Centre County, PA Map & Demographics
Centre County Map
Centre County Overview
$37,262
PER CAPITA INCOME
$104,862
AVG FAMILY INCOME
$70,087
AVG HOUSEHOLD INCOME
18.9%
WAGE / INCOME GAP [ % ]
81.1¢/ $1
WAGE / INCOME GAP [ $ ]
$11,185
FAMILY INCOME DEFICIT
0.48
INEQUALITY / GINI INDEX
158,665
TOTAL POPULATION
83,943
MALE POPULATION
74,722
FEMALE POPULATION
112.34
MALES / 100 FEMALES
89.02
FEMALES / 100 MALES
33.3
MEDIAN AGE
2.9
AVG FAMILY SIZE
2.4
AVG HOUSEHOLD SIZE
78,007
LABOR FORCE [ PEOPLE ]
56.5%
PERCENT IN LABOR FORCE
4.0%
UNEMPLOYMENT RATE
Centre County Area Codes
Income in Centre County
Income Overview in Centre County
Per Capita Income in Centre County is $37,262, while median incomes of families and households are $104,862 and $70,087 respectively.
| Characteristic | Number | Measure |
| Per Capita Income | 158,665 | $37,262 |
| Median Family Income | 32,260 | $104,862 |
| Mean Family Income | 32,260 | $129,950 |
| Median Household Income | 58,285 | $70,087 |
| Mean Household Income | 58,285 | $95,839 |
| Income Deficit | 32,260 | $11,185 |
| Wage / Income Gap (%) | 158,665 | 18.95% |
| Wage / Income Gap ($) | 158,665 | 81.05¢ per $1 |
| Gini / Inequality Index | 158,665 | 0.48 |
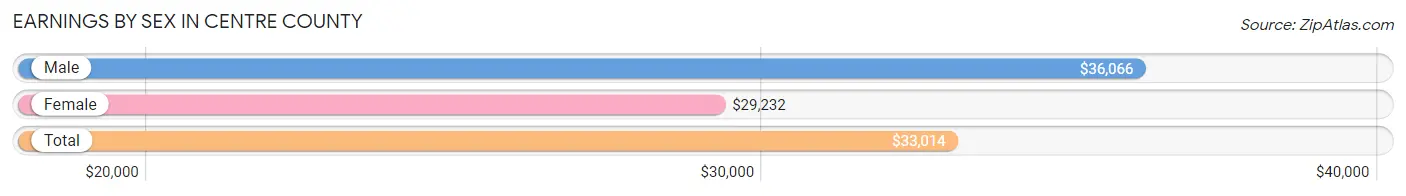
Earnings by Sex in Centre County
Average Earnings in Centre County are $33,014, $36,066 for men and $29,232 for women, a difference of 19.0%.
| Sex | Number | Average Earnings |
| Male | 51,124 (54.7%) | $36,066 |
| Female | 42,324 (45.3%) | $29,232 |
| Total | 93,448 (100.0%) | $33,014 |
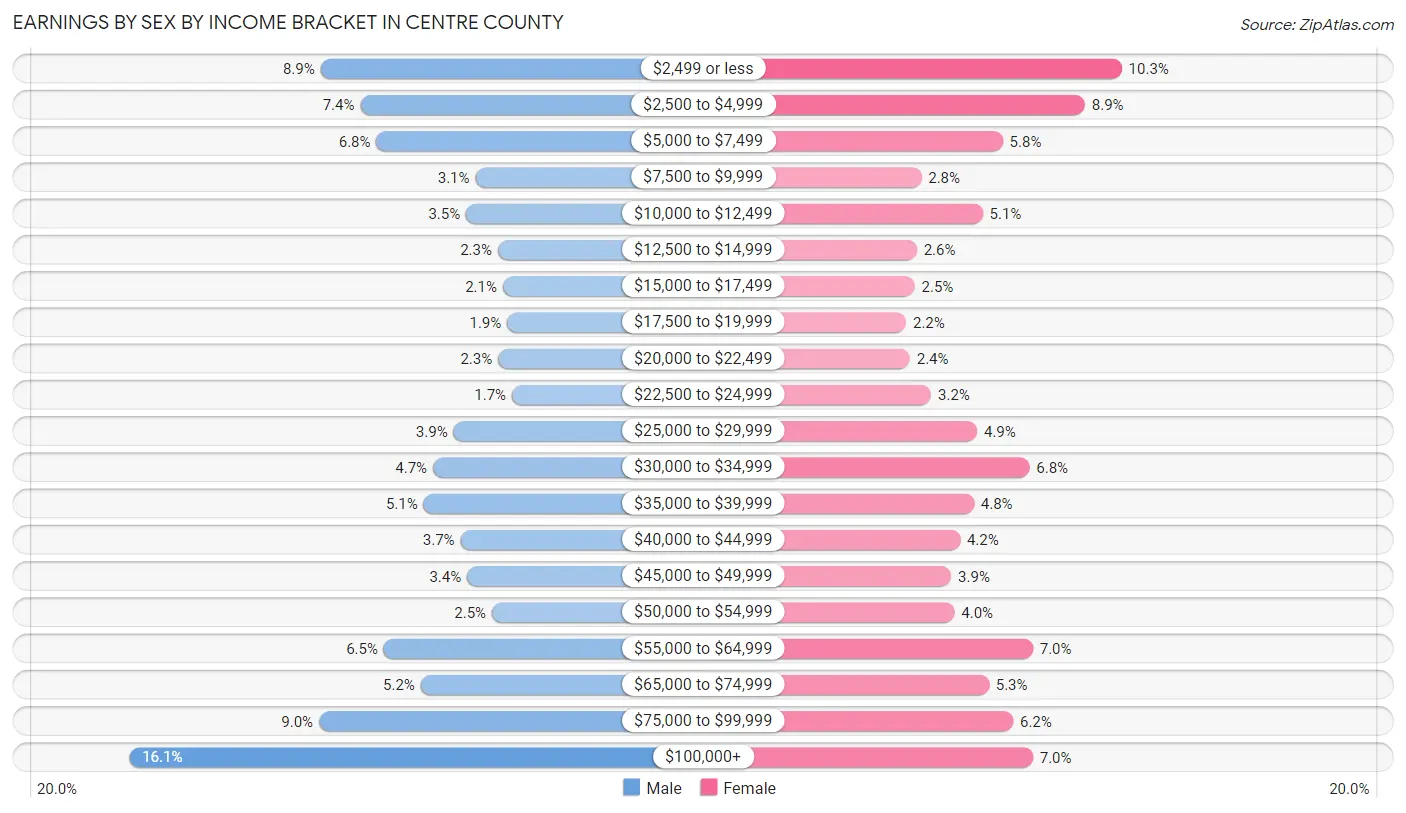
Earnings by Sex by Income Bracket in Centre County
The most common earnings brackets in Centre County are $100,000+ for men (8,222 | 16.1%) and $2,499 or less for women (4,359 | 10.3%).
| Income | Male | Female |
| $2,499 or less | 4,557 (8.9%) | 4,359 (10.3%) |
| $2,500 to $4,999 | 3,794 (7.4%) | 3,777 (8.9%) |
| $5,000 to $7,499 | 3,485 (6.8%) | 2,472 (5.8%) |
| $7,500 to $9,999 | 1,590 (3.1%) | 1,180 (2.8%) |
| $10,000 to $12,499 | 1,770 (3.5%) | 2,156 (5.1%) |
| $12,500 to $14,999 | 1,162 (2.3%) | 1,110 (2.6%) |
| $15,000 to $17,499 | 1,061 (2.1%) | 1,076 (2.5%) |
| $17,500 to $19,999 | 984 (1.9%) | 940 (2.2%) |
| $20,000 to $22,499 | 1,153 (2.3%) | 999 (2.4%) |
| $22,500 to $24,999 | 891 (1.7%) | 1,338 (3.2%) |
| $25,000 to $29,999 | 2,011 (3.9%) | 2,067 (4.9%) |
| $30,000 to $34,999 | 2,402 (4.7%) | 2,895 (6.8%) |
| $35,000 to $39,999 | 2,582 (5.1%) | 2,015 (4.8%) |
| $40,000 to $44,999 | 1,877 (3.7%) | 1,794 (4.2%) |
| $45,000 to $49,999 | 1,747 (3.4%) | 1,653 (3.9%) |
| $50,000 to $54,999 | 1,272 (2.5%) | 1,707 (4.0%) |
| $55,000 to $64,999 | 3,342 (6.5%) | 2,951 (7.0%) |
| $65,000 to $74,999 | 2,636 (5.2%) | 2,250 (5.3%) |
| $75,000 to $99,999 | 4,586 (9.0%) | 2,637 (6.2%) |
| $100,000+ | 8,222 (16.1%) | 2,948 (7.0%) |
| Total | 51,124 (100.0%) | 42,324 (100.0%) |
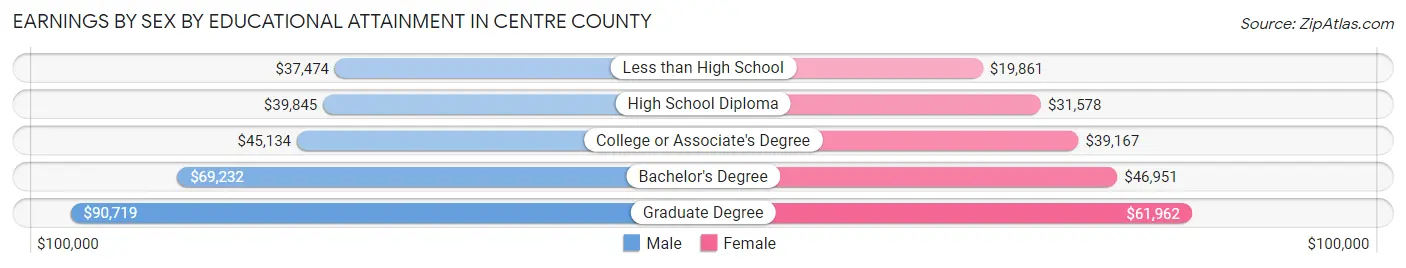
Earnings by Sex by Educational Attainment in Centre County
Average earnings in Centre County are $56,394 for men and $43,261 for women, a difference of 23.3%. Men with an educational attainment of graduate degree enjoy the highest average annual earnings of $90,719, while those with less than high school education earn the least with $37,474. Women with an educational attainment of graduate degree earn the most with the average annual earnings of $61,962, while those with less than high school education have the smallest earnings of $19,861.
| Educational Attainment | Male Income | Female Income |
| Less than High School | $37,474 | $19,861 |
| High School Diploma | $39,845 | $31,578 |
| College or Associate's Degree | $45,134 | $39,167 |
| Bachelor's Degree | $69,232 | $46,951 |
| Graduate Degree | $90,719 | $61,962 |
| Total | $56,394 | $43,261 |
Family Income in Centre County
Family Income Brackets in Centre County
According to the Centre County family income data, there are 8,065 families falling into the $100,000 to $149,999 income range, which is the most common income bracket and makes up 25.0% of all families. Conversely, the $10,000 to $14,999 income bracket is the least frequent group with only 387 families (1.2%) belonging to this category.
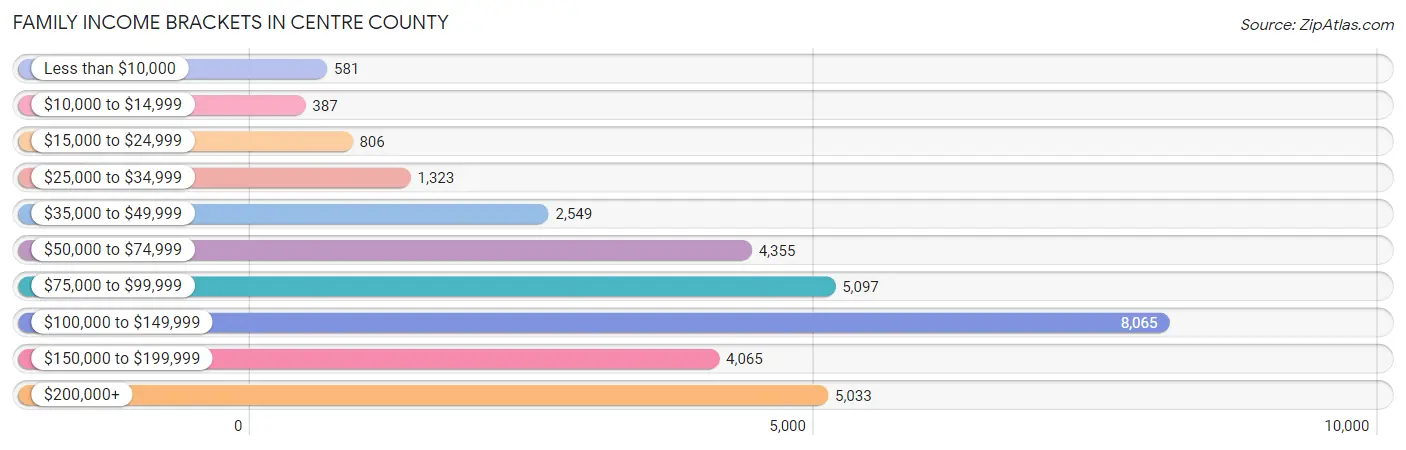
| Income Bracket | # Families | % Families |
| Less than $10,000 | 581 | 1.8% |
| $10,000 to $14,999 | 387 | 1.2% |
| $15,000 to $24,999 | 806 | 2.5% |
| $25,000 to $34,999 | 1,323 | 4.1% |
| $35,000 to $49,999 | 2,549 | 7.9% |
| $50,000 to $74,999 | 4,355 | 13.5% |
| $75,000 to $99,999 | 5,097 | 15.8% |
| $100,000 to $149,999 | 8,065 | 25.0% |
| $150,000 to $199,999 | 4,065 | 12.6% |
| $200,000+ | 5,033 | 15.6% |
Family Income by Famaliy Size in Centre County
5-person families (2,044 | 6.3%) account for the highest median family income in Centre County with $130,934 per family, while 2-person families (17,155 | 53.2%) have the highest median income of $47,039 per family member.
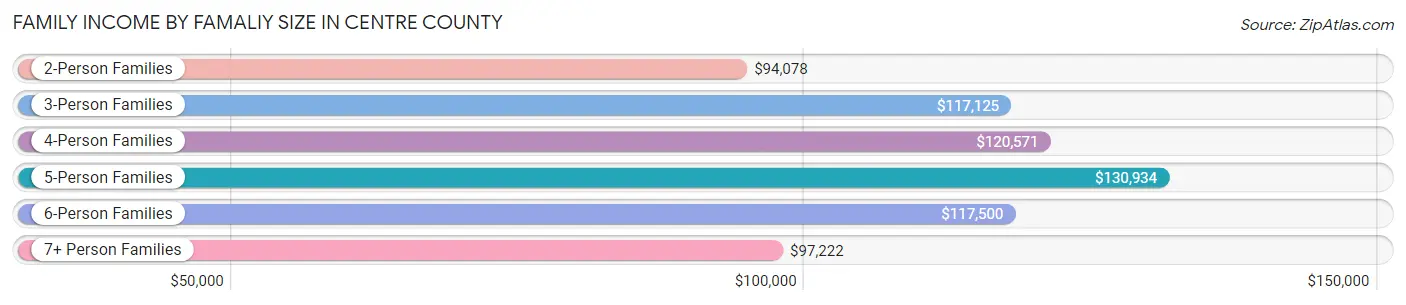
| Income Bracket | # Families | Median Income |
| 2-Person Families | 17,155 (53.2%) | $94,078 |
| 3-Person Families | 6,272 (19.4%) | $117,125 |
| 4-Person Families | 5,905 (18.3%) | $120,571 |
| 5-Person Families | 2,044 (6.3%) | $130,934 |
| 6-Person Families | 476 (1.5%) | $117,500 |
| 7+ Person Families | 408 (1.3%) | $97,222 |
| Total | 32,260 (100.0%) | $104,862 |
Family Income by Number of Earners in Centre County
The median family income in Centre County is $104,862, with families comprising 3+ earners (3,390) having the highest median family income of $146,154, while families with no earners (5,038) have the lowest median family income of $66,101, accounting for 10.5% and 15.6% of families, respectively.
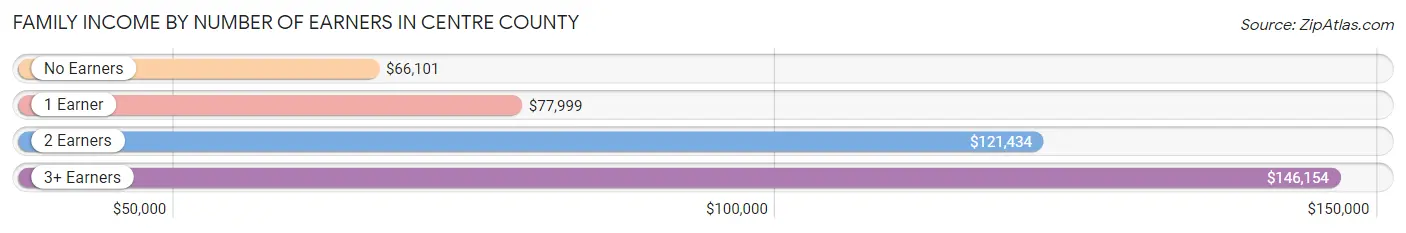
| Number of Earners | # Families | Median Income |
| No Earners | 5,038 (15.6%) | $66,101 |
| 1 Earner | 8,575 (26.6%) | $77,999 |
| 2 Earners | 15,257 (47.3%) | $121,434 |
| 3+ Earners | 3,390 (10.5%) | $146,154 |
| Total | 32,260 (100.0%) | $104,862 |
Household Income in Centre County
Household Income Brackets in Centre County
With 10,200 households falling in the category, the $100,000 to $149,999 income range is the most frequent in Centre County, accounting for 17.5% of all households. In contrast, only 2,040 households (3.5%) fall into the $10,000 to $14,999 income bracket, making it the least populous group.
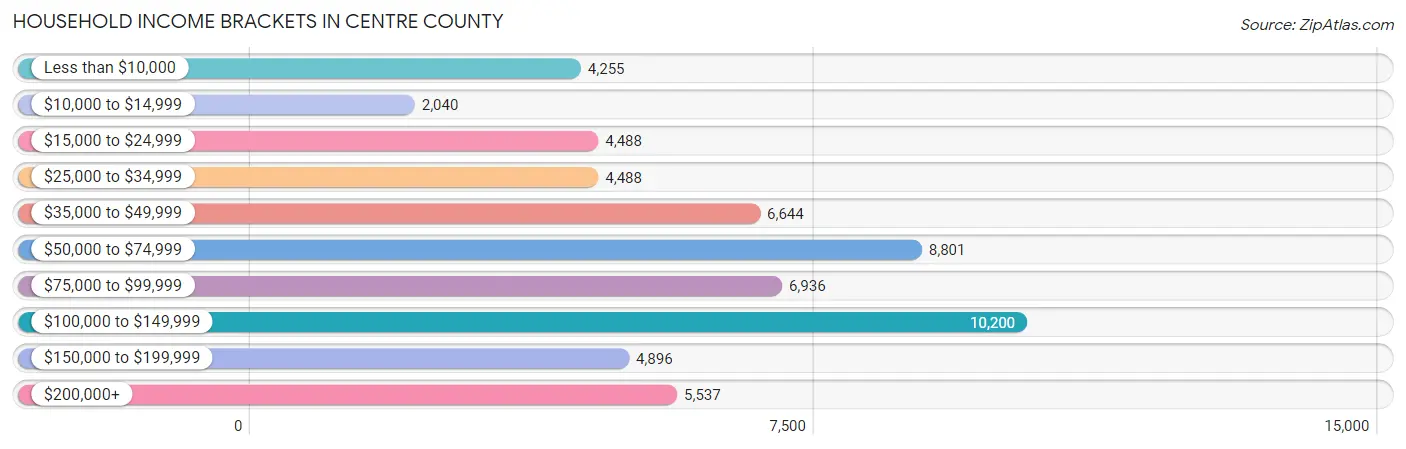
| Income Bracket | # Households | % Households |
| Less than $10,000 | 4,255 | 7.3% |
| $10,000 to $14,999 | 2,040 | 3.5% |
| $15,000 to $24,999 | 4,488 | 7.7% |
| $25,000 to $34,999 | 4,488 | 7.7% |
| $35,000 to $49,999 | 6,644 | 11.4% |
| $50,000 to $74,999 | 8,801 | 15.1% |
| $75,000 to $99,999 | 6,936 | 11.9% |
| $100,000 to $149,999 | 10,200 | 17.5% |
| $150,000 to $199,999 | 4,896 | 8.4% |
| $200,000+ | 5,537 | 9.5% |
Household Income by Householder Age in Centre County
The median household income in Centre County is $70,087, with the highest median household income of $96,077 found in the 45 to 64 years age bracket for the primary householder. A total of 19,308 households (33.1%) fall into this category. Meanwhile, the 15 to 24 years age bracket for the primary householder has the lowest median household income of $19,346, with 6,857 households (11.8%) in this group.
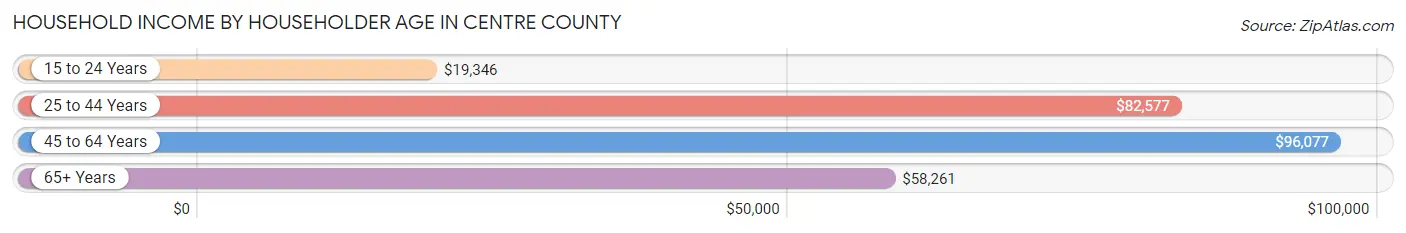
| Income Bracket | # Households | Median Income |
| 15 to 24 Years | 6,857 (11.8%) | $19,346 |
| 25 to 44 Years | 17,433 (29.9%) | $82,577 |
| 45 to 64 Years | 19,308 (33.1%) | $96,077 |
| 65+ Years | 14,687 (25.2%) | $58,261 |
| Total | 58,285 (100.0%) | $70,087 |
Poverty in Centre County
Income Below Poverty by Sex and Age in Centre County
With 18.1% poverty level for males and 15.9% for females among the residents of Centre County, 18 to 24 year old males and 18 to 24 year old females are the most vulnerable to poverty, with 8,735 males (67.9%) and 6,228 females (56.4%) in their respective age groups living below the poverty level.
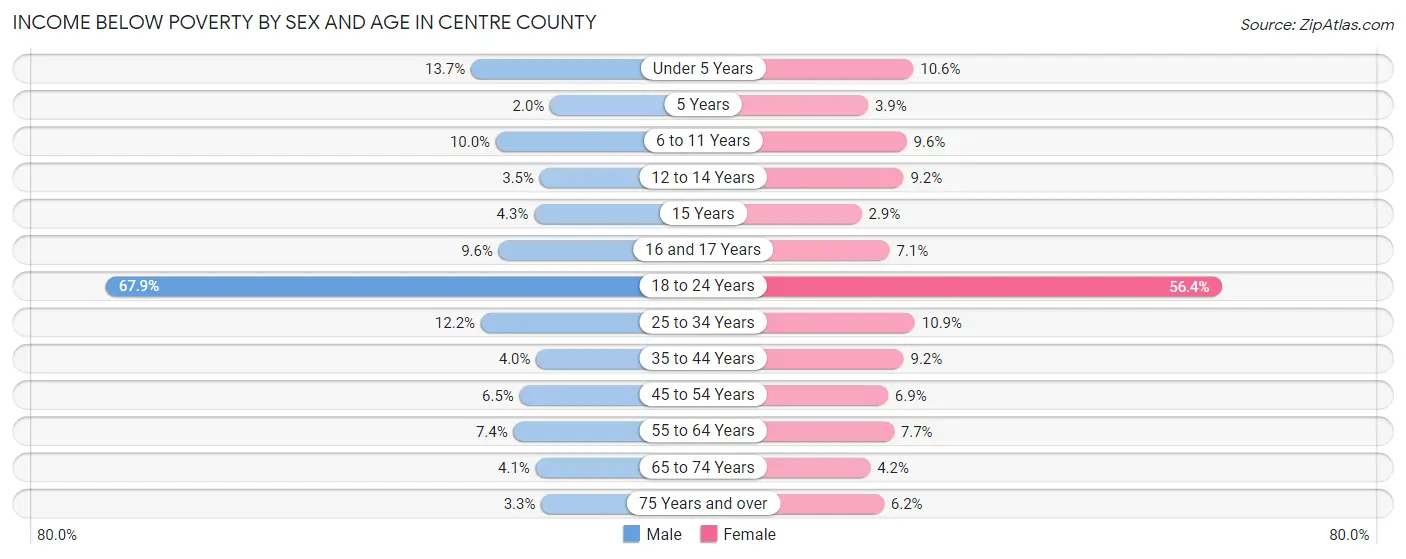
| Age Bracket | Male | Female |
| Under 5 Years | 403 (13.7%) | 288 (10.6%) |
| 5 Years | 9 (2.0%) | 25 (3.9%) |
| 6 to 11 Years | 409 (10.0%) | 379 (9.6%) |
| 12 to 14 Years | 78 (3.5%) | 153 (9.2%) |
| 15 Years | 38 (4.3%) | 22 (2.9%) |
| 16 and 17 Years | 113 (9.6%) | 79 (7.1%) |
| 18 to 24 Years | 8,735 (67.9%) | 6,228 (56.4%) |
| 25 to 34 Years | 1,305 (12.2%) | 962 (10.8%) |
| 35 to 44 Years | 354 (4.0%) | 701 (9.2%) |
| 45 to 54 Years | 537 (6.5%) | 533 (6.9%) |
| 55 to 64 Years | 652 (7.4%) | 682 (7.7%) |
| 65 to 74 Years | 274 (4.1%) | 292 (4.2%) |
| 75 Years and over | 131 (3.3%) | 335 (6.2%) |
| Total | 13,038 (18.1%) | 10,679 (15.9%) |
Income Above Poverty by Sex and Age in Centre County
According to the poverty statistics in Centre County, males aged 5 years and females aged 15 years are the age groups that are most secure financially, with 98.0% of males and 97.1% of females in these age groups living above the poverty line.
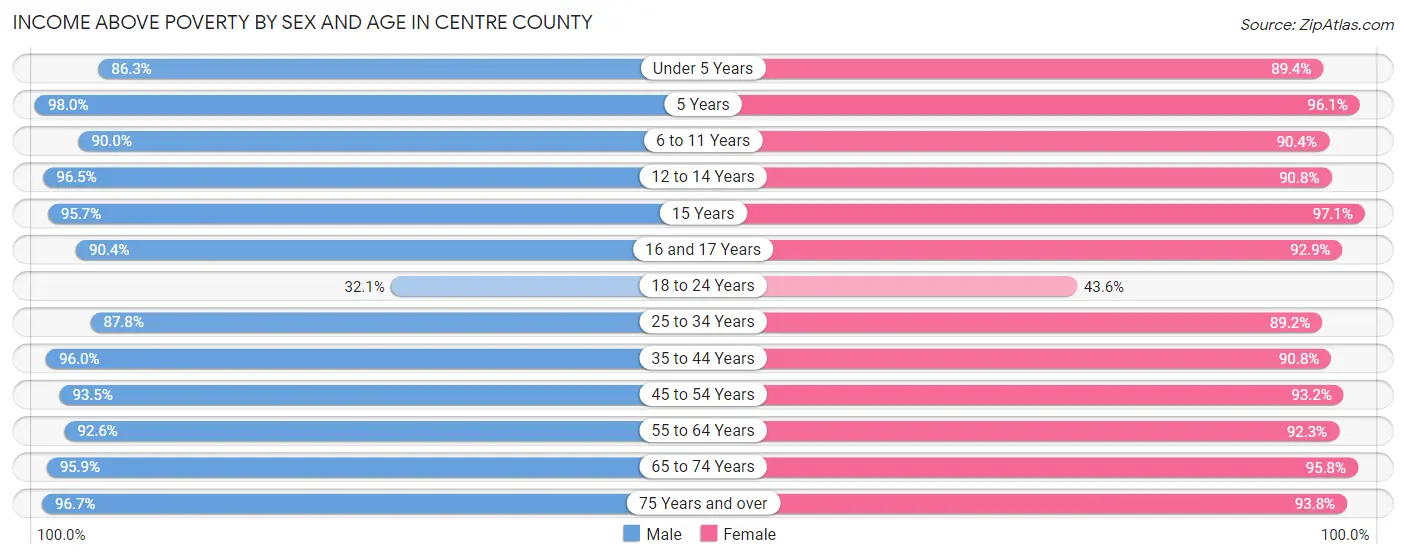
| Age Bracket | Male | Female |
| Under 5 Years | 2,536 (86.3%) | 2,424 (89.4%) |
| 5 Years | 450 (98.0%) | 618 (96.1%) |
| 6 to 11 Years | 3,678 (90.0%) | 3,561 (90.4%) |
| 12 to 14 Years | 2,160 (96.5%) | 1,518 (90.8%) |
| 15 Years | 841 (95.7%) | 730 (97.1%) |
| 16 and 17 Years | 1,066 (90.4%) | 1,035 (92.9%) |
| 18 to 24 Years | 4,123 (32.1%) | 4,822 (43.6%) |
| 25 to 34 Years | 9,359 (87.8%) | 7,906 (89.1%) |
| 35 to 44 Years | 8,477 (96.0%) | 6,945 (90.8%) |
| 45 to 54 Years | 7,745 (93.5%) | 7,253 (93.1%) |
| 55 to 64 Years | 8,153 (92.6%) | 8,146 (92.3%) |
| 65 to 74 Years | 6,393 (95.9%) | 6,621 (95.8%) |
| 75 Years and over | 3,874 (96.7%) | 5,036 (93.8%) |
| Total | 58,855 (81.9%) | 56,615 (84.1%) |
Income Below Poverty Among Married-Couple Families in Centre County
The poverty statistics for married-couple families in Centre County show that 2.9% or 789 of the total 27,208 families live below the poverty line. Families with 5 or more children have the highest poverty rate of 21.0%, comprising of 52 families. On the other hand, families with no children have the lowest poverty rate of 2.2%, which includes 381 families.
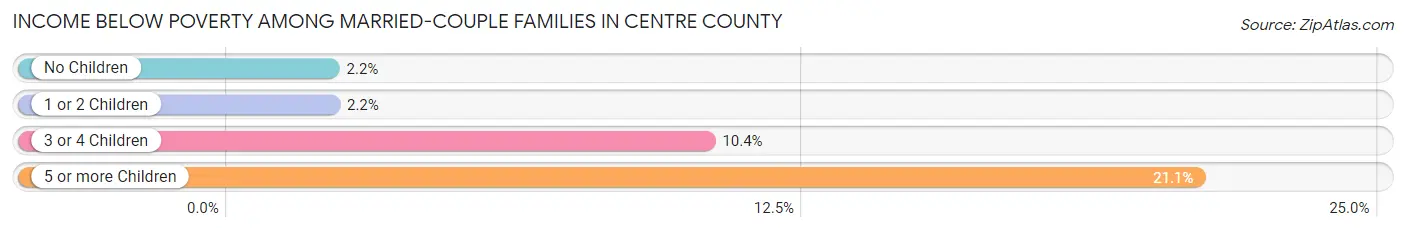
| Children | Above Poverty | Below Poverty |
| No Children | 16,877 (97.8%) | 381 (2.2%) |
| 1 or 2 Children | 7,804 (97.8%) | 177 (2.2%) |
| 3 or 4 Children | 1,543 (89.6%) | 179 (10.4%) |
| 5 or more Children | 195 (78.9%) | 52 (21.0%) |
| Total | 26,419 (97.1%) | 789 (2.9%) |
Income Below Poverty Among Single-Parent Households in Centre County
According to the poverty data in Centre County, 13.4% or 225 single-father households and 17.5% or 589 single-mother households are living below the poverty line. Among single-father households, those with 1 or 2 children have the highest poverty rate, with 144 households (20.1%) experiencing poverty. Likewise, among single-mother households, those with 5 or more children have the highest poverty rate, with 11 households (100.0%) falling below the poverty line.
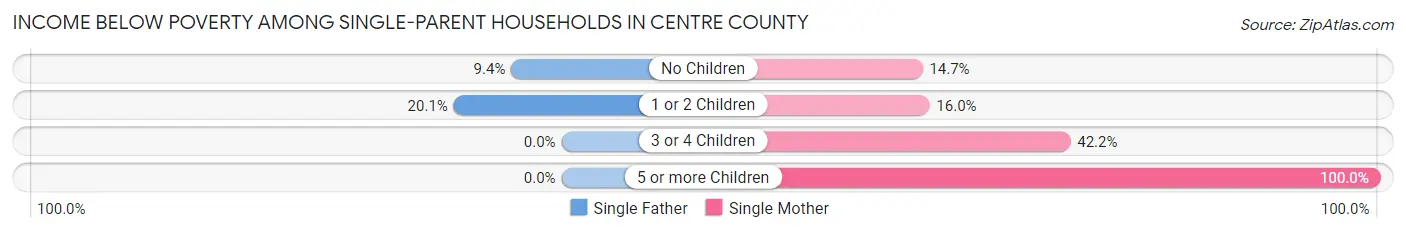
| Children | Single Father | Single Mother |
| No Children | 81 (9.4%) | 247 (14.7%) |
| 1 or 2 Children | 144 (20.1%) | 228 (16.0%) |
| 3 or 4 Children | 0 (0.0%) | 103 (42.2%) |
| 5 or more Children | 0 (0.0%) | 11 (100.0%) |
| Total | 225 (13.4%) | 589 (17.5%) |
Income Below Poverty Among Married-Couple vs Single-Parent Households in Centre County
The poverty data for Centre County shows that 789 of the married-couple family households (2.9%) and 814 of the single-parent households (16.1%) are living below the poverty level. Within the married-couple family households, those with 5 or more children have the highest poverty rate, with 52 households (21.0%) falling below the poverty line. Among the single-parent households, those with 5 or more children have the highest poverty rate, with 11 household (78.6%) living below poverty.
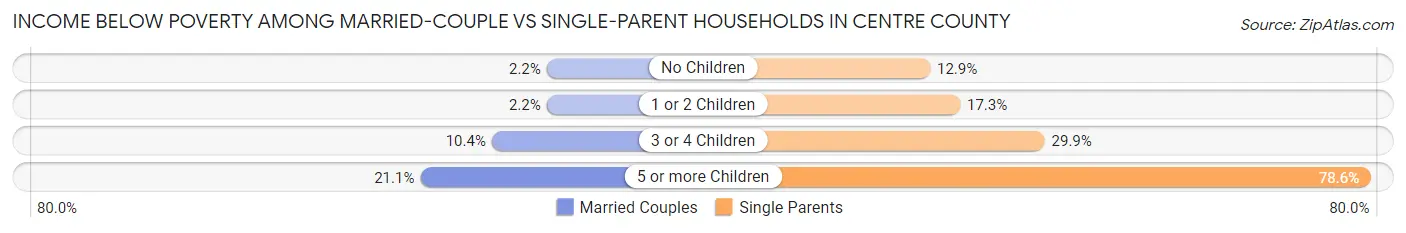
| Children | Married-Couple Families | Single-Parent Households |
| No Children | 381 (2.2%) | 328 (12.9%) |
| 1 or 2 Children | 177 (2.2%) | 372 (17.3%) |
| 3 or 4 Children | 179 (10.4%) | 103 (29.9%) |
| 5 or more Children | 52 (21.0%) | 11 (78.6%) |
| Total | 789 (2.9%) | 814 (16.1%) |
Race in Centre County
The most populous races in Centre County are White / Caucasian (136,130 | 85.8%), Asian (9,861 | 6.2%), and Two or more Races (6,613 | 4.2%).
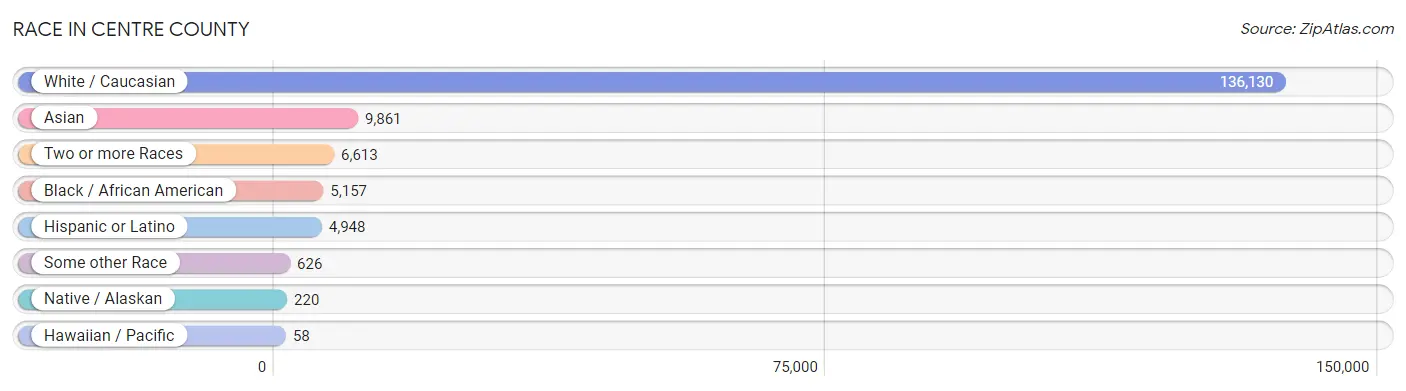
| Race | # Population | % Population |
| Asian | 9,861 | 6.2% |
| Black / African American | 5,157 | 3.3% |
| Hawaiian / Pacific | 58 | 0.0% |
| Hispanic or Latino | 4,948 | 3.1% |
| Native / Alaskan | 220 | 0.1% |
| White / Caucasian | 136,130 | 85.8% |
| Two or more Races | 6,613 | 4.2% |
| Some other Race | 626 | 0.4% |
| Total | 158,665 | 100.0% |
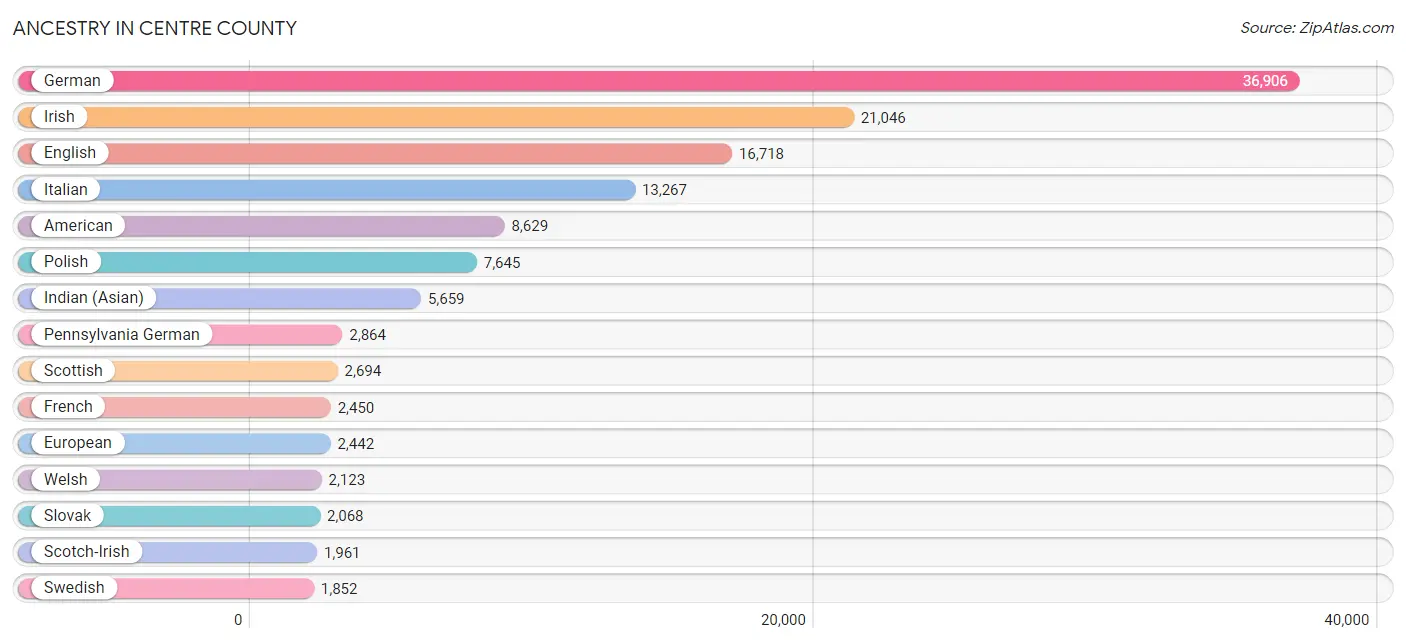
Ancestry in Centre County
The most populous ancestries reported in Centre County are German (36,906 | 23.3%), Irish (21,046 | 13.3%), English (16,718 | 10.5%), Italian (13,267 | 8.4%), and American (8,629 | 5.4%), together accounting for 60.9% of all Centre County residents.
| Ancestry | # Population | % Population |
| African | 229 | 0.1% |
| American | 8,629 | 5.4% |
| Apache | 16 | 0.0% |
| Arab | 1,113 | 0.7% |
| Argentinean | 117 | 0.1% |
| Armenian | 49 | 0.0% |
| Australian | 6 | 0.0% |
| Austrian | 438 | 0.3% |
| Bahamian | 69 | 0.0% |
| Basque | 26 | 0.0% |
| Belgian | 182 | 0.1% |
| Bermudan | 10 | 0.0% |
| Bhutanese | 288 | 0.2% |
| Blackfeet | 103 | 0.1% |
| Bolivian | 20 | 0.0% |
| Brazilian | 273 | 0.2% |
| British | 910 | 0.6% |
| Bulgarian | 110 | 0.1% |
| Burmese | 1,592 | 1.0% |
| Cambodian | 64 | 0.0% |
| Canadian | 188 | 0.1% |
| Cape Verdean | 10 | 0.0% |
| Carpatho Rusyn | 38 | 0.0% |
| Celtic | 17 | 0.0% |
| Central American | 454 | 0.3% |
| Central American Indian | 60 | 0.0% |
| Cherokee | 114 | 0.1% |
| Chickasaw | 5 | 0.0% |
| Chilean | 93 | 0.1% |
| Chippewa | 12 | 0.0% |
| Colombian | 156 | 0.1% |
| Comanche | 187 | 0.1% |
| Costa Rican | 72 | 0.1% |
| Creek | 1 | 0.0% |
| Croatian | 365 | 0.2% |
| Cuban | 200 | 0.1% |
| Czech | 527 | 0.3% |
| Czechoslovakian | 551 | 0.4% |
| Danish | 580 | 0.4% |
| Delaware | 63 | 0.0% |
| Dominican | 220 | 0.1% |
| Dutch | 1,535 | 1.0% |
| Eastern European | 1,235 | 0.8% |
| Ecuadorian | 98 | 0.1% |
| Egyptian | 177 | 0.1% |
| English | 16,718 | 10.5% |
| Estonian | 183 | 0.1% |
| Ethiopian | 33 | 0.0% |
| European | 2,442 | 1.5% |
| Filipino | 39 | 0.0% |
| Finnish | 197 | 0.1% |
| French | 2,450 | 1.5% |
| French Canadian | 301 | 0.2% |
| German | 36,906 | 23.3% |
| Ghanaian | 70 | 0.0% |
| Greek | 539 | 0.3% |
| Guamanian / Chamorro | 12 | 0.0% |
| Guatemalan | 108 | 0.1% |
| Guyanese | 7 | 0.0% |
| Haitian | 36 | 0.0% |
| Honduran | 5 | 0.0% |
| Houma | 10 | 0.0% |
| Hungarian | 967 | 0.6% |
| Indian (Asian) | 5,659 | 3.6% |
| Indonesian | 37 | 0.0% |
| Inupiat | 13 | 0.0% |
| Iranian | 752 | 0.5% |
| Iraqi | 28 | 0.0% |
| Irish | 21,046 | 13.3% |
| Iroquois | 20 | 0.0% |
| Israeli | 146 | 0.1% |
| Italian | 13,267 | 8.4% |
| Jamaican | 383 | 0.2% |
| Japanese | 74 | 0.1% |
| Jordanian | 6 | 0.0% |
| Korean | 1,102 | 0.7% |
| Latvian | 74 | 0.1% |
| Lebanese | 254 | 0.2% |
| Liberian | 32 | 0.0% |
| Lithuanian | 437 | 0.3% |
| Macedonian | 55 | 0.0% |
| Menominee | 16 | 0.0% |
| Mexican | 1,287 | 0.8% |
| Mexican American Indian | 18 | 0.0% |
| Mongolian | 93 | 0.1% |
| Moroccan | 13 | 0.0% |
| Native Hawaiian | 132 | 0.1% |
| Navajo | 365 | 0.2% |
| Nicaraguan | 63 | 0.0% |
| Nigerian | 309 | 0.2% |
| Northern European | 67 | 0.0% |
| Norwegian | 737 | 0.5% |
| Okinawan | 4 | 0.0% |
| Pakistani | 67 | 0.0% |
| Palestinian | 58 | 0.0% |
| Panamanian | 38 | 0.0% |
| Pennsylvania German | 2,864 | 1.8% |
| Peruvian | 163 | 0.1% |
| Pima | 50 | 0.0% |
| Polish | 7,645 | 4.8% |
| Portuguese | 175 | 0.1% |
| Puerto Rican | 1,424 | 0.9% |
| Romanian | 122 | 0.1% |
| Russian | 1,822 | 1.1% |
| Salvadoran | 168 | 0.1% |
| Samoan | 42 | 0.0% |
| Scandinavian | 294 | 0.2% |
| Scotch-Irish | 1,961 | 1.2% |
| Scottish | 2,694 | 1.7% |
| Seminole | 1 | 0.0% |
| Serbian | 16 | 0.0% |
| Sioux | 9 | 0.0% |
| Slavic | 210 | 0.1% |
| Slovak | 2,068 | 1.3% |
| Slovene | 267 | 0.2% |
| South African | 14 | 0.0% |
| South American | 672 | 0.4% |
| South American Indian | 41 | 0.0% |
| Spaniard | 168 | 0.1% |
| Spanish | 243 | 0.2% |
| Sri Lankan | 374 | 0.2% |
| Subsaharan African | 966 | 0.6% |
| Sudanese | 15 | 0.0% |
| Swedish | 1,852 | 1.2% |
| Swiss | 1,108 | 0.7% |
| Syrian | 143 | 0.1% |
| Thai | 1,518 | 1.0% |
| Tongan | 30 | 0.0% |
| Trinidadian and Tobagonian | 11 | 0.0% |
| Turkish | 389 | 0.3% |
| Ugandan | 107 | 0.1% |
| Ukrainian | 841 | 0.5% |
| Ute | 19 | 0.0% |
| Venezuelan | 25 | 0.0% |
| Vietnamese | 125 | 0.1% |
| Welsh | 2,123 | 1.3% |
| West Indian | 89 | 0.1% |
| Yugoslavian | 51 | 0.0% | View All 138 Rows |
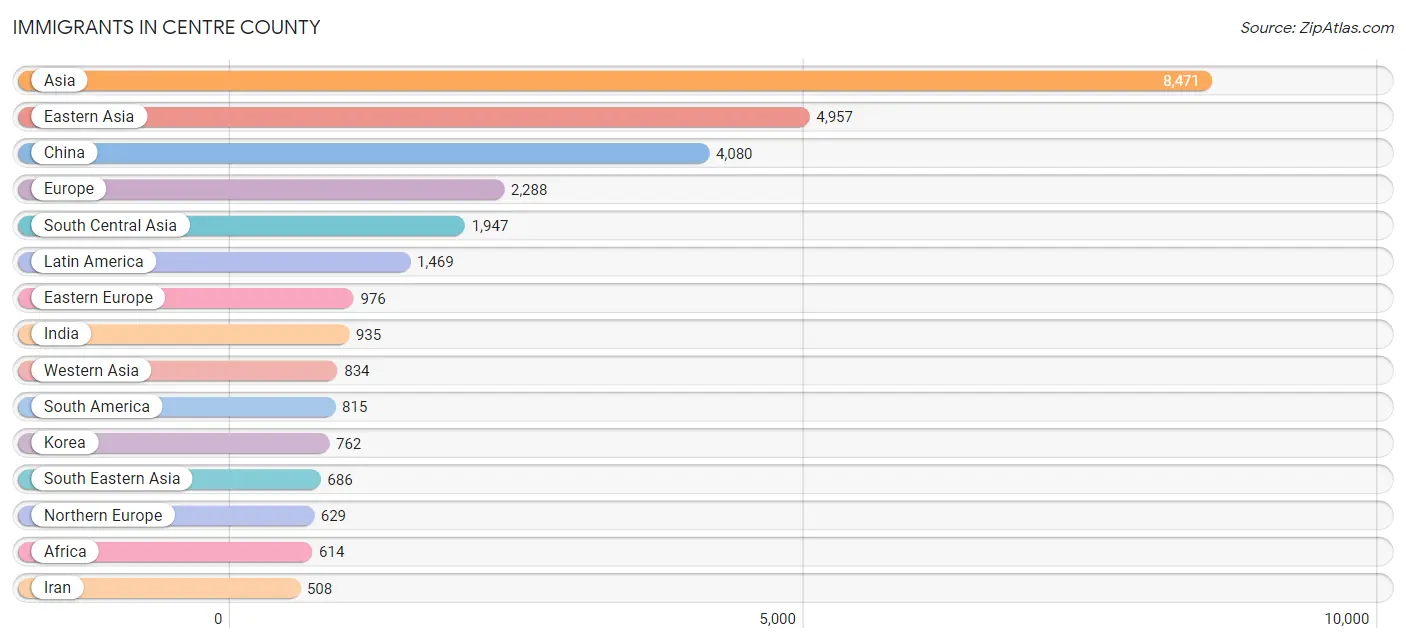
Immigrants in Centre County
The most numerous immigrant groups reported in Centre County came from Asia (8,471 | 5.3%), Eastern Asia (4,957 | 3.1%), China (4,080 | 2.6%), Europe (2,288 | 1.4%), and South Central Asia (1,947 | 1.2%), together accounting for 13.7% of all Centre County residents.
| Immigration Origin | # Population | % Population |
| Africa | 614 | 0.4% |
| Argentina | 53 | 0.0% |
| Asia | 8,471 | 5.3% |
| Australia | 5 | 0.0% |
| Austria | 7 | 0.0% |
| Bahamas | 19 | 0.0% |
| Bangladesh | 173 | 0.1% |
| Belarus | 3 | 0.0% |
| Belgium | 6 | 0.0% |
| Bolivia | 20 | 0.0% |
| Brazil | 456 | 0.3% |
| Bulgaria | 45 | 0.0% |
| Cambodia | 58 | 0.0% |
| Canada | 259 | 0.2% |
| Caribbean | 245 | 0.2% |
| Central America | 409 | 0.3% |
| Chile | 81 | 0.1% |
| China | 4,080 | 2.6% |
| Colombia | 105 | 0.1% |
| Costa Rica | 28 | 0.0% |
| Croatia | 9 | 0.0% |
| Cuba | 24 | 0.0% |
| Czechoslovakia | 5 | 0.0% |
| Dominican Republic | 37 | 0.0% |
| Eastern Africa | 56 | 0.0% |
| Eastern Asia | 4,957 | 3.1% |
| Eastern Europe | 976 | 0.6% |
| Ecuador | 39 | 0.0% |
| Egypt | 63 | 0.0% |
| El Salvador | 12 | 0.0% |
| England | 88 | 0.1% |
| Ethiopia | 14 | 0.0% |
| Europe | 2,288 | 1.4% |
| France | 165 | 0.1% |
| Germany | 285 | 0.2% |
| Ghana | 59 | 0.0% |
| Greece | 12 | 0.0% |
| Guatemala | 57 | 0.0% |
| Haiti | 27 | 0.0% |
| Honduras | 5 | 0.0% |
| Hong Kong | 29 | 0.0% |
| Hungary | 104 | 0.1% |
| India | 935 | 0.6% |
| Indonesia | 12 | 0.0% |
| Iran | 508 | 0.3% |
| Iraq | 14 | 0.0% |
| Ireland | 87 | 0.1% |
| Israel | 11 | 0.0% |
| Italy | 108 | 0.1% |
| Jamaica | 122 | 0.1% |
| Japan | 115 | 0.1% |
| Jordan | 6 | 0.0% |
| Kazakhstan | 222 | 0.1% |
| Kenya | 1 | 0.0% |
| Korea | 762 | 0.5% |
| Kuwait | 9 | 0.0% |
| Laos | 4 | 0.0% |
| Latin America | 1,469 | 0.9% |
| Latvia | 3 | 0.0% |
| Lebanon | 34 | 0.0% |
| Malaysia | 82 | 0.1% |
| Mexico | 282 | 0.2% |
| Netherlands | 33 | 0.0% |
| Nigeria | 197 | 0.1% |
| Northern Africa | 110 | 0.1% |
| Northern Europe | 629 | 0.4% |
| Norway | 45 | 0.0% |
| Oceania | 22 | 0.0% |
| Pakistan | 62 | 0.0% |
| Panama | 25 | 0.0% |
| Peru | 42 | 0.0% |
| Philippines | 288 | 0.2% |
| Poland | 146 | 0.1% |
| Romania | 84 | 0.1% |
| Russia | 401 | 0.3% |
| Saudi Arabia | 296 | 0.2% |
| Scotland | 9 | 0.0% |
| Singapore | 56 | 0.0% |
| South Africa | 21 | 0.0% |
| South America | 815 | 0.5% |
| South Central Asia | 1,947 | 1.2% |
| South Eastern Asia | 686 | 0.4% |
| Southern Europe | 187 | 0.1% |
| Spain | 67 | 0.0% |
| Sudan | 15 | 0.0% |
| Sweden | 150 | 0.1% |
| Syria | 17 | 0.0% |
| Taiwan | 273 | 0.2% |
| Thailand | 35 | 0.0% |
| Turkey | 430 | 0.3% |
| Uganda | 1 | 0.0% |
| Ukraine | 102 | 0.1% |
| Uzbekistan | 25 | 0.0% |
| Venezuela | 19 | 0.0% |
| Vietnam | 114 | 0.1% |
| Western Africa | 338 | 0.2% |
| Western Asia | 834 | 0.5% |
| Western Europe | 496 | 0.3% | View All 98 Rows |
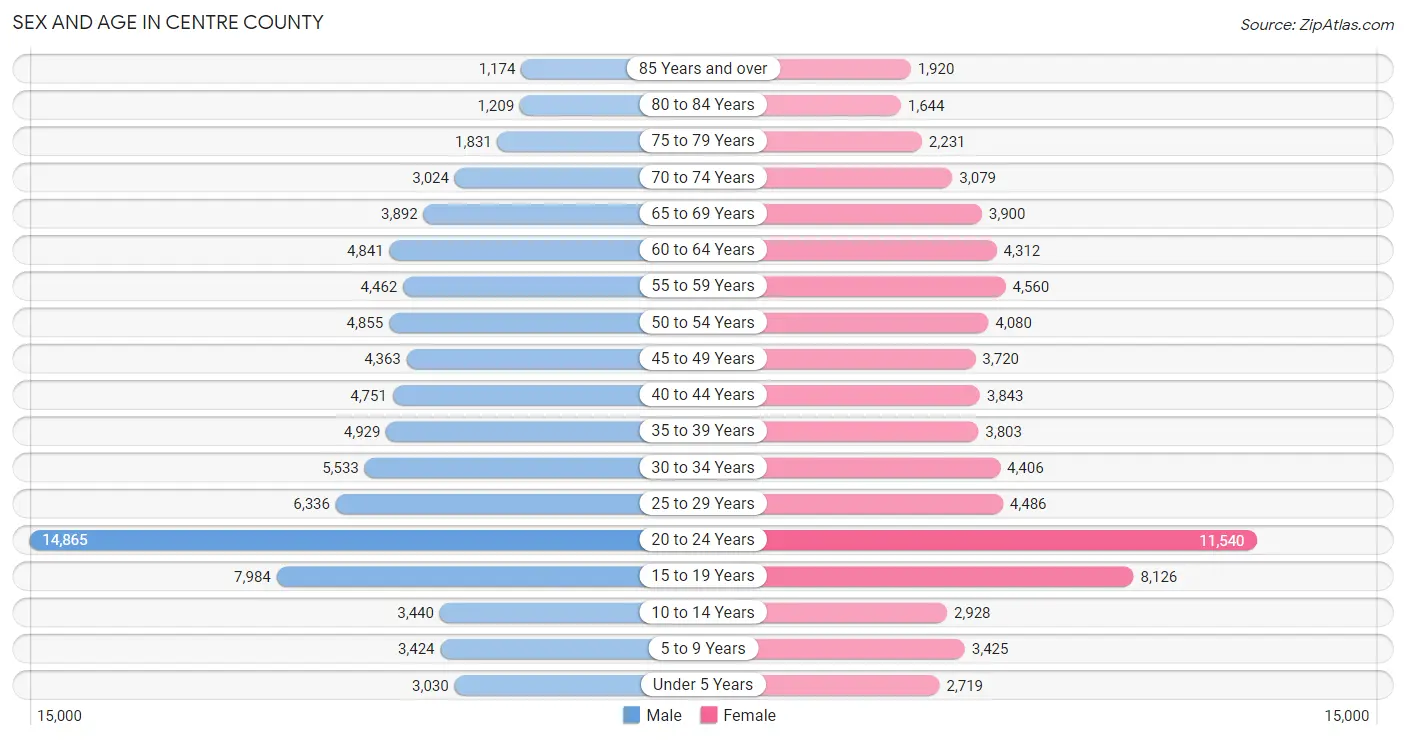
Sex and Age in Centre County
Sex and Age in Centre County
The most populous age groups in Centre County are 20 to 24 Years (14,865 | 17.7%) for men and 20 to 24 Years (11,540 | 15.4%) for women.
| Age Bracket | Male | Female |
| Under 5 Years | 3,030 (3.6%) | 2,719 (3.6%) |
| 5 to 9 Years | 3,424 (4.1%) | 3,425 (4.6%) |
| 10 to 14 Years | 3,440 (4.1%) | 2,928 (3.9%) |
| 15 to 19 Years | 7,984 (9.5%) | 8,126 (10.9%) |
| 20 to 24 Years | 14,865 (17.7%) | 11,540 (15.4%) |
| 25 to 29 Years | 6,336 (7.5%) | 4,486 (6.0%) |
| 30 to 34 Years | 5,533 (6.6%) | 4,406 (5.9%) |
| 35 to 39 Years | 4,929 (5.9%) | 3,803 (5.1%) |
| 40 to 44 Years | 4,751 (5.7%) | 3,843 (5.1%) |
| 45 to 49 Years | 4,363 (5.2%) | 3,720 (5.0%) |
| 50 to 54 Years | 4,855 (5.8%) | 4,080 (5.5%) |
| 55 to 59 Years | 4,462 (5.3%) | 4,560 (6.1%) |
| 60 to 64 Years | 4,841 (5.8%) | 4,312 (5.8%) |
| 65 to 69 Years | 3,892 (4.6%) | 3,900 (5.2%) |
| 70 to 74 Years | 3,024 (3.6%) | 3,079 (4.1%) |
| 75 to 79 Years | 1,831 (2.2%) | 2,231 (3.0%) |
| 80 to 84 Years | 1,209 (1.4%) | 1,644 (2.2%) |
| 85 Years and over | 1,174 (1.4%) | 1,920 (2.6%) |
| Total | 83,943 (100.0%) | 74,722 (100.0%) |
Families and Households in Centre County
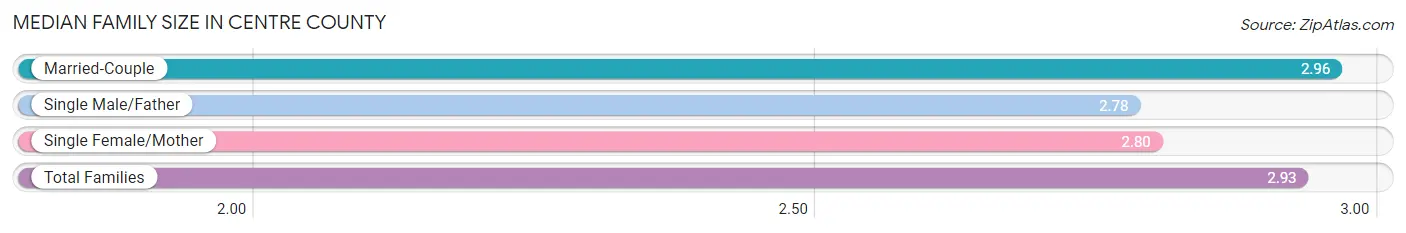
Median Family Size in Centre County
The median family size in Centre County is 2.93 persons per family, with married-couple families (27,208 | 84.3%) accounting for the largest median family size of 2.96 persons per family. On the other hand, single male/father families (1,685 | 5.2%) represent the smallest median family size with 2.78 persons per family.
| Family Type | # Families | Family Size |
| Married-Couple | 27,208 (84.3%) | 2.96 |
| Single Male/Father | 1,685 (5.2%) | 2.78 |
| Single Female/Mother | 3,367 (10.4%) | 2.80 |
| Total Families | 32,260 (100.0%) | 2.93 |
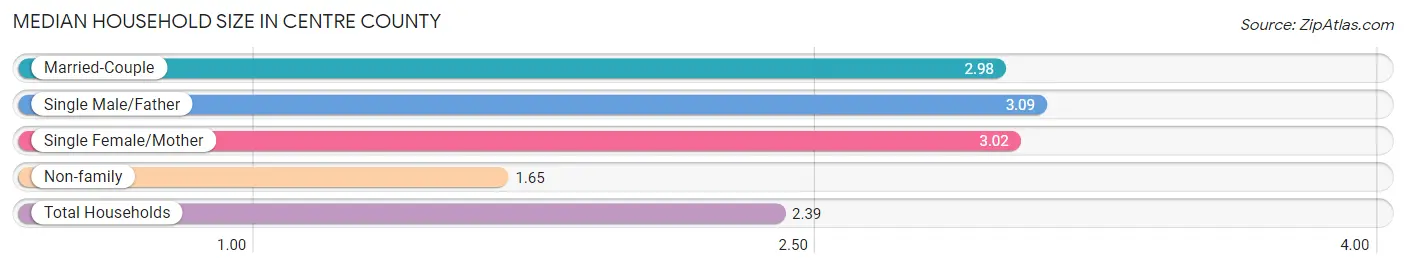
Median Household Size in Centre County
The median household size in Centre County is 2.39 persons per household, with single male/father households (1,685 | 2.9%) accounting for the largest median household size of 3.09 persons per household. non-family households (26,025 | 44.7%) represent the smallest median household size with 1.65 persons per household.
| Household Type | # Households | Household Size |
| Married-Couple | 27,208 (46.7%) | 2.98 |
| Single Male/Father | 1,685 (2.9%) | 3.09 |
| Single Female/Mother | 3,367 (5.8%) | 3.02 |
| Non-family | 26,025 (44.7%) | 1.65 |
| Total Households | 58,285 (100.0%) | 2.39 |
Household Size by Marriage Status in Centre County
Out of a total of 58,285 households in Centre County, 32,260 (55.3%) are family households, while 26,025 (44.7%) are nonfamily households. The most numerous type of family households are 2-person households, comprising 16,618, and the most common type of nonfamily households are 1-person households, comprising 19,125.
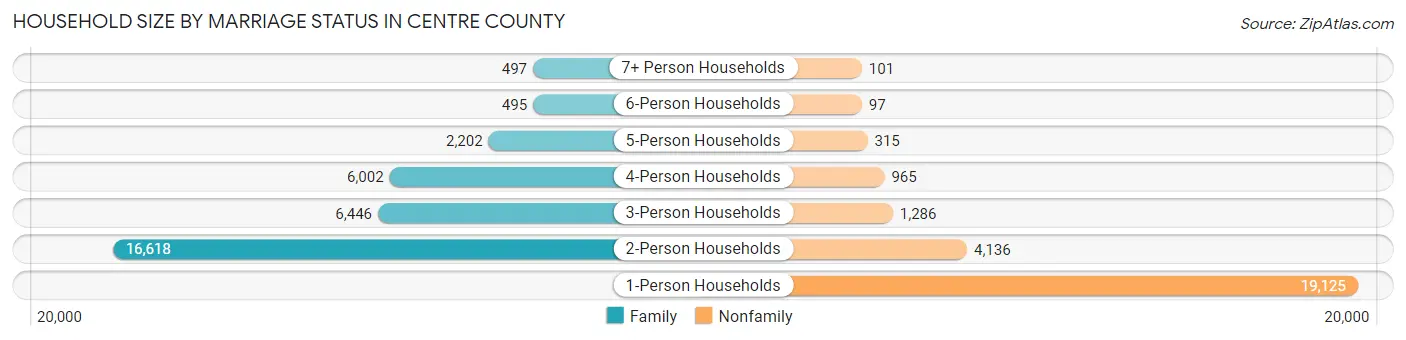
| Household Size | Family Households | Nonfamily Households |
| 1-Person Households | - | 19,125 (32.8%) |
| 2-Person Households | 16,618 (28.5%) | 4,136 (7.1%) |
| 3-Person Households | 6,446 (11.1%) | 1,286 (2.2%) |
| 4-Person Households | 6,002 (10.3%) | 965 (1.7%) |
| 5-Person Households | 2,202 (3.8%) | 315 (0.5%) |
| 6-Person Households | 495 (0.9%) | 97 (0.2%) |
| 7+ Person Households | 497 (0.9%) | 101 (0.2%) |
| Total | 32,260 (55.3%) | 26,025 (44.7%) |
Female Fertility in Centre County
Fertility by Age in Centre County
Average fertility rate in Centre County is 35.0 births per 1,000 women. Women in the age bracket of 20 to 34 years have the highest fertility rate with 45.0 births per 1,000 women. Women in the age bracket of 20 to 34 years acount for 65.5% of all women with births.
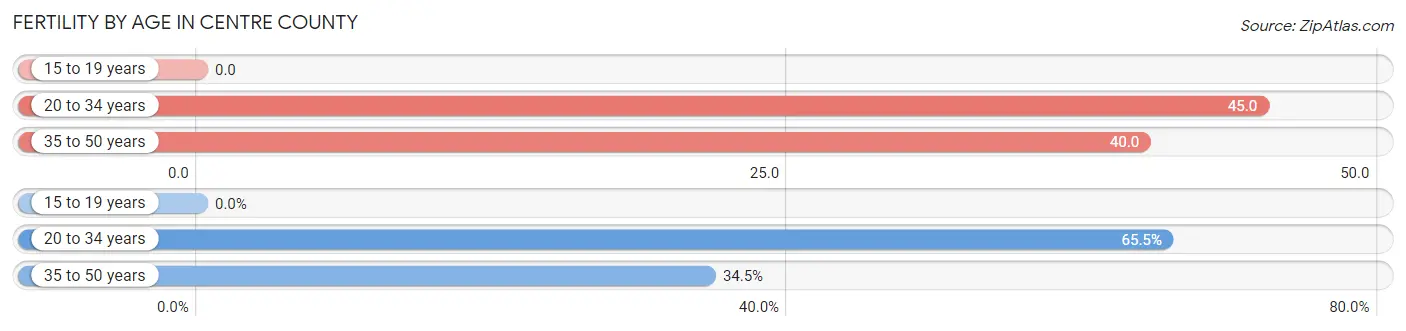
| Age Bracket | Women with Births | Births / 1,000 Women |
| 15 to 19 years | 0 (0.0%) | 0.0 |
| 20 to 34 years | 922 (65.5%) | 45.0 |
| 35 to 50 years | 485 (34.5%) | 40.0 |
| Total | 1,407 (100.0%) | 35.0 |
Fertility by Age by Marriage Status in Centre County
83.9% of women with births (1,407) in Centre County are married. The highest percentage of unmarried women with births falls into 20 to 34 years age bracket with 20.3% of them unmarried at the time of birth, while the lowest percentage of unmarried women with births belong to 35 to 50 years age bracket with 8.3% of them unmarried.
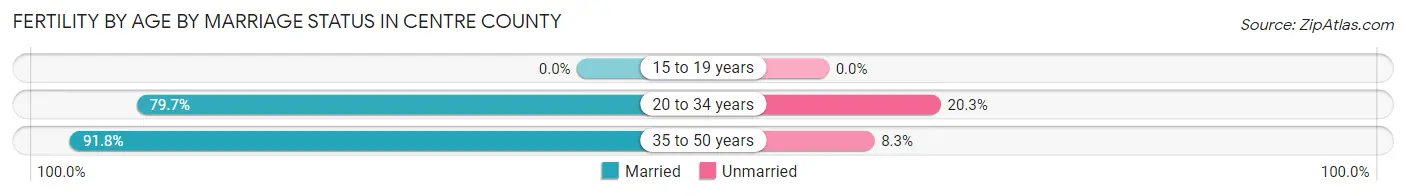
| Age Bracket | Married | Unmarried |
| 15 to 19 years | 0 (0.0%) | 0 (0.0%) |
| 20 to 34 years | 735 (79.7%) | 187 (20.3%) |
| 35 to 50 years | 445 (91.7%) | 40 (8.3%) |
| Total | 1,180 (83.9%) | 227 (16.1%) |
Fertility by Education in Centre County
Average fertility rate in Centre County is 35.0 births per 1,000 women. Women with the education attainment of graduate degree have the highest fertility rate of 54.0 births per 1,000 women, while women with the education attainment of college or associate's degree have the lowest fertility at 24.0 births per 1,000 women. Women with the education attainment of bachelor's degree represent 28.1% of all women with births.
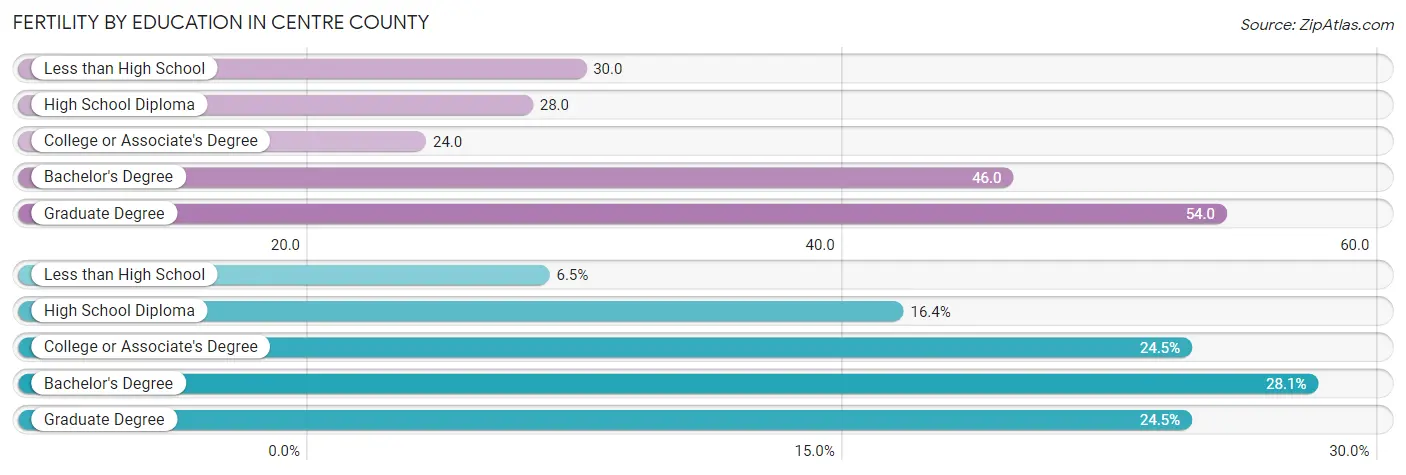
| Educational Attainment | Women with Births | Births / 1,000 Women |
| Less than High School | 91 (6.5%) | 30.0 |
| High School Diploma | 231 (16.4%) | 28.0 |
| College or Associate's Degree | 345 (24.5%) | 24.0 |
| Bachelor's Degree | 395 (28.1%) | 46.0 |
| Graduate Degree | 345 (24.5%) | 54.0 |
| Total | 1,407 (100.0%) | 35.0 |
Fertility by Education by Marriage Status in Centre County
16.1% of women with births in Centre County are unmarried. Women with the educational attainment of graduate degree are most likely to be married with 100.0% of them married at childbirth, while women with the educational attainment of high school diploma are least likely to be married with 42.0% of them unmarried at childbirth.
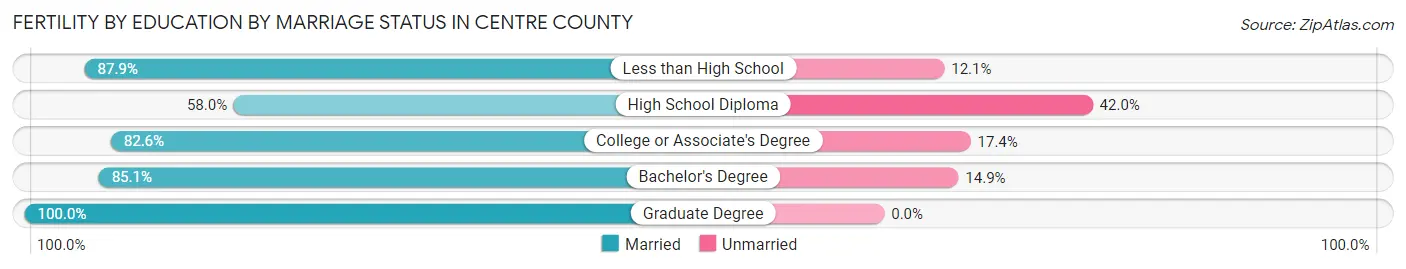
| Educational Attainment | Married | Unmarried |
| Less than High School | 80 (87.9%) | 11 (12.1%) |
| High School Diploma | 134 (58.0%) | 97 (42.0%) |
| College or Associate's Degree | 285 (82.6%) | 60 (17.4%) |
| Bachelor's Degree | 336 (85.1%) | 59 (14.9%) |
| Graduate Degree | 345 (100.0%) | 0 (0.0%) |
| Total | 1,180 (83.9%) | 227 (16.1%) |
Employment Characteristics in Centre County
Employment by Class of Employer in Centre County
Among the 73,011 employed individuals in Centre County, private company employees (41,068 | 56.2%), state government employees (12,006 | 16.4%), and not-for-profit organizations (9,908 | 13.6%) make up the most common classes of employment.
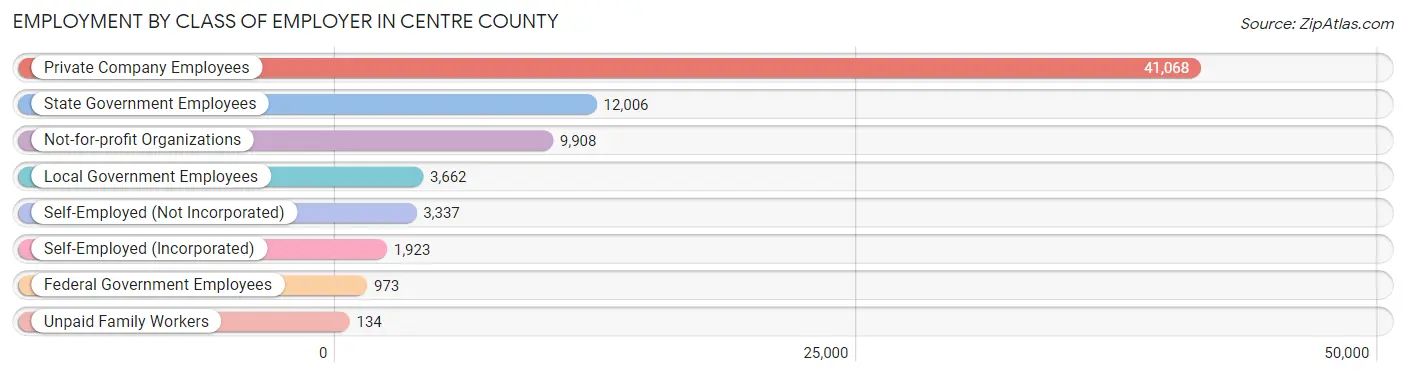
| Employer Class | # Employees | % Employees |
| Private Company Employees | 41,068 | 56.2% |
| Self-Employed (Incorporated) | 1,923 | 2.6% |
| Self-Employed (Not Incorporated) | 3,337 | 4.6% |
| Not-for-profit Organizations | 9,908 | 13.6% |
| Local Government Employees | 3,662 | 5.0% |
| State Government Employees | 12,006 | 16.4% |
| Federal Government Employees | 973 | 1.3% |
| Unpaid Family Workers | 134 | 0.2% |
| Total | 73,011 | 100.0% |
Employment Status by Age in Centre County
According to the labor force statistics for Centre County, out of the total population over 16 years of age (138,066), 56.5% or 78,007 individuals are in the labor force, with 4.0% or 3,120 of them unemployed. The age group with the highest labor force participation rate is 35 to 44 years, with 83.3% or 14,433 individuals in the labor force. Within the labor force, the 16 to 19 years age range has the highest percentage of unemployed individuals, with 11.6% or 455 of them being unemployed.
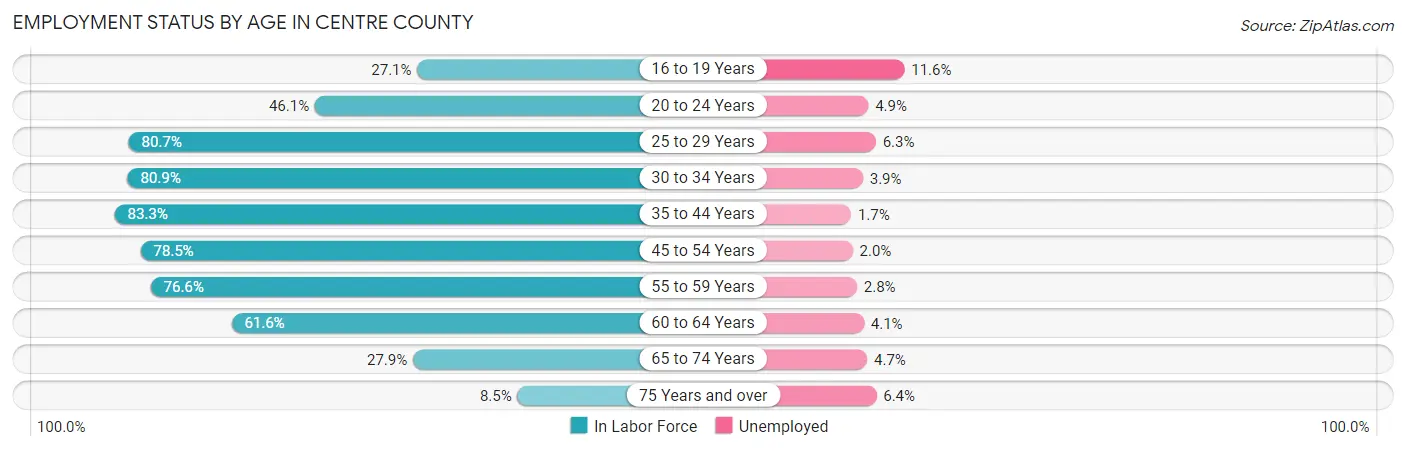
| Age Bracket | In Labor Force | Unemployed |
| 16 to 19 Years | 3,923 (27.1%) | 455 (11.6%) |
| 20 to 24 Years | 12,173 (46.1%) | 596 (4.9%) |
| 25 to 29 Years | 8,733 (80.7%) | 550 (6.3%) |
| 30 to 34 Years | 8,041 (80.9%) | 314 (3.9%) |
| 35 to 44 Years | 14,433 (83.3%) | 245 (1.7%) |
| 45 to 54 Years | 13,359 (78.5%) | 267 (2.0%) |
| 55 to 59 Years | 6,911 (76.6%) | 194 (2.8%) |
| 60 to 64 Years | 5,638 (61.6%) | 231 (4.1%) |
| 65 to 74 Years | 3,877 (27.9%) | 182 (4.7%) |
| 75 Years and over | 851 (8.5%) | 54 (6.4%) |
| Total | 78,007 (56.5%) | 3,120 (4.0%) |
Employment Status by Educational Attainment in Centre County
According to labor force statistics for Centre County, 77.9% of individuals (57,085) out of the total population between 25 and 64 years of age (73,280) are in the labor force, with 3.2% or 1,827 of them being unemployed. The group with the highest labor force participation rate are those with the educational attainment of bachelor's degree or higher, with 87.7% or 31,454 individuals in the labor force. Within the labor force, individuals with less than high school education have the highest percentage of unemployment, with 5.3% or 78 of them being unemployed.
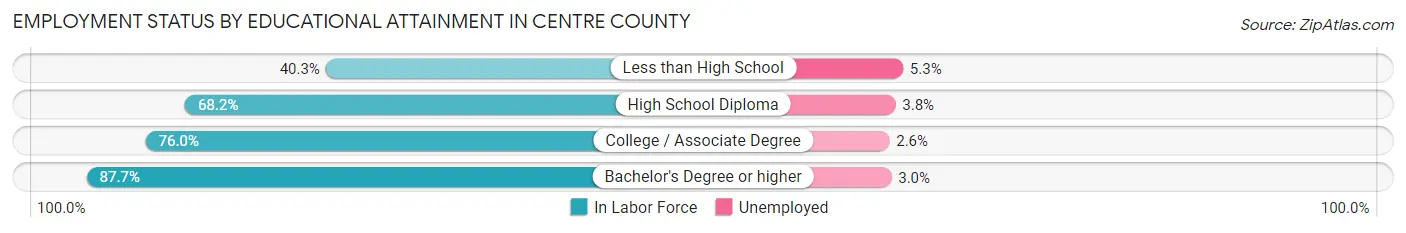
| Educational Attainment | In Labor Force | Unemployed |
| Less than High School | 1,468 (40.3%) | 193 (5.3%) |
| High School Diploma | 13,006 (68.2%) | 725 (3.8%) |
| College / Associate Degree | 11,173 (76.0%) | 382 (2.6%) |
| Bachelor's Degree or higher | 31,454 (87.7%) | 1,076 (3.0%) |
| Total | 57,085 (77.9%) | 2,345 (3.2%) |
Employment Occupations by Sex in Centre County
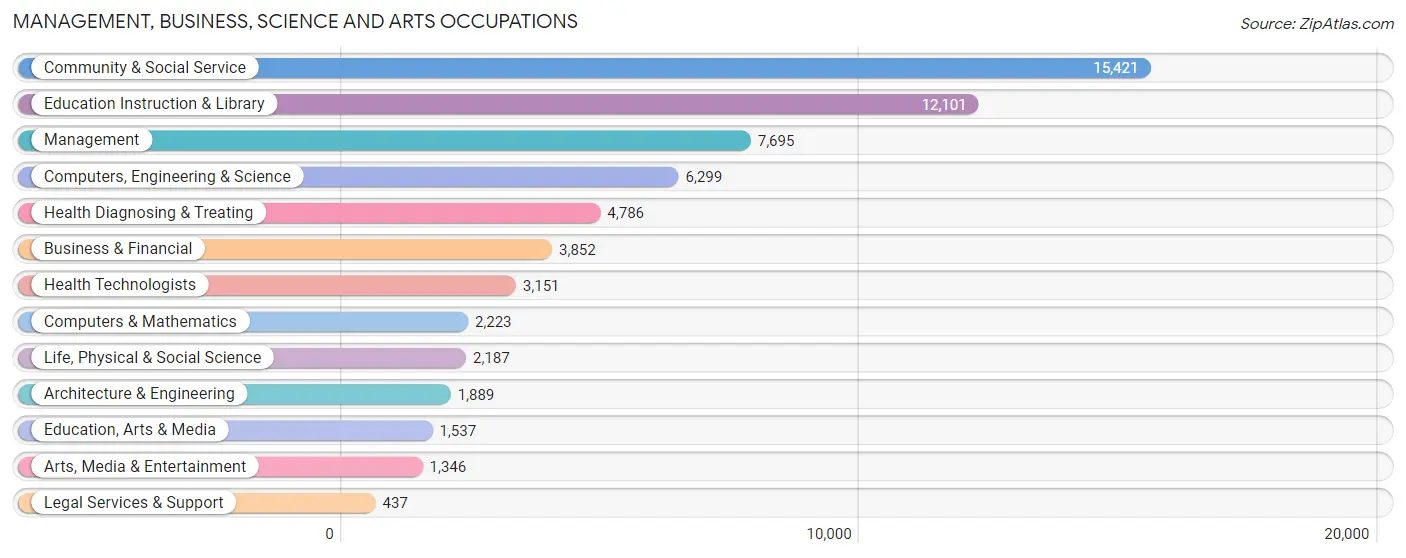
Management, Business, Science and Arts Occupations
The most common Management, Business, Science and Arts occupations in Centre County are Community & Social Service (15,421 | 20.6%), Education Instruction & Library (12,101 | 16.2%), Management (7,695 | 10.3%), Computers, Engineering & Science (6,299 | 8.4%), and Health Diagnosing & Treating (4,786 | 6.4%).
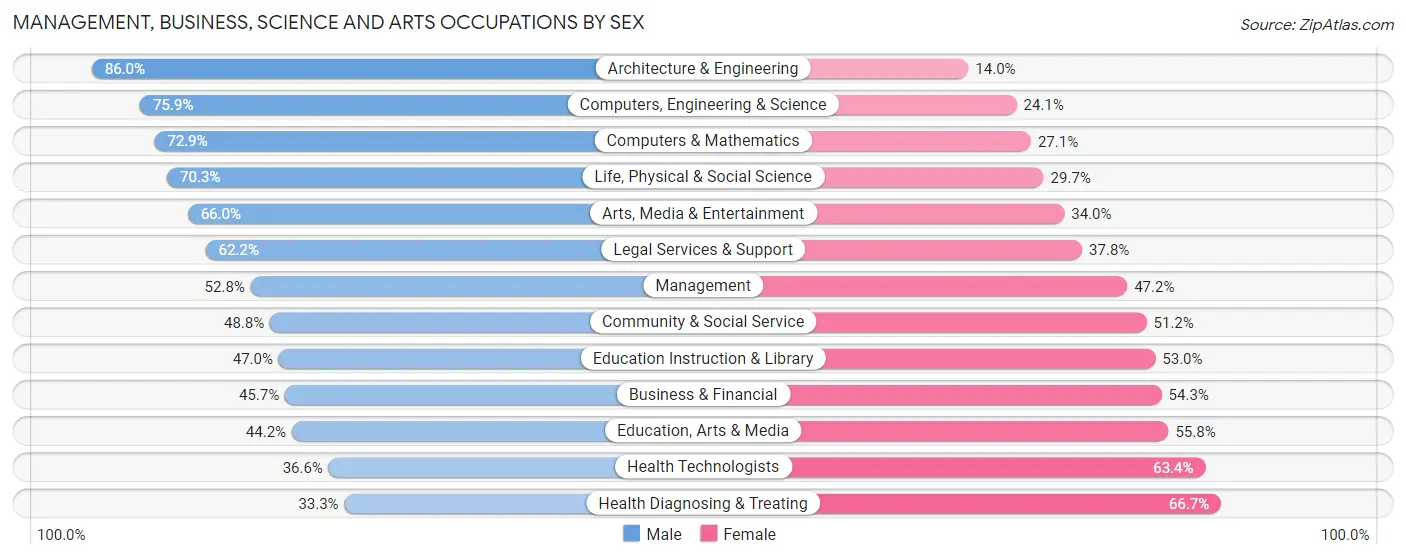
Management, Business, Science and Arts Occupations by Sex
Within the Management, Business, Science and Arts occupations in Centre County, the most male-oriented occupations are Architecture & Engineering (86.0%), Computers, Engineering & Science (75.9%), and Computers & Mathematics (72.9%), while the most female-oriented occupations are Health Diagnosing & Treating (66.7%), Health Technologists (63.4%), and Education, Arts & Media (55.8%).
| Occupation | Male | Female |
| Management | 4,066 (52.8%) | 3,629 (47.2%) |
| Business & Financial | 1,759 (45.7%) | 2,093 (54.3%) |
| Computers, Engineering & Science | 4,782 (75.9%) | 1,517 (24.1%) |
| Computers & Mathematics | 1,621 (72.9%) | 602 (27.1%) |
| Architecture & Engineering | 1,624 (86.0%) | 265 (14.0%) |
| Life, Physical & Social Science | 1,537 (70.3%) | 650 (29.7%) |
| Community & Social Service | 7,525 (48.8%) | 7,896 (51.2%) |
| Education, Arts & Media | 680 (44.2%) | 857 (55.8%) |
| Legal Services & Support | 272 (62.2%) | 165 (37.8%) |
| Education Instruction & Library | 5,685 (47.0%) | 6,416 (53.0%) |
| Arts, Media & Entertainment | 888 (66.0%) | 458 (34.0%) |
| Health Diagnosing & Treating | 1,593 (33.3%) | 3,193 (66.7%) |
| Health Technologists | 1,152 (36.6%) | 1,999 (63.4%) |
| Total (Category) | 19,725 (51.8%) | 18,328 (48.2%) |
| Total (Overall) | 40,287 (53.9%) | 34,383 (46.1%) |
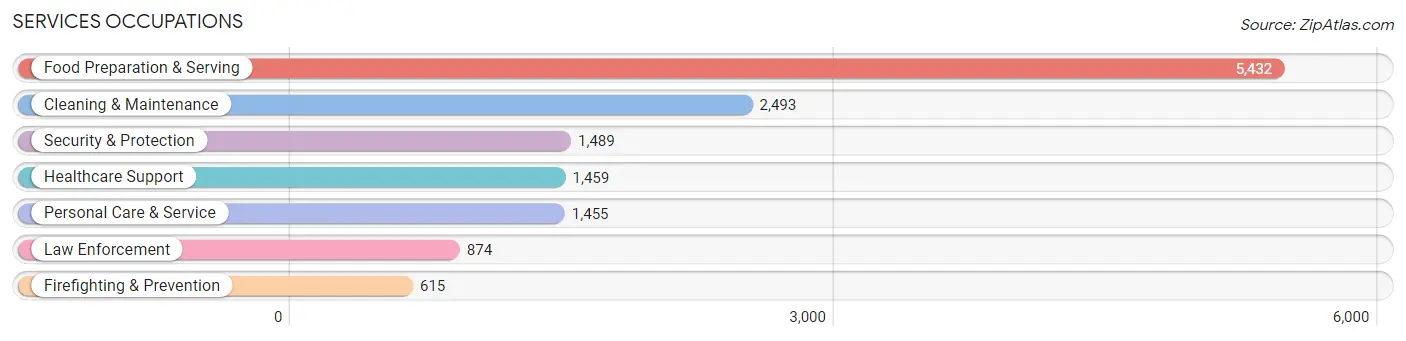
Services Occupations
The most common Services occupations in Centre County are Food Preparation & Serving (5,432 | 7.3%), Cleaning & Maintenance (2,493 | 3.3%), Security & Protection (1,489 | 2.0%), Healthcare Support (1,459 | 1.9%), and Personal Care & Service (1,455 | 1.9%).
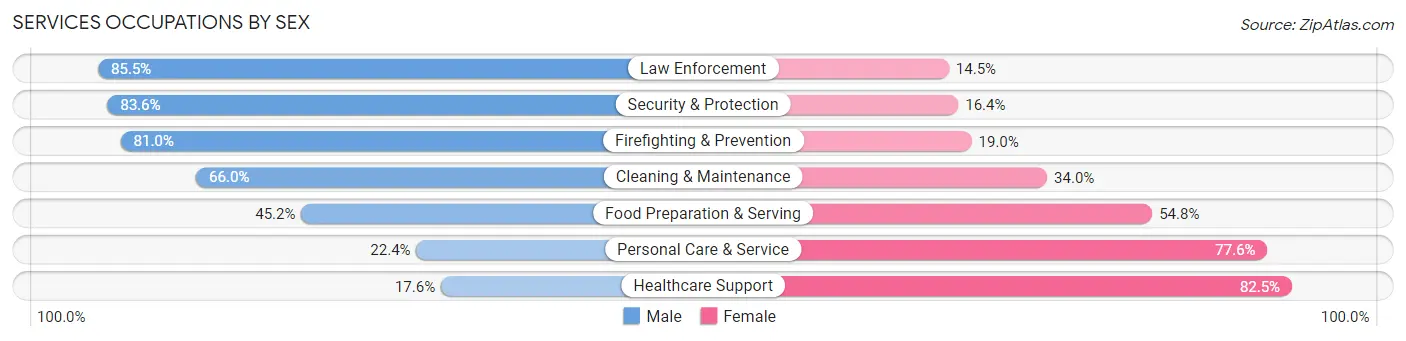
Services Occupations by Sex
Within the Services occupations in Centre County, the most male-oriented occupations are Law Enforcement (85.5%), Security & Protection (83.6%), and Firefighting & Prevention (81.0%), while the most female-oriented occupations are Healthcare Support (82.5%), Personal Care & Service (77.6%), and Food Preparation & Serving (54.8%).
| Occupation | Male | Female |
| Healthcare Support | 256 (17.5%) | 1,203 (82.5%) |
| Security & Protection | 1,245 (83.6%) | 244 (16.4%) |
| Firefighting & Prevention | 498 (81.0%) | 117 (19.0%) |
| Law Enforcement | 747 (85.5%) | 127 (14.5%) |
| Food Preparation & Serving | 2,456 (45.2%) | 2,976 (54.8%) |
| Cleaning & Maintenance | 1,646 (66.0%) | 847 (34.0%) |
| Personal Care & Service | 326 (22.4%) | 1,129 (77.6%) |
| Total (Category) | 5,929 (48.1%) | 6,399 (51.9%) |
| Total (Overall) | 40,287 (53.9%) | 34,383 (46.1%) |
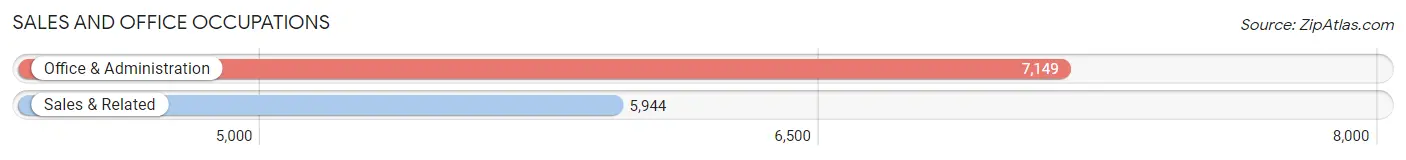
Sales and Office Occupations
The most common Sales and Office occupations in Centre County are Office & Administration (7,149 | 9.6%), and Sales & Related (5,944 | 8.0%).
Sales and Office Occupations by Sex
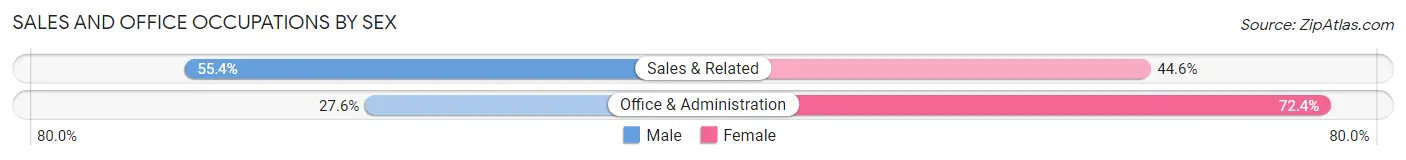
| Occupation | Male | Female |
| Sales & Related | 3,294 (55.4%) | 2,650 (44.6%) |
| Office & Administration | 1,974 (27.6%) | 5,175 (72.4%) |
| Total (Category) | 5,268 (40.2%) | 7,825 (59.8%) |
| Total (Overall) | 40,287 (53.9%) | 34,383 (46.1%) |
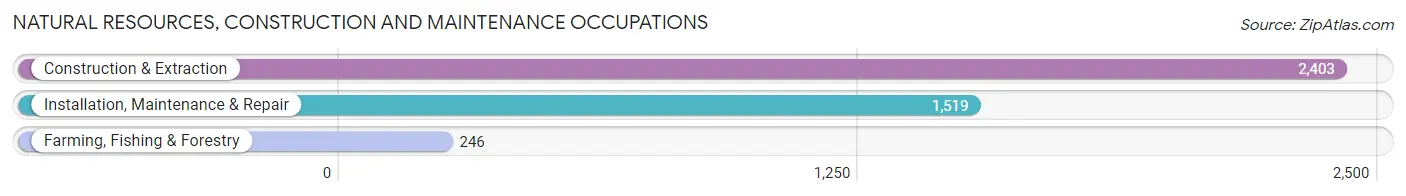
Natural Resources, Construction and Maintenance Occupations
The most common Natural Resources, Construction and Maintenance occupations in Centre County are Construction & Extraction (2,403 | 3.2%), Installation, Maintenance & Repair (1,519 | 2.0%), and Farming, Fishing & Forestry (246 | 0.3%).
Natural Resources, Construction and Maintenance Occupations by Sex
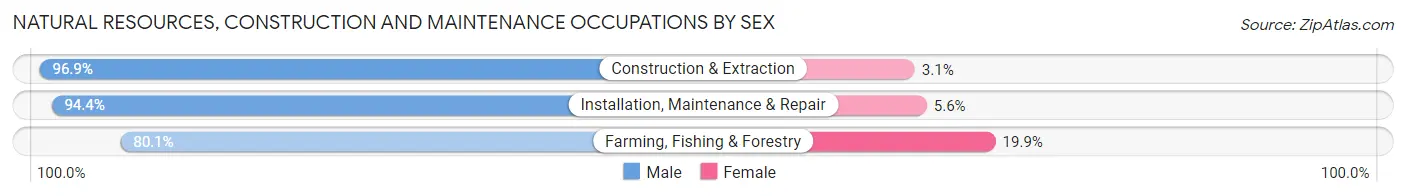
| Occupation | Male | Female |
| Farming, Fishing & Forestry | 197 (80.1%) | 49 (19.9%) |
| Construction & Extraction | 2,328 (96.9%) | 75 (3.1%) |
| Installation, Maintenance & Repair | 1,434 (94.4%) | 85 (5.6%) |
| Total (Category) | 3,959 (95.0%) | 209 (5.0%) |
| Total (Overall) | 40,287 (53.9%) | 34,383 (46.1%) |
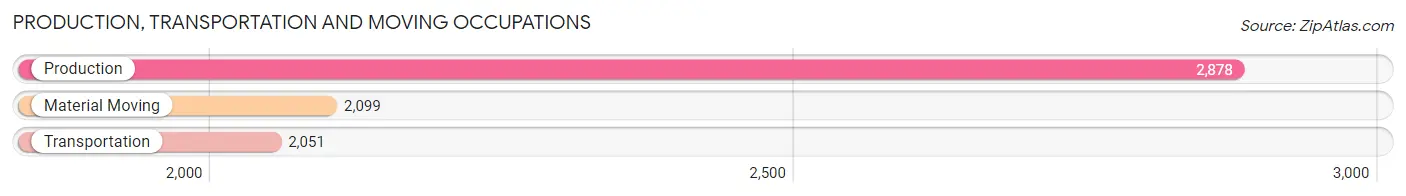
Production, Transportation and Moving Occupations
The most common Production, Transportation and Moving occupations in Centre County are Production (2,878 | 3.8%), Material Moving (2,099 | 2.8%), and Transportation (2,051 | 2.8%).
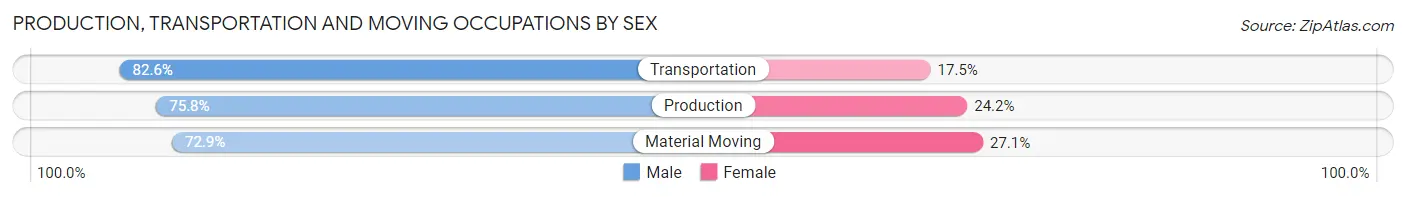
Production, Transportation and Moving Occupations by Sex
| Occupation | Male | Female |
| Production | 2,182 (75.8%) | 696 (24.2%) |
| Transportation | 1,693 (82.6%) | 358 (17.4%) |
| Material Moving | 1,531 (72.9%) | 568 (27.1%) |
| Total (Category) | 5,406 (76.9%) | 1,622 (23.1%) |
| Total (Overall) | 40,287 (53.9%) | 34,383 (46.1%) |
Employment Industries by Sex in Centre County
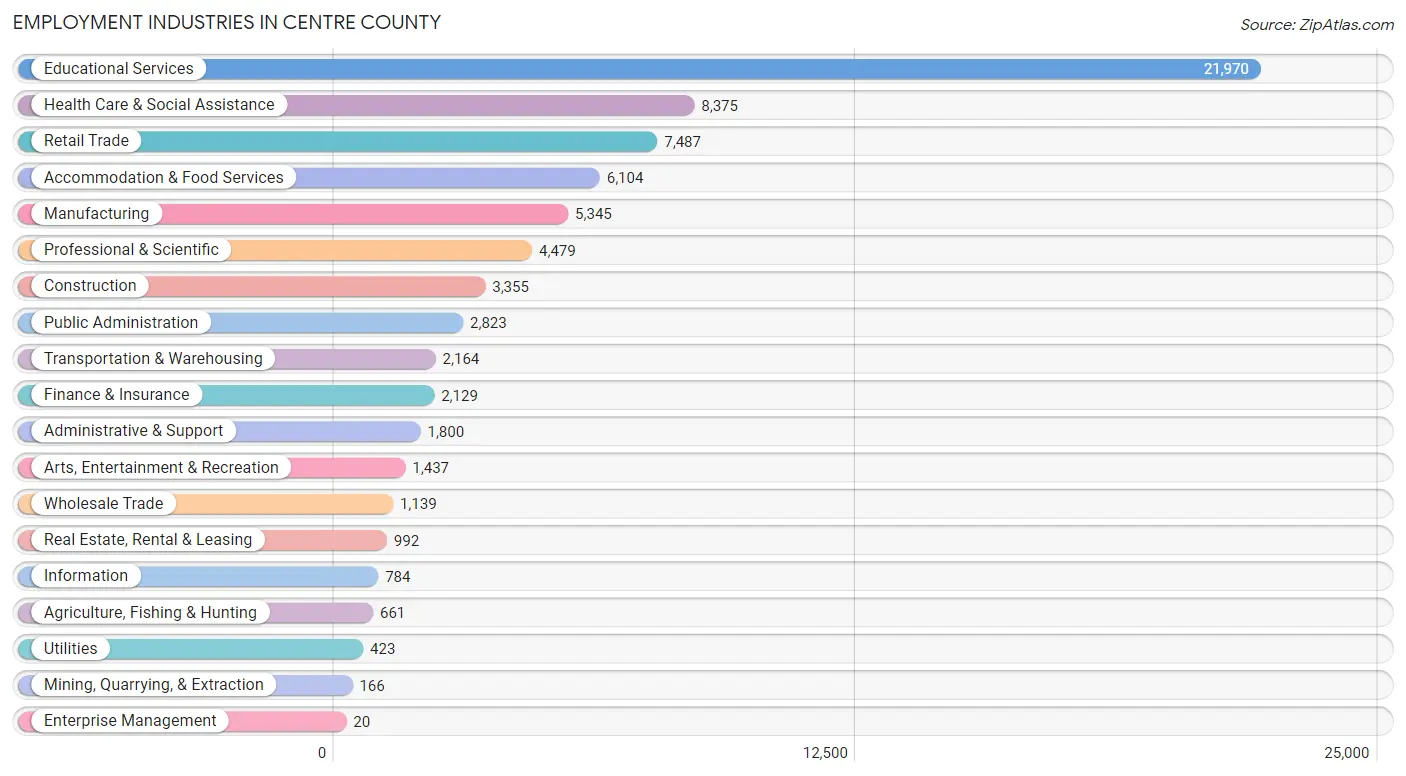
Employment Industries in Centre County
The major employment industries in Centre County include Educational Services (21,970 | 29.4%), Health Care & Social Assistance (8,375 | 11.2%), Retail Trade (7,487 | 10.0%), Accommodation & Food Services (6,104 | 8.2%), and Manufacturing (5,345 | 7.2%).
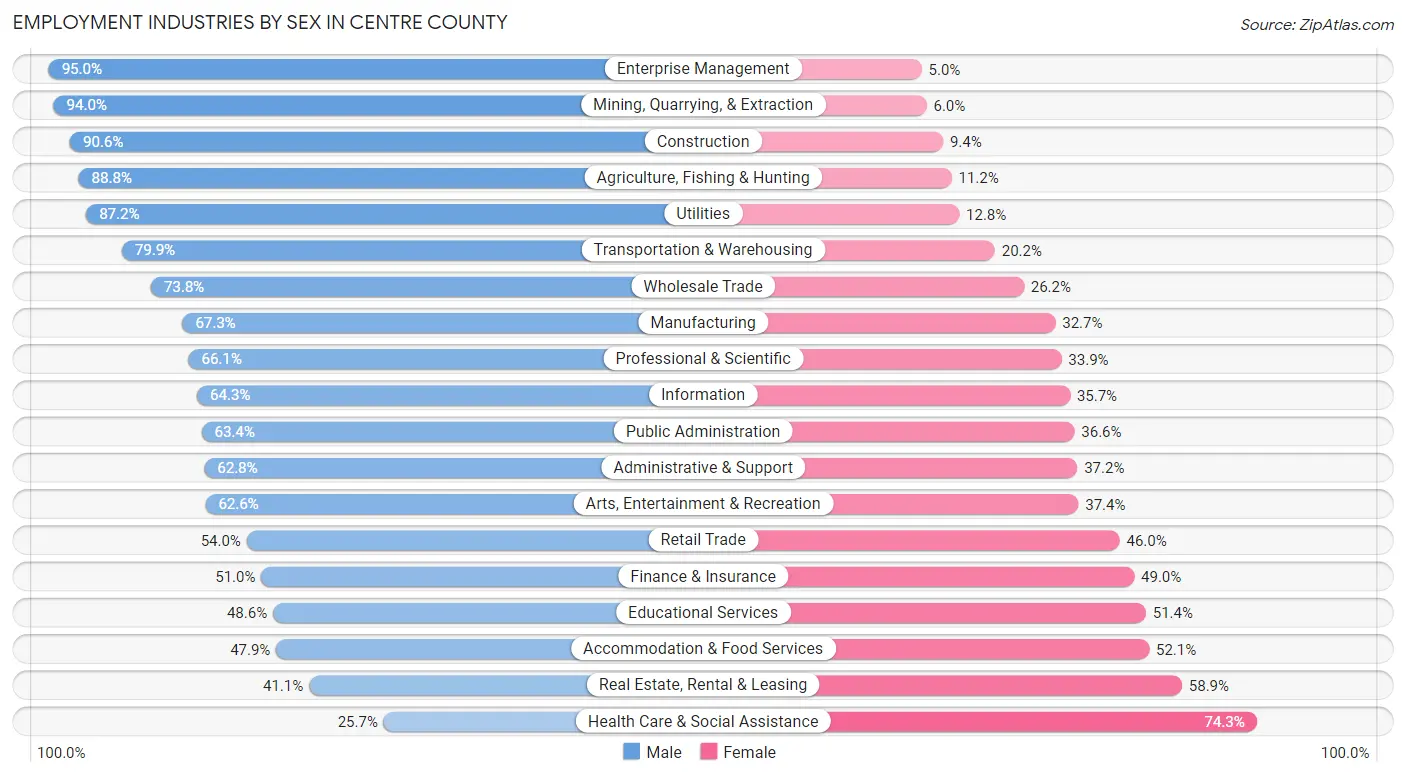
Employment Industries by Sex in Centre County
The Centre County industries that see more men than women are Enterprise Management (95.0%), Mining, Quarrying, & Extraction (94.0%), and Construction (90.6%), whereas the industries that tend to have a higher number of women are Health Care & Social Assistance (74.3%), Real Estate, Rental & Leasing (58.9%), and Accommodation & Food Services (52.1%).
| Industry | Male | Female |
| Agriculture, Fishing & Hunting | 587 (88.8%) | 74 (11.2%) |
| Mining, Quarrying, & Extraction | 156 (94.0%) | 10 (6.0%) |
| Construction | 3,039 (90.6%) | 316 (9.4%) |
| Manufacturing | 3,598 (67.3%) | 1,747 (32.7%) |
| Wholesale Trade | 841 (73.8%) | 298 (26.2%) |
| Retail Trade | 4,045 (54.0%) | 3,442 (46.0%) |
| Transportation & Warehousing | 1,728 (79.8%) | 436 (20.2%) |
| Utilities | 369 (87.2%) | 54 (12.8%) |
| Information | 504 (64.3%) | 280 (35.7%) |
| Finance & Insurance | 1,086 (51.0%) | 1,043 (49.0%) |
| Real Estate, Rental & Leasing | 408 (41.1%) | 584 (58.9%) |
| Professional & Scientific | 2,959 (66.1%) | 1,520 (33.9%) |
| Enterprise Management | 19 (95.0%) | 1 (5.0%) |
| Administrative & Support | 1,130 (62.8%) | 670 (37.2%) |
| Educational Services | 10,676 (48.6%) | 11,294 (51.4%) |
| Health Care & Social Assistance | 2,149 (25.7%) | 6,226 (74.3%) |
| Arts, Entertainment & Recreation | 899 (62.6%) | 538 (37.4%) |
| Accommodation & Food Services | 2,925 (47.9%) | 3,179 (52.1%) |
| Public Administration | 1,789 (63.4%) | 1,034 (36.6%) |
| Total | 40,287 (53.9%) | 34,383 (46.1%) |
Education in Centre County
School Enrollment in Centre County
The most common levels of schooling among the 57,077 students in Centre County are college / undergraduate (31,969 | 56.0%), graduate / professional (7,259 | 12.7%), and elementary school (5,330 | 9.3%).
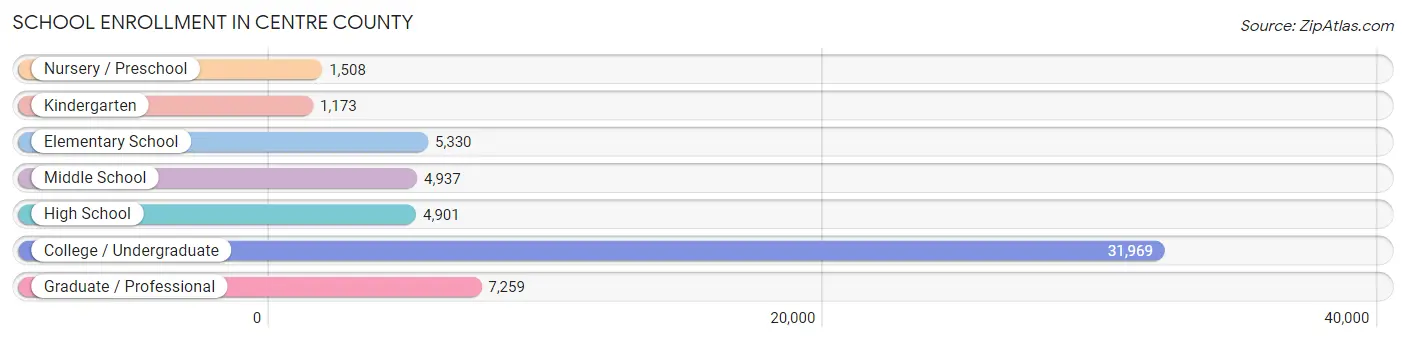
| School Level | # Students | % Students |
| Nursery / Preschool | 1,508 | 2.6% |
| Kindergarten | 1,173 | 2.1% |
| Elementary School | 5,330 | 9.3% |
| Middle School | 4,937 | 8.6% |
| High School | 4,901 | 8.6% |
| College / Undergraduate | 31,969 | 56.0% |
| Graduate / Professional | 7,259 | 12.7% |
| Total | 57,077 | 100.0% |
School Enrollment by Age by Funding Source in Centre County
Out of a total of 57,077 students who are enrolled in schools in Centre County, 5,879 (10.3%) attend a private institution, while the remaining 51,198 (89.7%) are enrolled in public schools. The age group of 3 to 4 year olds has the highest likelihood of being enrolled in private schools, with 714 (65.7% in the age bracket) enrolled. Conversely, the age group of 18 to 19 year olds has the lowest likelihood of being enrolled in a private school, with 11,078 (97.1% in the age bracket) attending a public institution.
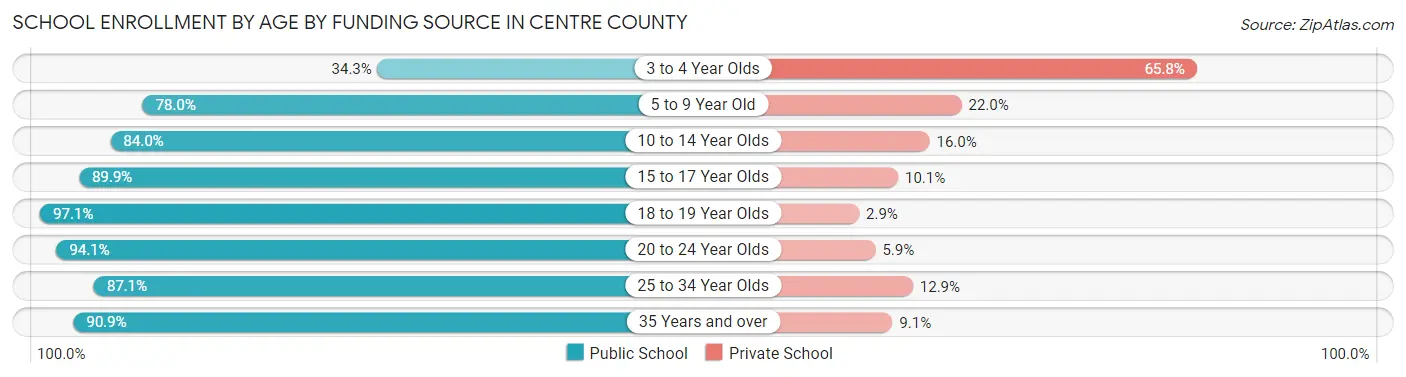
| Age Bracket | Public School | Private School |
| 3 to 4 Year Olds | 372 (34.3%) | 714 (65.7%) |
| 5 to 9 Year Old | 4,889 (78.0%) | 1,376 (22.0%) |
| 10 to 14 Year Olds | 5,200 (84.0%) | 990 (16.0%) |
| 15 to 17 Year Olds | 3,583 (89.9%) | 404 (10.1%) |
| 18 to 19 Year Olds | 11,078 (97.1%) | 328 (2.9%) |
| 20 to 24 Year Olds | 20,093 (94.1%) | 1,265 (5.9%) |
| 25 to 34 Year Olds | 4,136 (87.1%) | 612 (12.9%) |
| 35 Years and over | 1,852 (90.9%) | 185 (9.1%) |
| Total | 51,198 (89.7%) | 5,879 (10.3%) |
Educational Attainment by Field of Study in Centre County
Education (5,811 | 11.8%), bio, nature & agricultural (5,721 | 11.7%), business (5,658 | 11.5%), science & technology (5,084 | 10.4%), and engineering (4,681 | 9.6%) are the most common fields of study among 49,029 individuals in Centre County who have obtained a bachelor's degree or higher.
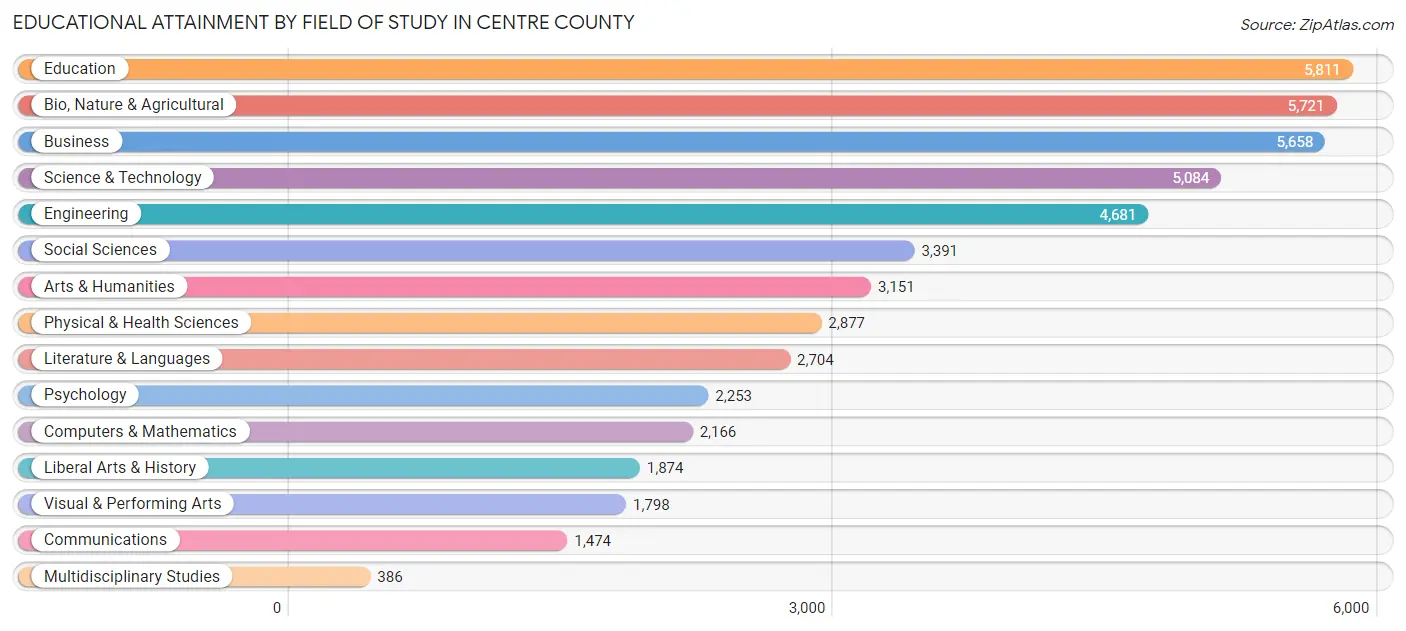
| Field of Study | # Graduates | % Graduates |
| Computers & Mathematics | 2,166 | 4.4% |
| Bio, Nature & Agricultural | 5,721 | 11.7% |
| Physical & Health Sciences | 2,877 | 5.9% |
| Psychology | 2,253 | 4.6% |
| Social Sciences | 3,391 | 6.9% |
| Engineering | 4,681 | 9.6% |
| Multidisciplinary Studies | 386 | 0.8% |
| Science & Technology | 5,084 | 10.4% |
| Business | 5,658 | 11.5% |
| Education | 5,811 | 11.8% |
| Literature & Languages | 2,704 | 5.5% |
| Liberal Arts & History | 1,874 | 3.8% |
| Visual & Performing Arts | 1,798 | 3.7% |
| Communications | 1,474 | 3.0% |
| Arts & Humanities | 3,151 | 6.4% |
| Total | 49,029 | 100.0% |
Transportation & Commute in Centre County
Vehicle Availability by Sex in Centre County
The most prevalent vehicle ownership categories in Centre County are males with 2 vehicles (15,148, accounting for 39.5%) and females with 2 vehicles (12,983, making up 47.0%).
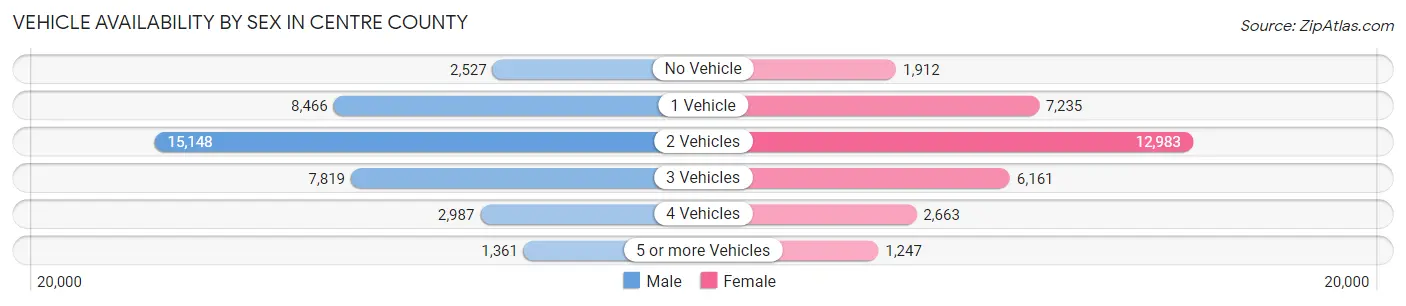
| Vehicles Available | Male | Female |
| No Vehicle | 2,527 (6.6%) | 1,912 (5.9%) |
| 1 Vehicle | 8,466 (22.1%) | 7,235 (22.5%) |
| 2 Vehicles | 15,148 (39.5%) | 12,983 (40.3%) |
| 3 Vehicles | 7,819 (20.4%) | 6,161 (19.1%) |
| 4 Vehicles | 2,987 (7.8%) | 2,663 (8.3%) |
| 5 or more Vehicles | 1,361 (3.5%) | 1,247 (3.9%) |
| Total | 38,308 (100.0%) | 32,201 (100.0%) |
Commute Time in Centre County
The most frequently occuring commute durations in Centre County are 15 to 19 minutes (13,130 commuters, 20.5%), 10 to 14 minutes (12,131 commuters, 18.9%), and 20 to 24 minutes (9,542 commuters, 14.9%).
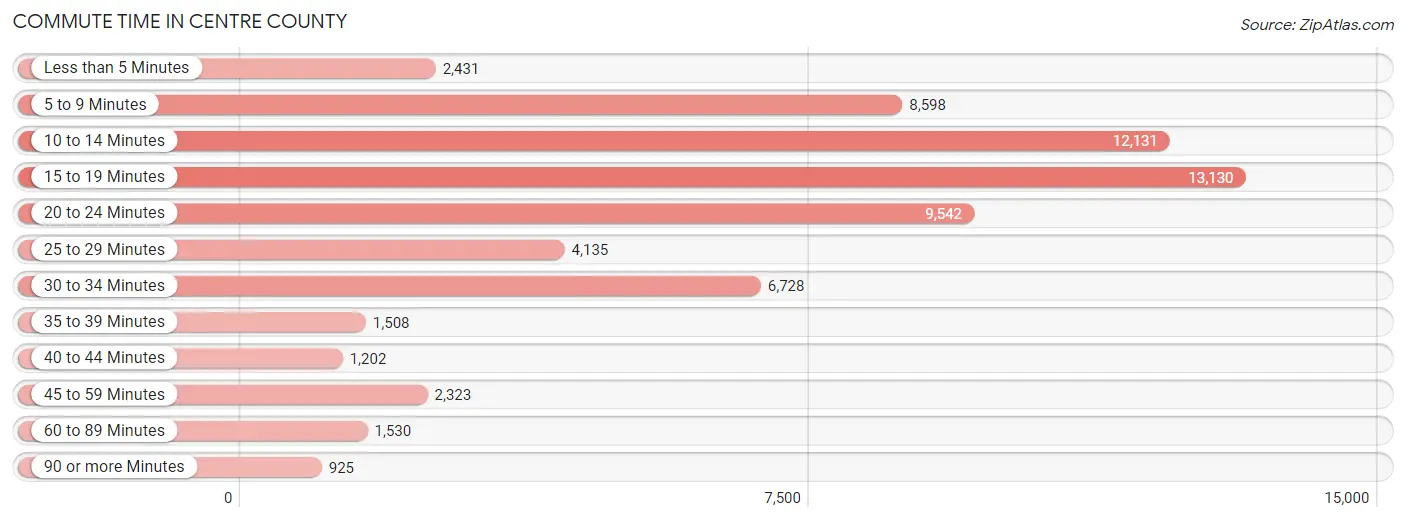
| Commute Time | # Commuters | % Commuters |
| Less than 5 Minutes | 2,431 | 3.8% |
| 5 to 9 Minutes | 8,598 | 13.4% |
| 10 to 14 Minutes | 12,131 | 18.9% |
| 15 to 19 Minutes | 13,130 | 20.5% |
| 20 to 24 Minutes | 9,542 | 14.9% |
| 25 to 29 Minutes | 4,135 | 6.4% |
| 30 to 34 Minutes | 6,728 | 10.5% |
| 35 to 39 Minutes | 1,508 | 2.4% |
| 40 to 44 Minutes | 1,202 | 1.9% |
| 45 to 59 Minutes | 2,323 | 3.6% |
| 60 to 89 Minutes | 1,530 | 2.4% |
| 90 or more Minutes | 925 | 1.4% |
Commute Time by Sex in Centre County
The most common commute times in Centre County are 15 to 19 minutes (7,480 commuters, 21.3%) for males and 15 to 19 minutes (5,650 commuters, 19.4%) for females.
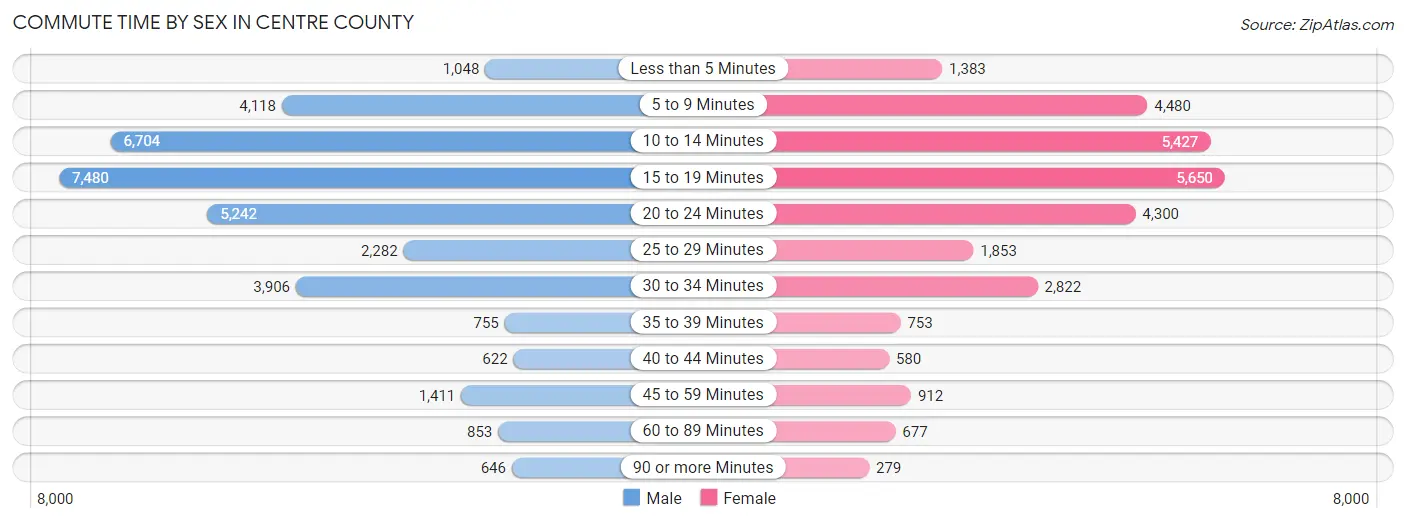
| Commute Time | Male | Female |
| Less than 5 Minutes | 1,048 (3.0%) | 1,383 (4.8%) |
| 5 to 9 Minutes | 4,118 (11.7%) | 4,480 (15.4%) |
| 10 to 14 Minutes | 6,704 (19.1%) | 5,427 (18.6%) |
| 15 to 19 Minutes | 7,480 (21.3%) | 5,650 (19.4%) |
| 20 to 24 Minutes | 5,242 (14.9%) | 4,300 (14.8%) |
| 25 to 29 Minutes | 2,282 (6.5%) | 1,853 (6.4%) |
| 30 to 34 Minutes | 3,906 (11.1%) | 2,822 (9.7%) |
| 35 to 39 Minutes | 755 (2.1%) | 753 (2.6%) |
| 40 to 44 Minutes | 622 (1.8%) | 580 (2.0%) |
| 45 to 59 Minutes | 1,411 (4.0%) | 912 (3.1%) |
| 60 to 89 Minutes | 853 (2.4%) | 677 (2.3%) |
| 90 or more Minutes | 646 (1.8%) | 279 (1.0%) |
Time of Departure to Work by Sex in Centre County
The most frequent times of departure to work in Centre County are 8:00 AM to 8:29 AM (4,549, 13.0%) for males and 7:30 AM to 7:59 AM (5,506, 18.9%) for females.
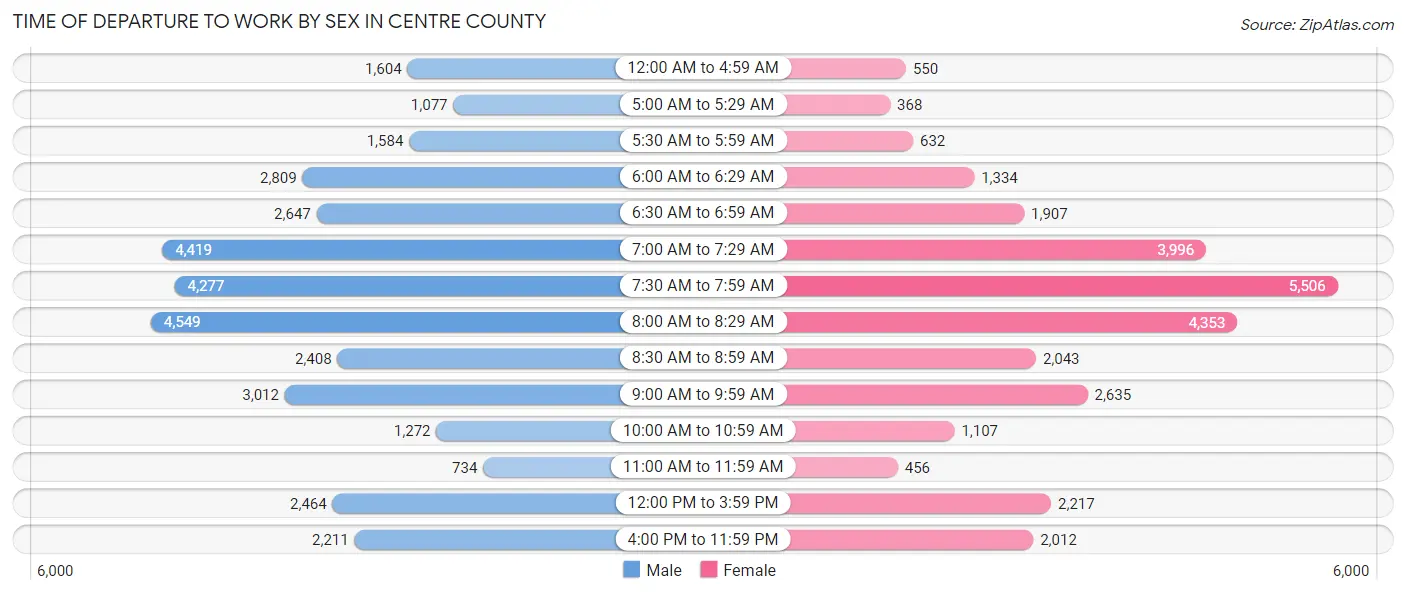
| Time of Departure | Male | Female |
| 12:00 AM to 4:59 AM | 1,604 (4.6%) | 550 (1.9%) |
| 5:00 AM to 5:29 AM | 1,077 (3.1%) | 368 (1.3%) |
| 5:30 AM to 5:59 AM | 1,584 (4.5%) | 632 (2.2%) |
| 6:00 AM to 6:29 AM | 2,809 (8.0%) | 1,334 (4.6%) |
| 6:30 AM to 6:59 AM | 2,647 (7.5%) | 1,907 (6.6%) |
| 7:00 AM to 7:29 AM | 4,419 (12.6%) | 3,996 (13.7%) |
| 7:30 AM to 7:59 AM | 4,277 (12.2%) | 5,506 (18.9%) |
| 8:00 AM to 8:29 AM | 4,549 (13.0%) | 4,353 (14.9%) |
| 8:30 AM to 8:59 AM | 2,408 (6.9%) | 2,043 (7.0%) |
| 9:00 AM to 9:59 AM | 3,012 (8.6%) | 2,635 (9.0%) |
| 10:00 AM to 10:59 AM | 1,272 (3.6%) | 1,107 (3.8%) |
| 11:00 AM to 11:59 AM | 734 (2.1%) | 456 (1.6%) |
| 12:00 PM to 3:59 PM | 2,464 (7.0%) | 2,217 (7.6%) |
| 4:00 PM to 11:59 PM | 2,211 (6.3%) | 2,012 (6.9%) |
| Total | 35,067 (100.0%) | 29,116 (100.0%) |
Housing Occupancy in Centre County
Occupancy by Ownership in Centre County
Of the total 58,285 dwellings in Centre County, owner-occupied units account for 36,460 (62.5%), while renter-occupied units make up 21,825 (37.4%).
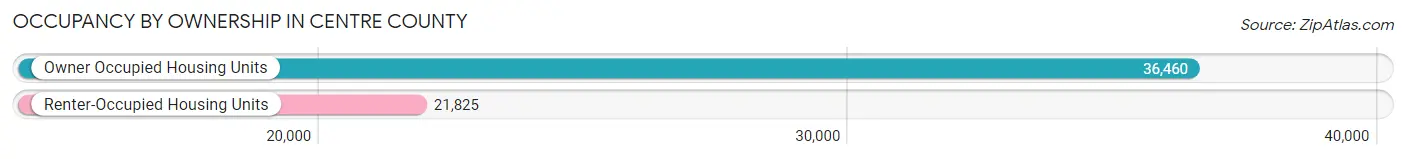
| Occupancy | # Housing Units | % Housing Units |
| Owner Occupied Housing Units | 36,460 | 62.5% |
| Renter-Occupied Housing Units | 21,825 | 37.4% |
| Total Occupied Housing Units | 58,285 | 100.0% |
Occupancy by Household Size in Centre County
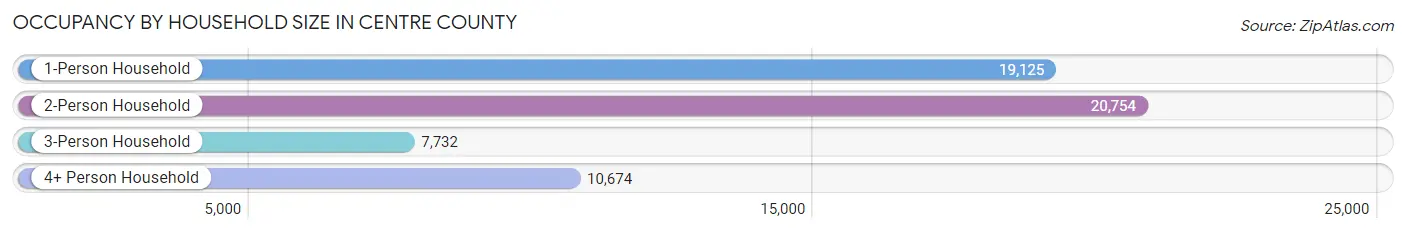
| Household Size | # Housing Units | % Housing Units |
| 1-Person Household | 19,125 | 32.8% |
| 2-Person Household | 20,754 | 35.6% |
| 3-Person Household | 7,732 | 13.3% |
| 4+ Person Household | 10,674 | 18.3% |
| Total Housing Units | 58,285 | 100.0% |
Occupancy by Ownership by Household Size in Centre County
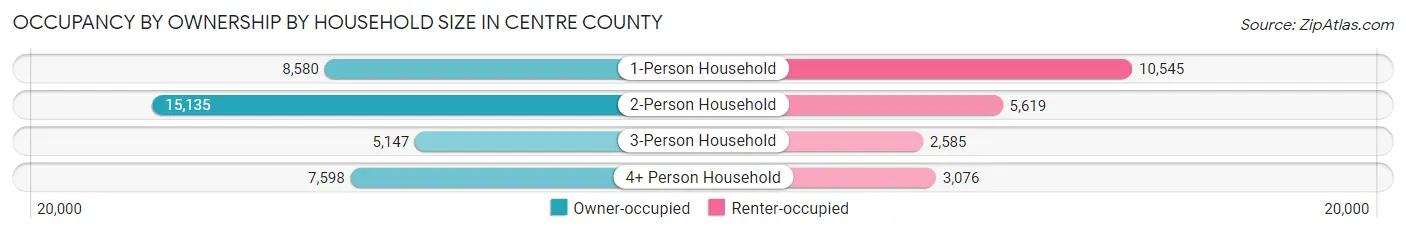
| Household Size | Owner-occupied | Renter-occupied |
| 1-Person Household | 8,580 (44.9%) | 10,545 (55.1%) |
| 2-Person Household | 15,135 (72.9%) | 5,619 (27.1%) |
| 3-Person Household | 5,147 (66.6%) | 2,585 (33.4%) |
| 4+ Person Household | 7,598 (71.2%) | 3,076 (28.8%) |
| Total Housing Units | 36,460 (62.5%) | 21,825 (37.4%) |
Occupancy by Educational Attainment in Centre County
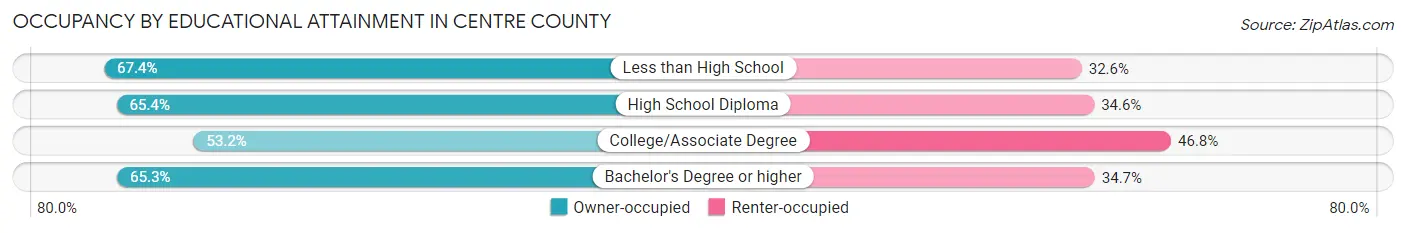
| Household Size | Owner-occupied | Renter-occupied |
| Less than High School | 1,260 (67.4%) | 610 (32.6%) |
| High School Diploma | 9,100 (65.4%) | 4,811 (34.6%) |
| College/Associate Degree | 7,306 (53.2%) | 6,422 (46.8%) |
| Bachelor's Degree or higher | 18,794 (65.3%) | 9,982 (34.7%) |
Occupancy by Age of Householder in Centre County
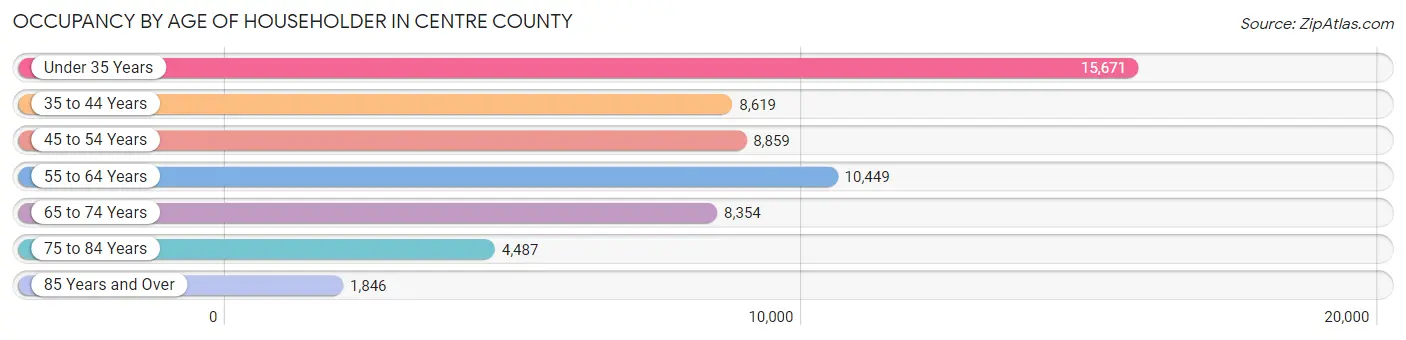
| Age Bracket | # Households | % Households |
| Under 35 Years | 15,671 | 26.9% |
| 35 to 44 Years | 8,619 | 14.8% |
| 45 to 54 Years | 8,859 | 15.2% |
| 55 to 64 Years | 10,449 | 17.9% |
| 65 to 74 Years | 8,354 | 14.3% |
| 75 to 84 Years | 4,487 | 7.7% |
| 85 Years and Over | 1,846 | 3.2% |
| Total | 58,285 | 100.0% |
Housing Finances in Centre County
Median Income by Occupancy in Centre County
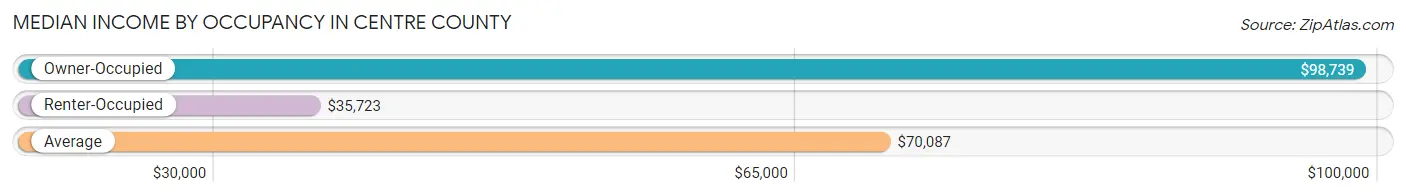
| Occupancy Type | # Households | Median Income |
| Owner-Occupied | 36,460 (62.5%) | $98,739 |
| Renter-Occupied | 21,825 (37.4%) | $35,723 |
| Average | 58,285 (100.0%) | $70,087 |
Occupancy by Householder Income Bracket in Centre County
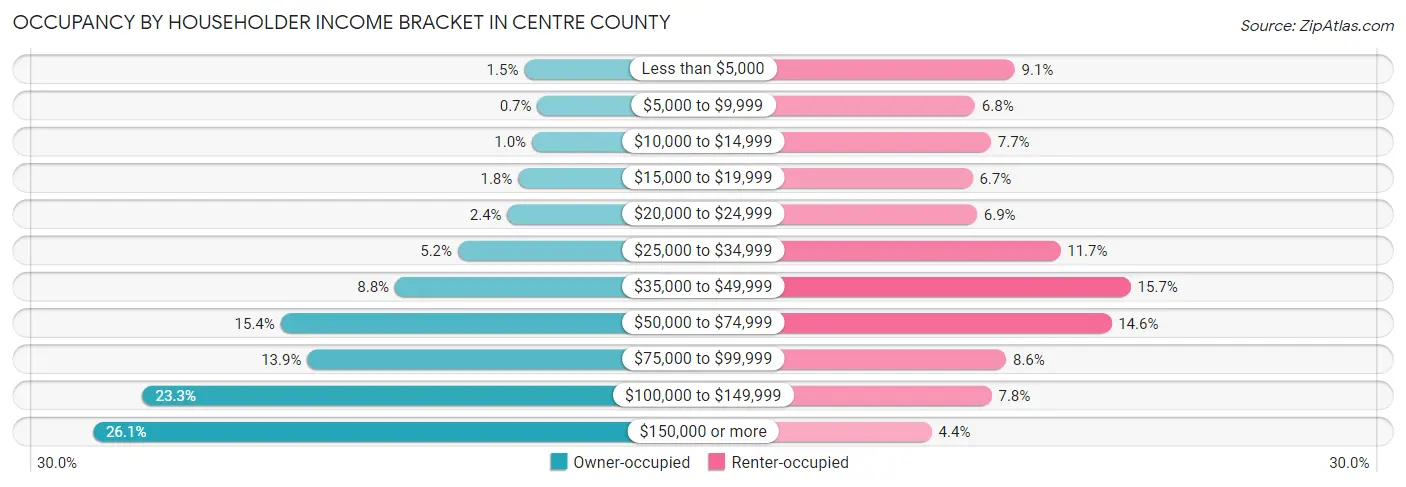
| Income Bracket | Owner-occupied | Renter-occupied |
| Less than $5,000 | 528 (1.5%) | 1,983 (9.1%) |
| $5,000 to $9,999 | 256 (0.7%) | 1,489 (6.8%) |
| $10,000 to $14,999 | 369 (1.0%) | 1,686 (7.7%) |
| $15,000 to $19,999 | 655 (1.8%) | 1,459 (6.7%) |
| $20,000 to $24,999 | 879 (2.4%) | 1,513 (6.9%) |
| $25,000 to $34,999 | 1,909 (5.2%) | 2,553 (11.7%) |
| $35,000 to $49,999 | 3,222 (8.8%) | 3,431 (15.7%) |
| $50,000 to $74,999 | 5,603 (15.4%) | 3,189 (14.6%) |
| $75,000 to $99,999 | 5,048 (13.9%) | 1,877 (8.6%) |
| $100,000 to $149,999 | 8,480 (23.3%) | 1,695 (7.8%) |
| $150,000 or more | 9,511 (26.1%) | 950 (4.3%) |
| Total | 36,460 (100.0%) | 21,825 (100.0%) |
Monthly Housing Cost Tiers in Centre County
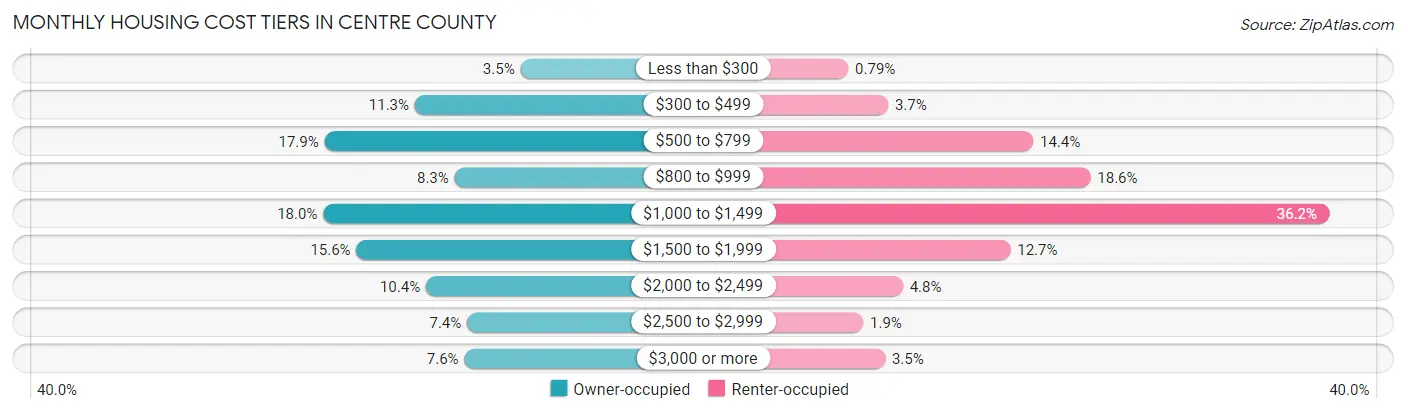
| Monthly Cost | Owner-occupied | Renter-occupied |
| Less than $300 | 1,270 (3.5%) | 172 (0.8%) |
| $300 to $499 | 4,105 (11.3%) | 811 (3.7%) |
| $500 to $799 | 6,530 (17.9%) | 3,145 (14.4%) |
| $800 to $999 | 3,036 (8.3%) | 4,066 (18.6%) |
| $1,000 to $1,499 | 6,565 (18.0%) | 7,899 (36.2%) |
| $1,500 to $1,999 | 5,673 (15.6%) | 2,778 (12.7%) |
| $2,000 to $2,499 | 3,806 (10.4%) | 1,049 (4.8%) |
| $2,500 to $2,999 | 2,701 (7.4%) | 412 (1.9%) |
| $3,000 or more | 2,774 (7.6%) | 764 (3.5%) |
| Total | 36,460 (100.0%) | 21,825 (100.0%) |
Physical Housing Characteristics in Centre County
Housing Structures in Centre County
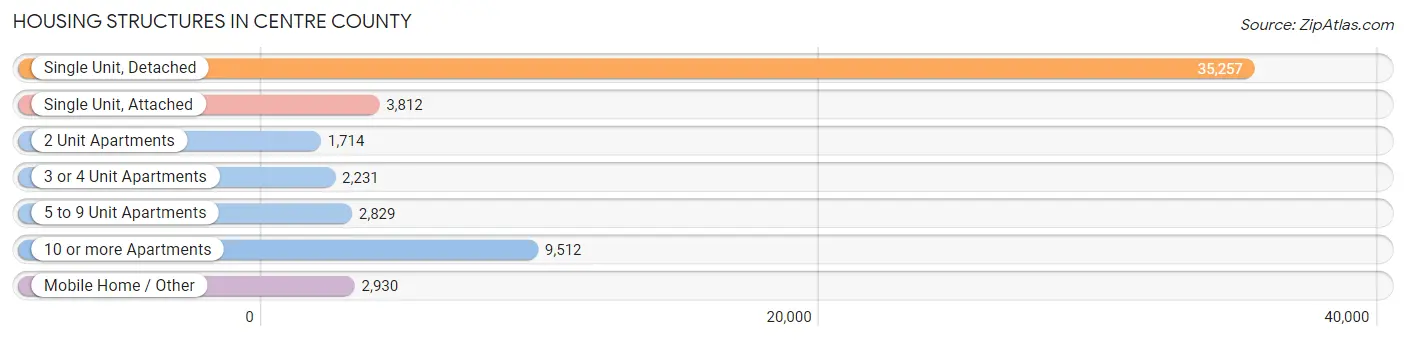
| Structure Type | # Housing Units | % Housing Units |
| Single Unit, Detached | 35,257 | 60.5% |
| Single Unit, Attached | 3,812 | 6.5% |
| 2 Unit Apartments | 1,714 | 2.9% |
| 3 or 4 Unit Apartments | 2,231 | 3.8% |
| 5 to 9 Unit Apartments | 2,829 | 4.9% |
| 10 or more Apartments | 9,512 | 16.3% |
| Mobile Home / Other | 2,930 | 5.0% |
| Total | 58,285 | 100.0% |
Housing Structures by Occupancy in Centre County
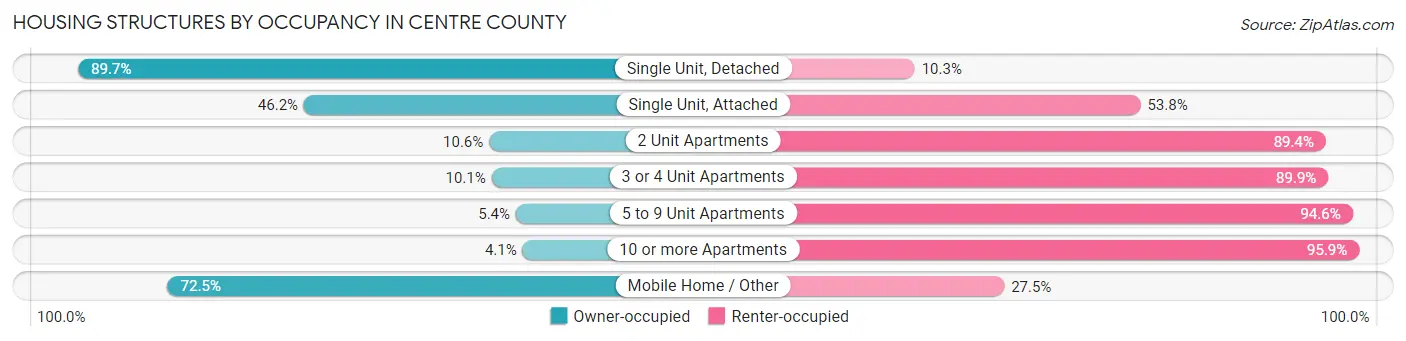
| Structure Type | Owner-occupied | Renter-occupied |
| Single Unit, Detached | 31,623 (89.7%) | 3,634 (10.3%) |
| Single Unit, Attached | 1,762 (46.2%) | 2,050 (53.8%) |
| 2 Unit Apartments | 181 (10.6%) | 1,533 (89.4%) |
| 3 or 4 Unit Apartments | 225 (10.1%) | 2,006 (89.9%) |
| 5 to 9 Unit Apartments | 153 (5.4%) | 2,676 (94.6%) |
| 10 or more Apartments | 393 (4.1%) | 9,119 (95.9%) |
| Mobile Home / Other | 2,123 (72.5%) | 807 (27.5%) |
| Total | 36,460 (62.5%) | 21,825 (37.4%) |
Housing Structures by Number of Rooms in Centre County
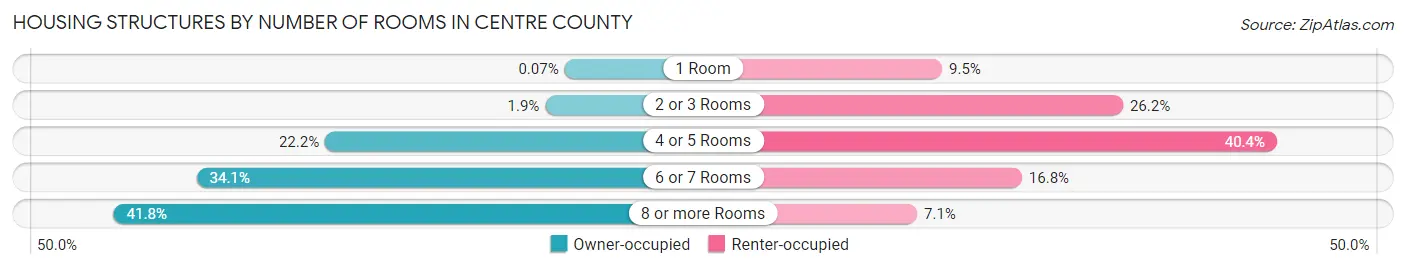
| Number of Rooms | Owner-occupied | Renter-occupied |
| 1 Room | 27 (0.1%) | 2,062 (9.5%) |
| 2 or 3 Rooms | 674 (1.8%) | 5,714 (26.2%) |
| 4 or 5 Rooms | 8,102 (22.2%) | 8,818 (40.4%) |
| 6 or 7 Rooms | 12,430 (34.1%) | 3,673 (16.8%) |
| 8 or more Rooms | 15,227 (41.8%) | 1,558 (7.1%) |
| Total | 36,460 (100.0%) | 21,825 (100.0%) |
Housing Structure by Heating Type in Centre County
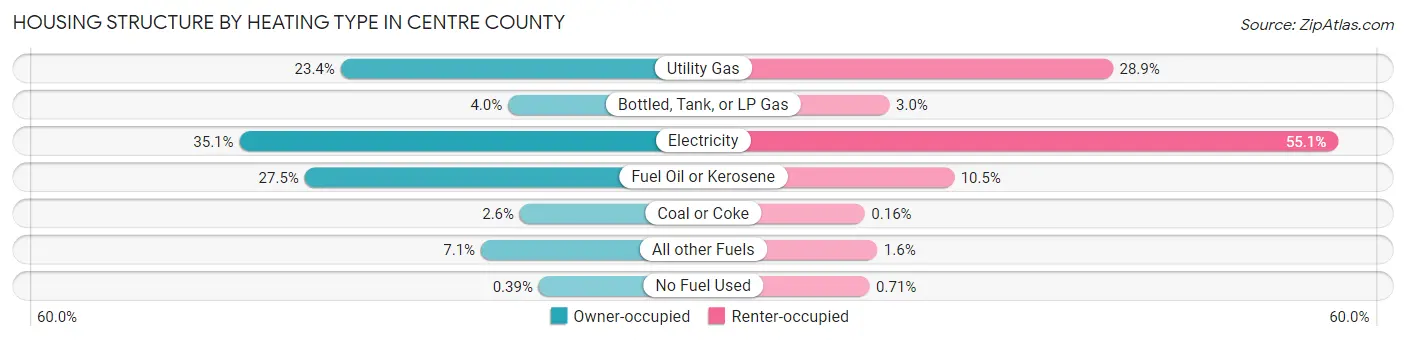
| Heating Type | Owner-occupied | Renter-occupied |
| Utility Gas | 8,517 (23.4%) | 6,313 (28.9%) |
| Bottled, Tank, or LP Gas | 1,441 (4.0%) | 660 (3.0%) |
| Electricity | 12,798 (35.1%) | 12,016 (55.1%) |
| Fuel Oil or Kerosene | 10,038 (27.5%) | 2,293 (10.5%) |
| Coal or Coke | 939 (2.6%) | 35 (0.2%) |
| All other Fuels | 2,586 (7.1%) | 352 (1.6%) |
| No Fuel Used | 141 (0.4%) | 156 (0.7%) |
| Total | 36,460 (100.0%) | 21,825 (100.0%) |
Household Vehicle Usage in Centre County
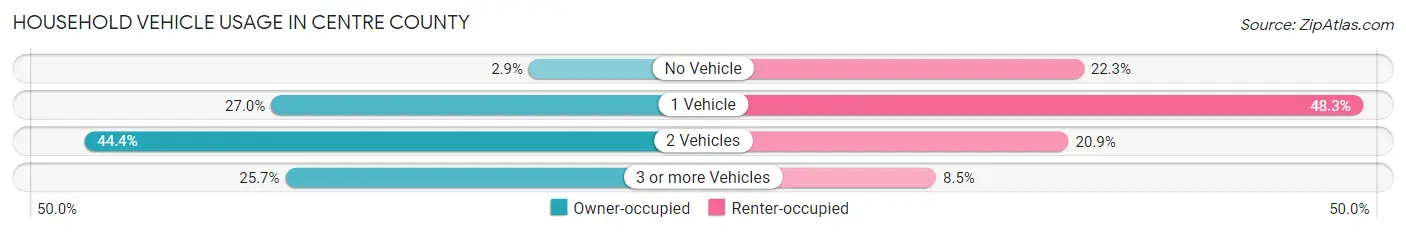
| Vehicles per Household | Owner-occupied | Renter-occupied |
| No Vehicle | 1,067 (2.9%) | 4,868 (22.3%) |
| 1 Vehicle | 9,839 (27.0%) | 10,543 (48.3%) |
| 2 Vehicles | 16,197 (44.4%) | 4,556 (20.9%) |
| 3 or more Vehicles | 9,357 (25.7%) | 1,858 (8.5%) |
| Total | 36,460 (100.0%) | 21,825 (100.0%) |
Real Estate & Mortgages in Centre County
Real Estate and Mortgage Overview in Centre County
| Characteristic | Without Mortgage | With Mortgage |
| Housing Units | 14,757 | 21,703 |
| Median Property Value | $255,100 | $313,300 |
| Median Household Income | $69,544 | $6,919 |
| Monthly Housing Costs | $590 | $2,682 |
| Real Estate Taxes | $2,817 | $153 |
Property Value by Mortgage Status in Centre County
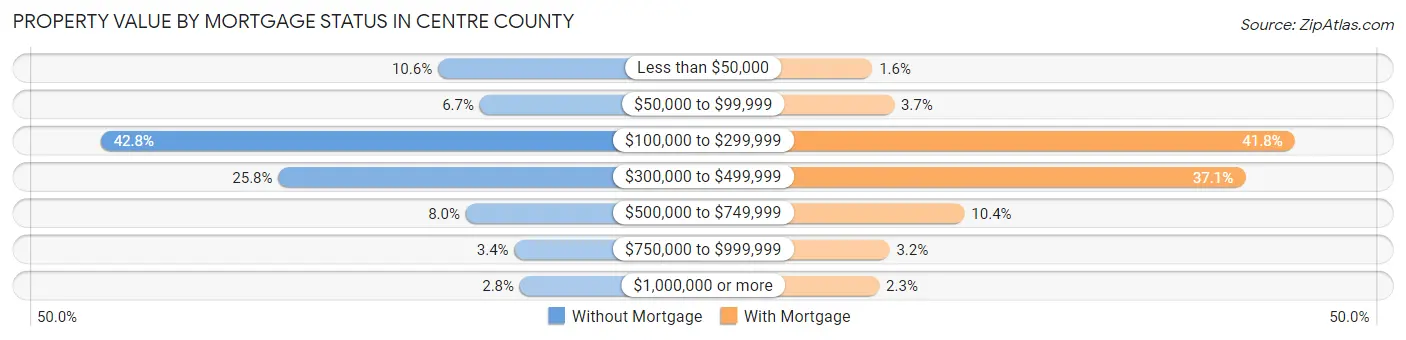
| Property Value | Without Mortgage | With Mortgage |
| Less than $50,000 | 1,568 (10.6%) | 345 (1.6%) |
| $50,000 to $99,999 | 981 (6.7%) | 795 (3.7%) |
| $100,000 to $299,999 | 6,308 (42.7%) | 9,074 (41.8%) |
| $300,000 to $499,999 | 3,812 (25.8%) | 8,050 (37.1%) |
| $500,000 to $749,999 | 1,177 (8.0%) | 2,250 (10.4%) |
| $750,000 to $999,999 | 494 (3.4%) | 700 (3.2%) |
| $1,000,000 or more | 417 (2.8%) | 489 (2.2%) |
| Total | 14,757 (100.0%) | 21,703 (100.0%) |
Household Income by Mortgage Status in Centre County
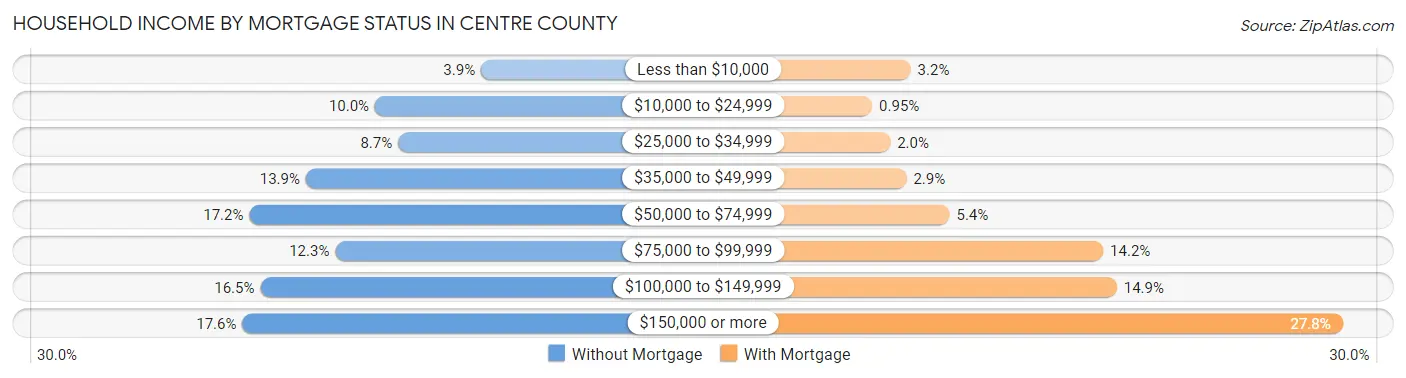
| Household Income | Without Mortgage | With Mortgage |
| Less than $10,000 | 578 (3.9%) | 683 (3.2%) |
| $10,000 to $24,999 | 1,473 (10.0%) | 206 (0.9%) |
| $25,000 to $34,999 | 1,278 (8.7%) | 430 (2.0%) |
| $35,000 to $49,999 | 2,056 (13.9%) | 631 (2.9%) |
| $50,000 to $74,999 | 2,533 (17.2%) | 1,166 (5.4%) |
| $75,000 to $99,999 | 1,807 (12.2%) | 3,070 (14.1%) |
| $100,000 to $149,999 | 2,440 (16.5%) | 3,241 (14.9%) |
| $150,000 or more | 2,592 (17.6%) | 6,040 (27.8%) |
| Total | 14,757 (100.0%) | 21,703 (100.0%) |
Property Value to Household Income Ratio in Centre County
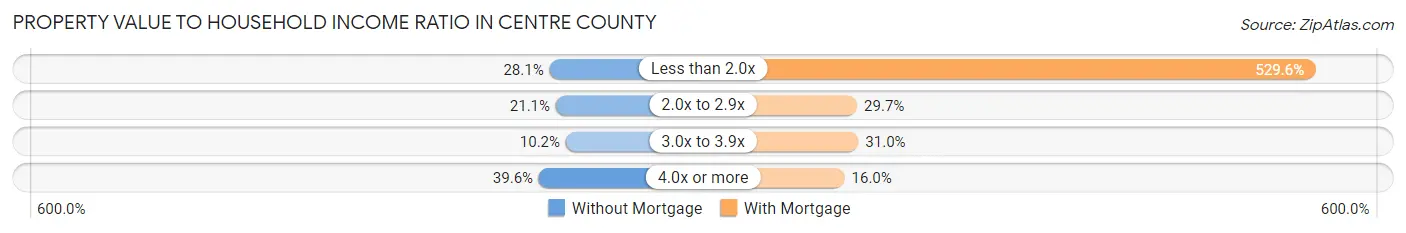
| Value-to-Income Ratio | Without Mortgage | With Mortgage |
| Less than 2.0x | 4,142 (28.1%) | 114,939 (529.6%) |
| 2.0x to 2.9x | 3,116 (21.1%) | 6,438 (29.7%) |
| 3.0x to 3.9x | 1,508 (10.2%) | 6,734 (31.0%) |
| 4.0x or more | 5,841 (39.6%) | 3,471 (16.0%) |
| Total | 14,757 (100.0%) | 21,703 (100.0%) |
Real Estate Taxes by Mortgage Status in Centre County
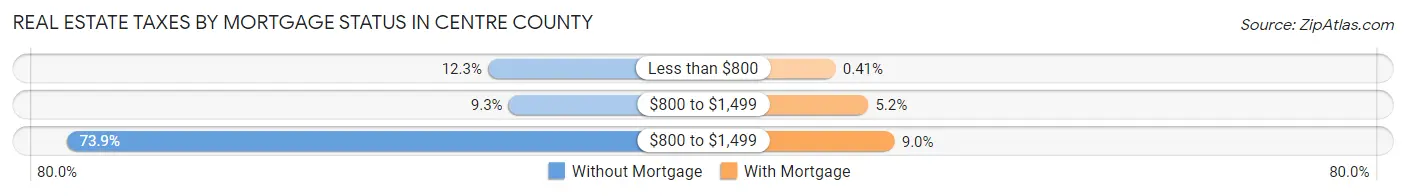
| Property Taxes | Without Mortgage | With Mortgage |
| Less than $800 | 1,819 (12.3%) | 89 (0.4%) |
| $800 to $1,499 | 1,372 (9.3%) | 1,125 (5.2%) |
| $800 to $1,499 | 10,899 (73.9%) | 1,957 (9.0%) |
| Total | 14,757 (100.0%) | 21,703 (100.0%) |
Health & Disability in Centre County
Health Insurance Coverage by Age in Centre County
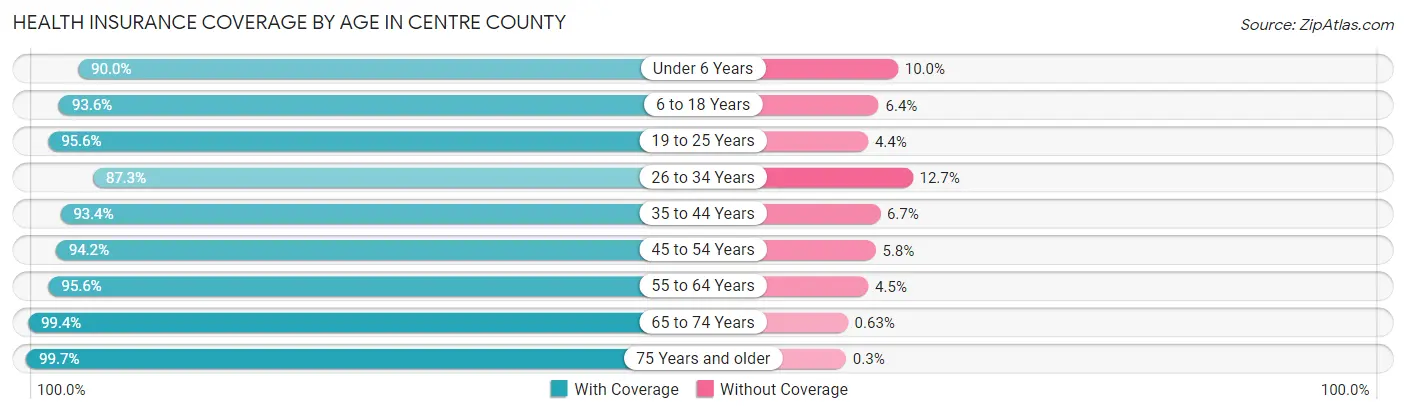
| Age Bracket | With Coverage | Without Coverage |
| Under 6 Years | 6,195 (90.0%) | 687 (10.0%) |
| 6 to 18 Years | 20,746 (93.6%) | 1,418 (6.4%) |
| 19 to 25 Years | 32,799 (95.6%) | 1,513 (4.4%) |
| 26 to 34 Years | 15,176 (87.3%) | 2,212 (12.7%) |
| 35 to 44 Years | 15,306 (93.3%) | 1,090 (6.7%) |
| 45 to 54 Years | 15,065 (94.2%) | 932 (5.8%) |
| 55 to 64 Years | 16,848 (95.6%) | 785 (4.4%) |
| 65 to 74 Years | 13,495 (99.4%) | 85 (0.6%) |
| 75 Years and older | 9,348 (99.7%) | 28 (0.3%) |
| Total | 144,978 (94.3%) | 8,750 (5.7%) |
Health Insurance Coverage by Citizenship Status in Centre County
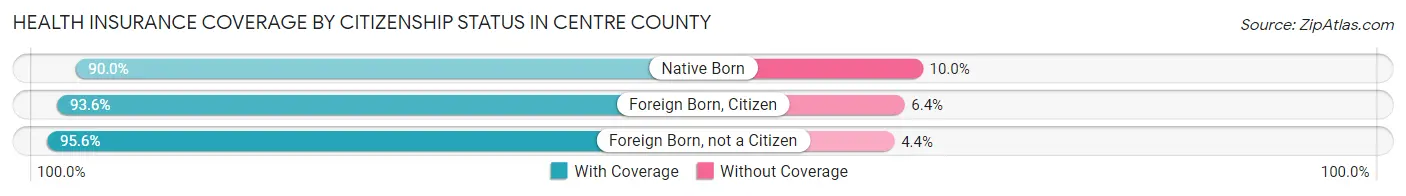
| Citizenship Status | With Coverage | Without Coverage |
| Native Born | 6,195 (90.0%) | 687 (10.0%) |
| Foreign Born, Citizen | 20,746 (93.6%) | 1,418 (6.4%) |
| Foreign Born, not a Citizen | 32,799 (95.6%) | 1,513 (4.4%) |
Health Insurance Coverage by Household Income in Centre County
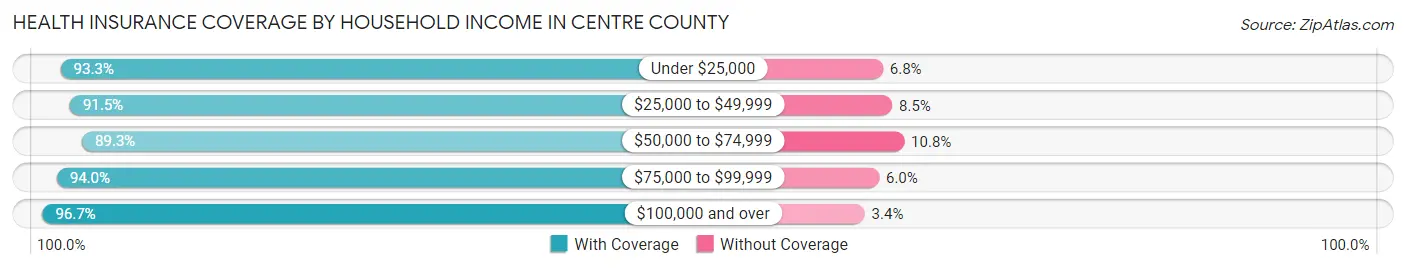
| Household Income | With Coverage | Without Coverage |
| Under $25,000 | 18,654 (93.2%) | 1,351 (6.8%) |
| $25,000 to $49,999 | 19,887 (91.5%) | 1,846 (8.5%) |
| $50,000 to $74,999 | 17,203 (89.2%) | 2,073 (10.7%) |
| $75,000 to $99,999 | 16,082 (94.0%) | 1,034 (6.0%) |
| $100,000 and over | 58,881 (96.7%) | 2,039 (3.4%) |
Public vs Private Health Insurance Coverage by Age in Centre County
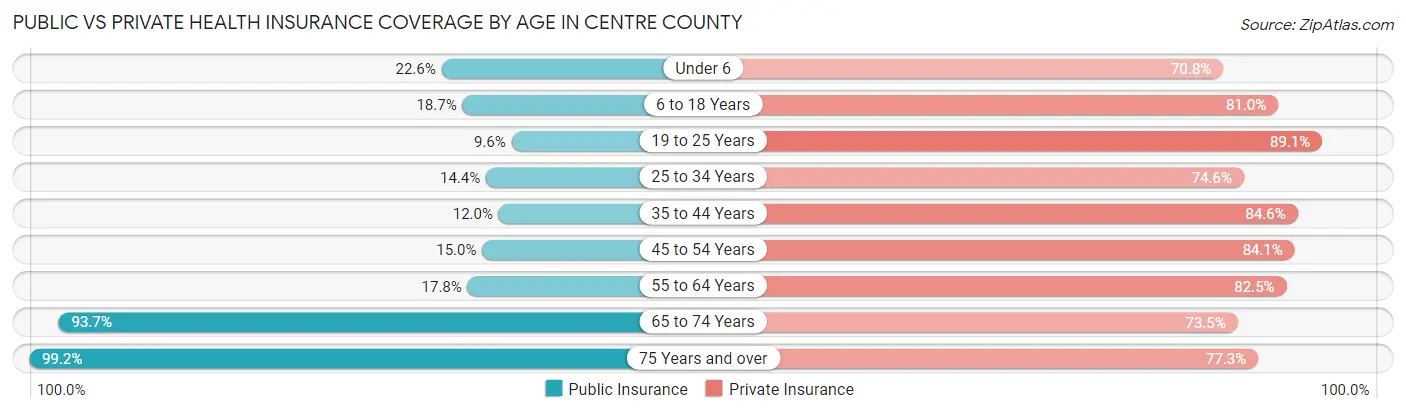
| Age Bracket | Public Insurance | Private Insurance |
| Under 6 | 1,556 (22.6%) | 4,871 (70.8%) |
| 6 to 18 Years | 4,148 (18.7%) | 17,947 (81.0%) |
| 19 to 25 Years | 3,299 (9.6%) | 30,584 (89.1%) |
| 25 to 34 Years | 2,496 (14.3%) | 12,973 (74.6%) |
| 35 to 44 Years | 1,964 (12.0%) | 13,870 (84.6%) |
| 45 to 54 Years | 2,406 (15.0%) | 13,447 (84.1%) |
| 55 to 64 Years | 3,133 (17.8%) | 14,551 (82.5%) |
| 65 to 74 Years | 12,724 (93.7%) | 9,976 (73.5%) |
| 75 Years and over | 9,299 (99.2%) | 7,245 (77.3%) |
| Total | 41,025 (26.7%) | 125,464 (81.6%) |
Disability Status by Sex by Age in Centre County
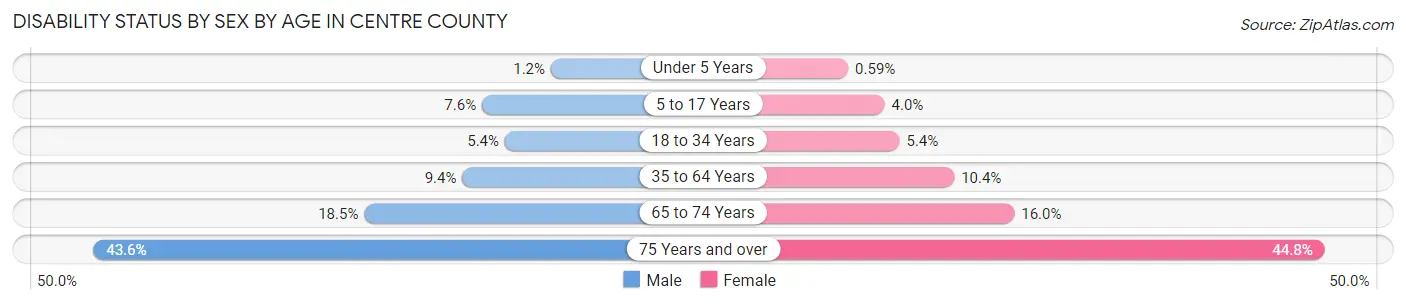
| Age Bracket | Male | Female |
| Under 5 Years | 35 (1.2%) | 16 (0.6%) |
| 5 to 17 Years | 678 (7.5%) | 336 (4.0%) |
| 18 to 34 Years | 1,691 (5.4%) | 1,414 (5.4%) |
| 35 to 64 Years | 2,417 (9.4%) | 2,531 (10.4%) |
| 65 to 74 Years | 1,232 (18.5%) | 1,107 (16.0%) |
| 75 Years and over | 1,747 (43.6%) | 2,407 (44.8%) |
Disability Class by Sex by Age in Centre County
Disability Class: Hearing Difficulty
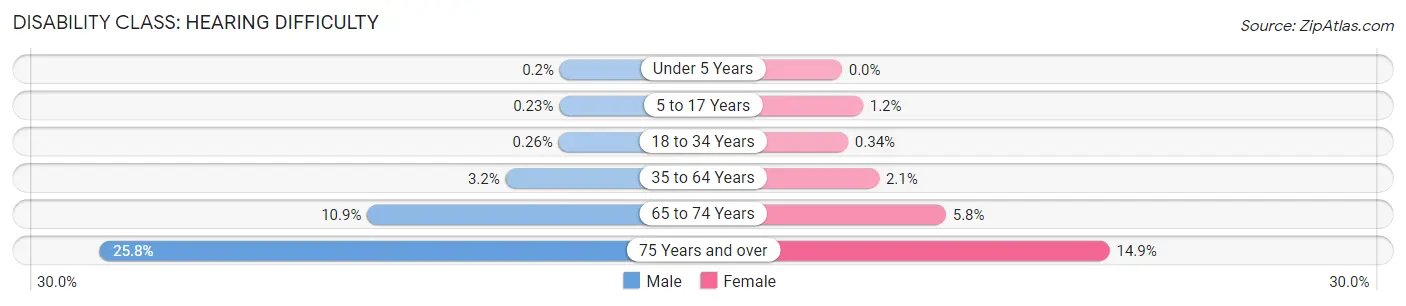
| Age Bracket | Male | Female |
| Under 5 Years | 6 (0.2%) | 0 (0.0%) |
| 5 to 17 Years | 21 (0.2%) | 99 (1.2%) |
| 18 to 34 Years | 81 (0.3%) | 90 (0.3%) |
| 35 to 64 Years | 830 (3.2%) | 502 (2.1%) |
| 65 to 74 Years | 728 (10.9%) | 400 (5.8%) |
| 75 Years and over | 1,033 (25.8%) | 801 (14.9%) |
Disability Class: Vision Difficulty
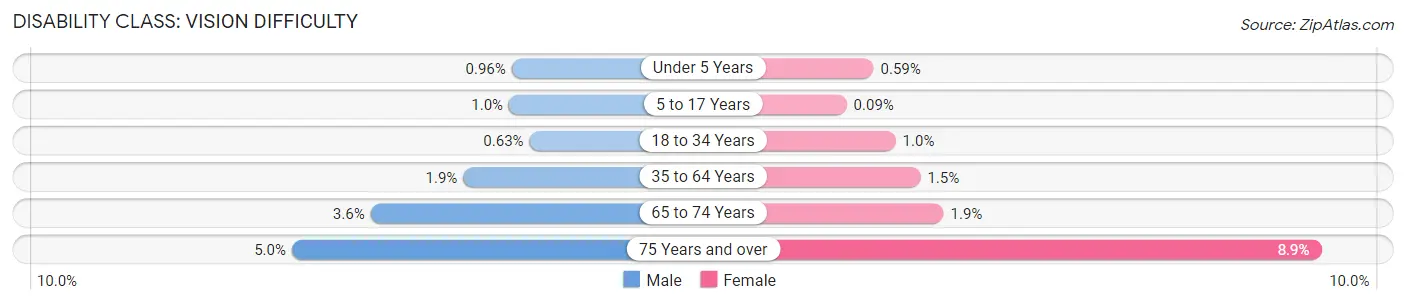
| Age Bracket | Male | Female |
| Under 5 Years | 29 (1.0%) | 16 (0.6%) |
| 5 to 17 Years | 91 (1.0%) | 8 (0.1%) |
| 18 to 34 Years | 195 (0.6%) | 263 (1.0%) |
| 35 to 64 Years | 479 (1.9%) | 355 (1.5%) |
| 65 to 74 Years | 239 (3.6%) | 131 (1.9%) |
| 75 Years and over | 202 (5.0%) | 478 (8.9%) |
Disability Class: Cognitive Difficulty
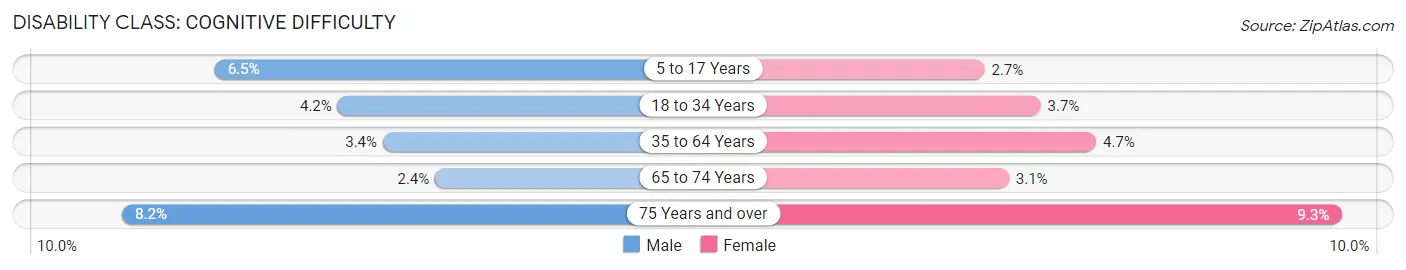
| Age Bracket | Male | Female |
| 5 to 17 Years | 581 (6.5%) | 224 (2.6%) |
| 18 to 34 Years | 1,305 (4.2%) | 975 (3.7%) |
| 35 to 64 Years | 864 (3.4%) | 1,145 (4.7%) |
| 65 to 74 Years | 159 (2.4%) | 214 (3.1%) |
| 75 Years and over | 328 (8.2%) | 498 (9.3%) |
Disability Class: Ambulatory Difficulty
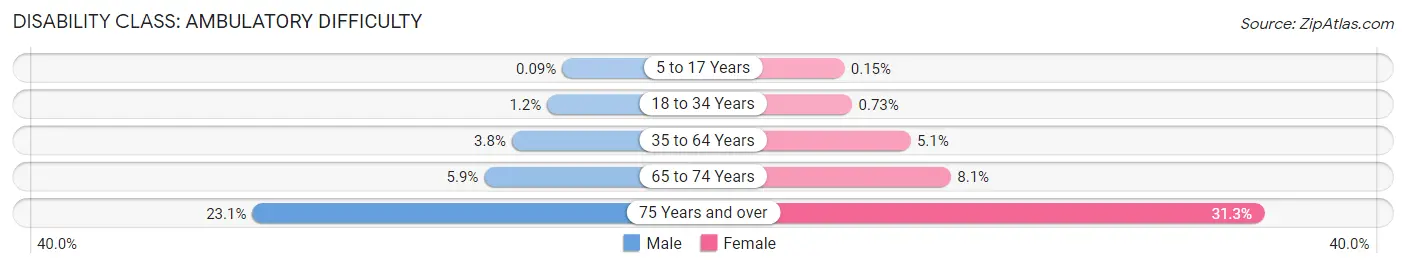
| Age Bracket | Male | Female |
| 5 to 17 Years | 8 (0.1%) | 13 (0.2%) |
| 18 to 34 Years | 378 (1.2%) | 192 (0.7%) |
| 35 to 64 Years | 986 (3.8%) | 1,227 (5.1%) |
| 65 to 74 Years | 392 (5.9%) | 557 (8.1%) |
| 75 Years and over | 925 (23.1%) | 1,683 (31.3%) |
Disability Class: Self-Care Difficulty
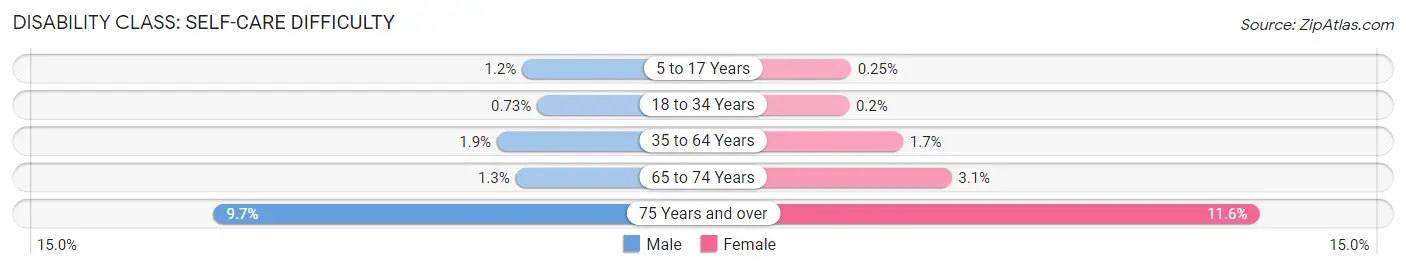
| Age Bracket | Male | Female |
| 5 to 17 Years | 103 (1.1%) | 21 (0.3%) |
| 18 to 34 Years | 227 (0.7%) | 53 (0.2%) |
| 35 to 64 Years | 477 (1.8%) | 413 (1.7%) |
| 65 to 74 Years | 89 (1.3%) | 211 (3.0%) |
| 75 Years and over | 390 (9.7%) | 624 (11.6%) |
Technology Access in Centre County
Computing Device Access in Centre County
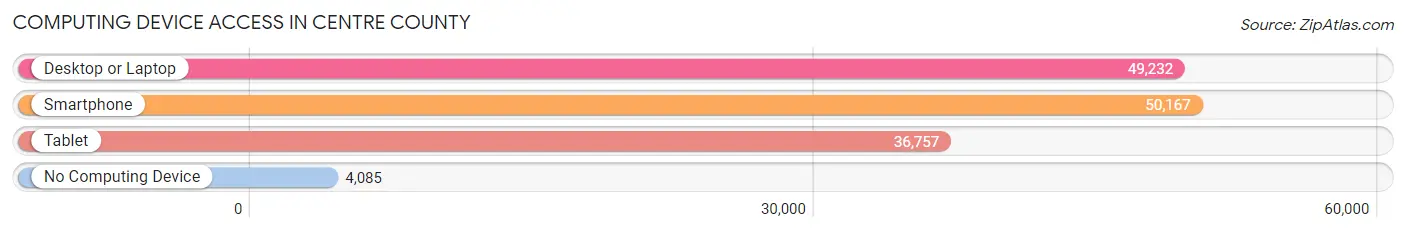
| Device Type | # Households | % Households |
| Desktop or Laptop | 49,232 | 84.5% |
| Smartphone | 50,167 | 86.1% |
| Tablet | 36,757 | 63.1% |
| No Computing Device | 4,085 | 7.0% |
| Total | 58,285 | 100.0% |
Internet Access in Centre County
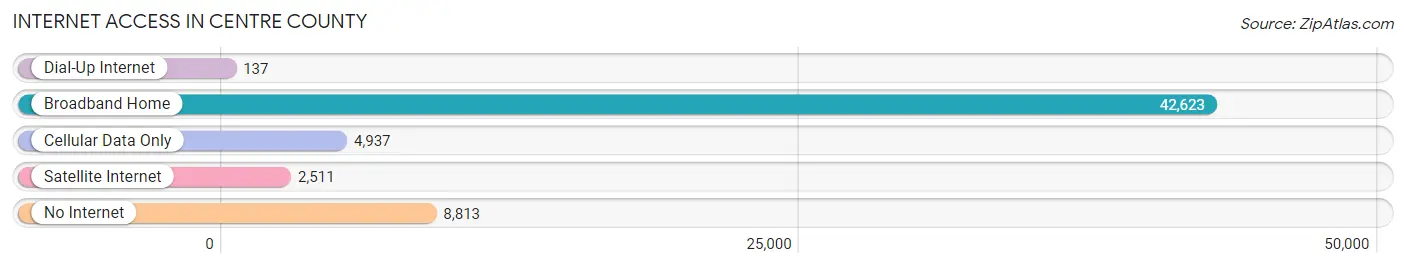
| Internet Type | # Households | % Households |
| Dial-Up Internet | 137 | 0.2% |
| Broadband Home | 42,623 | 73.1% |
| Cellular Data Only | 4,937 | 8.5% |
| Satellite Internet | 2,511 | 4.3% |
| No Internet | 8,813 | 15.1% |
| Total | 58,285 | 100.0% |
Centre County Summary
Centre County, Pennsylvania is located in the heart of the state and is home to a population of 153,990 people as of the 2019 census. The county seat is Bellefonte, and the county is part of the State College, PA Metropolitan Statistical Area. Centre County is bordered by Clinton County to the north, Mifflin County to the west, Huntingdon County to the south, and Union and Snyder Counties to the east.
Geography
Centre County is located in the Ridge and Valley region of the Appalachian Mountains. The county is home to several mountain ranges, including the Bald Eagle Mountains, the Nittany Mountains, and the Tussey Mountains. The highest point in the county is Mount Nittany, which stands at 2,213 feet above sea level. The county is also home to several rivers, including the Susquehanna River, the Juniata River, and the Bald Eagle Creek.
The county is home to several state parks, including Bald Eagle State Park, Black Moshannon State Park, and Rothrock State Forest. The county is also home to several state game lands, including State Game Lands #45, #46, and #47.
Economy
Centre County’s economy is largely based on agriculture, manufacturing, and tourism. The county is home to several large agricultural operations, including dairy farms, beef farms, and poultry farms. The county is also home to several large manufacturing companies, including Penn State Industries, Penn State University, and the Philipsburg-Osceola School District.
Tourism is also an important part of the county’s economy. The county is home to several popular tourist attractions, including Penn State University, the Pennsylvania State Capitol, and the Pennsylvania Military Museum. The county is also home to several popular outdoor recreation areas, including Bald Eagle State Park, Black Moshannon State Park, and Rothrock State Forest.
Demographics
As of the 2019 census, Centre County had a population of 153,990 people. The population is spread out with a median age of 37.7 years. The racial makeup of the county is 90.2% White, 4.2% Black or African American, 0.3% Native American, 2.7% Asian, 0.1% Pacific Islander, and 2.5% from other races. The county is also home to a large Hispanic or Latino population, making up 6.2% of the population.
The median household income in Centre County is $54,945, and the median family income is $68,945. The county’s poverty rate is 11.2%, and the unemployment rate is 4.2%.
Conclusion
Centre County, Pennsylvania is a vibrant and diverse county located in the heart of the state. The county is home to a population of 153,990 people, and the economy is largely based on agriculture, manufacturing, and tourism. The county is also home to several popular tourist attractions, state parks, and outdoor recreation areas. The county is also home to a large Hispanic or Latino population, making up 6.2% of the population. Centre County is a great place to live, work, and visit.
Common Questions
What is Per Capita Income in Centre County?
Per Capita income in Centre County is $37,262.
What is the Median Family Income in Centre County?
Median Family Income in Centre County is $104,862.
What is the Median Household income in Centre County?
Median Household Income in Centre County is $70,087.
What is Income or Wage Gap in Centre County?
Income or Wage Gap in Centre County is 18.9%.
Women in Centre County earn 81.1 cents for every dollar earned by a man.
What is Family Income Deficit in Centre County?
Family Income Deficit in Centre County is $11,185.
Families that are below poverty line in Centre County earn $11,185 less on average than the poverty threshold level.
What is Inequality or Gini Index in Centre County?
Inequality or Gini Index in Centre County is 0.48.
What is the Total Population of Centre County?
Total Population of Centre County is 158,665.
What is the Total Male Population of Centre County?
Total Male Population of Centre County is 83,943.
What is the Total Female Population of Centre County?
Total Female Population of Centre County is 74,722.
What is the Ratio of Males per 100 Females in Centre County?
There are 112.34 Males per 100 Females in Centre County.
What is the Ratio of Females per 100 Males in Centre County?
There are 89.02 Females per 100 Males in Centre County.
What is the Median Population Age in Centre County?
Median Population Age in Centre County is 33.3 Years.
What is the Average Family Size in Centre County
Average Family Size in Centre County is 2.9 People.
What is the Average Household Size in Centre County
Average Household Size in Centre County is 2.4 People.
How Large is the Labor Force in Centre County?
There are 78,007 People in the Labor Forcein in Centre County.
What is the Percentage of People in the Labor Force in Centre County?
56.5% of People are in the Labor Force in Centre County.
What is the Unemployment Rate in Centre County?
Unemployment Rate in Centre County is 4.0%.