Cameron County, PA Map & Demographics
Cameron County Map
Cameron County Overview
$27,426
PER CAPITA INCOME
$57,064
AVG FAMILY INCOME
$46,186
AVG HOUSEHOLD INCOME
28.7%
WAGE / INCOME GAP [ % ]
71.3¢/ $1
WAGE / INCOME GAP [ $ ]
$7,648
FAMILY INCOME DEFICIT
0.41
INEQUALITY / GINI INDEX
4,536
TOTAL POPULATION
2,280
MALE POPULATION
2,256
FEMALE POPULATION
101.06
MALES / 100 FEMALES
98.95
FEMALES / 100 MALES
51.8
MEDIAN AGE
2.5
AVG FAMILY SIZE
2.0
AVG HOUSEHOLD SIZE
1,949
LABOR FORCE [ PEOPLE ]
51.0%
PERCENT IN LABOR FORCE
7.1%
UNEMPLOYMENT RATE
Cameron County Area Codes
Income in Cameron County
Income Overview in Cameron County
Per Capita Income in Cameron County is $27,426, while median incomes of families and households are $57,064 and $46,186 respectively.
| Characteristic | Number | Measure |
| Per Capita Income | 4,536 | $27,426 |
| Median Family Income | 1,299 | $57,064 |
| Mean Family Income | 1,299 | $69,520 |
| Median Household Income | 2,210 | $46,186 |
| Mean Household Income | 2,210 | $57,495 |
| Income Deficit | 1,299 | $7,648 |
| Wage / Income Gap (%) | 4,536 | 28.69% |
| Wage / Income Gap ($) | 4,536 | 71.31¢ per $1 |
| Gini / Inequality Index | 4,536 | 0.41 |
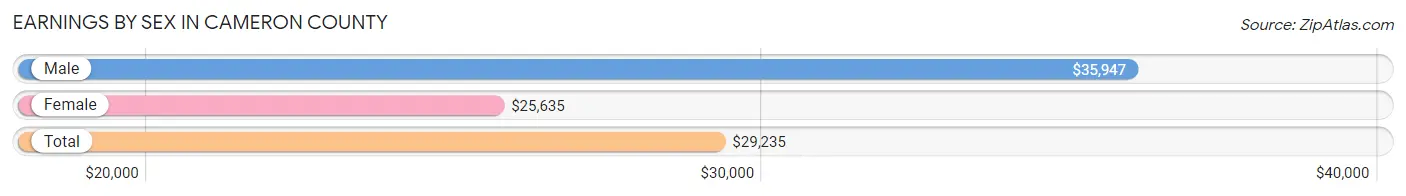
Earnings by Sex in Cameron County
Average Earnings in Cameron County are $29,235, $35,947 for men and $25,635 for women, a difference of 28.7%.
| Sex | Number | Average Earnings |
| Male | 1,098 (54.6%) | $35,947 |
| Female | 911 (45.4%) | $25,635 |
| Total | 2,009 (100.0%) | $29,235 |
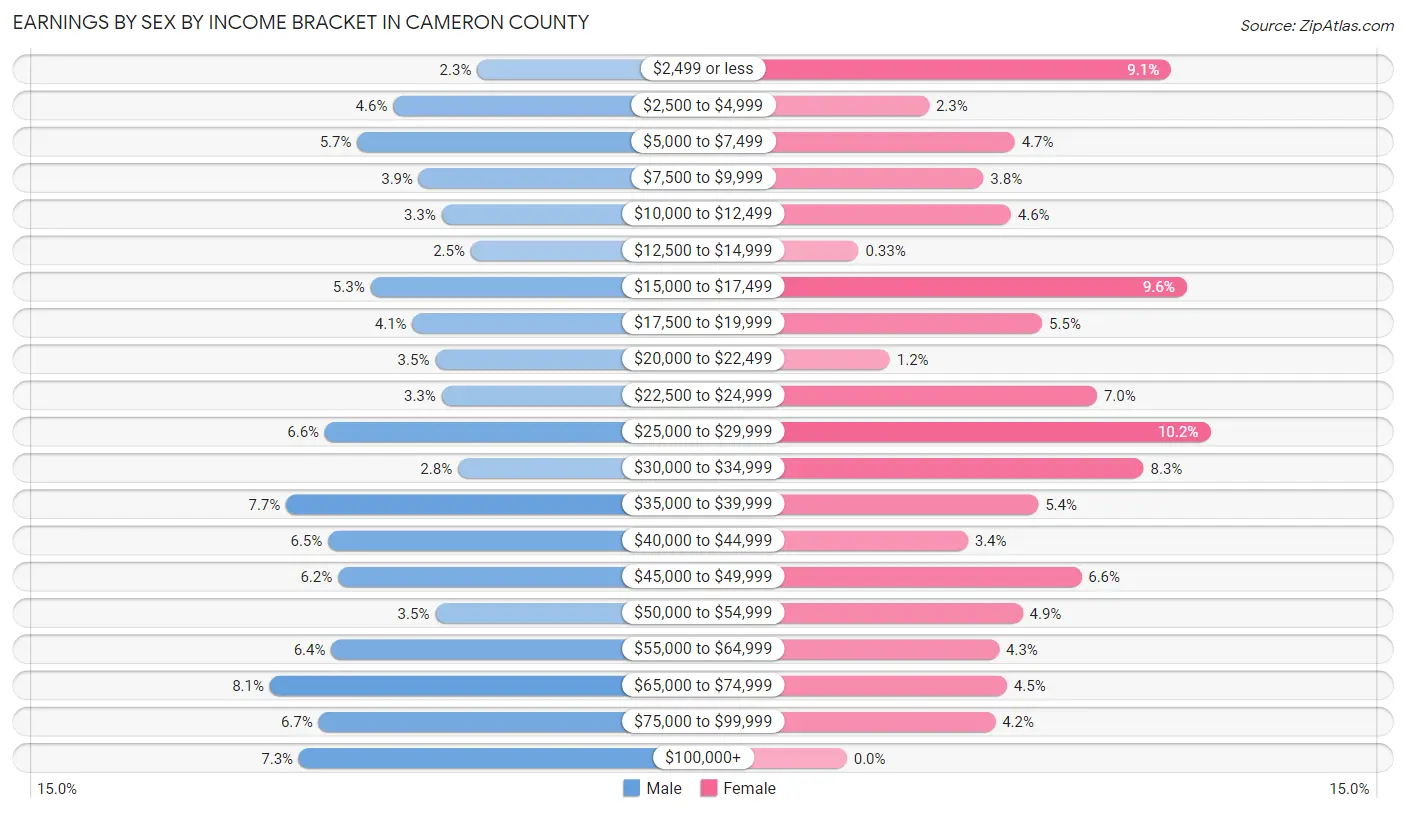
Earnings by Sex by Income Bracket in Cameron County
The most common earnings brackets in Cameron County are $65,000 to $74,999 for men (89 | 8.1%) and $25,000 to $29,999 for women (93 | 10.2%).
| Income | Male | Female |
| $2,499 or less | 25 (2.3%) | 83 (9.1%) |
| $2,500 to $4,999 | 51 (4.6%) | 21 (2.3%) |
| $5,000 to $7,499 | 62 (5.7%) | 43 (4.7%) |
| $7,500 to $9,999 | 43 (3.9%) | 35 (3.8%) |
| $10,000 to $12,499 | 36 (3.3%) | 42 (4.6%) |
| $12,500 to $14,999 | 27 (2.5%) | 3 (0.3%) |
| $15,000 to $17,499 | 58 (5.3%) | 87 (9.6%) |
| $17,500 to $19,999 | 45 (4.1%) | 50 (5.5%) |
| $20,000 to $22,499 | 38 (3.5%) | 11 (1.2%) |
| $22,500 to $24,999 | 36 (3.3%) | 64 (7.0%) |
| $25,000 to $29,999 | 72 (6.6%) | 93 (10.2%) |
| $30,000 to $34,999 | 31 (2.8%) | 76 (8.3%) |
| $35,000 to $39,999 | 84 (7.6%) | 49 (5.4%) |
| $40,000 to $44,999 | 71 (6.5%) | 31 (3.4%) |
| $45,000 to $49,999 | 68 (6.2%) | 60 (6.6%) |
| $50,000 to $54,999 | 38 (3.5%) | 45 (4.9%) |
| $55,000 to $64,999 | 70 (6.4%) | 39 (4.3%) |
| $65,000 to $74,999 | 89 (8.1%) | 41 (4.5%) |
| $75,000 to $99,999 | 74 (6.7%) | 38 (4.2%) |
| $100,000+ | 80 (7.3%) | 0 (0.0%) |
| Total | 1,098 (100.0%) | 911 (100.0%) |
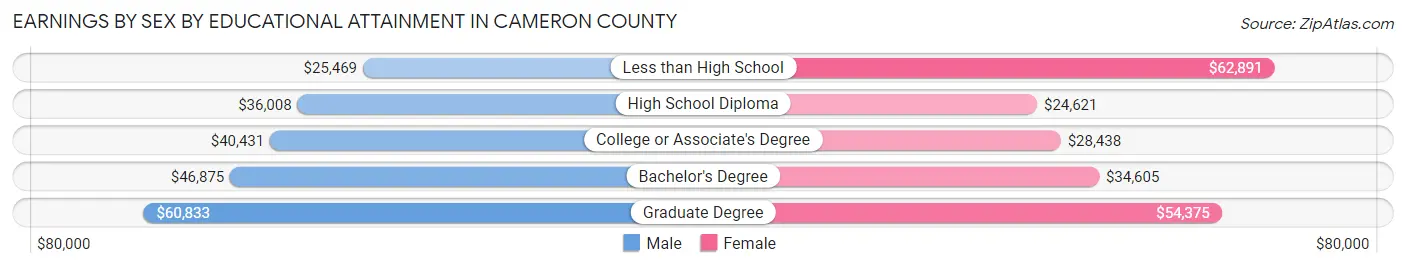
Earnings by Sex by Educational Attainment in Cameron County
Average earnings in Cameron County are $37,121 for men and $27,813 for women, a difference of 25.1%. Men with an educational attainment of graduate degree enjoy the highest average annual earnings of $60,833, while those with less than high school education earn the least with $25,469. Women with an educational attainment of less than high school earn the most with the average annual earnings of $62,891, while those with high school diploma education have the smallest earnings of $24,621.
| Educational Attainment | Male Income | Female Income |
| Less than High School | $25,469 | $62,891 |
| High School Diploma | $36,008 | $24,621 |
| College or Associate's Degree | $40,431 | $28,438 |
| Bachelor's Degree | $46,875 | $34,605 |
| Graduate Degree | $60,833 | $54,375 |
| Total | $37,121 | $27,813 |
Family Income in Cameron County
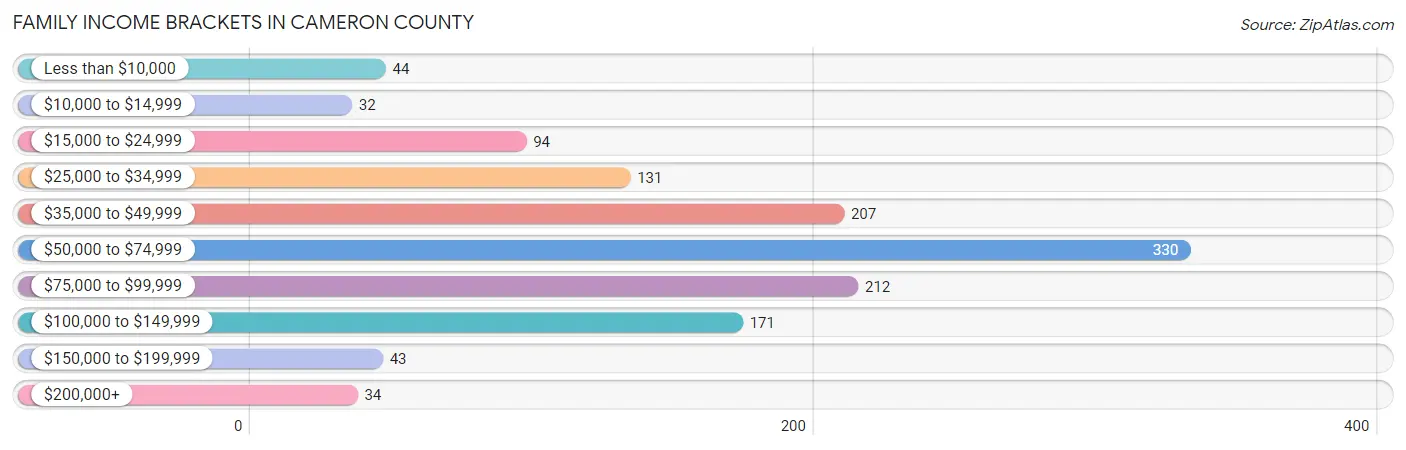
Family Income Brackets in Cameron County
According to the Cameron County family income data, there are 330 families falling into the $50,000 to $74,999 income range, which is the most common income bracket and makes up 25.4% of all families. Conversely, the $10,000 to $14,999 income bracket is the least frequent group with only 32 families (2.5%) belonging to this category.
| Income Bracket | # Families | % Families |
| Less than $10,000 | 44 | 3.4% |
| $10,000 to $14,999 | 32 | 2.5% |
| $15,000 to $24,999 | 94 | 7.2% |
| $25,000 to $34,999 | 131 | 10.1% |
| $35,000 to $49,999 | 207 | 15.9% |
| $50,000 to $74,999 | 330 | 25.4% |
| $75,000 to $99,999 | 212 | 16.3% |
| $100,000 to $149,999 | 171 | 13.2% |
| $150,000 to $199,999 | 43 | 3.3% |
| $200,000+ | 34 | 2.6% |
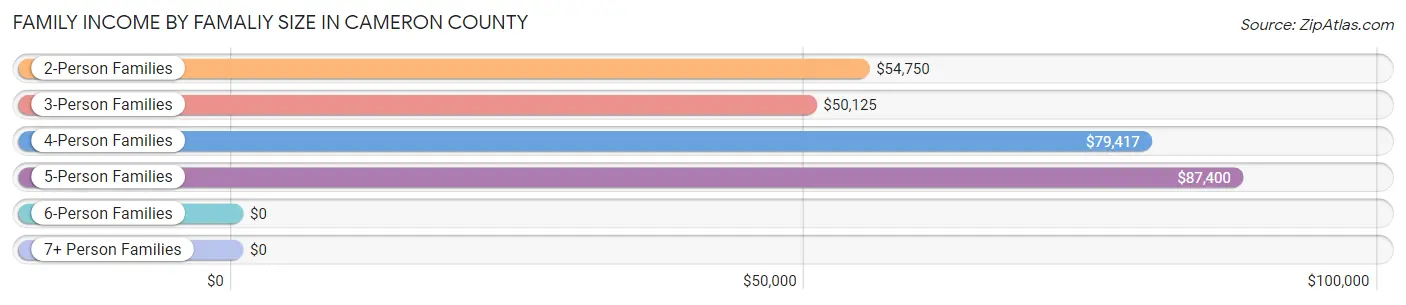
Family Income by Famaliy Size in Cameron County
5-person families (96 | 7.4%) account for the highest median family income in Cameron County with $87,400 per family, while 2-person families (873 | 67.2%) have the highest median income of $27,375 per family member.
| Income Bracket | # Families | Median Income |
| 2-Person Families | 873 (67.2%) | $54,750 |
| 3-Person Families | 225 (17.3%) | $50,125 |
| 4-Person Families | 67 (5.2%) | $79,417 |
| 5-Person Families | 96 (7.4%) | $87,400 |
| 6-Person Families | 16 (1.2%) | $0 |
| 7+ Person Families | 22 (1.7%) | $0 |
| Total | 1,299 (100.0%) | $57,064 |
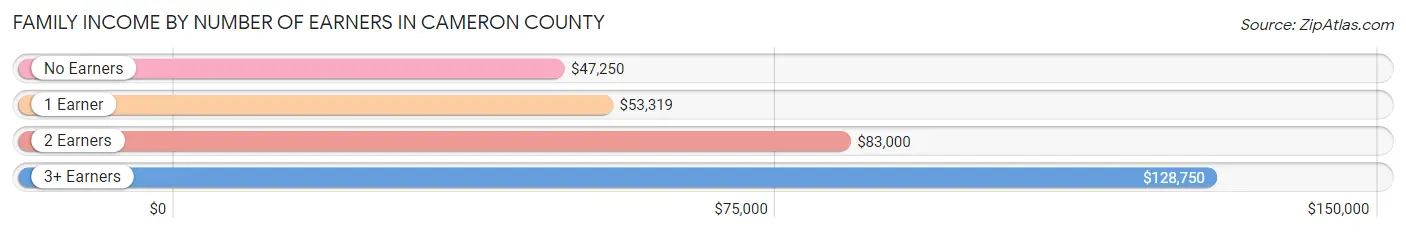
Family Income by Number of Earners in Cameron County
The median family income in Cameron County is $57,064, with families comprising 3+ earners (94) having the highest median family income of $128,750, while families with no earners (384) have the lowest median family income of $47,250, accounting for 7.2% and 29.6% of families, respectively.
| Number of Earners | # Families | Median Income |
| No Earners | 384 (29.6%) | $47,250 |
| 1 Earner | 493 (38.0%) | $53,319 |
| 2 Earners | 328 (25.3%) | $83,000 |
| 3+ Earners | 94 (7.2%) | $128,750 |
| Total | 1,299 (100.0%) | $57,064 |
Household Income in Cameron County
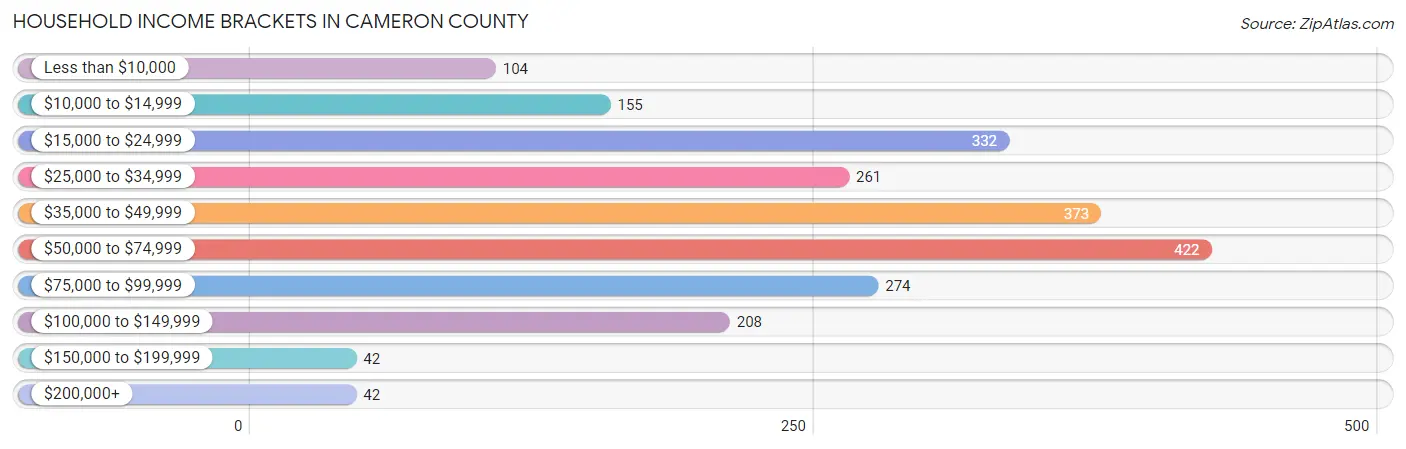
Household Income Brackets in Cameron County
With 422 households falling in the category, the $50,000 to $74,999 income range is the most frequent in Cameron County, accounting for 19.1% of all households. In contrast, only 42 households (1.9%) fall into the $150,000 to $199,999 income bracket, making it the least populous group.
| Income Bracket | # Households | % Households |
| Less than $10,000 | 104 | 4.7% |
| $10,000 to $14,999 | 155 | 7.0% |
| $15,000 to $24,999 | 332 | 15.0% |
| $25,000 to $34,999 | 261 | 11.8% |
| $35,000 to $49,999 | 373 | 16.9% |
| $50,000 to $74,999 | 422 | 19.1% |
| $75,000 to $99,999 | 274 | 12.4% |
| $100,000 to $149,999 | 208 | 9.4% |
| $150,000 to $199,999 | 42 | 1.9% |
| $200,000+ | 42 | 1.9% |
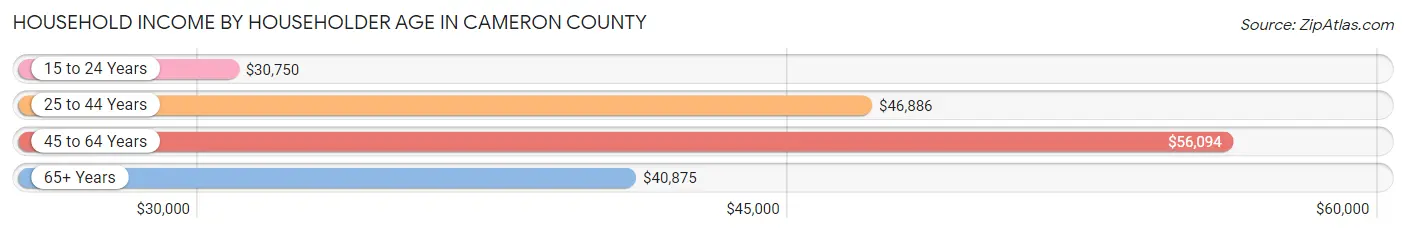
Household Income by Householder Age in Cameron County
The median household income in Cameron County is $46,186, with the highest median household income of $56,094 found in the 45 to 64 years age bracket for the primary householder. A total of 891 households (40.3%) fall into this category. Meanwhile, the 15 to 24 years age bracket for the primary householder has the lowest median household income of $30,750, with 74 households (3.4%) in this group.
| Income Bracket | # Households | Median Income |
| 15 to 24 Years | 74 (3.4%) | $30,750 |
| 25 to 44 Years | 434 (19.6%) | $46,886 |
| 45 to 64 Years | 891 (40.3%) | $56,094 |
| 65+ Years | 811 (36.7%) | $40,875 |
| Total | 2,210 (100.0%) | $46,186 |
Poverty in Cameron County
Income Below Poverty by Sex and Age in Cameron County
With 13.9% poverty level for males and 16.0% for females among the residents of Cameron County, under 5 year old males and 6 to 11 year old females are the most vulnerable to poverty, with 46 males (42.6%) and 51 females (54.8%) in their respective age groups living below the poverty level.
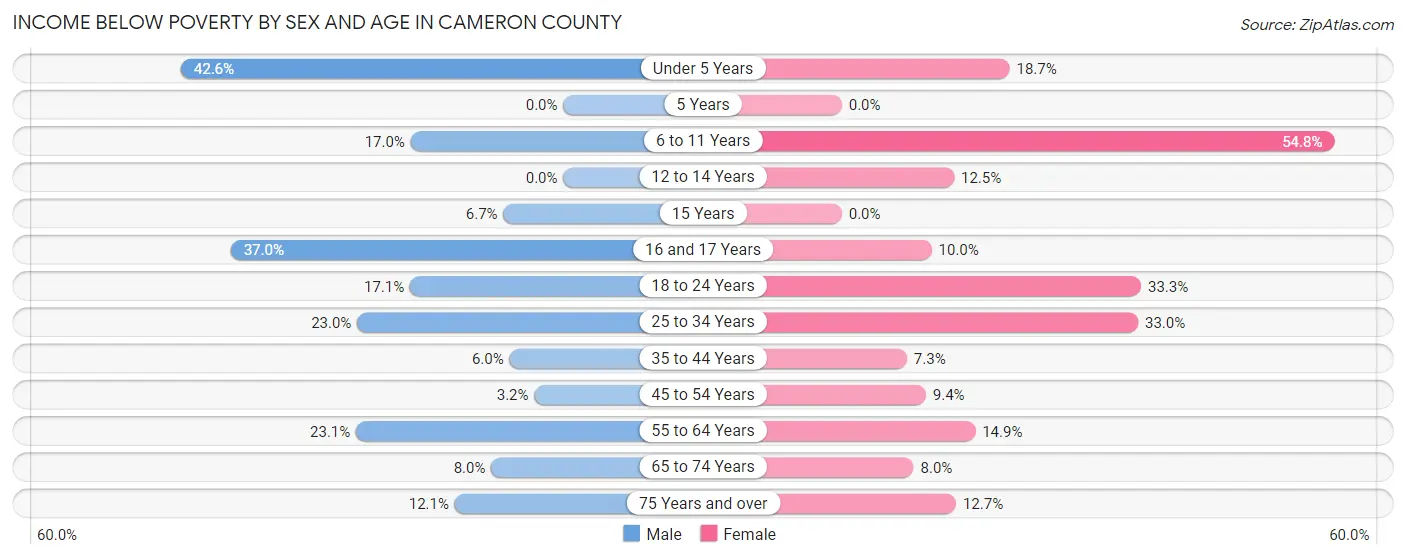
| Age Bracket | Male | Female |
| Under 5 Years | 46 (42.6%) | 17 (18.7%) |
| 5 Years | 0 (0.0%) | 0 (0.0%) |
| 6 to 11 Years | 17 (17.0%) | 51 (54.8%) |
| 12 to 14 Years | 0 (0.0%) | 9 (12.5%) |
| 15 Years | 1 (6.7%) | 0 (0.0%) |
| 16 and 17 Years | 10 (37.0%) | 4 (10.0%) |
| 18 to 24 Years | 21 (17.1%) | 50 (33.3%) |
| 25 to 34 Years | 45 (23.0%) | 65 (33.0%) |
| 35 to 44 Years | 16 (6.0%) | 14 (7.2%) |
| 45 to 54 Years | 9 (3.2%) | 25 (9.4%) |
| 55 to 64 Years | 93 (23.1%) | 59 (14.9%) |
| 65 to 74 Years | 32 (8.0%) | 28 (8.0%) |
| 75 Years and over | 26 (12.1%) | 36 (12.7%) |
| Total | 316 (13.9%) | 358 (16.0%) |
Income Above Poverty by Sex and Age in Cameron County
According to the poverty statistics in Cameron County, males aged 5 years and females aged 5 years are the age groups that are most secure financially, with 100.0% of males and 100.0% of females in these age groups living above the poverty line.
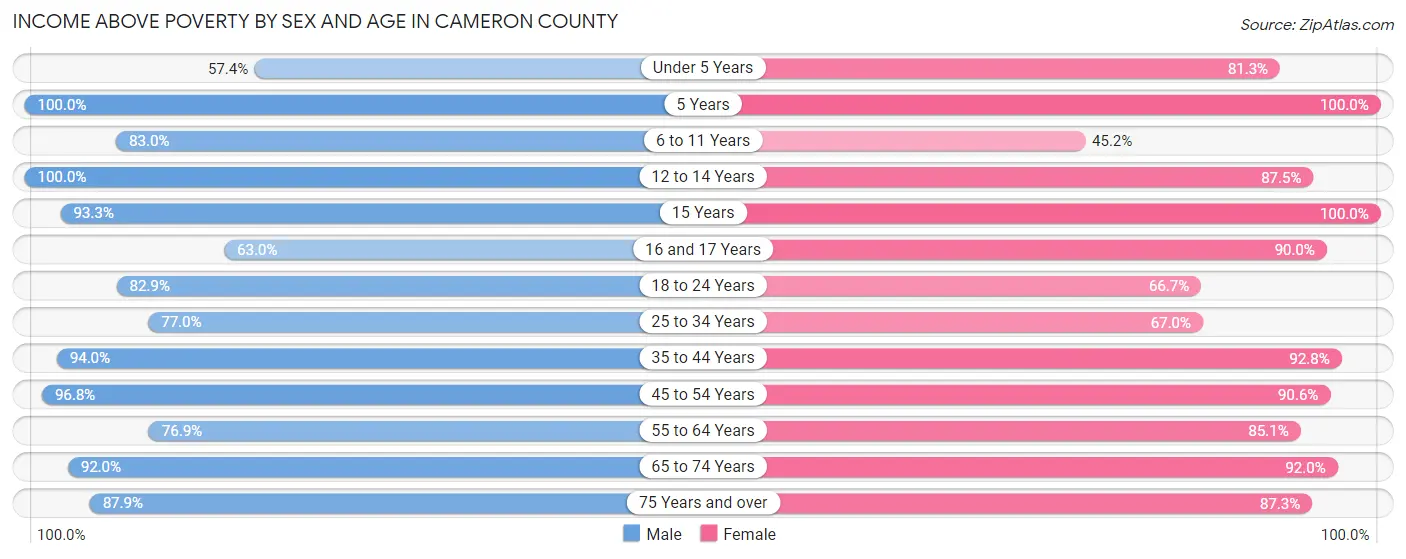
| Age Bracket | Male | Female |
| Under 5 Years | 62 (57.4%) | 74 (81.3%) |
| 5 Years | 43 (100.0%) | 59 (100.0%) |
| 6 to 11 Years | 83 (83.0%) | 42 (45.2%) |
| 12 to 14 Years | 92 (100.0%) | 63 (87.5%) |
| 15 Years | 14 (93.3%) | 42 (100.0%) |
| 16 and 17 Years | 17 (63.0%) | 36 (90.0%) |
| 18 to 24 Years | 102 (82.9%) | 100 (66.7%) |
| 25 to 34 Years | 151 (77.0%) | 132 (67.0%) |
| 35 to 44 Years | 251 (94.0%) | 179 (92.7%) |
| 45 to 54 Years | 270 (96.8%) | 242 (90.6%) |
| 55 to 64 Years | 310 (76.9%) | 338 (85.1%) |
| 65 to 74 Years | 367 (92.0%) | 322 (92.0%) |
| 75 Years and over | 189 (87.9%) | 247 (87.3%) |
| Total | 1,951 (86.1%) | 1,876 (84.0%) |
Income Below Poverty Among Married-Couple Families in Cameron County
The poverty statistics for married-couple families in Cameron County show that 4.4% or 40 of the total 906 families live below the poverty line. Families with 1 or 2 children have the highest poverty rate of 11.5%, comprising of 15 families. On the other hand, families with 3 or 4 children have the lowest poverty rate of 0.0%, which includes 0 families.
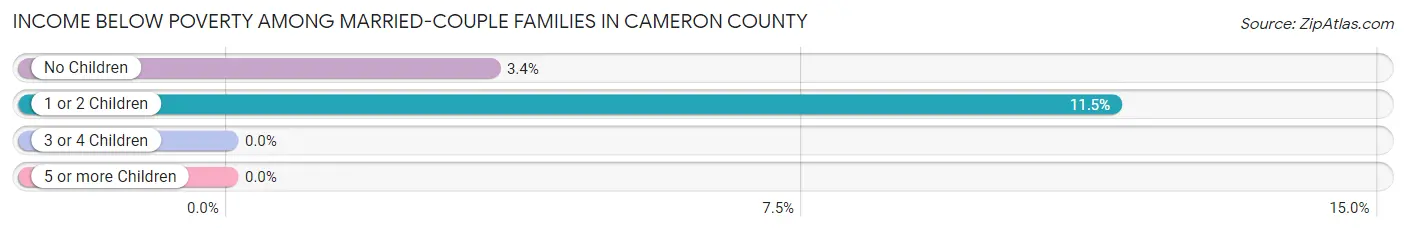
| Children | Above Poverty | Below Poverty |
| No Children | 705 (96.6%) | 25 (3.4%) |
| 1 or 2 Children | 115 (88.5%) | 15 (11.5%) |
| 3 or 4 Children | 46 (100.0%) | 0 (0.0%) |
| 5 or more Children | 0 (0.0%) | 0 (0.0%) |
| Total | 866 (95.6%) | 40 (4.4%) |
Income Below Poverty Among Single-Parent Households in Cameron County
According to the poverty data in Cameron County, 9.4% or 14 single-father households and 33.6% or 82 single-mother households are living below the poverty line. Among single-father households, those with 3 or 4 children have the highest poverty rate, with 7 households (100.0%) experiencing poverty. Likewise, among single-mother households, those with 1 or 2 children have the highest poverty rate, with 81 households (44.0%) falling below the poverty line.
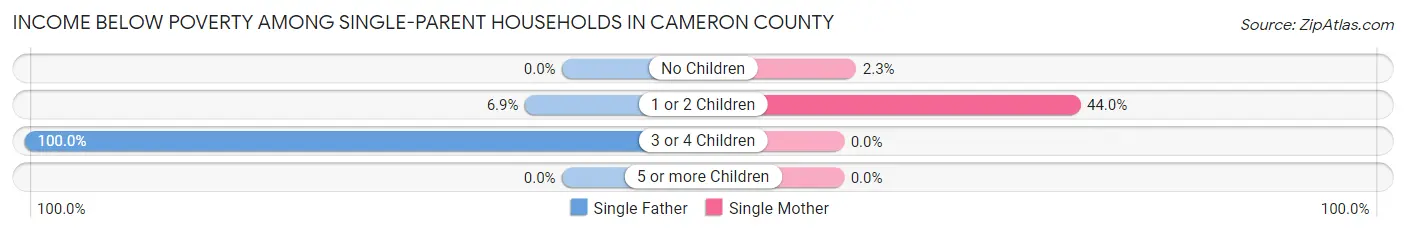
| Children | Single Father | Single Mother |
| No Children | 0 (0.0%) | 1 (2.3%) |
| 1 or 2 Children | 7 (6.9%) | 81 (44.0%) |
| 3 or 4 Children | 7 (100.0%) | 0 (0.0%) |
| 5 or more Children | 0 (0.0%) | 0 (0.0%) |
| Total | 14 (9.4%) | 82 (33.6%) |
Income Below Poverty Among Married-Couple vs Single-Parent Households in Cameron County
The poverty data for Cameron County shows that 40 of the married-couple family households (4.4%) and 96 of the single-parent households (24.4%) are living below the poverty level. Within the married-couple family households, those with 1 or 2 children have the highest poverty rate, with 15 households (11.5%) falling below the poverty line. Among the single-parent households, those with 1 or 2 children have the highest poverty rate, with 88 household (30.9%) living below poverty.
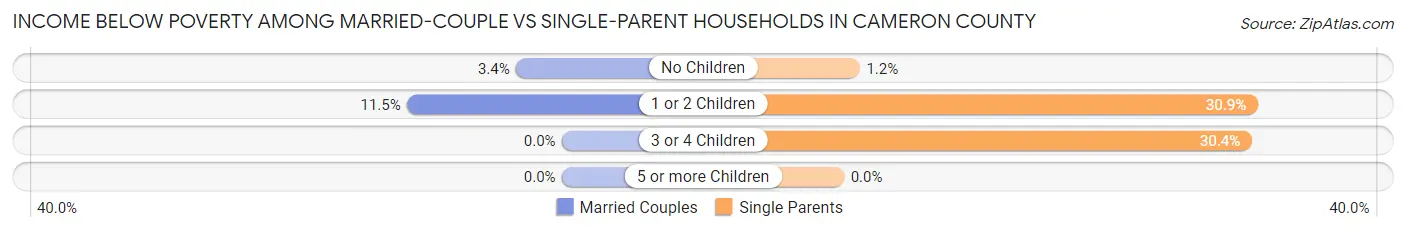
| Children | Married-Couple Families | Single-Parent Households |
| No Children | 25 (3.4%) | 1 (1.2%) |
| 1 or 2 Children | 15 (11.5%) | 88 (30.9%) |
| 3 or 4 Children | 0 (0.0%) | 7 (30.4%) |
| 5 or more Children | 0 (0.0%) | 0 (0.0%) |
| Total | 40 (4.4%) | 96 (24.4%) |
Race in Cameron County
The most populous races in Cameron County are White / Caucasian (4,311 | 95.0%), Two or more Races (197 | 4.3%), and Hispanic or Latino (91 | 2.0%).
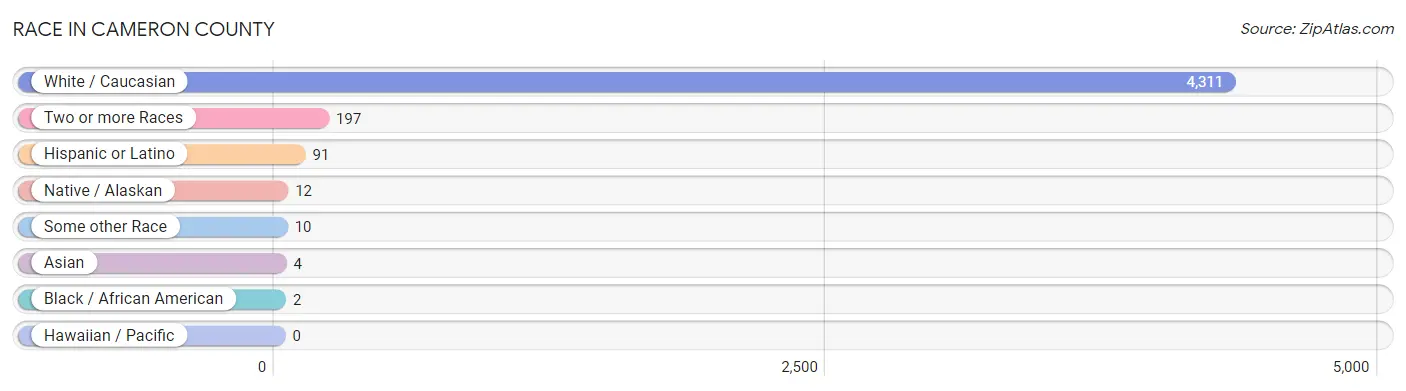
| Race | # Population | % Population |
| Asian | 4 | 0.1% |
| Black / African American | 2 | 0.0% |
| Hawaiian / Pacific | 0 | 0.0% |
| Hispanic or Latino | 91 | 2.0% |
| Native / Alaskan | 12 | 0.3% |
| White / Caucasian | 4,311 | 95.0% |
| Two or more Races | 197 | 4.3% |
| Some other Race | 10 | 0.2% |
| Total | 4,536 | 100.0% |
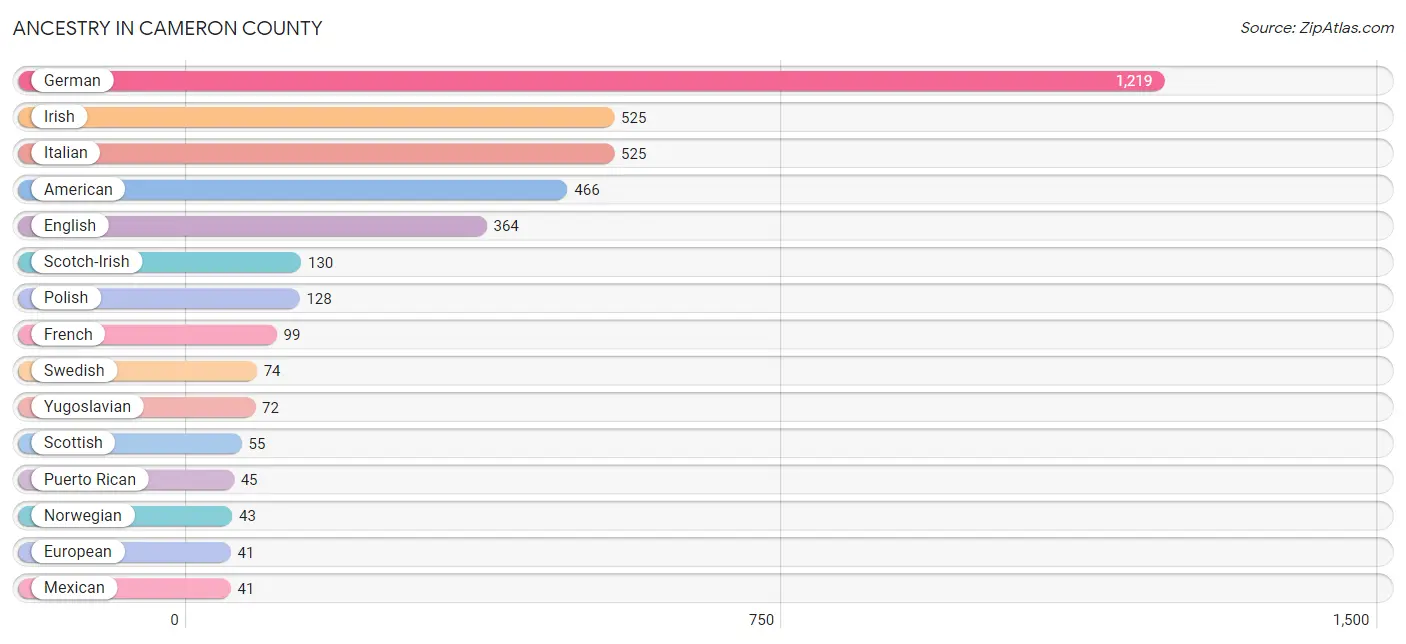
Ancestry in Cameron County
The most populous ancestries reported in Cameron County are German (1,219 | 26.9%), Irish (525 | 11.6%), Italian (525 | 11.6%), American (466 | 10.3%), and English (364 | 8.0%), together accounting for 68.3% of all Cameron County residents.
| Ancestry | # Population | % Population |
| American | 466 | 10.3% |
| Austrian | 25 | 0.5% |
| British | 35 | 0.8% |
| Canadian | 1 | 0.0% |
| Croatian | 1 | 0.0% |
| Czech | 5 | 0.1% |
| Czechoslovakian | 16 | 0.4% |
| Dutch | 23 | 0.5% |
| English | 364 | 8.0% |
| European | 41 | 0.9% |
| French | 99 | 2.2% |
| French American Indian | 1 | 0.0% |
| French Canadian | 30 | 0.7% |
| German | 1,219 | 26.9% |
| Greek | 19 | 0.4% |
| Hungarian | 12 | 0.3% |
| Irish | 525 | 11.6% |
| Italian | 525 | 11.6% |
| Korean | 4 | 0.1% |
| Lithuanian | 4 | 0.1% |
| Mexican | 41 | 0.9% |
| Northern European | 6 | 0.1% |
| Norwegian | 43 | 0.9% |
| Pennsylvania German | 39 | 0.9% |
| Polish | 128 | 2.8% |
| Puerto Rican | 45 | 1.0% |
| Romanian | 1 | 0.0% |
| Russian | 6 | 0.1% |
| Scandinavian | 17 | 0.4% |
| Scotch-Irish | 130 | 2.9% |
| Scottish | 55 | 1.2% |
| Slavic | 15 | 0.3% |
| Slovak | 15 | 0.3% |
| Spaniard | 5 | 0.1% |
| Swedish | 74 | 1.6% |
| Swiss | 32 | 0.7% |
| Ukrainian | 5 | 0.1% |
| Welsh | 23 | 0.5% |
| Yugoslavian | 72 | 1.6% | View All 39 Rows |
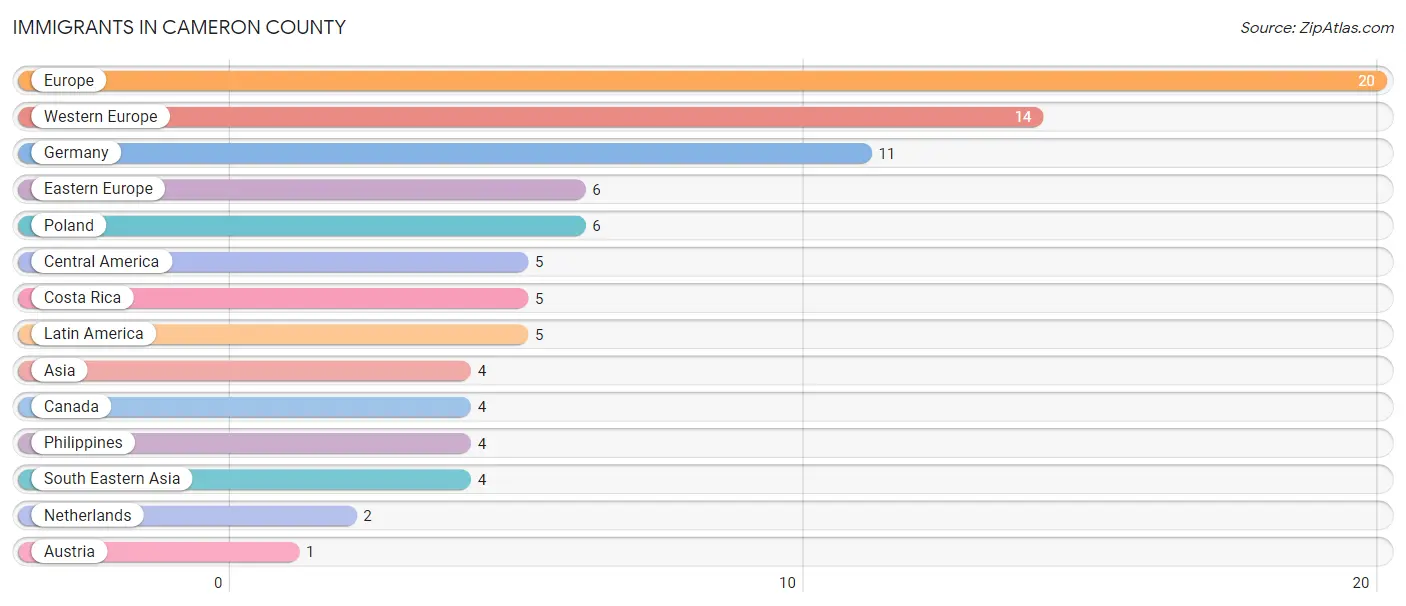
Immigrants in Cameron County
The most numerous immigrant groups reported in Cameron County came from Europe (20 | 0.4%), Western Europe (14 | 0.3%), Germany (11 | 0.2%), Eastern Europe (6 | 0.1%), and Poland (6 | 0.1%), together accounting for 1.2% of all Cameron County residents.
| Immigration Origin | # Population | % Population |
| Asia | 4 | 0.1% |
| Austria | 1 | 0.0% |
| Canada | 4 | 0.1% |
| Central America | 5 | 0.1% |
| Costa Rica | 5 | 0.1% |
| Eastern Europe | 6 | 0.1% |
| Europe | 20 | 0.4% |
| Germany | 11 | 0.2% |
| Latin America | 5 | 0.1% |
| Netherlands | 2 | 0.0% |
| Philippines | 4 | 0.1% |
| Poland | 6 | 0.1% |
| South Eastern Asia | 4 | 0.1% |
| Western Europe | 14 | 0.3% | View All 14 Rows |
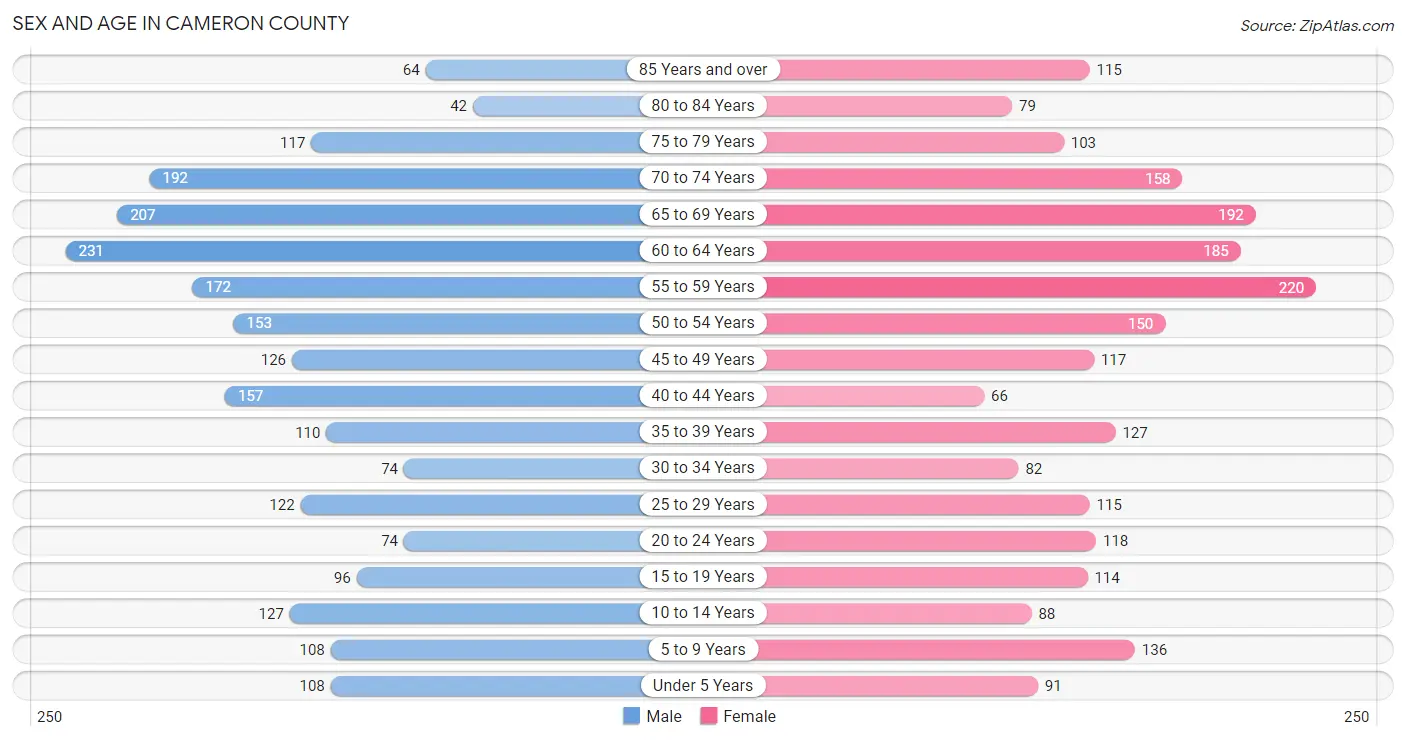
Sex and Age in Cameron County
Sex and Age in Cameron County
The most populous age groups in Cameron County are 60 to 64 Years (231 | 10.1%) for men and 55 to 59 Years (220 | 9.8%) for women.
| Age Bracket | Male | Female |
| Under 5 Years | 108 (4.7%) | 91 (4.0%) |
| 5 to 9 Years | 108 (4.7%) | 136 (6.0%) |
| 10 to 14 Years | 127 (5.6%) | 88 (3.9%) |
| 15 to 19 Years | 96 (4.2%) | 114 (5.1%) |
| 20 to 24 Years | 74 (3.3%) | 118 (5.2%) |
| 25 to 29 Years | 122 (5.3%) | 115 (5.1%) |
| 30 to 34 Years | 74 (3.3%) | 82 (3.6%) |
| 35 to 39 Years | 110 (4.8%) | 127 (5.6%) |
| 40 to 44 Years | 157 (6.9%) | 66 (2.9%) |
| 45 to 49 Years | 126 (5.5%) | 117 (5.2%) |
| 50 to 54 Years | 153 (6.7%) | 150 (6.7%) |
| 55 to 59 Years | 172 (7.5%) | 220 (9.8%) |
| 60 to 64 Years | 231 (10.1%) | 185 (8.2%) |
| 65 to 69 Years | 207 (9.1%) | 192 (8.5%) |
| 70 to 74 Years | 192 (8.4%) | 158 (7.0%) |
| 75 to 79 Years | 117 (5.1%) | 103 (4.6%) |
| 80 to 84 Years | 42 (1.8%) | 79 (3.5%) |
| 85 Years and over | 64 (2.8%) | 115 (5.1%) |
| Total | 2,280 (100.0%) | 2,256 (100.0%) |
Families and Households in Cameron County
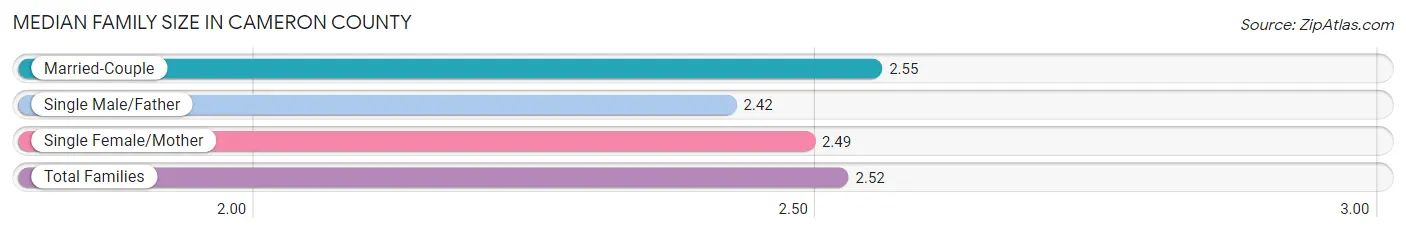
Median Family Size in Cameron County
The median family size in Cameron County is 2.52 persons per family, with married-couple families (906 | 69.8%) accounting for the largest median family size of 2.55 persons per family. On the other hand, single male/father families (149 | 11.5%) represent the smallest median family size with 2.42 persons per family.
| Family Type | # Families | Family Size |
| Married-Couple | 906 (69.8%) | 2.55 |
| Single Male/Father | 149 (11.5%) | 2.42 |
| Single Female/Mother | 244 (18.8%) | 2.49 |
| Total Families | 1,299 (100.0%) | 2.52 |
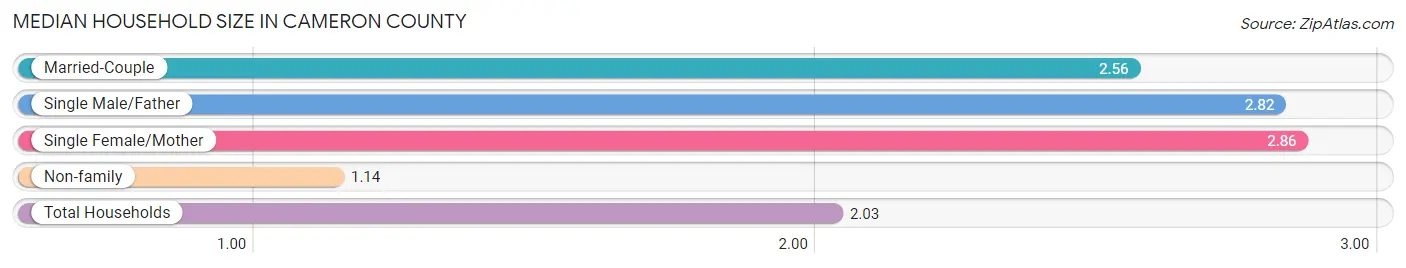
Median Household Size in Cameron County
The median household size in Cameron County is 2.03 persons per household, with single female/mother households (244 | 11.0%) accounting for the largest median household size of 2.86 persons per household. non-family households (911 | 41.2%) represent the smallest median household size with 1.14 persons per household.
| Household Type | # Households | Household Size |
| Married-Couple | 906 (41.0%) | 2.56 |
| Single Male/Father | 149 (6.7%) | 2.82 |
| Single Female/Mother | 244 (11.0%) | 2.86 |
| Non-family | 911 (41.2%) | 1.14 |
| Total Households | 2,210 (100.0%) | 2.03 |
Household Size by Marriage Status in Cameron County
Out of a total of 2,210 households in Cameron County, 1,299 (58.8%) are family households, while 911 (41.2%) are nonfamily households. The most numerous type of family households are 2-person households, comprising 795, and the most common type of nonfamily households are 1-person households, comprising 785.
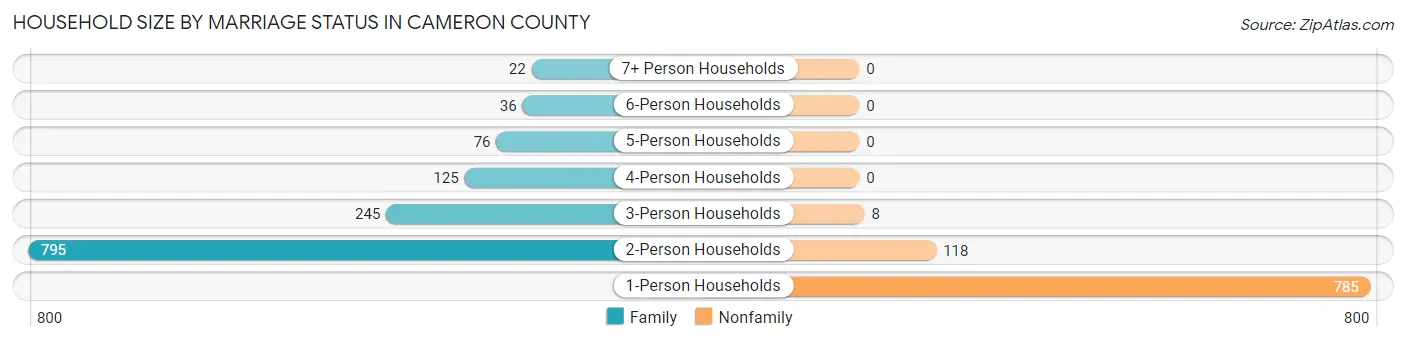
| Household Size | Family Households | Nonfamily Households |
| 1-Person Households | - | 785 (35.5%) |
| 2-Person Households | 795 (36.0%) | 118 (5.3%) |
| 3-Person Households | 245 (11.1%) | 8 (0.4%) |
| 4-Person Households | 125 (5.7%) | 0 (0.0%) |
| 5-Person Households | 76 (3.4%) | 0 (0.0%) |
| 6-Person Households | 36 (1.6%) | 0 (0.0%) |
| 7+ Person Households | 22 (1.0%) | 0 (0.0%) |
| Total | 1,299 (58.8%) | 911 (41.2%) |
Female Fertility in Cameron County
Fertility by Age in Cameron County
Average fertility rate in Cameron County is 38.0 births per 1,000 women. Women in the age bracket of 20 to 34 years have the highest fertility rate with 89.0 births per 1,000 women. Women in the age bracket of 20 to 34 years acount for 96.6% of all women with births.
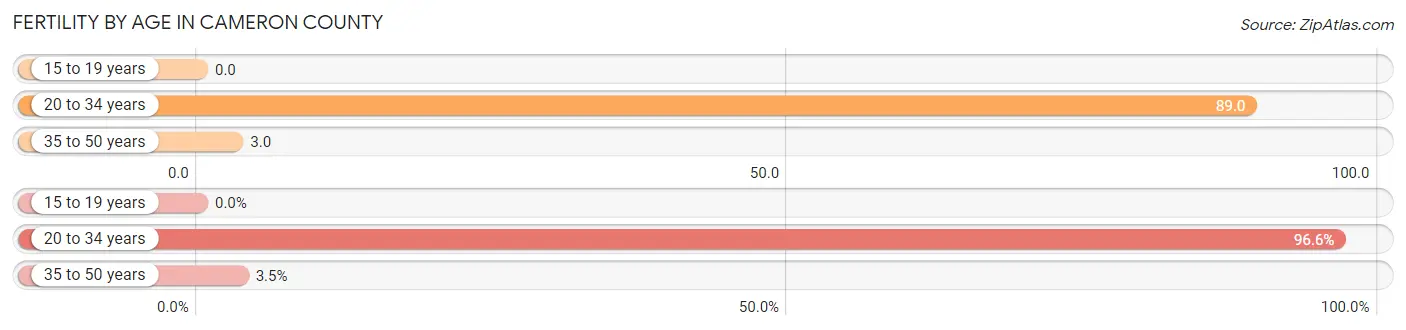
| Age Bracket | Women with Births | Births / 1,000 Women |
| 15 to 19 years | 0 (0.0%) | 0.0 |
| 20 to 34 years | 28 (96.6%) | 89.0 |
| 35 to 50 years | 1 (3.5%) | 3.0 |
| Total | 29 (100.0%) | 38.0 |
Fertility by Age by Marriage Status in Cameron County
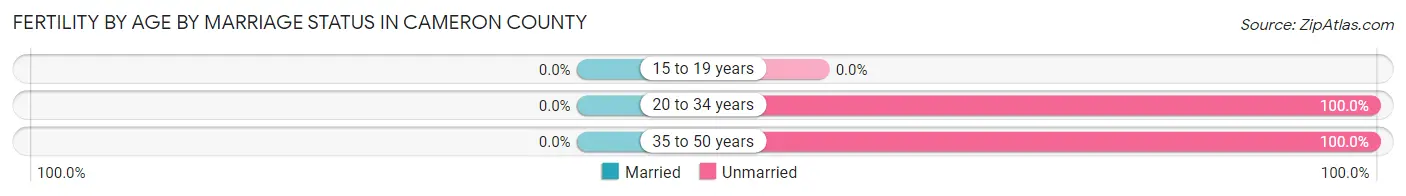
| Age Bracket | Married | Unmarried |
| 15 to 19 years | 0 (0.0%) | 0 (0.0%) |
| 20 to 34 years | 0 (0.0%) | 28 (100.0%) |
| 35 to 50 years | 0 (0.0%) | 1 (100.0%) |
| Total | 0 (0.0%) | 29 (100.0%) |
Fertility by Education in Cameron County
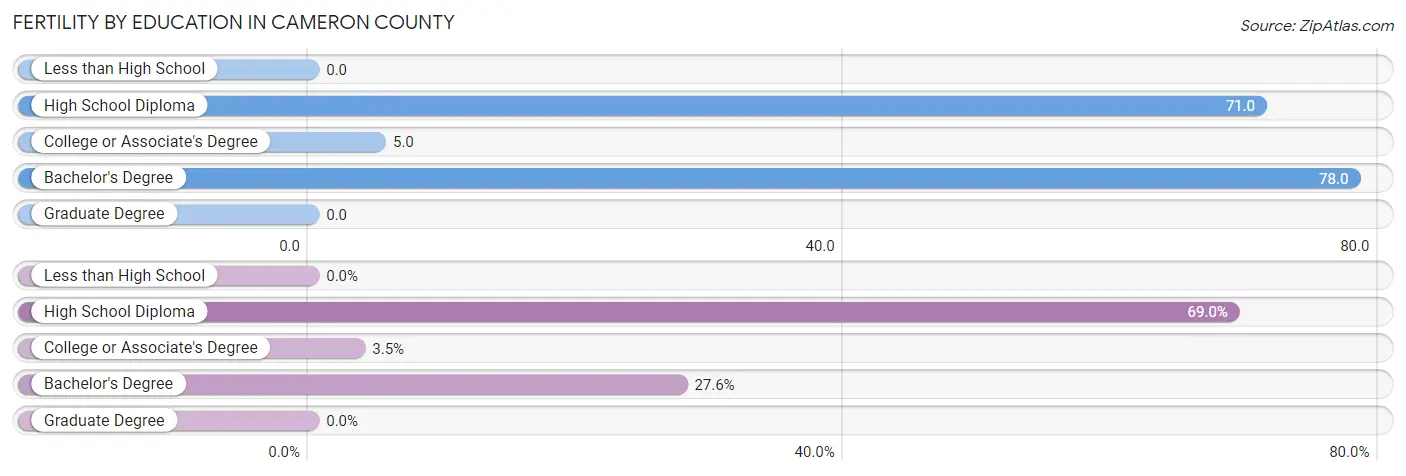
| Educational Attainment | Women with Births | Births / 1,000 Women |
| Less than High School | 0 (0.0%) | 0.0 |
| High School Diploma | 20 (69.0%) | 71.0 |
| College or Associate's Degree | 1 (3.5%) | 5.0 |
| Bachelor's Degree | 8 (27.6%) | 78.0 |
| Graduate Degree | 0 (0.0%) | 0.0 |
| Total | 29 (100.0%) | 38.0 |
Fertility by Education by Marriage Status in Cameron County
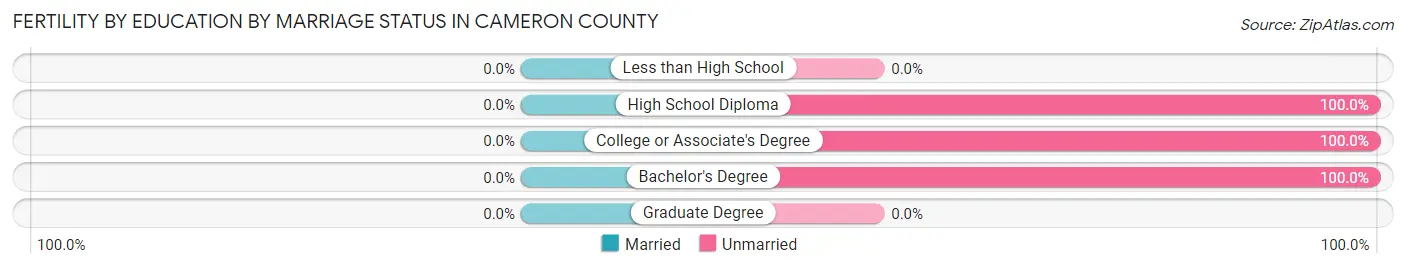
| Educational Attainment | Married | Unmarried |
| Less than High School | 0 (0.0%) | 0 (0.0%) |
| High School Diploma | 0 (0.0%) | 20 (100.0%) |
| College or Associate's Degree | 0 (0.0%) | 1 (100.0%) |
| Bachelor's Degree | 0 (0.0%) | 8 (100.0%) |
| Graduate Degree | 0 (0.0%) | 0 (0.0%) |
| Total | 0 (0.0%) | 29 (100.0%) |
Employment Characteristics in Cameron County
Employment by Class of Employer in Cameron County
Among the 1,777 employed individuals in Cameron County, private company employees (1,184 | 66.6%), self-employed (not incorporated) (136 | 7.6%), and local government employees (132 | 7.4%) make up the most common classes of employment.
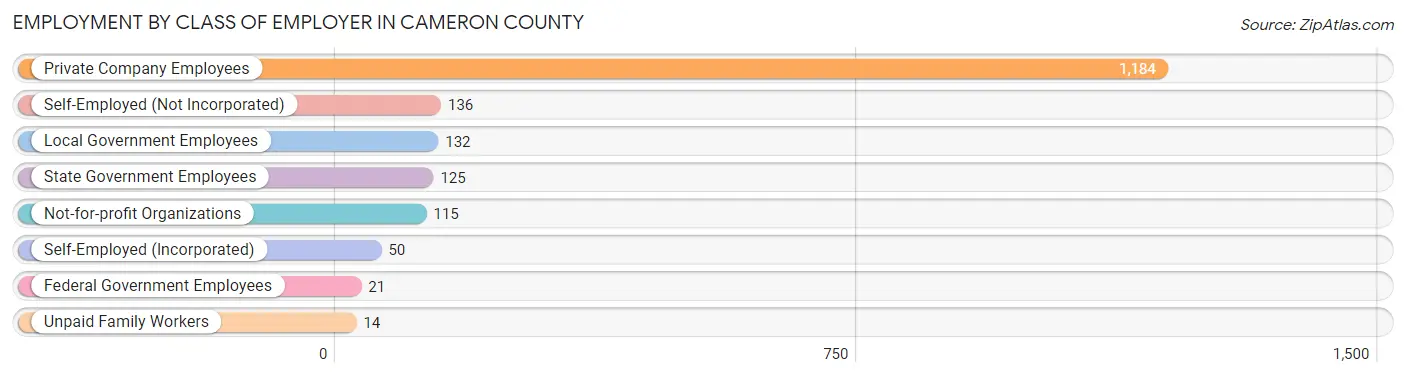
| Employer Class | # Employees | % Employees |
| Private Company Employees | 1,184 | 66.6% |
| Self-Employed (Incorporated) | 50 | 2.8% |
| Self-Employed (Not Incorporated) | 136 | 7.6% |
| Not-for-profit Organizations | 115 | 6.5% |
| Local Government Employees | 132 | 7.4% |
| State Government Employees | 125 | 7.0% |
| Federal Government Employees | 21 | 1.2% |
| Unpaid Family Workers | 14 | 0.8% |
| Total | 1,777 | 100.0% |
Employment Status by Age in Cameron County
According to the labor force statistics for Cameron County, out of the total population over 16 years of age (3,821), 51.0% or 1,949 individuals are in the labor force, with 7.1% or 138 of them unemployed. The age group with the highest labor force participation rate is 25 to 29 years, with 91.1% or 216 individuals in the labor force. Within the labor force, the 25 to 29 years age range has the highest percentage of unemployed individuals, with 23.1% or 50 of them being unemployed.
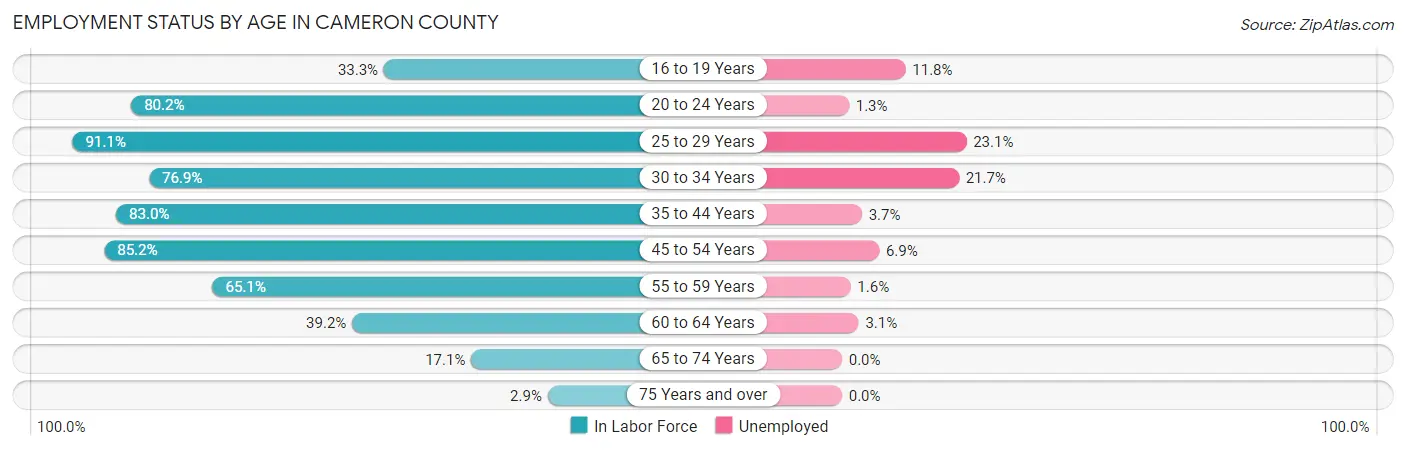
| Age Bracket | In Labor Force | Unemployed |
| 16 to 19 Years | 51 (33.3%) | 6 (11.8%) |
| 20 to 24 Years | 154 (80.2%) | 2 (1.3%) |
| 25 to 29 Years | 216 (91.1%) | 50 (23.1%) |
| 30 to 34 Years | 120 (76.9%) | 26 (21.7%) |
| 35 to 44 Years | 382 (83.0%) | 14 (3.7%) |
| 45 to 54 Years | 465 (85.2%) | 32 (6.9%) |
| 55 to 59 Years | 255 (65.1%) | 4 (1.6%) |
| 60 to 64 Years | 163 (39.2%) | 5 (3.1%) |
| 65 to 74 Years | 128 (17.1%) | 0 (0.0%) |
| 75 Years and over | 15 (2.9%) | 0 (0.0%) |
| Total | 1,949 (51.0%) | 138 (7.1%) |
Employment Status by Educational Attainment in Cameron County
According to labor force statistics for Cameron County, 72.5% of individuals (1,600) out of the total population between 25 and 64 years of age (2,207) are in the labor force, with 8.2% or 131 of them being unemployed. The group with the highest labor force participation rate are those with the educational attainment of college / associate degree, with 78.8% or 588 individuals in the labor force. Within the labor force, individuals with college / associate degree education have the highest percentage of unemployment, with 10.7% or 63 of them being unemployed.
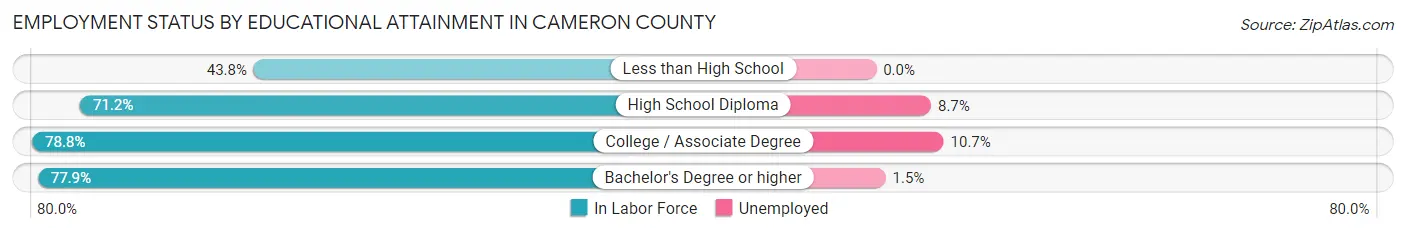
| Educational Attainment | In Labor Force | Unemployed |
| Less than High School | 71 (43.8%) | 0 (0.0%) |
| High School Diploma | 745 (71.2%) | 91 (8.7%) |
| College / Associate Degree | 588 (78.8%) | 80 (10.7%) |
| Bachelor's Degree or higher | 197 (77.9%) | 4 (1.5%) |
| Total | 1,600 (72.5%) | 181 (8.2%) |
Employment Occupations by Sex in Cameron County
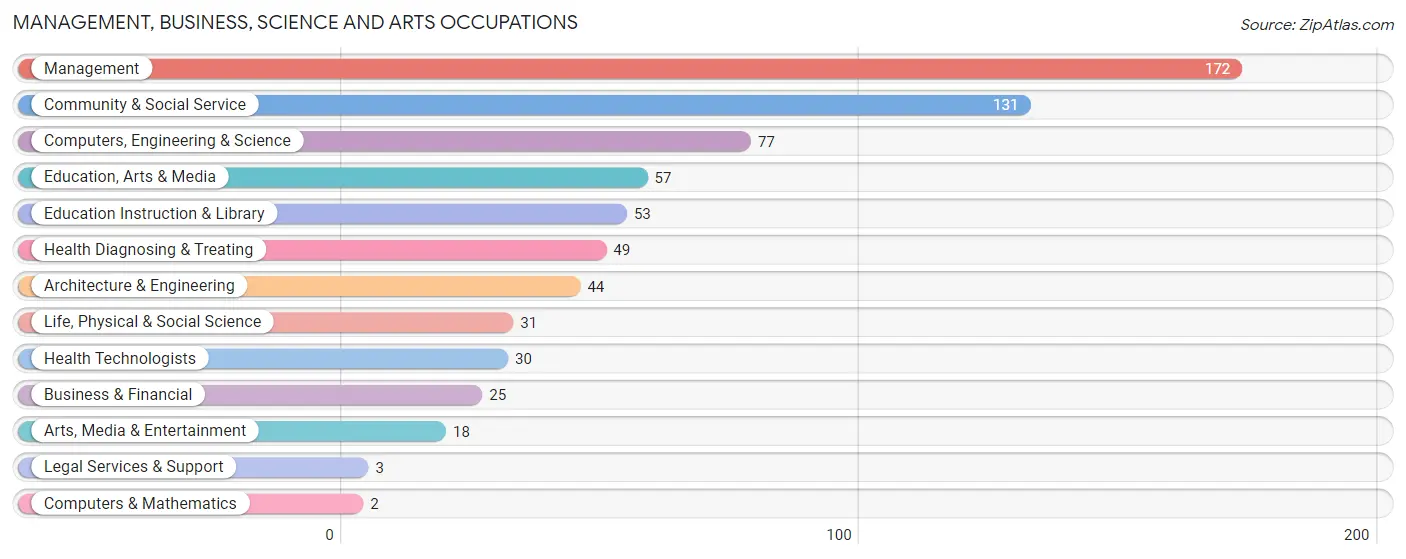
Management, Business, Science and Arts Occupations
The most common Management, Business, Science and Arts occupations in Cameron County are Management (172 | 9.5%), Community & Social Service (131 | 7.2%), Computers, Engineering & Science (77 | 4.3%), Education, Arts & Media (57 | 3.2%), and Education Instruction & Library (53 | 2.9%).
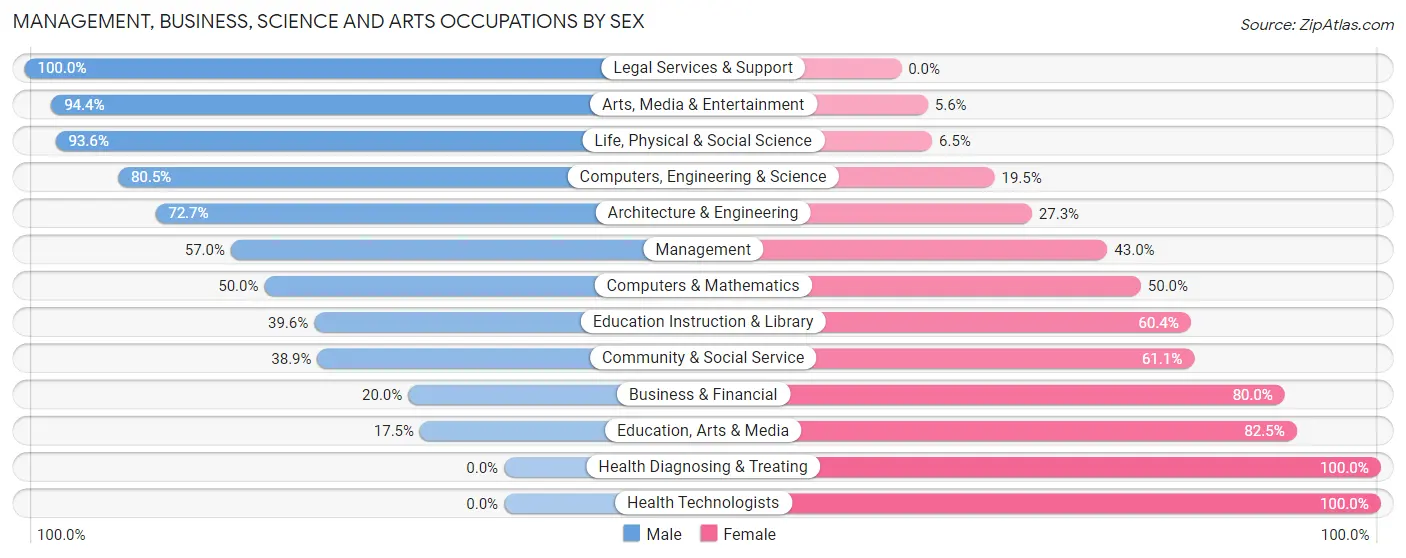
Management, Business, Science and Arts Occupations by Sex
Within the Management, Business, Science and Arts occupations in Cameron County, the most male-oriented occupations are Legal Services & Support (100.0%), Arts, Media & Entertainment (94.4%), and Life, Physical & Social Science (93.5%), while the most female-oriented occupations are Health Diagnosing & Treating (100.0%), Health Technologists (100.0%), and Education, Arts & Media (82.5%).
| Occupation | Male | Female |
| Management | 98 (57.0%) | 74 (43.0%) |
| Business & Financial | 5 (20.0%) | 20 (80.0%) |
| Computers, Engineering & Science | 62 (80.5%) | 15 (19.5%) |
| Computers & Mathematics | 1 (50.0%) | 1 (50.0%) |
| Architecture & Engineering | 32 (72.7%) | 12 (27.3%) |
| Life, Physical & Social Science | 29 (93.5%) | 2 (6.5%) |
| Community & Social Service | 51 (38.9%) | 80 (61.1%) |
| Education, Arts & Media | 10 (17.5%) | 47 (82.5%) |
| Legal Services & Support | 3 (100.0%) | 0 (0.0%) |
| Education Instruction & Library | 21 (39.6%) | 32 (60.4%) |
| Arts, Media & Entertainment | 17 (94.4%) | 1 (5.6%) |
| Health Diagnosing & Treating | 0 (0.0%) | 49 (100.0%) |
| Health Technologists | 0 (0.0%) | 30 (100.0%) |
| Total (Category) | 216 (47.6%) | 238 (52.4%) |
| Total (Overall) | 981 (54.2%) | 829 (45.8%) |
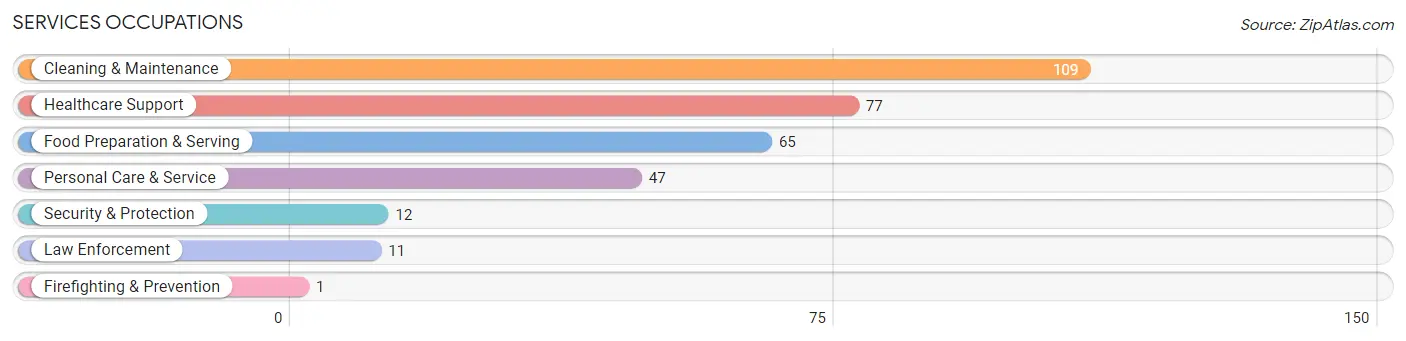
Services Occupations
The most common Services occupations in Cameron County are Cleaning & Maintenance (109 | 6.0%), Healthcare Support (77 | 4.3%), Food Preparation & Serving (65 | 3.6%), Personal Care & Service (47 | 2.6%), and Security & Protection (12 | 0.7%).
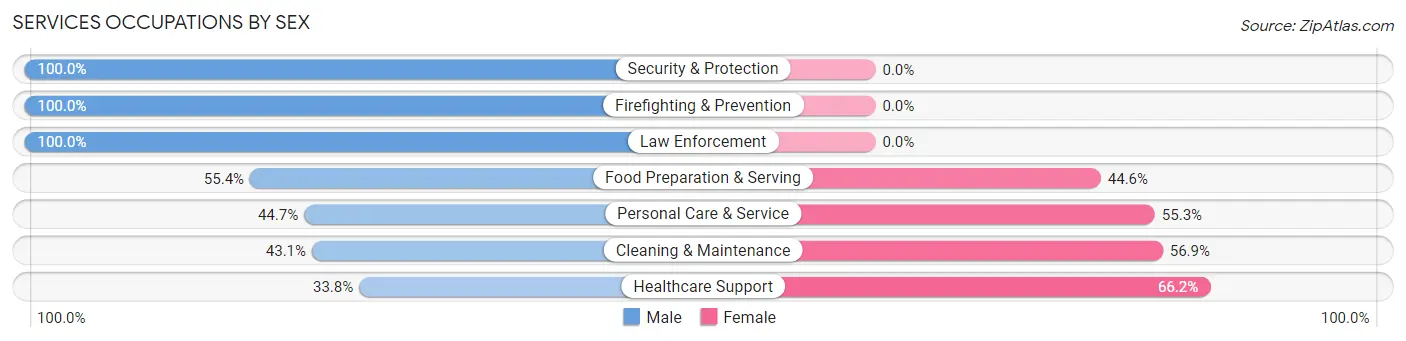
Services Occupations by Sex
Within the Services occupations in Cameron County, the most male-oriented occupations are Security & Protection (100.0%), Firefighting & Prevention (100.0%), and Law Enforcement (100.0%), while the most female-oriented occupations are Healthcare Support (66.2%), Cleaning & Maintenance (56.9%), and Personal Care & Service (55.3%).
| Occupation | Male | Female |
| Healthcare Support | 26 (33.8%) | 51 (66.2%) |
| Security & Protection | 12 (100.0%) | 0 (0.0%) |
| Firefighting & Prevention | 1 (100.0%) | 0 (0.0%) |
| Law Enforcement | 11 (100.0%) | 0 (0.0%) |
| Food Preparation & Serving | 36 (55.4%) | 29 (44.6%) |
| Cleaning & Maintenance | 47 (43.1%) | 62 (56.9%) |
| Personal Care & Service | 21 (44.7%) | 26 (55.3%) |
| Total (Category) | 142 (45.8%) | 168 (54.2%) |
| Total (Overall) | 981 (54.2%) | 829 (45.8%) |
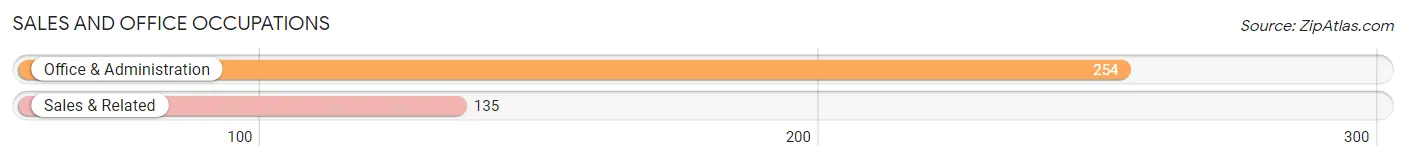
Sales and Office Occupations
The most common Sales and Office occupations in Cameron County are Office & Administration (254 | 14.0%), and Sales & Related (135 | 7.5%).
Sales and Office Occupations by Sex
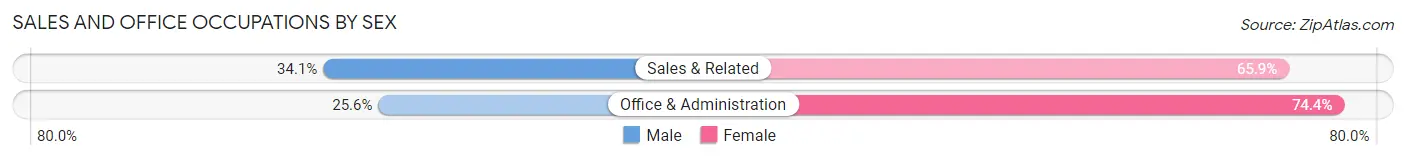
| Occupation | Male | Female |
| Sales & Related | 46 (34.1%) | 89 (65.9%) |
| Office & Administration | 65 (25.6%) | 189 (74.4%) |
| Total (Category) | 111 (28.5%) | 278 (71.5%) |
| Total (Overall) | 981 (54.2%) | 829 (45.8%) |
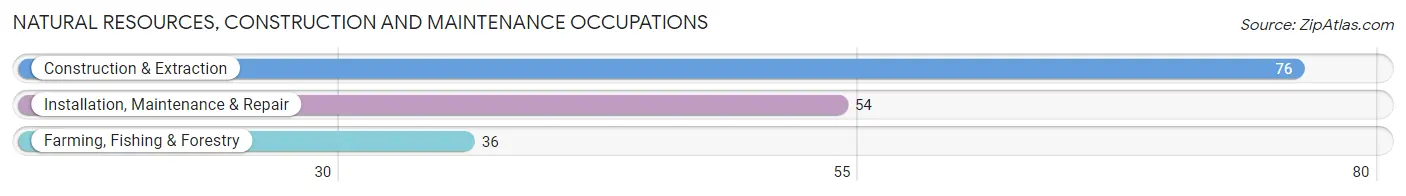
Natural Resources, Construction and Maintenance Occupations
The most common Natural Resources, Construction and Maintenance occupations in Cameron County are Construction & Extraction (76 | 4.2%), Installation, Maintenance & Repair (54 | 3.0%), and Farming, Fishing & Forestry (36 | 2.0%).
Natural Resources, Construction and Maintenance Occupations by Sex
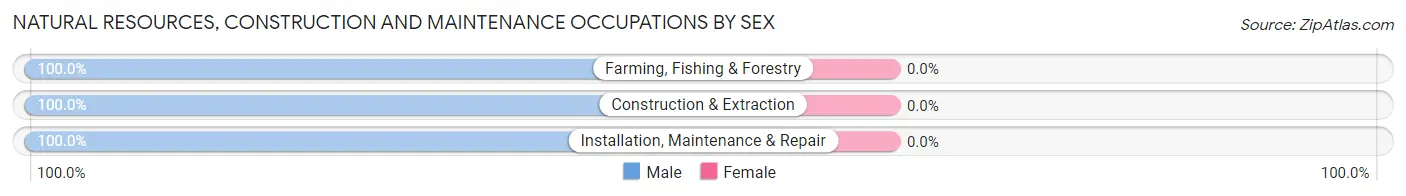
| Occupation | Male | Female |
| Farming, Fishing & Forestry | 36 (100.0%) | 0 (0.0%) |
| Construction & Extraction | 76 (100.0%) | 0 (0.0%) |
| Installation, Maintenance & Repair | 54 (100.0%) | 0 (0.0%) |
| Total (Category) | 166 (100.0%) | 0 (0.0%) |
| Total (Overall) | 981 (54.2%) | 829 (45.8%) |
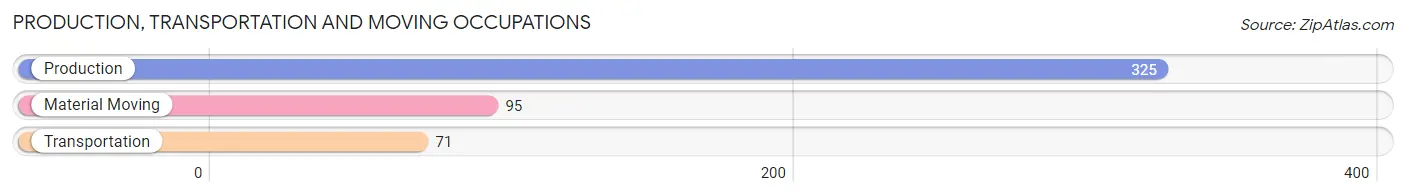
Production, Transportation and Moving Occupations
The most common Production, Transportation and Moving occupations in Cameron County are Production (325 | 18.0%), Material Moving (95 | 5.2%), and Transportation (71 | 3.9%).
Production, Transportation and Moving Occupations by Sex
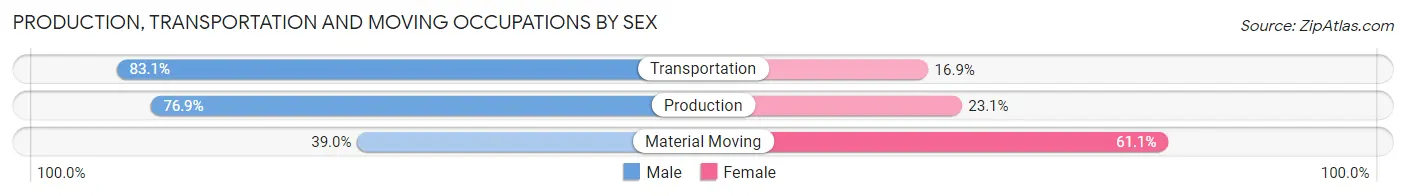
| Occupation | Male | Female |
| Production | 250 (76.9%) | 75 (23.1%) |
| Transportation | 59 (83.1%) | 12 (16.9%) |
| Material Moving | 37 (39.0%) | 58 (61.1%) |
| Total (Category) | 346 (70.5%) | 145 (29.5%) |
| Total (Overall) | 981 (54.2%) | 829 (45.8%) |
Employment Industries by Sex in Cameron County
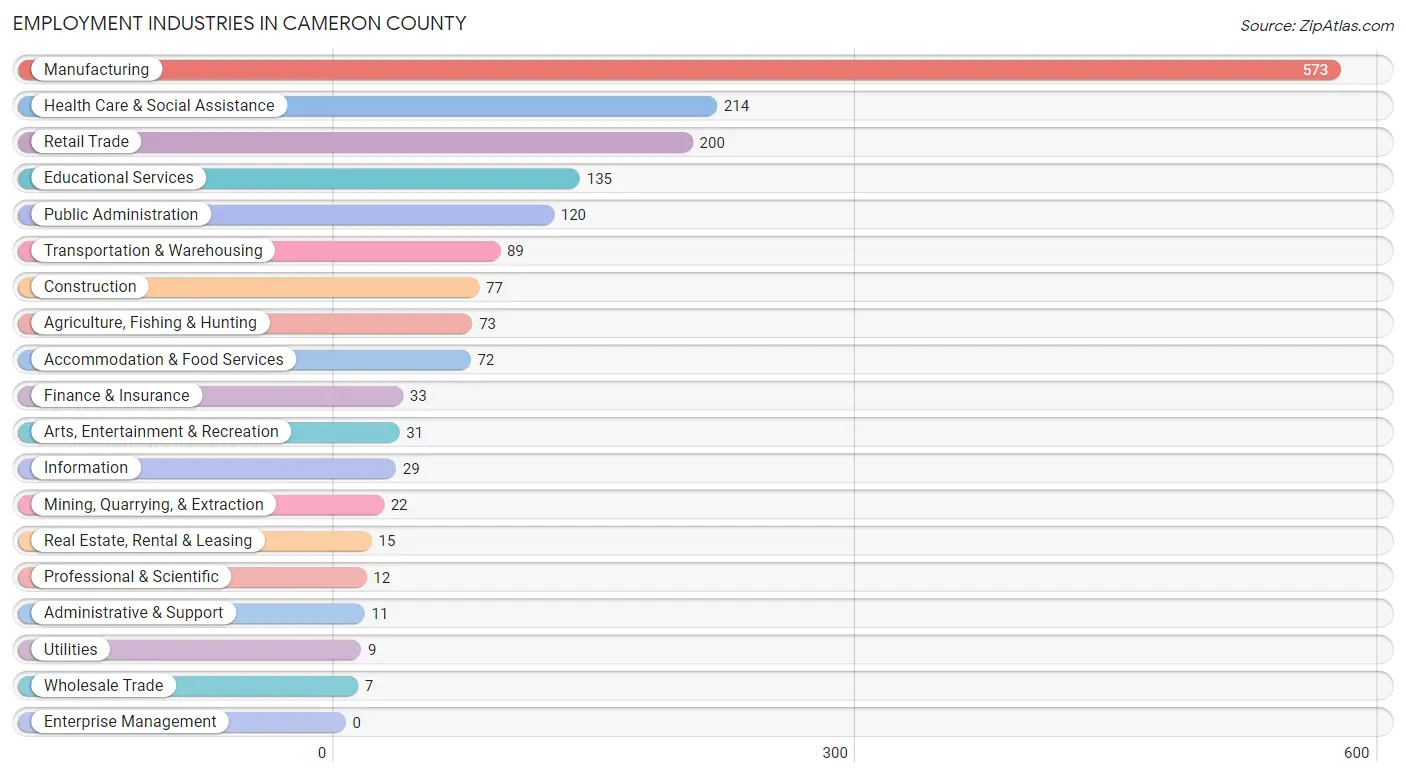
Employment Industries in Cameron County
The major employment industries in Cameron County include Manufacturing (573 | 31.7%), Health Care & Social Assistance (214 | 11.8%), Retail Trade (200 | 11.1%), Educational Services (135 | 7.5%), and Public Administration (120 | 6.6%).
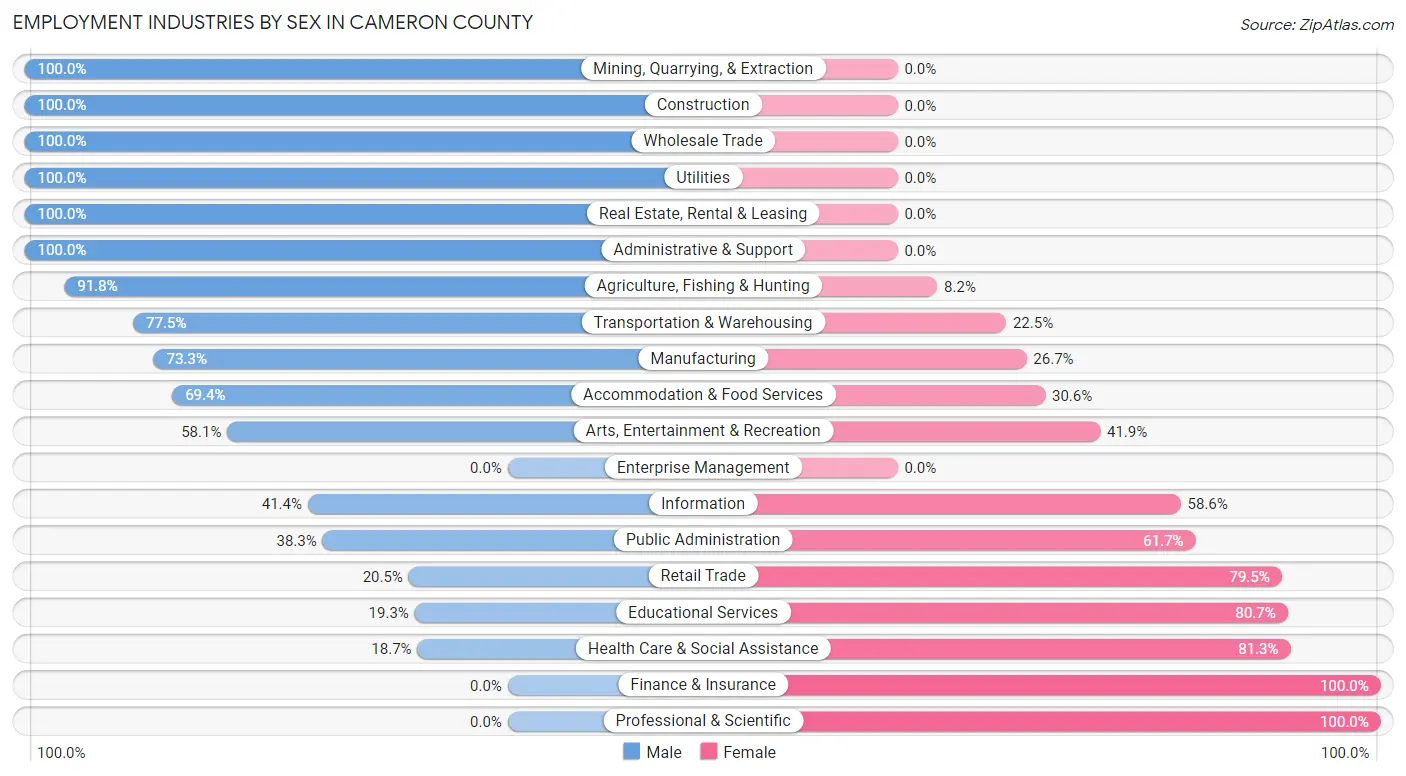
Employment Industries by Sex in Cameron County
The Cameron County industries that see more men than women are Mining, Quarrying, & Extraction (100.0%), Construction (100.0%), and Wholesale Trade (100.0%), whereas the industries that tend to have a higher number of women are Finance & Insurance (100.0%), Professional & Scientific (100.0%), and Health Care & Social Assistance (81.3%).
| Industry | Male | Female |
| Agriculture, Fishing & Hunting | 67 (91.8%) | 6 (8.2%) |
| Mining, Quarrying, & Extraction | 22 (100.0%) | 0 (0.0%) |
| Construction | 77 (100.0%) | 0 (0.0%) |
| Manufacturing | 420 (73.3%) | 153 (26.7%) |
| Wholesale Trade | 7 (100.0%) | 0 (0.0%) |
| Retail Trade | 41 (20.5%) | 159 (79.5%) |
| Transportation & Warehousing | 69 (77.5%) | 20 (22.5%) |
| Utilities | 9 (100.0%) | 0 (0.0%) |
| Information | 12 (41.4%) | 17 (58.6%) |
| Finance & Insurance | 0 (0.0%) | 33 (100.0%) |
| Real Estate, Rental & Leasing | 15 (100.0%) | 0 (0.0%) |
| Professional & Scientific | 0 (0.0%) | 12 (100.0%) |
| Enterprise Management | 0 (0.0%) | 0 (0.0%) |
| Administrative & Support | 11 (100.0%) | 0 (0.0%) |
| Educational Services | 26 (19.3%) | 109 (80.7%) |
| Health Care & Social Assistance | 40 (18.7%) | 174 (81.3%) |
| Arts, Entertainment & Recreation | 18 (58.1%) | 13 (41.9%) |
| Accommodation & Food Services | 50 (69.4%) | 22 (30.6%) |
| Public Administration | 46 (38.3%) | 74 (61.7%) |
| Total | 981 (54.2%) | 829 (45.8%) |
Education in Cameron County
School Enrollment in Cameron County
The most common levels of schooling among the 797 students in Cameron County are middle school (204 | 25.6%), high school (181 | 22.7%), and nursery / preschool (151 | 19.0%).
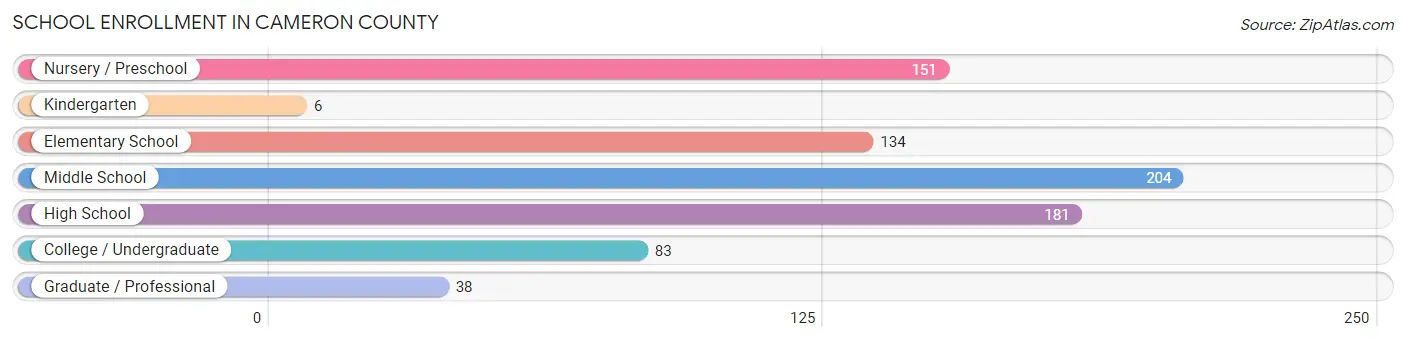
| School Level | # Students | % Students |
| Nursery / Preschool | 151 | 19.0% |
| Kindergarten | 6 | 0.7% |
| Elementary School | 134 | 16.8% |
| Middle School | 204 | 25.6% |
| High School | 181 | 22.7% |
| College / Undergraduate | 83 | 10.4% |
| Graduate / Professional | 38 | 4.8% |
| Total | 797 | 100.0% |
School Enrollment by Age by Funding Source in Cameron County
Out of a total of 797 students who are enrolled in schools in Cameron County, 87 (10.9%) attend a private institution, while the remaining 710 (89.1%) are enrolled in public schools. The age group of 35 years and over has the highest likelihood of being enrolled in private schools, with 48 (92.3% in the age bracket) enrolled. Conversely, the age group of 3 to 4 year olds has the lowest likelihood of being enrolled in a private school, with 55 (100.0% in the age bracket) attending a public institution.
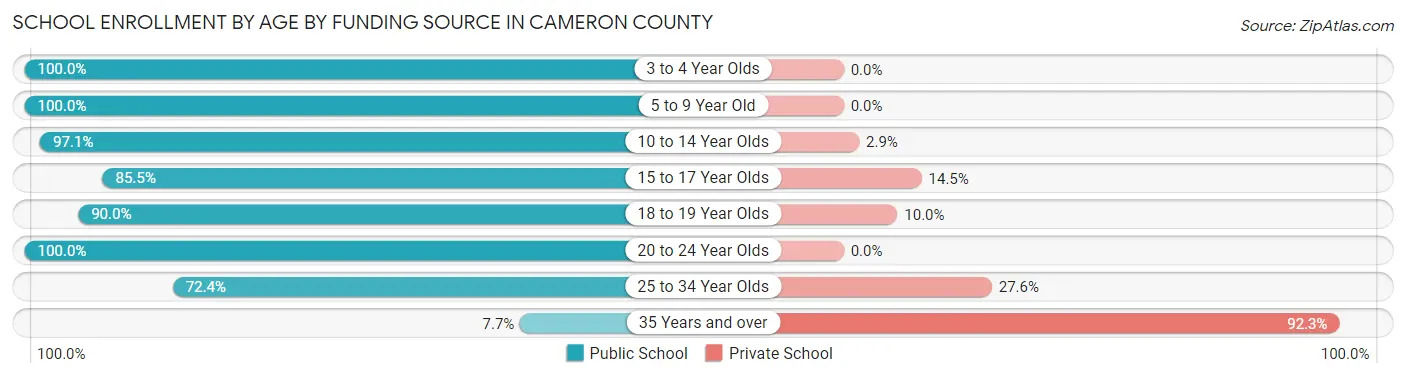
| Age Bracket | Public School | Private School |
| 3 to 4 Year Olds | 55 (100.0%) | 0 (0.0%) |
| 5 to 9 Year Old | 228 (100.0%) | 0 (0.0%) |
| 10 to 14 Year Olds | 202 (97.1%) | 6 (2.9%) |
| 15 to 17 Year Olds | 106 (85.5%) | 18 (14.5%) |
| 18 to 19 Year Olds | 63 (90.0%) | 7 (10.0%) |
| 20 to 24 Year Olds | 31 (100.0%) | 0 (0.0%) |
| 25 to 34 Year Olds | 21 (72.4%) | 8 (27.6%) |
| 35 Years and over | 4 (7.7%) | 48 (92.3%) |
| Total | 710 (89.1%) | 87 (10.9%) |
Educational Attainment by Field of Study in Cameron County
Education (159 | 40.4%), engineering (34 | 8.6%), psychology (32 | 8.1%), social sciences (32 | 8.1%), and arts & humanities (24 | 6.1%) are the most common fields of study among 394 individuals in Cameron County who have obtained a bachelor's degree or higher.
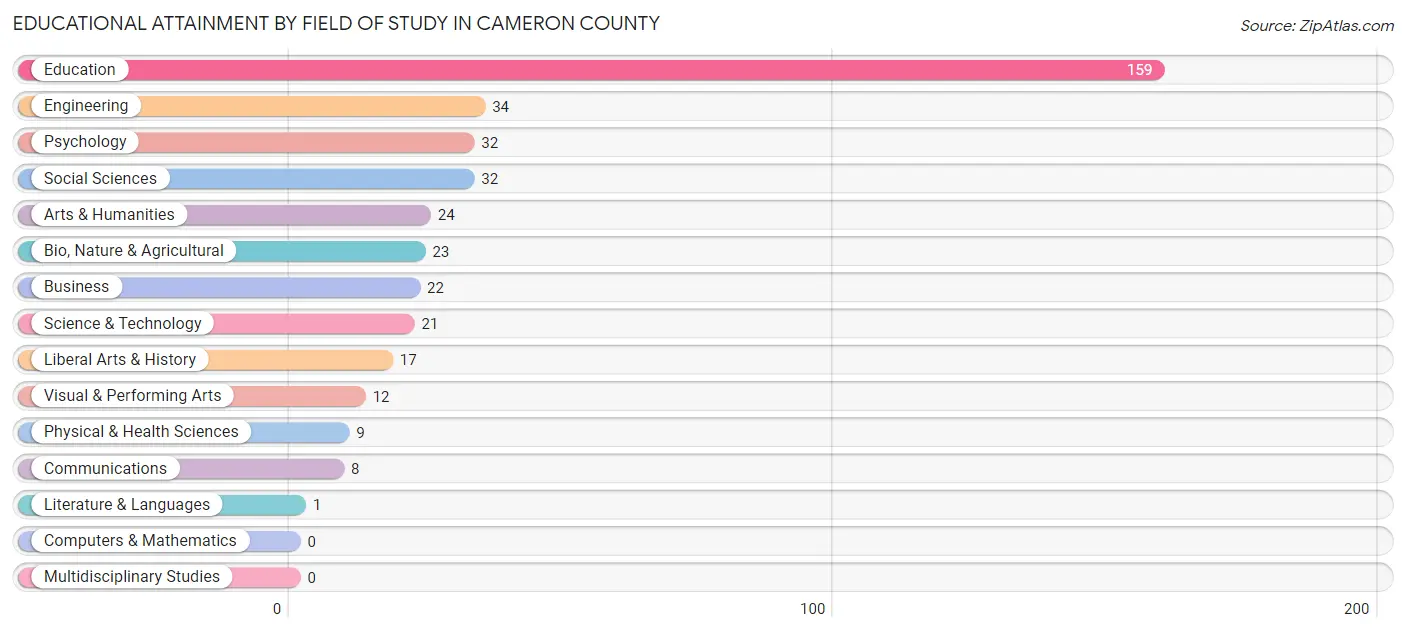
| Field of Study | # Graduates | % Graduates |
| Computers & Mathematics | 0 | 0.0% |
| Bio, Nature & Agricultural | 23 | 5.8% |
| Physical & Health Sciences | 9 | 2.3% |
| Psychology | 32 | 8.1% |
| Social Sciences | 32 | 8.1% |
| Engineering | 34 | 8.6% |
| Multidisciplinary Studies | 0 | 0.0% |
| Science & Technology | 21 | 5.3% |
| Business | 22 | 5.6% |
| Education | 159 | 40.4% |
| Literature & Languages | 1 | 0.3% |
| Liberal Arts & History | 17 | 4.3% |
| Visual & Performing Arts | 12 | 3.0% |
| Communications | 8 | 2.0% |
| Arts & Humanities | 24 | 6.1% |
| Total | 394 | 100.0% |
Transportation & Commute in Cameron County
Vehicle Availability by Sex in Cameron County
The most prevalent vehicle ownership categories in Cameron County are males with 2 vehicles (461, accounting for 47.7%) and females with 2 vehicles (306, making up 57.6%).
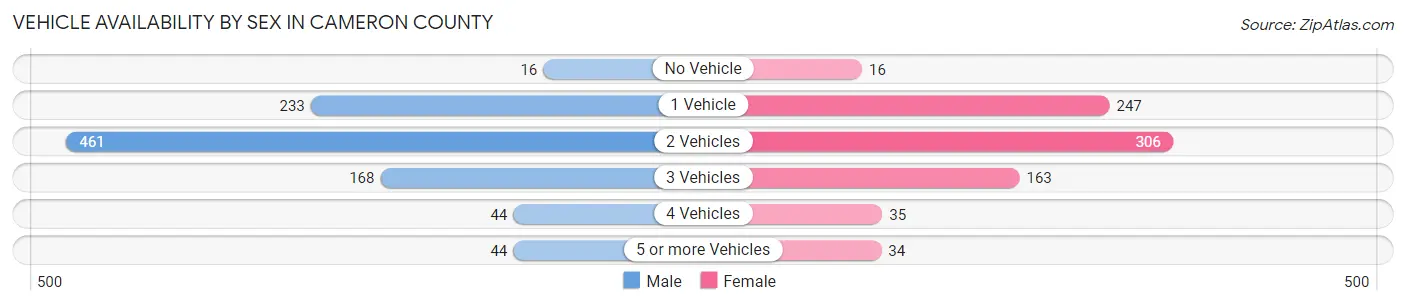
| Vehicles Available | Male | Female |
| No Vehicle | 16 (1.7%) | 16 (2.0%) |
| 1 Vehicle | 233 (24.1%) | 247 (30.8%) |
| 2 Vehicles | 461 (47.7%) | 306 (38.2%) |
| 3 Vehicles | 168 (17.4%) | 163 (20.3%) |
| 4 Vehicles | 44 (4.5%) | 35 (4.4%) |
| 5 or more Vehicles | 44 (4.5%) | 34 (4.2%) |
| Total | 966 (100.0%) | 801 (100.0%) |
Commute Time in Cameron County
The most frequently occuring commute durations in Cameron County are 5 to 9 minutes (523 commuters, 30.0%), 10 to 14 minutes (273 commuters, 15.7%), and less than 5 minutes (263 commuters, 15.1%).
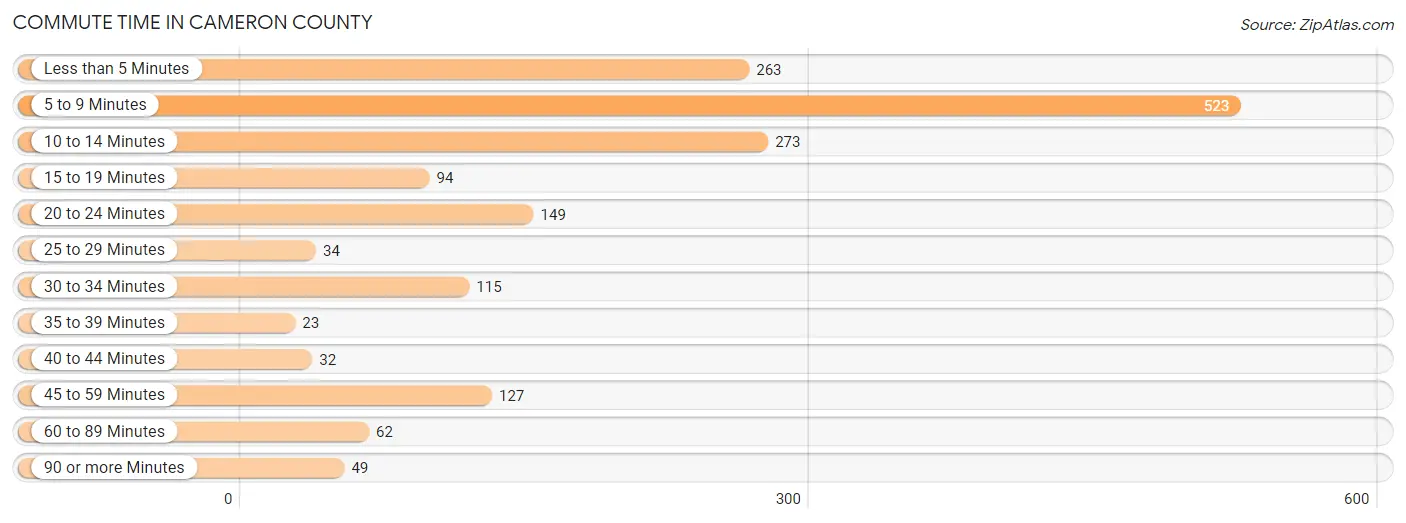
| Commute Time | # Commuters | % Commuters |
| Less than 5 Minutes | 263 | 15.1% |
| 5 to 9 Minutes | 523 | 30.0% |
| 10 to 14 Minutes | 273 | 15.7% |
| 15 to 19 Minutes | 94 | 5.4% |
| 20 to 24 Minutes | 149 | 8.5% |
| 25 to 29 Minutes | 34 | 1.9% |
| 30 to 34 Minutes | 115 | 6.6% |
| 35 to 39 Minutes | 23 | 1.3% |
| 40 to 44 Minutes | 32 | 1.8% |
| 45 to 59 Minutes | 127 | 7.3% |
| 60 to 89 Minutes | 62 | 3.6% |
| 90 or more Minutes | 49 | 2.8% |
Commute Time by Sex in Cameron County
The most common commute times in Cameron County are 5 to 9 minutes (284 commuters, 29.7%) for males and 5 to 9 minutes (239 commuters, 30.4%) for females.
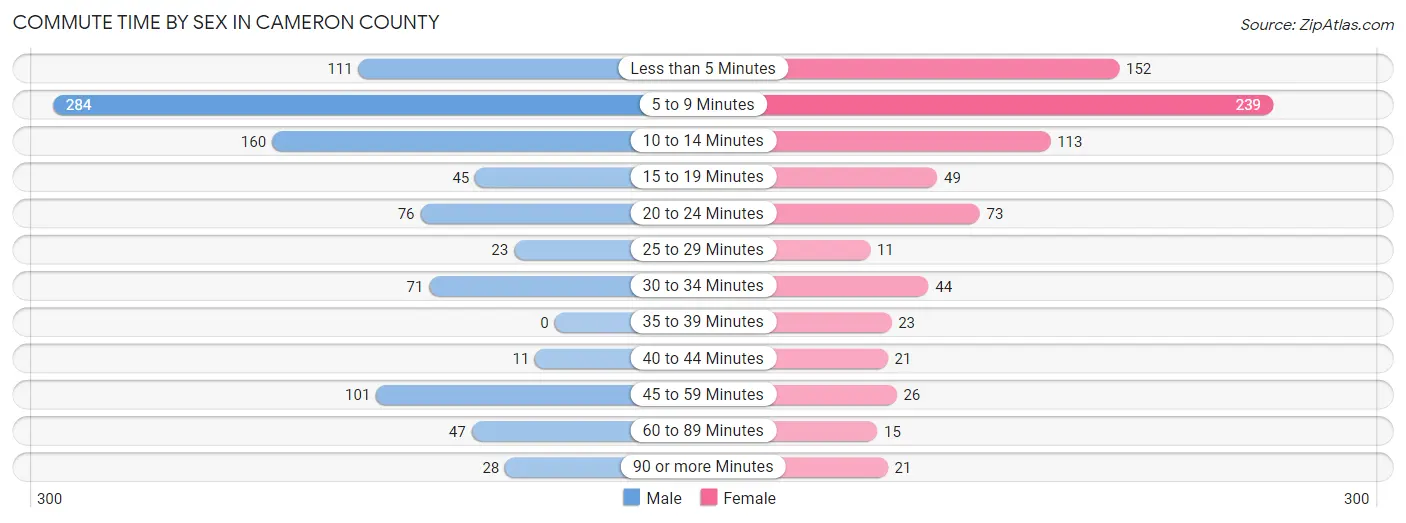
| Commute Time | Male | Female |
| Less than 5 Minutes | 111 (11.6%) | 152 (19.3%) |
| 5 to 9 Minutes | 284 (29.7%) | 239 (30.4%) |
| 10 to 14 Minutes | 160 (16.7%) | 113 (14.4%) |
| 15 to 19 Minutes | 45 (4.7%) | 49 (6.2%) |
| 20 to 24 Minutes | 76 (7.9%) | 73 (9.3%) |
| 25 to 29 Minutes | 23 (2.4%) | 11 (1.4%) |
| 30 to 34 Minutes | 71 (7.4%) | 44 (5.6%) |
| 35 to 39 Minutes | 0 (0.0%) | 23 (2.9%) |
| 40 to 44 Minutes | 11 (1.1%) | 21 (2.7%) |
| 45 to 59 Minutes | 101 (10.5%) | 26 (3.3%) |
| 60 to 89 Minutes | 47 (4.9%) | 15 (1.9%) |
| 90 or more Minutes | 28 (2.9%) | 21 (2.7%) |
Time of Departure to Work by Sex in Cameron County
The most frequent times of departure to work in Cameron County are 6:00 AM to 6:29 AM (171, 17.9%) for males and 7:30 AM to 7:59 AM (153, 19.4%) for females.
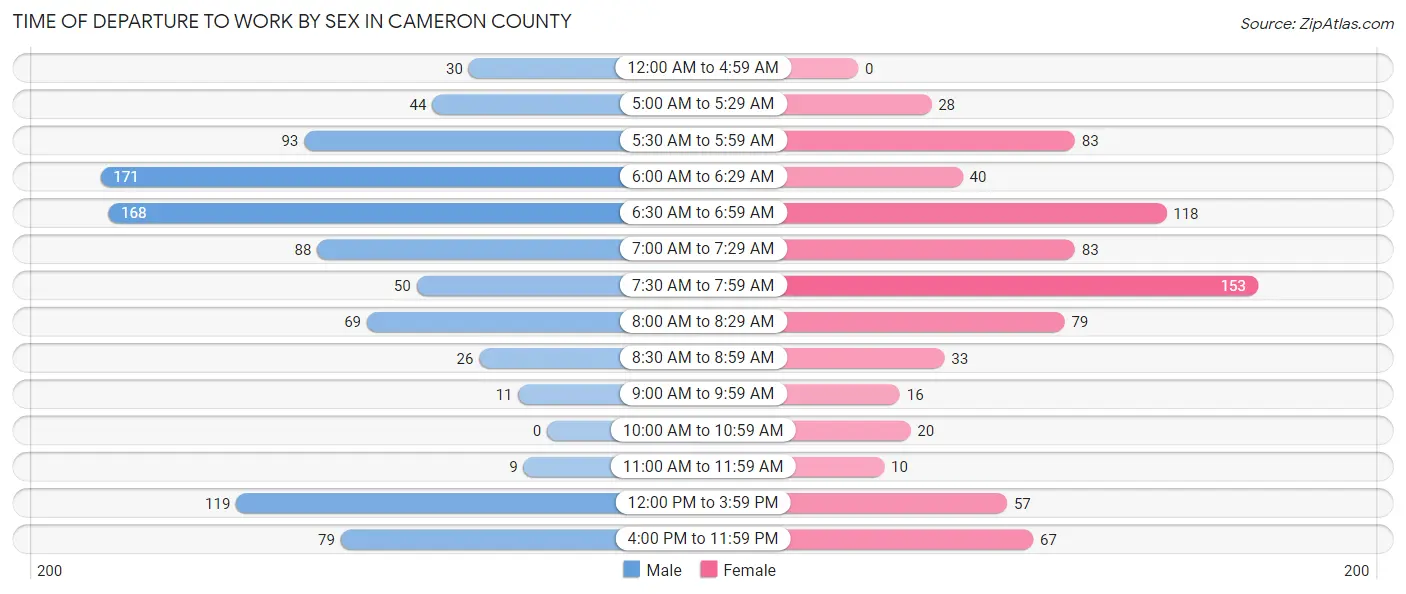
| Time of Departure | Male | Female |
| 12:00 AM to 4:59 AM | 30 (3.1%) | 0 (0.0%) |
| 5:00 AM to 5:29 AM | 44 (4.6%) | 28 (3.6%) |
| 5:30 AM to 5:59 AM | 93 (9.7%) | 83 (10.5%) |
| 6:00 AM to 6:29 AM | 171 (17.9%) | 40 (5.1%) |
| 6:30 AM to 6:59 AM | 168 (17.5%) | 118 (15.0%) |
| 7:00 AM to 7:29 AM | 88 (9.2%) | 83 (10.5%) |
| 7:30 AM to 7:59 AM | 50 (5.2%) | 153 (19.4%) |
| 8:00 AM to 8:29 AM | 69 (7.2%) | 79 (10.0%) |
| 8:30 AM to 8:59 AM | 26 (2.7%) | 33 (4.2%) |
| 9:00 AM to 9:59 AM | 11 (1.1%) | 16 (2.0%) |
| 10:00 AM to 10:59 AM | 0 (0.0%) | 20 (2.5%) |
| 11:00 AM to 11:59 AM | 9 (0.9%) | 10 (1.3%) |
| 12:00 PM to 3:59 PM | 119 (12.4%) | 57 (7.2%) |
| 4:00 PM to 11:59 PM | 79 (8.3%) | 67 (8.5%) |
| Total | 957 (100.0%) | 787 (100.0%) |
Housing Occupancy in Cameron County
Occupancy by Ownership in Cameron County
Of the total 2,210 dwellings in Cameron County, owner-occupied units account for 1,577 (71.4%), while renter-occupied units make up 633 (28.6%).
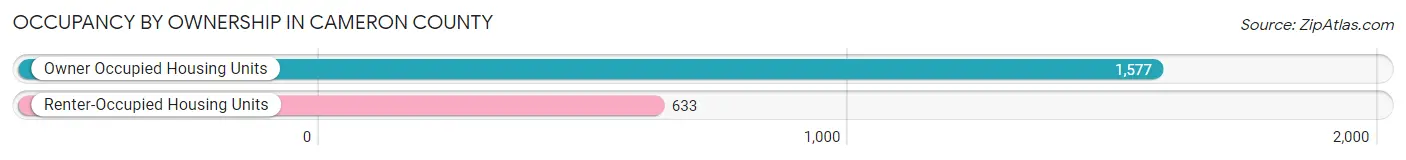
| Occupancy | # Housing Units | % Housing Units |
| Owner Occupied Housing Units | 1,577 | 71.4% |
| Renter-Occupied Housing Units | 633 | 28.6% |
| Total Occupied Housing Units | 2,210 | 100.0% |
Occupancy by Household Size in Cameron County
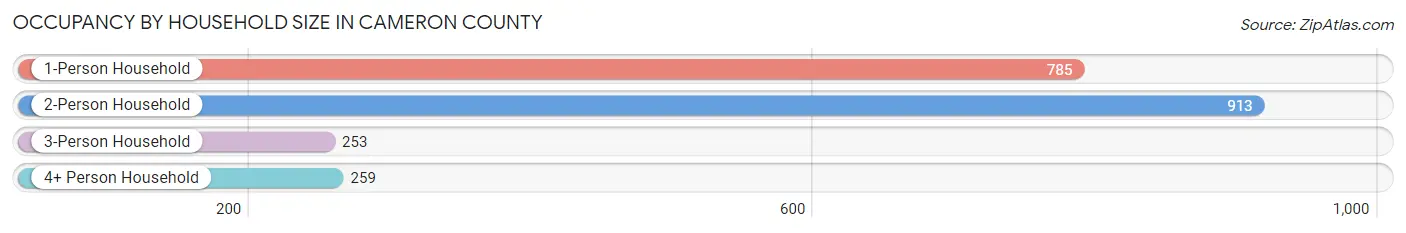
| Household Size | # Housing Units | % Housing Units |
| 1-Person Household | 785 | 35.5% |
| 2-Person Household | 913 | 41.3% |
| 3-Person Household | 253 | 11.5% |
| 4+ Person Household | 259 | 11.7% |
| Total Housing Units | 2,210 | 100.0% |
Occupancy by Ownership by Household Size in Cameron County
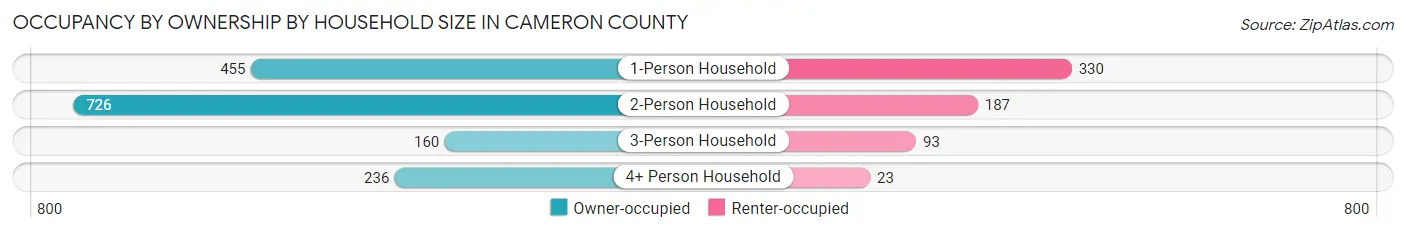
| Household Size | Owner-occupied | Renter-occupied |
| 1-Person Household | 455 (58.0%) | 330 (42.0%) |
| 2-Person Household | 726 (79.5%) | 187 (20.5%) |
| 3-Person Household | 160 (63.2%) | 93 (36.8%) |
| 4+ Person Household | 236 (91.1%) | 23 (8.9%) |
| Total Housing Units | 1,577 (71.4%) | 633 (28.6%) |
Occupancy by Educational Attainment in Cameron County
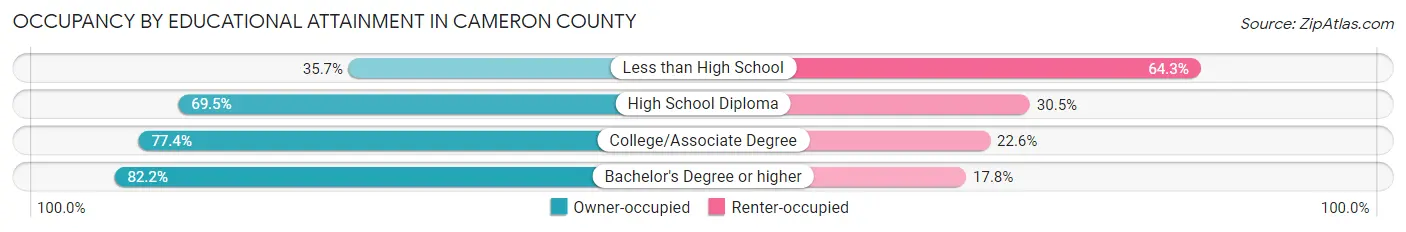
| Household Size | Owner-occupied | Renter-occupied |
| Less than High School | 45 (35.7%) | 81 (64.3%) |
| High School Diploma | 812 (69.5%) | 356 (30.5%) |
| College/Associate Degree | 531 (77.4%) | 155 (22.6%) |
| Bachelor's Degree or higher | 189 (82.2%) | 41 (17.8%) |
Occupancy by Age of Householder in Cameron County
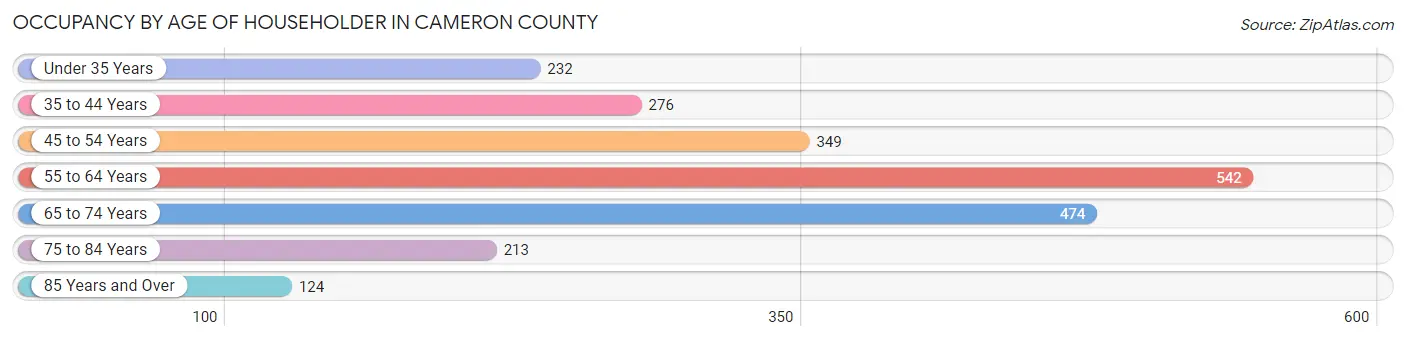
| Age Bracket | # Households | % Households |
| Under 35 Years | 232 | 10.5% |
| 35 to 44 Years | 276 | 12.5% |
| 45 to 54 Years | 349 | 15.8% |
| 55 to 64 Years | 542 | 24.5% |
| 65 to 74 Years | 474 | 21.4% |
| 75 to 84 Years | 213 | 9.6% |
| 85 Years and Over | 124 | 5.6% |
| Total | 2,210 | 100.0% |
Housing Finances in Cameron County
Median Income by Occupancy in Cameron County
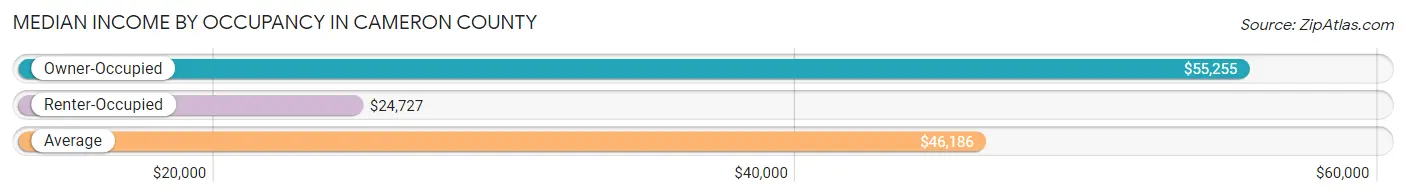
| Occupancy Type | # Households | Median Income |
| Owner-Occupied | 1,577 (71.4%) | $55,255 |
| Renter-Occupied | 633 (28.6%) | $24,727 |
| Average | 2,210 (100.0%) | $46,186 |
Occupancy by Householder Income Bracket in Cameron County
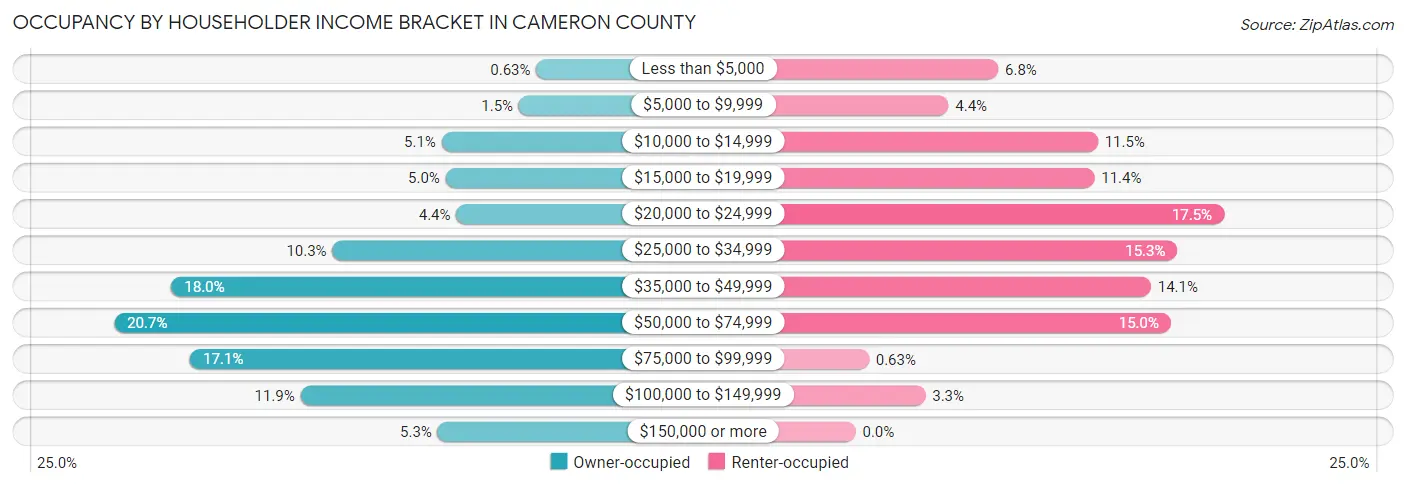
| Income Bracket | Owner-occupied | Renter-occupied |
| Less than $5,000 | 10 (0.6%) | 43 (6.8%) |
| $5,000 to $9,999 | 23 (1.5%) | 28 (4.4%) |
| $10,000 to $14,999 | 81 (5.1%) | 73 (11.5%) |
| $15,000 to $19,999 | 78 (5.0%) | 72 (11.4%) |
| $20,000 to $24,999 | 70 (4.4%) | 111 (17.5%) |
| $25,000 to $34,999 | 163 (10.3%) | 97 (15.3%) |
| $35,000 to $49,999 | 284 (18.0%) | 89 (14.1%) |
| $50,000 to $74,999 | 327 (20.7%) | 95 (15.0%) |
| $75,000 to $99,999 | 270 (17.1%) | 4 (0.6%) |
| $100,000 to $149,999 | 187 (11.9%) | 21 (3.3%) |
| $150,000 or more | 84 (5.3%) | 0 (0.0%) |
| Total | 1,577 (100.0%) | 633 (100.0%) |
Monthly Housing Cost Tiers in Cameron County
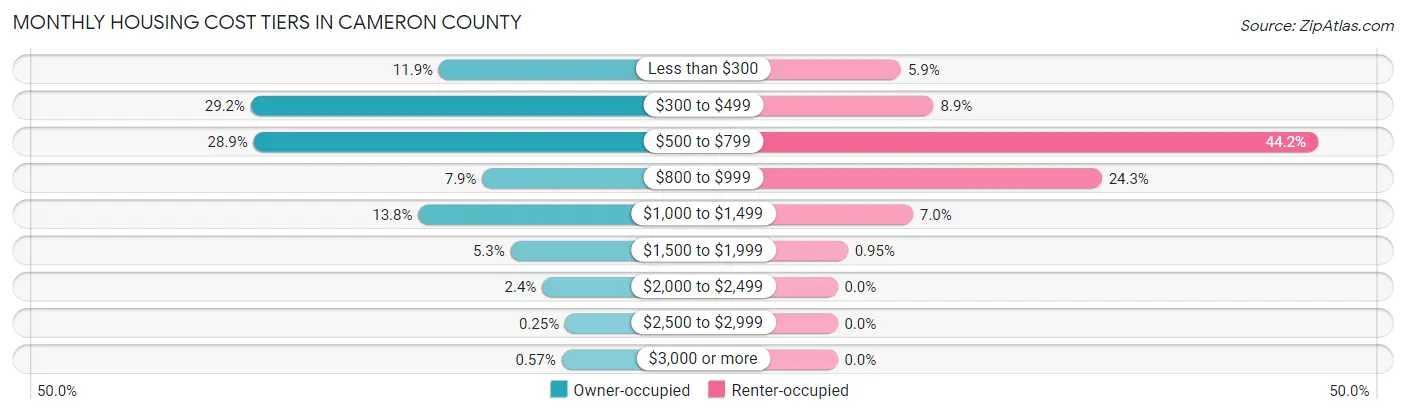
| Monthly Cost | Owner-occupied | Renter-occupied |
| Less than $300 | 187 (11.9%) | 37 (5.9%) |
| $300 to $499 | 460 (29.2%) | 56 (8.8%) |
| $500 to $799 | 456 (28.9%) | 280 (44.2%) |
| $800 to $999 | 124 (7.9%) | 154 (24.3%) |
| $1,000 to $1,499 | 217 (13.8%) | 44 (7.0%) |
| $1,500 to $1,999 | 83 (5.3%) | 6 (0.9%) |
| $2,000 to $2,499 | 37 (2.4%) | 0 (0.0%) |
| $2,500 to $2,999 | 4 (0.3%) | 0 (0.0%) |
| $3,000 or more | 9 (0.6%) | 0 (0.0%) |
| Total | 1,577 (100.0%) | 633 (100.0%) |
Physical Housing Characteristics in Cameron County
Housing Structures in Cameron County
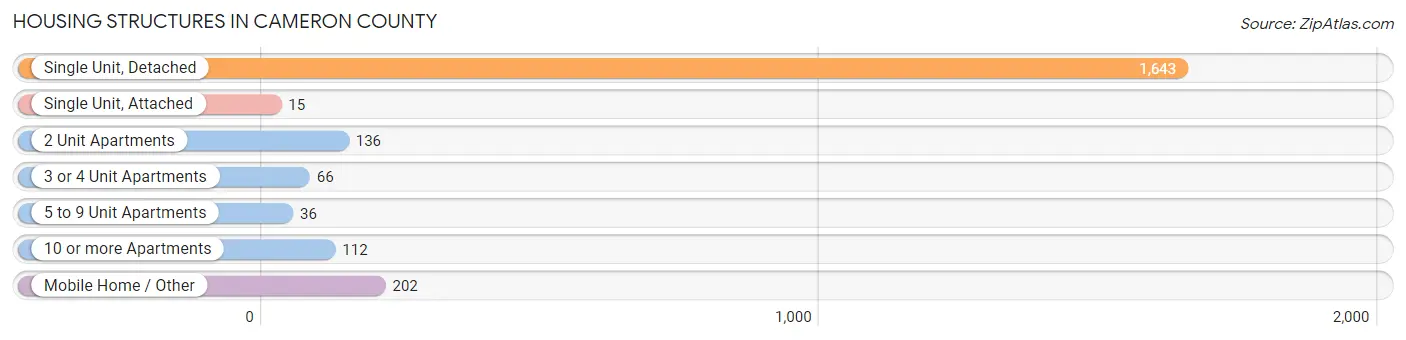
| Structure Type | # Housing Units | % Housing Units |
| Single Unit, Detached | 1,643 | 74.3% |
| Single Unit, Attached | 15 | 0.7% |
| 2 Unit Apartments | 136 | 6.1% |
| 3 or 4 Unit Apartments | 66 | 3.0% |
| 5 to 9 Unit Apartments | 36 | 1.6% |
| 10 or more Apartments | 112 | 5.1% |
| Mobile Home / Other | 202 | 9.1% |
| Total | 2,210 | 100.0% |
Housing Structures by Occupancy in Cameron County
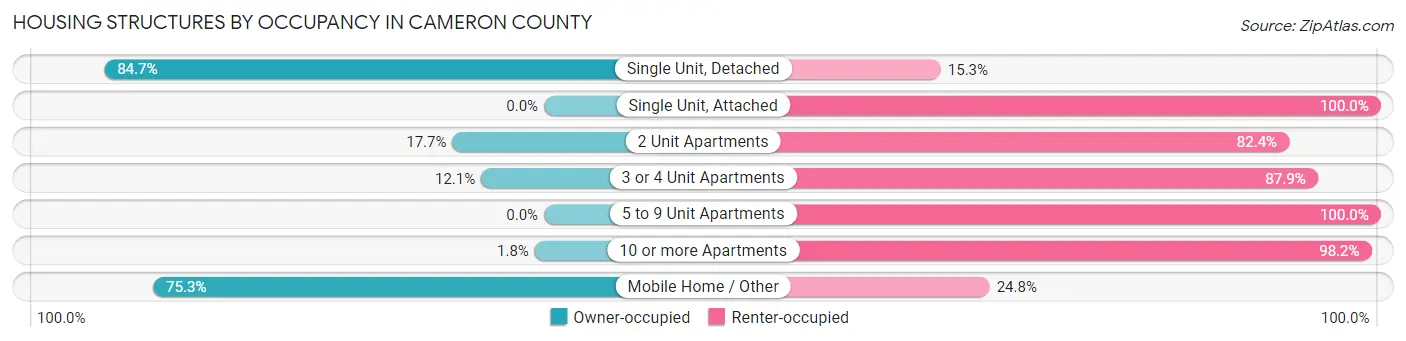
| Structure Type | Owner-occupied | Renter-occupied |
| Single Unit, Detached | 1,391 (84.7%) | 252 (15.3%) |
| Single Unit, Attached | 0 (0.0%) | 15 (100.0%) |
| 2 Unit Apartments | 24 (17.6%) | 112 (82.4%) |
| 3 or 4 Unit Apartments | 8 (12.1%) | 58 (87.9%) |
| 5 to 9 Unit Apartments | 0 (0.0%) | 36 (100.0%) |
| 10 or more Apartments | 2 (1.8%) | 110 (98.2%) |
| Mobile Home / Other | 152 (75.2%) | 50 (24.7%) |
| Total | 1,577 (71.4%) | 633 (28.6%) |
Housing Structures by Number of Rooms in Cameron County
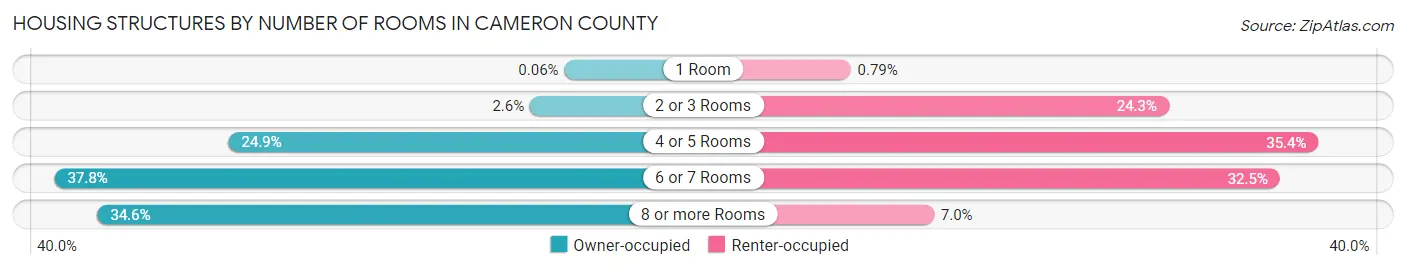
| Number of Rooms | Owner-occupied | Renter-occupied |
| 1 Room | 1 (0.1%) | 5 (0.8%) |
| 2 or 3 Rooms | 41 (2.6%) | 154 (24.3%) |
| 4 or 5 Rooms | 393 (24.9%) | 224 (35.4%) |
| 6 or 7 Rooms | 596 (37.8%) | 206 (32.5%) |
| 8 or more Rooms | 546 (34.6%) | 44 (7.0%) |
| Total | 1,577 (100.0%) | 633 (100.0%) |
Housing Structure by Heating Type in Cameron County
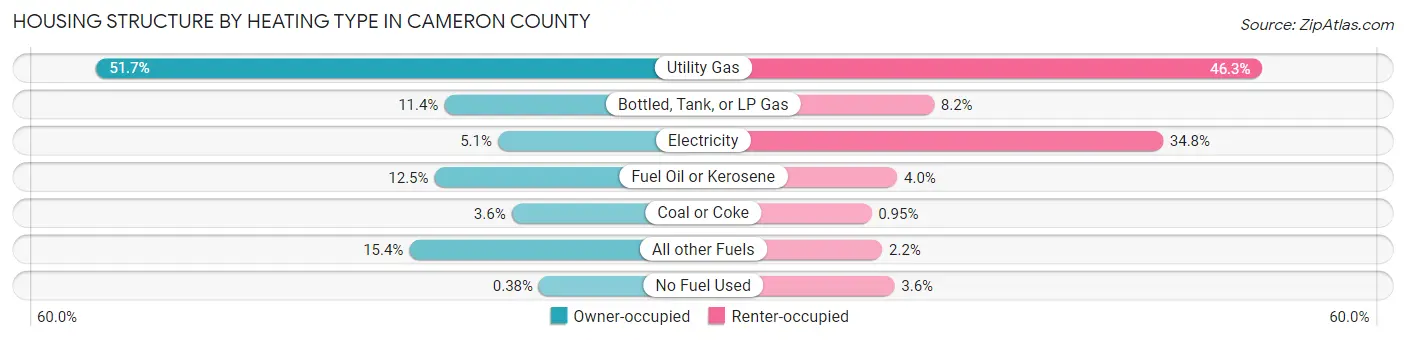
| Heating Type | Owner-occupied | Renter-occupied |
| Utility Gas | 815 (51.7%) | 293 (46.3%) |
| Bottled, Tank, or LP Gas | 179 (11.4%) | 52 (8.2%) |
| Electricity | 81 (5.1%) | 220 (34.8%) |
| Fuel Oil or Kerosene | 197 (12.5%) | 25 (4.0%) |
| Coal or Coke | 56 (3.5%) | 6 (0.9%) |
| All other Fuels | 243 (15.4%) | 14 (2.2%) |
| No Fuel Used | 6 (0.4%) | 23 (3.6%) |
| Total | 1,577 (100.0%) | 633 (100.0%) |
Household Vehicle Usage in Cameron County
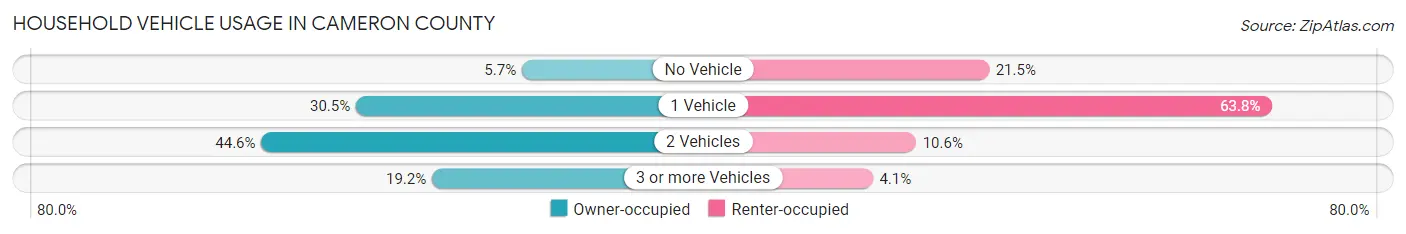
| Vehicles per Household | Owner-occupied | Renter-occupied |
| No Vehicle | 90 (5.7%) | 136 (21.5%) |
| 1 Vehicle | 481 (30.5%) | 404 (63.8%) |
| 2 Vehicles | 704 (44.6%) | 67 (10.6%) |
| 3 or more Vehicles | 302 (19.2%) | 26 (4.1%) |
| Total | 1,577 (100.0%) | 633 (100.0%) |
Real Estate & Mortgages in Cameron County
Real Estate and Mortgage Overview in Cameron County
| Characteristic | Without Mortgage | With Mortgage |
| Housing Units | 977 | 600 |
| Median Property Value | $84,400 | $89,200 |
| Median Household Income | $53,631 | $37 |
| Monthly Housing Costs | $451 | $9 |
| Real Estate Taxes | $1,338 | $12 |
Property Value by Mortgage Status in Cameron County
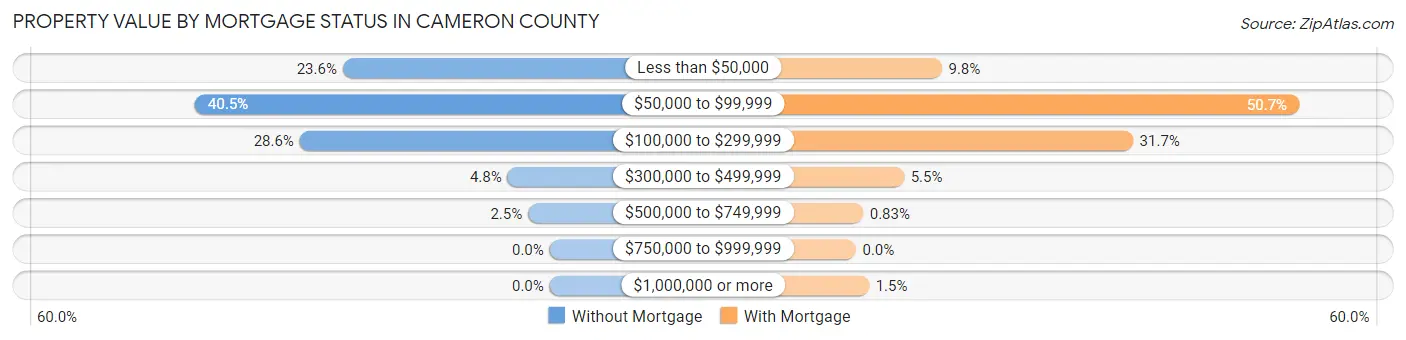
| Property Value | Without Mortgage | With Mortgage |
| Less than $50,000 | 231 (23.6%) | 59 (9.8%) |
| $50,000 to $99,999 | 396 (40.5%) | 304 (50.7%) |
| $100,000 to $299,999 | 279 (28.6%) | 190 (31.7%) |
| $300,000 to $499,999 | 47 (4.8%) | 33 (5.5%) |
| $500,000 to $749,999 | 24 (2.5%) | 5 (0.8%) |
| $750,000 to $999,999 | 0 (0.0%) | 0 (0.0%) |
| $1,000,000 or more | 0 (0.0%) | 9 (1.5%) |
| Total | 977 (100.0%) | 600 (100.0%) |
Household Income by Mortgage Status in Cameron County
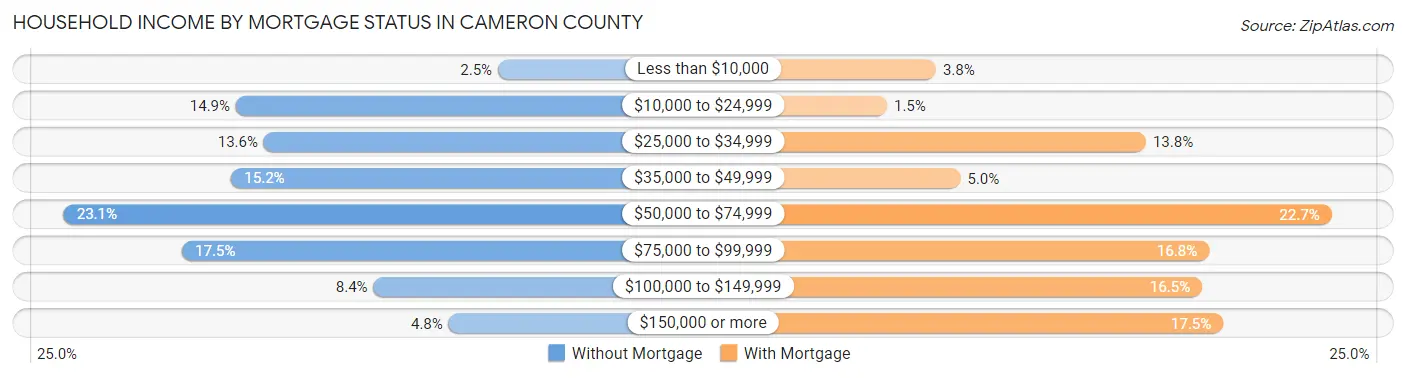
| Household Income | Without Mortgage | With Mortgage |
| Less than $10,000 | 24 (2.5%) | 23 (3.8%) |
| $10,000 to $24,999 | 146 (14.9%) | 9 (1.5%) |
| $25,000 to $34,999 | 133 (13.6%) | 83 (13.8%) |
| $35,000 to $49,999 | 148 (15.1%) | 30 (5.0%) |
| $50,000 to $74,999 | 226 (23.1%) | 136 (22.7%) |
| $75,000 to $99,999 | 171 (17.5%) | 101 (16.8%) |
| $100,000 to $149,999 | 82 (8.4%) | 99 (16.5%) |
| $150,000 or more | 47 (4.8%) | 105 (17.5%) |
| Total | 977 (100.0%) | 600 (100.0%) |
Property Value to Household Income Ratio in Cameron County
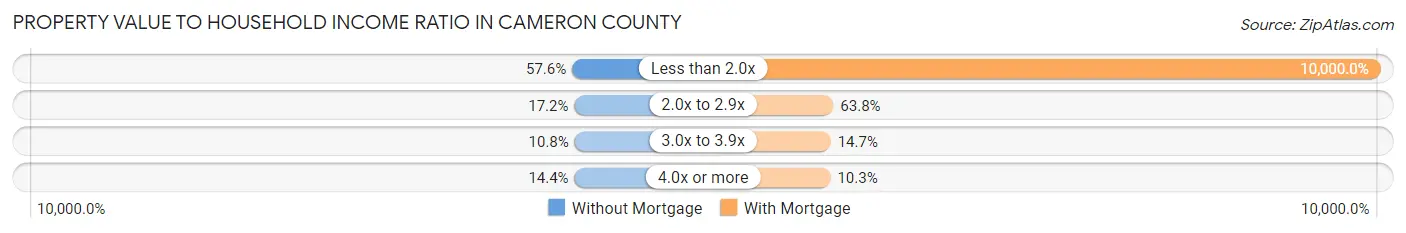
| Value-to-Income Ratio | Without Mortgage | With Mortgage |
| Less than 2.0x | 563 (57.6%) | 60,000 (10,000.0%) |
| 2.0x to 2.9x | 168 (17.2%) | 383 (63.8%) |
| 3.0x to 3.9x | 105 (10.7%) | 88 (14.7%) |
| 4.0x or more | 141 (14.4%) | 62 (10.3%) |
| Total | 977 (100.0%) | 600 (100.0%) |
Real Estate Taxes by Mortgage Status in Cameron County
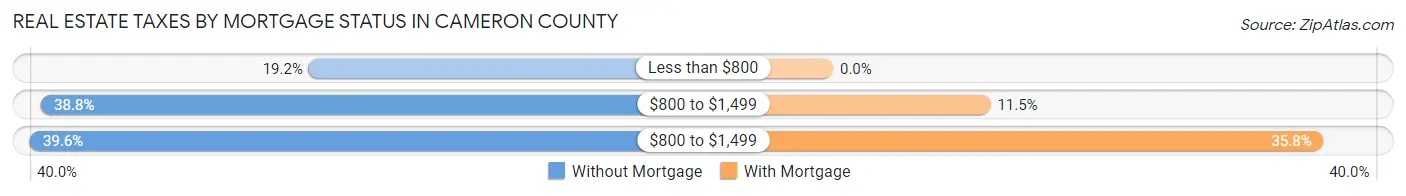
| Property Taxes | Without Mortgage | With Mortgage |
| Less than $800 | 188 (19.2%) | 0 (0.0%) |
| $800 to $1,499 | 379 (38.8%) | 69 (11.5%) |
| $800 to $1,499 | 387 (39.6%) | 215 (35.8%) |
| Total | 977 (100.0%) | 600 (100.0%) |
Health & Disability in Cameron County
Health Insurance Coverage by Age in Cameron County
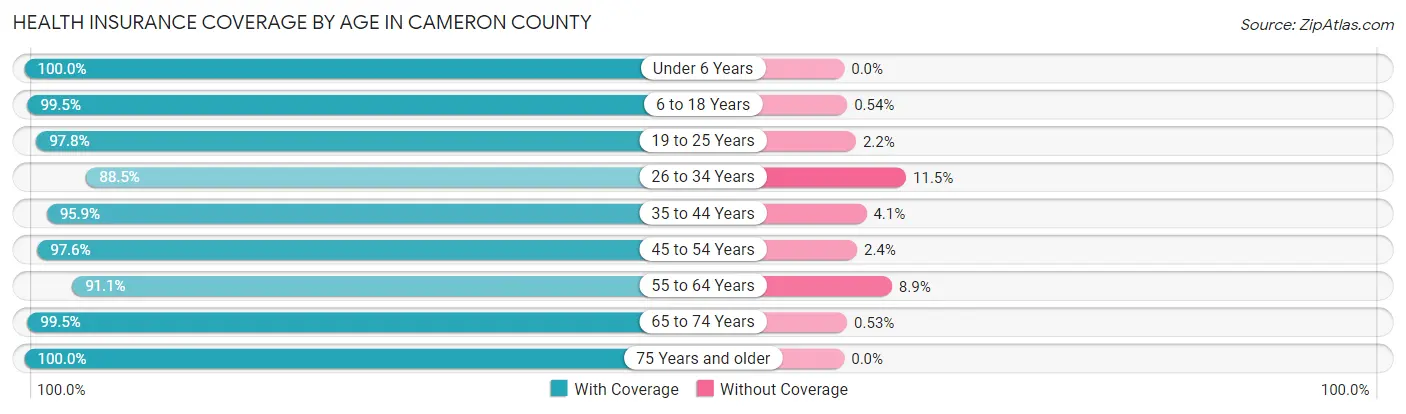
| Age Bracket | With Coverage | Without Coverage |
| Under 6 Years | 301 (100.0%) | 0 (0.0%) |
| 6 to 18 Years | 548 (99.5%) | 3 (0.5%) |
| 19 to 25 Years | 269 (97.8%) | 6 (2.2%) |
| 26 to 34 Years | 284 (88.5%) | 37 (11.5%) |
| 35 to 44 Years | 441 (95.9%) | 19 (4.1%) |
| 45 to 54 Years | 533 (97.6%) | 13 (2.4%) |
| 55 to 64 Years | 729 (91.1%) | 71 (8.9%) |
| 65 to 74 Years | 745 (99.5%) | 4 (0.5%) |
| 75 Years and older | 498 (100.0%) | 0 (0.0%) |
| Total | 4,348 (96.6%) | 153 (3.4%) |
Health Insurance Coverage by Citizenship Status in Cameron County
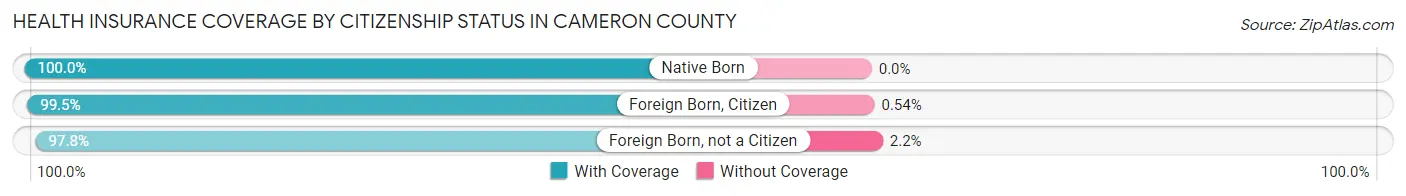
| Citizenship Status | With Coverage | Without Coverage |
| Native Born | 301 (100.0%) | 0 (0.0%) |
| Foreign Born, Citizen | 548 (99.5%) | 3 (0.5%) |
| Foreign Born, not a Citizen | 269 (97.8%) | 6 (2.2%) |
Health Insurance Coverage by Household Income in Cameron County
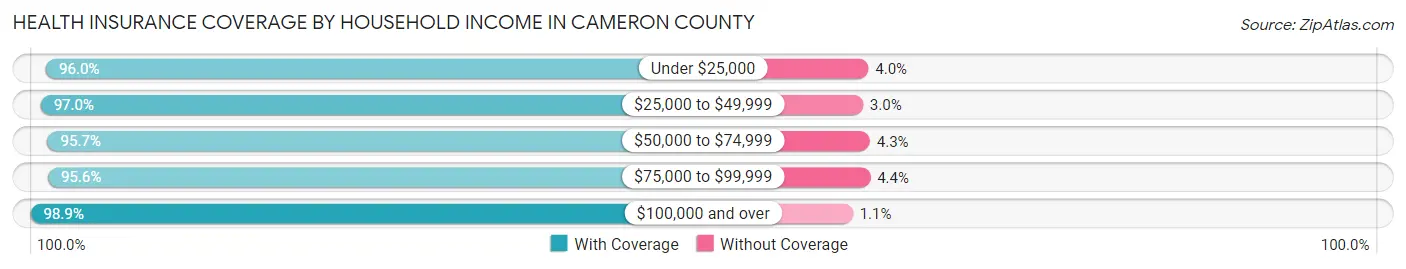
| Household Income | With Coverage | Without Coverage |
| Under $25,000 | 784 (96.0%) | 33 (4.0%) |
| $25,000 to $49,999 | 1,156 (97.0%) | 36 (3.0%) |
| $50,000 to $74,999 | 974 (95.7%) | 44 (4.3%) |
| $75,000 to $99,999 | 697 (95.6%) | 32 (4.4%) |
| $100,000 and over | 714 (98.9%) | 8 (1.1%) |
Public vs Private Health Insurance Coverage by Age in Cameron County
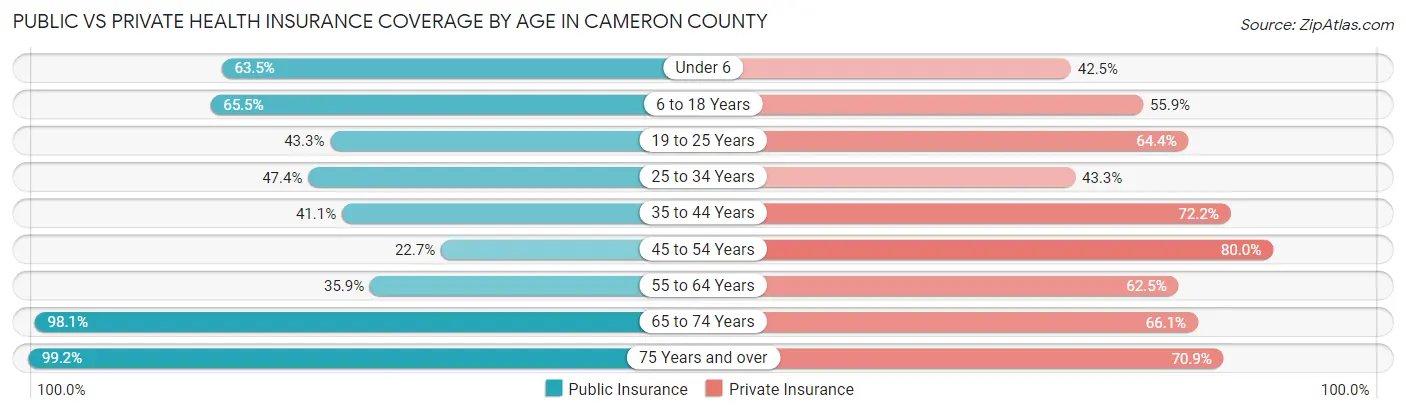
| Age Bracket | Public Insurance | Private Insurance |
| Under 6 | 191 (63.5%) | 128 (42.5%) |
| 6 to 18 Years | 361 (65.5%) | 308 (55.9%) |
| 19 to 25 Years | 119 (43.3%) | 177 (64.4%) |
| 25 to 34 Years | 152 (47.3%) | 139 (43.3%) |
| 35 to 44 Years | 189 (41.1%) | 332 (72.2%) |
| 45 to 54 Years | 124 (22.7%) | 437 (80.0%) |
| 55 to 64 Years | 287 (35.9%) | 500 (62.5%) |
| 65 to 74 Years | 735 (98.1%) | 495 (66.1%) |
| 75 Years and over | 494 (99.2%) | 353 (70.9%) |
| Total | 2,652 (58.9%) | 2,869 (63.7%) |
Disability Status by Sex by Age in Cameron County
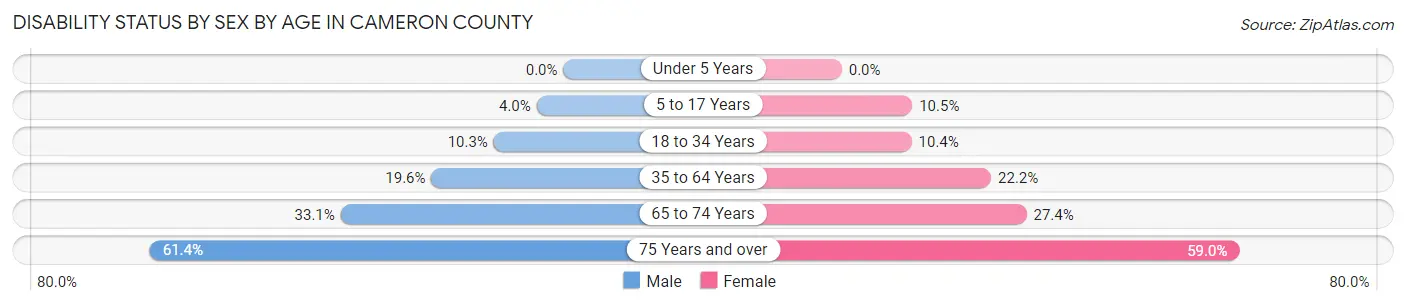
| Age Bracket | Male | Female |
| Under 5 Years | 0 (0.0%) | 0 (0.0%) |
| 5 to 17 Years | 11 (4.0%) | 32 (10.5%) |
| 18 to 34 Years | 33 (10.3%) | 36 (10.4%) |
| 35 to 64 Years | 186 (19.6%) | 190 (22.2%) |
| 65 to 74 Years | 132 (33.1%) | 96 (27.4%) |
| 75 Years and over | 132 (61.4%) | 167 (59.0%) |
Disability Class by Sex by Age in Cameron County
Disability Class: Hearing Difficulty
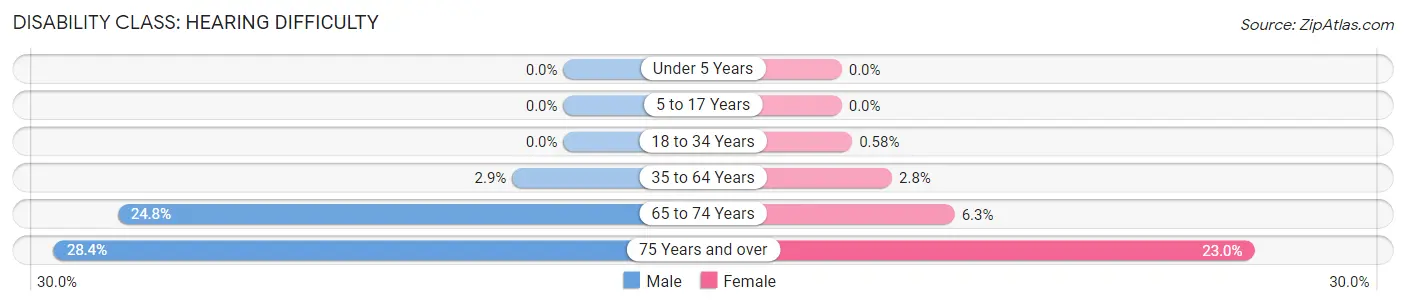
| Age Bracket | Male | Female |
| Under 5 Years | 0 (0.0%) | 0 (0.0%) |
| 5 to 17 Years | 0 (0.0%) | 0 (0.0%) |
| 18 to 34 Years | 0 (0.0%) | 2 (0.6%) |
| 35 to 64 Years | 27 (2.9%) | 24 (2.8%) |
| 65 to 74 Years | 99 (24.8%) | 22 (6.3%) |
| 75 Years and over | 61 (28.4%) | 65 (23.0%) |
Disability Class: Vision Difficulty
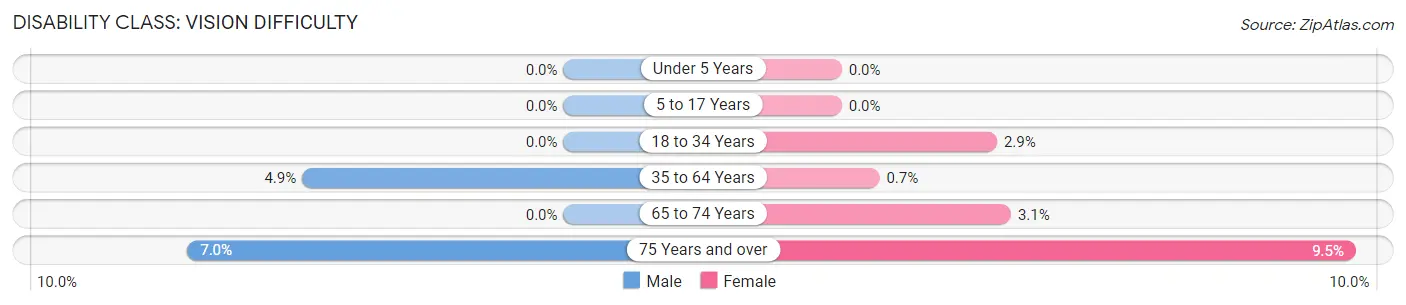
| Age Bracket | Male | Female |
| Under 5 Years | 0 (0.0%) | 0 (0.0%) |
| 5 to 17 Years | 0 (0.0%) | 0 (0.0%) |
| 18 to 34 Years | 0 (0.0%) | 10 (2.9%) |
| 35 to 64 Years | 46 (4.9%) | 6 (0.7%) |
| 65 to 74 Years | 0 (0.0%) | 11 (3.1%) |
| 75 Years and over | 15 (7.0%) | 27 (9.5%) |
Disability Class: Cognitive Difficulty
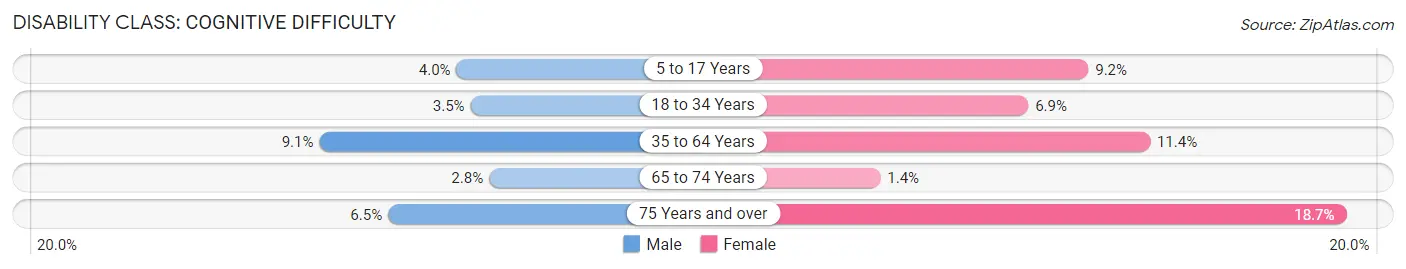
| Age Bracket | Male | Female |
| 5 to 17 Years | 11 (4.0%) | 28 (9.1%) |
| 18 to 34 Years | 11 (3.5%) | 24 (6.9%) |
| 35 to 64 Years | 86 (9.1%) | 98 (11.4%) |
| 65 to 74 Years | 11 (2.8%) | 5 (1.4%) |
| 75 Years and over | 14 (6.5%) | 53 (18.7%) |
Disability Class: Ambulatory Difficulty
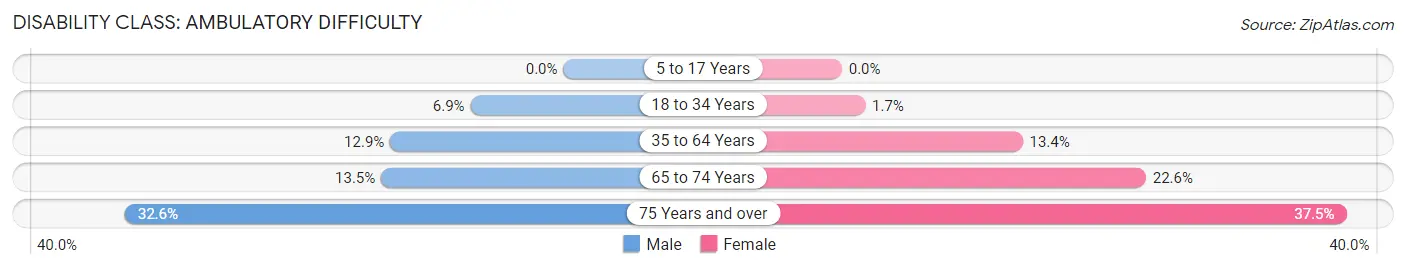
| Age Bracket | Male | Female |
| 5 to 17 Years | 0 (0.0%) | 0 (0.0%) |
| 18 to 34 Years | 22 (6.9%) | 6 (1.7%) |
| 35 to 64 Years | 122 (12.9%) | 115 (13.4%) |
| 65 to 74 Years | 54 (13.5%) | 79 (22.6%) |
| 75 Years and over | 70 (32.6%) | 106 (37.5%) |
Disability Class: Self-Care Difficulty
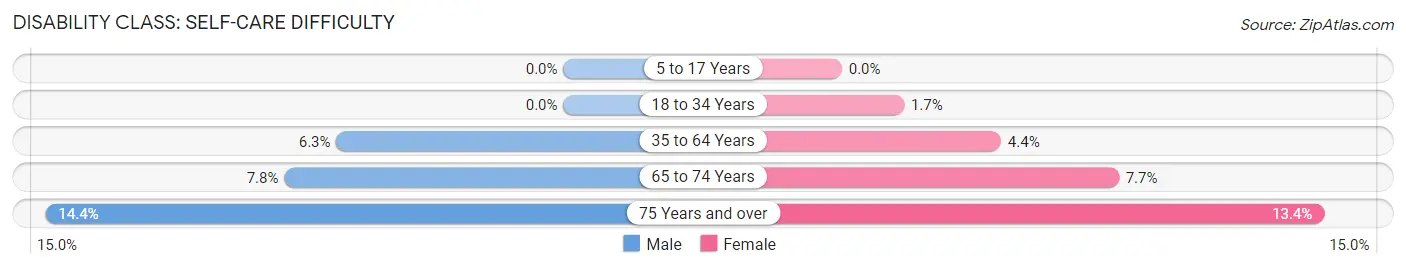
| Age Bracket | Male | Female |
| 5 to 17 Years | 0 (0.0%) | 0 (0.0%) |
| 18 to 34 Years | 0 (0.0%) | 6 (1.7%) |
| 35 to 64 Years | 60 (6.3%) | 38 (4.4%) |
| 65 to 74 Years | 31 (7.8%) | 27 (7.7%) |
| 75 Years and over | 31 (14.4%) | 38 (13.4%) |
Technology Access in Cameron County
Computing Device Access in Cameron County
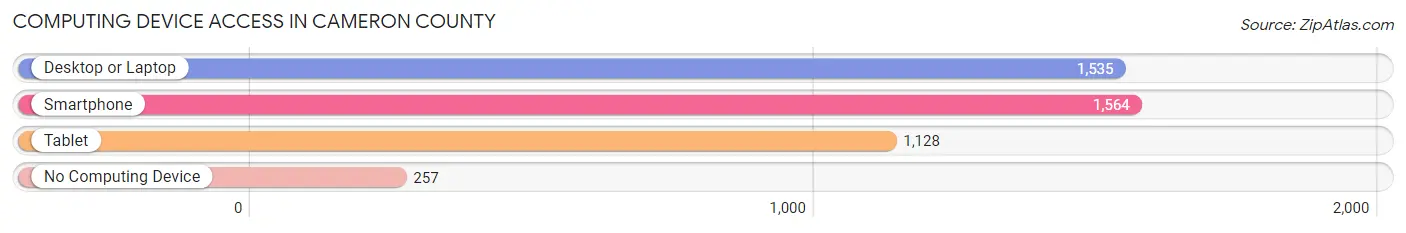
| Device Type | # Households | % Households |
| Desktop or Laptop | 1,535 | 69.5% |
| Smartphone | 1,564 | 70.8% |
| Tablet | 1,128 | 51.0% |
| No Computing Device | 257 | 11.6% |
| Total | 2,210 | 100.0% |
Internet Access in Cameron County
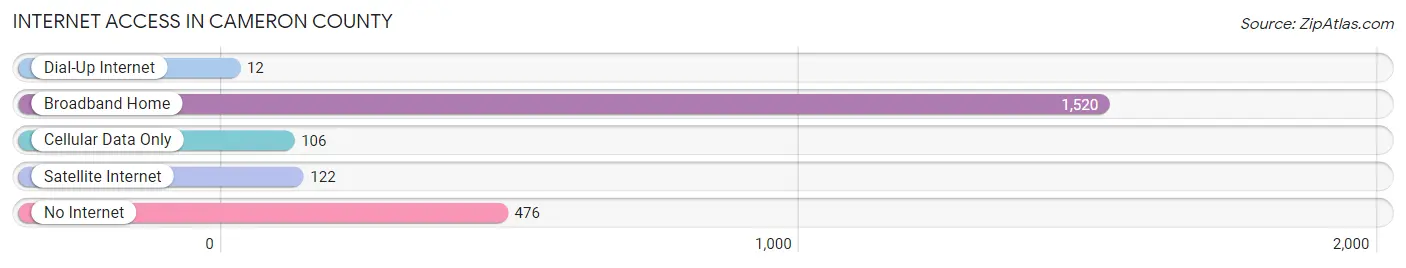
| Internet Type | # Households | % Households |
| Dial-Up Internet | 12 | 0.5% |
| Broadband Home | 1,520 | 68.8% |
| Cellular Data Only | 106 | 4.8% |
| Satellite Internet | 122 | 5.5% |
| No Internet | 476 | 21.5% |
| Total | 2,210 | 100.0% |
Cameron County Summary
Cameron County is a county located in the U.S. state of Pennsylvania. As of the 2010 census, the population was 5,085, making it the least populous county in the state. The county seat is Emporium. The county was created on March 29, 1860, from parts of Clinton, Elk, McKean, and Potter Counties and is named for Senator Simon Cameron.
Geography
Cameron County is located in the northwest corner of Pennsylvania, bordered by the state of New York to the north, Potter County to the east, McKean County to the south, and Elk County to the west. The county has a total area of 437 square miles, of which 434 square miles is land and 3.2 square miles (0.7%) is water.
The county is located in the Allegheny Plateau region of Pennsylvania. The terrain is generally rolling hills, with the highest point being 2,890 feet above sea level at the summit of Little Mountain. The county is drained by the Sinnemahoning Creek and its tributaries, which flow southward into the West Branch Susquehanna River.
Demographics
As of the 2010 census, there were 5,085 people, 2,093 households, and 1,395 families residing in the county. The population density was 11.7 people per square mile. There were 2,817 housing units at an average density of 6.5 per square mile. The racial makeup of the county was 97.7% White, 0.5% Black or African American, 0.2% Native American, 0.2% Asian, 0.1% Pacific Islander, 0.3% from other races, and 1.0% from two or more races. 1.2% of the population were Hispanic or Latino of any race.
There were 2,093 households, out of which 28.2% had children under the age of 18 living with them, 53.2% were married couples living together, 9.2% had a female householder with no husband present, and 33.2% were non-families. 29.2% of all households were made up of individuals, and 14.2% had someone living alone who was 65 years of age or older. The average household size was 2.37 and the average family size was 2.90.
The median age in the county was 44.3 years. 22.2% of residents were under the age of 18; 6.7% were between the ages of 18 and 24; 22.7% were from 25 to 44; 29.2% were from 45 to 64; and 19.2% were 65 years of age or older. The gender makeup of the county was 48.7% male and 51.3% female.
Economy
Cameron County is a rural county with a largely agricultural economy. The county is home to several small farms, as well as a few larger operations. The county is also home to several small businesses, including a few restaurants, convenience stores, and other retail establishments.
The county is also home to several natural gas and oil wells, as well as a few coal mines. The county is also home to several state parks, including Sinnemahoning State Park, which offers camping, fishing, and other outdoor activities.
The county is served by the Cameron County Airport, which offers general aviation services. The county is also served by several bus lines, including the Cameron County Transit Authority, which provides public transportation throughout the county.
Conclusion
Cameron County is a rural county located in the northwest corner of Pennsylvania. The county has a population of 5,085, making it the least populous county in the state. The county has a largely agricultural economy, with several small farms and businesses. The county is also home to several natural gas and oil wells, as well as a few coal mines. The county is served by the Cameron County Airport and several bus lines, including the Cameron County Transit Authority.
Common Questions
What is Per Capita Income in Cameron County?
Per Capita income in Cameron County is $27,426.
What is the Median Family Income in Cameron County?
Median Family Income in Cameron County is $57,064.
What is the Median Household income in Cameron County?
Median Household Income in Cameron County is $46,186.
What is Income or Wage Gap in Cameron County?
Income or Wage Gap in Cameron County is 28.7%.
Women in Cameron County earn 71.3 cents for every dollar earned by a man.
What is Family Income Deficit in Cameron County?
Family Income Deficit in Cameron County is $7,648.
Families that are below poverty line in Cameron County earn $7,648 less on average than the poverty threshold level.
What is Inequality or Gini Index in Cameron County?
Inequality or Gini Index in Cameron County is 0.41.
What is the Total Population of Cameron County?
Total Population of Cameron County is 4,536.
What is the Total Male Population of Cameron County?
Total Male Population of Cameron County is 2,280.
What is the Total Female Population of Cameron County?
Total Female Population of Cameron County is 2,256.
What is the Ratio of Males per 100 Females in Cameron County?
There are 101.06 Males per 100 Females in Cameron County.
What is the Ratio of Females per 100 Males in Cameron County?
There are 98.95 Females per 100 Males in Cameron County.
What is the Median Population Age in Cameron County?
Median Population Age in Cameron County is 51.8 Years.
What is the Average Family Size in Cameron County
Average Family Size in Cameron County is 2.5 People.
What is the Average Household Size in Cameron County
Average Household Size in Cameron County is 2.0 People.
How Large is the Labor Force in Cameron County?
There are 1,949 People in the Labor Forcein in Cameron County.
What is the Percentage of People in the Labor Force in Cameron County?
51.0% of People are in the Labor Force in Cameron County.
What is the Unemployment Rate in Cameron County?
Unemployment Rate in Cameron County is 7.1%.