Cambria County, PA Map & Demographics
Cambria County Map
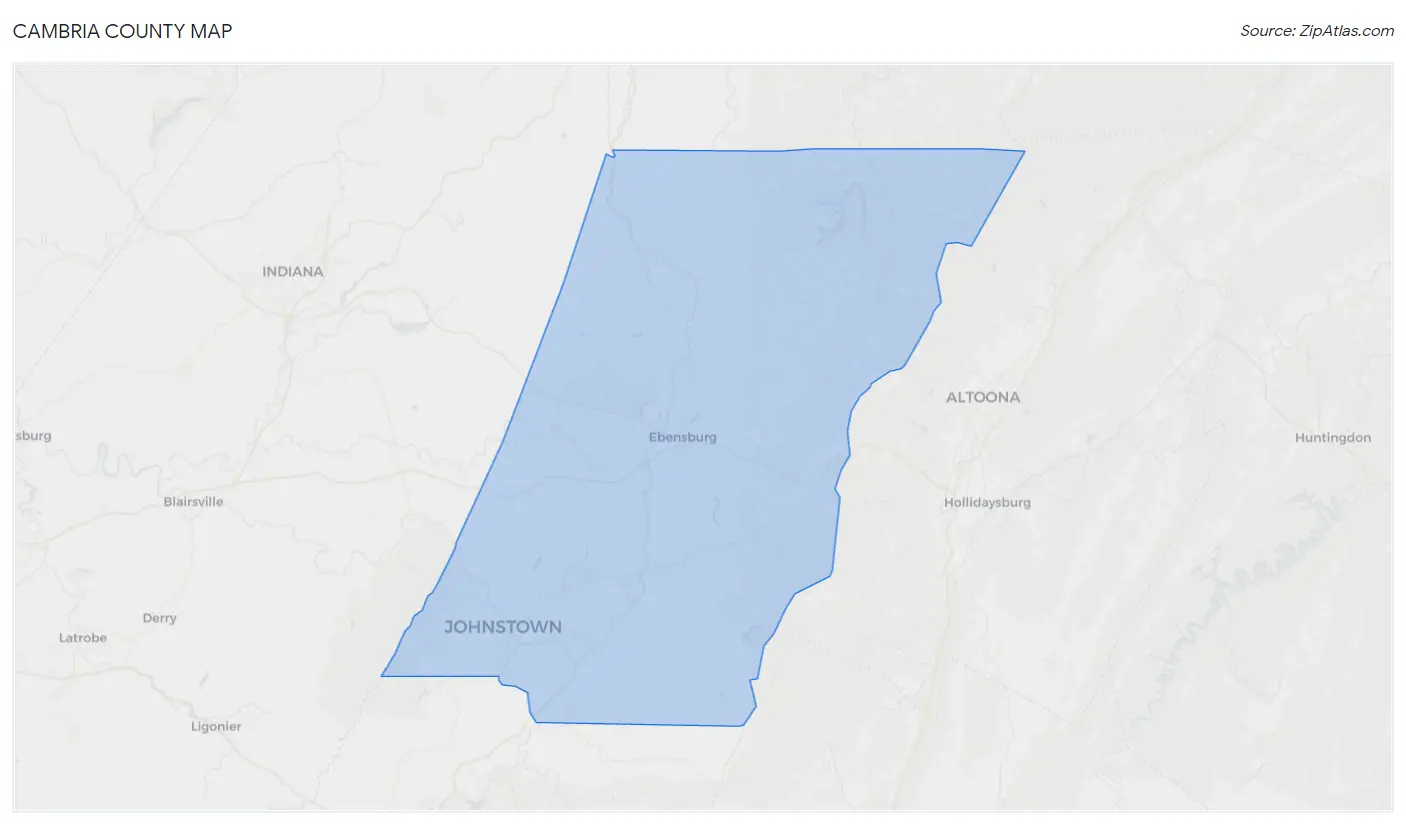
Cambria County Overview
$31,532
PER CAPITA INCOME
$75,939
AVG FAMILY INCOME
$54,221
AVG HOUSEHOLD INCOME
28.8%
WAGE / INCOME GAP [ % ]
71.2¢/ $1
WAGE / INCOME GAP [ $ ]
$11,013
FAMILY INCOME DEFICIT
0.45
INEQUALITY / GINI INDEX
133,263
TOTAL POPULATION
66,411
MALE POPULATION
66,852
FEMALE POPULATION
99.34
MALES / 100 FEMALES
100.66
FEMALES / 100 MALES
45.6
MEDIAN AGE
2.9
AVG FAMILY SIZE
2.3
AVG HOUSEHOLD SIZE
60,910
LABOR FORCE [ PEOPLE ]
54.8%
PERCENT IN LABOR FORCE
5.0%
UNEMPLOYMENT RATE
Cambria County Area Codes
Income in Cambria County
Income Overview in Cambria County
Per Capita Income in Cambria County is $31,532, while median incomes of families and households are $75,939 and $54,221 respectively.
| Characteristic | Number | Measure |
| Per Capita Income | 133,263 | $31,532 |
| Median Family Income | 33,602 | $75,939 |
| Mean Family Income | 33,602 | $91,072 |
| Median Household Income | 55,541 | $54,221 |
| Mean Household Income | 55,541 | $72,815 |
| Income Deficit | 33,602 | $11,013 |
| Wage / Income Gap (%) | 133,263 | 28.78% |
| Wage / Income Gap ($) | 133,263 | 71.22¢ per $1 |
| Gini / Inequality Index | 133,263 | 0.45 |
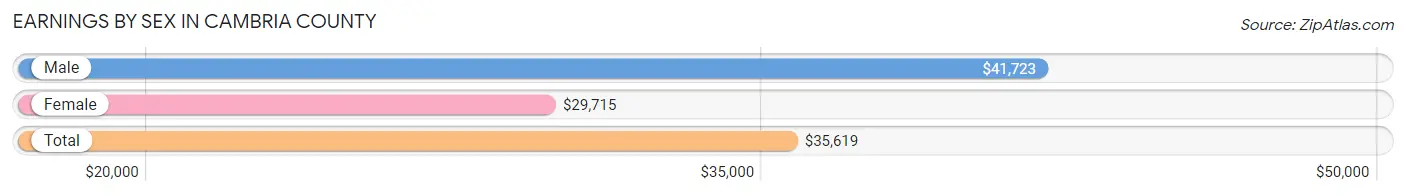
Earnings by Sex in Cambria County
Average Earnings in Cambria County are $35,619, $41,723 for men and $29,715 for women, a difference of 28.8%.
| Sex | Number | Average Earnings |
| Male | 34,242 (52.5%) | $41,723 |
| Female | 30,992 (47.5%) | $29,715 |
| Total | 65,234 (100.0%) | $35,619 |
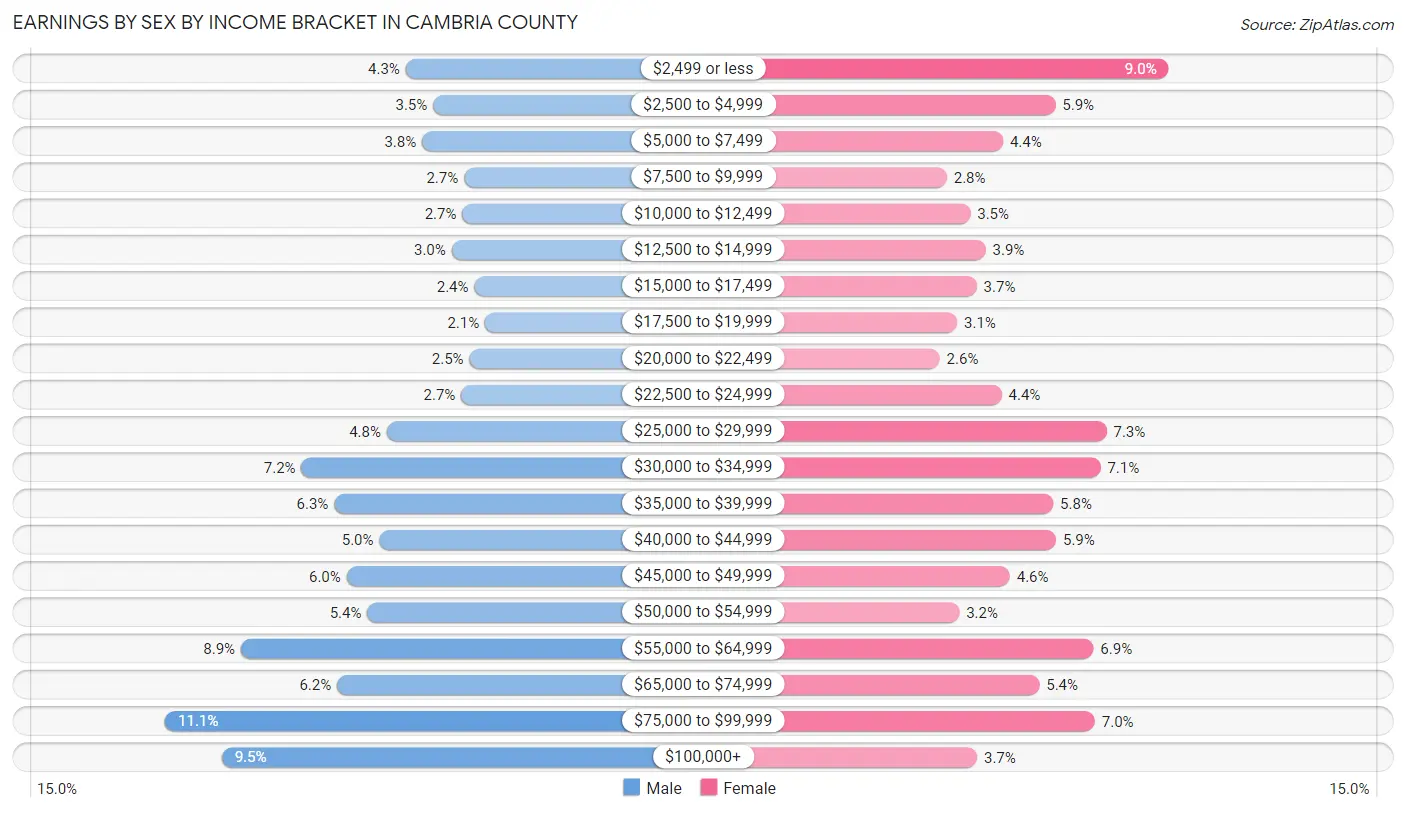
Earnings by Sex by Income Bracket in Cambria County
The most common earnings brackets in Cambria County are $75,000 to $99,999 for men (3,783 | 11.1%) and $2,499 or less for women (2,802 | 9.0%).
| Income | Male | Female |
| $2,499 or less | 1,468 (4.3%) | 2,802 (9.0%) |
| $2,500 to $4,999 | 1,207 (3.5%) | 1,815 (5.9%) |
| $5,000 to $7,499 | 1,312 (3.8%) | 1,360 (4.4%) |
| $7,500 to $9,999 | 909 (2.6%) | 871 (2.8%) |
| $10,000 to $12,499 | 926 (2.7%) | 1,076 (3.5%) |
| $12,500 to $14,999 | 1,027 (3.0%) | 1,209 (3.9%) |
| $15,000 to $17,499 | 809 (2.4%) | 1,131 (3.6%) |
| $17,500 to $19,999 | 704 (2.1%) | 962 (3.1%) |
| $20,000 to $22,499 | 856 (2.5%) | 809 (2.6%) |
| $22,500 to $24,999 | 936 (2.7%) | 1,347 (4.3%) |
| $25,000 to $29,999 | 1,650 (4.8%) | 2,263 (7.3%) |
| $30,000 to $34,999 | 2,472 (7.2%) | 2,211 (7.1%) |
| $35,000 to $39,999 | 2,158 (6.3%) | 1,797 (5.8%) |
| $40,000 to $44,999 | 1,723 (5.0%) | 1,822 (5.9%) |
| $45,000 to $49,999 | 2,038 (5.9%) | 1,419 (4.6%) |
| $50,000 to $54,999 | 1,838 (5.4%) | 978 (3.2%) |
| $55,000 to $64,999 | 3,056 (8.9%) | 2,148 (6.9%) |
| $65,000 to $74,999 | 2,130 (6.2%) | 1,677 (5.4%) |
| $75,000 to $99,999 | 3,783 (11.1%) | 2,160 (7.0%) |
| $100,000+ | 3,240 (9.5%) | 1,135 (3.7%) |
| Total | 34,242 (100.0%) | 30,992 (100.0%) |
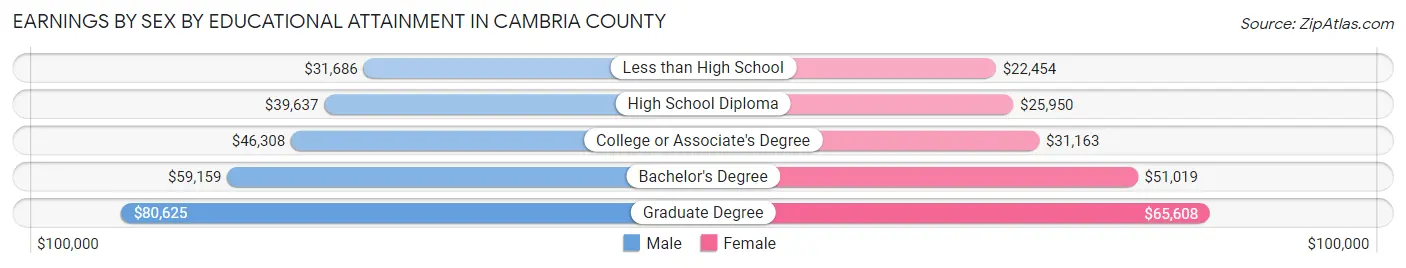
Earnings by Sex by Educational Attainment in Cambria County
Average earnings in Cambria County are $46,717 for men and $34,562 for women, a difference of 26.0%. Men with an educational attainment of graduate degree enjoy the highest average annual earnings of $80,625, while those with less than high school education earn the least with $31,686. Women with an educational attainment of graduate degree earn the most with the average annual earnings of $65,608, while those with less than high school education have the smallest earnings of $22,454.
| Educational Attainment | Male Income | Female Income |
| Less than High School | $31,686 | $22,454 |
| High School Diploma | $39,637 | $25,950 |
| College or Associate's Degree | $46,308 | $31,163 |
| Bachelor's Degree | $59,159 | $51,019 |
| Graduate Degree | $80,625 | $65,608 |
| Total | $46,717 | $34,562 |
Family Income in Cambria County
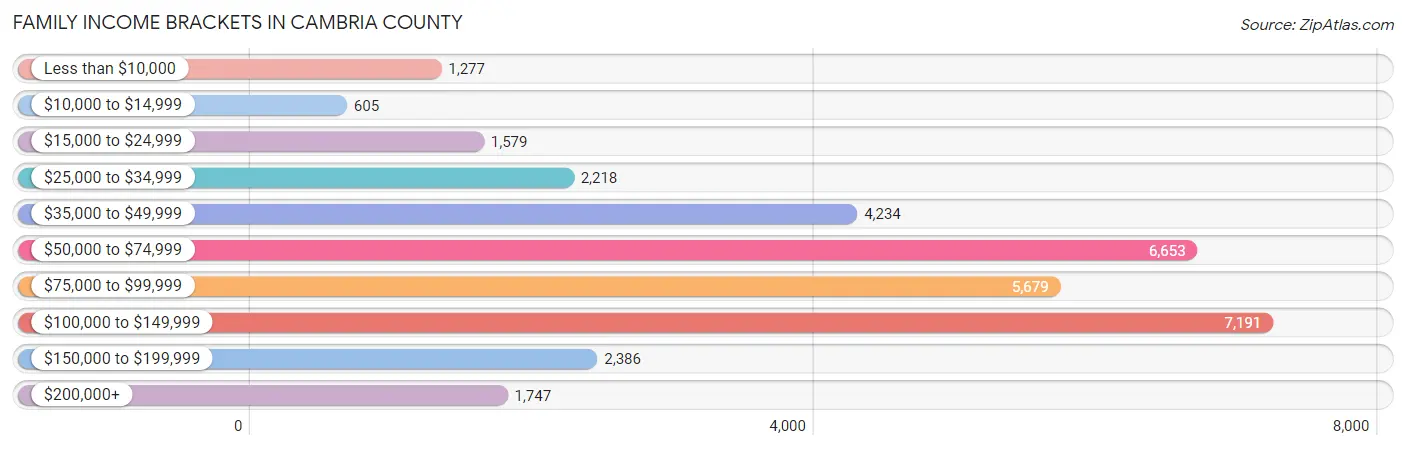
Family Income Brackets in Cambria County
According to the Cambria County family income data, there are 7,191 families falling into the $100,000 to $149,999 income range, which is the most common income bracket and makes up 21.4% of all families. Conversely, the $10,000 to $14,999 income bracket is the least frequent group with only 605 families (1.8%) belonging to this category.
| Income Bracket | # Families | % Families |
| Less than $10,000 | 1,277 | 3.8% |
| $10,000 to $14,999 | 605 | 1.8% |
| $15,000 to $24,999 | 1,579 | 4.7% |
| $25,000 to $34,999 | 2,218 | 6.6% |
| $35,000 to $49,999 | 4,234 | 12.6% |
| $50,000 to $74,999 | 6,653 | 19.8% |
| $75,000 to $99,999 | 5,679 | 16.9% |
| $100,000 to $149,999 | 7,191 | 21.4% |
| $150,000 to $199,999 | 2,386 | 7.1% |
| $200,000+ | 1,747 | 5.2% |
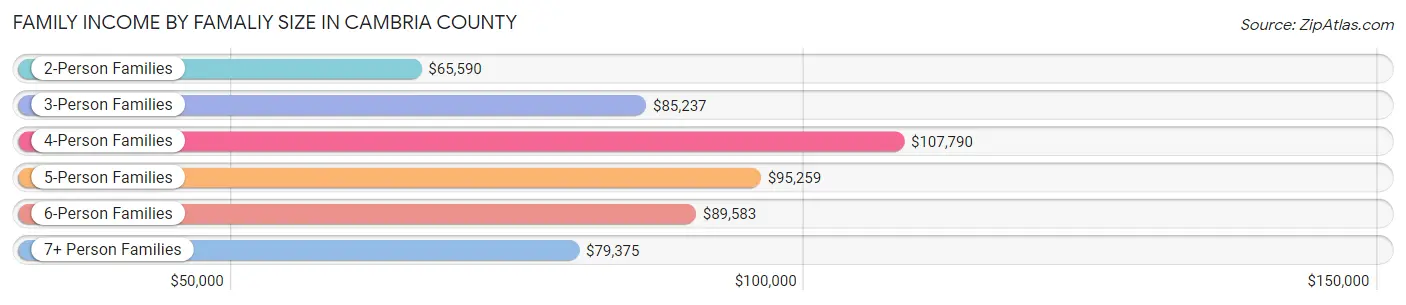
Family Income by Famaliy Size in Cambria County
4-person families (4,712 | 14.0%) account for the highest median family income in Cambria County with $107,790 per family, while 2-person families (18,618 | 55.4%) have the highest median income of $32,795 per family member.
| Income Bracket | # Families | Median Income |
| 2-Person Families | 18,618 (55.4%) | $65,590 |
| 3-Person Families | 7,187 (21.4%) | $85,237 |
| 4-Person Families | 4,712 (14.0%) | $107,790 |
| 5-Person Families | 2,191 (6.5%) | $95,259 |
| 6-Person Families | 587 (1.8%) | $89,583 |
| 7+ Person Families | 307 (0.9%) | $79,375 |
| Total | 33,602 (100.0%) | $75,939 |
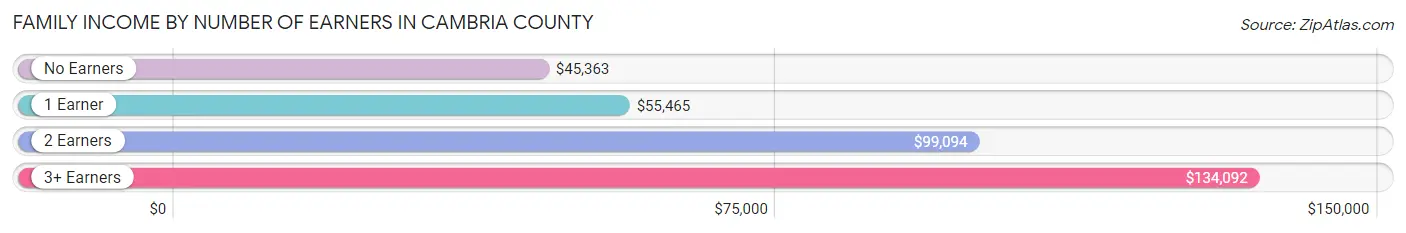
Family Income by Number of Earners in Cambria County
The median family income in Cambria County is $75,939, with families comprising 3+ earners (3,375) having the highest median family income of $134,092, while families with no earners (7,200) have the lowest median family income of $45,363, accounting for 10.0% and 21.4% of families, respectively.
| Number of Earners | # Families | Median Income |
| No Earners | 7,200 (21.4%) | $45,363 |
| 1 Earner | 10,320 (30.7%) | $55,465 |
| 2 Earners | 12,707 (37.8%) | $99,094 |
| 3+ Earners | 3,375 (10.0%) | $134,092 |
| Total | 33,602 (100.0%) | $75,939 |
Household Income in Cambria County
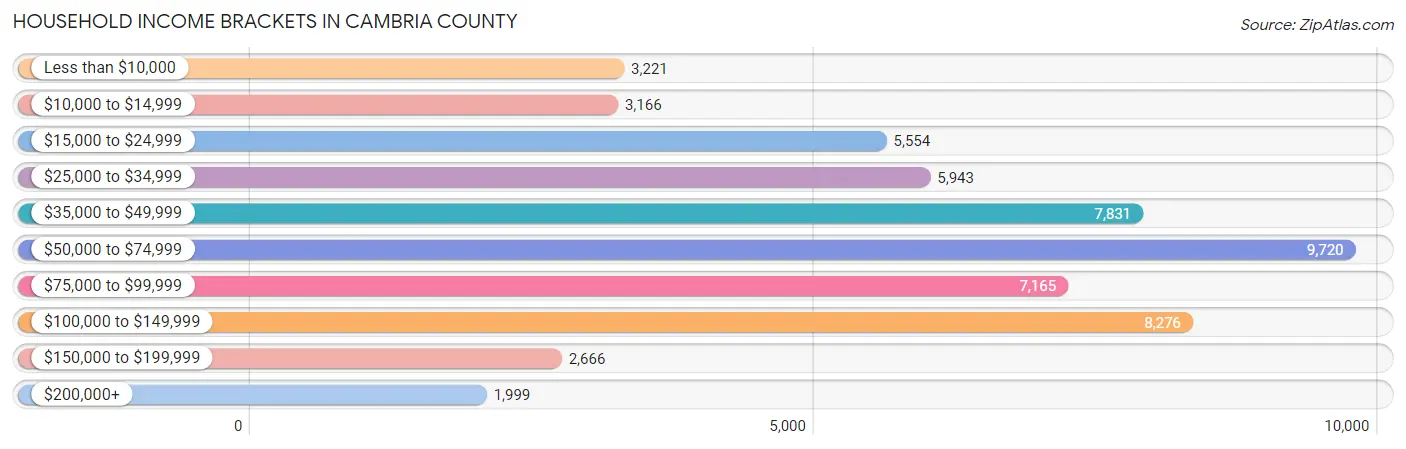
Household Income Brackets in Cambria County
With 9,720 households falling in the category, the $50,000 to $74,999 income range is the most frequent in Cambria County, accounting for 17.5% of all households. In contrast, only 1,999 households (3.6%) fall into the $200,000+ income bracket, making it the least populous group.
| Income Bracket | # Households | % Households |
| Less than $10,000 | 3,221 | 5.8% |
| $10,000 to $14,999 | 3,166 | 5.7% |
| $15,000 to $24,999 | 5,554 | 10.0% |
| $25,000 to $34,999 | 5,943 | 10.7% |
| $35,000 to $49,999 | 7,831 | 14.1% |
| $50,000 to $74,999 | 9,720 | 17.5% |
| $75,000 to $99,999 | 7,165 | 12.9% |
| $100,000 to $149,999 | 8,276 | 14.9% |
| $150,000 to $199,999 | 2,666 | 4.8% |
| $200,000+ | 1,999 | 3.6% |
Household Income by Householder Age in Cambria County
The median household income in Cambria County is $54,221, with the highest median household income of $68,776 found in the 25 to 44 years age bracket for the primary householder. A total of 13,003 households (23.4%) fall into this category. Meanwhile, the 15 to 24 years age bracket for the primary householder has the lowest median household income of $35,897, with 1,360 households (2.5%) in this group.
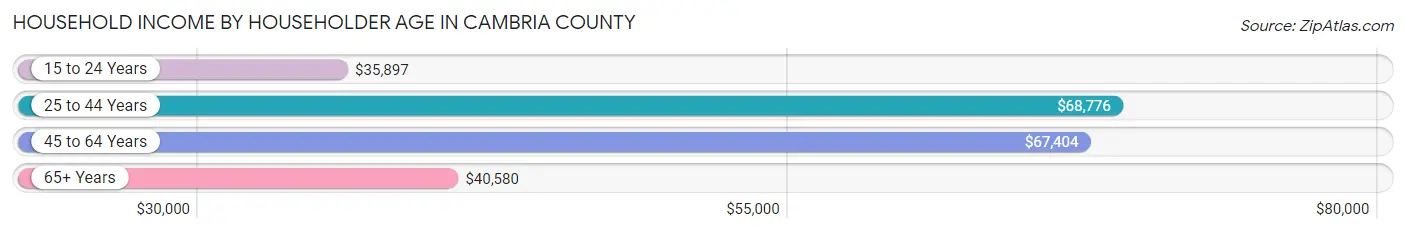
| Income Bracket | # Households | Median Income |
| 15 to 24 Years | 1,360 (2.5%) | $35,897 |
| 25 to 44 Years | 13,003 (23.4%) | $68,776 |
| 45 to 64 Years | 21,283 (38.3%) | $67,404 |
| 65+ Years | 19,895 (35.8%) | $40,580 |
| Total | 55,541 (100.0%) | $54,221 |
Poverty in Cambria County
Income Below Poverty by Sex and Age in Cambria County
With 12.7% poverty level for males and 16.0% for females among the residents of Cambria County, 5 year old males and 12 to 14 year old females are the most vulnerable to poverty, with 164 males (29.2%) and 664 females (28.3%) in their respective age groups living below the poverty level.
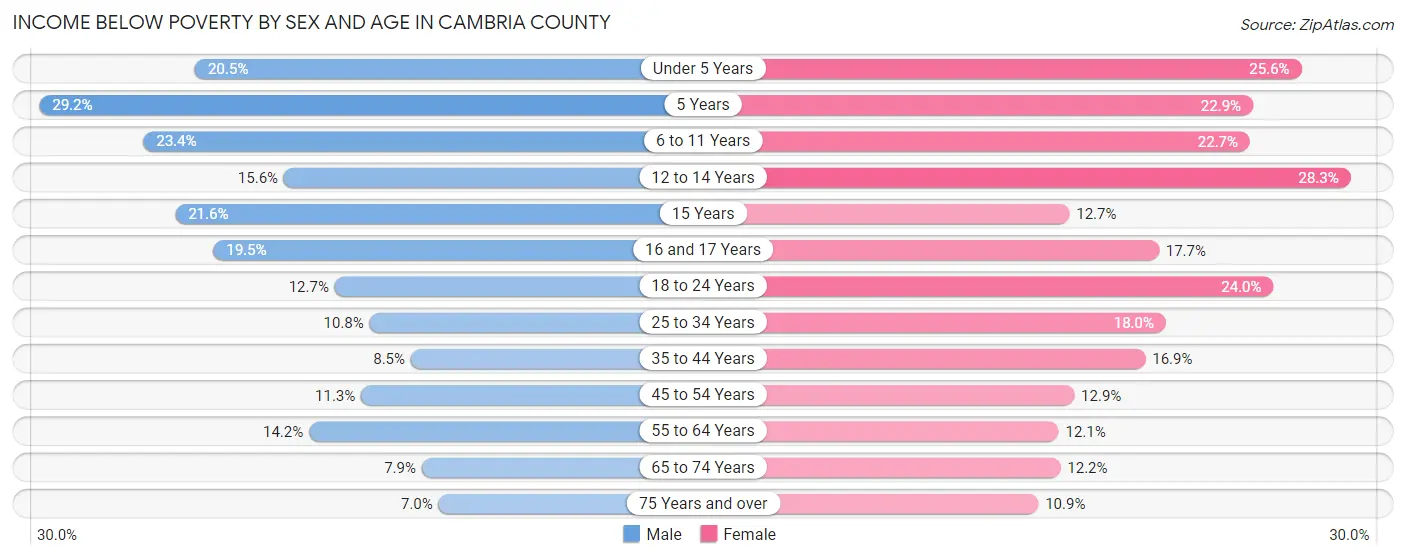
| Age Bracket | Male | Female |
| Under 5 Years | 668 (20.5%) | 761 (25.6%) |
| 5 Years | 164 (29.2%) | 163 (22.9%) |
| 6 to 11 Years | 1,061 (23.4%) | 835 (22.7%) |
| 12 to 14 Years | 335 (15.6%) | 664 (28.3%) |
| 15 Years | 172 (21.6%) | 83 (12.7%) |
| 16 and 17 Years | 323 (19.5%) | 286 (17.6%) |
| 18 to 24 Years | 611 (12.7%) | 931 (24.0%) |
| 25 to 34 Years | 769 (10.8%) | 1,177 (18.0%) |
| 35 to 44 Years | 591 (8.5%) | 1,152 (16.9%) |
| 45 to 54 Years | 923 (11.3%) | 1,056 (12.9%) |
| 55 to 64 Years | 1,407 (14.2%) | 1,196 (12.1%) |
| 65 to 74 Years | 674 (7.9%) | 1,095 (12.2%) |
| 75 Years and over | 344 (7.0%) | 799 (10.9%) |
| Total | 8,042 (12.7%) | 10,198 (16.0%) |
Income Above Poverty by Sex and Age in Cambria County
According to the poverty statistics in Cambria County, males aged 75 years and over and females aged 75 years and over are the age groups that are most secure financially, with 93.0% of males and 89.1% of females in these age groups living above the poverty line.
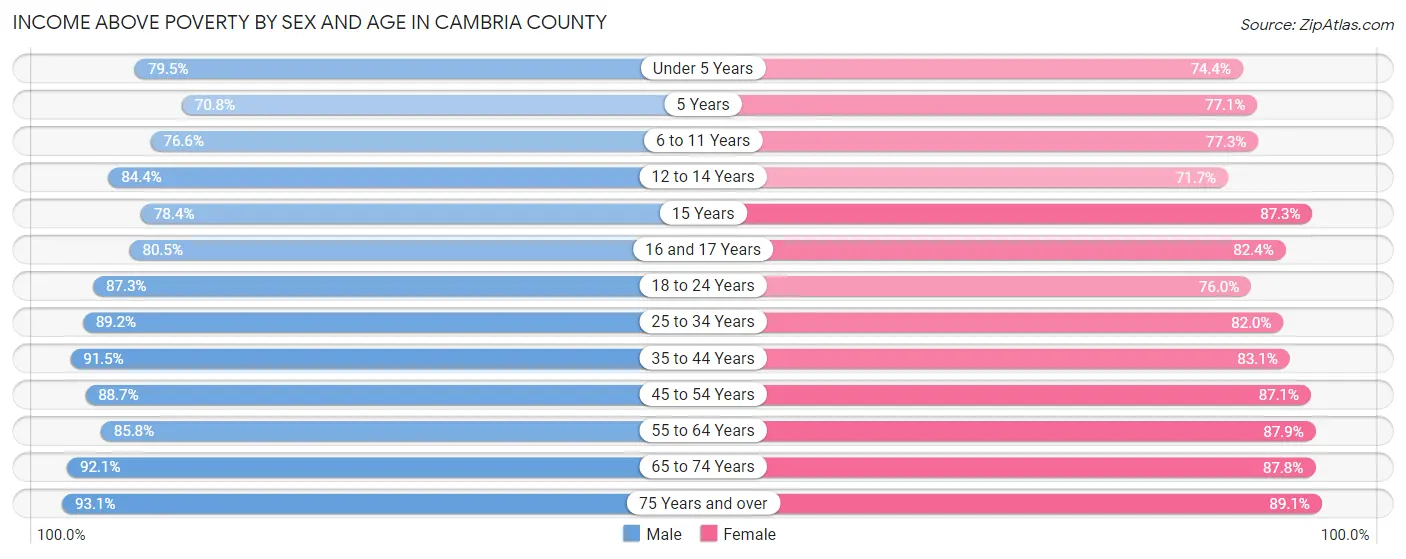
| Age Bracket | Male | Female |
| Under 5 Years | 2,589 (79.5%) | 2,213 (74.4%) |
| 5 Years | 398 (70.8%) | 549 (77.1%) |
| 6 to 11 Years | 3,476 (76.6%) | 2,840 (77.3%) |
| 12 to 14 Years | 1,818 (84.4%) | 1,680 (71.7%) |
| 15 Years | 624 (78.4%) | 572 (87.3%) |
| 16 and 17 Years | 1,334 (80.5%) | 1,334 (82.4%) |
| 18 to 24 Years | 4,189 (87.3%) | 2,944 (76.0%) |
| 25 to 34 Years | 6,360 (89.2%) | 5,346 (82.0%) |
| 35 to 44 Years | 6,372 (91.5%) | 5,666 (83.1%) |
| 45 to 54 Years | 7,273 (88.7%) | 7,102 (87.1%) |
| 55 to 64 Years | 8,531 (85.8%) | 8,716 (87.9%) |
| 65 to 74 Years | 7,874 (92.1%) | 7,905 (87.8%) |
| 75 Years and over | 4,608 (93.0%) | 6,503 (89.1%) |
| Total | 55,446 (87.3%) | 53,370 (84.0%) |
Income Below Poverty Among Married-Couple Families in Cambria County
The poverty statistics for married-couple families in Cambria County show that 3.5% or 871 of the total 24,917 families live below the poverty line. Families with 5 or more children have the highest poverty rate of 12.0%, comprising of 15 families. On the other hand, families with 1 or 2 children have the lowest poverty rate of 3.0%, which includes 171 families.
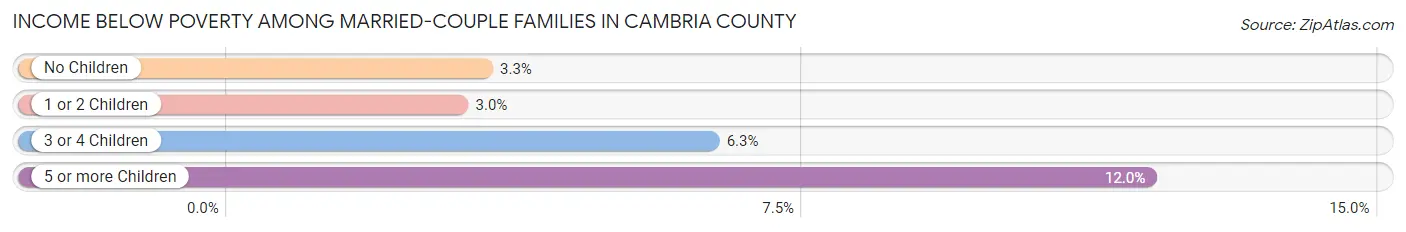
| Children | Above Poverty | Below Poverty |
| No Children | 16,884 (96.7%) | 581 (3.3%) |
| 1 or 2 Children | 5,502 (97.0%) | 171 (3.0%) |
| 3 or 4 Children | 1,550 (93.7%) | 104 (6.3%) |
| 5 or more Children | 110 (88.0%) | 15 (12.0%) |
| Total | 24,046 (96.5%) | 871 (3.5%) |
Income Below Poverty Among Single-Parent Households in Cambria County
According to the poverty data in Cambria County, 16.5% or 460 single-father households and 30.8% or 1,813 single-mother households are living below the poverty line. Among single-father households, those with 5 or more children have the highest poverty rate, with 19 households (100.0%) experiencing poverty. Likewise, among single-mother households, those with 5 or more children have the highest poverty rate, with 84 households (100.0%) falling below the poverty line.
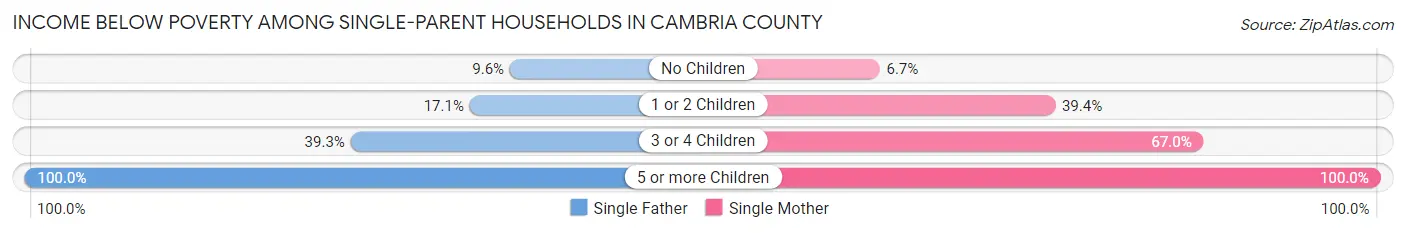
| Children | Single Father | Single Mother |
| No Children | 113 (9.6%) | 151 (6.7%) |
| 1 or 2 Children | 231 (17.1%) | 1,135 (39.4%) |
| 3 or 4 Children | 97 (39.3%) | 443 (67.0%) |
| 5 or more Children | 19 (100.0%) | 84 (100.0%) |
| Total | 460 (16.5%) | 1,813 (30.8%) |
Income Below Poverty Among Married-Couple vs Single-Parent Households in Cambria County
The poverty data for Cambria County shows that 871 of the married-couple family households (3.5%) and 2,273 of the single-parent households (26.2%) are living below the poverty level. Within the married-couple family households, those with 5 or more children have the highest poverty rate, with 15 households (12.0%) falling below the poverty line. Among the single-parent households, those with 5 or more children have the highest poverty rate, with 103 household (100.0%) living below poverty.
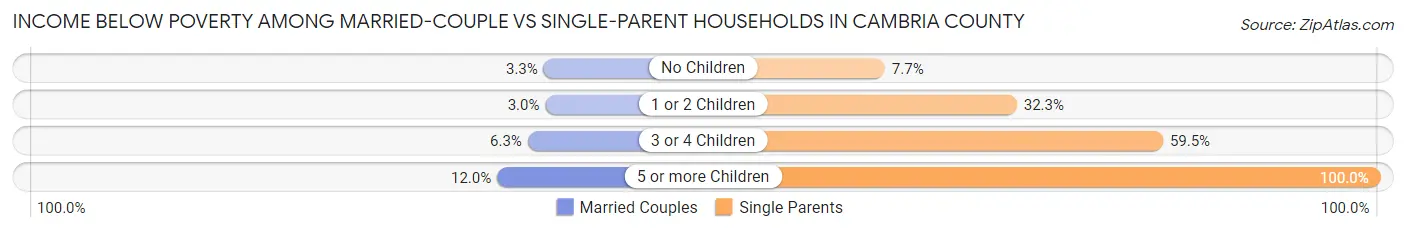
| Children | Married-Couple Families | Single-Parent Households |
| No Children | 581 (3.3%) | 264 (7.7%) |
| 1 or 2 Children | 171 (3.0%) | 1,366 (32.3%) |
| 3 or 4 Children | 104 (6.3%) | 540 (59.5%) |
| 5 or more Children | 15 (12.0%) | 103 (100.0%) |
| Total | 871 (3.5%) | 2,273 (26.2%) |
Race in Cambria County
The most populous races in Cambria County are White / Caucasian (122,895 | 92.2%), Black / African American (4,877 | 3.7%), and Two or more Races (4,061 | 3.0%).
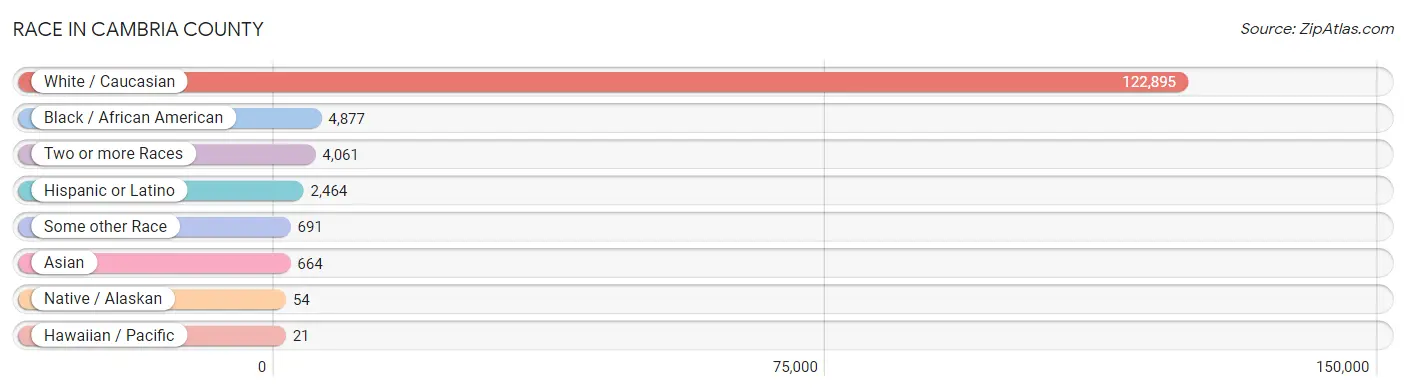
| Race | # Population | % Population |
| Asian | 664 | 0.5% |
| Black / African American | 4,877 | 3.7% |
| Hawaiian / Pacific | 21 | 0.0% |
| Hispanic or Latino | 2,464 | 1.8% |
| Native / Alaskan | 54 | 0.0% |
| White / Caucasian | 122,895 | 92.2% |
| Two or more Races | 4,061 | 3.0% |
| Some other Race | 691 | 0.5% |
| Total | 133,263 | 100.0% |
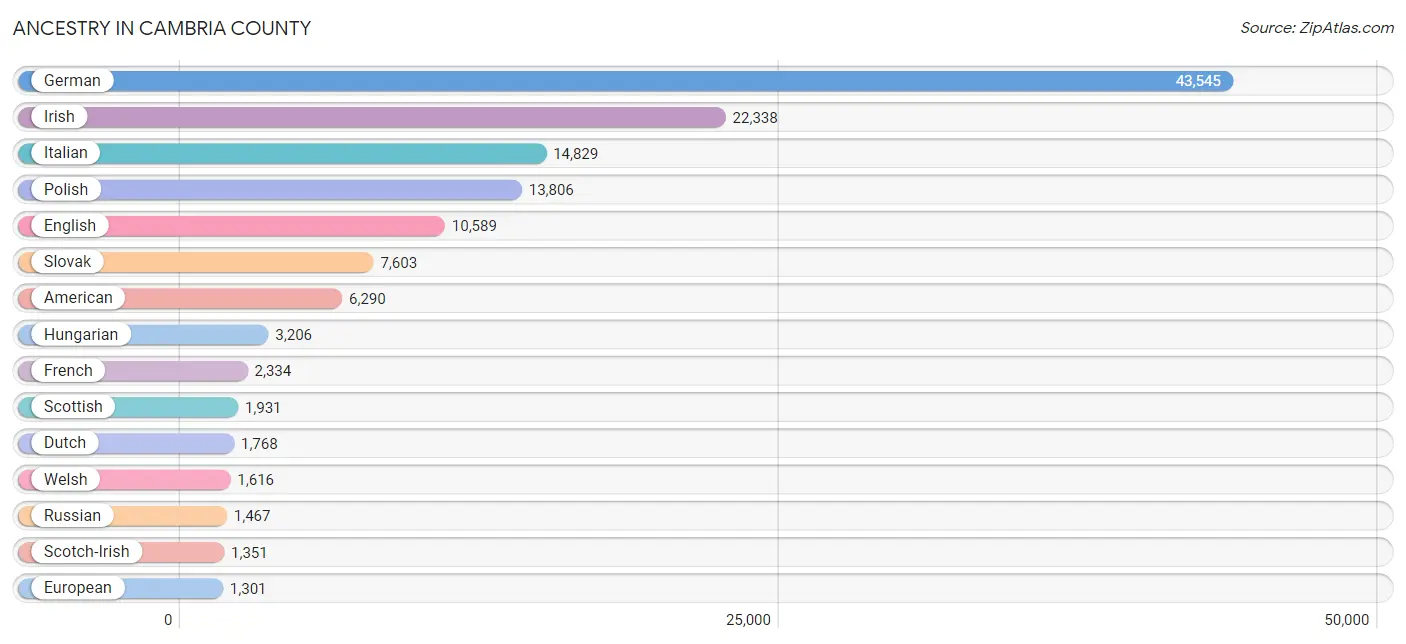
Ancestry in Cambria County
The most populous ancestries reported in Cambria County are German (43,545 | 32.7%), Irish (22,338 | 16.8%), Italian (14,829 | 11.1%), Polish (13,806 | 10.4%), and English (10,589 | 8.0%), together accounting for 78.9% of all Cambria County residents.
| Ancestry | # Population | % Population |
| African | 165 | 0.1% |
| Alaska Native | 2 | 0.0% |
| Albanian | 6 | 0.0% |
| American | 6,290 | 4.7% |
| Apache | 22 | 0.0% |
| Arab | 690 | 0.5% |
| Argentinean | 7 | 0.0% |
| Armenian | 38 | 0.0% |
| Australian | 10 | 0.0% |
| Austrian | 624 | 0.5% |
| Belgian | 76 | 0.1% |
| Bhutanese | 82 | 0.1% |
| Blackfeet | 14 | 0.0% |
| Brazilian | 31 | 0.0% |
| British | 247 | 0.2% |
| Burmese | 190 | 0.1% |
| Cambodian | 3 | 0.0% |
| Canadian | 98 | 0.1% |
| Carpatho Rusyn | 87 | 0.1% |
| Celtic | 33 | 0.0% |
| Central American | 49 | 0.0% |
| Cherokee | 220 | 0.2% |
| Chilean | 12 | 0.0% |
| Chinese | 22 | 0.0% |
| Chippewa | 4 | 0.0% |
| Choctaw | 2 | 0.0% |
| Colombian | 22 | 0.0% |
| Comanche | 12 | 0.0% |
| Costa Rican | 18 | 0.0% |
| Croatian | 1,155 | 0.9% |
| Cuban | 98 | 0.1% |
| Czech | 1,078 | 0.8% |
| Czechoslovakian | 730 | 0.5% |
| Danish | 34 | 0.0% |
| Delaware | 20 | 0.0% |
| Dominican | 189 | 0.1% |
| Dutch | 1,768 | 1.3% |
| Eastern European | 563 | 0.4% |
| Ecuadorian | 30 | 0.0% |
| Egyptian | 10 | 0.0% |
| English | 10,589 | 8.0% |
| European | 1,301 | 1.0% |
| Filipino | 8 | 0.0% |
| Finnish | 78 | 0.1% |
| French | 2,334 | 1.8% |
| French American Indian | 8 | 0.0% |
| French Canadian | 164 | 0.1% |
| German | 43,545 | 32.7% |
| German Russian | 1 | 0.0% |
| Greek | 268 | 0.2% |
| Guamanian / Chamorro | 7 | 0.0% |
| Haitian | 74 | 0.1% |
| Honduran | 1 | 0.0% |
| Hungarian | 3,206 | 2.4% |
| Indian (Asian) | 205 | 0.2% |
| Iranian | 94 | 0.1% |
| Irish | 22,338 | 16.8% |
| Iroquois | 6 | 0.0% |
| Israeli | 2 | 0.0% |
| Italian | 14,829 | 11.1% |
| Jamaican | 49 | 0.0% |
| Jordanian | 5 | 0.0% |
| Korean | 403 | 0.3% |
| Lebanese | 477 | 0.4% |
| Lithuanian | 699 | 0.5% |
| Malaysian | 69 | 0.1% |
| Mexican | 803 | 0.6% |
| Mexican American Indian | 10 | 0.0% |
| Moroccan | 39 | 0.0% |
| Native Hawaiian | 69 | 0.1% |
| Northern European | 73 | 0.1% |
| Norwegian | 113 | 0.1% |
| Pakistani | 16 | 0.0% |
| Panamanian | 30 | 0.0% |
| Pennsylvania German | 1,300 | 1.0% |
| Polish | 13,806 | 10.4% |
| Portuguese | 131 | 0.1% |
| Puerto Rican | 860 | 0.6% |
| Romanian | 72 | 0.1% |
| Russian | 1,467 | 1.1% |
| Scandinavian | 129 | 0.1% |
| Scotch-Irish | 1,351 | 1.0% |
| Scottish | 1,931 | 1.5% |
| Serbian | 944 | 0.7% |
| Shoshone | 2 | 0.0% |
| Sioux | 37 | 0.0% |
| Slavic | 505 | 0.4% |
| Slovak | 7,603 | 5.7% |
| Slovene | 540 | 0.4% |
| South American | 100 | 0.1% |
| Spaniard | 43 | 0.0% |
| Spanish | 62 | 0.1% |
| Sri Lankan | 70 | 0.1% |
| Subsaharan African | 165 | 0.1% |
| Swedish | 765 | 0.6% |
| Swiss | 277 | 0.2% |
| Syrian | 46 | 0.0% |
| Thai | 60 | 0.1% |
| Tlingit-Haida | 2 | 0.0% |
| Trinidadian and Tobagonian | 3 | 0.0% |
| Turkish | 11 | 0.0% |
| Ukrainian | 855 | 0.6% |
| Venezuelan | 7 | 0.0% |
| Welsh | 1,616 | 1.2% |
| West Indian | 10 | 0.0% |
| Yakama | 2 | 0.0% |
| Yugoslavian | 65 | 0.1% | View All 107 Rows |
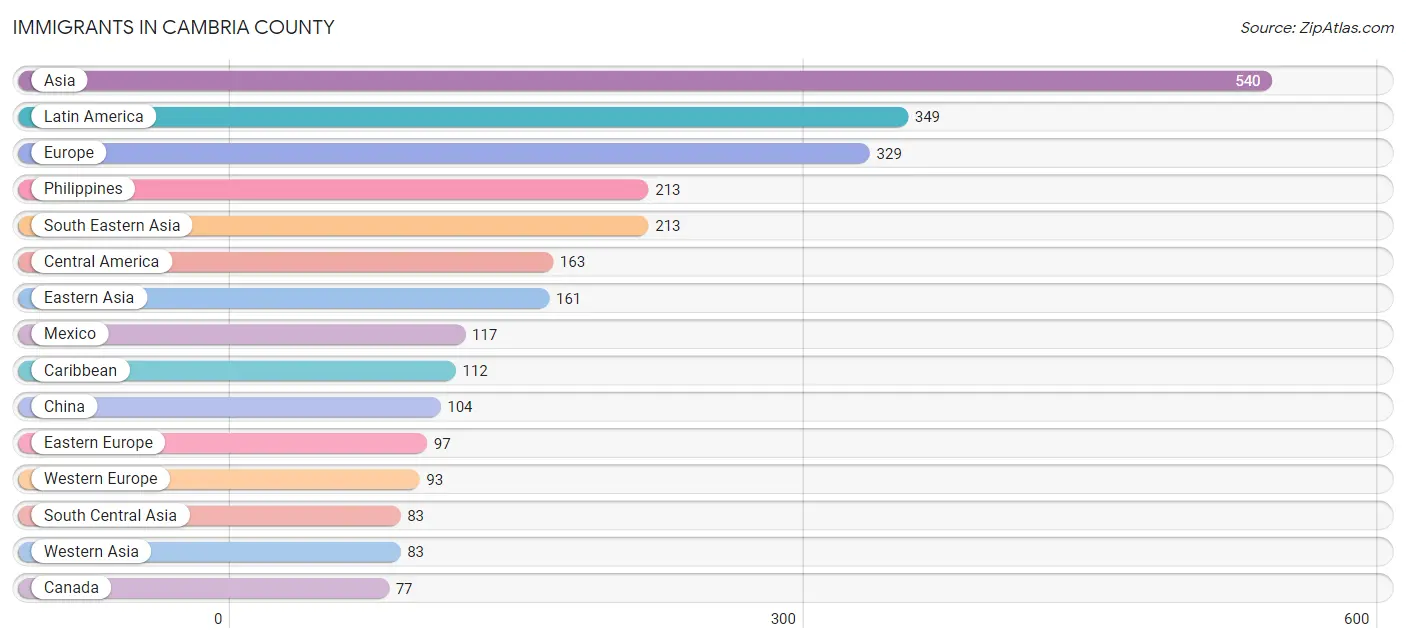
Immigrants in Cambria County
The most numerous immigrant groups reported in Cambria County came from Asia (540 | 0.4%), Latin America (349 | 0.3%), Europe (329 | 0.3%), Philippines (213 | 0.2%), and South Eastern Asia (213 | 0.2%), together accounting for 1.2% of all Cambria County residents.
| Immigration Origin | # Population | % Population |
| Africa | 68 | 0.1% |
| Armenia | 11 | 0.0% |
| Asia | 540 | 0.4% |
| Belarus | 5 | 0.0% |
| Brazil | 33 | 0.0% |
| Canada | 77 | 0.1% |
| Caribbean | 112 | 0.1% |
| Central America | 163 | 0.1% |
| Chile | 12 | 0.0% |
| China | 104 | 0.1% |
| Colombia | 15 | 0.0% |
| Cuba | 7 | 0.0% |
| Czechoslovakia | 21 | 0.0% |
| Dominican Republic | 49 | 0.0% |
| Eastern Africa | 22 | 0.0% |
| Eastern Asia | 161 | 0.1% |
| Eastern Europe | 97 | 0.1% |
| Ecuador | 11 | 0.0% |
| Egypt | 10 | 0.0% |
| England | 13 | 0.0% |
| Europe | 329 | 0.3% |
| France | 55 | 0.0% |
| Germany | 32 | 0.0% |
| Ghana | 2 | 0.0% |
| Haiti | 18 | 0.0% |
| Hong Kong | 7 | 0.0% |
| Hungary | 2 | 0.0% |
| India | 32 | 0.0% |
| Iran | 51 | 0.0% |
| Israel | 40 | 0.0% |
| Italy | 63 | 0.1% |
| Jamaica | 24 | 0.0% |
| Japan | 26 | 0.0% |
| Kenya | 22 | 0.0% |
| Korea | 31 | 0.0% |
| Latin America | 349 | 0.3% |
| Lebanon | 12 | 0.0% |
| Mexico | 117 | 0.1% |
| Moldova | 10 | 0.0% |
| Morocco | 9 | 0.0% |
| Netherlands | 6 | 0.0% |
| Nicaragua | 37 | 0.0% |
| Northern Africa | 19 | 0.0% |
| Northern Europe | 63 | 0.1% |
| Oceania | 9 | 0.0% |
| Panama | 9 | 0.0% |
| Philippines | 213 | 0.2% |
| Poland | 10 | 0.0% |
| Portugal | 2 | 0.0% |
| Russia | 20 | 0.0% |
| Saudi Arabia | 3 | 0.0% |
| Serbia | 2 | 0.0% |
| South Africa | 20 | 0.0% |
| South America | 74 | 0.1% |
| South Central Asia | 83 | 0.1% |
| South Eastern Asia | 213 | 0.2% |
| Southern Europe | 76 | 0.1% |
| Spain | 11 | 0.0% |
| Taiwan | 8 | 0.0% |
| Trinidad and Tobago | 14 | 0.0% |
| Turkey | 10 | 0.0% |
| Ukraine | 6 | 0.0% |
| Uruguay | 2 | 0.0% |
| Venezuela | 1 | 0.0% |
| Western Africa | 2 | 0.0% |
| Western Asia | 83 | 0.1% |
| Western Europe | 93 | 0.1% | View All 67 Rows |
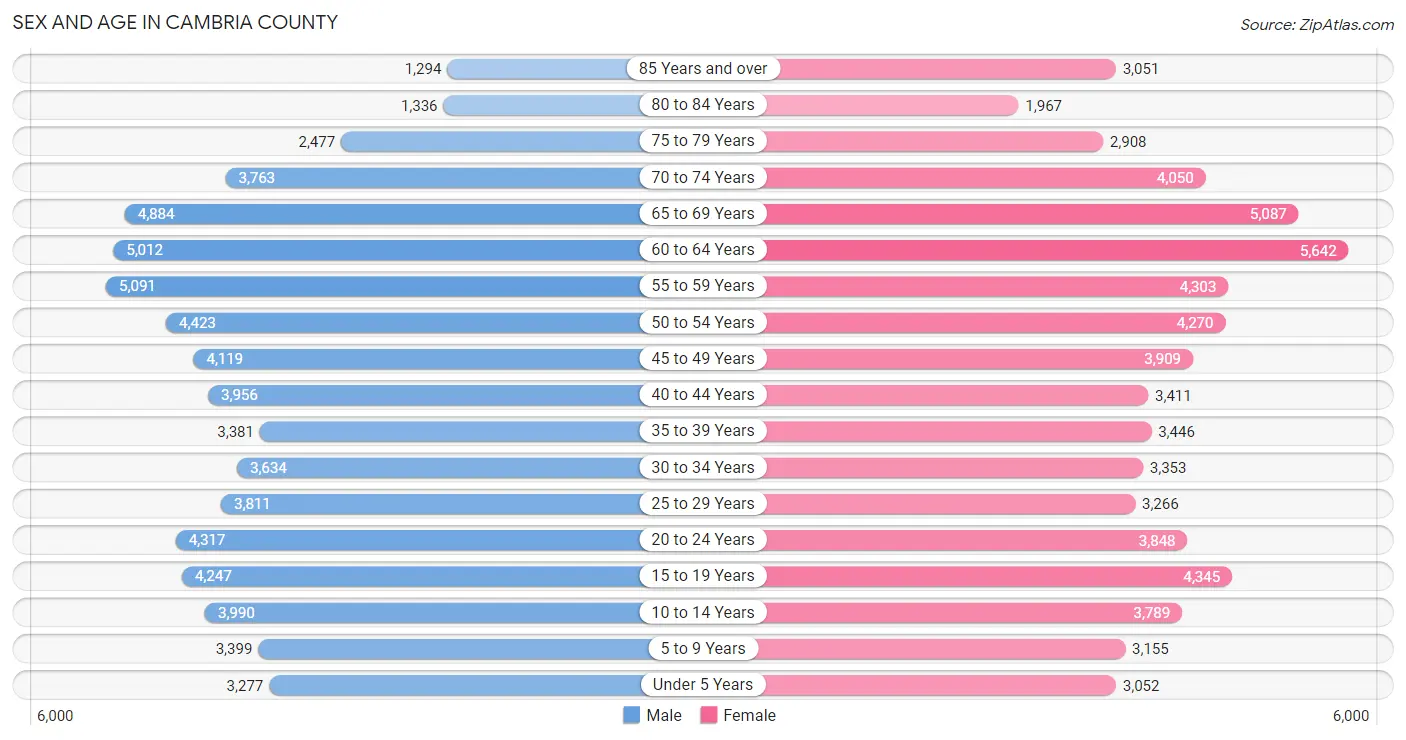
Sex and Age in Cambria County
Sex and Age in Cambria County
The most populous age groups in Cambria County are 55 to 59 Years (5,091 | 7.7%) for men and 60 to 64 Years (5,642 | 8.4%) for women.
| Age Bracket | Male | Female |
| Under 5 Years | 3,277 (4.9%) | 3,052 (4.6%) |
| 5 to 9 Years | 3,399 (5.1%) | 3,155 (4.7%) |
| 10 to 14 Years | 3,990 (6.0%) | 3,789 (5.7%) |
| 15 to 19 Years | 4,247 (6.4%) | 4,345 (6.5%) |
| 20 to 24 Years | 4,317 (6.5%) | 3,848 (5.8%) |
| 25 to 29 Years | 3,811 (5.7%) | 3,266 (4.9%) |
| 30 to 34 Years | 3,634 (5.5%) | 3,353 (5.0%) |
| 35 to 39 Years | 3,381 (5.1%) | 3,446 (5.1%) |
| 40 to 44 Years | 3,956 (6.0%) | 3,411 (5.1%) |
| 45 to 49 Years | 4,119 (6.2%) | 3,909 (5.9%) |
| 50 to 54 Years | 4,423 (6.7%) | 4,270 (6.4%) |
| 55 to 59 Years | 5,091 (7.7%) | 4,303 (6.4%) |
| 60 to 64 Years | 5,012 (7.5%) | 5,642 (8.4%) |
| 65 to 69 Years | 4,884 (7.3%) | 5,087 (7.6%) |
| 70 to 74 Years | 3,763 (5.7%) | 4,050 (6.1%) |
| 75 to 79 Years | 2,477 (3.7%) | 2,908 (4.3%) |
| 80 to 84 Years | 1,336 (2.0%) | 1,967 (2.9%) |
| 85 Years and over | 1,294 (1.9%) | 3,051 (4.6%) |
| Total | 66,411 (100.0%) | 66,852 (100.0%) |
Families and Households in Cambria County
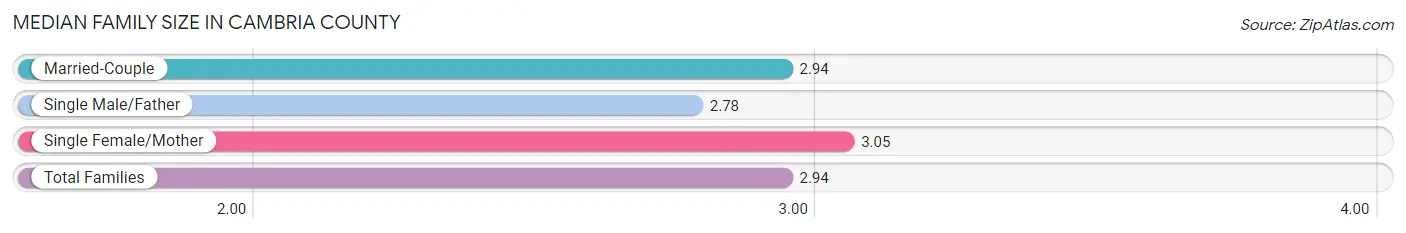
Median Family Size in Cambria County
The median family size in Cambria County is 2.94 persons per family, with single female/mother families (5,890 | 17.5%) accounting for the largest median family size of 3.05 persons per family. On the other hand, single male/father families (2,795 | 8.3%) represent the smallest median family size with 2.78 persons per family.
| Family Type | # Families | Family Size |
| Married-Couple | 24,917 (74.2%) | 2.94 |
| Single Male/Father | 2,795 (8.3%) | 2.78 |
| Single Female/Mother | 5,890 (17.5%) | 3.05 |
| Total Families | 33,602 (100.0%) | 2.94 |
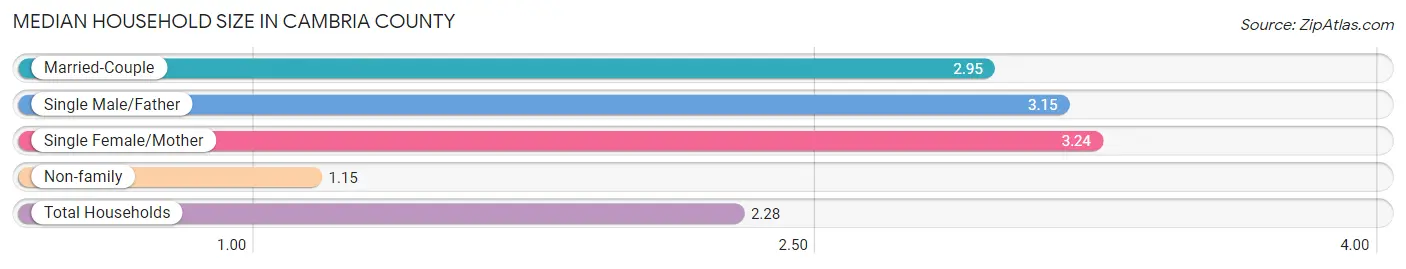
Median Household Size in Cambria County
The median household size in Cambria County is 2.28 persons per household, with single female/mother households (5,890 | 10.6%) accounting for the largest median household size of 3.24 persons per household. non-family households (21,939 | 39.5%) represent the smallest median household size with 1.15 persons per household.
| Household Type | # Households | Household Size |
| Married-Couple | 24,917 (44.9%) | 2.95 |
| Single Male/Father | 2,795 (5.0%) | 3.15 |
| Single Female/Mother | 5,890 (10.6%) | 3.24 |
| Non-family | 21,939 (39.5%) | 1.15 |
| Total Households | 55,541 (100.0%) | 2.28 |
Household Size by Marriage Status in Cambria County
Out of a total of 55,541 households in Cambria County, 33,602 (60.5%) are family households, while 21,939 (39.5%) are nonfamily households. The most numerous type of family households are 2-person households, comprising 17,624, and the most common type of nonfamily households are 1-person households, comprising 19,220.
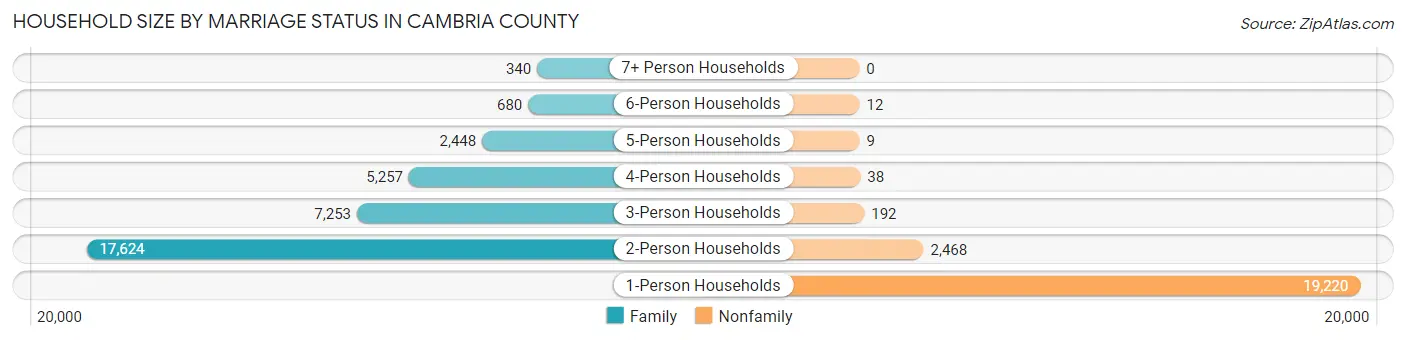
| Household Size | Family Households | Nonfamily Households |
| 1-Person Households | - | 19,220 (34.6%) |
| 2-Person Households | 17,624 (31.7%) | 2,468 (4.4%) |
| 3-Person Households | 7,253 (13.1%) | 192 (0.4%) |
| 4-Person Households | 5,257 (9.5%) | 38 (0.1%) |
| 5-Person Households | 2,448 (4.4%) | 9 (0.0%) |
| 6-Person Households | 680 (1.2%) | 12 (0.0%) |
| 7+ Person Households | 340 (0.6%) | 0 (0.0%) |
| Total | 33,602 (60.5%) | 21,939 (39.5%) |
Female Fertility in Cambria County
Fertility by Age in Cambria County
Average fertility rate in Cambria County is 44.0 births per 1,000 women. Women in the age bracket of 20 to 34 years have the highest fertility rate with 88.0 births per 1,000 women. Women in the age bracket of 20 to 34 years acount for 79.0% of all women with births.
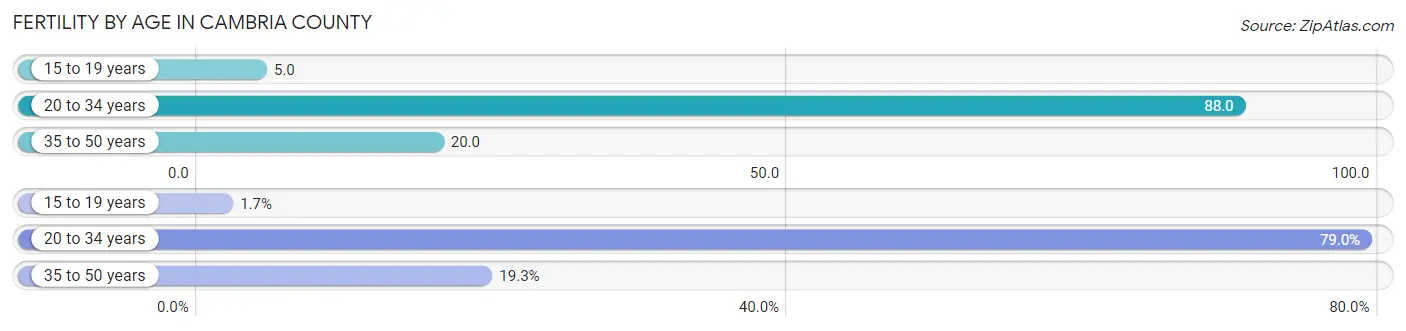
| Age Bracket | Women with Births | Births / 1,000 Women |
| 15 to 19 years | 20 (1.7%) | 5.0 |
| 20 to 34 years | 925 (79.0%) | 88.0 |
| 35 to 50 years | 226 (19.3%) | 20.0 |
| Total | 1,171 (100.0%) | 44.0 |
Fertility by Age by Marriage Status in Cambria County
62.7% of women with births (1,171) in Cambria County are married. The highest percentage of unmarried women with births falls into 15 to 19 years age bracket with 100.0% of them unmarried at the time of birth, while the lowest percentage of unmarried women with births belong to 35 to 50 years age bracket with 34.5% of them unmarried.
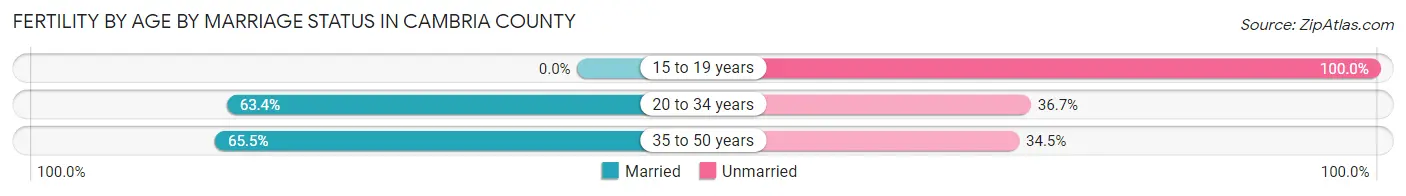
| Age Bracket | Married | Unmarried |
| 15 to 19 years | 0 (0.0%) | 20 (100.0%) |
| 20 to 34 years | 586 (63.3%) | 339 (36.6%) |
| 35 to 50 years | 148 (65.5%) | 78 (34.5%) |
| Total | 734 (62.7%) | 437 (37.3%) |
Fertility by Education in Cambria County
Average fertility rate in Cambria County is 44.0 births per 1,000 women. Women with the education attainment of graduate degree have the highest fertility rate of 84.0 births per 1,000 women, while women with the education attainment of less than high school have the lowest fertility at 19.0 births per 1,000 women. Women with the education attainment of college or associate's degree represent 33.1% of all women with births.
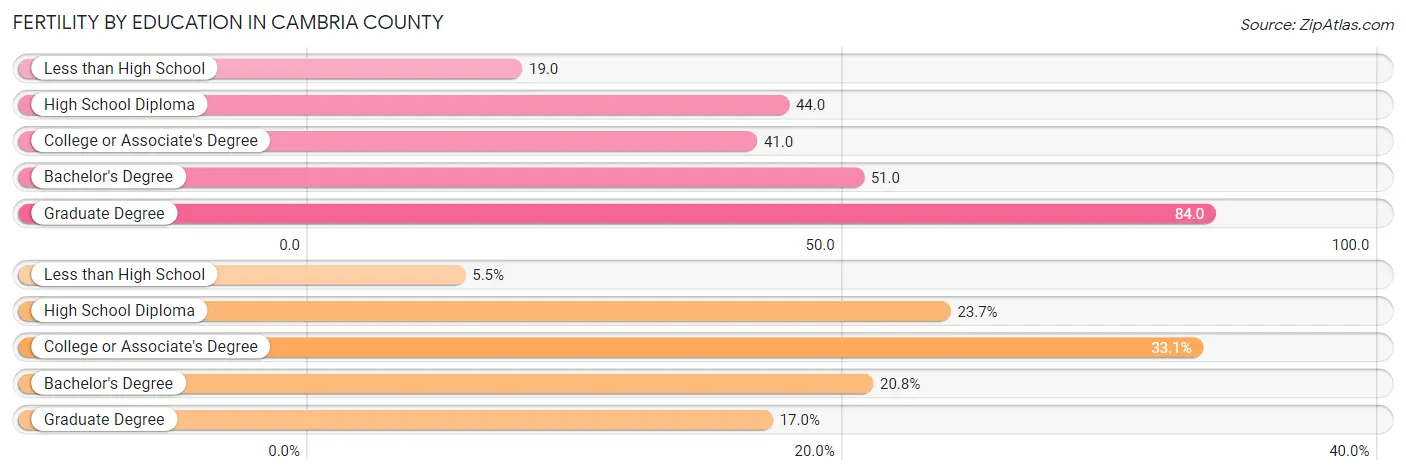
| Educational Attainment | Women with Births | Births / 1,000 Women |
| Less than High School | 64 (5.5%) | 19.0 |
| High School Diploma | 277 (23.6%) | 44.0 |
| College or Associate's Degree | 388 (33.1%) | 41.0 |
| Bachelor's Degree | 243 (20.7%) | 51.0 |
| Graduate Degree | 199 (17.0%) | 84.0 |
| Total | 1,171 (100.0%) | 44.0 |
Fertility by Education by Marriage Status in Cambria County
37.3% of women with births in Cambria County are unmarried. Women with the educational attainment of graduate degree are most likely to be married with 99.5% of them married at childbirth, while women with the educational attainment of less than high school are least likely to be married with 76.6% of them unmarried at childbirth.
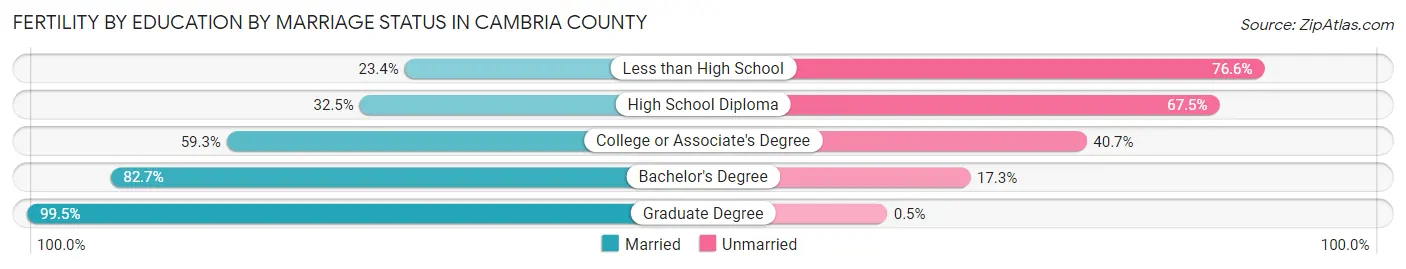
| Educational Attainment | Married | Unmarried |
| Less than High School | 15 (23.4%) | 49 (76.6%) |
| High School Diploma | 90 (32.5%) | 187 (67.5%) |
| College or Associate's Degree | 230 (59.3%) | 158 (40.7%) |
| Bachelor's Degree | 201 (82.7%) | 42 (17.3%) |
| Graduate Degree | 198 (99.5%) | 1 (0.5%) |
| Total | 734 (62.7%) | 437 (37.3%) |
Employment Characteristics in Cambria County
Employment by Class of Employer in Cambria County
Among the 56,653 employed individuals in Cambria County, private company employees (38,533 | 68.0%), not-for-profit organizations (6,163 | 10.9%), and local government employees (3,406 | 6.0%) make up the most common classes of employment.
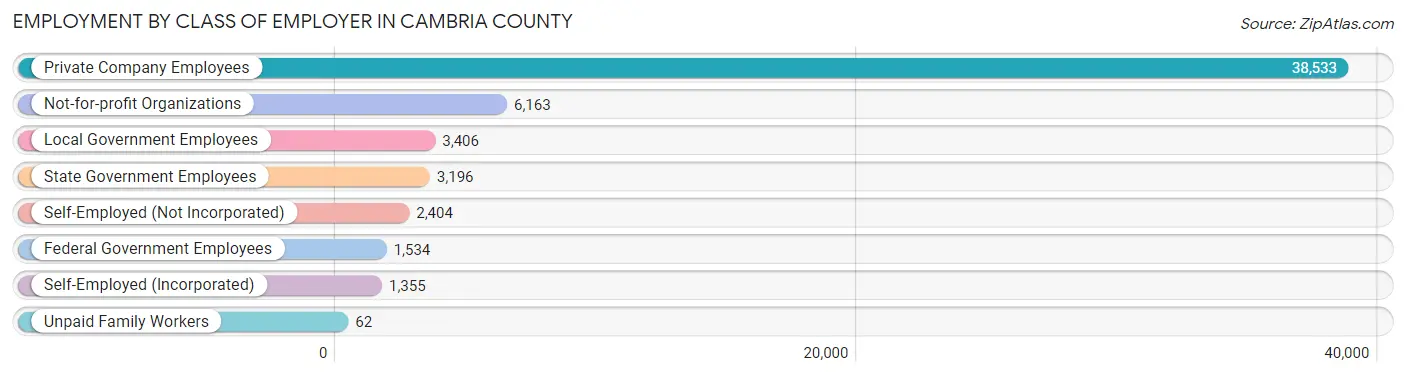
| Employer Class | # Employees | % Employees |
| Private Company Employees | 38,533 | 68.0% |
| Self-Employed (Incorporated) | 1,355 | 2.4% |
| Self-Employed (Not Incorporated) | 2,404 | 4.2% |
| Not-for-profit Organizations | 6,163 | 10.9% |
| Local Government Employees | 3,406 | 6.0% |
| State Government Employees | 3,196 | 5.6% |
| Federal Government Employees | 1,534 | 2.7% |
| Unpaid Family Workers | 62 | 0.1% |
| Total | 56,653 | 100.0% |
Employment Status by Age in Cambria County
According to the labor force statistics for Cambria County, out of the total population over 16 years of age (111,150), 54.8% or 60,910 individuals are in the labor force, with 5.0% or 3,046 of them unemployed. The age group with the highest labor force participation rate is 25 to 29 years, with 84.4% or 5,973 individuals in the labor force. Within the labor force, the 16 to 19 years age range has the highest percentage of unemployed individuals, with 11.6% or 305 of them being unemployed.
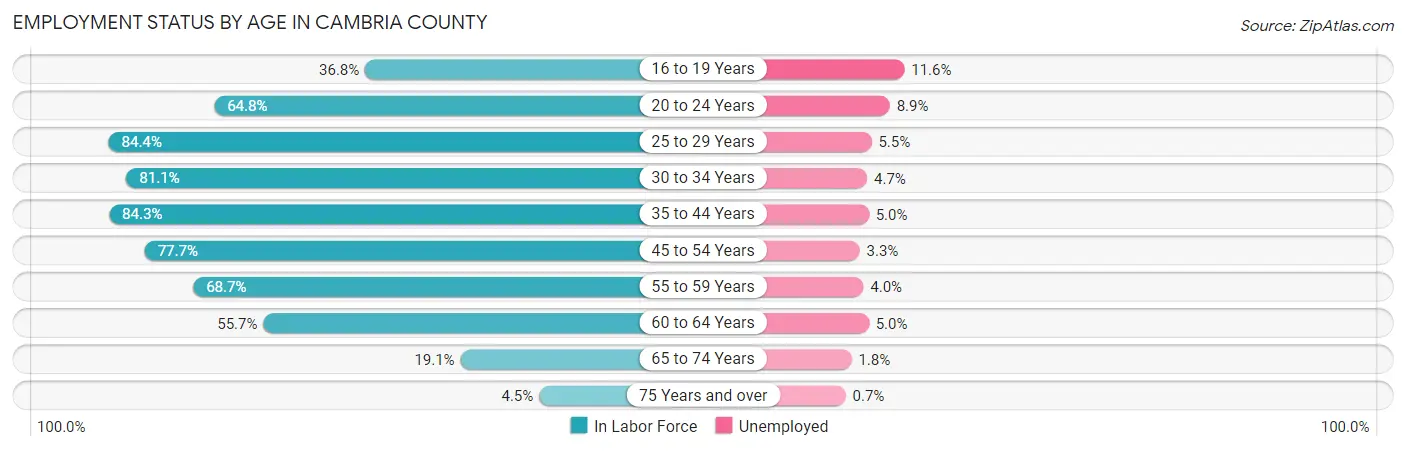
| Age Bracket | In Labor Force | Unemployed |
| 16 to 19 Years | 2,628 (36.8%) | 305 (11.6%) |
| 20 to 24 Years | 5,291 (64.8%) | 471 (8.9%) |
| 25 to 29 Years | 5,973 (84.4%) | 329 (5.5%) |
| 30 to 34 Years | 5,666 (81.1%) | 266 (4.7%) |
| 35 to 44 Years | 11,966 (84.3%) | 598 (5.0%) |
| 45 to 54 Years | 12,992 (77.7%) | 429 (3.3%) |
| 55 to 59 Years | 6,454 (68.7%) | 258 (4.0%) |
| 60 to 64 Years | 5,934 (55.7%) | 297 (5.0%) |
| 65 to 74 Years | 3,397 (19.1%) | 61 (1.8%) |
| 75 Years and over | 586 (4.5%) | 4 (0.7%) |
| Total | 60,910 (54.8%) | 3,046 (5.0%) |
Employment Status by Educational Attainment in Cambria County
According to labor force statistics for Cambria County, 75.3% of individuals (48,965) out of the total population between 25 and 64 years of age (65,027) are in the labor force, with 4.4% or 2,154 of them being unemployed. The group with the highest labor force participation rate are those with the educational attainment of bachelor's degree or higher, with 89.2% or 14,988 individuals in the labor force. Within the labor force, individuals with less than high school education have the highest percentage of unemployment, with 10.5% or 181 of them being unemployed.
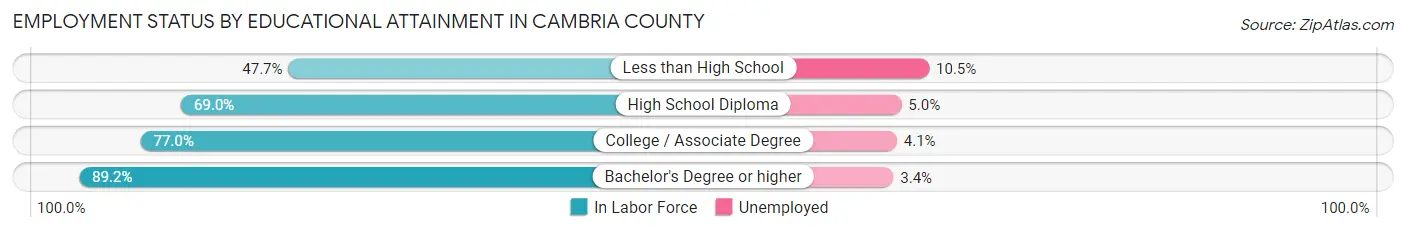
| Educational Attainment | In Labor Force | Unemployed |
| Less than High School | 1,721 (47.7%) | 379 (10.5%) |
| High School Diploma | 17,913 (69.0%) | 1,298 (5.0%) |
| College / Associate Degree | 14,364 (77.0%) | 765 (4.1%) |
| Bachelor's Degree or higher | 14,988 (89.2%) | 571 (3.4%) |
| Total | 48,965 (75.3%) | 2,861 (4.4%) |
Employment Occupations by Sex in Cambria County
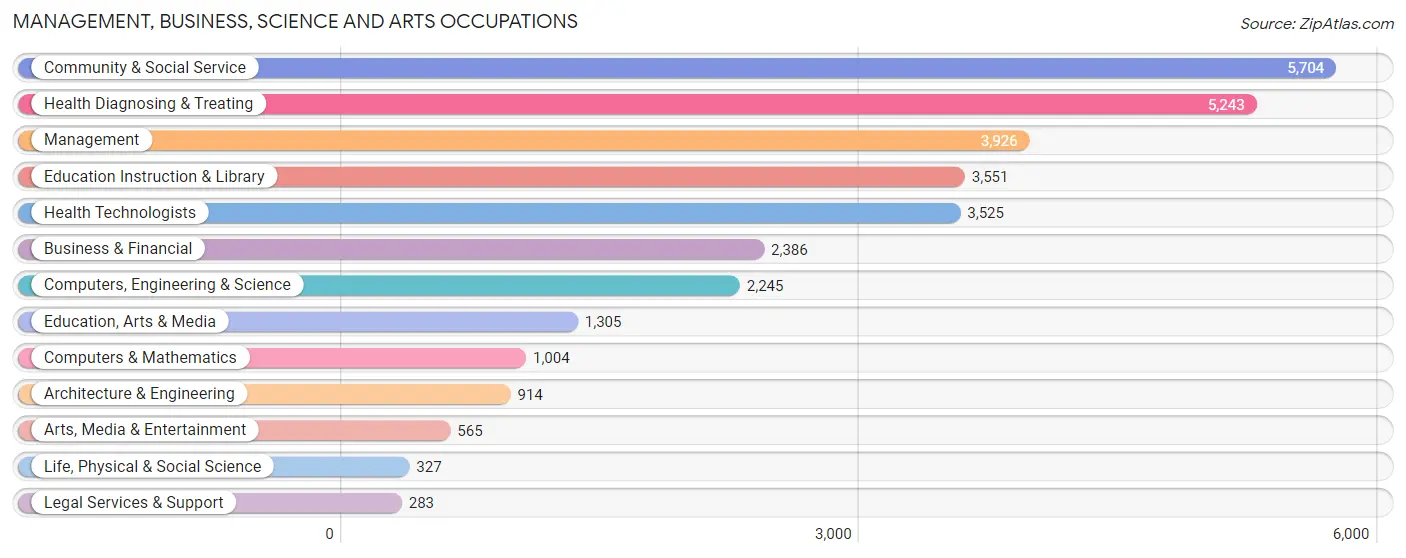
Management, Business, Science and Arts Occupations
The most common Management, Business, Science and Arts occupations in Cambria County are Community & Social Service (5,704 | 9.9%), Health Diagnosing & Treating (5,243 | 9.1%), Management (3,926 | 6.8%), Education Instruction & Library (3,551 | 6.1%), and Health Technologists (3,525 | 6.1%).
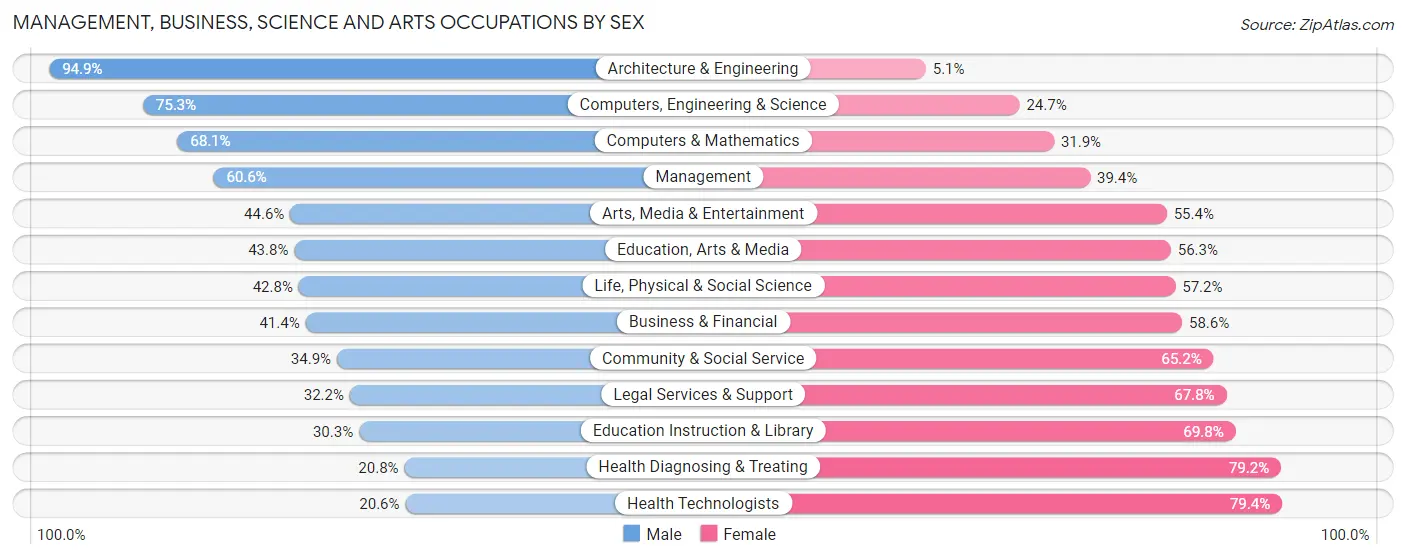
Management, Business, Science and Arts Occupations by Sex
Within the Management, Business, Science and Arts occupations in Cambria County, the most male-oriented occupations are Architecture & Engineering (94.9%), Computers, Engineering & Science (75.3%), and Computers & Mathematics (68.1%), while the most female-oriented occupations are Health Technologists (79.4%), Health Diagnosing & Treating (79.2%), and Education Instruction & Library (69.8%).
| Occupation | Male | Female |
| Management | 2,379 (60.6%) | 1,547 (39.4%) |
| Business & Financial | 988 (41.4%) | 1,398 (58.6%) |
| Computers, Engineering & Science | 1,691 (75.3%) | 554 (24.7%) |
| Computers & Mathematics | 684 (68.1%) | 320 (31.9%) |
| Architecture & Engineering | 867 (94.9%) | 47 (5.1%) |
| Life, Physical & Social Science | 140 (42.8%) | 187 (57.2%) |
| Community & Social Service | 1,988 (34.8%) | 3,716 (65.1%) |
| Education, Arts & Media | 571 (43.8%) | 734 (56.2%) |
| Legal Services & Support | 91 (32.2%) | 192 (67.8%) |
| Education Instruction & Library | 1,074 (30.2%) | 2,477 (69.8%) |
| Arts, Media & Entertainment | 252 (44.6%) | 313 (55.4%) |
| Health Diagnosing & Treating | 1,089 (20.8%) | 4,154 (79.2%) |
| Health Technologists | 725 (20.6%) | 2,800 (79.4%) |
| Total (Category) | 8,135 (41.7%) | 11,369 (58.3%) |
| Total (Overall) | 30,380 (52.6%) | 27,327 (47.3%) |
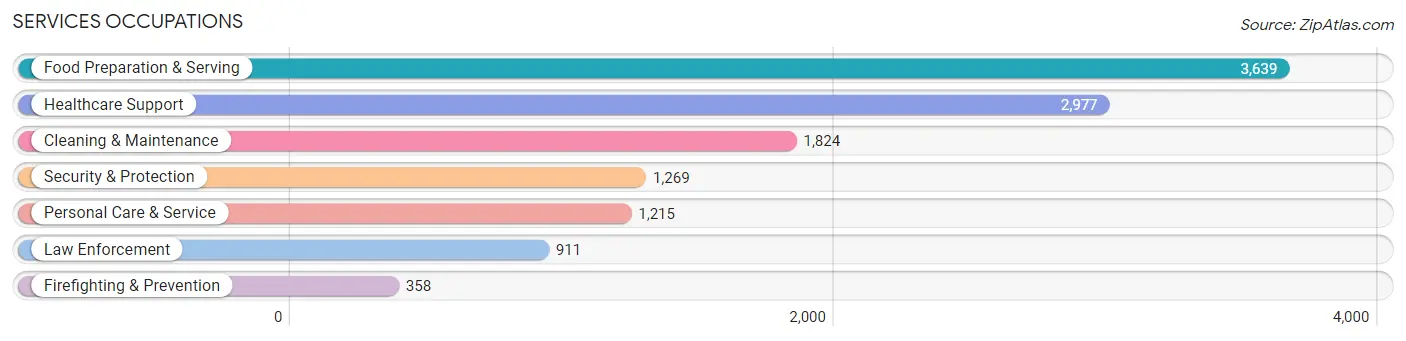
Services Occupations
The most common Services occupations in Cambria County are Food Preparation & Serving (3,639 | 6.3%), Healthcare Support (2,977 | 5.2%), Cleaning & Maintenance (1,824 | 3.2%), Security & Protection (1,269 | 2.2%), and Personal Care & Service (1,215 | 2.1%).
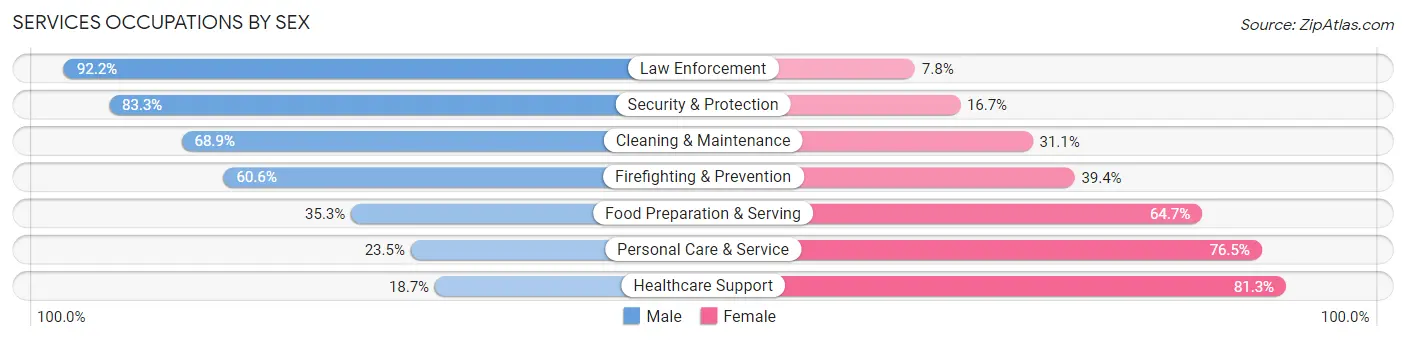
Services Occupations by Sex
Within the Services occupations in Cambria County, the most male-oriented occupations are Law Enforcement (92.2%), Security & Protection (83.3%), and Cleaning & Maintenance (68.9%), while the most female-oriented occupations are Healthcare Support (81.3%), Personal Care & Service (76.5%), and Food Preparation & Serving (64.7%).
| Occupation | Male | Female |
| Healthcare Support | 558 (18.7%) | 2,419 (81.3%) |
| Security & Protection | 1,057 (83.3%) | 212 (16.7%) |
| Firefighting & Prevention | 217 (60.6%) | 141 (39.4%) |
| Law Enforcement | 840 (92.2%) | 71 (7.8%) |
| Food Preparation & Serving | 1,286 (35.3%) | 2,353 (64.7%) |
| Cleaning & Maintenance | 1,257 (68.9%) | 567 (31.1%) |
| Personal Care & Service | 286 (23.5%) | 929 (76.5%) |
| Total (Category) | 4,444 (40.7%) | 6,480 (59.3%) |
| Total (Overall) | 30,380 (52.6%) | 27,327 (47.3%) |
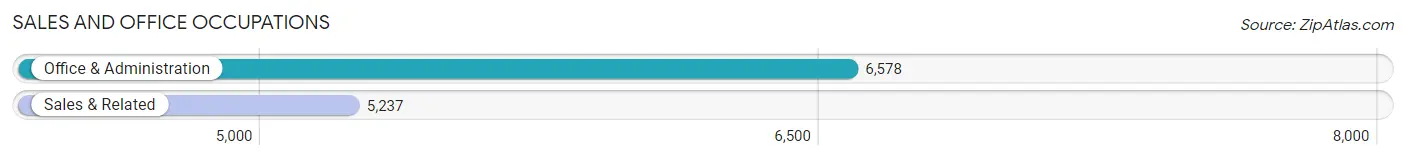
Sales and Office Occupations
The most common Sales and Office occupations in Cambria County are Office & Administration (6,578 | 11.4%), and Sales & Related (5,237 | 9.1%).
Sales and Office Occupations by Sex
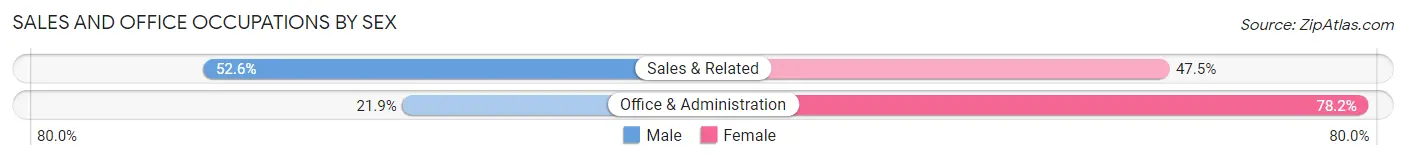
| Occupation | Male | Female |
| Sales & Related | 2,752 (52.5%) | 2,485 (47.4%) |
| Office & Administration | 1,437 (21.8%) | 5,141 (78.1%) |
| Total (Category) | 4,189 (35.4%) | 7,626 (64.5%) |
| Total (Overall) | 30,380 (52.6%) | 27,327 (47.3%) |
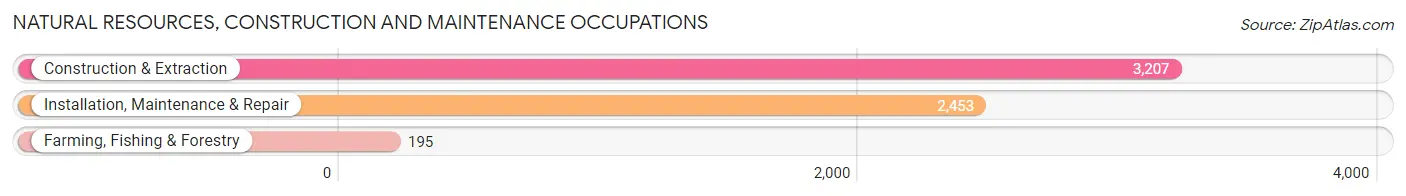
Natural Resources, Construction and Maintenance Occupations
The most common Natural Resources, Construction and Maintenance occupations in Cambria County are Construction & Extraction (3,207 | 5.6%), Installation, Maintenance & Repair (2,453 | 4.3%), and Farming, Fishing & Forestry (195 | 0.3%).
Natural Resources, Construction and Maintenance Occupations by Sex
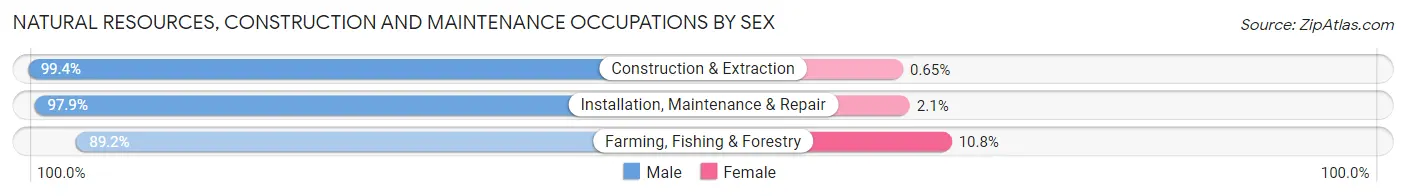
| Occupation | Male | Female |
| Farming, Fishing & Forestry | 174 (89.2%) | 21 (10.8%) |
| Construction & Extraction | 3,186 (99.4%) | 21 (0.6%) |
| Installation, Maintenance & Repair | 2,402 (97.9%) | 51 (2.1%) |
| Total (Category) | 5,762 (98.4%) | 93 (1.6%) |
| Total (Overall) | 30,380 (52.6%) | 27,327 (47.3%) |
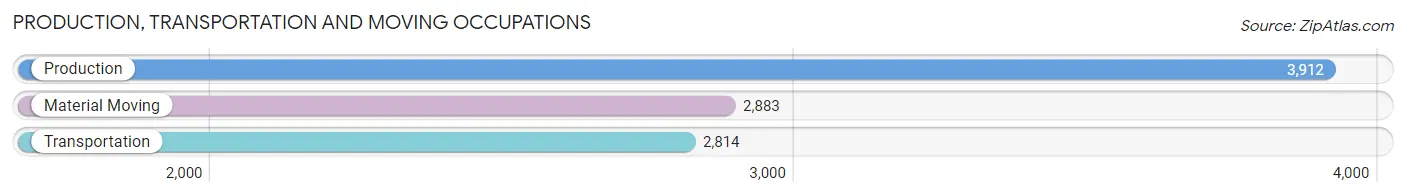
Production, Transportation and Moving Occupations
The most common Production, Transportation and Moving occupations in Cambria County are Production (3,912 | 6.8%), Material Moving (2,883 | 5.0%), and Transportation (2,814 | 4.9%).
Production, Transportation and Moving Occupations by Sex
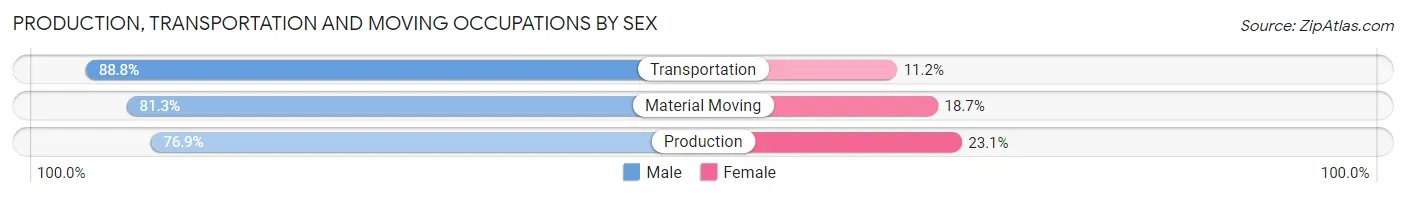
| Occupation | Male | Female |
| Production | 3,009 (76.9%) | 903 (23.1%) |
| Transportation | 2,498 (88.8%) | 316 (11.2%) |
| Material Moving | 2,343 (81.3%) | 540 (18.7%) |
| Total (Category) | 7,850 (81.7%) | 1,759 (18.3%) |
| Total (Overall) | 30,380 (52.6%) | 27,327 (47.3%) |
Employment Industries by Sex in Cambria County
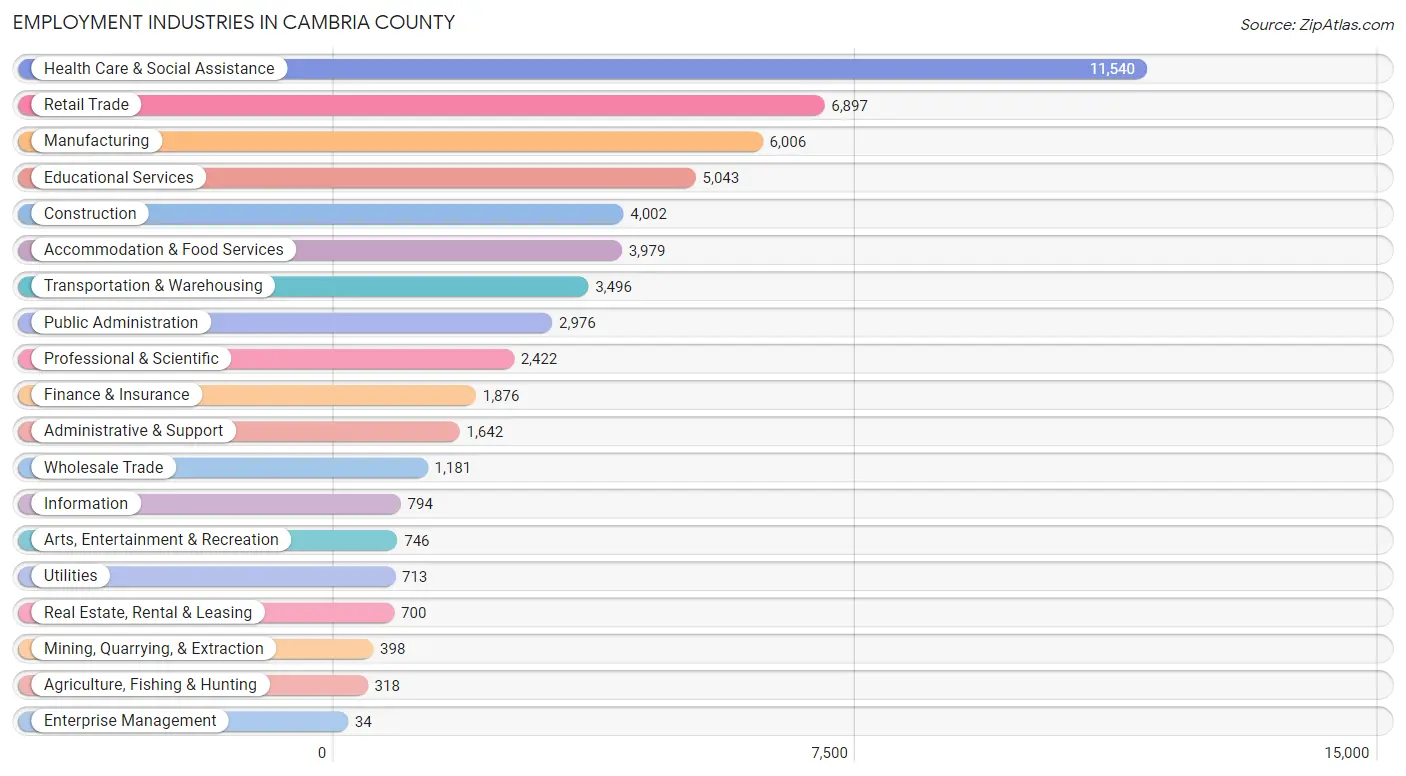
Employment Industries in Cambria County
The major employment industries in Cambria County include Health Care & Social Assistance (11,540 | 20.0%), Retail Trade (6,897 | 11.9%), Manufacturing (6,006 | 10.4%), Educational Services (5,043 | 8.7%), and Construction (4,002 | 6.9%).
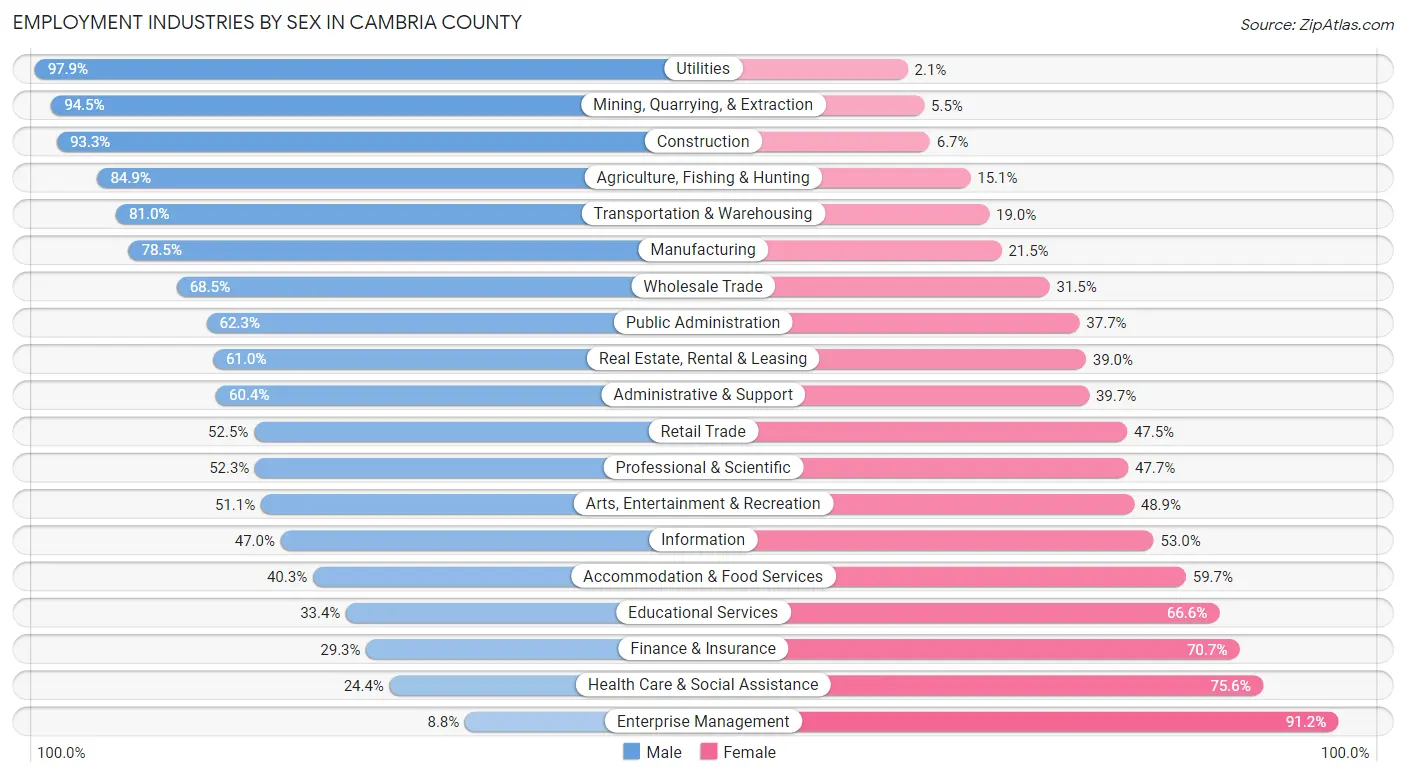
Employment Industries by Sex in Cambria County
The Cambria County industries that see more men than women are Utilities (97.9%), Mining, Quarrying, & Extraction (94.5%), and Construction (93.3%), whereas the industries that tend to have a higher number of women are Enterprise Management (91.2%), Health Care & Social Assistance (75.6%), and Finance & Insurance (70.7%).
| Industry | Male | Female |
| Agriculture, Fishing & Hunting | 270 (84.9%) | 48 (15.1%) |
| Mining, Quarrying, & Extraction | 376 (94.5%) | 22 (5.5%) |
| Construction | 3,734 (93.3%) | 268 (6.7%) |
| Manufacturing | 4,713 (78.5%) | 1,293 (21.5%) |
| Wholesale Trade | 809 (68.5%) | 372 (31.5%) |
| Retail Trade | 3,620 (52.5%) | 3,277 (47.5%) |
| Transportation & Warehousing | 2,833 (81.0%) | 663 (19.0%) |
| Utilities | 698 (97.9%) | 15 (2.1%) |
| Information | 373 (47.0%) | 421 (53.0%) |
| Finance & Insurance | 549 (29.3%) | 1,327 (70.7%) |
| Real Estate, Rental & Leasing | 427 (61.0%) | 273 (39.0%) |
| Professional & Scientific | 1,266 (52.3%) | 1,156 (47.7%) |
| Enterprise Management | 3 (8.8%) | 31 (91.2%) |
| Administrative & Support | 991 (60.4%) | 651 (39.7%) |
| Educational Services | 1,686 (33.4%) | 3,357 (66.6%) |
| Health Care & Social Assistance | 2,819 (24.4%) | 8,721 (75.6%) |
| Arts, Entertainment & Recreation | 381 (51.1%) | 365 (48.9%) |
| Accommodation & Food Services | 1,604 (40.3%) | 2,375 (59.7%) |
| Public Administration | 1,855 (62.3%) | 1,121 (37.7%) |
| Total | 30,380 (52.6%) | 27,327 (47.3%) |
Education in Cambria County
School Enrollment in Cambria County
The most common levels of schooling among the 27,928 students in Cambria County are college / undergraduate (6,683 | 23.9%), high school (6,213 | 22.3%), and middle school (5,873 | 21.0%).
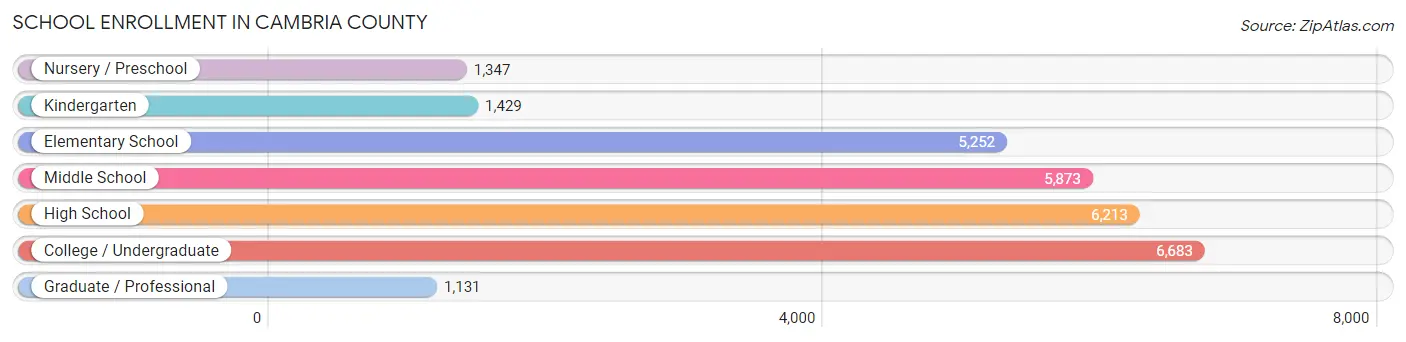
| School Level | # Students | % Students |
| Nursery / Preschool | 1,347 | 4.8% |
| Kindergarten | 1,429 | 5.1% |
| Elementary School | 5,252 | 18.8% |
| Middle School | 5,873 | 21.0% |
| High School | 6,213 | 22.3% |
| College / Undergraduate | 6,683 | 23.9% |
| Graduate / Professional | 1,131 | 4.1% |
| Total | 27,928 | 100.0% |
School Enrollment by Age by Funding Source in Cambria County
Out of a total of 27,928 students who are enrolled in schools in Cambria County, 6,284 (22.5%) attend a private institution, while the remaining 21,644 (77.5%) are enrolled in public schools. The age group of 20 to 24 year olds has the highest likelihood of being enrolled in private schools, with 1,501 (42.6% in the age bracket) enrolled. Conversely, the age group of 10 to 14 year olds has the lowest likelihood of being enrolled in a private school, with 6,576 (86.3% in the age bracket) attending a public institution.
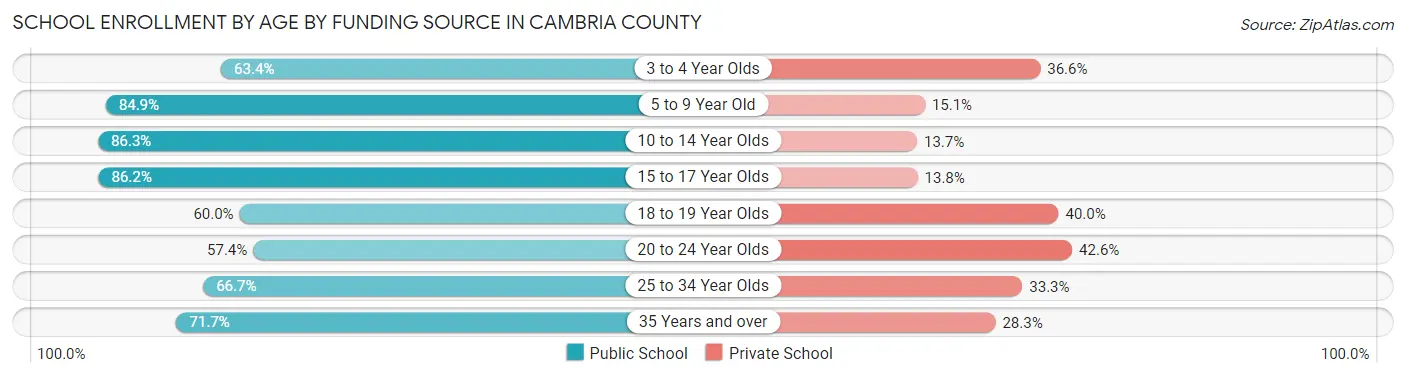
| Age Bracket | Public School | Private School |
| 3 to 4 Year Olds | 578 (63.4%) | 334 (36.6%) |
| 5 to 9 Year Old | 5,153 (84.9%) | 919 (15.1%) |
| 10 to 14 Year Olds | 6,576 (86.3%) | 1,041 (13.7%) |
| 15 to 17 Year Olds | 4,007 (86.2%) | 640 (13.8%) |
| 18 to 19 Year Olds | 1,851 (60.0%) | 1,235 (40.0%) |
| 20 to 24 Year Olds | 2,026 (57.4%) | 1,501 (42.6%) |
| 25 to 34 Year Olds | 459 (66.7%) | 229 (33.3%) |
| 35 Years and over | 989 (71.7%) | 390 (28.3%) |
| Total | 21,644 (77.5%) | 6,284 (22.5%) |
Educational Attainment by Field of Study in Cambria County
Education (4,474 | 19.3%), business (4,148 | 17.8%), science & technology (3,986 | 17.2%), social sciences (1,923 | 8.3%), and bio, nature & agricultural (1,503 | 6.5%) are the most common fields of study among 23,245 individuals in Cambria County who have obtained a bachelor's degree or higher.
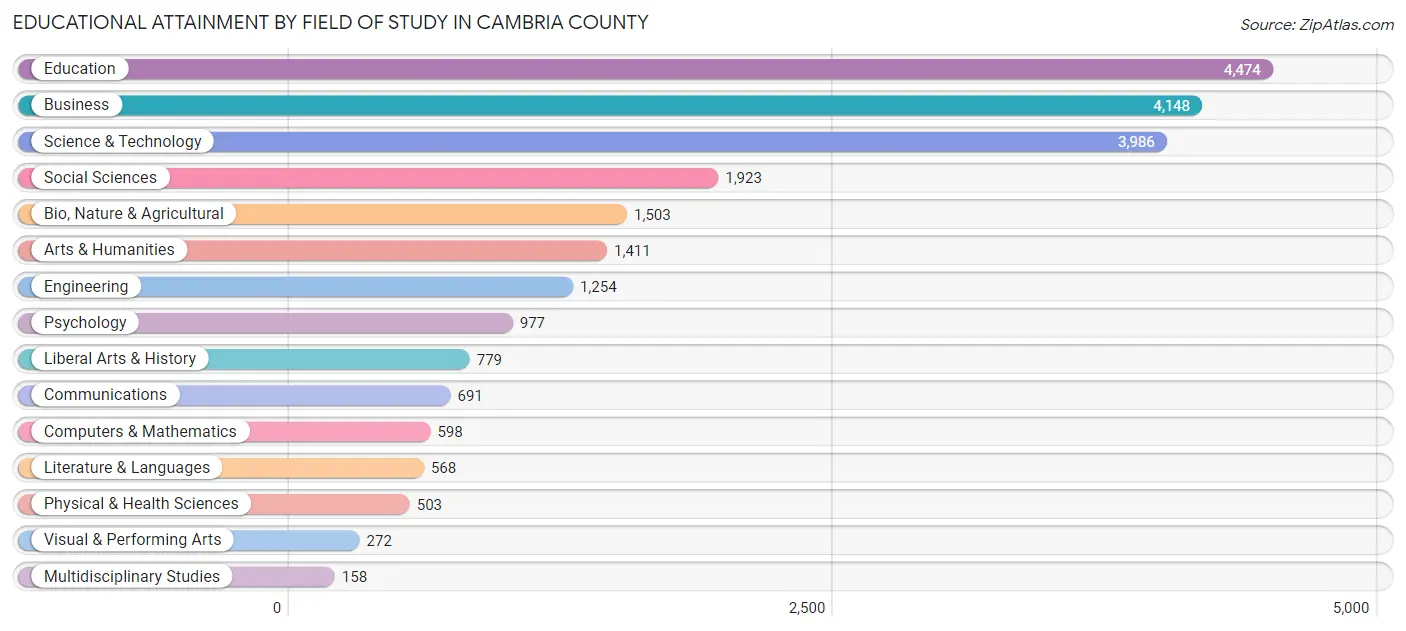
| Field of Study | # Graduates | % Graduates |
| Computers & Mathematics | 598 | 2.6% |
| Bio, Nature & Agricultural | 1,503 | 6.5% |
| Physical & Health Sciences | 503 | 2.2% |
| Psychology | 977 | 4.2% |
| Social Sciences | 1,923 | 8.3% |
| Engineering | 1,254 | 5.4% |
| Multidisciplinary Studies | 158 | 0.7% |
| Science & Technology | 3,986 | 17.2% |
| Business | 4,148 | 17.8% |
| Education | 4,474 | 19.3% |
| Literature & Languages | 568 | 2.4% |
| Liberal Arts & History | 779 | 3.4% |
| Visual & Performing Arts | 272 | 1.2% |
| Communications | 691 | 3.0% |
| Arts & Humanities | 1,411 | 6.1% |
| Total | 23,245 | 100.0% |
Transportation & Commute in Cambria County
Vehicle Availability by Sex in Cambria County
The most prevalent vehicle ownership categories in Cambria County are males with 2 vehicles (12,732, accounting for 42.8%) and females with 2 vehicles (10,800, making up 48.4%).
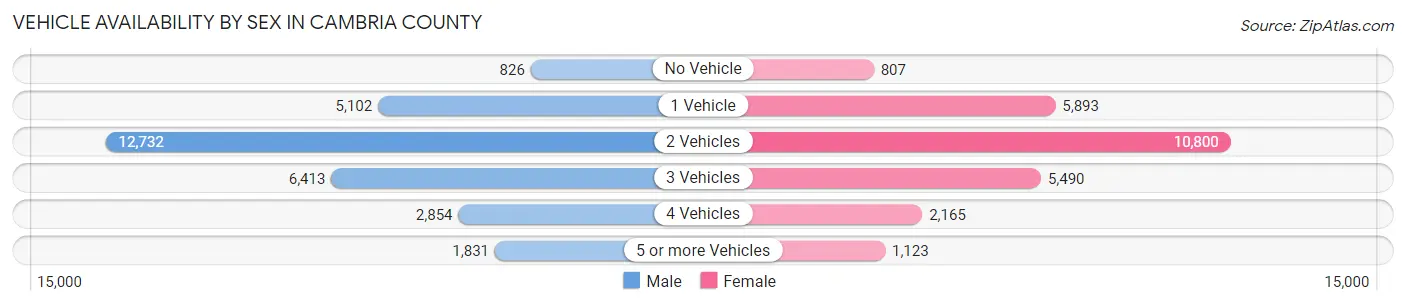
| Vehicles Available | Male | Female |
| No Vehicle | 826 (2.8%) | 807 (3.1%) |
| 1 Vehicle | 5,102 (17.1%) | 5,893 (22.4%) |
| 2 Vehicles | 12,732 (42.8%) | 10,800 (41.1%) |
| 3 Vehicles | 6,413 (21.5%) | 5,490 (20.9%) |
| 4 Vehicles | 2,854 (9.6%) | 2,165 (8.2%) |
| 5 or more Vehicles | 1,831 (6.1%) | 1,123 (4.3%) |
| Total | 29,758 (100.0%) | 26,278 (100.0%) |
Commute Time in Cambria County
The most frequently occuring commute durations in Cambria County are 10 to 14 minutes (8,861 commuters, 17.0%), 15 to 19 minutes (8,052 commuters, 15.4%), and 5 to 9 minutes (7,225 commuters, 13.8%).
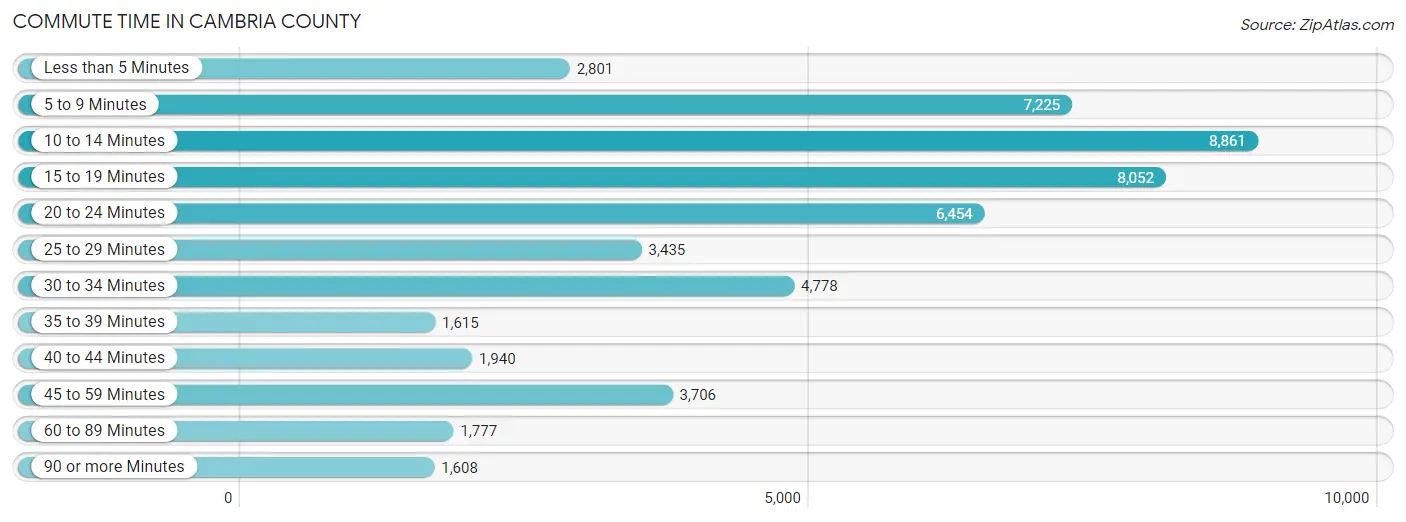
| Commute Time | # Commuters | % Commuters |
| Less than 5 Minutes | 2,801 | 5.4% |
| 5 to 9 Minutes | 7,225 | 13.8% |
| 10 to 14 Minutes | 8,861 | 17.0% |
| 15 to 19 Minutes | 8,052 | 15.4% |
| 20 to 24 Minutes | 6,454 | 12.3% |
| 25 to 29 Minutes | 3,435 | 6.6% |
| 30 to 34 Minutes | 4,778 | 9.1% |
| 35 to 39 Minutes | 1,615 | 3.1% |
| 40 to 44 Minutes | 1,940 | 3.7% |
| 45 to 59 Minutes | 3,706 | 7.1% |
| 60 to 89 Minutes | 1,777 | 3.4% |
| 90 or more Minutes | 1,608 | 3.1% |
Commute Time by Sex in Cambria County
The most common commute times in Cambria County are 10 to 14 minutes (4,302 commuters, 15.4%) for males and 10 to 14 minutes (4,559 commuters, 18.7%) for females.
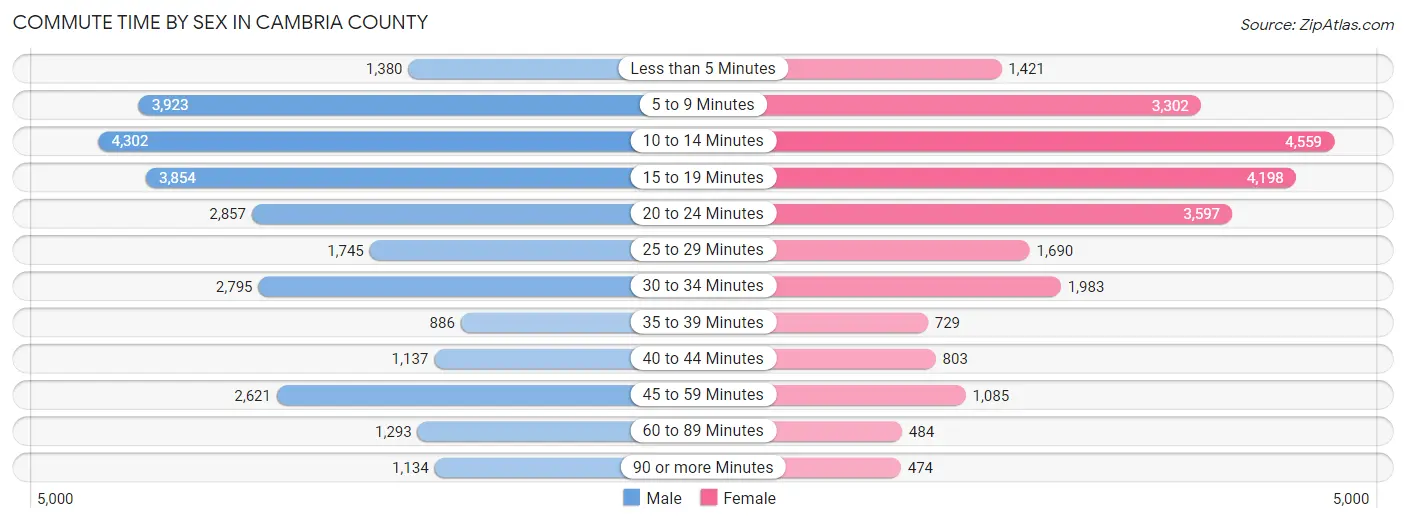
| Commute Time | Male | Female |
| Less than 5 Minutes | 1,380 (4.9%) | 1,421 (5.8%) |
| 5 to 9 Minutes | 3,923 (14.1%) | 3,302 (13.6%) |
| 10 to 14 Minutes | 4,302 (15.4%) | 4,559 (18.7%) |
| 15 to 19 Minutes | 3,854 (13.8%) | 4,198 (17.3%) |
| 20 to 24 Minutes | 2,857 (10.2%) | 3,597 (14.8%) |
| 25 to 29 Minutes | 1,745 (6.2%) | 1,690 (7.0%) |
| 30 to 34 Minutes | 2,795 (10.0%) | 1,983 (8.2%) |
| 35 to 39 Minutes | 886 (3.2%) | 729 (3.0%) |
| 40 to 44 Minutes | 1,137 (4.1%) | 803 (3.3%) |
| 45 to 59 Minutes | 2,621 (9.4%) | 1,085 (4.5%) |
| 60 to 89 Minutes | 1,293 (4.6%) | 484 (2.0%) |
| 90 or more Minutes | 1,134 (4.1%) | 474 (1.9%) |
Time of Departure to Work by Sex in Cambria County
The most frequent times of departure to work in Cambria County are 7:00 AM to 7:29 AM (3,450, 12.3%) for males and 7:00 AM to 7:29 AM (4,002, 16.5%) for females.
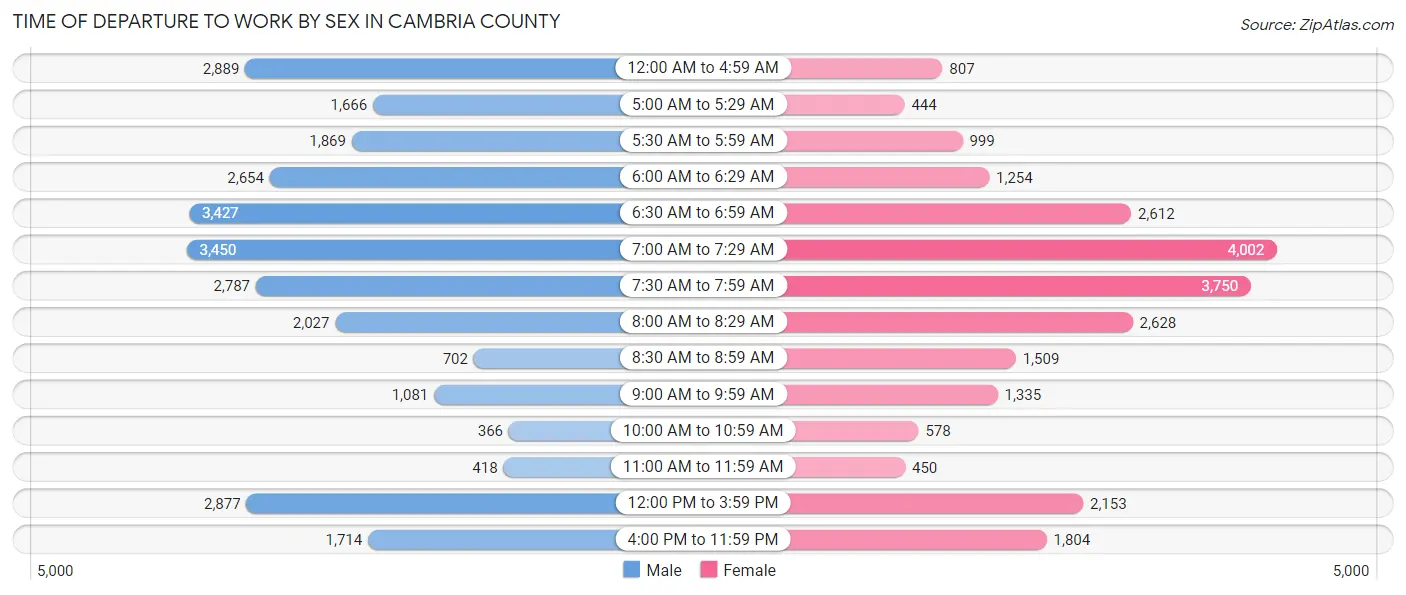
| Time of Departure | Male | Female |
| 12:00 AM to 4:59 AM | 2,889 (10.3%) | 807 (3.3%) |
| 5:00 AM to 5:29 AM | 1,666 (6.0%) | 444 (1.8%) |
| 5:30 AM to 5:59 AM | 1,869 (6.7%) | 999 (4.1%) |
| 6:00 AM to 6:29 AM | 2,654 (9.5%) | 1,254 (5.2%) |
| 6:30 AM to 6:59 AM | 3,427 (12.3%) | 2,612 (10.7%) |
| 7:00 AM to 7:29 AM | 3,450 (12.3%) | 4,002 (16.5%) |
| 7:30 AM to 7:59 AM | 2,787 (10.0%) | 3,750 (15.4%) |
| 8:00 AM to 8:29 AM | 2,027 (7.3%) | 2,628 (10.8%) |
| 8:30 AM to 8:59 AM | 702 (2.5%) | 1,509 (6.2%) |
| 9:00 AM to 9:59 AM | 1,081 (3.9%) | 1,335 (5.5%) |
| 10:00 AM to 10:59 AM | 366 (1.3%) | 578 (2.4%) |
| 11:00 AM to 11:59 AM | 418 (1.5%) | 450 (1.8%) |
| 12:00 PM to 3:59 PM | 2,877 (10.3%) | 2,153 (8.8%) |
| 4:00 PM to 11:59 PM | 1,714 (6.1%) | 1,804 (7.4%) |
| Total | 27,927 (100.0%) | 24,325 (100.0%) |
Housing Occupancy in Cambria County
Occupancy by Ownership in Cambria County
Of the total 55,541 dwellings in Cambria County, owner-occupied units account for 42,088 (75.8%), while renter-occupied units make up 13,453 (24.2%).
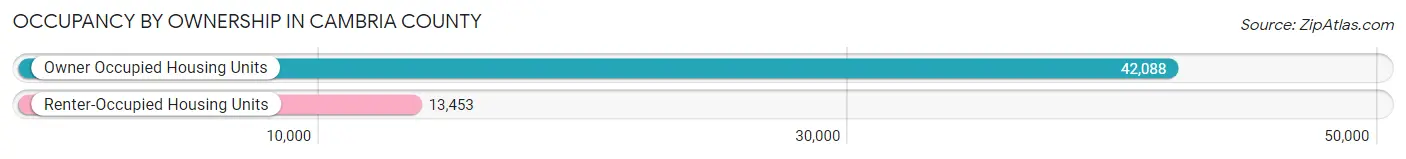
| Occupancy | # Housing Units | % Housing Units |
| Owner Occupied Housing Units | 42,088 | 75.8% |
| Renter-Occupied Housing Units | 13,453 | 24.2% |
| Total Occupied Housing Units | 55,541 | 100.0% |
Occupancy by Household Size in Cambria County
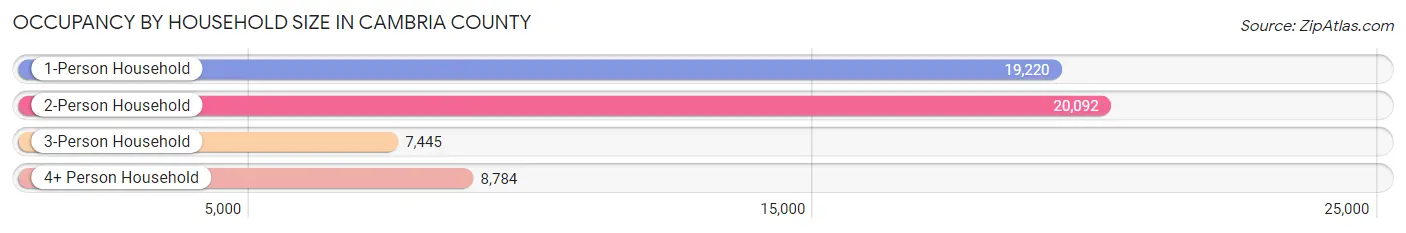
| Household Size | # Housing Units | % Housing Units |
| 1-Person Household | 19,220 | 34.6% |
| 2-Person Household | 20,092 | 36.2% |
| 3-Person Household | 7,445 | 13.4% |
| 4+ Person Household | 8,784 | 15.8% |
| Total Housing Units | 55,541 | 100.0% |
Occupancy by Ownership by Household Size in Cambria County
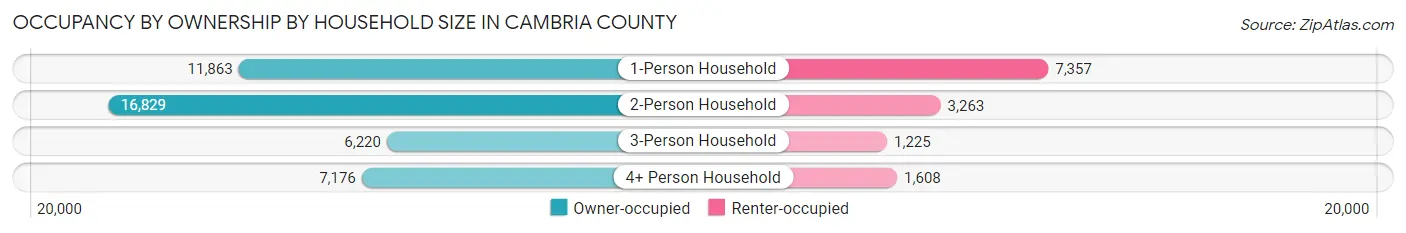
| Household Size | Owner-occupied | Renter-occupied |
| 1-Person Household | 11,863 (61.7%) | 7,357 (38.3%) |
| 2-Person Household | 16,829 (83.8%) | 3,263 (16.2%) |
| 3-Person Household | 6,220 (83.6%) | 1,225 (16.5%) |
| 4+ Person Household | 7,176 (81.7%) | 1,608 (18.3%) |
| Total Housing Units | 42,088 (75.8%) | 13,453 (24.2%) |
Occupancy by Educational Attainment in Cambria County
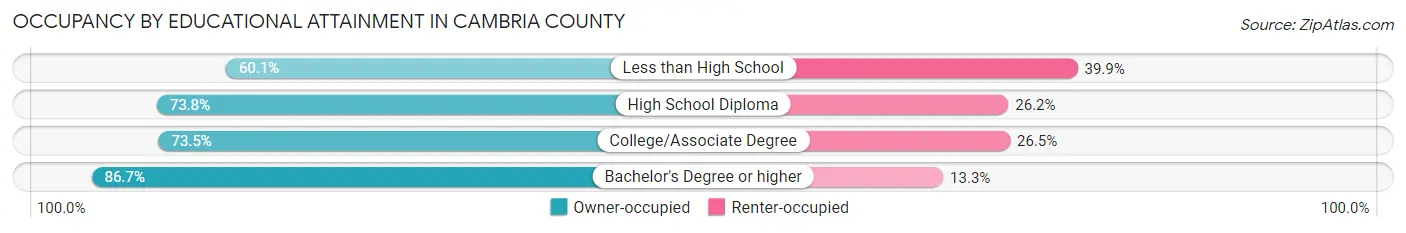
| Household Size | Owner-occupied | Renter-occupied |
| Less than High School | 2,240 (60.1%) | 1,489 (39.9%) |
| High School Diploma | 17,614 (73.8%) | 6,255 (26.2%) |
| College/Associate Degree | 11,071 (73.5%) | 3,999 (26.5%) |
| Bachelor's Degree or higher | 11,163 (86.7%) | 1,710 (13.3%) |
Occupancy by Age of Householder in Cambria County
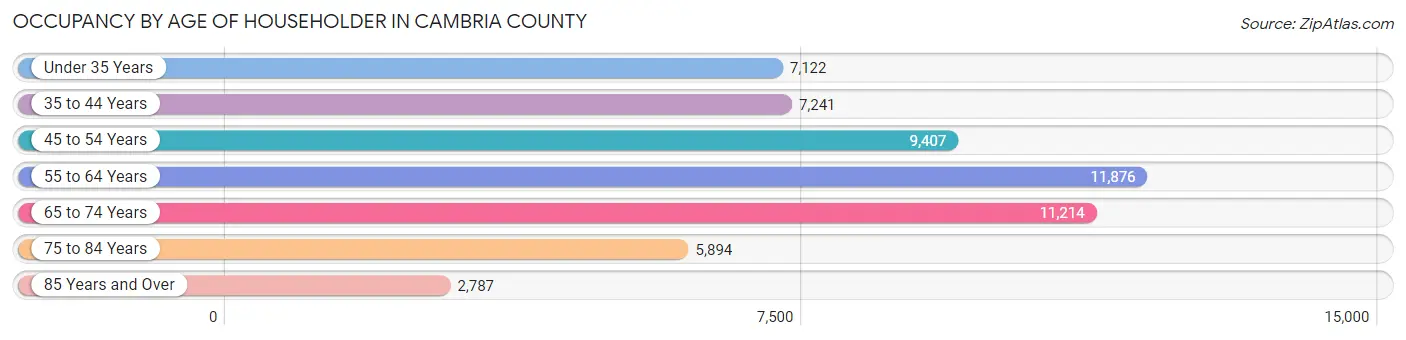
| Age Bracket | # Households | % Households |
| Under 35 Years | 7,122 | 12.8% |
| 35 to 44 Years | 7,241 | 13.0% |
| 45 to 54 Years | 9,407 | 16.9% |
| 55 to 64 Years | 11,876 | 21.4% |
| 65 to 74 Years | 11,214 | 20.2% |
| 75 to 84 Years | 5,894 | 10.6% |
| 85 Years and Over | 2,787 | 5.0% |
| Total | 55,541 | 100.0% |
Housing Finances in Cambria County
Median Income by Occupancy in Cambria County
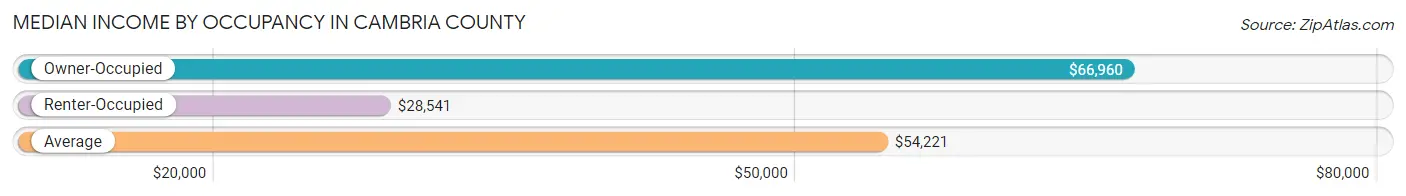
| Occupancy Type | # Households | Median Income |
| Owner-Occupied | 42,088 (75.8%) | $66,960 |
| Renter-Occupied | 13,453 (24.2%) | $28,541 |
| Average | 55,541 (100.0%) | $54,221 |
Occupancy by Householder Income Bracket in Cambria County
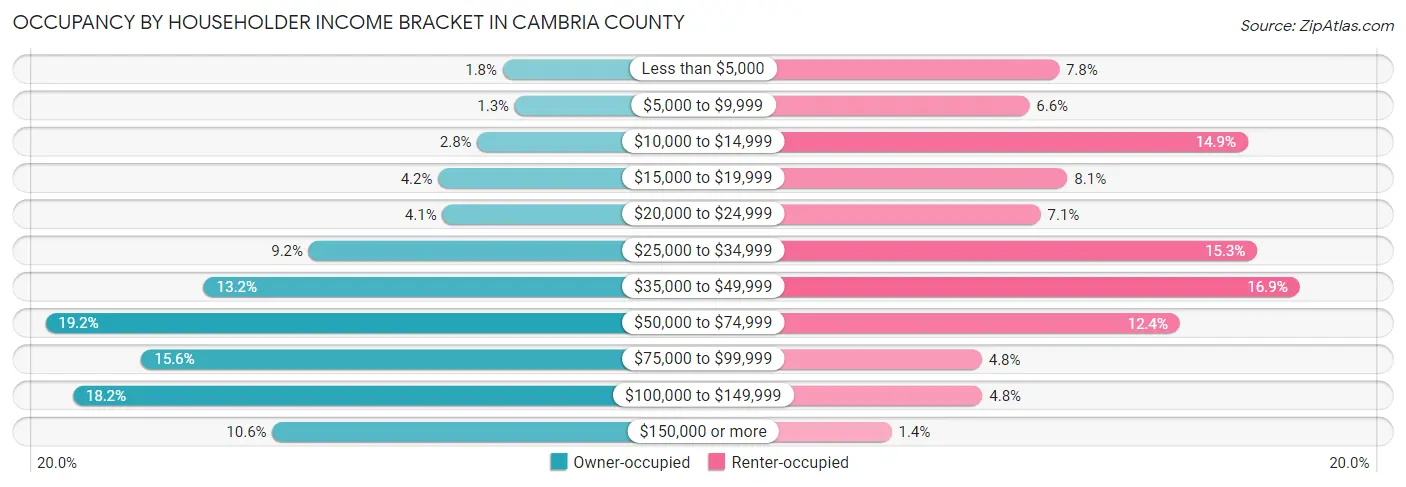
| Income Bracket | Owner-occupied | Renter-occupied |
| Less than $5,000 | 749 (1.8%) | 1,042 (7.7%) |
| $5,000 to $9,999 | 555 (1.3%) | 890 (6.6%) |
| $10,000 to $14,999 | 1,158 (2.8%) | 2,010 (14.9%) |
| $15,000 to $19,999 | 1,785 (4.2%) | 1,086 (8.1%) |
| $20,000 to $24,999 | 1,716 (4.1%) | 949 (7.0%) |
| $25,000 to $34,999 | 3,858 (9.2%) | 2,058 (15.3%) |
| $35,000 to $49,999 | 5,549 (13.2%) | 2,275 (16.9%) |
| $50,000 to $74,999 | 8,085 (19.2%) | 1,662 (12.3%) |
| $75,000 to $99,999 | 6,544 (15.5%) | 647 (4.8%) |
| $100,000 to $149,999 | 7,645 (18.2%) | 650 (4.8%) |
| $150,000 or more | 4,444 (10.6%) | 184 (1.4%) |
| Total | 42,088 (100.0%) | 13,453 (100.0%) |
Monthly Housing Cost Tiers in Cambria County
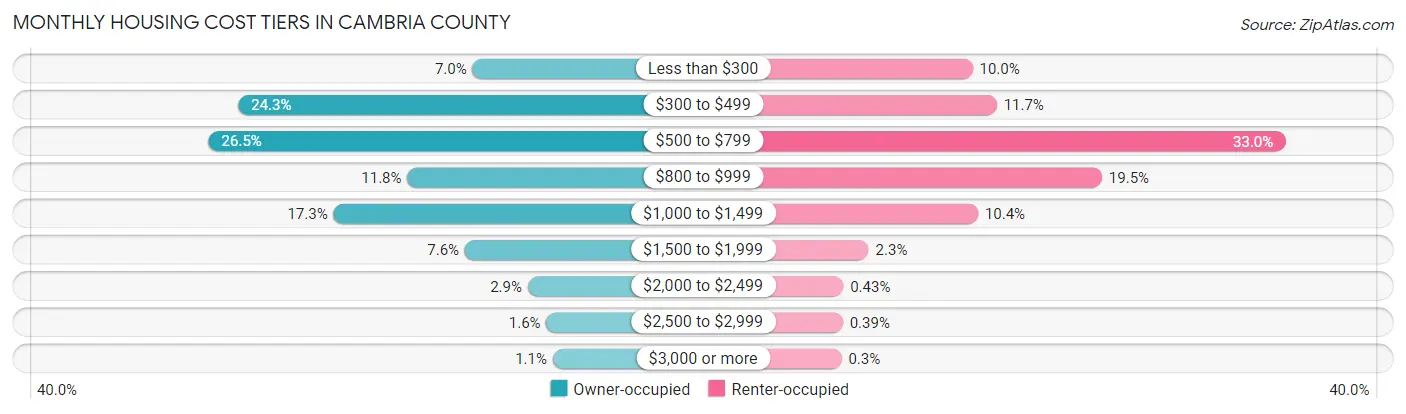
| Monthly Cost | Owner-occupied | Renter-occupied |
| Less than $300 | 2,952 (7.0%) | 1,338 (10.0%) |
| $300 to $499 | 10,220 (24.3%) | 1,578 (11.7%) |
| $500 to $799 | 11,138 (26.5%) | 4,435 (33.0%) |
| $800 to $999 | 4,970 (11.8%) | 2,620 (19.5%) |
| $1,000 to $1,499 | 7,259 (17.2%) | 1,393 (10.3%) |
| $1,500 to $1,999 | 3,185 (7.6%) | 310 (2.3%) |
| $2,000 to $2,499 | 1,238 (2.9%) | 58 (0.4%) |
| $2,500 to $2,999 | 661 (1.6%) | 52 (0.4%) |
| $3,000 or more | 465 (1.1%) | 40 (0.3%) |
| Total | 42,088 (100.0%) | 13,453 (100.0%) |
Physical Housing Characteristics in Cambria County
Housing Structures in Cambria County
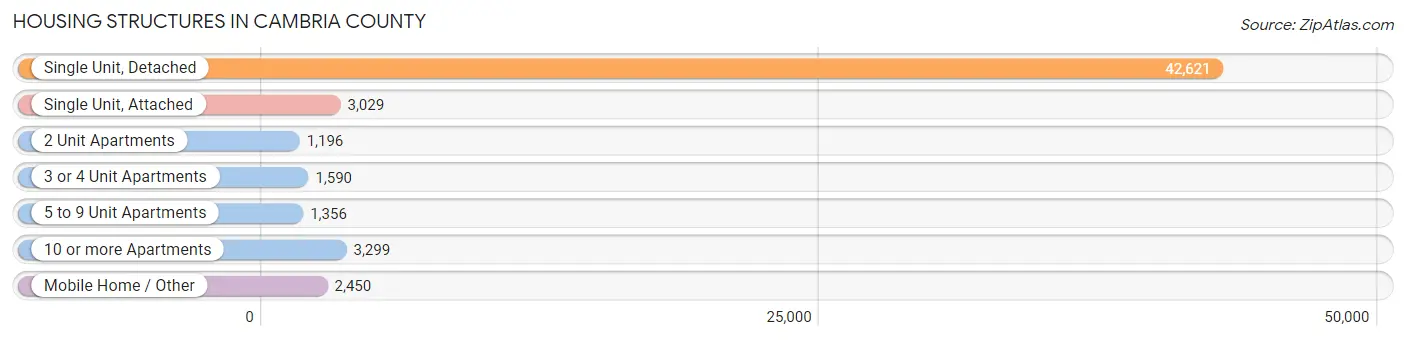
| Structure Type | # Housing Units | % Housing Units |
| Single Unit, Detached | 42,621 | 76.7% |
| Single Unit, Attached | 3,029 | 5.4% |
| 2 Unit Apartments | 1,196 | 2.1% |
| 3 or 4 Unit Apartments | 1,590 | 2.9% |
| 5 to 9 Unit Apartments | 1,356 | 2.4% |
| 10 or more Apartments | 3,299 | 5.9% |
| Mobile Home / Other | 2,450 | 4.4% |
| Total | 55,541 | 100.0% |
Housing Structures by Occupancy in Cambria County
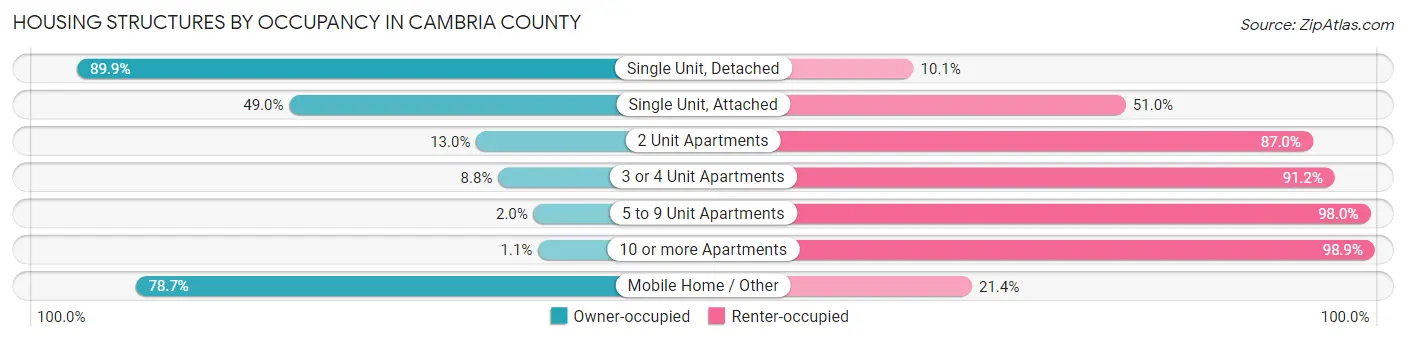
| Structure Type | Owner-occupied | Renter-occupied |
| Single Unit, Detached | 38,316 (89.9%) | 4,305 (10.1%) |
| Single Unit, Attached | 1,485 (49.0%) | 1,544 (51.0%) |
| 2 Unit Apartments | 156 (13.0%) | 1,040 (87.0%) |
| 3 or 4 Unit Apartments | 140 (8.8%) | 1,450 (91.2%) |
| 5 to 9 Unit Apartments | 27 (2.0%) | 1,329 (98.0%) |
| 10 or more Apartments | 37 (1.1%) | 3,262 (98.9%) |
| Mobile Home / Other | 1,927 (78.6%) | 523 (21.3%) |
| Total | 42,088 (75.8%) | 13,453 (24.2%) |
Housing Structures by Number of Rooms in Cambria County
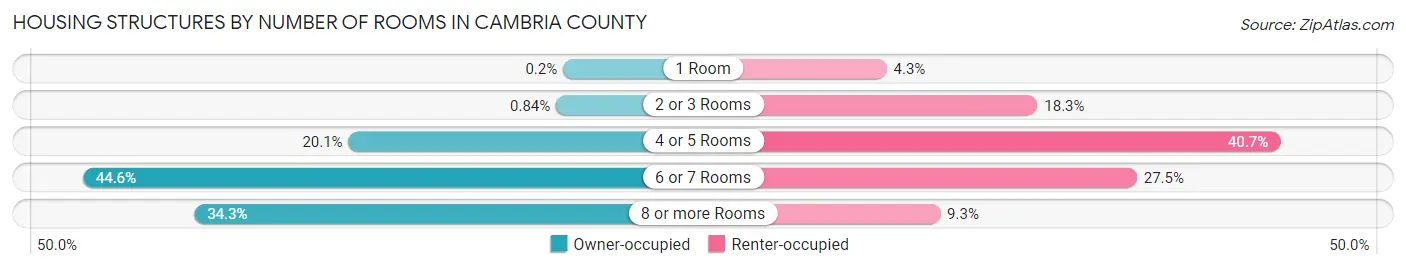
| Number of Rooms | Owner-occupied | Renter-occupied |
| 1 Room | 83 (0.2%) | 581 (4.3%) |
| 2 or 3 Rooms | 353 (0.8%) | 2,456 (18.3%) |
| 4 or 5 Rooms | 8,439 (20.1%) | 5,475 (40.7%) |
| 6 or 7 Rooms | 18,774 (44.6%) | 3,694 (27.5%) |
| 8 or more Rooms | 14,439 (34.3%) | 1,247 (9.3%) |
| Total | 42,088 (100.0%) | 13,453 (100.0%) |
Housing Structure by Heating Type in Cambria County
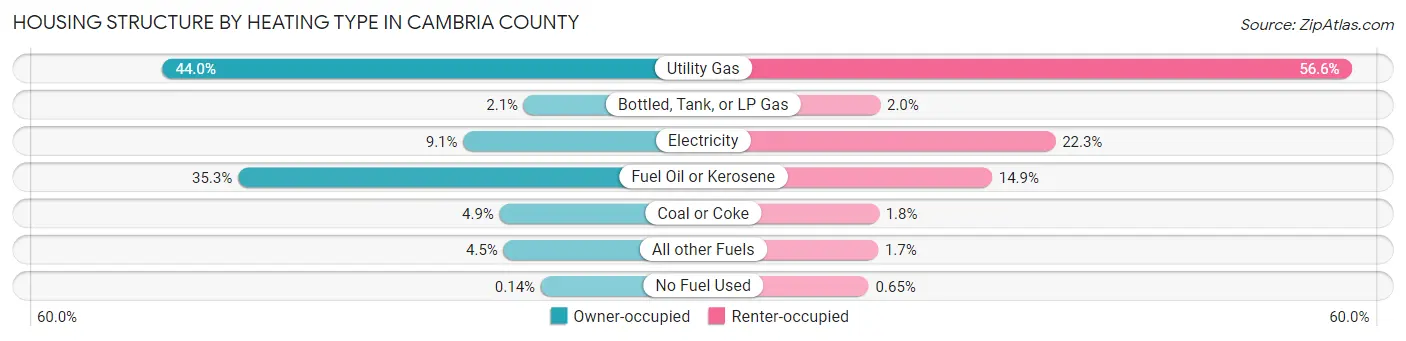
| Heating Type | Owner-occupied | Renter-occupied |
| Utility Gas | 18,517 (44.0%) | 7,617 (56.6%) |
| Bottled, Tank, or LP Gas | 887 (2.1%) | 265 (2.0%) |
| Electricity | 3,841 (9.1%) | 2,998 (22.3%) |
| Fuel Oil or Kerosene | 14,836 (35.2%) | 2,008 (14.9%) |
| Coal or Coke | 2,072 (4.9%) | 245 (1.8%) |
| All other Fuels | 1,875 (4.4%) | 233 (1.7%) |
| No Fuel Used | 60 (0.1%) | 87 (0.6%) |
| Total | 42,088 (100.0%) | 13,453 (100.0%) |
Household Vehicle Usage in Cambria County
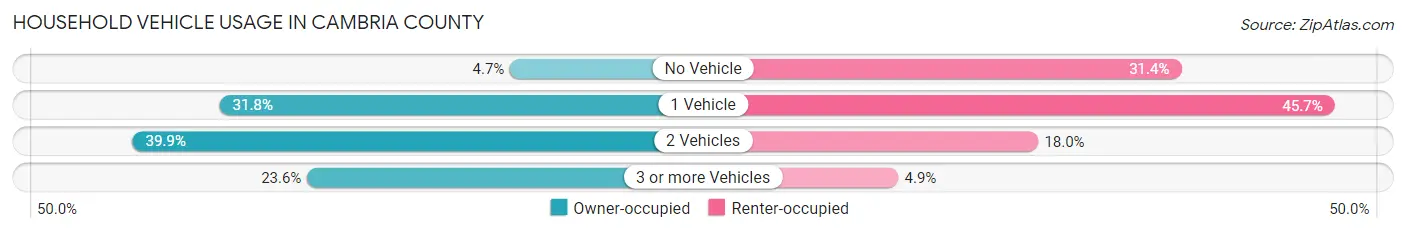
| Vehicles per Household | Owner-occupied | Renter-occupied |
| No Vehicle | 1,965 (4.7%) | 4,223 (31.4%) |
| 1 Vehicle | 13,378 (31.8%) | 6,150 (45.7%) |
| 2 Vehicles | 16,802 (39.9%) | 2,418 (18.0%) |
| 3 or more Vehicles | 9,943 (23.6%) | 662 (4.9%) |
| Total | 42,088 (100.0%) | 13,453 (100.0%) |
Real Estate & Mortgages in Cambria County
Real Estate and Mortgage Overview in Cambria County
| Characteristic | Without Mortgage | With Mortgage |
| Housing Units | 23,125 | 18,963 |
| Median Property Value | $94,900 | $130,000 |
| Median Household Income | $51,036 | $3,126 |
| Monthly Housing Costs | $478 | $420 |
| Real Estate Taxes | $1,329 | $206 |
Property Value by Mortgage Status in Cambria County
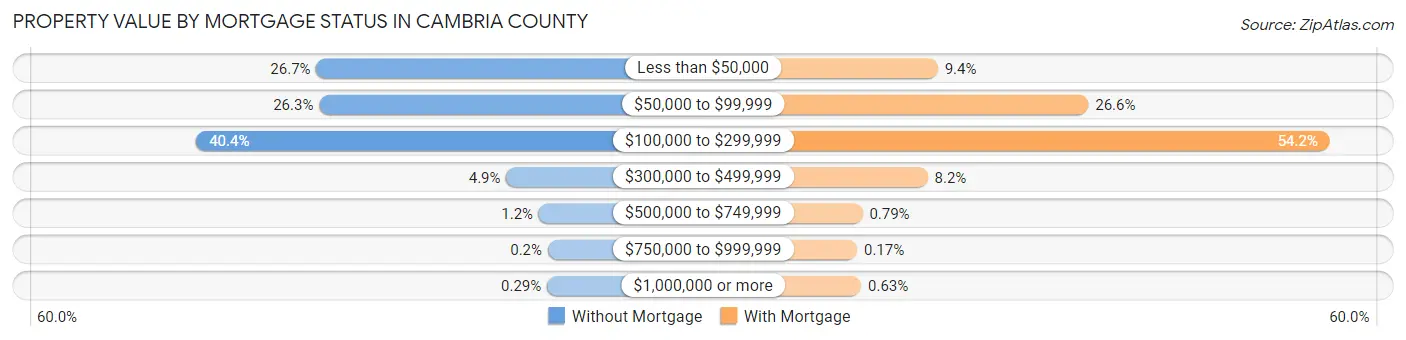
| Property Value | Without Mortgage | With Mortgage |
| Less than $50,000 | 6,163 (26.7%) | 1,781 (9.4%) |
| $50,000 to $99,999 | 6,088 (26.3%) | 5,044 (26.6%) |
| $100,000 to $299,999 | 9,338 (40.4%) | 10,276 (54.2%) |
| $300,000 to $499,999 | 1,143 (4.9%) | 1,560 (8.2%) |
| $500,000 to $749,999 | 281 (1.2%) | 150 (0.8%) |
| $750,000 to $999,999 | 46 (0.2%) | 32 (0.2%) |
| $1,000,000 or more | 66 (0.3%) | 120 (0.6%) |
| Total | 23,125 (100.0%) | 18,963 (100.0%) |
Household Income by Mortgage Status in Cambria County
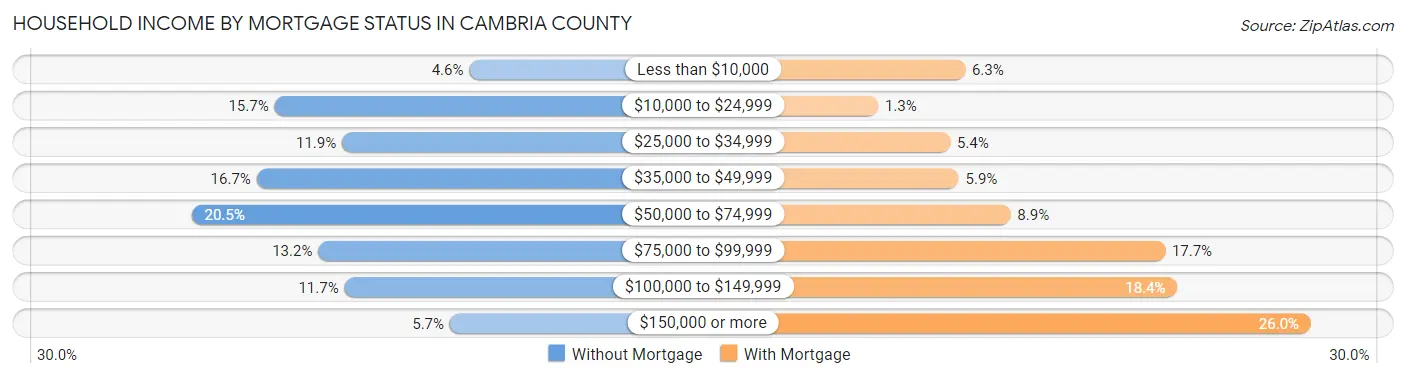
| Household Income | Without Mortgage | With Mortgage |
| Less than $10,000 | 1,061 (4.6%) | 1,186 (6.2%) |
| $10,000 to $24,999 | 3,635 (15.7%) | 243 (1.3%) |
| $25,000 to $34,999 | 2,742 (11.9%) | 1,024 (5.4%) |
| $35,000 to $49,999 | 3,870 (16.7%) | 1,116 (5.9%) |
| $50,000 to $74,999 | 4,732 (20.5%) | 1,679 (8.8%) |
| $75,000 to $99,999 | 3,056 (13.2%) | 3,353 (17.7%) |
| $100,000 to $149,999 | 2,711 (11.7%) | 3,488 (18.4%) |
| $150,000 or more | 1,318 (5.7%) | 4,934 (26.0%) |
| Total | 23,125 (100.0%) | 18,963 (100.0%) |
Property Value to Household Income Ratio in Cambria County
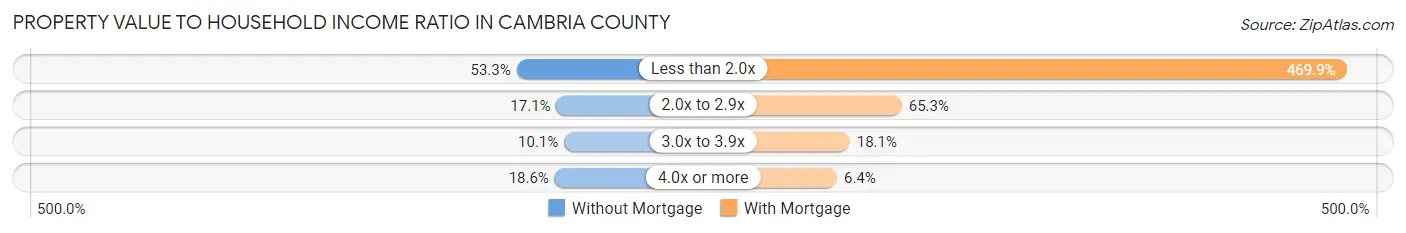
| Value-to-Income Ratio | Without Mortgage | With Mortgage |
| Less than 2.0x | 12,327 (53.3%) | 89,104 (469.9%) |
| 2.0x to 2.9x | 3,955 (17.1%) | 12,380 (65.3%) |
| 3.0x to 3.9x | 2,333 (10.1%) | 3,431 (18.1%) |
| 4.0x or more | 4,308 (18.6%) | 1,222 (6.4%) |
| Total | 23,125 (100.0%) | 18,963 (100.0%) |
Real Estate Taxes by Mortgage Status in Cambria County
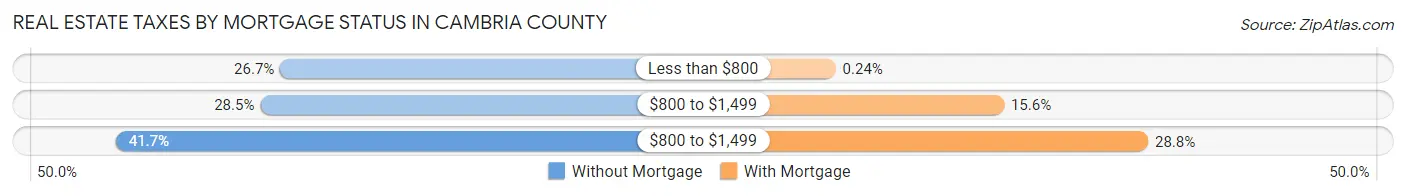
| Property Taxes | Without Mortgage | With Mortgage |
| Less than $800 | 6,164 (26.7%) | 45 (0.2%) |
| $800 to $1,499 | 6,587 (28.5%) | 2,961 (15.6%) |
| $800 to $1,499 | 9,637 (41.7%) | 5,456 (28.8%) |
| Total | 23,125 (100.0%) | 18,963 (100.0%) |
Health & Disability in Cambria County
Health Insurance Coverage by Age in Cambria County
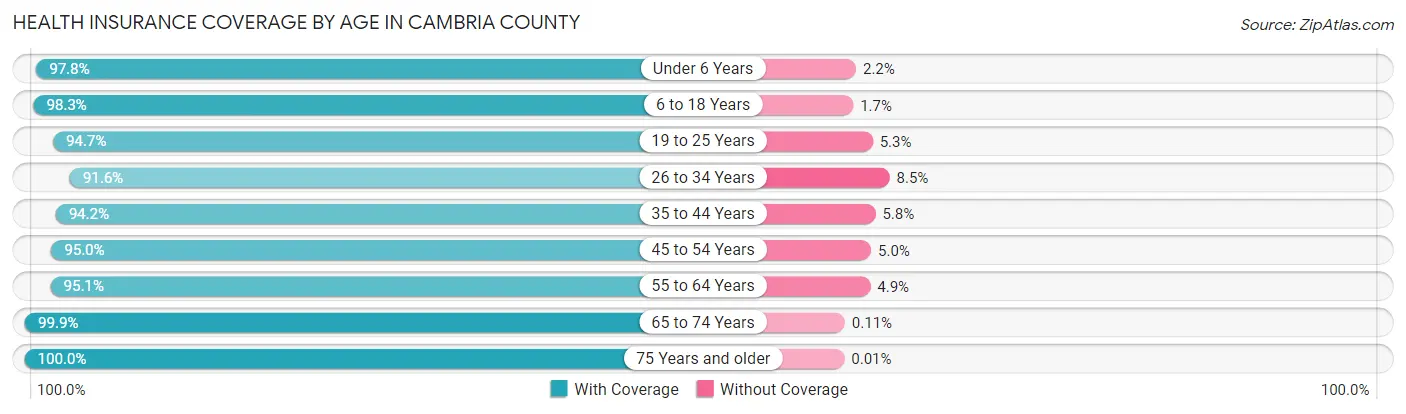
| Age Bracket | With Coverage | Without Coverage |
| Under 6 Years | 7,416 (97.8%) | 166 (2.2%) |
| 6 to 18 Years | 19,013 (98.3%) | 320 (1.7%) |
| 19 to 25 Years | 10,751 (94.7%) | 602 (5.3%) |
| 26 to 34 Years | 11,312 (91.5%) | 1,044 (8.5%) |
| 35 to 44 Years | 12,950 (94.2%) | 799 (5.8%) |
| 45 to 54 Years | 15,508 (95.0%) | 817 (5.0%) |
| 55 to 64 Years | 18,886 (95.1%) | 964 (4.9%) |
| 65 to 74 Years | 17,528 (99.9%) | 20 (0.1%) |
| 75 Years and older | 12,253 (100.0%) | 1 (0.0%) |
| Total | 125,617 (96.4%) | 4,733 (3.6%) |
Health Insurance Coverage by Citizenship Status in Cambria County
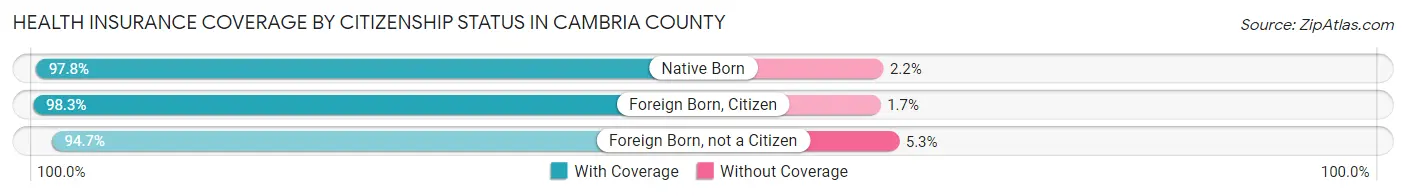
| Citizenship Status | With Coverage | Without Coverage |
| Native Born | 7,416 (97.8%) | 166 (2.2%) |
| Foreign Born, Citizen | 19,013 (98.3%) | 320 (1.7%) |
| Foreign Born, not a Citizen | 10,751 (94.7%) | 602 (5.3%) |
Health Insurance Coverage by Household Income in Cambria County
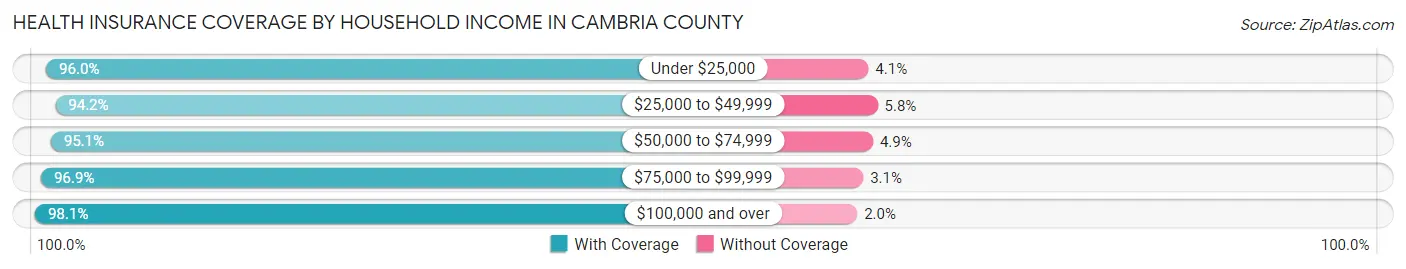
| Household Income | With Coverage | Without Coverage |
| Under $25,000 | 17,920 (96.0%) | 756 (4.1%) |
| $25,000 to $49,999 | 23,994 (94.2%) | 1,470 (5.8%) |
| $50,000 to $74,999 | 21,197 (95.1%) | 1,095 (4.9%) |
| $75,000 to $99,999 | 18,303 (96.9%) | 582 (3.1%) |
| $100,000 and over | 40,378 (98.1%) | 801 (1.9%) |
Public vs Private Health Insurance Coverage by Age in Cambria County
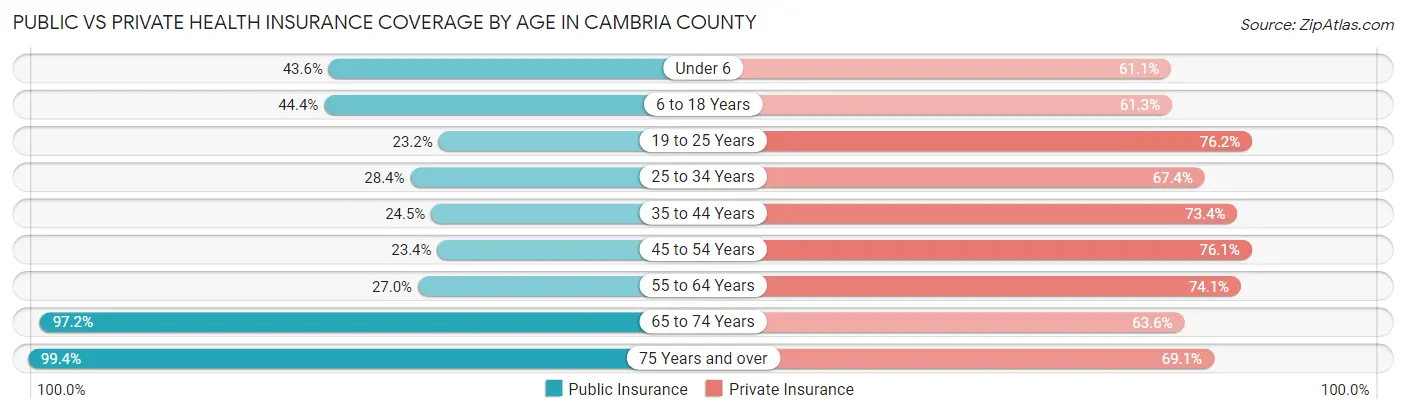
| Age Bracket | Public Insurance | Private Insurance |
| Under 6 | 3,302 (43.5%) | 4,635 (61.1%) |
| 6 to 18 Years | 8,582 (44.4%) | 11,852 (61.3%) |
| 19 to 25 Years | 2,629 (23.2%) | 8,646 (76.2%) |
| 25 to 34 Years | 3,509 (28.4%) | 8,325 (67.4%) |
| 35 to 44 Years | 3,372 (24.5%) | 10,095 (73.4%) |
| 45 to 54 Years | 3,819 (23.4%) | 12,416 (76.1%) |
| 55 to 64 Years | 5,357 (27.0%) | 14,704 (74.1%) |
| 65 to 74 Years | 17,053 (97.2%) | 11,159 (63.6%) |
| 75 Years and over | 12,179 (99.4%) | 8,462 (69.1%) |
| Total | 59,802 (45.9%) | 90,294 (69.3%) |
Disability Status by Sex by Age in Cambria County
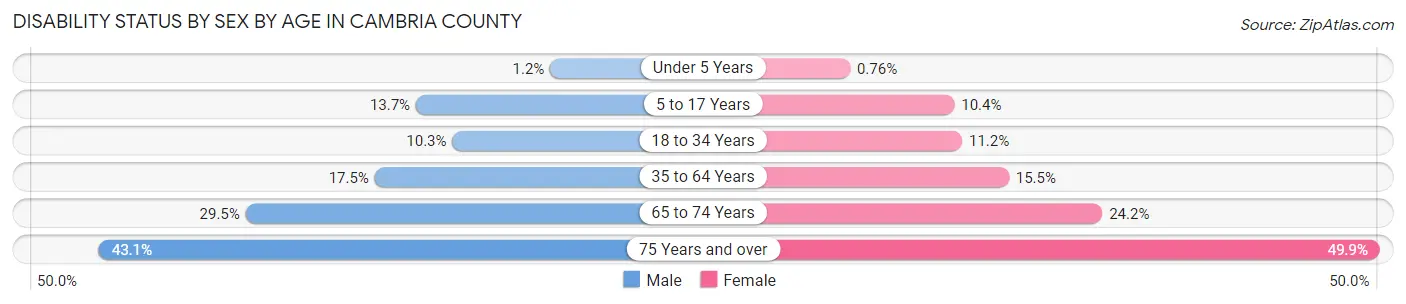
| Age Bracket | Male | Female |
| Under 5 Years | 40 (1.2%) | 23 (0.8%) |
| 5 to 17 Years | 1,340 (13.7%) | 956 (10.4%) |
| 18 to 34 Years | 1,339 (10.3%) | 1,381 (11.2%) |
| 35 to 64 Years | 4,385 (17.5%) | 3,858 (15.5%) |
| 65 to 74 Years | 2,521 (29.5%) | 2,175 (24.2%) |
| 75 Years and over | 2,135 (43.1%) | 3,646 (49.9%) |
Disability Class by Sex by Age in Cambria County
Disability Class: Hearing Difficulty
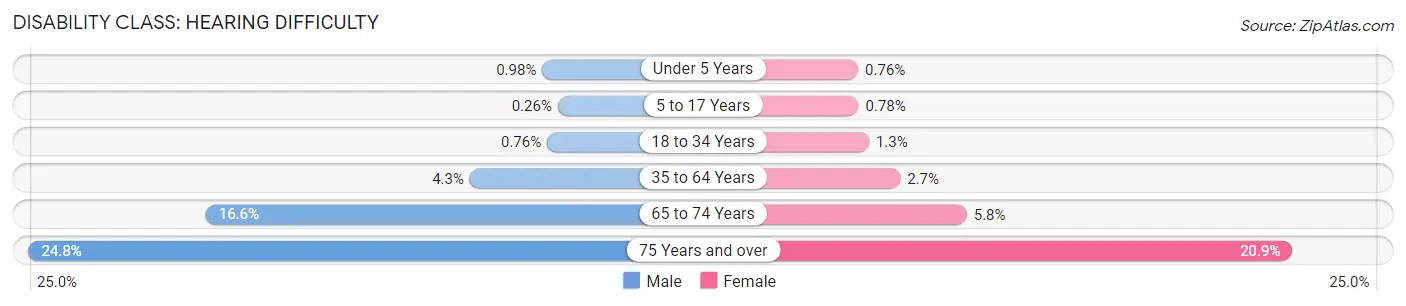
| Age Bracket | Male | Female |
| Under 5 Years | 32 (1.0%) | 23 (0.8%) |
| 5 to 17 Years | 25 (0.3%) | 71 (0.8%) |
| 18 to 34 Years | 99 (0.8%) | 156 (1.3%) |
| 35 to 64 Years | 1,087 (4.3%) | 675 (2.7%) |
| 65 to 74 Years | 1,418 (16.6%) | 522 (5.8%) |
| 75 Years and over | 1,229 (24.8%) | 1,526 (20.9%) |
Disability Class: Vision Difficulty
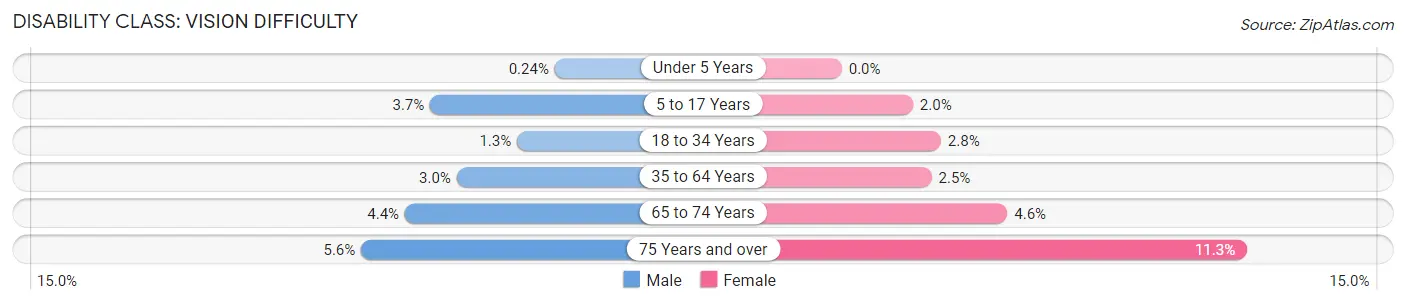
| Age Bracket | Male | Female |
| Under 5 Years | 8 (0.2%) | 0 (0.0%) |
| 5 to 17 Years | 363 (3.7%) | 181 (2.0%) |
| 18 to 34 Years | 168 (1.3%) | 342 (2.8%) |
| 35 to 64 Years | 744 (3.0%) | 621 (2.5%) |
| 65 to 74 Years | 377 (4.4%) | 415 (4.6%) |
| 75 Years and over | 279 (5.6%) | 824 (11.3%) |
Disability Class: Cognitive Difficulty
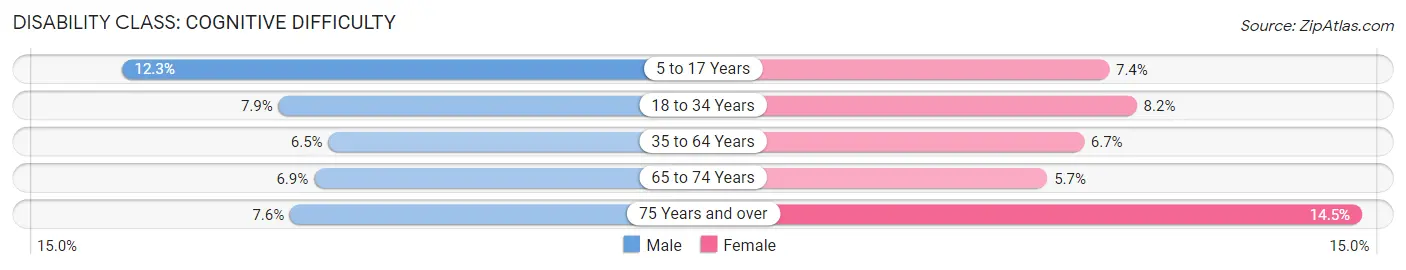
| Age Bracket | Male | Female |
| 5 to 17 Years | 1,205 (12.3%) | 681 (7.4%) |
| 18 to 34 Years | 1,031 (7.9%) | 1,016 (8.2%) |
| 35 to 64 Years | 1,637 (6.5%) | 1,678 (6.7%) |
| 65 to 74 Years | 593 (6.9%) | 515 (5.7%) |
| 75 Years and over | 377 (7.6%) | 1,057 (14.5%) |
Disability Class: Ambulatory Difficulty
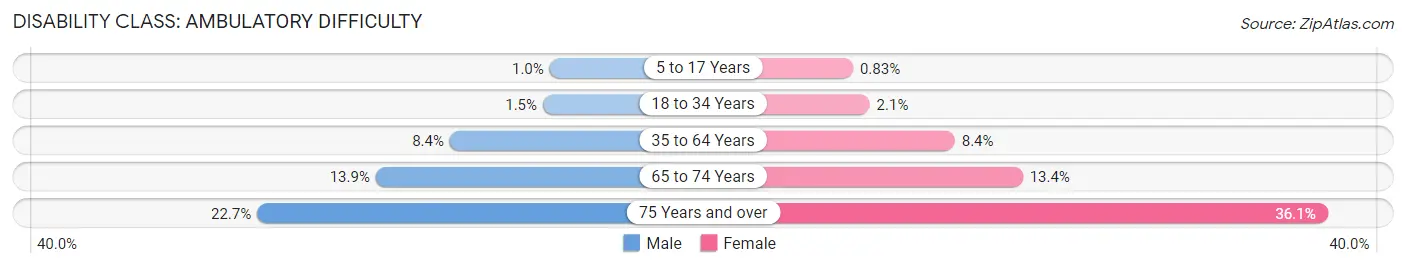
| Age Bracket | Male | Female |
| 5 to 17 Years | 100 (1.0%) | 76 (0.8%) |
| 18 to 34 Years | 198 (1.5%) | 256 (2.1%) |
| 35 to 64 Years | 2,111 (8.4%) | 2,089 (8.4%) |
| 65 to 74 Years | 1,191 (13.9%) | 1,209 (13.4%) |
| 75 Years and over | 1,126 (22.7%) | 2,633 (36.1%) |
Disability Class: Self-Care Difficulty
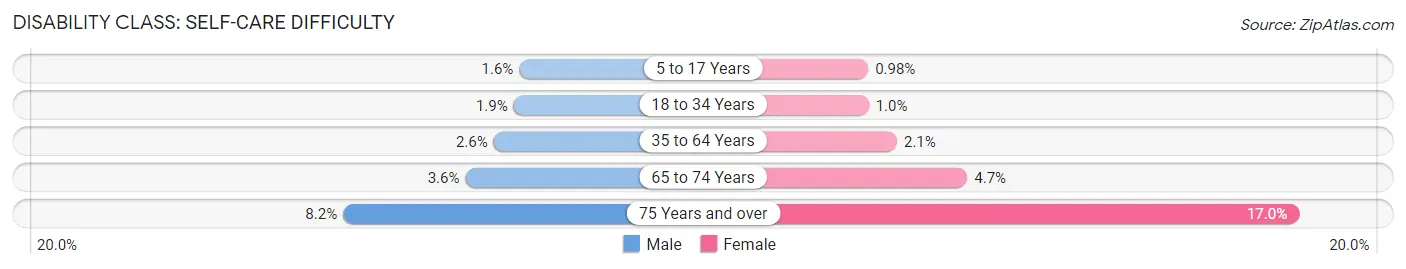
| Age Bracket | Male | Female |
| 5 to 17 Years | 161 (1.6%) | 90 (1.0%) |
| 18 to 34 Years | 240 (1.8%) | 124 (1.0%) |
| 35 to 64 Years | 649 (2.6%) | 509 (2.1%) |
| 65 to 74 Years | 311 (3.6%) | 419 (4.7%) |
| 75 Years and over | 405 (8.2%) | 1,239 (17.0%) |
Technology Access in Cambria County
Computing Device Access in Cambria County
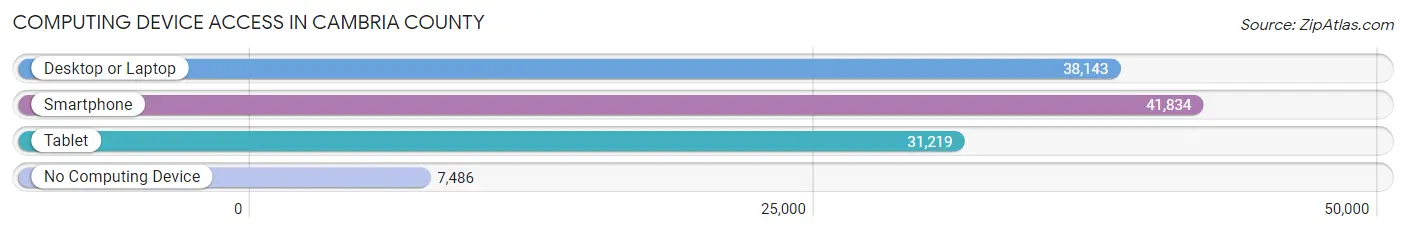
| Device Type | # Households | % Households |
| Desktop or Laptop | 38,143 | 68.7% |
| Smartphone | 41,834 | 75.3% |
| Tablet | 31,219 | 56.2% |
| No Computing Device | 7,486 | 13.5% |
| Total | 55,541 | 100.0% |
Internet Access in Cambria County
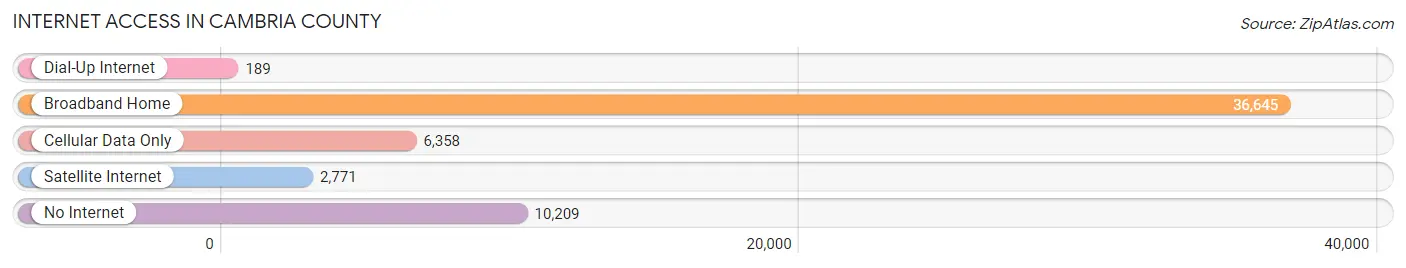
| Internet Type | # Households | % Households |
| Dial-Up Internet | 189 | 0.3% |
| Broadband Home | 36,645 | 66.0% |
| Cellular Data Only | 6,358 | 11.5% |
| Satellite Internet | 2,771 | 5.0% |
| No Internet | 10,209 | 18.4% |
| Total | 55,541 | 100.0% |
Cambria County Summary
Cambria County is a county located in the U.S. state of Pennsylvania. As of the 2010 census, the population was 143,679. The county seat is Ebensburg. The county was created on March 26, 1804, from parts of Bedford, Huntingdon, and Somerset Counties and later organized in 1807. It is named for the nation of Wales.
Geography
Cambria County is located in the Allegheny Mountains region of the Appalachian Mountains. It is bordered by Clearfield County to the north, Blair County to the east, Somerset County to the south, and Indiana County to the west. The county is drained by the Little Conemaugh River and Stonycreek River, both of which are tributaries of the Conemaugh River, which flows into the Allegheny River. The highest point in the county is Blue Knob, which has an elevation of 3,127 feet (953 m).
The county has a total area of 683 square miles (1,770 km2), of which 681 square miles (1,766 km2) is land and 2.2 square miles (5.7 km2) (0.3%) is water.
Demographics
As of the census of 2000, there were 140,842 people, 55,906 households, and 38,941 families residing in the county. The population density was 207 people per square mile (80/km2). There were 60,479 housing units at an average density of 88 per square mile (34/km2). The racial makeup of the county was 98.82% White, 0.25% Black or African American, 0.10% Native American, 0.35% Asian, 0.02% Pacific Islander, 0.16% from other races, and 0.40% from two or more races. 0.51% of the population were Hispanic or Latino of any race. 28.5% were of German, 12.6% Italian, 10.7% Irish, 8.9% American, 8.2% Slovak and 5.8% English ancestry according to Census 2000.
Economy
Cambria County is home to a variety of industries, including manufacturing, health care, retail, and tourism. The county is home to several large employers, including the Johnstown-Cambria County Airport, the Johnstown-Cambria County Industrial Park, and the Johnstown-Cambria County Medical Center.
The county is also home to several small businesses, including a number of wineries, breweries, and distilleries. The county is also home to a number of tourist attractions, including the Johnstown Flood National Memorial, the Johnstown Inclined Plane, and the Johnstown Symphony Orchestra.
The county's economy is largely based on the manufacturing sector, which accounts for about one-third of the county's total employment. The county is home to several large manufacturers, including Johnstown Wire Technologies, Johnstown Steel, and Johnstown Aluminum.
Conclusion
Cambria County is a county located in the U.S. state of Pennsylvania. As of the 2010 census, the population was 143,679. The county seat is Ebensburg. The county was created on March 26, 1804, from parts of Bedford, Huntingdon, and Somerset Counties and later organized in 1807. It is named for the nation of Wales. The county has a total area of 683 square miles (1,770 km2), of which 681 square miles (1,766 km2) is land and 2.2 square miles (5.7 km2) (0.3%) is water. As of the census of 2000, there were 140,842 people, 55,906 households, and 38,941 families residing in the county. The county's economy is largely based on the manufacturing sector, which accounts for about one-third of the county's total employment. The county is also home to several small businesses, including a number of wineries, breweries, and distilleries. The county is also home to a number of tourist attractions, including the Johnstown Flood National Memorial, the Johnstown Inclined Plane, and the Johnstown Symphony Orchestra.
Common Questions
What is Per Capita Income in Cambria County?
Per Capita income in Cambria County is $31,532.
What is the Median Family Income in Cambria County?
Median Family Income in Cambria County is $75,939.
What is the Median Household income in Cambria County?
Median Household Income in Cambria County is $54,221.
What is Income or Wage Gap in Cambria County?
Income or Wage Gap in Cambria County is 28.8%.
Women in Cambria County earn 71.2 cents for every dollar earned by a man.
What is Family Income Deficit in Cambria County?
Family Income Deficit in Cambria County is $11,013.
Families that are below poverty line in Cambria County earn $11,013 less on average than the poverty threshold level.
What is Inequality or Gini Index in Cambria County?
Inequality or Gini Index in Cambria County is 0.45.
What is the Total Population of Cambria County?
Total Population of Cambria County is 133,263.
What is the Total Male Population of Cambria County?
Total Male Population of Cambria County is 66,411.
What is the Total Female Population of Cambria County?
Total Female Population of Cambria County is 66,852.
What is the Ratio of Males per 100 Females in Cambria County?
There are 99.34 Males per 100 Females in Cambria County.
What is the Ratio of Females per 100 Males in Cambria County?
There are 100.66 Females per 100 Males in Cambria County.
What is the Median Population Age in Cambria County?
Median Population Age in Cambria County is 45.6 Years.
What is the Average Family Size in Cambria County
Average Family Size in Cambria County is 2.9 People.
What is the Average Household Size in Cambria County
Average Household Size in Cambria County is 2.3 People.
How Large is the Labor Force in Cambria County?
There are 60,910 People in the Labor Forcein in Cambria County.
What is the Percentage of People in the Labor Force in Cambria County?
54.8% of People are in the Labor Force in Cambria County.
What is the Unemployment Rate in Cambria County?
Unemployment Rate in Cambria County is 5.0%.