Bradford County, PA Map & Demographics
Bradford County Map
Bradford County Overview
$32,440
PER CAPITA INCOME
$76,250
AVG FAMILY INCOME
$60,650
AVG HOUSEHOLD INCOME
37.4%
WAGE / INCOME GAP [ % ]
62.6¢/ $1
WAGE / INCOME GAP [ $ ]
$10,819
FAMILY INCOME DEFICIT
0.42
INEQUALITY / GINI INDEX
60,159
TOTAL POPULATION
30,156
MALE POPULATION
30,003
FEMALE POPULATION
100.51
MALES / 100 FEMALES
99.49
FEMALES / 100 MALES
43.9
MEDIAN AGE
3.0
AVG FAMILY SIZE
2.4
AVG HOUSEHOLD SIZE
27,277
LABOR FORCE [ PEOPLE ]
56.0%
PERCENT IN LABOR FORCE
4.8%
UNEMPLOYMENT RATE
Bradford County Area Codes
Income in Bradford County
Income Overview in Bradford County
Per Capita Income in Bradford County is $32,440, while median incomes of families and households are $76,250 and $60,650 respectively.
| Characteristic | Number | Measure |
| Per Capita Income | 60,159 | $32,440 |
| Median Family Income | 15,782 | $76,250 |
| Mean Family Income | 15,782 | $91,928 |
| Median Household Income | 24,361 | $60,650 |
| Mean Household Income | 24,361 | $78,657 |
| Income Deficit | 15,782 | $10,819 |
| Wage / Income Gap (%) | 60,159 | 37.42% |
| Wage / Income Gap ($) | 60,159 | 62.58¢ per $1 |
| Gini / Inequality Index | 60,159 | 0.42 |
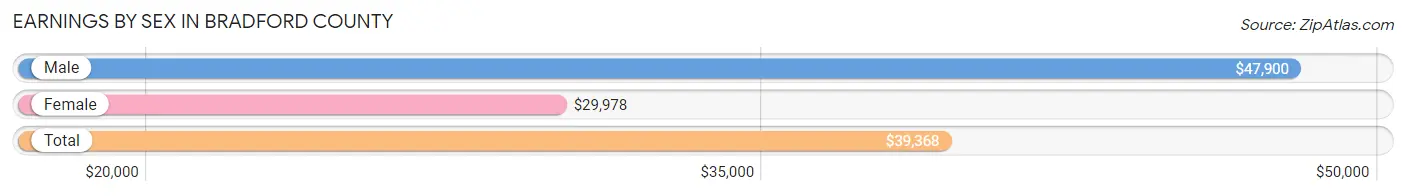
Earnings by Sex in Bradford County
Average Earnings in Bradford County are $39,368, $47,900 for men and $29,978 for women, a difference of 37.4%.
| Sex | Number | Average Earnings |
| Male | 15,800 (54.5%) | $47,900 |
| Female | 13,166 (45.5%) | $29,978 |
| Total | 28,966 (100.0%) | $39,368 |
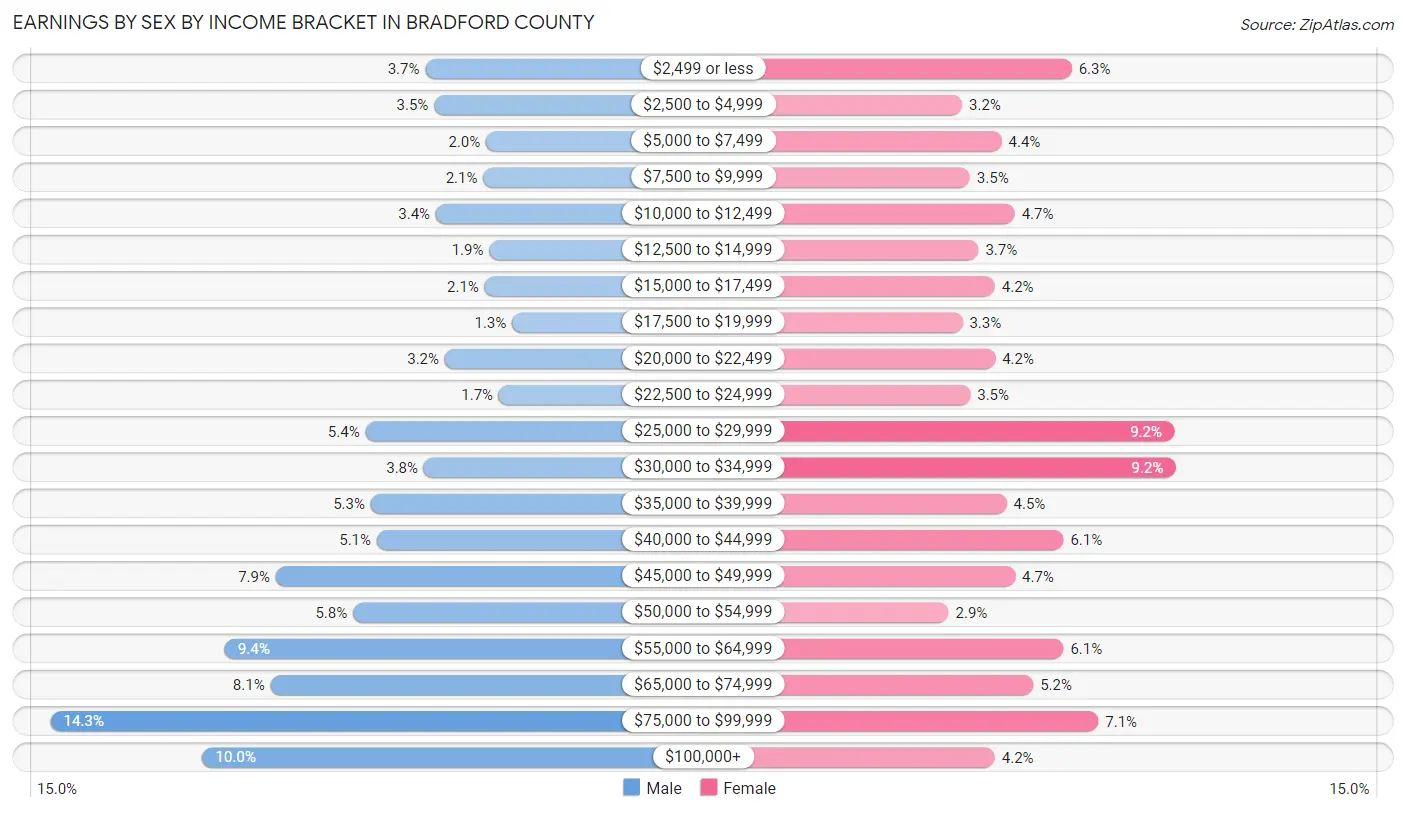
Earnings by Sex by Income Bracket in Bradford County
The most common earnings brackets in Bradford County are $75,000 to $99,999 for men (2,255 | 14.3%) and $30,000 to $34,999 for women (1,215 | 9.2%).
| Income | Male | Female |
| $2,499 or less | 591 (3.7%) | 832 (6.3%) |
| $2,500 to $4,999 | 551 (3.5%) | 427 (3.2%) |
| $5,000 to $7,499 | 320 (2.0%) | 573 (4.3%) |
| $7,500 to $9,999 | 334 (2.1%) | 455 (3.5%) |
| $10,000 to $12,499 | 543 (3.4%) | 622 (4.7%) |
| $12,500 to $14,999 | 306 (1.9%) | 487 (3.7%) |
| $15,000 to $17,499 | 327 (2.1%) | 548 (4.2%) |
| $17,500 to $19,999 | 206 (1.3%) | 428 (3.3%) |
| $20,000 to $22,499 | 504 (3.2%) | 549 (4.2%) |
| $22,500 to $24,999 | 264 (1.7%) | 457 (3.5%) |
| $25,000 to $29,999 | 856 (5.4%) | 1,210 (9.2%) |
| $30,000 to $34,999 | 598 (3.8%) | 1,215 (9.2%) |
| $35,000 to $39,999 | 833 (5.3%) | 591 (4.5%) |
| $40,000 to $44,999 | 806 (5.1%) | 802 (6.1%) |
| $45,000 to $49,999 | 1,255 (7.9%) | 623 (4.7%) |
| $50,000 to $54,999 | 911 (5.8%) | 376 (2.9%) |
| $55,000 to $64,999 | 1,481 (9.4%) | 802 (6.1%) |
| $65,000 to $74,999 | 1,279 (8.1%) | 690 (5.2%) |
| $75,000 to $99,999 | 2,255 (14.3%) | 931 (7.1%) |
| $100,000+ | 1,580 (10.0%) | 548 (4.2%) |
| Total | 15,800 (100.0%) | 13,166 (100.0%) |
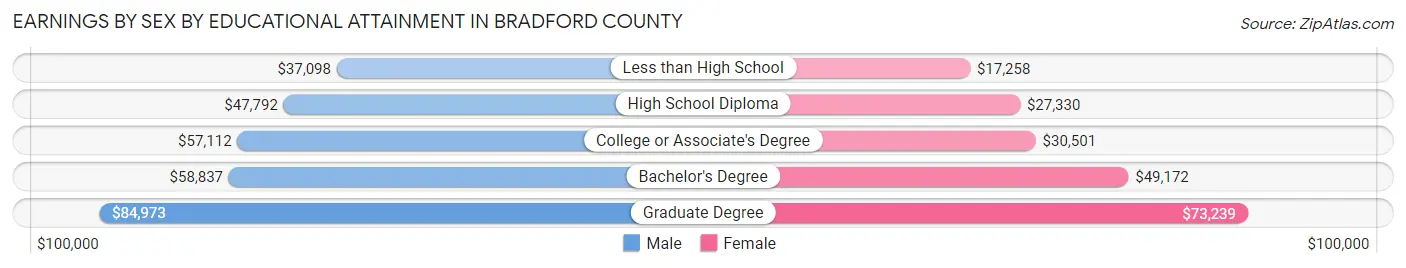
Earnings by Sex by Educational Attainment in Bradford County
Average earnings in Bradford County are $52,203 for men and $32,123 for women, a difference of 38.5%. Men with an educational attainment of graduate degree enjoy the highest average annual earnings of $84,973, while those with less than high school education earn the least with $37,098. Women with an educational attainment of graduate degree earn the most with the average annual earnings of $73,239, while those with less than high school education have the smallest earnings of $17,258.
| Educational Attainment | Male Income | Female Income |
| Less than High School | $37,098 | $17,258 |
| High School Diploma | $47,792 | $27,330 |
| College or Associate's Degree | $57,112 | $30,501 |
| Bachelor's Degree | $58,837 | $49,172 |
| Graduate Degree | $84,973 | $73,239 |
| Total | $52,203 | $32,123 |
Family Income in Bradford County
Family Income Brackets in Bradford County
According to the Bradford County family income data, there are 3,409 families falling into the $100,000 to $149,999 income range, which is the most common income bracket and makes up 21.6% of all families. Conversely, the $10,000 to $14,999 income bracket is the least frequent group with only 331 families (2.1%) belonging to this category.
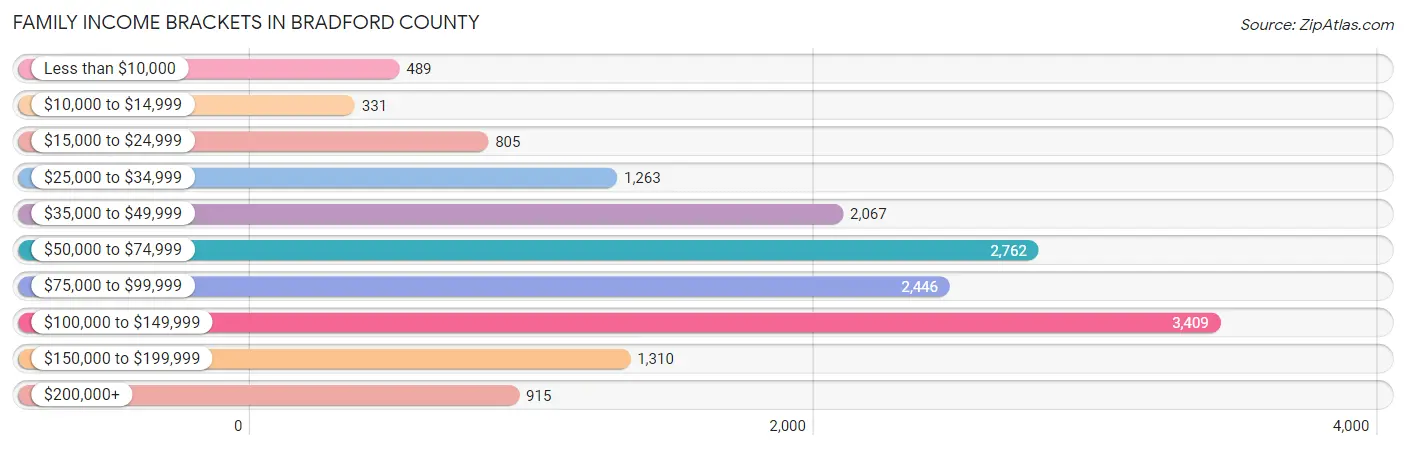
| Income Bracket | # Families | % Families |
| Less than $10,000 | 489 | 3.1% |
| $10,000 to $14,999 | 331 | 2.1% |
| $15,000 to $24,999 | 805 | 5.1% |
| $25,000 to $34,999 | 1,263 | 8.0% |
| $35,000 to $49,999 | 2,067 | 13.1% |
| $50,000 to $74,999 | 2,762 | 17.5% |
| $75,000 to $99,999 | 2,446 | 15.5% |
| $100,000 to $149,999 | 3,409 | 21.6% |
| $150,000 to $199,999 | 1,310 | 8.3% |
| $200,000+ | 915 | 5.8% |
Family Income by Famaliy Size in Bradford County
6-person families (406 | 2.6%) account for the highest median family income in Bradford County with $109,250 per family, while 2-person families (8,300 | 52.6%) have the highest median income of $33,414 per family member.
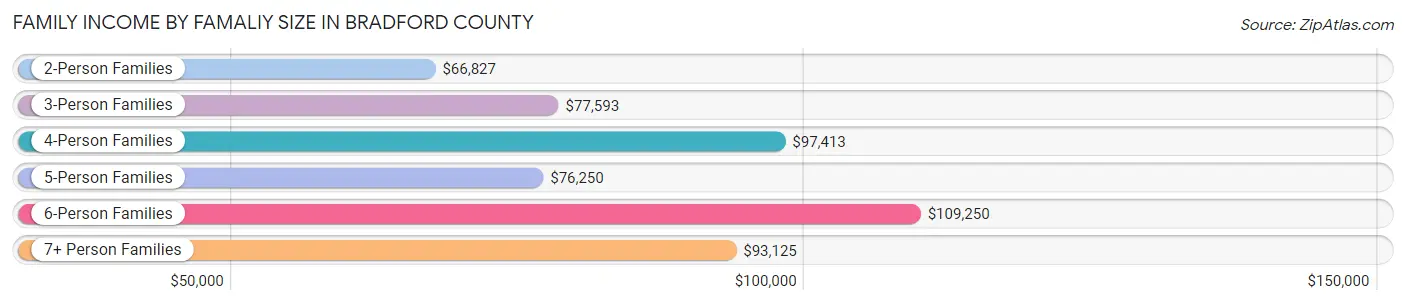
| Income Bracket | # Families | Median Income |
| 2-Person Families | 8,300 (52.6%) | $66,827 |
| 3-Person Families | 2,998 (19.0%) | $77,593 |
| 4-Person Families | 2,576 (16.3%) | $97,413 |
| 5-Person Families | 1,267 (8.0%) | $76,250 |
| 6-Person Families | 406 (2.6%) | $109,250 |
| 7+ Person Families | 235 (1.5%) | $93,125 |
| Total | 15,782 (100.0%) | $76,250 |
Family Income by Number of Earners in Bradford County
The median family income in Bradford County is $76,250, with families comprising 3+ earners (1,437) having the highest median family income of $134,225, while families with no earners (3,342) have the lowest median family income of $43,285, accounting for 9.1% and 21.2% of families, respectively.
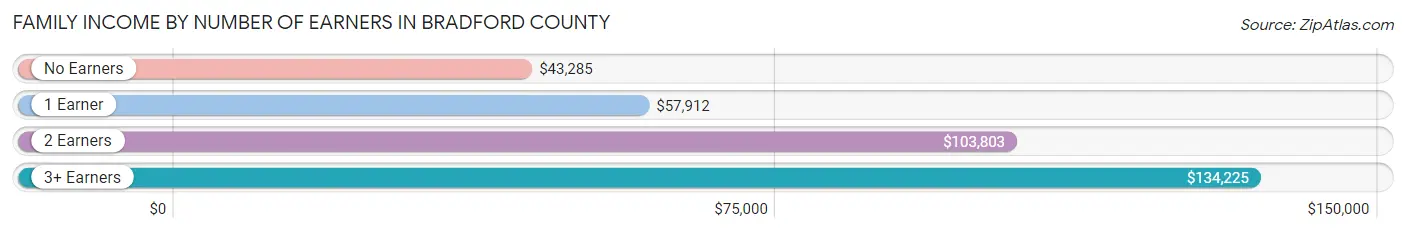
| Number of Earners | # Families | Median Income |
| No Earners | 3,342 (21.2%) | $43,285 |
| 1 Earner | 5,207 (33.0%) | $57,912 |
| 2 Earners | 5,796 (36.7%) | $103,803 |
| 3+ Earners | 1,437 (9.1%) | $134,225 |
| Total | 15,782 (100.0%) | $76,250 |
Household Income in Bradford County
Household Income Brackets in Bradford County
With 4,117 households falling in the category, the $100,000 to $149,999 income range is the most frequent in Bradford County, accounting for 16.9% of all households. In contrast, only 974 households (4.0%) fall into the less than $10,000 income bracket, making it the least populous group.
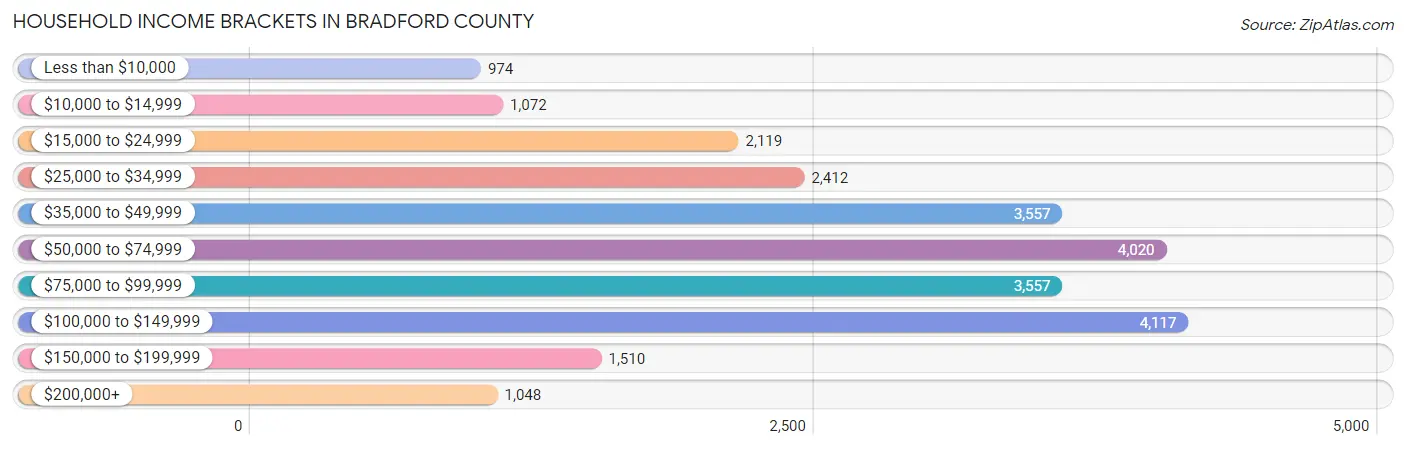
| Income Bracket | # Households | % Households |
| Less than $10,000 | 974 | 4.0% |
| $10,000 to $14,999 | 1,072 | 4.4% |
| $15,000 to $24,999 | 2,119 | 8.7% |
| $25,000 to $34,999 | 2,412 | 9.9% |
| $35,000 to $49,999 | 3,557 | 14.6% |
| $50,000 to $74,999 | 4,020 | 16.5% |
| $75,000 to $99,999 | 3,557 | 14.6% |
| $100,000 to $149,999 | 4,117 | 16.9% |
| $150,000 to $199,999 | 1,510 | 6.2% |
| $200,000+ | 1,048 | 4.3% |
Household Income by Householder Age in Bradford County
The median household income in Bradford County is $60,650, with the highest median household income of $77,414 found in the 45 to 64 years age bracket for the primary householder. A total of 9,298 households (38.2%) fall into this category. Meanwhile, the 65+ years age bracket for the primary householder has the lowest median household income of $41,730, with 8,085 households (33.2%) in this group.
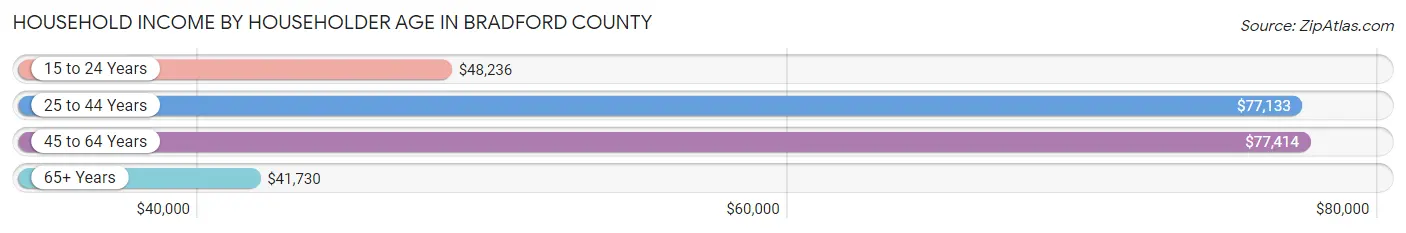
| Income Bracket | # Households | Median Income |
| 15 to 24 Years | 893 (3.7%) | $48,236 |
| 25 to 44 Years | 6,085 (25.0%) | $77,133 |
| 45 to 64 Years | 9,298 (38.2%) | $77,414 |
| 65+ Years | 8,085 (33.2%) | $41,730 |
| Total | 24,361 (100.0%) | $60,650 |
Poverty in Bradford County
Income Below Poverty by Sex and Age in Bradford County
With 11.8% poverty level for males and 14.4% for females among the residents of Bradford County, 16 and 17 year old males and under 5 year old females are the most vulnerable to poverty, with 191 males (20.7%) and 406 females (24.6%) in their respective age groups living below the poverty level.
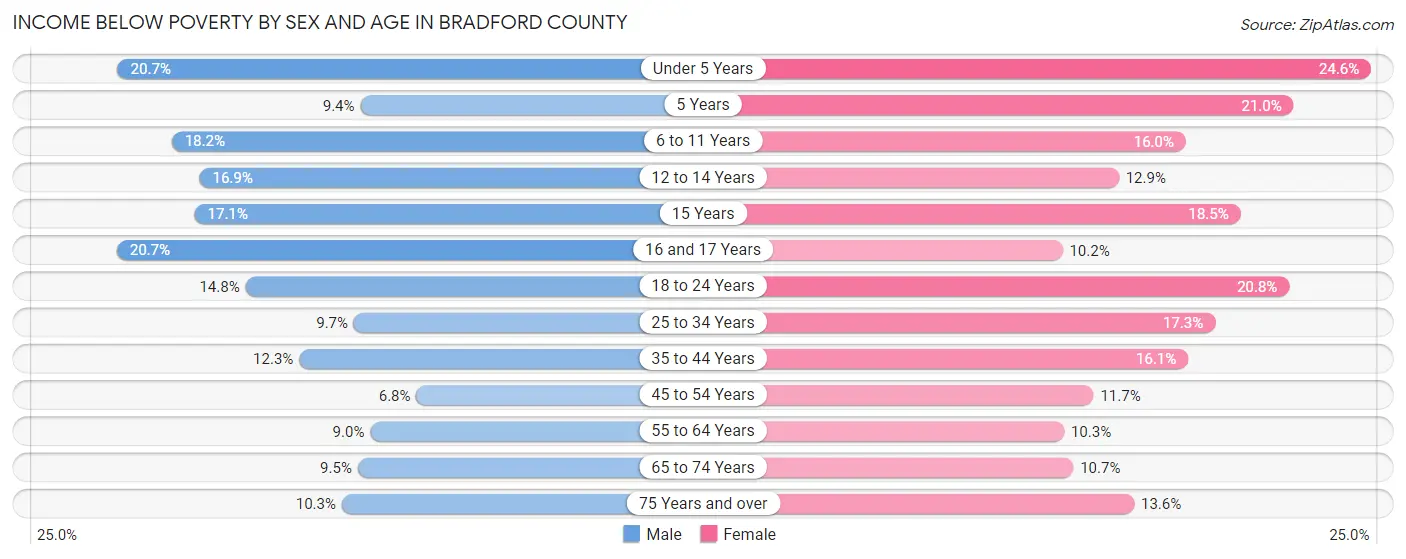
| Age Bracket | Male | Female |
| Under 5 Years | 355 (20.7%) | 406 (24.6%) |
| 5 Years | 42 (9.4%) | 61 (21.0%) |
| 6 to 11 Years | 412 (18.2%) | 341 (16.0%) |
| 12 to 14 Years | 185 (16.9%) | 156 (12.9%) |
| 15 Years | 39 (17.1%) | 42 (18.5%) |
| 16 and 17 Years | 191 (20.7%) | 85 (10.2%) |
| 18 to 24 Years | 322 (14.7%) | 443 (20.8%) |
| 25 to 34 Years | 331 (9.7%) | 567 (17.3%) |
| 35 to 44 Years | 381 (12.3%) | 500 (16.1%) |
| 45 to 54 Years | 248 (6.8%) | 416 (11.7%) |
| 55 to 64 Years | 418 (9.0%) | 469 (10.3%) |
| 65 to 74 Years | 347 (9.5%) | 404 (10.7%) |
| 75 Years and over | 253 (10.3%) | 395 (13.6%) |
| Total | 3,524 (11.8%) | 4,285 (14.4%) |
Income Above Poverty by Sex and Age in Bradford County
According to the poverty statistics in Bradford County, males aged 45 to 54 years and females aged 16 and 17 years are the age groups that are most secure financially, with 93.2% of males and 89.8% of females in these age groups living above the poverty line.
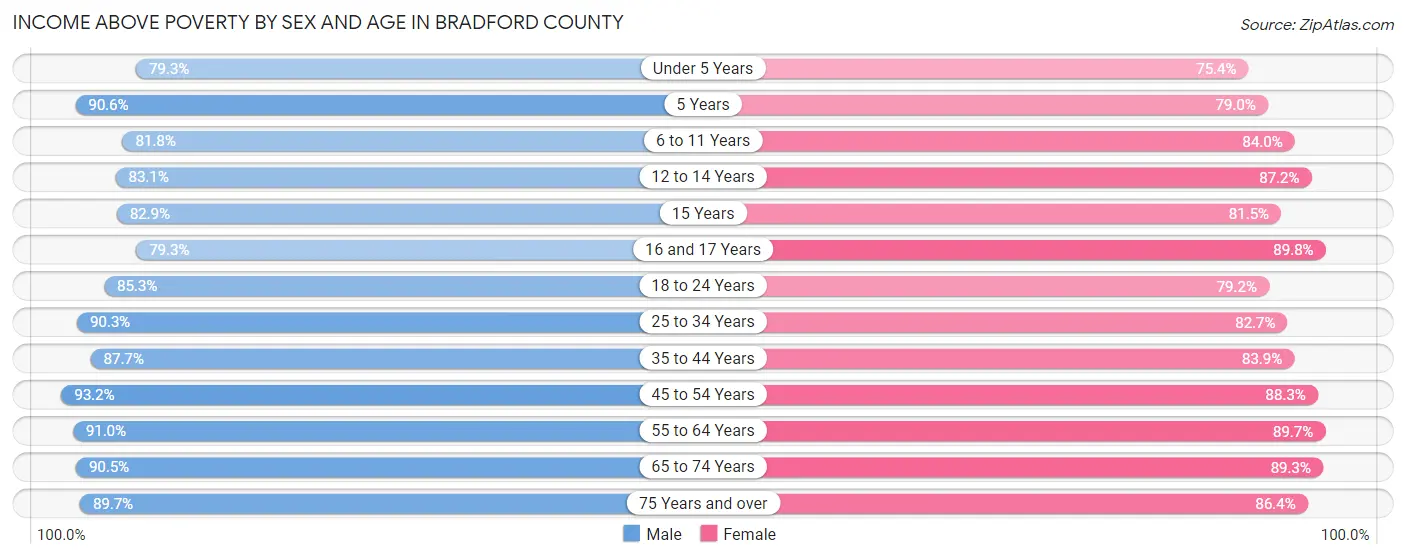
| Age Bracket | Male | Female |
| Under 5 Years | 1,362 (79.3%) | 1,247 (75.4%) |
| 5 Years | 404 (90.6%) | 230 (79.0%) |
| 6 to 11 Years | 1,855 (81.8%) | 1,795 (84.0%) |
| 12 to 14 Years | 911 (83.1%) | 1,058 (87.2%) |
| 15 Years | 189 (82.9%) | 185 (81.5%) |
| 16 and 17 Years | 731 (79.3%) | 745 (89.8%) |
| 18 to 24 Years | 1,861 (85.3%) | 1,691 (79.2%) |
| 25 to 34 Years | 3,076 (90.3%) | 2,707 (82.7%) |
| 35 to 44 Years | 2,727 (87.7%) | 2,611 (83.9%) |
| 45 to 54 Years | 3,386 (93.2%) | 3,145 (88.3%) |
| 55 to 64 Years | 4,248 (91.0%) | 4,080 (89.7%) |
| 65 to 74 Years | 3,289 (90.5%) | 3,357 (89.3%) |
| 75 Years and over | 2,209 (89.7%) | 2,518 (86.4%) |
| Total | 26,248 (88.2%) | 25,369 (85.6%) |
Income Below Poverty Among Married-Couple Families in Bradford County
The poverty statistics for married-couple families in Bradford County show that 5.2% or 632 of the total 12,075 families live below the poverty line. Families with 5 or more children have the highest poverty rate of 15.5%, comprising of 11 families. On the other hand, families with no children have the lowest poverty rate of 4.6%, which includes 369 families.
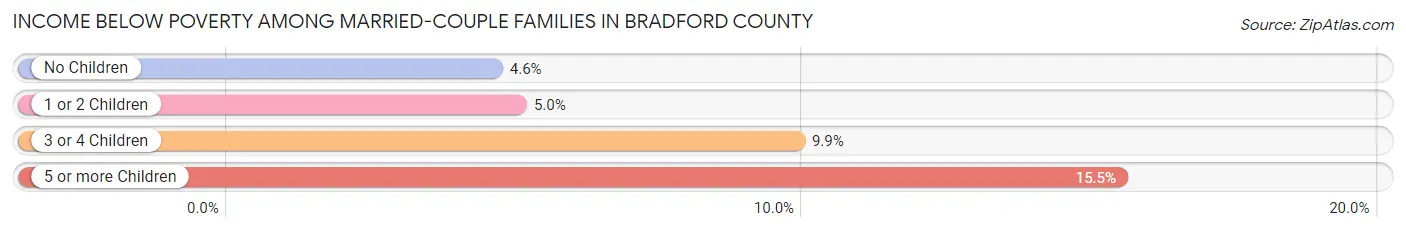
| Children | Above Poverty | Below Poverty |
| No Children | 7,640 (95.4%) | 369 (4.6%) |
| 1 or 2 Children | 2,793 (95.0%) | 148 (5.0%) |
| 3 or 4 Children | 950 (90.1%) | 104 (9.9%) |
| 5 or more Children | 60 (84.5%) | 11 (15.5%) |
| Total | 11,443 (94.8%) | 632 (5.2%) |
Income Below Poverty Among Single-Parent Households in Bradford County
According to the poverty data in Bradford County, 12.4% or 190 single-father households and 31.1% or 676 single-mother households are living below the poverty line. Among single-father households, those with 3 or 4 children have the highest poverty rate, with 95 households (49.0%) experiencing poverty. Likewise, among single-mother households, those with 3 or 4 children have the highest poverty rate, with 139 households (51.7%) falling below the poverty line.
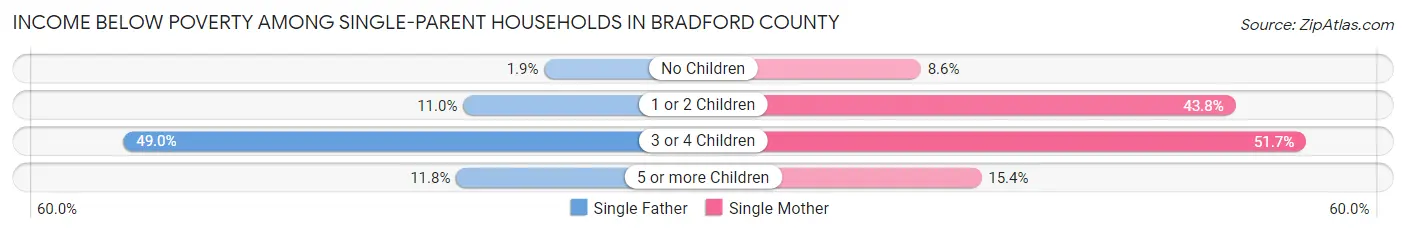
| Children | Single Father | Single Mother |
| No Children | 11 (1.9%) | 71 (8.6%) |
| 1 or 2 Children | 82 (11.0%) | 462 (43.8%) |
| 3 or 4 Children | 95 (49.0%) | 139 (51.7%) |
| 5 or more Children | 2 (11.8%) | 4 (15.4%) |
| Total | 190 (12.4%) | 676 (31.1%) |
Income Below Poverty Among Married-Couple vs Single-Parent Households in Bradford County
The poverty data for Bradford County shows that 632 of the married-couple family households (5.2%) and 866 of the single-parent households (23.4%) are living below the poverty level. Within the married-couple family households, those with 5 or more children have the highest poverty rate, with 11 households (15.5%) falling below the poverty line. Among the single-parent households, those with 3 or 4 children have the highest poverty rate, with 234 household (50.5%) living below poverty.
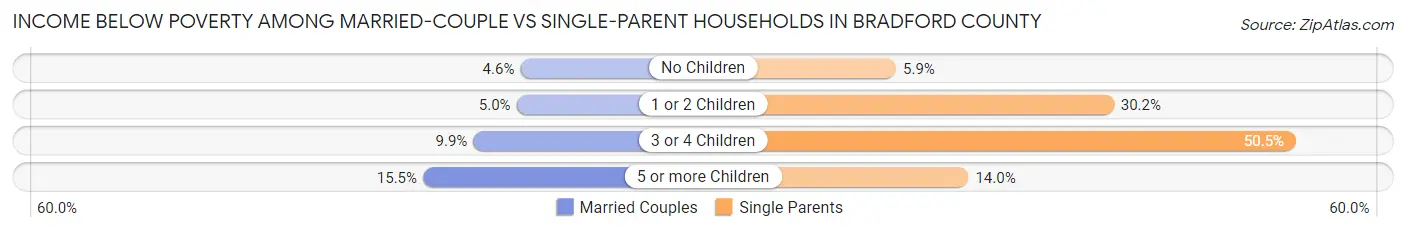
| Children | Married-Couple Families | Single-Parent Households |
| No Children | 369 (4.6%) | 82 (5.9%) |
| 1 or 2 Children | 148 (5.0%) | 544 (30.2%) |
| 3 or 4 Children | 104 (9.9%) | 234 (50.5%) |
| 5 or more Children | 11 (15.5%) | 6 (14.0%) |
| Total | 632 (5.2%) | 866 (23.4%) |
Race in Bradford County
The most populous races in Bradford County are White / Caucasian (57,419 | 95.5%), Two or more Races (1,426 | 2.4%), and Hispanic or Latino (946 | 1.6%).
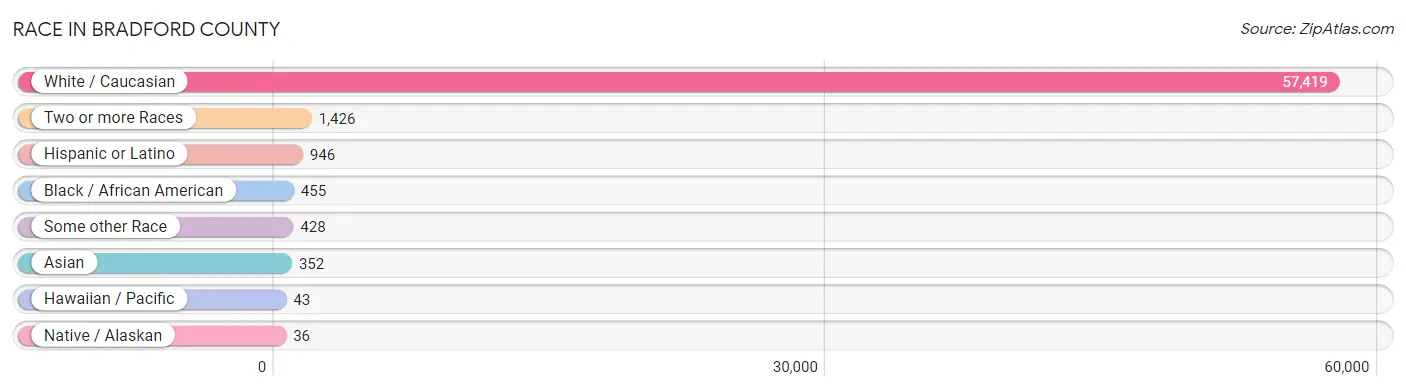
| Race | # Population | % Population |
| Asian | 352 | 0.6% |
| Black / African American | 455 | 0.8% |
| Hawaiian / Pacific | 43 | 0.1% |
| Hispanic or Latino | 946 | 1.6% |
| Native / Alaskan | 36 | 0.1% |
| White / Caucasian | 57,419 | 95.5% |
| Two or more Races | 1,426 | 2.4% |
| Some other Race | 428 | 0.7% |
| Total | 60,159 | 100.0% |
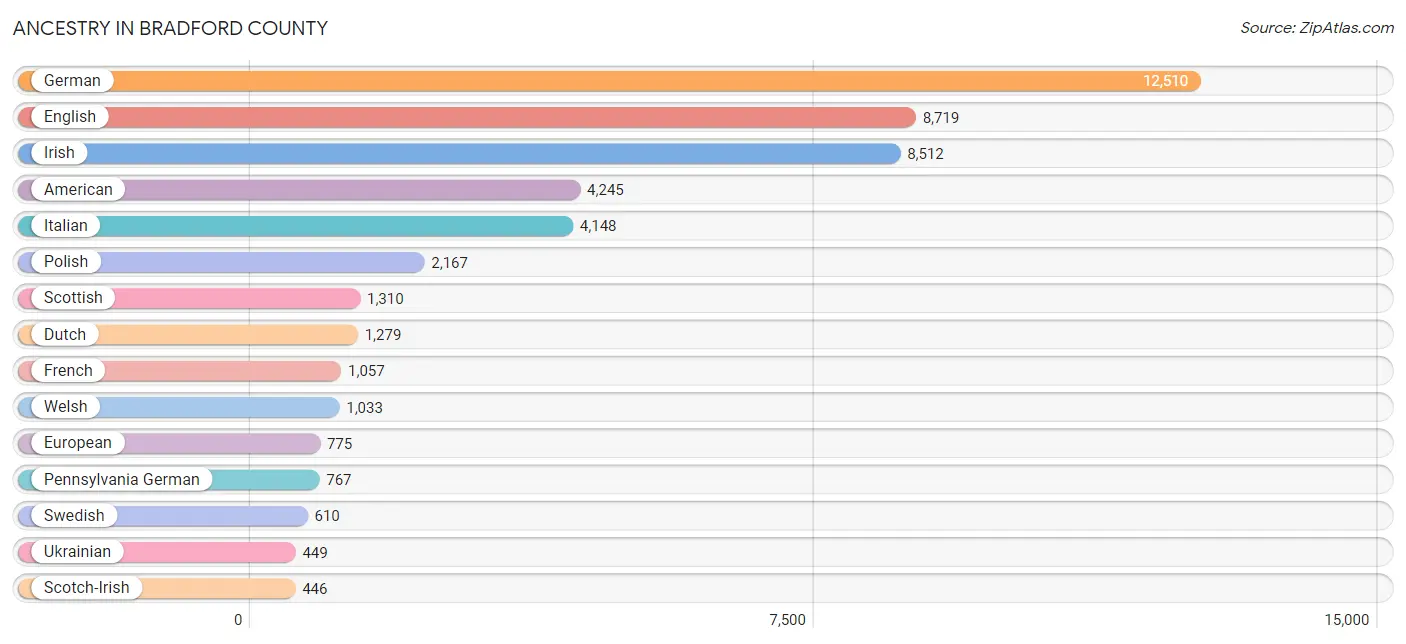
Ancestry in Bradford County
The most populous ancestries reported in Bradford County are German (12,510 | 20.8%), English (8,719 | 14.5%), Irish (8,512 | 14.1%), American (4,245 | 7.1%), and Italian (4,148 | 6.9%), together accounting for 63.4% of all Bradford County residents.
| Ancestry | # Population | % Population |
| African | 89 | 0.2% |
| Alaskan Athabascan | 2 | 0.0% |
| American | 4,245 | 7.1% |
| Apache | 3 | 0.0% |
| Arab | 145 | 0.2% |
| Argentinean | 2 | 0.0% |
| Armenian | 9 | 0.0% |
| Australian | 9 | 0.0% |
| Austrian | 145 | 0.2% |
| Barbadian | 8 | 0.0% |
| Basque | 2 | 0.0% |
| Belgian | 8 | 0.0% |
| Bhutanese | 84 | 0.1% |
| Blackfeet | 38 | 0.1% |
| British | 253 | 0.4% |
| Burmese | 31 | 0.1% |
| Canadian | 40 | 0.1% |
| Carpatho Rusyn | 6 | 0.0% |
| Celtic | 2 | 0.0% |
| Central American | 52 | 0.1% |
| Central American Indian | 6 | 0.0% |
| Cherokee | 45 | 0.1% |
| Chickasaw | 1 | 0.0% |
| Chilean | 6 | 0.0% |
| Chippewa | 8 | 0.0% |
| Colombian | 16 | 0.0% |
| Croatian | 80 | 0.1% |
| Cuban | 30 | 0.1% |
| Czech | 171 | 0.3% |
| Czechoslovakian | 43 | 0.1% |
| Danish | 73 | 0.1% |
| Delaware | 6 | 0.0% |
| Dominican | 19 | 0.0% |
| Dutch | 1,279 | 2.1% |
| Eastern European | 186 | 0.3% |
| Ecuadorian | 31 | 0.1% |
| Egyptian | 4 | 0.0% |
| English | 8,719 | 14.5% |
| Estonian | 13 | 0.0% |
| European | 775 | 1.3% |
| Finnish | 42 | 0.1% |
| French | 1,057 | 1.8% |
| French American Indian | 1 | 0.0% |
| French Canadian | 121 | 0.2% |
| German | 12,510 | 20.8% |
| Greek | 132 | 0.2% |
| Guatemalan | 13 | 0.0% |
| Honduran | 26 | 0.0% |
| Hungarian | 200 | 0.3% |
| Icelander | 63 | 0.1% |
| Indian (Asian) | 51 | 0.1% |
| Irish | 8,512 | 14.1% |
| Iroquois | 31 | 0.1% |
| Israeli | 28 | 0.1% |
| Italian | 4,148 | 6.9% |
| Jamaican | 15 | 0.0% |
| Kenyan | 28 | 0.1% |
| Korean | 95 | 0.2% |
| Laotian | 86 | 0.1% |
| Latvian | 10 | 0.0% |
| Lebanese | 73 | 0.1% |
| Lithuanian | 168 | 0.3% |
| Luxembourger | 12 | 0.0% |
| Maltese | 9 | 0.0% |
| Mexican | 380 | 0.6% |
| Northern European | 22 | 0.0% |
| Norwegian | 164 | 0.3% |
| Pakistani | 4 | 0.0% |
| Palestinian | 2 | 0.0% |
| Panamanian | 13 | 0.0% |
| Pennsylvania German | 767 | 1.3% |
| Polish | 2,167 | 3.6% |
| Portuguese | 39 | 0.1% |
| Puerto Rican | 372 | 0.6% |
| Romanian | 26 | 0.0% |
| Russian | 276 | 0.5% |
| Samoan | 7 | 0.0% |
| Scandinavian | 158 | 0.3% |
| Scotch-Irish | 446 | 0.7% |
| Scottish | 1,310 | 2.2% |
| Seminole | 2 | 0.0% |
| Slavic | 28 | 0.1% |
| Slovak | 213 | 0.4% |
| Slovene | 8 | 0.0% |
| South American | 61 | 0.1% |
| Spaniard | 2 | 0.0% |
| Spanish | 6 | 0.0% |
| Sri Lankan | 78 | 0.1% |
| Subsaharan African | 117 | 0.2% |
| Swedish | 610 | 1.0% |
| Swiss | 176 | 0.3% |
| Syrian | 66 | 0.1% |
| Thai | 52 | 0.1% |
| Turkish | 10 | 0.0% |
| Ukrainian | 449 | 0.7% |
| Venezuelan | 6 | 0.0% |
| Welsh | 1,033 | 1.7% |
| West Indian | 7 | 0.0% |
| Yugoslavian | 97 | 0.2% | View All 99 Rows |
Immigrants in Bradford County
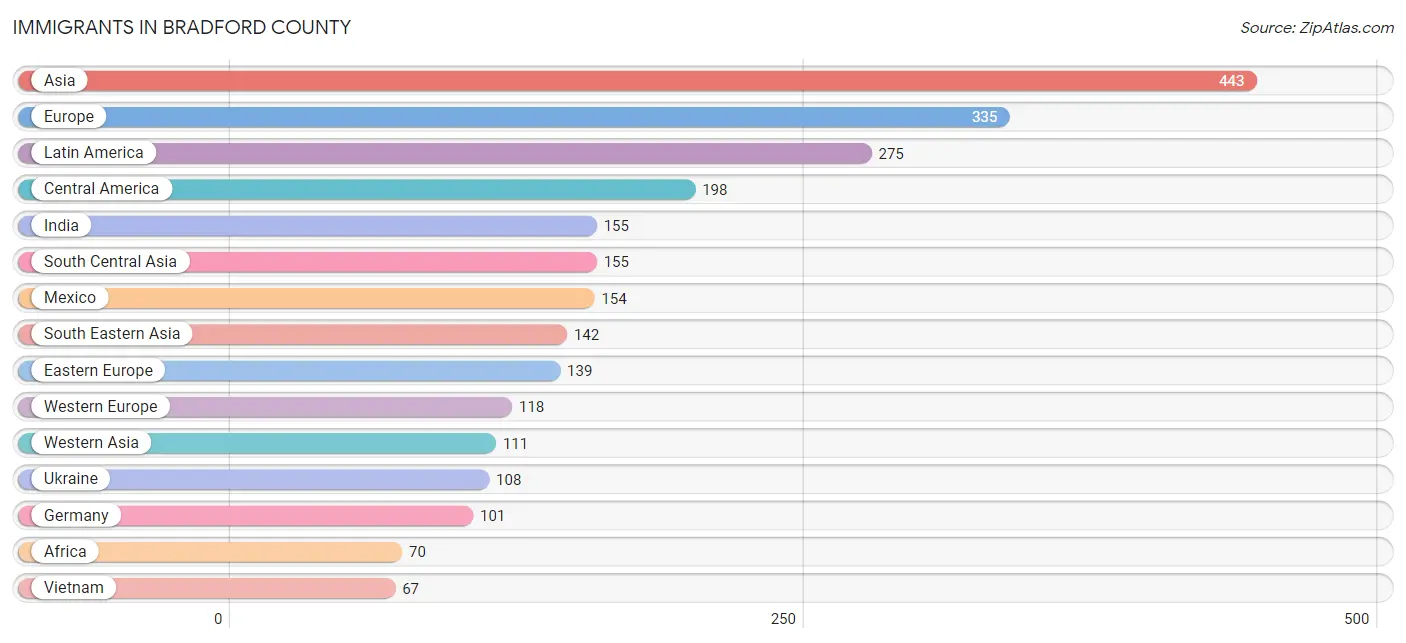
The most numerous immigrant groups reported in Bradford County came from Asia (443 | 0.7%), Europe (335 | 0.6%), Latin America (275 | 0.5%), Central America (198 | 0.3%), and India (155 | 0.3%), together accounting for 2.4% of all Bradford County residents.
| Immigration Origin | # Population | % Population |
| Africa | 70 | 0.1% |
| Asia | 443 | 0.7% |
| Australia | 3 | 0.0% |
| Austria | 7 | 0.0% |
| Bosnia and Herzegovina | 14 | 0.0% |
| Canada | 52 | 0.1% |
| Caribbean | 11 | 0.0% |
| Central America | 198 | 0.3% |
| Chile | 6 | 0.0% |
| China | 26 | 0.0% |
| Colombia | 9 | 0.0% |
| Croatia | 1 | 0.0% |
| Denmark | 7 | 0.0% |
| Dominican Republic | 11 | 0.0% |
| Eastern Africa | 62 | 0.1% |
| Eastern Asia | 35 | 0.1% |
| Eastern Europe | 139 | 0.2% |
| Ecuador | 28 | 0.1% |
| England | 8 | 0.0% |
| Europe | 335 | 0.6% |
| France | 5 | 0.0% |
| Germany | 101 | 0.2% |
| Guatemala | 13 | 0.0% |
| Guyana | 7 | 0.0% |
| Honduras | 26 | 0.0% |
| India | 155 | 0.3% |
| Indonesia | 21 | 0.0% |
| Israel | 14 | 0.0% |
| Italy | 43 | 0.1% |
| Japan | 8 | 0.0% |
| Kenya | 54 | 0.1% |
| Korea | 1 | 0.0% |
| Laos | 8 | 0.0% |
| Latin America | 275 | 0.5% |
| Lebanon | 50 | 0.1% |
| Mexico | 154 | 0.3% |
| Netherlands | 5 | 0.0% |
| Northern Europe | 35 | 0.1% |
| Oceania | 3 | 0.0% |
| Panama | 5 | 0.0% |
| Philippines | 42 | 0.1% |
| Russia | 3 | 0.0% |
| Scotland | 6 | 0.0% |
| South Africa | 8 | 0.0% |
| South America | 66 | 0.1% |
| South Central Asia | 155 | 0.3% |
| South Eastern Asia | 142 | 0.2% |
| Southern Europe | 43 | 0.1% |
| Syria | 47 | 0.1% |
| Thailand | 4 | 0.0% |
| Uganda | 8 | 0.0% |
| Ukraine | 108 | 0.2% |
| Uruguay | 10 | 0.0% |
| Venezuela | 6 | 0.0% |
| Vietnam | 67 | 0.1% |
| Western Asia | 111 | 0.2% |
| Western Europe | 118 | 0.2% | View All 57 Rows |
Sex and Age in Bradford County
Sex and Age in Bradford County
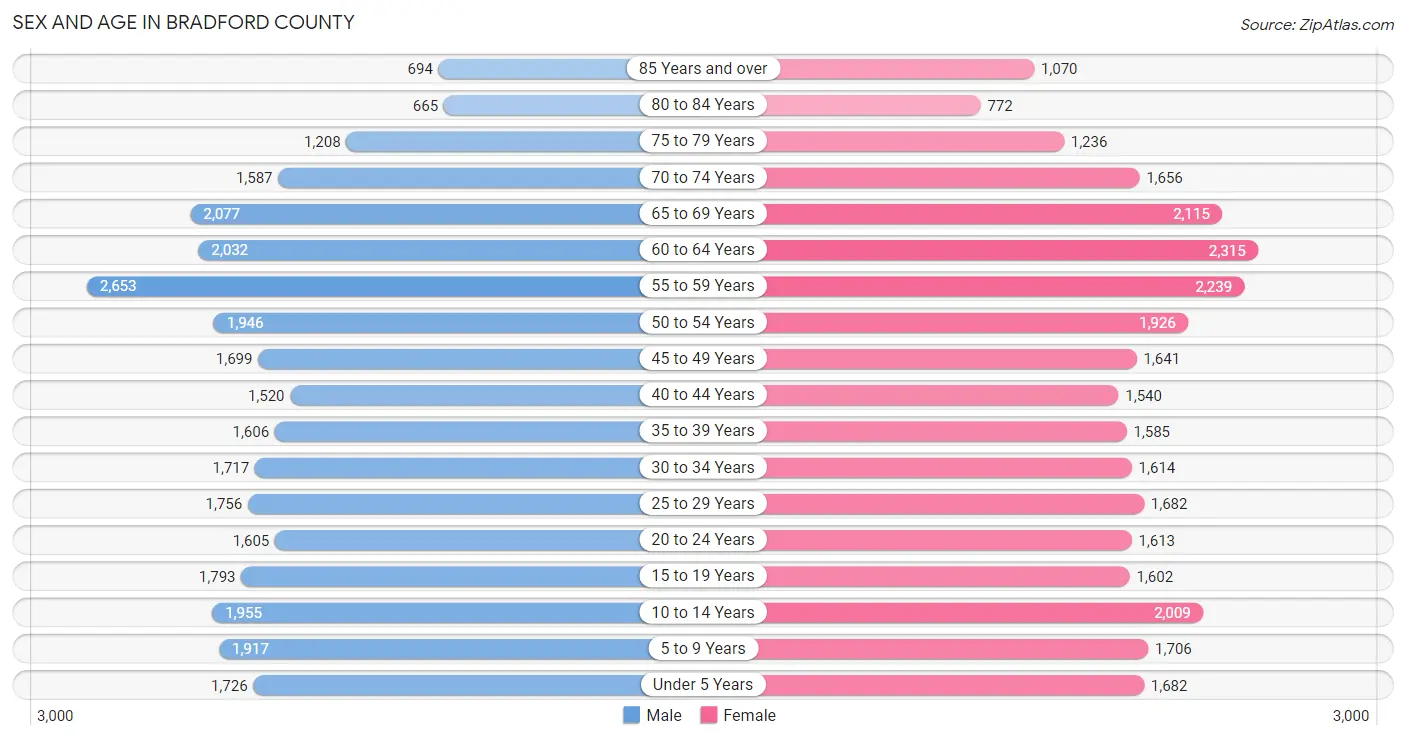
The most populous age groups in Bradford County are 55 to 59 Years (2,653 | 8.8%) for men and 60 to 64 Years (2,315 | 7.7%) for women.
| Age Bracket | Male | Female |
| Under 5 Years | 1,726 (5.7%) | 1,682 (5.6%) |
| 5 to 9 Years | 1,917 (6.4%) | 1,706 (5.7%) |
| 10 to 14 Years | 1,955 (6.5%) | 2,009 (6.7%) |
| 15 to 19 Years | 1,793 (5.9%) | 1,602 (5.3%) |
| 20 to 24 Years | 1,605 (5.3%) | 1,613 (5.4%) |
| 25 to 29 Years | 1,756 (5.8%) | 1,682 (5.6%) |
| 30 to 34 Years | 1,717 (5.7%) | 1,614 (5.4%) |
| 35 to 39 Years | 1,606 (5.3%) | 1,585 (5.3%) |
| 40 to 44 Years | 1,520 (5.0%) | 1,540 (5.1%) |
| 45 to 49 Years | 1,699 (5.6%) | 1,641 (5.5%) |
| 50 to 54 Years | 1,946 (6.5%) | 1,926 (6.4%) |
| 55 to 59 Years | 2,653 (8.8%) | 2,239 (7.5%) |
| 60 to 64 Years | 2,032 (6.7%) | 2,315 (7.7%) |
| 65 to 69 Years | 2,077 (6.9%) | 2,115 (7.0%) |
| 70 to 74 Years | 1,587 (5.3%) | 1,656 (5.5%) |
| 75 to 79 Years | 1,208 (4.0%) | 1,236 (4.1%) |
| 80 to 84 Years | 665 (2.2%) | 772 (2.6%) |
| 85 Years and over | 694 (2.3%) | 1,070 (3.6%) |
| Total | 30,156 (100.0%) | 30,003 (100.0%) |
Families and Households in Bradford County
Median Family Size in Bradford County
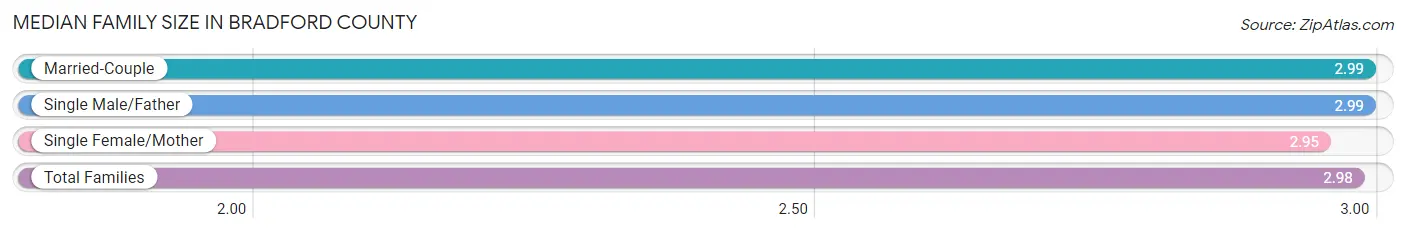
The median family size in Bradford County is 2.98 persons per family, with married-couple families (12,075 | 76.5%) accounting for the largest median family size of 2.99 persons per family. On the other hand, single female/mother families (2,175 | 13.8%) represent the smallest median family size with 2.95 persons per family.
| Family Type | # Families | Family Size |
| Married-Couple | 12,075 (76.5%) | 2.99 |
| Single Male/Father | 1,532 (9.7%) | 2.99 |
| Single Female/Mother | 2,175 (13.8%) | 2.95 |
| Total Families | 15,782 (100.0%) | 2.98 |
Median Household Size in Bradford County
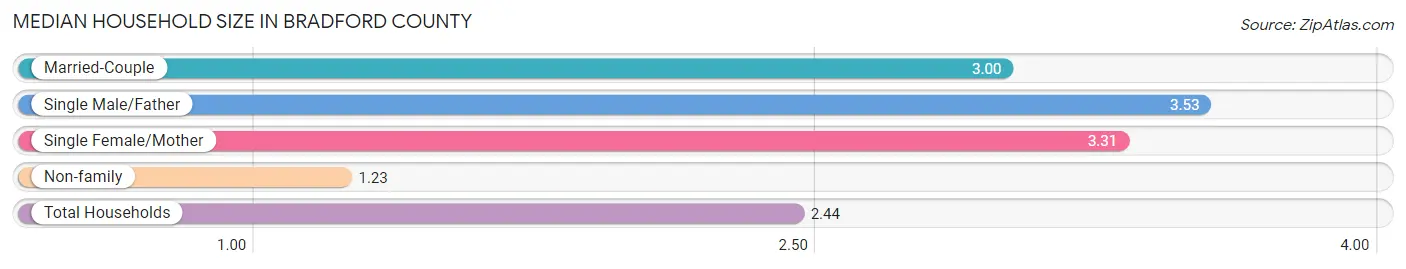
The median household size in Bradford County is 2.44 persons per household, with single male/father households (1,532 | 6.3%) accounting for the largest median household size of 3.53 persons per household. non-family households (8,579 | 35.2%) represent the smallest median household size with 1.23 persons per household.
| Household Type | # Households | Household Size |
| Married-Couple | 12,075 (49.6%) | 3.00 |
| Single Male/Father | 1,532 (6.3%) | 3.53 |
| Single Female/Mother | 2,175 (8.9%) | 3.31 |
| Non-family | 8,579 (35.2%) | 1.23 |
| Total Households | 24,361 (100.0%) | 2.44 |
Household Size by Marriage Status in Bradford County
Out of a total of 24,361 households in Bradford County, 15,782 (64.8%) are family households, while 8,579 (35.2%) are nonfamily households. The most numerous type of family households are 2-person households, comprising 7,767, and the most common type of nonfamily households are 1-person households, comprising 7,084.
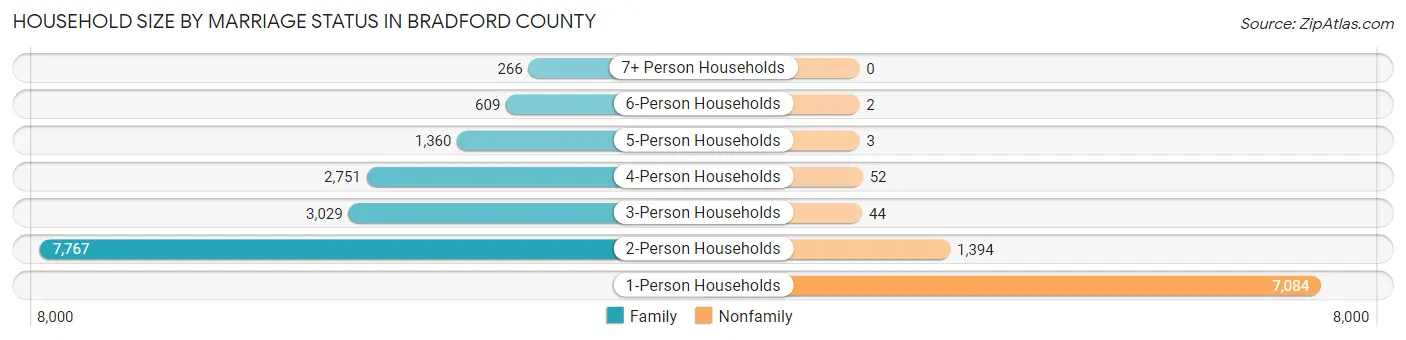
| Household Size | Family Households | Nonfamily Households |
| 1-Person Households | - | 7,084 (29.1%) |
| 2-Person Households | 7,767 (31.9%) | 1,394 (5.7%) |
| 3-Person Households | 3,029 (12.4%) | 44 (0.2%) |
| 4-Person Households | 2,751 (11.3%) | 52 (0.2%) |
| 5-Person Households | 1,360 (5.6%) | 3 (0.0%) |
| 6-Person Households | 609 (2.5%) | 2 (0.0%) |
| 7+ Person Households | 266 (1.1%) | 0 (0.0%) |
| Total | 15,782 (64.8%) | 8,579 (35.2%) |
Female Fertility in Bradford County
Fertility by Age in Bradford County
Average fertility rate in Bradford County is 64.0 births per 1,000 women. Women in the age bracket of 20 to 34 years have the highest fertility rate with 104.0 births per 1,000 women. Women in the age bracket of 20 to 34 years acount for 68.6% of all women with births.
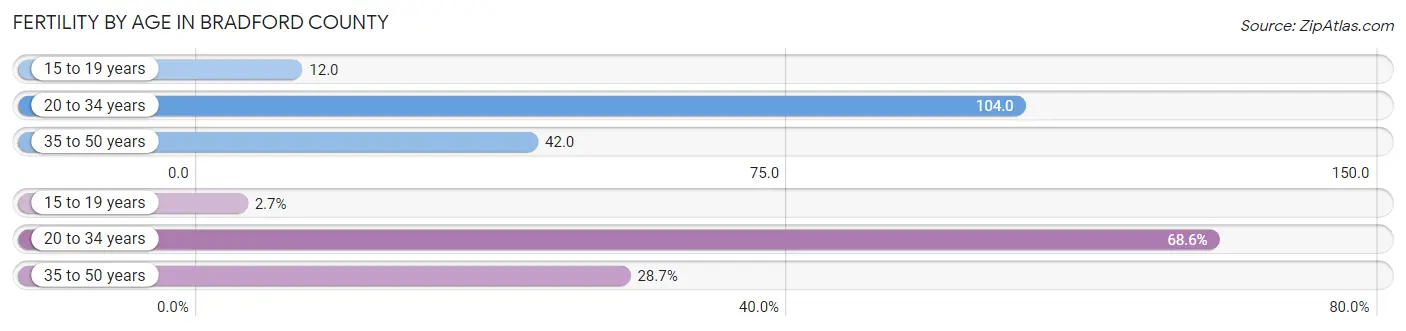
| Age Bracket | Women with Births | Births / 1,000 Women |
| 15 to 19 years | 20 (2.7%) | 12.0 |
| 20 to 34 years | 510 (68.6%) | 104.0 |
| 35 to 50 years | 213 (28.7%) | 42.0 |
| Total | 743 (100.0%) | 64.0 |
Fertility by Age by Marriage Status in Bradford County
54.4% of women with births (743) in Bradford County are married. The highest percentage of unmarried women with births falls into 15 to 19 years age bracket with 100.0% of them unmarried at the time of birth, while the lowest percentage of unmarried women with births belong to 35 to 50 years age bracket with 17.8% of them unmarried.
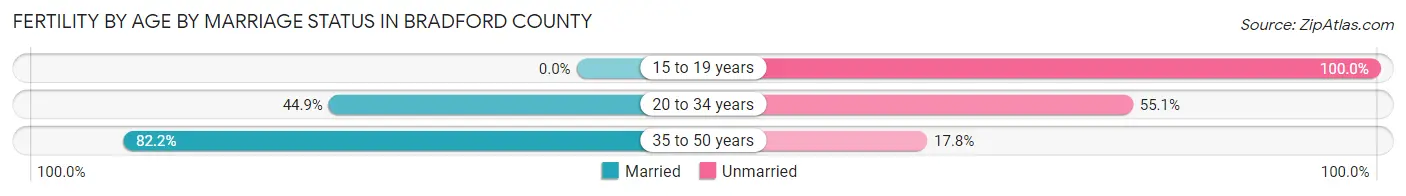
| Age Bracket | Married | Unmarried |
| 15 to 19 years | 0 (0.0%) | 20 (100.0%) |
| 20 to 34 years | 229 (44.9%) | 281 (55.1%) |
| 35 to 50 years | 175 (82.2%) | 38 (17.8%) |
| Total | 404 (54.4%) | 339 (45.6%) |
Fertility by Education in Bradford County
Average fertility rate in Bradford County is 64.0 births per 1,000 women. Women with the education attainment of high school diploma have the highest fertility rate of 89.0 births per 1,000 women, while women with the education attainment of less than high school have the lowest fertility at 33.0 births per 1,000 women. Women with the education attainment of high school diploma represent 48.4% of all women with births.
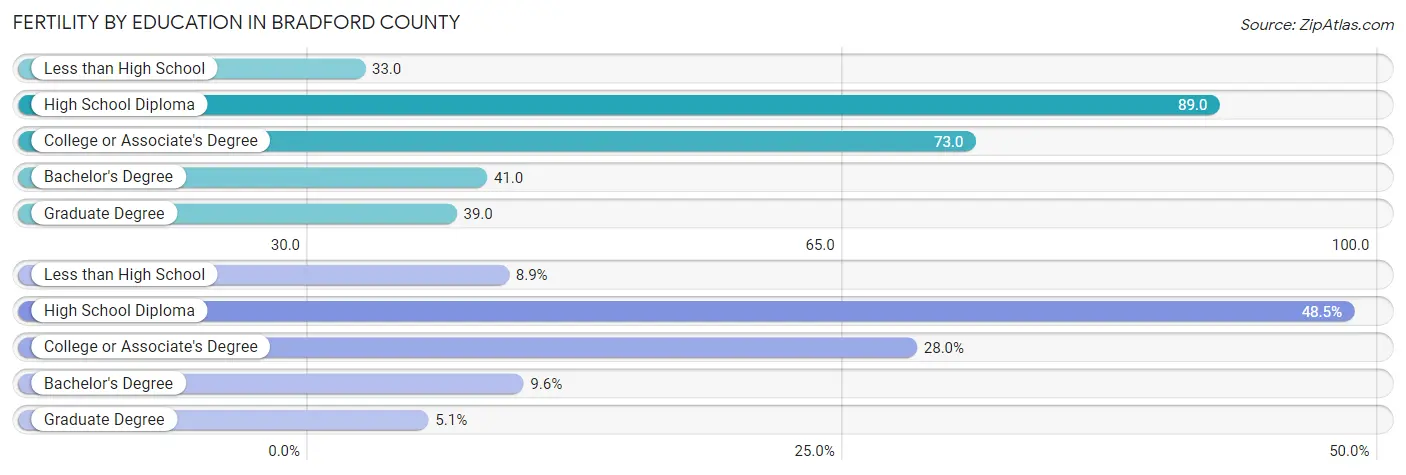
| Educational Attainment | Women with Births | Births / 1,000 Women |
| Less than High School | 66 (8.9%) | 33.0 |
| High School Diploma | 360 (48.4%) | 89.0 |
| College or Associate's Degree | 208 (28.0%) | 73.0 |
| Bachelor's Degree | 71 (9.6%) | 41.0 |
| Graduate Degree | 38 (5.1%) | 39.0 |
| Total | 743 (100.0%) | 64.0 |
Fertility by Education by Marriage Status in Bradford County
45.6% of women with births in Bradford County are unmarried. Women with the educational attainment of graduate degree are most likely to be married with 78.9% of them married at childbirth, while women with the educational attainment of high school diploma are least likely to be married with 52.2% of them unmarried at childbirth.
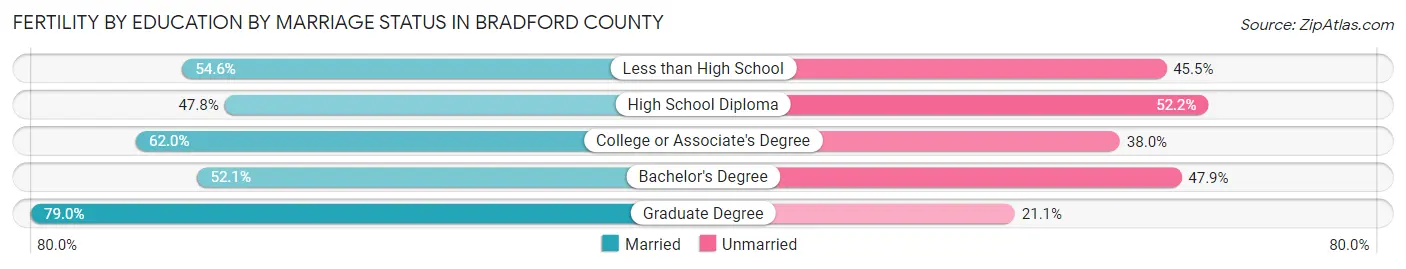
| Educational Attainment | Married | Unmarried |
| Less than High School | 36 (54.5%) | 30 (45.5%) |
| High School Diploma | 172 (47.8%) | 188 (52.2%) |
| College or Associate's Degree | 129 (62.0%) | 79 (38.0%) |
| Bachelor's Degree | 37 (52.1%) | 34 (47.9%) |
| Graduate Degree | 30 (78.9%) | 8 (21.0%) |
| Total | 404 (54.4%) | 339 (45.6%) |
Employment Characteristics in Bradford County
Employment by Class of Employer in Bradford County
Among the 25,435 employed individuals in Bradford County, private company employees (17,525 | 68.9%), not-for-profit organizations (2,808 | 11.0%), and local government employees (1,804 | 7.1%) make up the most common classes of employment.
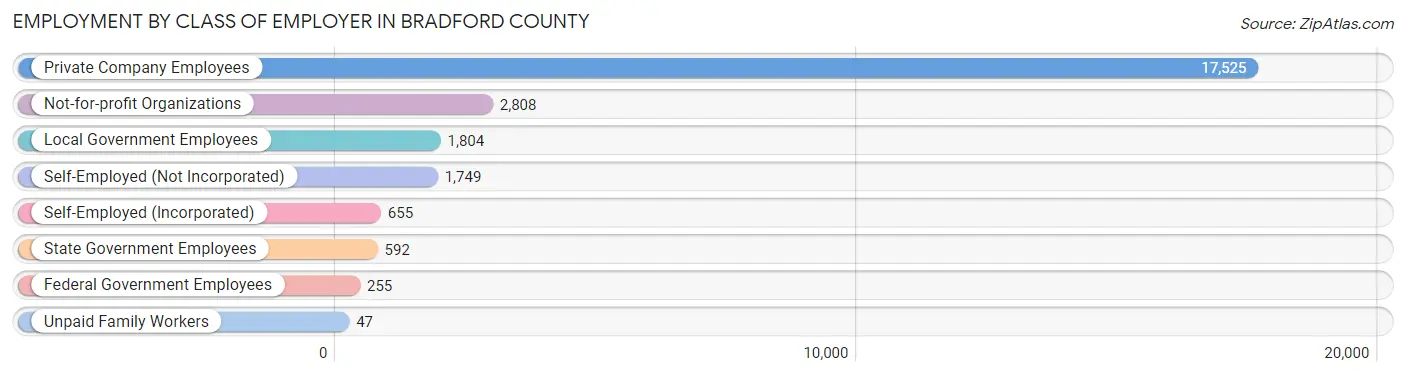
| Employer Class | # Employees | % Employees |
| Private Company Employees | 17,525 | 68.9% |
| Self-Employed (Incorporated) | 655 | 2.6% |
| Self-Employed (Not Incorporated) | 1,749 | 6.9% |
| Not-for-profit Organizations | 2,808 | 11.0% |
| Local Government Employees | 1,804 | 7.1% |
| State Government Employees | 592 | 2.3% |
| Federal Government Employees | 255 | 1.0% |
| Unpaid Family Workers | 47 | 0.2% |
| Total | 25,435 | 100.0% |
Employment Status by Age in Bradford County
According to the labor force statistics for Bradford County, out of the total population over 16 years of age (48,709), 56.0% or 27,277 individuals are in the labor force, with 4.8% or 1,309 of them unemployed. The age group with the highest labor force participation rate is 25 to 29 years, with 85.9% or 2,953 individuals in the labor force. Within the labor force, the 16 to 19 years age range has the highest percentage of unemployed individuals, with 15.0% or 152 of them being unemployed.
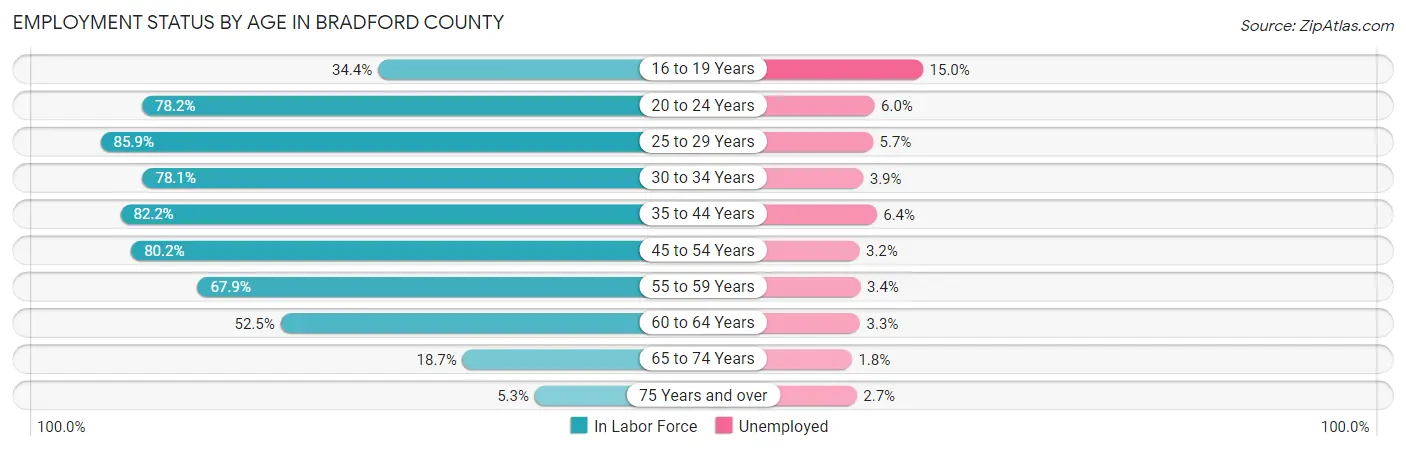
| Age Bracket | In Labor Force | Unemployed |
| 16 to 19 Years | 1,011 (34.4%) | 152 (15.0%) |
| 20 to 24 Years | 2,516 (78.2%) | 151 (6.0%) |
| 25 to 29 Years | 2,953 (85.9%) | 168 (5.7%) |
| 30 to 34 Years | 2,602 (78.1%) | 101 (3.9%) |
| 35 to 44 Years | 5,138 (82.2%) | 329 (6.4%) |
| 45 to 54 Years | 5,784 (80.2%) | 185 (3.2%) |
| 55 to 59 Years | 3,322 (67.9%) | 113 (3.4%) |
| 60 to 64 Years | 2,282 (52.5%) | 75 (3.3%) |
| 65 to 74 Years | 1,390 (18.7%) | 25 (1.8%) |
| 75 Years and over | 299 (5.3%) | 8 (2.7%) |
| Total | 27,277 (56.0%) | 1,309 (4.8%) |
Employment Status by Educational Attainment in Bradford County
According to labor force statistics for Bradford County, 74.9% of individuals (22,074) out of the total population between 25 and 64 years of age (29,471) are in the labor force, with 4.4% or 971 of them being unemployed. The group with the highest labor force participation rate are those with the educational attainment of bachelor's degree or higher, with 83.1% or 5,237 individuals in the labor force. Within the labor force, individuals with less than high school education have the highest percentage of unemployment, with 9.9% or 120 of them being unemployed.
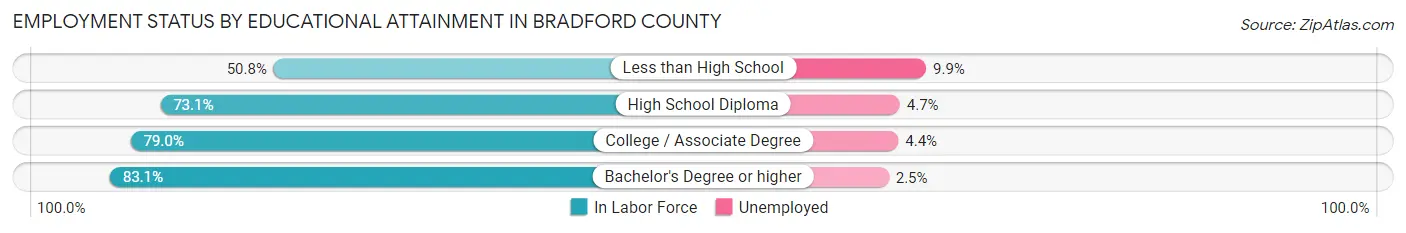
| Educational Attainment | In Labor Force | Unemployed |
| Less than High School | 1,208 (50.8%) | 235 (9.9%) |
| High School Diploma | 9,746 (73.1%) | 627 (4.7%) |
| College / Associate Degree | 5,893 (79.0%) | 328 (4.4%) |
| Bachelor's Degree or higher | 5,237 (83.1%) | 158 (2.5%) |
| Total | 22,074 (74.9%) | 1,297 (4.4%) |
Employment Occupations by Sex in Bradford County
Management, Business, Science and Arts Occupations
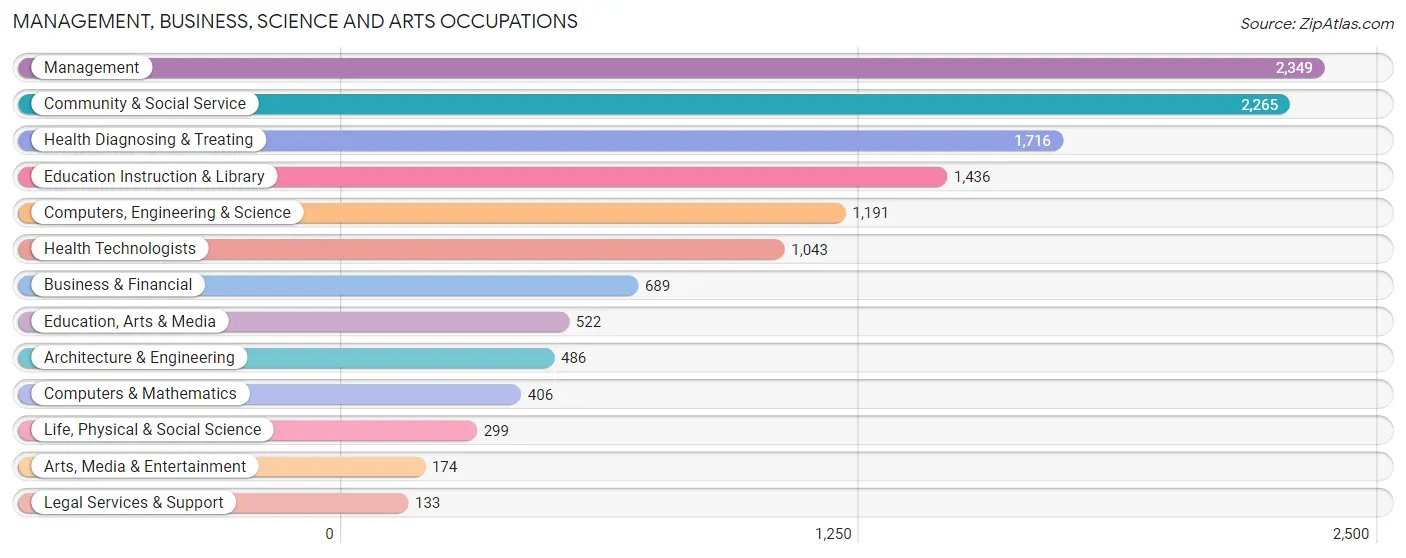
The most common Management, Business, Science and Arts occupations in Bradford County are Management (2,349 | 9.0%), Community & Social Service (2,265 | 8.7%), Health Diagnosing & Treating (1,716 | 6.6%), Education Instruction & Library (1,436 | 5.5%), and Computers, Engineering & Science (1,191 | 4.6%).
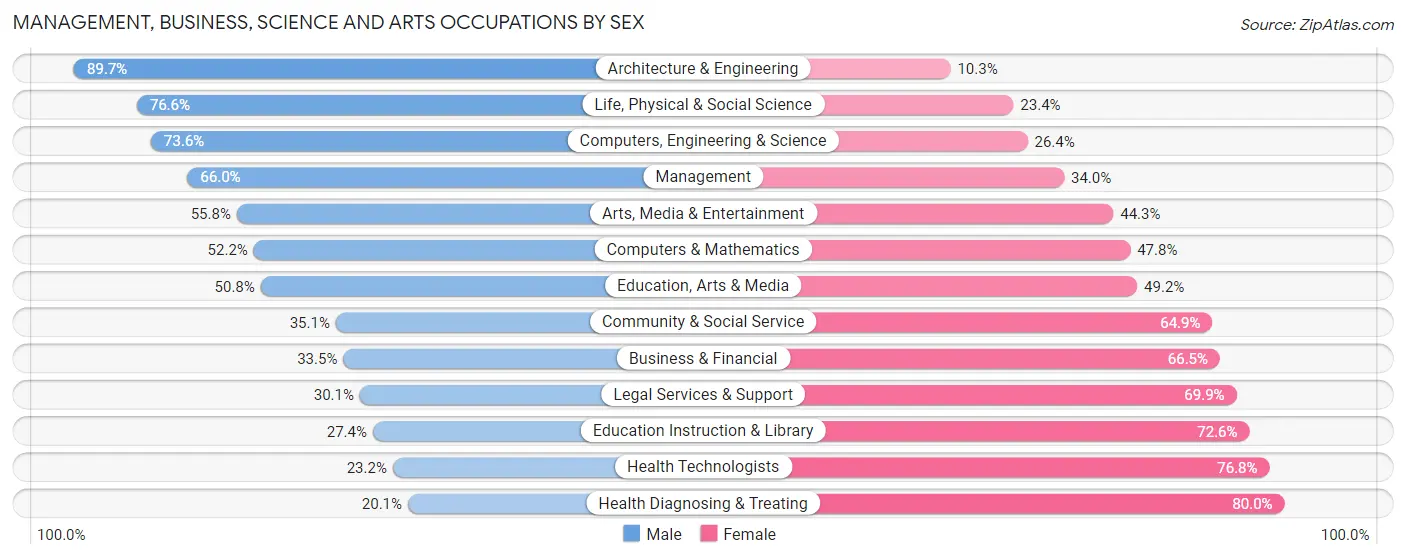
Management, Business, Science and Arts Occupations by Sex
Within the Management, Business, Science and Arts occupations in Bradford County, the most male-oriented occupations are Architecture & Engineering (89.7%), Life, Physical & Social Science (76.6%), and Computers, Engineering & Science (73.6%), while the most female-oriented occupations are Health Diagnosing & Treating (79.9%), Health Technologists (76.8%), and Education Instruction & Library (72.6%).
| Occupation | Male | Female |
| Management | 1,551 (66.0%) | 798 (34.0%) |
| Business & Financial | 231 (33.5%) | 458 (66.5%) |
| Computers, Engineering & Science | 877 (73.6%) | 314 (26.4%) |
| Computers & Mathematics | 212 (52.2%) | 194 (47.8%) |
| Architecture & Engineering | 436 (89.7%) | 50 (10.3%) |
| Life, Physical & Social Science | 229 (76.6%) | 70 (23.4%) |
| Community & Social Service | 795 (35.1%) | 1,470 (64.9%) |
| Education, Arts & Media | 265 (50.8%) | 257 (49.2%) |
| Legal Services & Support | 40 (30.1%) | 93 (69.9%) |
| Education Instruction & Library | 393 (27.4%) | 1,043 (72.6%) |
| Arts, Media & Entertainment | 97 (55.7%) | 77 (44.3%) |
| Health Diagnosing & Treating | 344 (20.1%) | 1,372 (79.9%) |
| Health Technologists | 242 (23.2%) | 801 (76.8%) |
| Total (Category) | 3,798 (46.3%) | 4,412 (53.7%) |
| Total (Overall) | 14,290 (55.0%) | 11,671 (45.0%) |
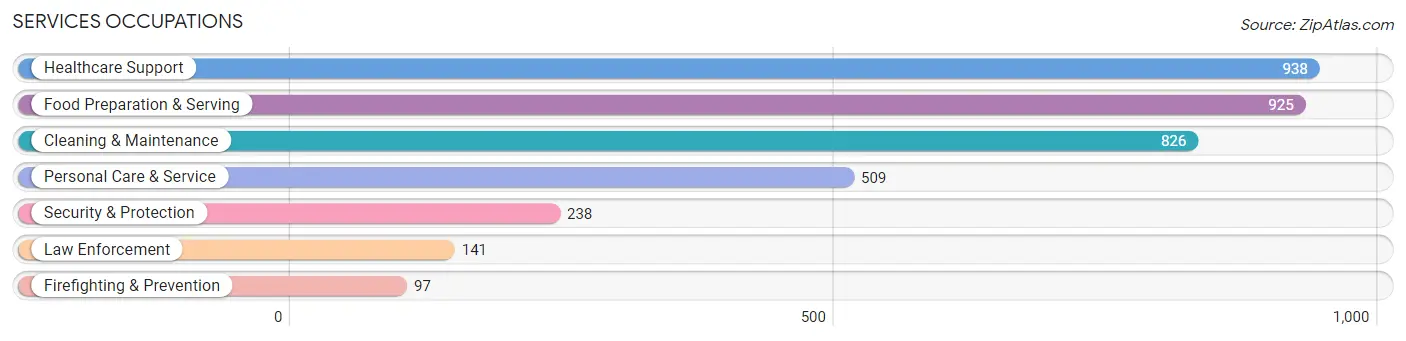
Services Occupations
The most common Services occupations in Bradford County are Healthcare Support (938 | 3.6%), Food Preparation & Serving (925 | 3.6%), Cleaning & Maintenance (826 | 3.2%), Personal Care & Service (509 | 2.0%), and Security & Protection (238 | 0.9%).
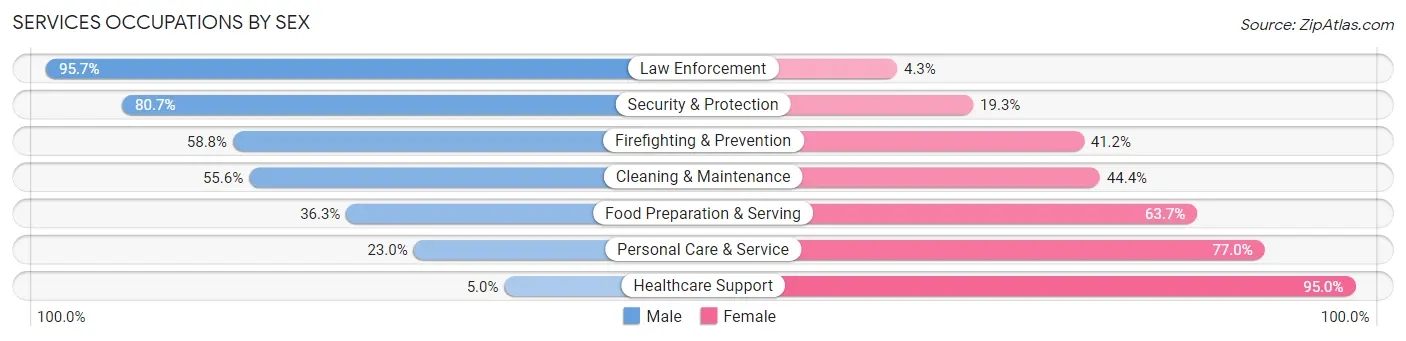
Services Occupations by Sex
Within the Services occupations in Bradford County, the most male-oriented occupations are Law Enforcement (95.7%), Security & Protection (80.7%), and Firefighting & Prevention (58.8%), while the most female-oriented occupations are Healthcare Support (95.0%), Personal Care & Service (77.0%), and Food Preparation & Serving (63.7%).
| Occupation | Male | Female |
| Healthcare Support | 47 (5.0%) | 891 (95.0%) |
| Security & Protection | 192 (80.7%) | 46 (19.3%) |
| Firefighting & Prevention | 57 (58.8%) | 40 (41.2%) |
| Law Enforcement | 135 (95.7%) | 6 (4.3%) |
| Food Preparation & Serving | 336 (36.3%) | 589 (63.7%) |
| Cleaning & Maintenance | 459 (55.6%) | 367 (44.4%) |
| Personal Care & Service | 117 (23.0%) | 392 (77.0%) |
| Total (Category) | 1,151 (33.5%) | 2,285 (66.5%) |
| Total (Overall) | 14,290 (55.0%) | 11,671 (45.0%) |
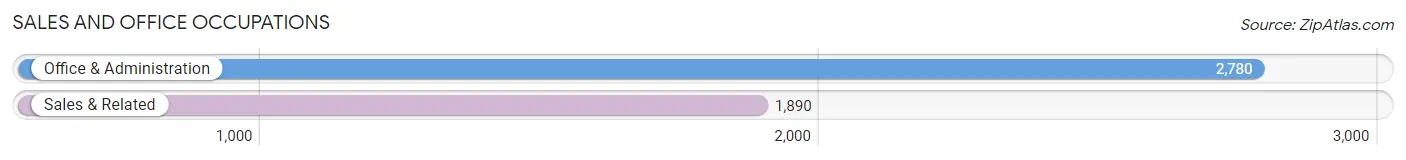
Sales and Office Occupations
The most common Sales and Office occupations in Bradford County are Office & Administration (2,780 | 10.7%), and Sales & Related (1,890 | 7.3%).
Sales and Office Occupations by Sex
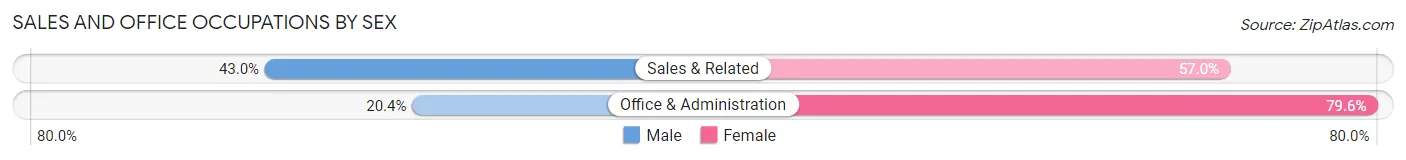
| Occupation | Male | Female |
| Sales & Related | 813 (43.0%) | 1,077 (57.0%) |
| Office & Administration | 566 (20.4%) | 2,214 (79.6%) |
| Total (Category) | 1,379 (29.5%) | 3,291 (70.5%) |
| Total (Overall) | 14,290 (55.0%) | 11,671 (45.0%) |
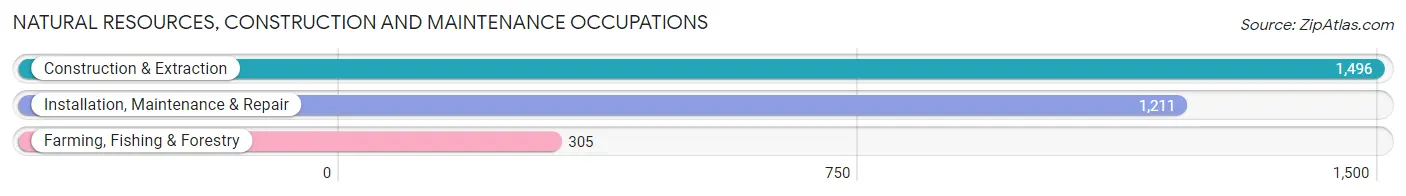
Natural Resources, Construction and Maintenance Occupations
The most common Natural Resources, Construction and Maintenance occupations in Bradford County are Construction & Extraction (1,496 | 5.8%), Installation, Maintenance & Repair (1,211 | 4.7%), and Farming, Fishing & Forestry (305 | 1.2%).
Natural Resources, Construction and Maintenance Occupations by Sex
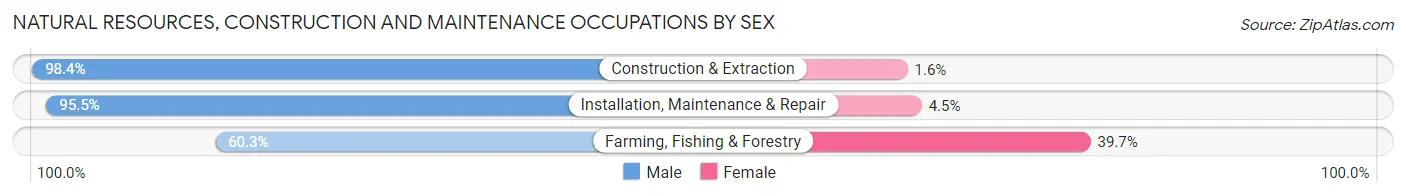
| Occupation | Male | Female |
| Farming, Fishing & Forestry | 184 (60.3%) | 121 (39.7%) |
| Construction & Extraction | 1,472 (98.4%) | 24 (1.6%) |
| Installation, Maintenance & Repair | 1,156 (95.5%) | 55 (4.5%) |
| Total (Category) | 2,812 (93.4%) | 200 (6.6%) |
| Total (Overall) | 14,290 (55.0%) | 11,671 (45.0%) |
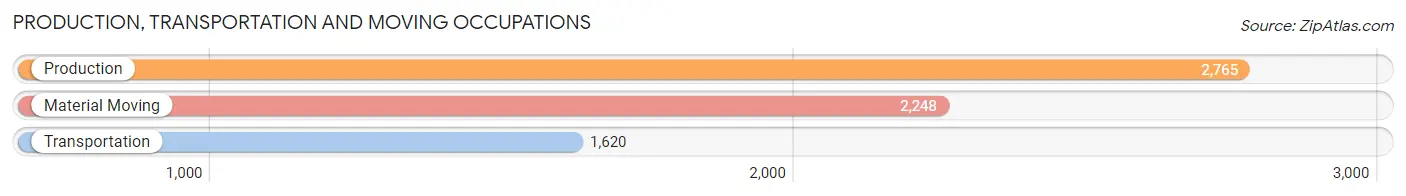
Production, Transportation and Moving Occupations
The most common Production, Transportation and Moving occupations in Bradford County are Production (2,765 | 10.6%), Material Moving (2,248 | 8.7%), and Transportation (1,620 | 6.2%).
Production, Transportation and Moving Occupations by Sex
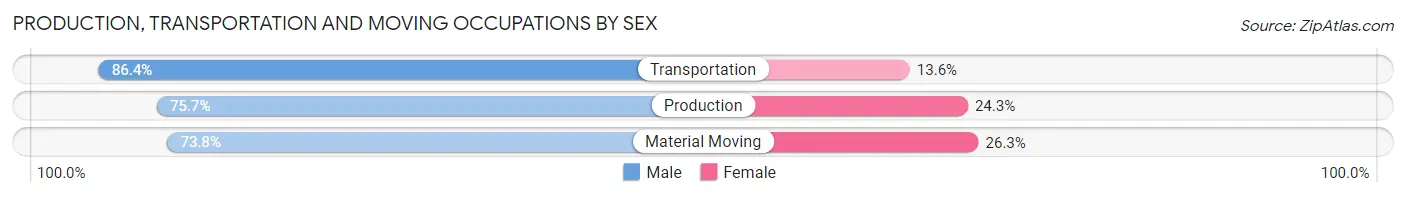
| Occupation | Male | Female |
| Production | 2,093 (75.7%) | 672 (24.3%) |
| Transportation | 1,399 (86.4%) | 221 (13.6%) |
| Material Moving | 1,658 (73.8%) | 590 (26.3%) |
| Total (Category) | 5,150 (77.6%) | 1,483 (22.4%) |
| Total (Overall) | 14,290 (55.0%) | 11,671 (45.0%) |
Employment Industries by Sex in Bradford County
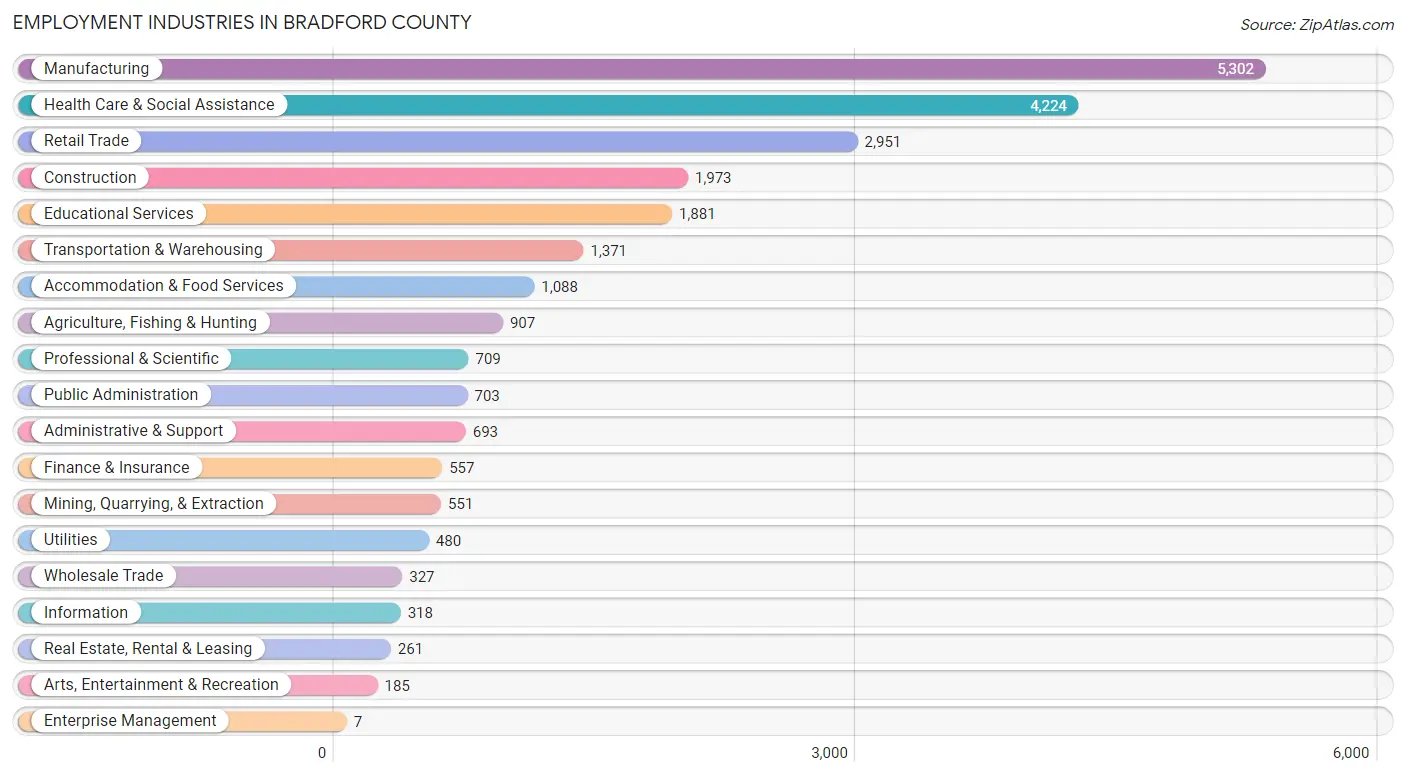
Employment Industries in Bradford County
The major employment industries in Bradford County include Manufacturing (5,302 | 20.4%), Health Care & Social Assistance (4,224 | 16.3%), Retail Trade (2,951 | 11.4%), Construction (1,973 | 7.6%), and Educational Services (1,881 | 7.2%).
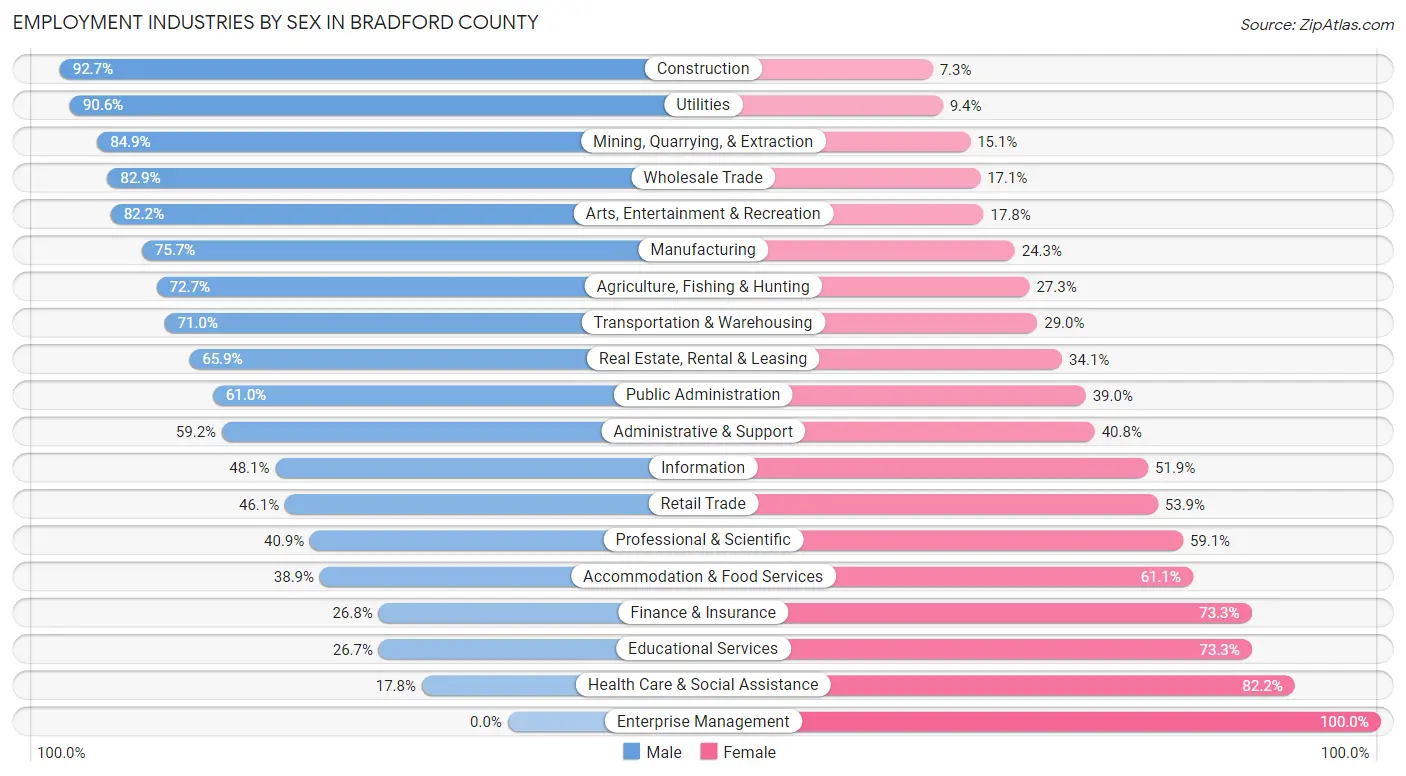
Employment Industries by Sex in Bradford County
The Bradford County industries that see more men than women are Construction (92.7%), Utilities (90.6%), and Mining, Quarrying, & Extraction (84.9%), whereas the industries that tend to have a higher number of women are Enterprise Management (100.0%), Health Care & Social Assistance (82.2%), and Educational Services (73.3%).
| Industry | Male | Female |
| Agriculture, Fishing & Hunting | 659 (72.7%) | 248 (27.3%) |
| Mining, Quarrying, & Extraction | 468 (84.9%) | 83 (15.1%) |
| Construction | 1,829 (92.7%) | 144 (7.3%) |
| Manufacturing | 4,014 (75.7%) | 1,288 (24.3%) |
| Wholesale Trade | 271 (82.9%) | 56 (17.1%) |
| Retail Trade | 1,360 (46.1%) | 1,591 (53.9%) |
| Transportation & Warehousing | 974 (71.0%) | 397 (29.0%) |
| Utilities | 435 (90.6%) | 45 (9.4%) |
| Information | 153 (48.1%) | 165 (51.9%) |
| Finance & Insurance | 149 (26.8%) | 408 (73.3%) |
| Real Estate, Rental & Leasing | 172 (65.9%) | 89 (34.1%) |
| Professional & Scientific | 290 (40.9%) | 419 (59.1%) |
| Enterprise Management | 0 (0.0%) | 7 (100.0%) |
| Administrative & Support | 410 (59.2%) | 283 (40.8%) |
| Educational Services | 502 (26.7%) | 1,379 (73.3%) |
| Health Care & Social Assistance | 751 (17.8%) | 3,473 (82.2%) |
| Arts, Entertainment & Recreation | 152 (82.2%) | 33 (17.8%) |
| Accommodation & Food Services | 423 (38.9%) | 665 (61.1%) |
| Public Administration | 429 (61.0%) | 274 (39.0%) |
| Total | 14,290 (55.0%) | 11,671 (45.0%) |
Education in Bradford County
School Enrollment in Bradford County
The most common levels of schooling among the 11,917 students in Bradford County are middle school (3,144 | 26.4%), high school (3,003 | 25.2%), and elementary school (2,910 | 24.4%).
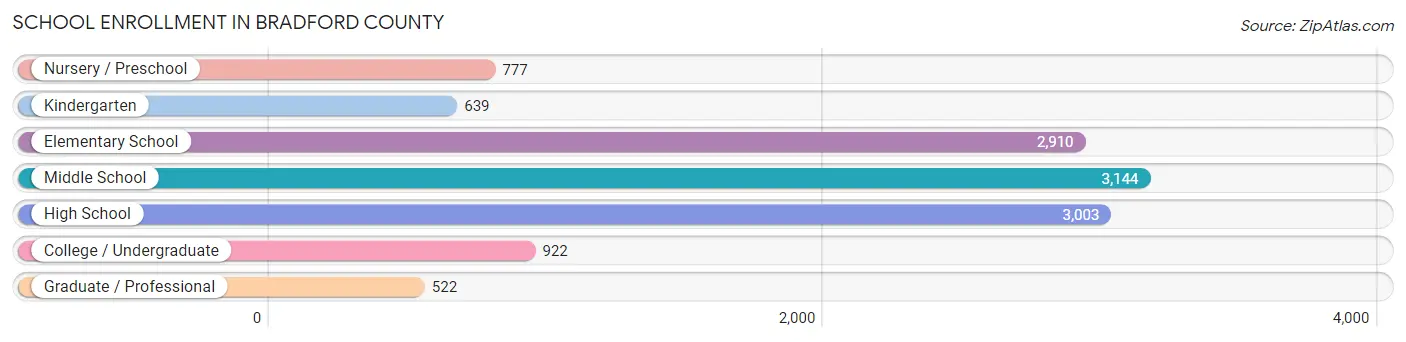
| School Level | # Students | % Students |
| Nursery / Preschool | 777 | 6.5% |
| Kindergarten | 639 | 5.4% |
| Elementary School | 2,910 | 24.4% |
| Middle School | 3,144 | 26.4% |
| High School | 3,003 | 25.2% |
| College / Undergraduate | 922 | 7.7% |
| Graduate / Professional | 522 | 4.4% |
| Total | 11,917 | 100.0% |
School Enrollment by Age by Funding Source in Bradford County
Out of a total of 11,917 students who are enrolled in schools in Bradford County, 1,656 (13.9%) attend a private institution, while the remaining 10,261 (86.1%) are enrolled in public schools. The age group of 25 to 34 year olds has the highest likelihood of being enrolled in private schools, with 128 (31.8% in the age bracket) enrolled. Conversely, the age group of 10 to 14 year olds has the lowest likelihood of being enrolled in a private school, with 3,640 (93.4% in the age bracket) attending a public institution.
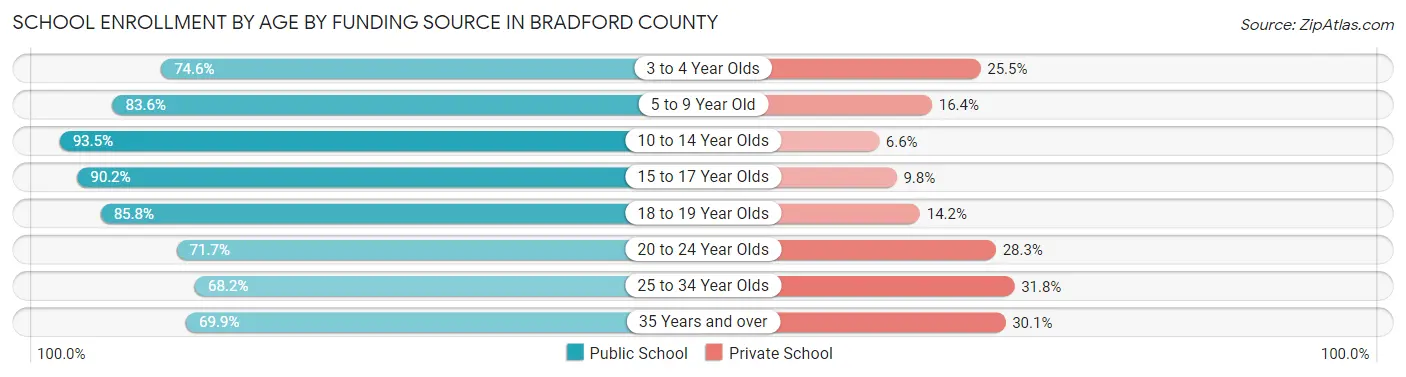
| Age Bracket | Public School | Private School |
| 3 to 4 Year Olds | 451 (74.6%) | 154 (25.5%) |
| 5 to 9 Year Old | 2,765 (83.6%) | 543 (16.4%) |
| 10 to 14 Year Olds | 3,640 (93.4%) | 255 (6.6%) |
| 15 to 17 Year Olds | 1,944 (90.2%) | 212 (9.8%) |
| 18 to 19 Year Olds | 472 (85.8%) | 78 (14.2%) |
| 20 to 24 Year Olds | 400 (71.7%) | 158 (28.3%) |
| 25 to 34 Year Olds | 275 (68.2%) | 128 (31.8%) |
| 35 Years and over | 309 (69.9%) | 133 (30.1%) |
| Total | 10,261 (86.1%) | 1,656 (13.9%) |
Educational Attainment by Field of Study in Bradford County
Education (2,033 | 22.6%), science & technology (1,340 | 14.9%), business (1,132 | 12.6%), arts & humanities (753 | 8.4%), and bio, nature & agricultural (688 | 7.6%) are the most common fields of study among 8,998 individuals in Bradford County who have obtained a bachelor's degree or higher.
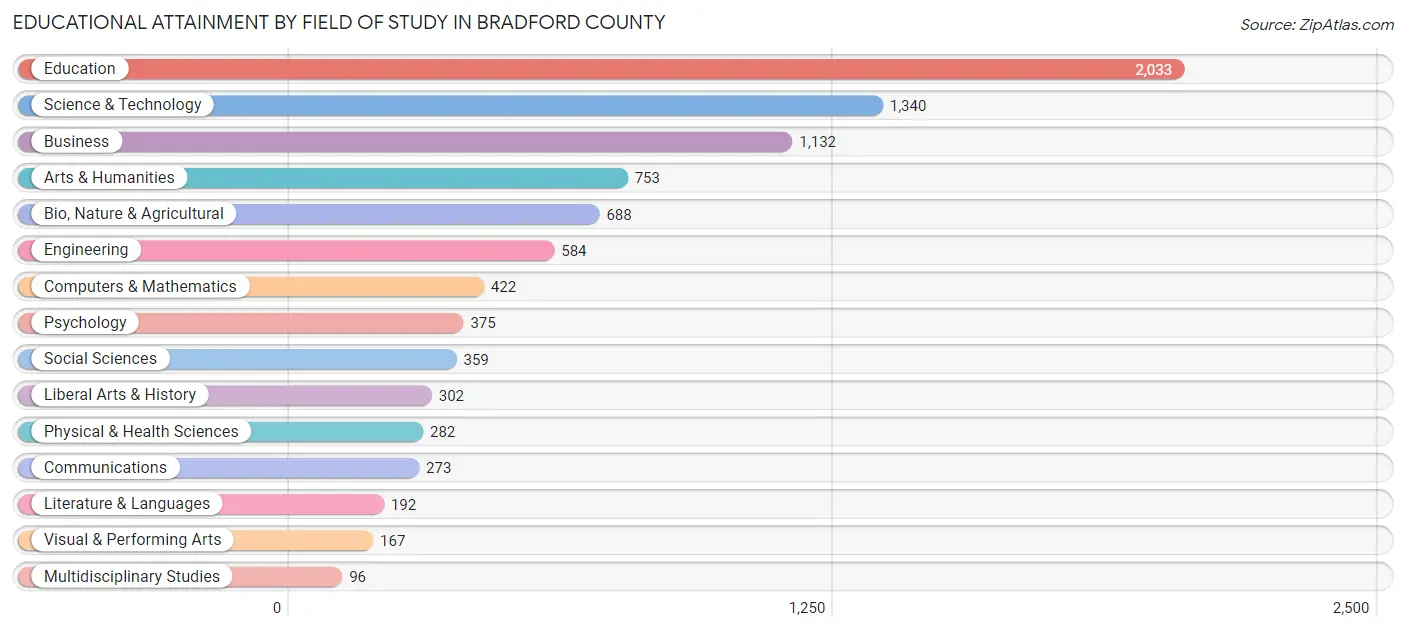
| Field of Study | # Graduates | % Graduates |
| Computers & Mathematics | 422 | 4.7% |
| Bio, Nature & Agricultural | 688 | 7.6% |
| Physical & Health Sciences | 282 | 3.1% |
| Psychology | 375 | 4.2% |
| Social Sciences | 359 | 4.0% |
| Engineering | 584 | 6.5% |
| Multidisciplinary Studies | 96 | 1.1% |
| Science & Technology | 1,340 | 14.9% |
| Business | 1,132 | 12.6% |
| Education | 2,033 | 22.6% |
| Literature & Languages | 192 | 2.1% |
| Liberal Arts & History | 302 | 3.4% |
| Visual & Performing Arts | 167 | 1.9% |
| Communications | 273 | 3.0% |
| Arts & Humanities | 753 | 8.4% |
| Total | 8,998 | 100.0% |
Transportation & Commute in Bradford County
Vehicle Availability by Sex in Bradford County
The most prevalent vehicle ownership categories in Bradford County are males with 2 vehicles (5,647, accounting for 40.3%) and females with 2 vehicles (4,375, making up 49.6%).
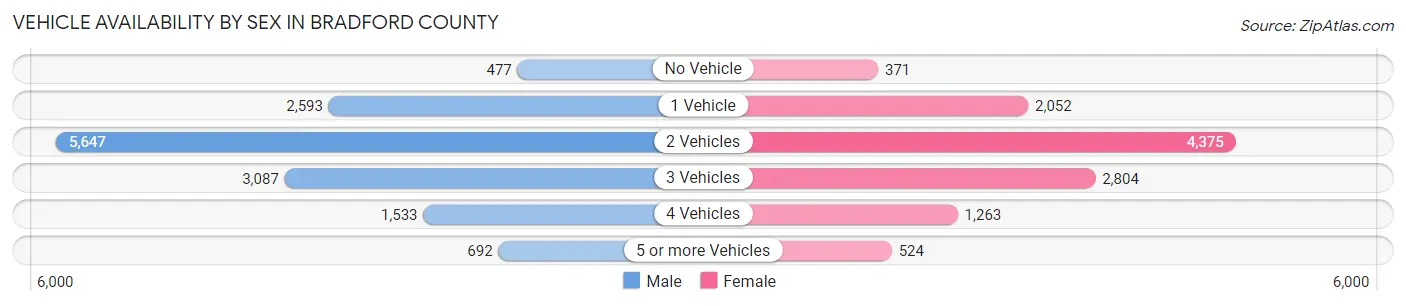
| Vehicles Available | Male | Female |
| No Vehicle | 477 (3.4%) | 371 (3.3%) |
| 1 Vehicle | 2,593 (18.5%) | 2,052 (18.0%) |
| 2 Vehicles | 5,647 (40.3%) | 4,375 (38.4%) |
| 3 Vehicles | 3,087 (22.0%) | 2,804 (24.6%) |
| 4 Vehicles | 1,533 (10.9%) | 1,263 (11.1%) |
| 5 or more Vehicles | 692 (4.9%) | 524 (4.6%) |
| Total | 14,029 (100.0%) | 11,389 (100.0%) |
Commute Time in Bradford County
The most frequently occuring commute durations in Bradford County are 5 to 9 minutes (3,923 commuters, 16.5%), 10 to 14 minutes (3,184 commuters, 13.4%), and 15 to 19 minutes (2,937 commuters, 12.4%).
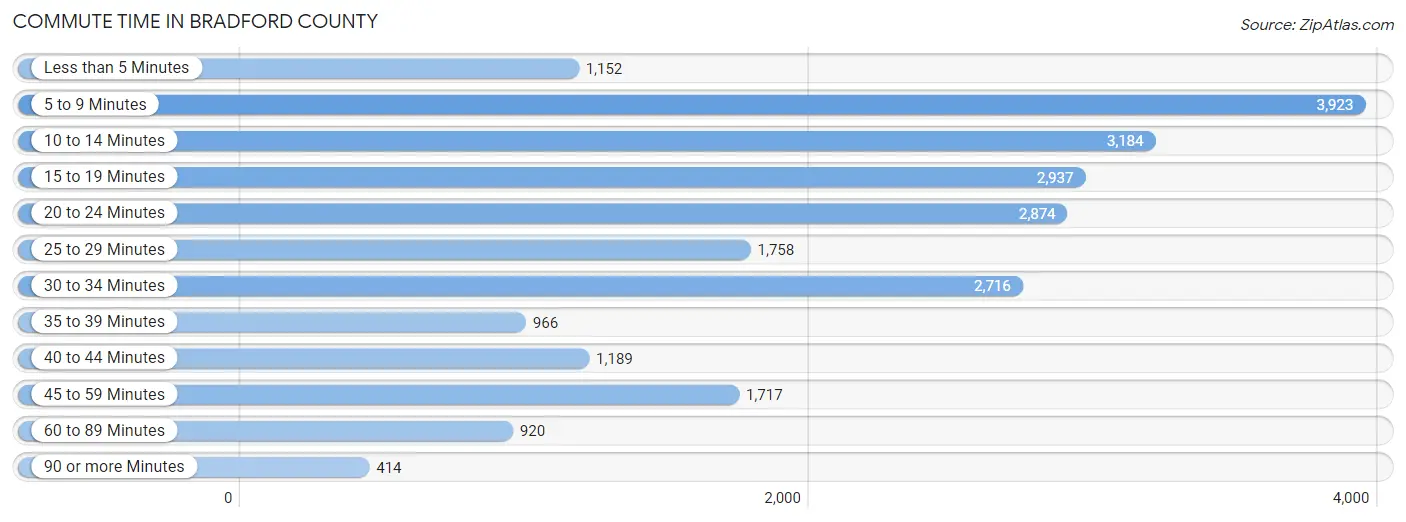
| Commute Time | # Commuters | % Commuters |
| Less than 5 Minutes | 1,152 | 4.9% |
| 5 to 9 Minutes | 3,923 | 16.5% |
| 10 to 14 Minutes | 3,184 | 13.4% |
| 15 to 19 Minutes | 2,937 | 12.4% |
| 20 to 24 Minutes | 2,874 | 12.1% |
| 25 to 29 Minutes | 1,758 | 7.4% |
| 30 to 34 Minutes | 2,716 | 11.4% |
| 35 to 39 Minutes | 966 | 4.1% |
| 40 to 44 Minutes | 1,189 | 5.0% |
| 45 to 59 Minutes | 1,717 | 7.2% |
| 60 to 89 Minutes | 920 | 3.9% |
| 90 or more Minutes | 414 | 1.7% |
Commute Time by Sex in Bradford County
The most common commute times in Bradford County are 5 to 9 minutes (2,036 commuters, 15.5%) for males and 5 to 9 minutes (1,887 commuters, 17.8%) for females.
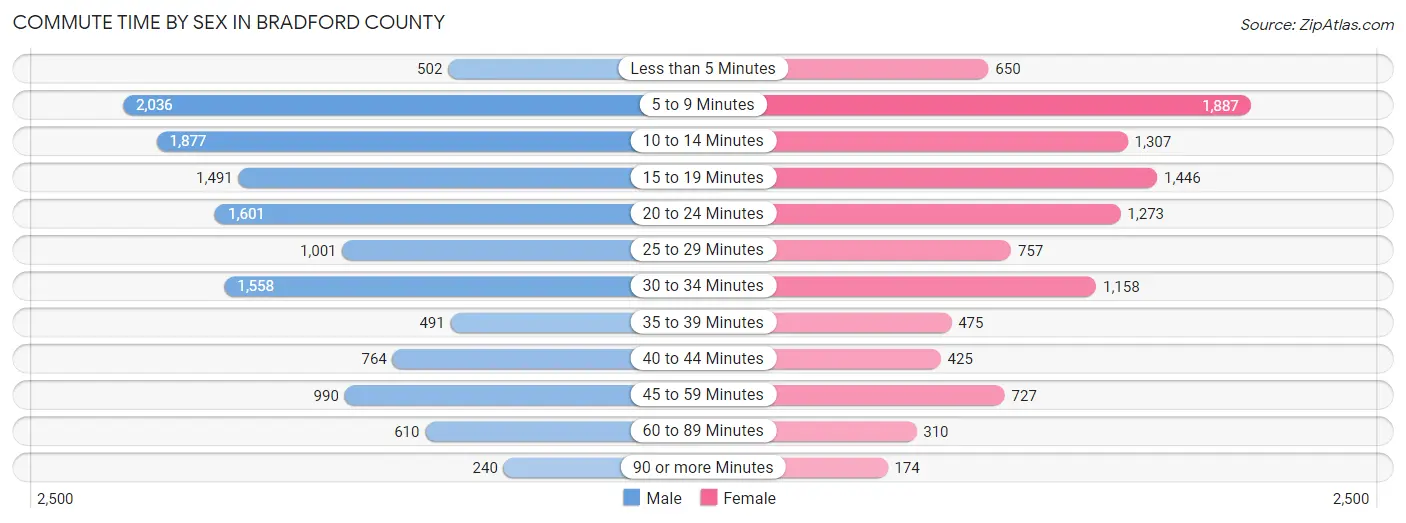
| Commute Time | Male | Female |
| Less than 5 Minutes | 502 (3.8%) | 650 (6.1%) |
| 5 to 9 Minutes | 2,036 (15.5%) | 1,887 (17.8%) |
| 10 to 14 Minutes | 1,877 (14.3%) | 1,307 (12.3%) |
| 15 to 19 Minutes | 1,491 (11.3%) | 1,446 (13.7%) |
| 20 to 24 Minutes | 1,601 (12.2%) | 1,273 (12.0%) |
| 25 to 29 Minutes | 1,001 (7.6%) | 757 (7.1%) |
| 30 to 34 Minutes | 1,558 (11.8%) | 1,158 (10.9%) |
| 35 to 39 Minutes | 491 (3.7%) | 475 (4.5%) |
| 40 to 44 Minutes | 764 (5.8%) | 425 (4.0%) |
| 45 to 59 Minutes | 990 (7.5%) | 727 (6.9%) |
| 60 to 89 Minutes | 610 (4.6%) | 310 (2.9%) |
| 90 or more Minutes | 240 (1.8%) | 174 (1.6%) |
Time of Departure to Work by Sex in Bradford County
The most frequent times of departure to work in Bradford County are 7:00 AM to 7:29 AM (1,907, 14.5%) for males and 7:30 AM to 7:59 AM (1,787, 16.9%) for females.
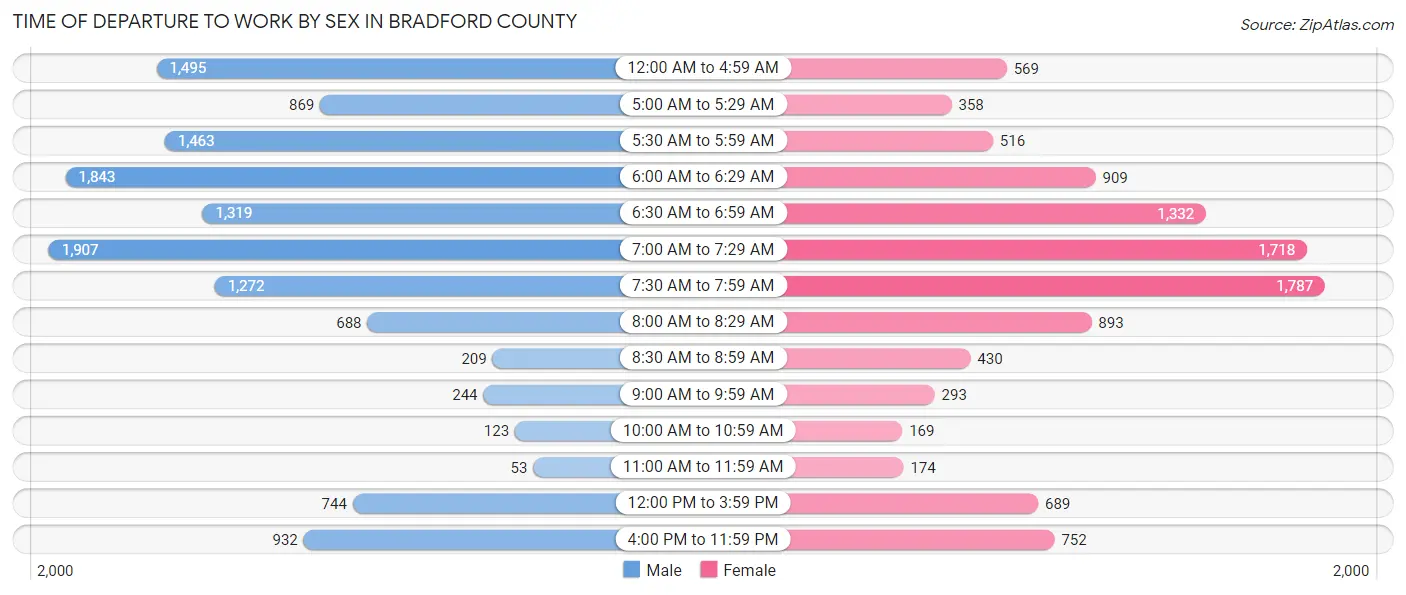
| Time of Departure | Male | Female |
| 12:00 AM to 4:59 AM | 1,495 (11.4%) | 569 (5.4%) |
| 5:00 AM to 5:29 AM | 869 (6.6%) | 358 (3.4%) |
| 5:30 AM to 5:59 AM | 1,463 (11.1%) | 516 (4.9%) |
| 6:00 AM to 6:29 AM | 1,843 (14.0%) | 909 (8.6%) |
| 6:30 AM to 6:59 AM | 1,319 (10.0%) | 1,332 (12.6%) |
| 7:00 AM to 7:29 AM | 1,907 (14.5%) | 1,718 (16.2%) |
| 7:30 AM to 7:59 AM | 1,272 (9.7%) | 1,787 (16.9%) |
| 8:00 AM to 8:29 AM | 688 (5.2%) | 893 (8.4%) |
| 8:30 AM to 8:59 AM | 209 (1.6%) | 430 (4.1%) |
| 9:00 AM to 9:59 AM | 244 (1.8%) | 293 (2.8%) |
| 10:00 AM to 10:59 AM | 123 (0.9%) | 169 (1.6%) |
| 11:00 AM to 11:59 AM | 53 (0.4%) | 174 (1.6%) |
| 12:00 PM to 3:59 PM | 744 (5.7%) | 689 (6.5%) |
| 4:00 PM to 11:59 PM | 932 (7.1%) | 752 (7.1%) |
| Total | 13,161 (100.0%) | 10,589 (100.0%) |
Housing Occupancy in Bradford County
Occupancy by Ownership in Bradford County
Of the total 24,361 dwellings in Bradford County, owner-occupied units account for 17,648 (72.4%), while renter-occupied units make up 6,713 (27.6%).
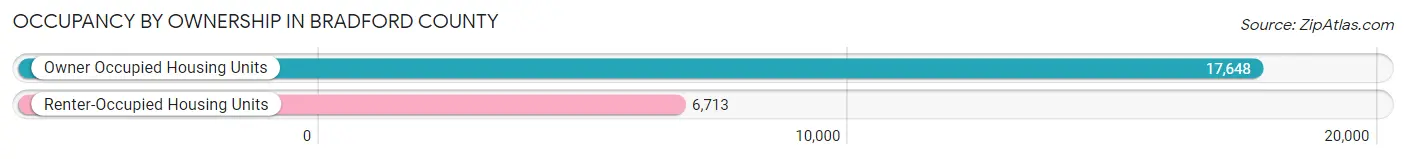
| Occupancy | # Housing Units | % Housing Units |
| Owner Occupied Housing Units | 17,648 | 72.4% |
| Renter-Occupied Housing Units | 6,713 | 27.6% |
| Total Occupied Housing Units | 24,361 | 100.0% |
Occupancy by Household Size in Bradford County
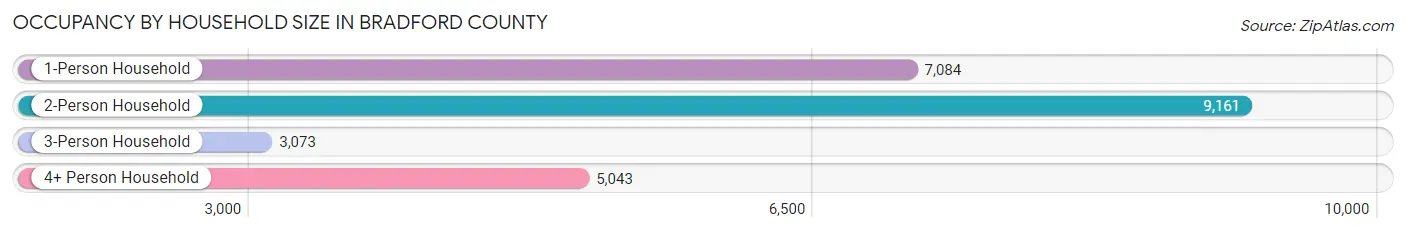
| Household Size | # Housing Units | % Housing Units |
| 1-Person Household | 7,084 | 29.1% |
| 2-Person Household | 9,161 | 37.6% |
| 3-Person Household | 3,073 | 12.6% |
| 4+ Person Household | 5,043 | 20.7% |
| Total Housing Units | 24,361 | 100.0% |
Occupancy by Ownership by Household Size in Bradford County
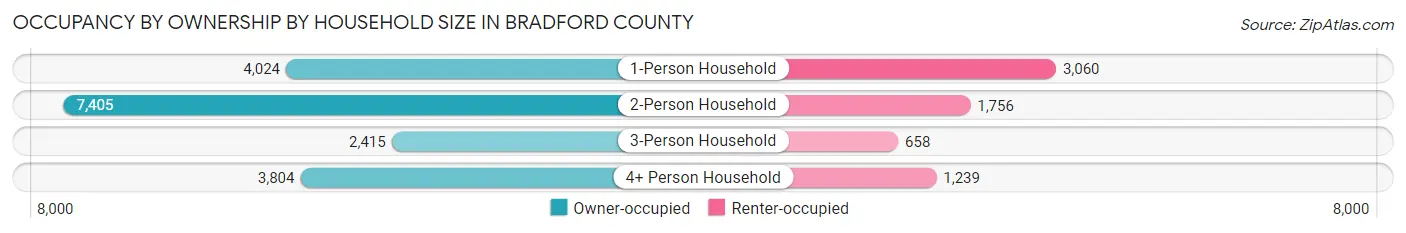
| Household Size | Owner-occupied | Renter-occupied |
| 1-Person Household | 4,024 (56.8%) | 3,060 (43.2%) |
| 2-Person Household | 7,405 (80.8%) | 1,756 (19.2%) |
| 3-Person Household | 2,415 (78.6%) | 658 (21.4%) |
| 4+ Person Household | 3,804 (75.4%) | 1,239 (24.6%) |
| Total Housing Units | 17,648 (72.4%) | 6,713 (27.6%) |
Occupancy by Educational Attainment in Bradford County
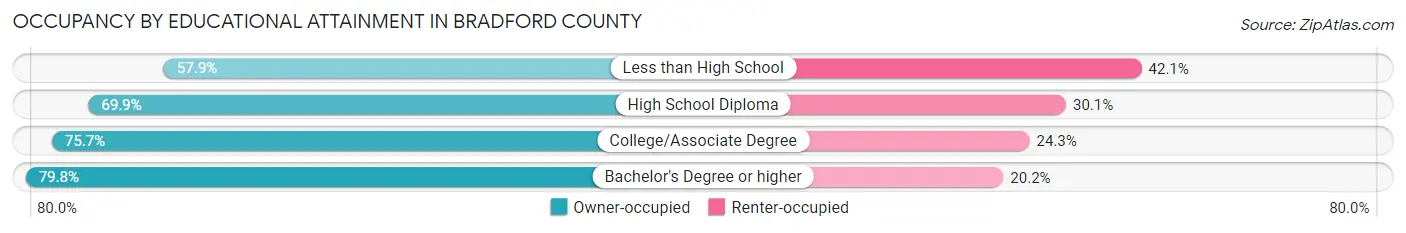
| Household Size | Owner-occupied | Renter-occupied |
| Less than High School | 1,147 (57.9%) | 834 (42.1%) |
| High School Diploma | 7,799 (69.9%) | 3,362 (30.1%) |
| College/Associate Degree | 4,597 (75.7%) | 1,479 (24.3%) |
| Bachelor's Degree or higher | 4,105 (79.8%) | 1,038 (20.2%) |
Occupancy by Age of Householder in Bradford County
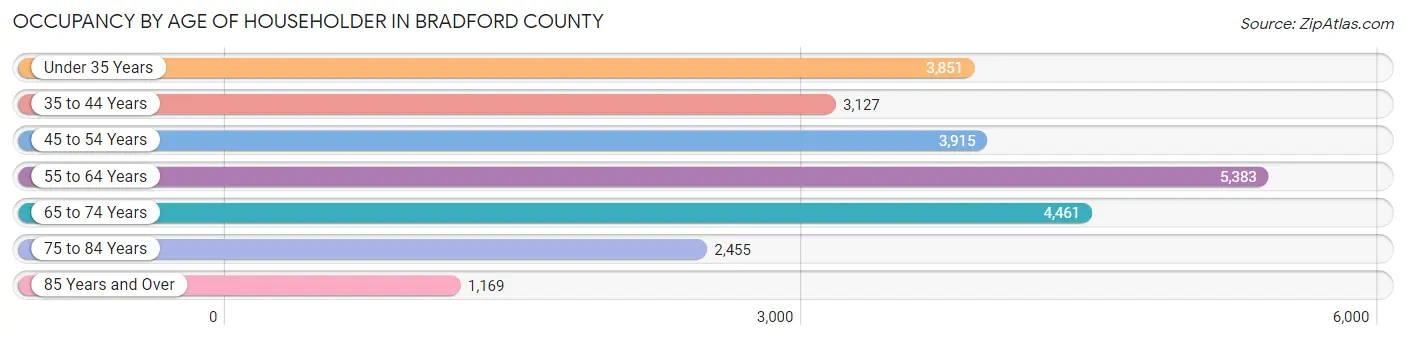
| Age Bracket | # Households | % Households |
| Under 35 Years | 3,851 | 15.8% |
| 35 to 44 Years | 3,127 | 12.8% |
| 45 to 54 Years | 3,915 | 16.1% |
| 55 to 64 Years | 5,383 | 22.1% |
| 65 to 74 Years | 4,461 | 18.3% |
| 75 to 84 Years | 2,455 | 10.1% |
| 85 Years and Over | 1,169 | 4.8% |
| Total | 24,361 | 100.0% |
Housing Finances in Bradford County
Median Income by Occupancy in Bradford County
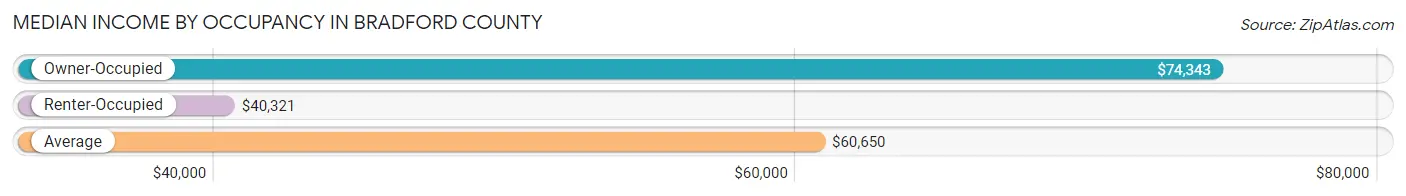
| Occupancy Type | # Households | Median Income |
| Owner-Occupied | 17,648 (72.4%) | $74,343 |
| Renter-Occupied | 6,713 (27.6%) | $40,321 |
| Average | 24,361 (100.0%) | $60,650 |
Occupancy by Householder Income Bracket in Bradford County
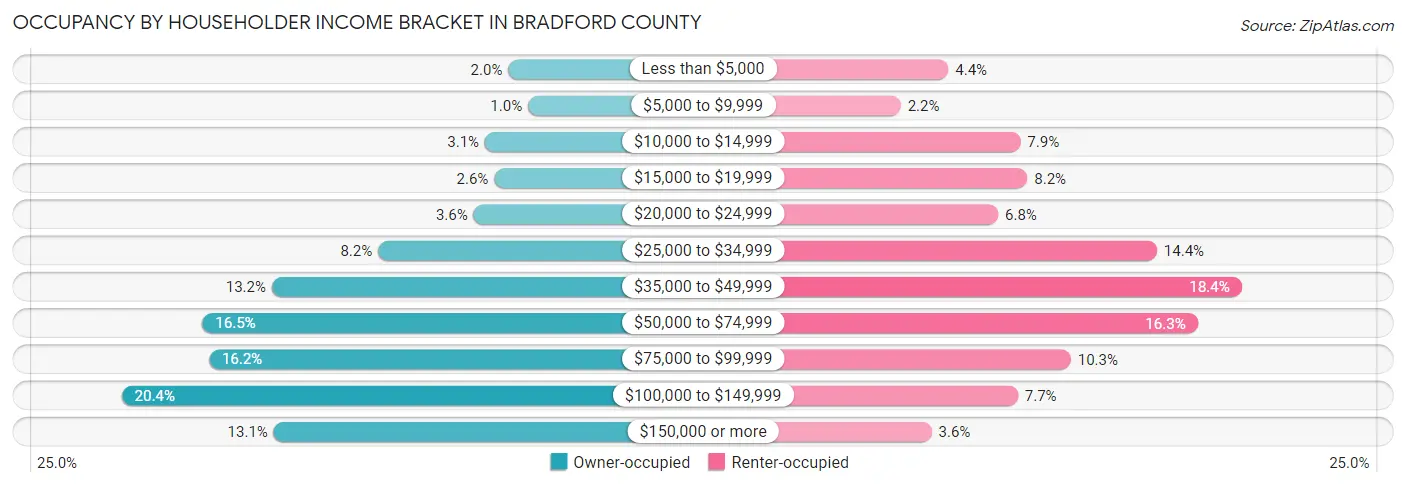
| Income Bracket | Owner-occupied | Renter-occupied |
| Less than $5,000 | 348 (2.0%) | 297 (4.4%) |
| $5,000 to $9,999 | 182 (1.0%) | 144 (2.1%) |
| $10,000 to $14,999 | 543 (3.1%) | 527 (7.9%) |
| $15,000 to $19,999 | 466 (2.6%) | 549 (8.2%) |
| $20,000 to $24,999 | 639 (3.6%) | 456 (6.8%) |
| $25,000 to $34,999 | 1,441 (8.2%) | 963 (14.3%) |
| $35,000 to $49,999 | 2,334 (13.2%) | 1,234 (18.4%) |
| $50,000 to $74,999 | 2,917 (16.5%) | 1,093 (16.3%) |
| $75,000 to $99,999 | 2,862 (16.2%) | 688 (10.2%) |
| $100,000 to $149,999 | 3,597 (20.4%) | 519 (7.7%) |
| $150,000 or more | 2,319 (13.1%) | 243 (3.6%) |
| Total | 17,648 (100.0%) | 6,713 (100.0%) |
Monthly Housing Cost Tiers in Bradford County
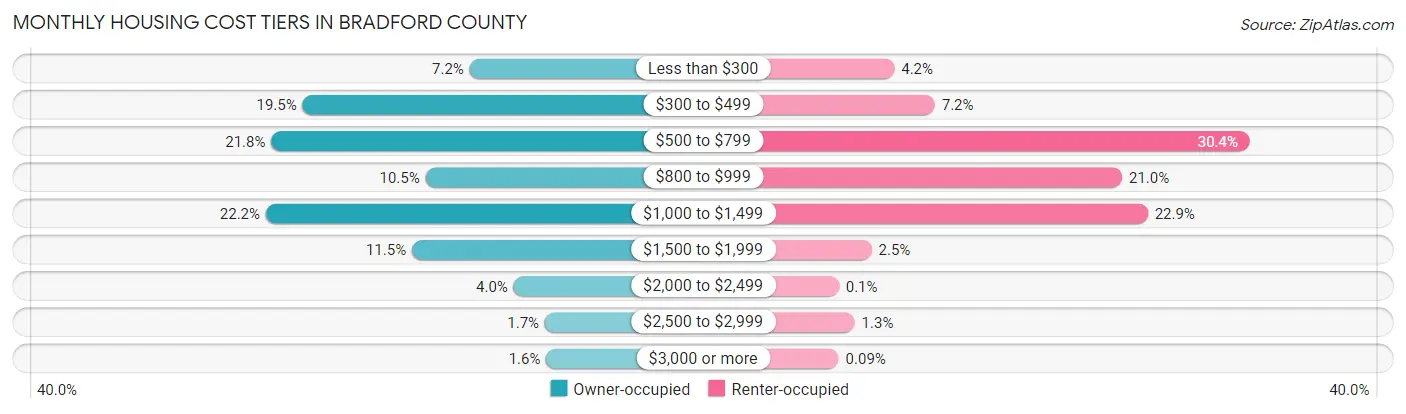
| Monthly Cost | Owner-occupied | Renter-occupied |
| Less than $300 | 1,274 (7.2%) | 281 (4.2%) |
| $300 to $499 | 3,447 (19.5%) | 481 (7.2%) |
| $500 to $799 | 3,853 (21.8%) | 2,039 (30.4%) |
| $800 to $999 | 1,847 (10.5%) | 1,407 (21.0%) |
| $1,000 to $1,499 | 3,923 (22.2%) | 1,534 (22.9%) |
| $1,500 to $1,999 | 2,025 (11.5%) | 169 (2.5%) |
| $2,000 to $2,499 | 703 (4.0%) | 7 (0.1%) |
| $2,500 to $2,999 | 297 (1.7%) | 85 (1.3%) |
| $3,000 or more | 279 (1.6%) | 6 (0.1%) |
| Total | 17,648 (100.0%) | 6,713 (100.0%) |
Physical Housing Characteristics in Bradford County
Housing Structures in Bradford County
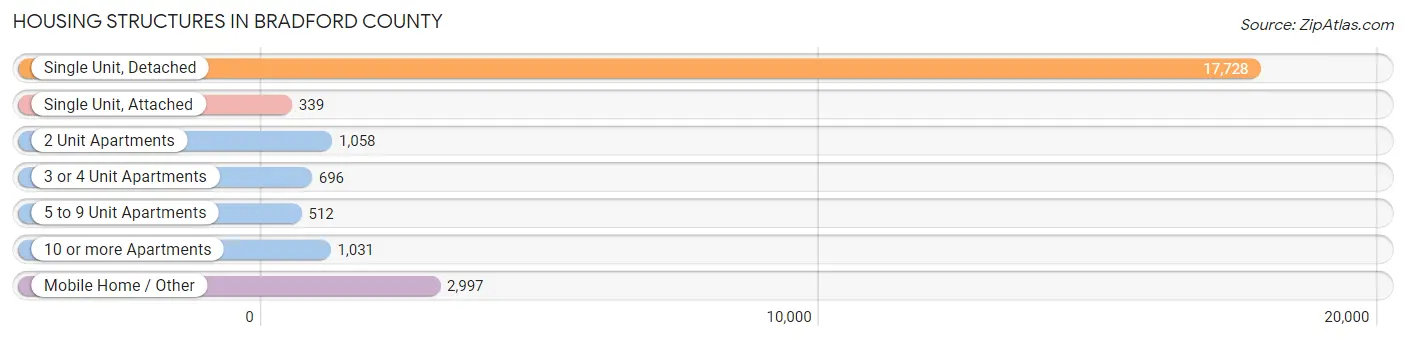
| Structure Type | # Housing Units | % Housing Units |
| Single Unit, Detached | 17,728 | 72.8% |
| Single Unit, Attached | 339 | 1.4% |
| 2 Unit Apartments | 1,058 | 4.3% |
| 3 or 4 Unit Apartments | 696 | 2.9% |
| 5 to 9 Unit Apartments | 512 | 2.1% |
| 10 or more Apartments | 1,031 | 4.2% |
| Mobile Home / Other | 2,997 | 12.3% |
| Total | 24,361 | 100.0% |
Housing Structures by Occupancy in Bradford County
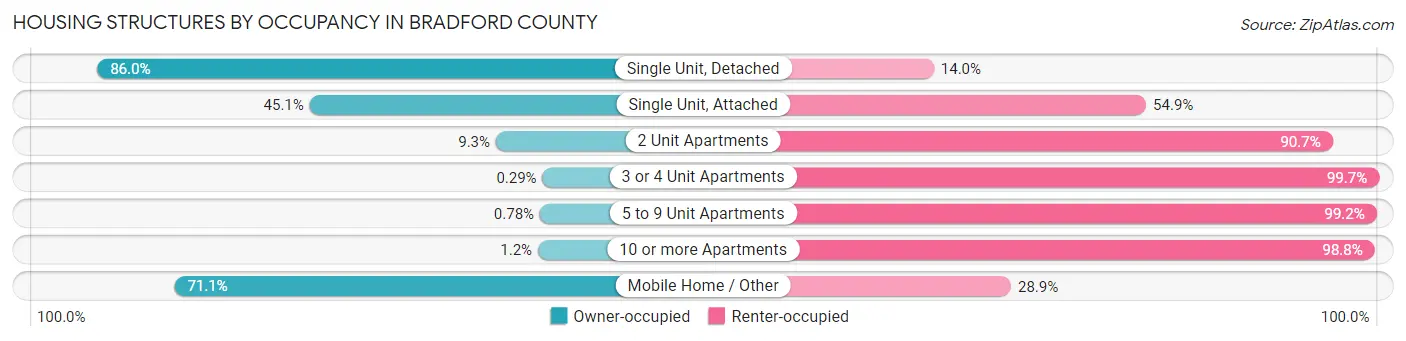
| Structure Type | Owner-occupied | Renter-occupied |
| Single Unit, Detached | 15,247 (86.0%) | 2,481 (14.0%) |
| Single Unit, Attached | 153 (45.1%) | 186 (54.9%) |
| 2 Unit Apartments | 98 (9.3%) | 960 (90.7%) |
| 3 or 4 Unit Apartments | 2 (0.3%) | 694 (99.7%) |
| 5 to 9 Unit Apartments | 4 (0.8%) | 508 (99.2%) |
| 10 or more Apartments | 12 (1.2%) | 1,019 (98.8%) |
| Mobile Home / Other | 2,132 (71.1%) | 865 (28.9%) |
| Total | 17,648 (72.4%) | 6,713 (27.6%) |
Housing Structures by Number of Rooms in Bradford County
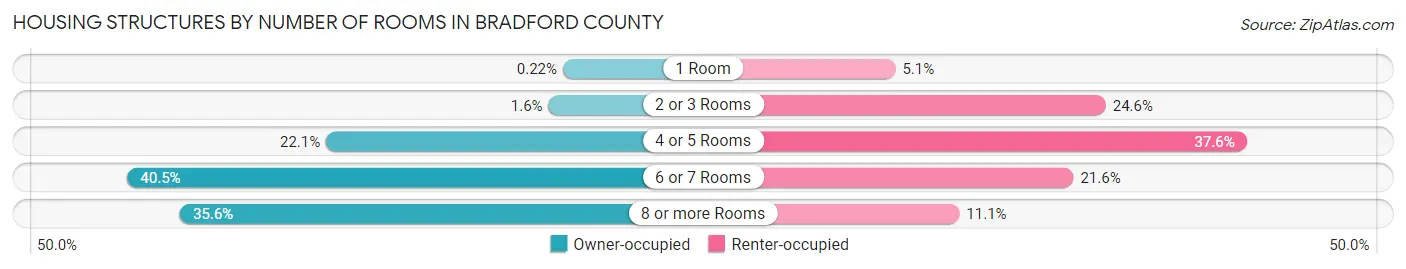
| Number of Rooms | Owner-occupied | Renter-occupied |
| 1 Room | 39 (0.2%) | 345 (5.1%) |
| 2 or 3 Rooms | 273 (1.5%) | 1,651 (24.6%) |
| 4 or 5 Rooms | 3,903 (22.1%) | 2,525 (37.6%) |
| 6 or 7 Rooms | 7,145 (40.5%) | 1,450 (21.6%) |
| 8 or more Rooms | 6,288 (35.6%) | 742 (11.1%) |
| Total | 17,648 (100.0%) | 6,713 (100.0%) |
Housing Structure by Heating Type in Bradford County
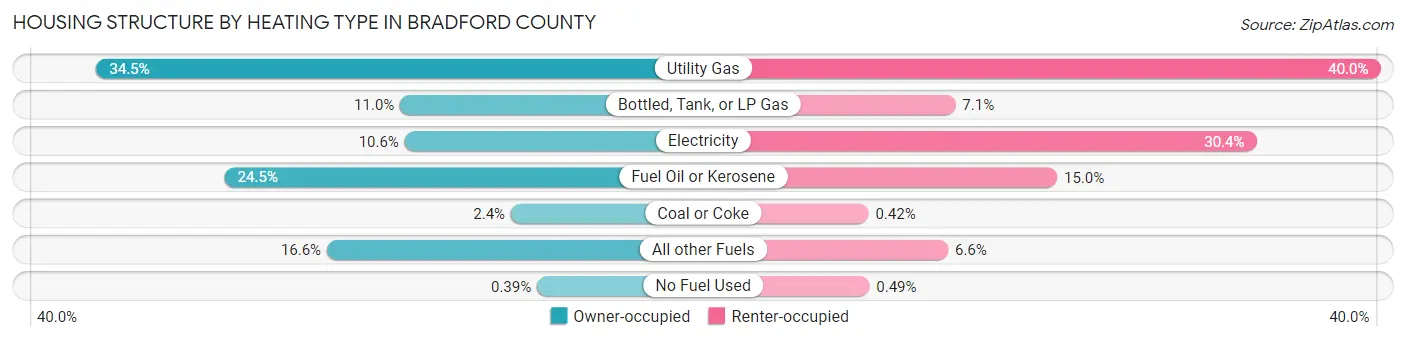
| Heating Type | Owner-occupied | Renter-occupied |
| Utility Gas | 6,079 (34.4%) | 2,684 (40.0%) |
| Bottled, Tank, or LP Gas | 1,936 (11.0%) | 479 (7.1%) |
| Electricity | 1,874 (10.6%) | 2,041 (30.4%) |
| Fuel Oil or Kerosene | 4,330 (24.5%) | 1,007 (15.0%) |
| Coal or Coke | 426 (2.4%) | 28 (0.4%) |
| All other Fuels | 2,935 (16.6%) | 441 (6.6%) |
| No Fuel Used | 68 (0.4%) | 33 (0.5%) |
| Total | 17,648 (100.0%) | 6,713 (100.0%) |
Household Vehicle Usage in Bradford County
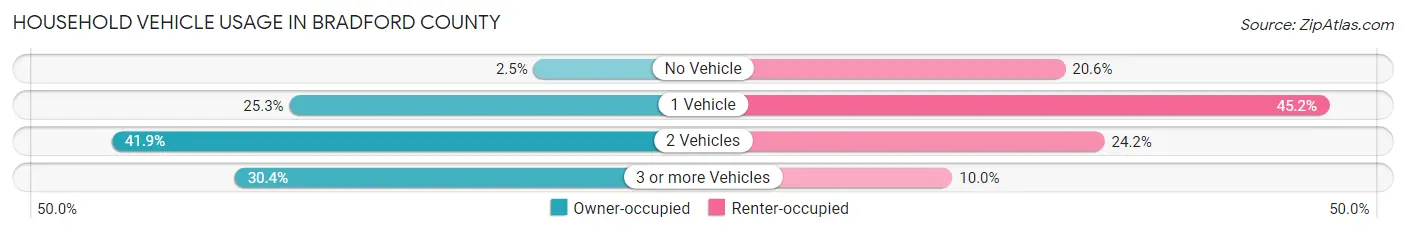
| Vehicles per Household | Owner-occupied | Renter-occupied |
| No Vehicle | 439 (2.5%) | 1,381 (20.6%) |
| 1 Vehicle | 4,462 (25.3%) | 3,032 (45.2%) |
| 2 Vehicles | 7,386 (41.8%) | 1,627 (24.2%) |
| 3 or more Vehicles | 5,361 (30.4%) | 673 (10.0%) |
| Total | 17,648 (100.0%) | 6,713 (100.0%) |
Real Estate & Mortgages in Bradford County
Real Estate and Mortgage Overview in Bradford County
| Characteristic | Without Mortgage | With Mortgage |
| Housing Units | 9,172 | 8,476 |
| Median Property Value | $160,000 | $179,900 |
| Median Household Income | $55,562 | $1,561 |
| Monthly Housing Costs | $497 | $273 |
| Real Estate Taxes | $1,808 | $139 |
Property Value by Mortgage Status in Bradford County
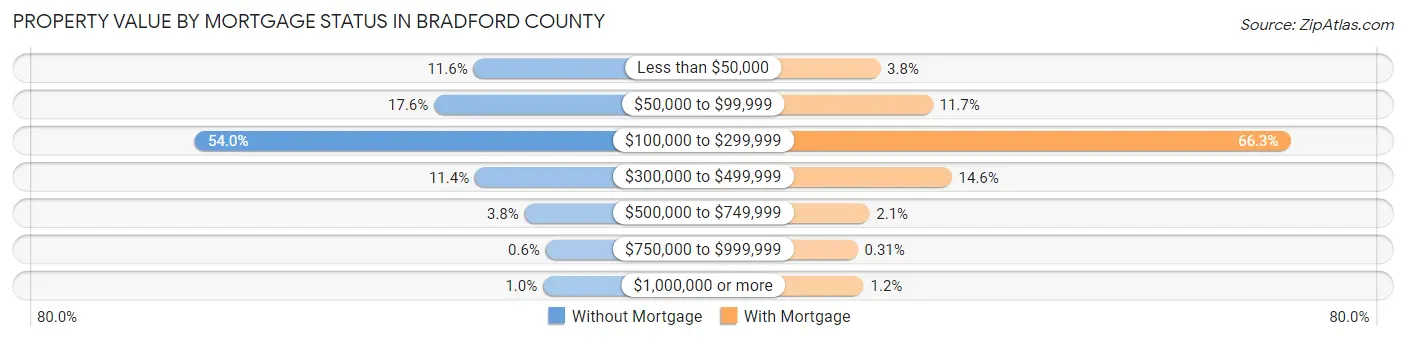
| Property Value | Without Mortgage | With Mortgage |
| Less than $50,000 | 1,064 (11.6%) | 318 (3.7%) |
| $50,000 to $99,999 | 1,614 (17.6%) | 994 (11.7%) |
| $100,000 to $299,999 | 4,955 (54.0%) | 5,615 (66.2%) |
| $300,000 to $499,999 | 1,043 (11.4%) | 1,241 (14.6%) |
| $500,000 to $749,999 | 349 (3.8%) | 178 (2.1%) |
| $750,000 to $999,999 | 55 (0.6%) | 26 (0.3%) |
| $1,000,000 or more | 92 (1.0%) | 104 (1.2%) |
| Total | 9,172 (100.0%) | 8,476 (100.0%) |
Household Income by Mortgage Status in Bradford County
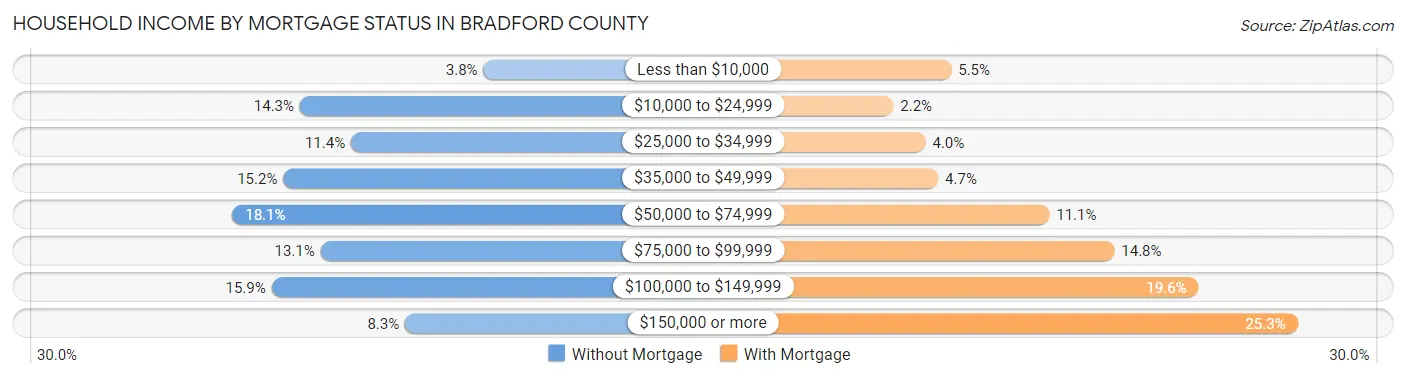
| Household Income | Without Mortgage | With Mortgage |
| Less than $10,000 | 347 (3.8%) | 464 (5.5%) |
| $10,000 to $24,999 | 1,309 (14.3%) | 183 (2.2%) |
| $25,000 to $34,999 | 1,041 (11.4%) | 339 (4.0%) |
| $35,000 to $49,999 | 1,396 (15.2%) | 400 (4.7%) |
| $50,000 to $74,999 | 1,663 (18.1%) | 938 (11.1%) |
| $75,000 to $99,999 | 1,201 (13.1%) | 1,254 (14.8%) |
| $100,000 to $149,999 | 1,457 (15.9%) | 1,661 (19.6%) |
| $150,000 or more | 758 (8.3%) | 2,140 (25.3%) |
| Total | 9,172 (100.0%) | 8,476 (100.0%) |
Property Value to Household Income Ratio in Bradford County
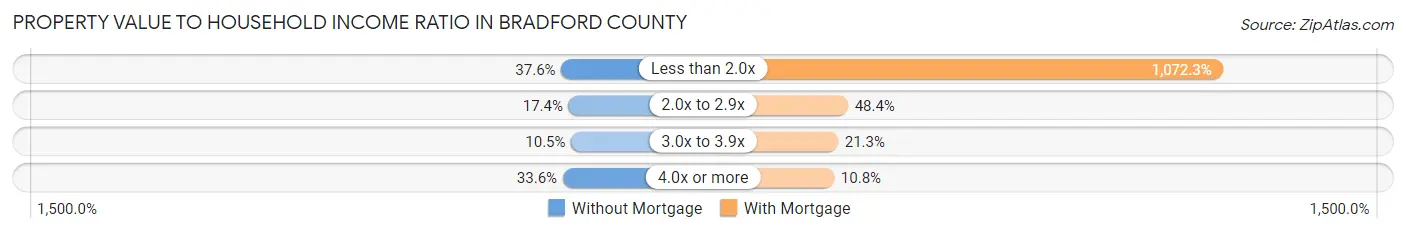
| Value-to-Income Ratio | Without Mortgage | With Mortgage |
| Less than 2.0x | 3,451 (37.6%) | 90,891 (1,072.3%) |
| 2.0x to 2.9x | 1,600 (17.4%) | 4,102 (48.4%) |
| 3.0x to 3.9x | 964 (10.5%) | 1,809 (21.3%) |
| 4.0x or more | 3,080 (33.6%) | 916 (10.8%) |
| Total | 9,172 (100.0%) | 8,476 (100.0%) |
Real Estate Taxes by Mortgage Status in Bradford County
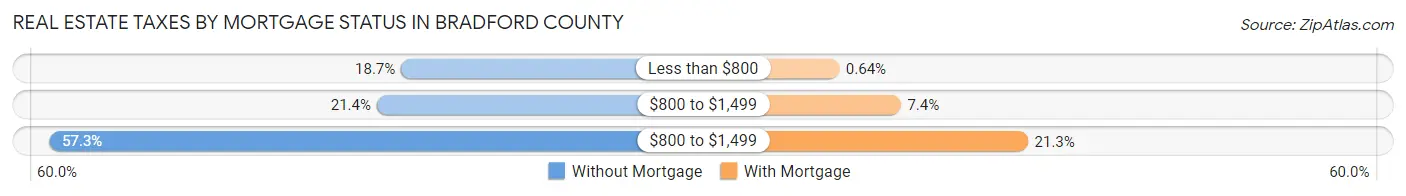
| Property Taxes | Without Mortgage | With Mortgage |
| Less than $800 | 1,719 (18.7%) | 54 (0.6%) |
| $800 to $1,499 | 1,963 (21.4%) | 626 (7.4%) |
| $800 to $1,499 | 5,258 (57.3%) | 1,807 (21.3%) |
| Total | 9,172 (100.0%) | 8,476 (100.0%) |
Health & Disability in Bradford County
Health Insurance Coverage by Age in Bradford County
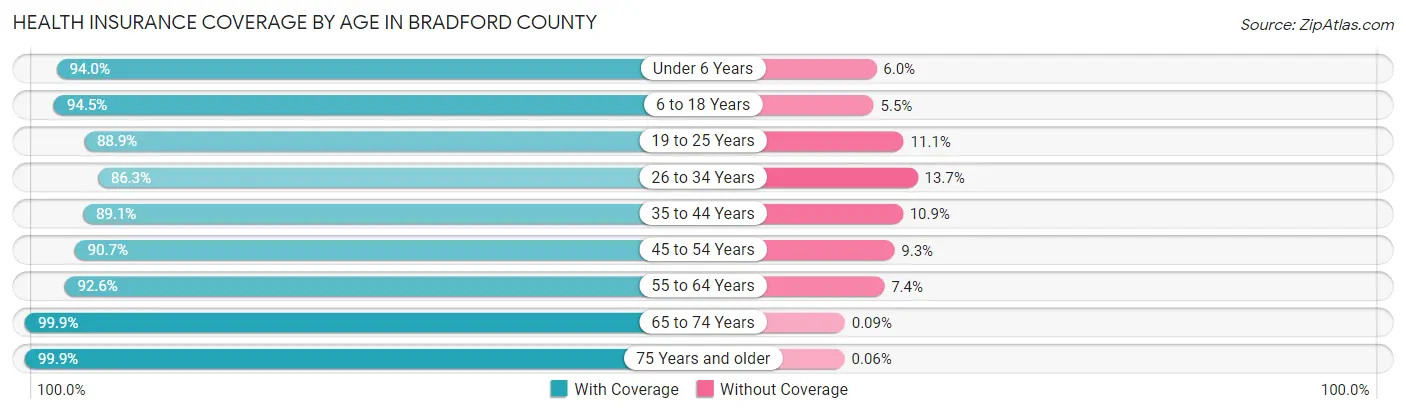
| Age Bracket | With Coverage | Without Coverage |
| Under 6 Years | 3,901 (94.0%) | 248 (6.0%) |
| 6 to 18 Years | 9,117 (94.5%) | 528 (5.5%) |
| 19 to 25 Years | 3,887 (88.9%) | 484 (11.1%) |
| 26 to 34 Years | 5,235 (86.3%) | 828 (13.7%) |
| 35 to 44 Years | 5,541 (89.1%) | 677 (10.9%) |
| 45 to 54 Years | 6,523 (90.7%) | 672 (9.3%) |
| 55 to 64 Years | 8,529 (92.6%) | 686 (7.4%) |
| 65 to 74 Years | 7,390 (99.9%) | 7 (0.1%) |
| 75 Years and older | 5,372 (99.9%) | 3 (0.1%) |
| Total | 55,495 (93.1%) | 4,133 (6.9%) |
Health Insurance Coverage by Citizenship Status in Bradford County
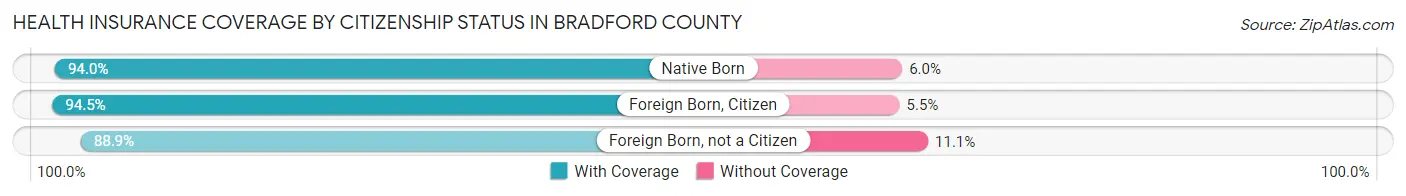
| Citizenship Status | With Coverage | Without Coverage |
| Native Born | 3,901 (94.0%) | 248 (6.0%) |
| Foreign Born, Citizen | 9,117 (94.5%) | 528 (5.5%) |
| Foreign Born, not a Citizen | 3,887 (88.9%) | 484 (11.1%) |
Health Insurance Coverage by Household Income in Bradford County
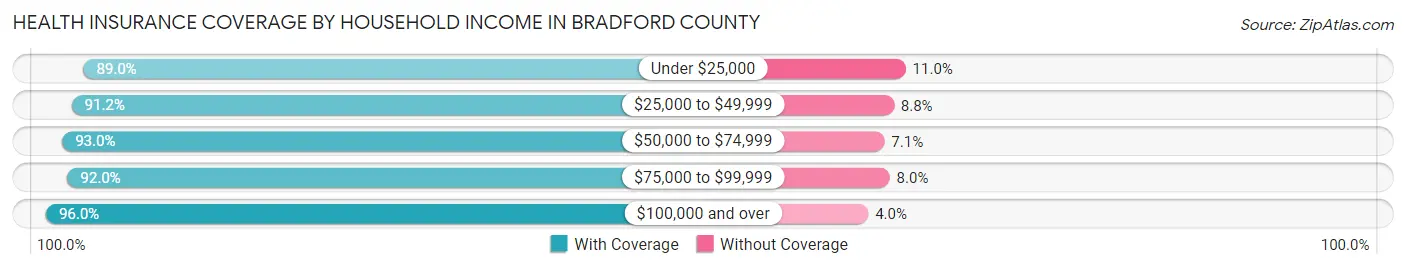
| Household Income | With Coverage | Without Coverage |
| Under $25,000 | 5,955 (89.0%) | 738 (11.0%) |
| $25,000 to $49,999 | 11,444 (91.2%) | 1,105 (8.8%) |
| $50,000 to $74,999 | 9,462 (92.9%) | 718 (7.0%) |
| $75,000 to $99,999 | 8,413 (92.0%) | 735 (8.0%) |
| $100,000 and over | 20,020 (96.0%) | 837 (4.0%) |
Public vs Private Health Insurance Coverage by Age in Bradford County
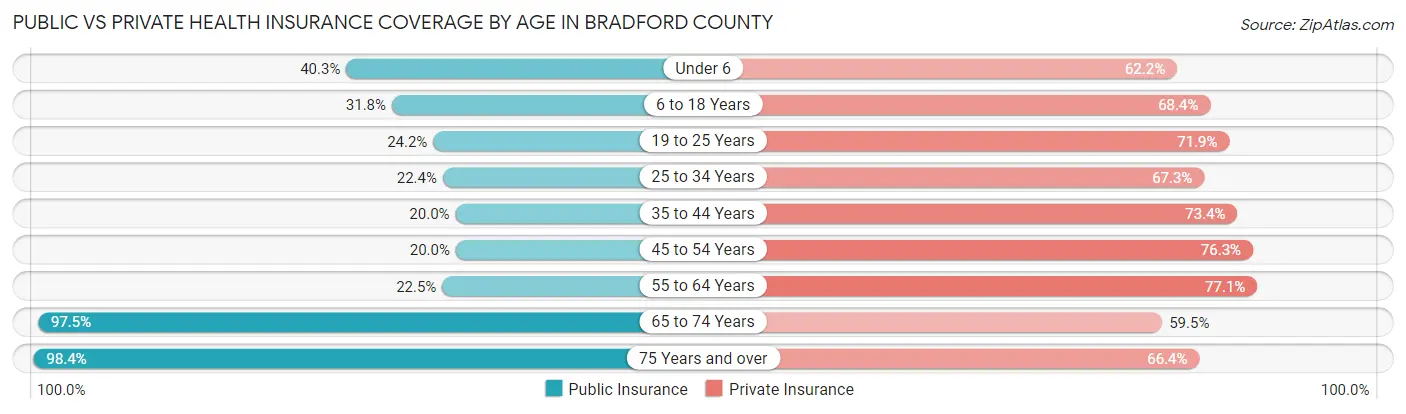
| Age Bracket | Public Insurance | Private Insurance |
| Under 6 | 1,672 (40.3%) | 2,581 (62.2%) |
| 6 to 18 Years | 3,070 (31.8%) | 6,595 (68.4%) |
| 19 to 25 Years | 1,056 (24.2%) | 3,144 (71.9%) |
| 25 to 34 Years | 1,357 (22.4%) | 4,078 (67.3%) |
| 35 to 44 Years | 1,246 (20.0%) | 4,565 (73.4%) |
| 45 to 54 Years | 1,437 (20.0%) | 5,490 (76.3%) |
| 55 to 64 Years | 2,072 (22.5%) | 7,104 (77.1%) |
| 65 to 74 Years | 7,215 (97.5%) | 4,400 (59.5%) |
| 75 Years and over | 5,287 (98.4%) | 3,567 (66.4%) |
| Total | 24,412 (40.9%) | 41,524 (69.6%) |
Disability Status by Sex by Age in Bradford County
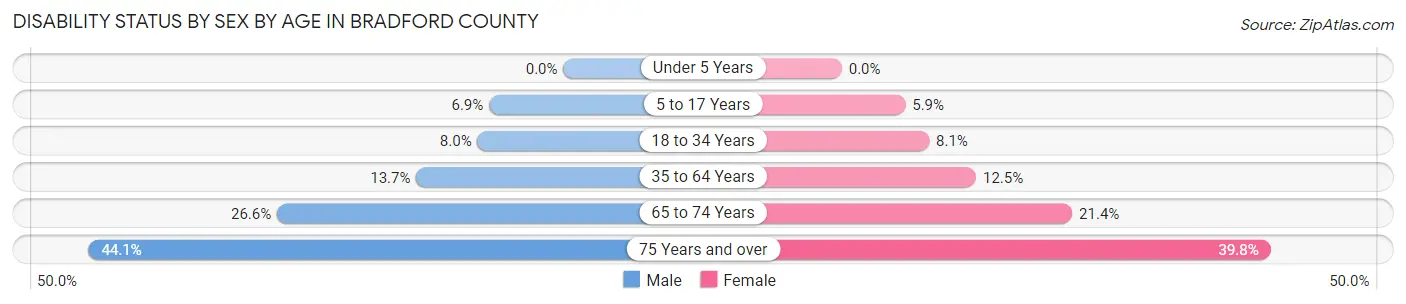
| Age Bracket | Male | Female |
| Under 5 Years | 0 (0.0%) | 0 (0.0%) |
| 5 to 17 Years | 346 (6.9%) | 281 (5.9%) |
| 18 to 34 Years | 447 (8.0%) | 439 (8.1%) |
| 35 to 64 Years | 1,557 (13.7%) | 1,398 (12.5%) |
| 65 to 74 Years | 966 (26.6%) | 804 (21.4%) |
| 75 Years and over | 1,085 (44.1%) | 1,159 (39.8%) |
Disability Class by Sex by Age in Bradford County
Disability Class: Hearing Difficulty
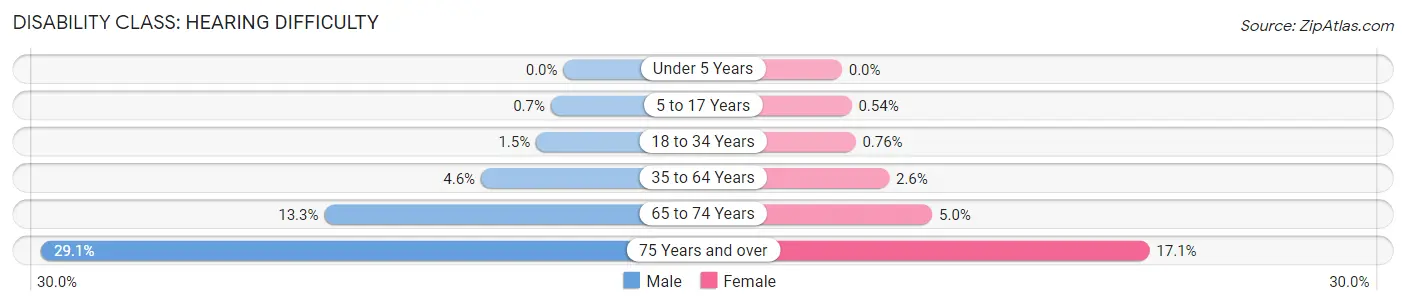
| Age Bracket | Male | Female |
| Under 5 Years | 0 (0.0%) | 0 (0.0%) |
| 5 to 17 Years | 35 (0.7%) | 26 (0.5%) |
| 18 to 34 Years | 85 (1.5%) | 41 (0.8%) |
| 35 to 64 Years | 524 (4.6%) | 295 (2.6%) |
| 65 to 74 Years | 484 (13.3%) | 189 (5.0%) |
| 75 Years and over | 716 (29.1%) | 499 (17.1%) |
Disability Class: Vision Difficulty
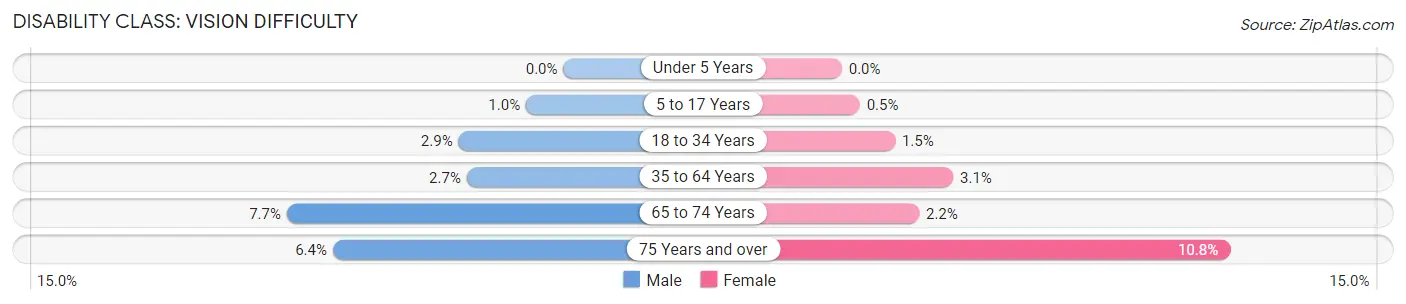
| Age Bracket | Male | Female |
| Under 5 Years | 0 (0.0%) | 0 (0.0%) |
| 5 to 17 Years | 52 (1.0%) | 24 (0.5%) |
| 18 to 34 Years | 164 (2.9%) | 80 (1.5%) |
| 35 to 64 Years | 307 (2.7%) | 348 (3.1%) |
| 65 to 74 Years | 280 (7.7%) | 81 (2.1%) |
| 75 Years and over | 158 (6.4%) | 315 (10.8%) |
Disability Class: Cognitive Difficulty
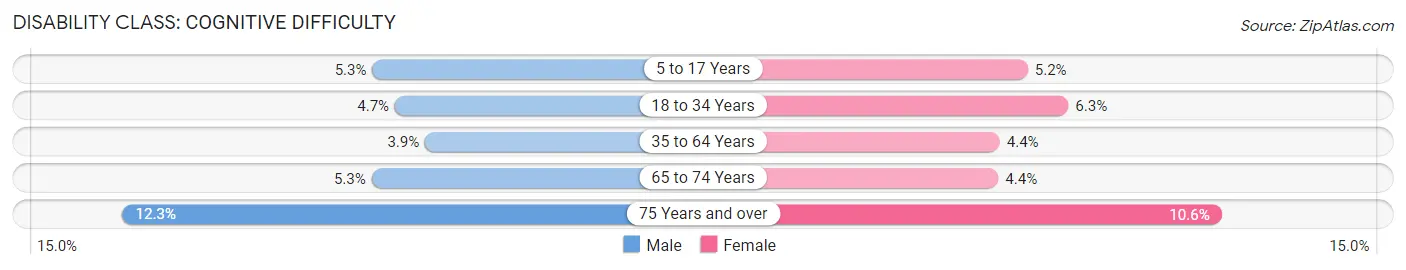
| Age Bracket | Male | Female |
| 5 to 17 Years | 267 (5.3%) | 247 (5.2%) |
| 18 to 34 Years | 263 (4.7%) | 342 (6.3%) |
| 35 to 64 Years | 439 (3.8%) | 494 (4.4%) |
| 65 to 74 Years | 194 (5.3%) | 164 (4.4%) |
| 75 Years and over | 302 (12.3%) | 308 (10.6%) |
Disability Class: Ambulatory Difficulty
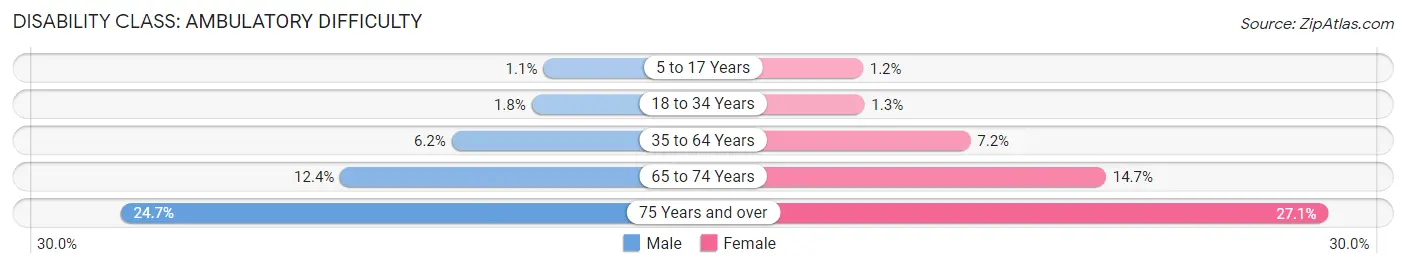
| Age Bracket | Male | Female |
| 5 to 17 Years | 56 (1.1%) | 56 (1.2%) |
| 18 to 34 Years | 99 (1.8%) | 68 (1.3%) |
| 35 to 64 Years | 709 (6.2%) | 803 (7.2%) |
| 65 to 74 Years | 452 (12.4%) | 553 (14.7%) |
| 75 Years and over | 607 (24.6%) | 789 (27.1%) |
Disability Class: Self-Care Difficulty
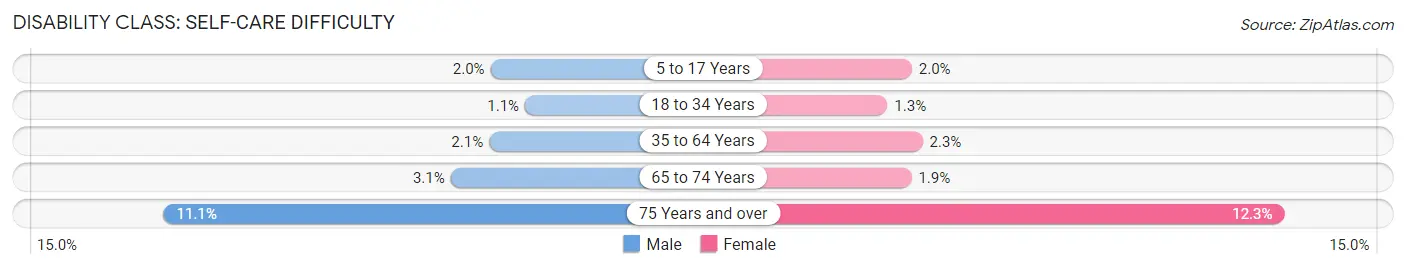
| Age Bracket | Male | Female |
| 5 to 17 Years | 102 (2.0%) | 93 (1.9%) |
| 18 to 34 Years | 60 (1.1%) | 69 (1.3%) |
| 35 to 64 Years | 236 (2.1%) | 253 (2.2%) |
| 65 to 74 Years | 114 (3.1%) | 73 (1.9%) |
| 75 Years and over | 274 (11.1%) | 359 (12.3%) |
Technology Access in Bradford County
Computing Device Access in Bradford County
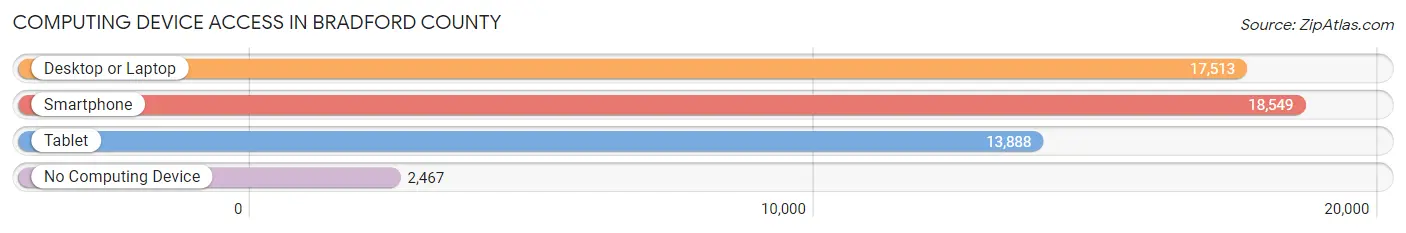
| Device Type | # Households | % Households |
| Desktop or Laptop | 17,513 | 71.9% |
| Smartphone | 18,549 | 76.1% |
| Tablet | 13,888 | 57.0% |
| No Computing Device | 2,467 | 10.1% |
| Total | 24,361 | 100.0% |
Internet Access in Bradford County
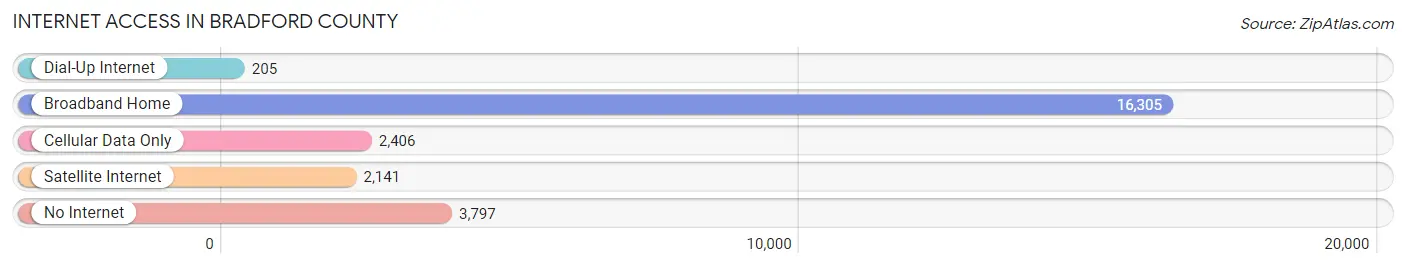
| Internet Type | # Households | % Households |
| Dial-Up Internet | 205 | 0.8% |
| Broadband Home | 16,305 | 66.9% |
| Cellular Data Only | 2,406 | 9.9% |
| Satellite Internet | 2,141 | 8.8% |
| No Internet | 3,797 | 15.6% |
| Total | 24,361 | 100.0% |
Bradford County Summary
Bradford County is located in the northern tier of Pennsylvania, and is part of the Endless Mountains region. It is bordered by Susquehanna County to the north, Wyoming County to the east, Sullivan County to the south, and Lycoming County to the west. The county seat is Towanda, and the county has a total area of 895 square miles.
History
Bradford County was formed in 1810 from parts of Luzerne County. It was named after William Bradford, who was the first attorney general of Pennsylvania. The county was originally part of the Connecticut Western Reserve, and was settled by pioneers from New England. The first settlers arrived in the area in the late 1700s, and the county was officially established in 1810.
The county was an important part of the lumber industry in the 19th century, and the lumber industry was a major source of income for the county. The county was also an important part of the oil industry in the late 19th and early 20th centuries. The first oil well in the county was drilled in 1871, and the county was home to several major oil companies.
Geography
Bradford County is located in the northern tier of Pennsylvania, and is part of the Endless Mountains region. The county is mostly mountainous, with the highest point being Mount Pisgah at 2,092 feet. The county is drained by the Susquehanna River and its tributaries, including the Towanda Creek, Wyalusing Creek, and Tunkhannock Creek. The county is home to several state parks, including Ricketts Glen State Park, Worlds End State Park, and Loyalsock State Forest.
Economy
The economy of Bradford County is largely based on agriculture and natural resources. The county is home to several dairy farms, as well as beef and poultry farms. The county is also home to several timber companies, and the lumber industry is an important part of the economy. The county is also home to several oil and gas companies, and the oil and gas industry is an important part of the economy.
Demographics
As of the 2010 census, the population of Bradford County was 62,622. The population is mostly white (96.2%), with small percentages of African American (1.2%), Native American (0.4%), Asian (0.3%), and other races (1.9%). The median household income in the county is $45,845, and the median family income is $54,845. The county has a poverty rate of 13.3%.
Conclusion
Bradford County is a rural county located in the northern tier of Pennsylvania. It is part of the Endless Mountains region, and is home to several state parks and forests. The economy of the county is largely based on agriculture and natural resources, and the county is home to several dairy farms, timber companies, and oil and gas companies. The population of the county is mostly white, and the median household income is $45,845.
Common Questions
What is Per Capita Income in Bradford County?
Per Capita income in Bradford County is $32,440.
What is the Median Family Income in Bradford County?
Median Family Income in Bradford County is $76,250.
What is the Median Household income in Bradford County?
Median Household Income in Bradford County is $60,650.
What is Income or Wage Gap in Bradford County?
Income or Wage Gap in Bradford County is 37.4%.
Women in Bradford County earn 62.6 cents for every dollar earned by a man.
What is Family Income Deficit in Bradford County?
Family Income Deficit in Bradford County is $10,819.
Families that are below poverty line in Bradford County earn $10,819 less on average than the poverty threshold level.
What is Inequality or Gini Index in Bradford County?
Inequality or Gini Index in Bradford County is 0.42.
What is the Total Population of Bradford County?
Total Population of Bradford County is 60,159.
What is the Total Male Population of Bradford County?
Total Male Population of Bradford County is 30,156.
What is the Total Female Population of Bradford County?
Total Female Population of Bradford County is 30,003.
What is the Ratio of Males per 100 Females in Bradford County?
There are 100.51 Males per 100 Females in Bradford County.
What is the Ratio of Females per 100 Males in Bradford County?
There are 99.49 Females per 100 Males in Bradford County.
What is the Median Population Age in Bradford County?
Median Population Age in Bradford County is 43.9 Years.
What is the Average Family Size in Bradford County
Average Family Size in Bradford County is 3.0 People.
What is the Average Household Size in Bradford County
Average Household Size in Bradford County is 2.4 People.
How Large is the Labor Force in Bradford County?
There are 27,277 People in the Labor Forcein in Bradford County.
What is the Percentage of People in the Labor Force in Bradford County?
56.0% of People are in the Labor Force in Bradford County.
What is the Unemployment Rate in Bradford County?
Unemployment Rate in Bradford County is 4.8%.