Blair County, PA Map & Demographics
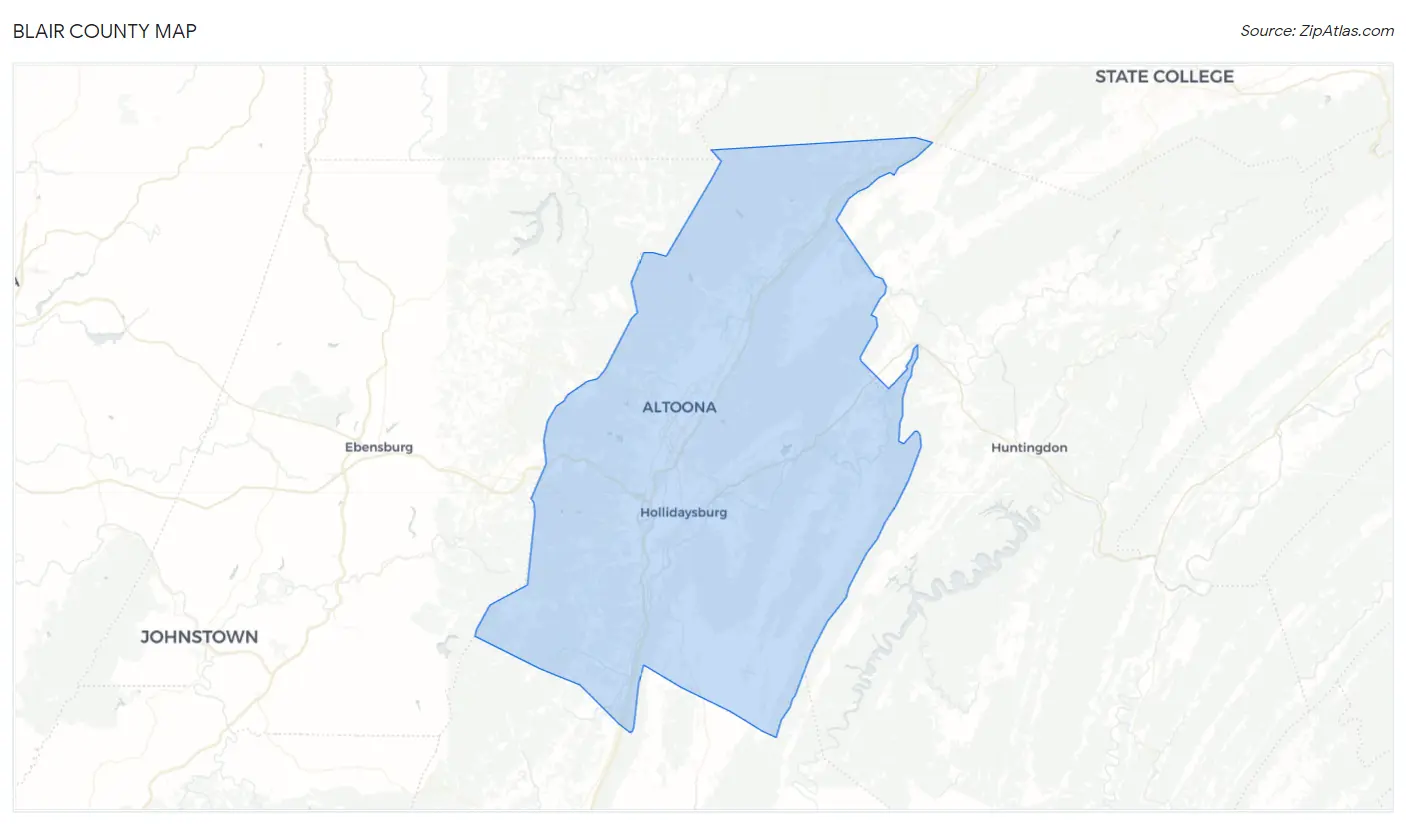
Blair County Map
Blair County Overview
$33,585
PER CAPITA INCOME
$80,754
AVG FAMILY INCOME
$59,386
AVG HOUSEHOLD INCOME
25.1%
WAGE / INCOME GAP [ % ]
74.9¢/ $1
WAGE / INCOME GAP [ $ ]
$9,990
FAMILY INCOME DEFICIT
0.45
INEQUALITY / GINI INDEX
122,640
TOTAL POPULATION
60,452
MALE POPULATION
62,188
FEMALE POPULATION
97.21
MALES / 100 FEMALES
102.87
FEMALES / 100 MALES
42.9
MEDIAN AGE
3.0
AVG FAMILY SIZE
2.4
AVG HOUSEHOLD SIZE
60,099
LABOR FORCE [ PEOPLE ]
59.5%
PERCENT IN LABOR FORCE
4.2%
UNEMPLOYMENT RATE
Blair County Area Codes
Income in Blair County
Income Overview in Blair County
Per Capita Income in Blair County is $33,585, while median incomes of families and households are $80,754 and $59,386 respectively.
| Characteristic | Number | Measure |
| Per Capita Income | 122,640 | $33,585 |
| Median Family Income | 31,567 | $80,754 |
| Mean Family Income | 31,567 | $96,935 |
| Median Household Income | 50,587 | $59,386 |
| Mean Household Income | 50,587 | $79,100 |
| Income Deficit | 31,567 | $9,990 |
| Wage / Income Gap (%) | 122,640 | 25.09% |
| Wage / Income Gap ($) | 122,640 | 74.91¢ per $1 |
| Gini / Inequality Index | 122,640 | 0.45 |
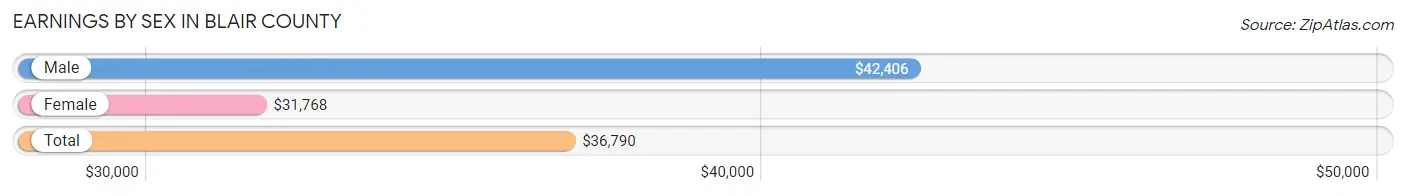
Earnings by Sex in Blair County
Average Earnings in Blair County are $36,790, $42,406 for men and $31,768 for women, a difference of 25.1%.
| Sex | Number | Average Earnings |
| Male | 33,089 (52.5%) | $42,406 |
| Female | 29,975 (47.5%) | $31,768 |
| Total | 63,064 (100.0%) | $36,790 |
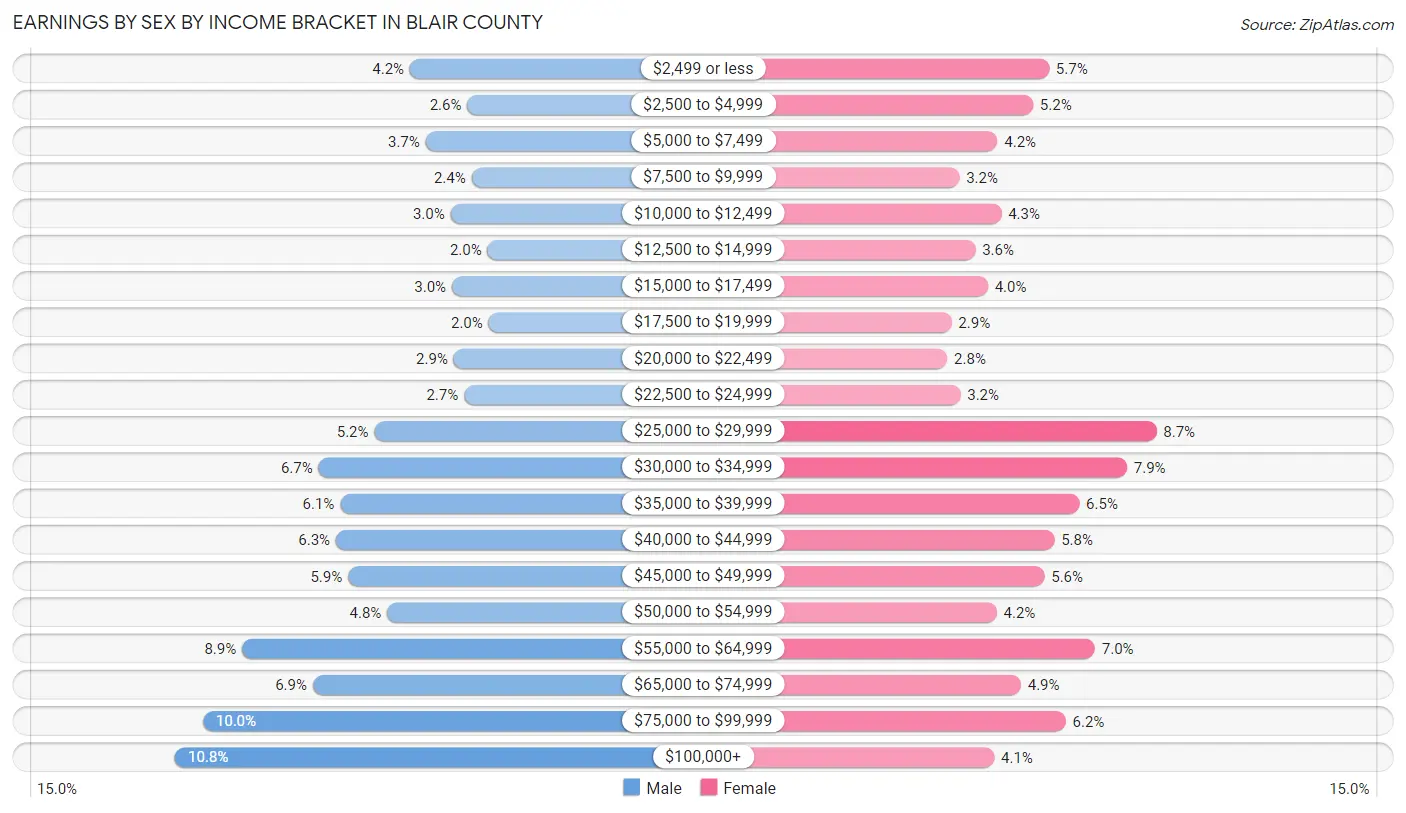
Earnings by Sex by Income Bracket in Blair County
The most common earnings brackets in Blair County are $100,000+ for men (3,564 | 10.8%) and $25,000 to $29,999 for women (2,609 | 8.7%).
| Income | Male | Female |
| $2,499 or less | 1,379 (4.2%) | 1,703 (5.7%) |
| $2,500 to $4,999 | 847 (2.6%) | 1,568 (5.2%) |
| $5,000 to $7,499 | 1,233 (3.7%) | 1,268 (4.2%) |
| $7,500 to $9,999 | 807 (2.4%) | 948 (3.2%) |
| $10,000 to $12,499 | 1,001 (3.0%) | 1,301 (4.3%) |
| $12,500 to $14,999 | 660 (2.0%) | 1,081 (3.6%) |
| $15,000 to $17,499 | 988 (3.0%) | 1,186 (4.0%) |
| $17,500 to $19,999 | 647 (2.0%) | 882 (2.9%) |
| $20,000 to $22,499 | 972 (2.9%) | 844 (2.8%) |
| $22,500 to $24,999 | 876 (2.6%) | 956 (3.2%) |
| $25,000 to $29,999 | 1,711 (5.2%) | 2,609 (8.7%) |
| $30,000 to $34,999 | 2,230 (6.7%) | 2,359 (7.9%) |
| $35,000 to $39,999 | 2,029 (6.1%) | 1,956 (6.5%) |
| $40,000 to $44,999 | 2,068 (6.2%) | 1,748 (5.8%) |
| $45,000 to $49,999 | 1,955 (5.9%) | 1,664 (5.6%) |
| $50,000 to $54,999 | 1,592 (4.8%) | 1,261 (4.2%) |
| $55,000 to $64,999 | 2,943 (8.9%) | 2,090 (7.0%) |
| $65,000 to $74,999 | 2,282 (6.9%) | 1,467 (4.9%) |
| $75,000 to $99,999 | 3,305 (10.0%) | 1,842 (6.1%) |
| $100,000+ | 3,564 (10.8%) | 1,242 (4.1%) |
| Total | 33,089 (100.0%) | 29,975 (100.0%) |
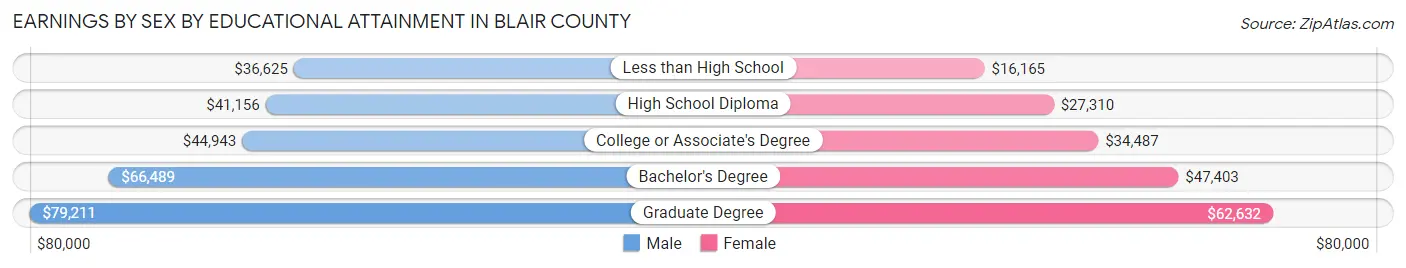
Earnings by Sex by Educational Attainment in Blair County
Average earnings in Blair County are $46,644 for men and $35,028 for women, a difference of 24.9%. Men with an educational attainment of graduate degree enjoy the highest average annual earnings of $79,211, while those with less than high school education earn the least with $36,625. Women with an educational attainment of graduate degree earn the most with the average annual earnings of $62,632, while those with less than high school education have the smallest earnings of $16,165.
| Educational Attainment | Male Income | Female Income |
| Less than High School | $36,625 | $16,165 |
| High School Diploma | $41,156 | $27,310 |
| College or Associate's Degree | $44,943 | $34,487 |
| Bachelor's Degree | $66,489 | $47,403 |
| Graduate Degree | $79,211 | $62,632 |
| Total | $46,644 | $35,028 |
Family Income in Blair County
Family Income Brackets in Blair County
According to the Blair County family income data, there are 6,976 families falling into the $100,000 to $149,999 income range, which is the most common income bracket and makes up 22.1% of all families. Conversely, the $10,000 to $14,999 income bracket is the least frequent group with only 600 families (1.9%) belonging to this category.
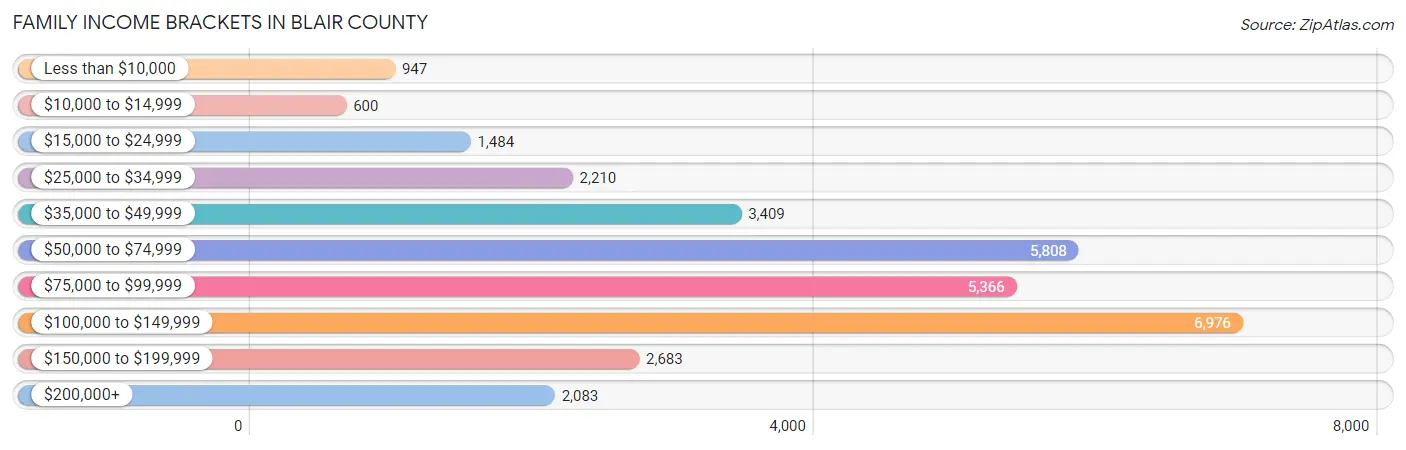
| Income Bracket | # Families | % Families |
| Less than $10,000 | 947 | 3.0% |
| $10,000 to $14,999 | 600 | 1.9% |
| $15,000 to $24,999 | 1,484 | 4.7% |
| $25,000 to $34,999 | 2,210 | 7.0% |
| $35,000 to $49,999 | 3,409 | 10.8% |
| $50,000 to $74,999 | 5,808 | 18.4% |
| $75,000 to $99,999 | 5,366 | 17.0% |
| $100,000 to $149,999 | 6,976 | 22.1% |
| $150,000 to $199,999 | 2,683 | 8.5% |
| $200,000+ | 2,083 | 6.6% |
Family Income by Famaliy Size in Blair County
5-person families (1,879 | 5.9%) account for the highest median family income in Blair County with $113,775 per family, while 2-person families (16,004 | 50.7%) have the highest median income of $34,828 per family member.
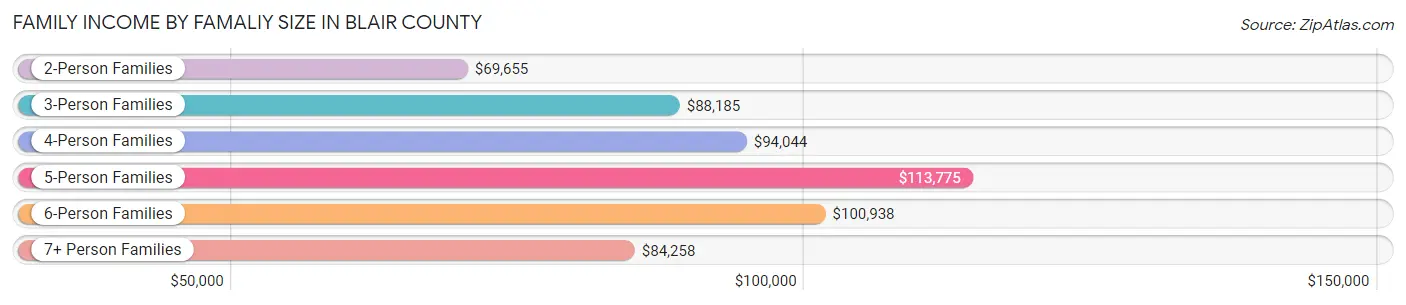
| Income Bracket | # Families | Median Income |
| 2-Person Families | 16,004 (50.7%) | $69,655 |
| 3-Person Families | 7,684 (24.3%) | $88,185 |
| 4-Person Families | 5,027 (15.9%) | $94,044 |
| 5-Person Families | 1,879 (5.9%) | $113,775 |
| 6-Person Families | 504 (1.6%) | $100,938 |
| 7+ Person Families | 469 (1.5%) | $84,258 |
| Total | 31,567 (100.0%) | $80,754 |
Family Income by Number of Earners in Blair County
The median family income in Blair County is $80,754, with families comprising 3+ earners (3,528) having the highest median family income of $131,579, while families with no earners (6,063) have the lowest median family income of $47,783, accounting for 11.2% and 19.2% of families, respectively.
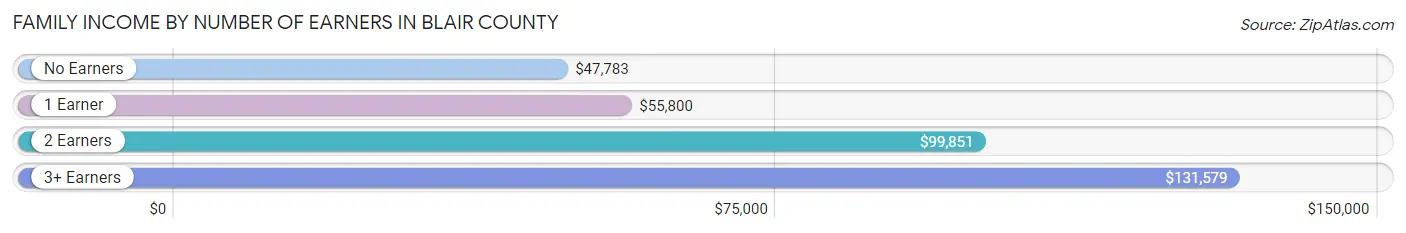
| Number of Earners | # Families | Median Income |
| No Earners | 6,063 (19.2%) | $47,783 |
| 1 Earner | 9,282 (29.4%) | $55,800 |
| 2 Earners | 12,694 (40.2%) | $99,851 |
| 3+ Earners | 3,528 (11.2%) | $131,579 |
| Total | 31,567 (100.0%) | $80,754 |
Household Income in Blair County
Household Income Brackets in Blair County
With 8,752 households falling in the category, the $50,000 to $74,999 income range is the most frequent in Blair County, accounting for 17.3% of all households. In contrast, only 2,327 households (4.6%) fall into the $200,000+ income bracket, making it the least populous group.
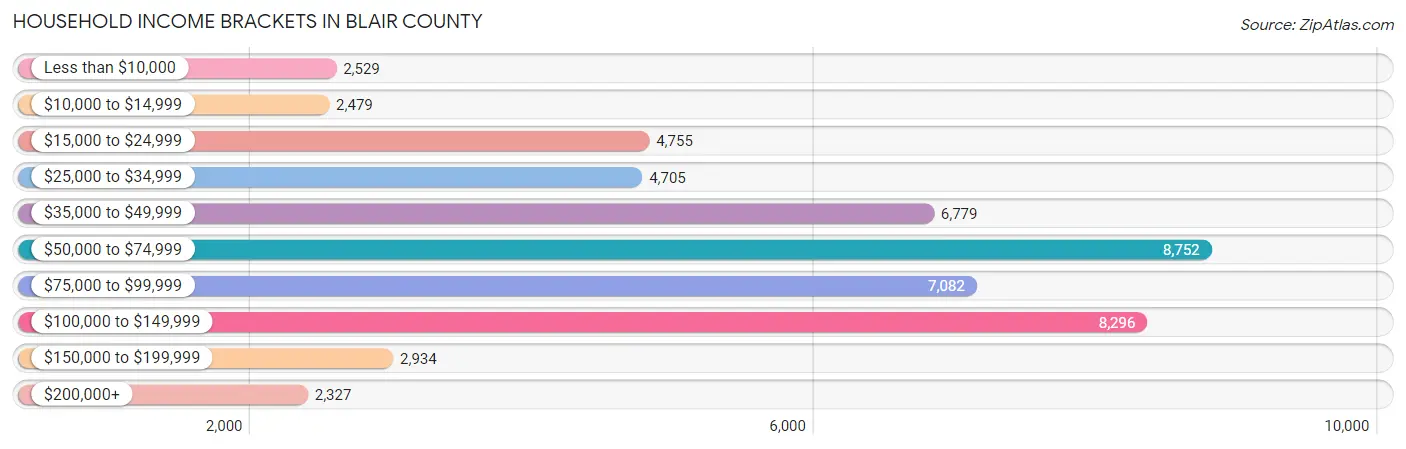
| Income Bracket | # Households | % Households |
| Less than $10,000 | 2,529 | 5.0% |
| $10,000 to $14,999 | 2,479 | 4.9% |
| $15,000 to $24,999 | 4,755 | 9.4% |
| $25,000 to $34,999 | 4,705 | 9.3% |
| $35,000 to $49,999 | 6,779 | 13.4% |
| $50,000 to $74,999 | 8,752 | 17.3% |
| $75,000 to $99,999 | 7,082 | 14.0% |
| $100,000 to $149,999 | 8,296 | 16.4% |
| $150,000 to $199,999 | 2,934 | 5.8% |
| $200,000+ | 2,327 | 4.6% |
Household Income by Householder Age in Blair County
The median household income in Blair County is $59,386, with the highest median household income of $74,259 found in the 45 to 64 years age bracket for the primary householder. A total of 18,493 households (36.6%) fall into this category. Meanwhile, the 15 to 24 years age bracket for the primary householder has the lowest median household income of $38,724, with 1,382 households (2.7%) in this group.
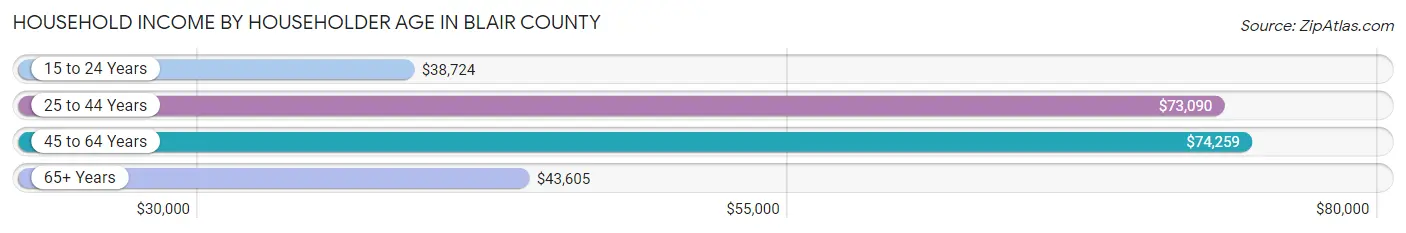
| Income Bracket | # Households | Median Income |
| 15 to 24 Years | 1,382 (2.7%) | $38,724 |
| 25 to 44 Years | 14,116 (27.9%) | $73,090 |
| 45 to 64 Years | 18,493 (36.6%) | $74,259 |
| 65+ Years | 16,596 (32.8%) | $43,605 |
| Total | 50,587 (100.0%) | $59,386 |
Poverty in Blair County
Income Below Poverty by Sex and Age in Blair County
With 12.0% poverty level for males and 14.3% for females among the residents of Blair County, under 5 year old males and under 5 year old females are the most vulnerable to poverty, with 713 males (22.9%) and 745 females (25.4%) in their respective age groups living below the poverty level.
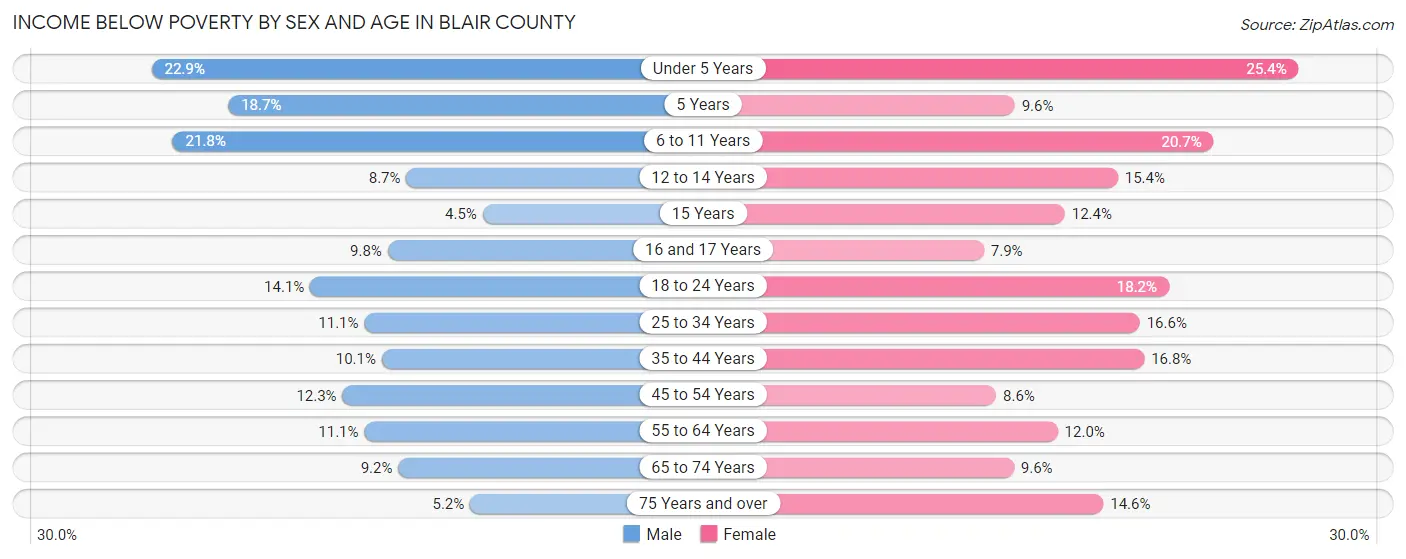
| Age Bracket | Male | Female |
| Under 5 Years | 713 (22.9%) | 745 (25.4%) |
| 5 Years | 109 (18.7%) | 52 (9.6%) |
| 6 to 11 Years | 950 (21.8%) | 857 (20.7%) |
| 12 to 14 Years | 185 (8.7%) | 321 (15.4%) |
| 15 Years | 28 (4.5%) | 77 (12.4%) |
| 16 and 17 Years | 161 (9.8%) | 111 (7.9%) |
| 18 to 24 Years | 682 (14.1%) | 801 (18.2%) |
| 25 to 34 Years | 835 (11.1%) | 1,188 (16.6%) |
| 35 to 44 Years | 721 (10.1%) | 1,197 (16.8%) |
| 45 to 54 Years | 928 (12.3%) | 650 (8.6%) |
| 55 to 64 Years | 955 (11.1%) | 1,072 (12.0%) |
| 65 to 74 Years | 635 (9.2%) | 736 (9.6%) |
| 75 Years and over | 207 (5.2%) | 823 (14.6%) |
| Total | 7,109 (12.0%) | 8,630 (14.3%) |
Income Above Poverty by Sex and Age in Blair County
According to the poverty statistics in Blair County, males aged 15 years and females aged 16 and 17 years are the age groups that are most secure financially, with 95.5% of males and 92.1% of females in these age groups living above the poverty line.
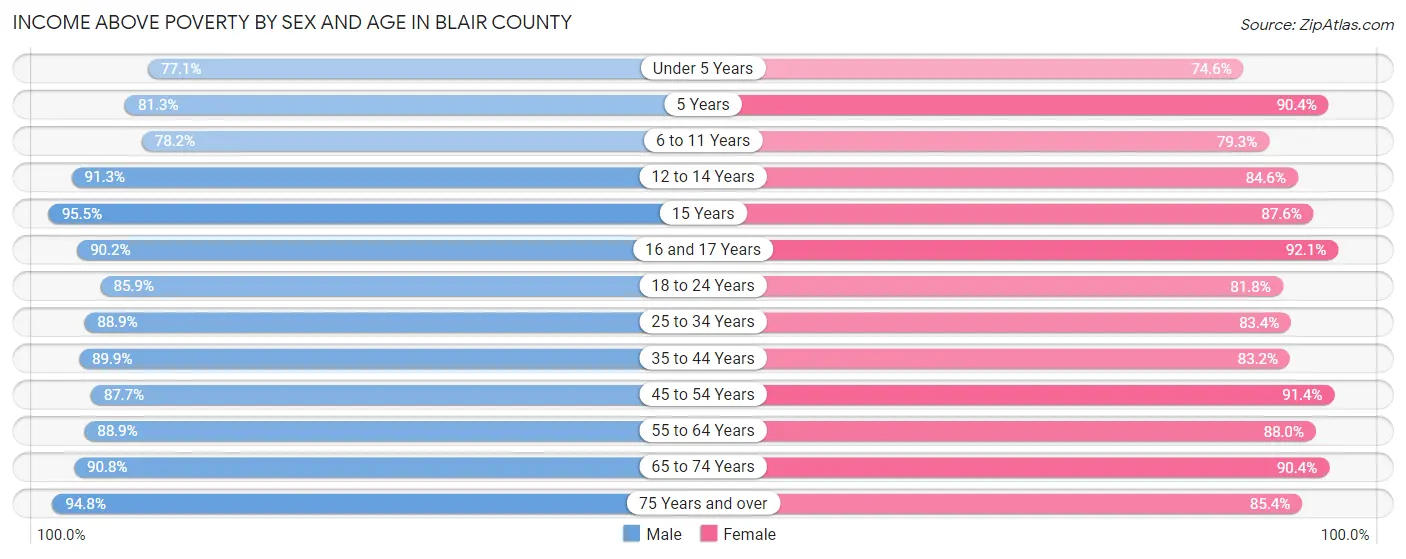
| Age Bracket | Male | Female |
| Under 5 Years | 2,397 (77.1%) | 2,185 (74.6%) |
| 5 Years | 475 (81.3%) | 488 (90.4%) |
| 6 to 11 Years | 3,416 (78.2%) | 3,284 (79.3%) |
| 12 to 14 Years | 1,932 (91.3%) | 1,768 (84.6%) |
| 15 Years | 596 (95.5%) | 543 (87.6%) |
| 16 and 17 Years | 1,486 (90.2%) | 1,292 (92.1%) |
| 18 to 24 Years | 4,155 (85.9%) | 3,598 (81.8%) |
| 25 to 34 Years | 6,703 (88.9%) | 5,975 (83.4%) |
| 35 to 44 Years | 6,413 (89.9%) | 5,909 (83.2%) |
| 45 to 54 Years | 6,614 (87.7%) | 6,914 (91.4%) |
| 55 to 64 Years | 7,664 (88.9%) | 7,849 (88.0%) |
| 65 to 74 Years | 6,275 (90.8%) | 6,949 (90.4%) |
| 75 Years and over | 3,784 (94.8%) | 4,831 (85.4%) |
| Total | 51,910 (87.9%) | 51,585 (85.7%) |
Income Below Poverty Among Married-Couple Families in Blair County
The poverty statistics for married-couple families in Blair County show that 3.6% or 852 of the total 23,392 families live below the poverty line. Families with 5 or more children have the highest poverty rate of 23.7%, comprising of 87 families. On the other hand, families with no children have the lowest poverty rate of 2.7%, which includes 412 families.
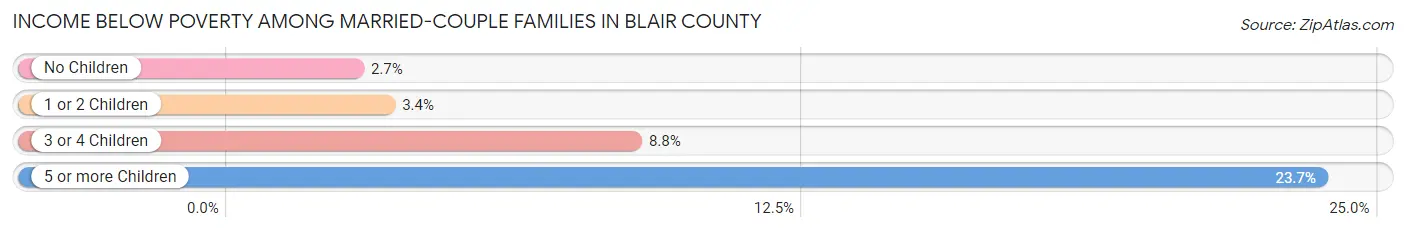
| Children | Above Poverty | Below Poverty |
| No Children | 14,623 (97.3%) | 412 (2.7%) |
| 1 or 2 Children | 6,288 (96.6%) | 223 (3.4%) |
| 3 or 4 Children | 1,349 (91.2%) | 130 (8.8%) |
| 5 or more Children | 280 (76.3%) | 87 (23.7%) |
| Total | 22,540 (96.4%) | 852 (3.6%) |
Income Below Poverty Among Single-Parent Households in Blair County
According to the poverty data in Blair County, 14.7% or 344 single-father households and 28.0% or 1,636 single-mother households are living below the poverty line. Among single-father households, those with 1 or 2 children have the highest poverty rate, with 230 households (19.5%) experiencing poverty. Likewise, among single-mother households, those with 5 or more children have the highest poverty rate, with 22 households (55.0%) falling below the poverty line.
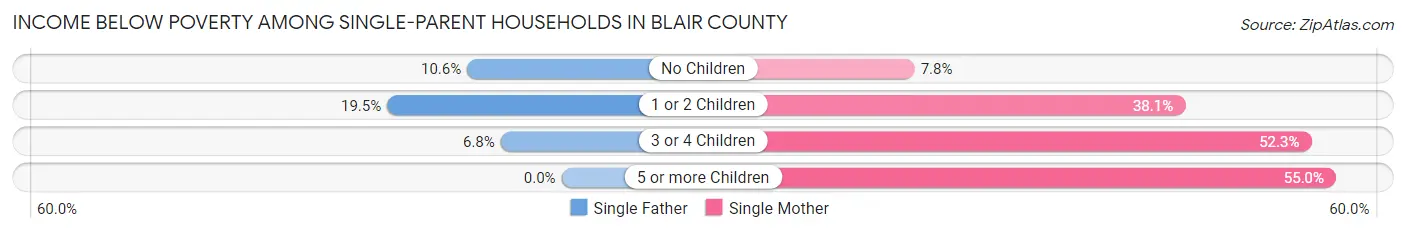
| Children | Single Father | Single Mother |
| No Children | 100 (10.5%) | 174 (7.8%) |
| 1 or 2 Children | 230 (19.5%) | 1,161 (38.1%) |
| 3 or 4 Children | 14 (6.8%) | 279 (52.2%) |
| 5 or more Children | 0 (0.0%) | 22 (55.0%) |
| Total | 344 (14.7%) | 1,636 (28.0%) |
Income Below Poverty Among Married-Couple vs Single-Parent Households in Blair County
The poverty data for Blair County shows that 852 of the married-couple family households (3.6%) and 1,980 of the single-parent households (24.2%) are living below the poverty level. Within the married-couple family households, those with 5 or more children have the highest poverty rate, with 87 households (23.7%) falling below the poverty line. Among the single-parent households, those with 5 or more children have the highest poverty rate, with 22 household (55.0%) living below poverty.
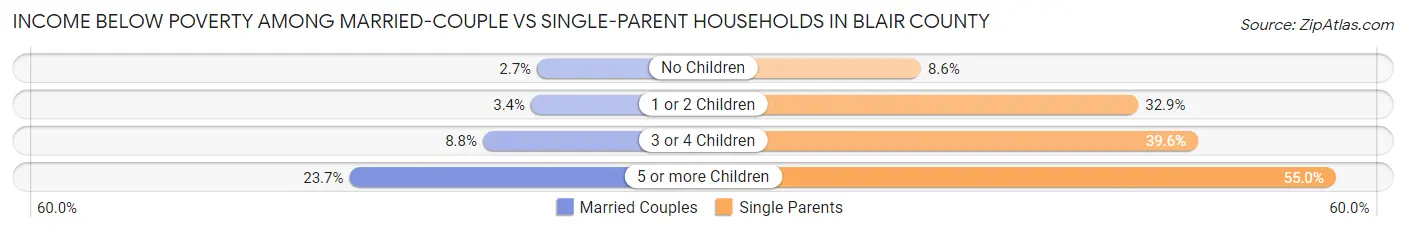
| Children | Married-Couple Families | Single-Parent Households |
| No Children | 412 (2.7%) | 274 (8.6%) |
| 1 or 2 Children | 223 (3.4%) | 1,391 (32.9%) |
| 3 or 4 Children | 130 (8.8%) | 293 (39.6%) |
| 5 or more Children | 87 (23.7%) | 22 (55.0%) |
| Total | 852 (3.6%) | 1,980 (24.2%) |
Race in Blair County
The most populous races in Blair County are White / Caucasian (115,276 | 94.0%), Two or more Races (3,894 | 3.2%), and Black / African American (2,329 | 1.9%).
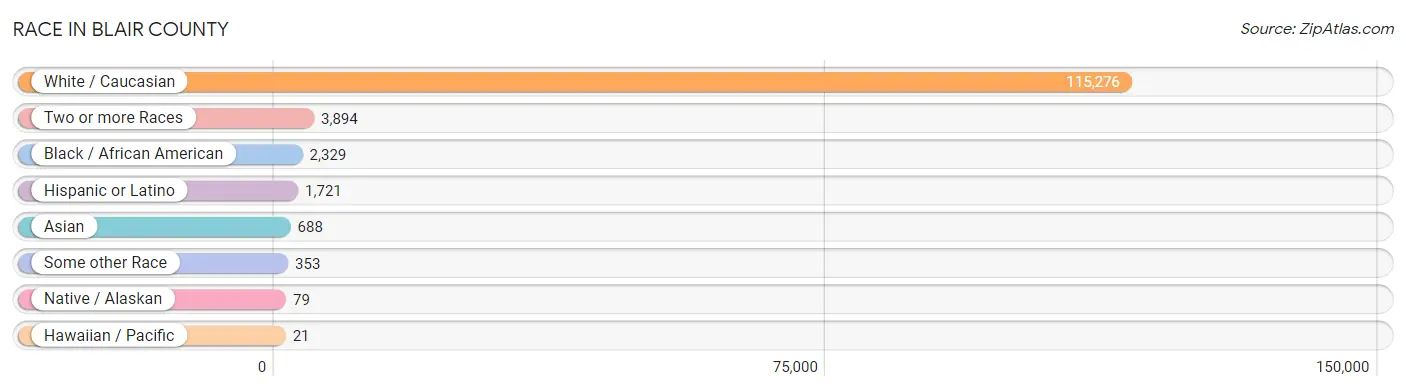
| Race | # Population | % Population |
| Asian | 688 | 0.6% |
| Black / African American | 2,329 | 1.9% |
| Hawaiian / Pacific | 21 | 0.0% |
| Hispanic or Latino | 1,721 | 1.4% |
| Native / Alaskan | 79 | 0.1% |
| White / Caucasian | 115,276 | 94.0% |
| Two or more Races | 3,894 | 3.2% |
| Some other Race | 353 | 0.3% |
| Total | 122,640 | 100.0% |
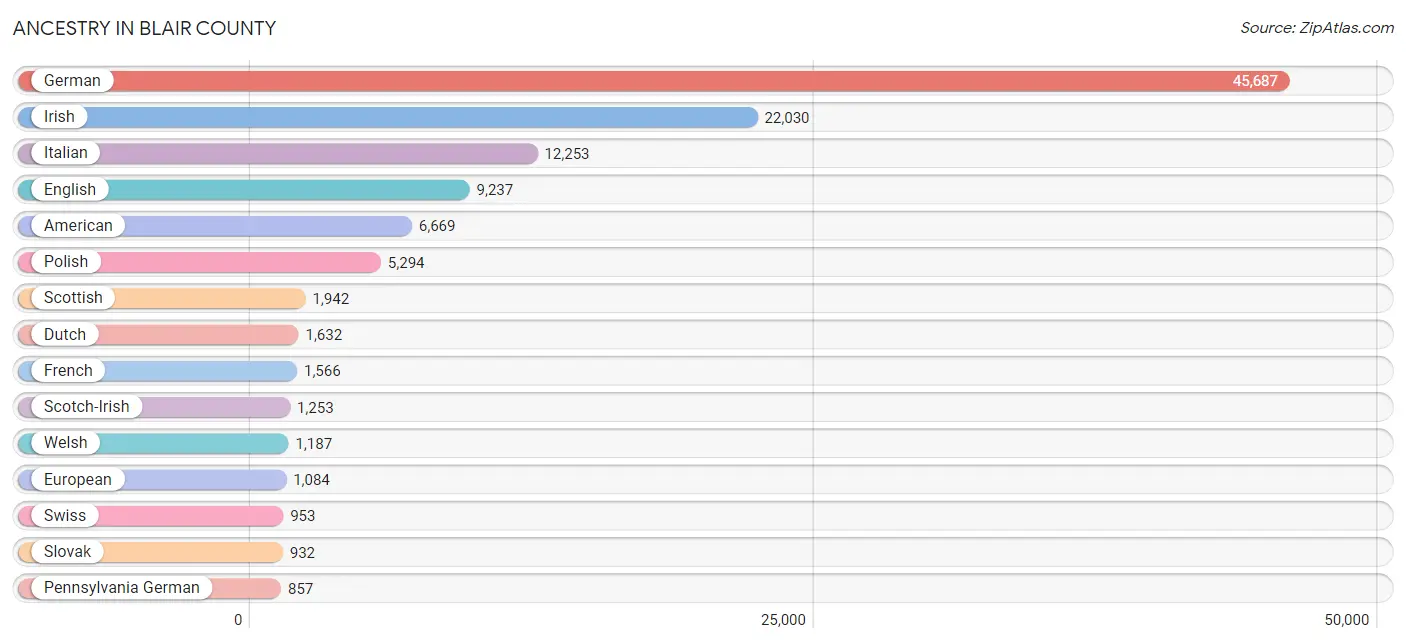
Ancestry in Blair County
The most populous ancestries reported in Blair County are German (45,687 | 37.2%), Irish (22,030 | 18.0%), Italian (12,253 | 10.0%), English (9,237 | 7.5%), and American (6,669 | 5.4%), together accounting for 78.2% of all Blair County residents.
| Ancestry | # Population | % Population |
| African | 80 | 0.1% |
| Albanian | 15 | 0.0% |
| American | 6,669 | 5.4% |
| Apache | 2 | 0.0% |
| Arab | 228 | 0.2% |
| Armenian | 24 | 0.0% |
| Austrian | 300 | 0.2% |
| Belgian | 68 | 0.1% |
| Bhutanese | 100 | 0.1% |
| Blackfeet | 43 | 0.0% |
| Brazilian | 53 | 0.0% |
| British | 349 | 0.3% |
| Bulgarian | 16 | 0.0% |
| Burmese | 134 | 0.1% |
| Canadian | 183 | 0.2% |
| Central American | 110 | 0.1% |
| Central American Indian | 9 | 0.0% |
| Cherokee | 216 | 0.2% |
| Chilean | 5 | 0.0% |
| Chippewa | 22 | 0.0% |
| Colombian | 6 | 0.0% |
| Costa Rican | 16 | 0.0% |
| Croatian | 318 | 0.3% |
| Cuban | 205 | 0.2% |
| Czech | 318 | 0.3% |
| Czechoslovakian | 99 | 0.1% |
| Danish | 39 | 0.0% |
| Delaware | 36 | 0.0% |
| Dominican | 92 | 0.1% |
| Dutch | 1,632 | 1.3% |
| Eastern European | 293 | 0.2% |
| Ecuadorian | 75 | 0.1% |
| English | 9,237 | 7.5% |
| Ethiopian | 20 | 0.0% |
| European | 1,084 | 0.9% |
| Filipino | 23 | 0.0% |
| Finnish | 9 | 0.0% |
| French | 1,566 | 1.3% |
| French Canadian | 181 | 0.2% |
| German | 45,687 | 37.2% |
| Greek | 263 | 0.2% |
| Guamanian / Chamorro | 12 | 0.0% |
| Guatemalan | 11 | 0.0% |
| Haitian | 10 | 0.0% |
| Hungarian | 415 | 0.3% |
| Indian (Asian) | 208 | 0.2% |
| Inupiat | 8 | 0.0% |
| Irish | 22,030 | 18.0% |
| Iroquois | 29 | 0.0% |
| Italian | 12,253 | 10.0% |
| Jamaican | 44 | 0.0% |
| Japanese | 96 | 0.1% |
| Korean | 375 | 0.3% |
| Lebanese | 49 | 0.0% |
| Lithuanian | 239 | 0.2% |
| Lumbee | 1 | 0.0% |
| Luxembourger | 19 | 0.0% |
| Macedonian | 16 | 0.0% |
| Malaysian | 6 | 0.0% |
| Mexican | 406 | 0.3% |
| Mexican American Indian | 2 | 0.0% |
| Native Hawaiian | 19 | 0.0% |
| Nigerian | 21 | 0.0% |
| Northern European | 41 | 0.0% |
| Norwegian | 191 | 0.2% |
| Pakistani | 7 | 0.0% |
| Palestinian | 6 | 0.0% |
| Panamanian | 75 | 0.1% |
| Pennsylvania German | 857 | 0.7% |
| Polish | 5,294 | 4.3% |
| Portuguese | 74 | 0.1% |
| Puerto Rican | 586 | 0.5% |
| Puget Sound Salish | 11 | 0.0% |
| Romanian | 50 | 0.0% |
| Russian | 371 | 0.3% |
| Salvadoran | 8 | 0.0% |
| Samoan | 21 | 0.0% |
| Scandinavian | 230 | 0.2% |
| Scotch-Irish | 1,253 | 1.0% |
| Scottish | 1,942 | 1.6% |
| Serbian | 4 | 0.0% |
| Sierra Leonean | 191 | 0.2% |
| Sioux | 6 | 0.0% |
| Slavic | 65 | 0.1% |
| Slovak | 932 | 0.8% |
| Slovene | 19 | 0.0% |
| South American | 128 | 0.1% |
| South American Indian | 5 | 0.0% |
| Spaniard | 14 | 0.0% |
| Spanish | 120 | 0.1% |
| Sri Lankan | 21 | 0.0% |
| Subsaharan African | 312 | 0.3% |
| Swedish | 798 | 0.6% |
| Swiss | 953 | 0.8% |
| Syrian | 125 | 0.1% |
| Thai | 173 | 0.1% |
| Turkish | 41 | 0.0% |
| Ukrainian | 490 | 0.4% |
| Venezuelan | 42 | 0.0% |
| Welsh | 1,187 | 1.0% |
| West Indian | 51 | 0.0% |
| Yugoslavian | 12 | 0.0% | View All 102 Rows |
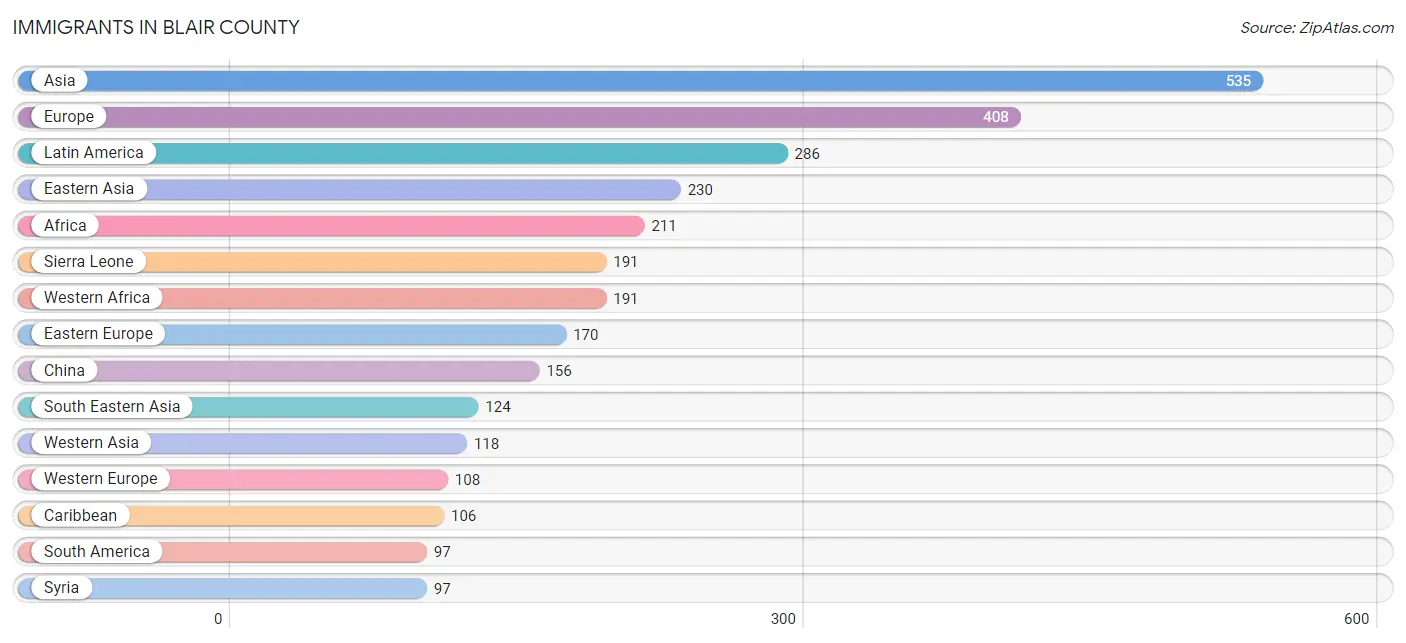
Immigrants in Blair County
The most numerous immigrant groups reported in Blair County came from Asia (535 | 0.4%), Europe (408 | 0.3%), Latin America (286 | 0.2%), Eastern Asia (230 | 0.2%), and Africa (211 | 0.2%), together accounting for 1.4% of all Blair County residents.
| Immigration Origin | # Population | % Population |
| Africa | 211 | 0.2% |
| Albania | 10 | 0.0% |
| Asia | 535 | 0.4% |
| Australia | 6 | 0.0% |
| Austria | 7 | 0.0% |
| Belgium | 13 | 0.0% |
| Brazil | 48 | 0.0% |
| Canada | 49 | 0.0% |
| Caribbean | 106 | 0.1% |
| Central America | 83 | 0.1% |
| China | 156 | 0.1% |
| Colombia | 8 | 0.0% |
| Croatia | 12 | 0.0% |
| Dominican Republic | 54 | 0.0% |
| Eastern Africa | 20 | 0.0% |
| Eastern Asia | 230 | 0.2% |
| Eastern Europe | 170 | 0.1% |
| Ecuador | 21 | 0.0% |
| El Salvador | 8 | 0.0% |
| England | 42 | 0.0% |
| Eritrea | 20 | 0.0% |
| Europe | 408 | 0.3% |
| Germany | 84 | 0.1% |
| Guatemala | 11 | 0.0% |
| Guyana | 15 | 0.0% |
| Haiti | 5 | 0.0% |
| Honduras | 16 | 0.0% |
| India | 30 | 0.0% |
| Ireland | 7 | 0.0% |
| Italy | 30 | 0.0% |
| Japan | 26 | 0.0% |
| Korea | 48 | 0.0% |
| Latin America | 286 | 0.2% |
| Lebanon | 21 | 0.0% |
| Mexico | 41 | 0.0% |
| Netherlands | 4 | 0.0% |
| Northern Europe | 96 | 0.1% |
| Oceania | 6 | 0.0% |
| Pakistan | 18 | 0.0% |
| Panama | 7 | 0.0% |
| Philippines | 51 | 0.0% |
| Poland | 39 | 0.0% |
| Portugal | 4 | 0.0% |
| Romania | 23 | 0.0% |
| Russia | 28 | 0.0% |
| Scotland | 30 | 0.0% |
| Sierra Leone | 191 | 0.2% |
| Singapore | 15 | 0.0% |
| South America | 97 | 0.1% |
| South Central Asia | 63 | 0.1% |
| South Eastern Asia | 124 | 0.1% |
| Southern Europe | 34 | 0.0% |
| Sri Lanka | 15 | 0.0% |
| Sweden | 5 | 0.0% |
| Syria | 97 | 0.1% |
| Taiwan | 8 | 0.0% |
| Thailand | 53 | 0.0% |
| Trinidad and Tobago | 47 | 0.0% |
| Ukraine | 58 | 0.1% |
| Vietnam | 5 | 0.0% |
| Western Africa | 191 | 0.2% |
| Western Asia | 118 | 0.1% |
| Western Europe | 108 | 0.1% | View All 63 Rows |
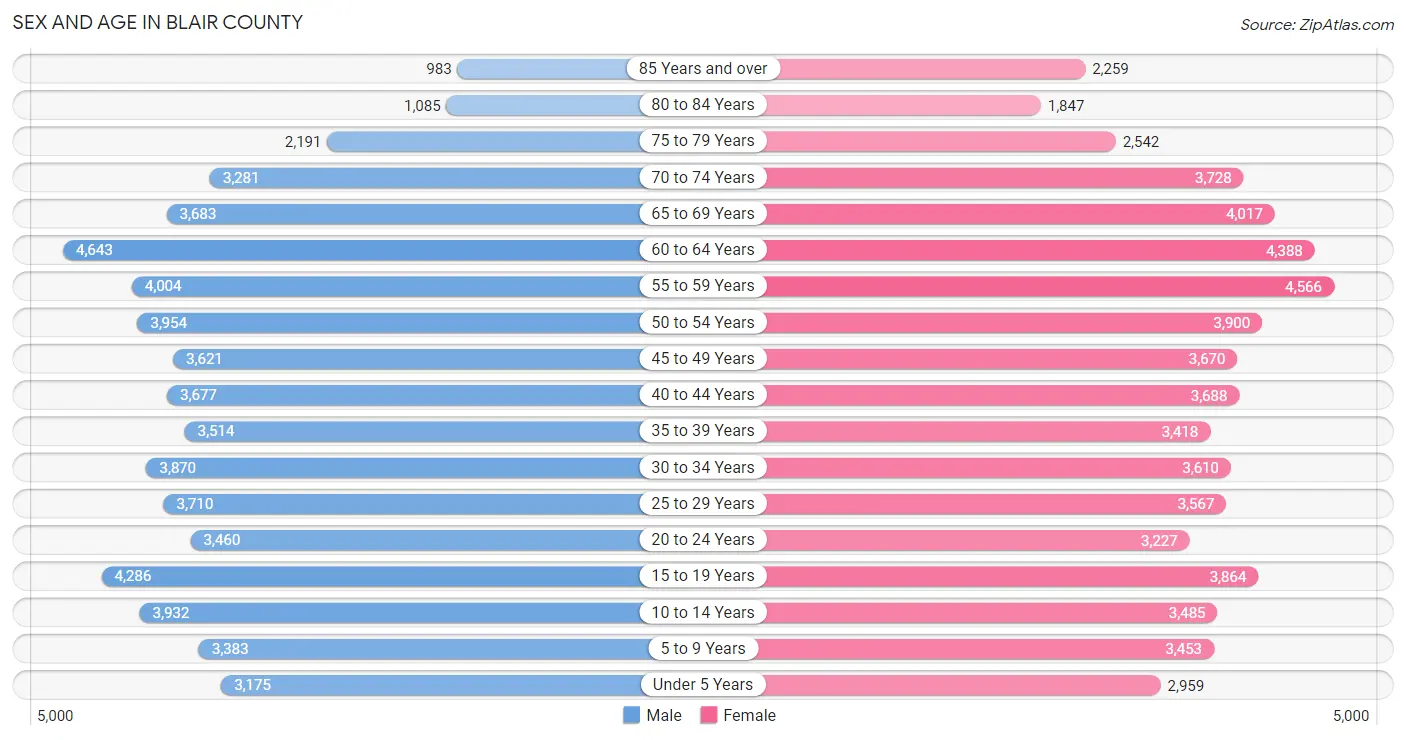
Sex and Age in Blair County
Sex and Age in Blair County
The most populous age groups in Blair County are 60 to 64 Years (4,643 | 7.7%) for men and 55 to 59 Years (4,566 | 7.3%) for women.
| Age Bracket | Male | Female |
| Under 5 Years | 3,175 (5.2%) | 2,959 (4.8%) |
| 5 to 9 Years | 3,383 (5.6%) | 3,453 (5.6%) |
| 10 to 14 Years | 3,932 (6.5%) | 3,485 (5.6%) |
| 15 to 19 Years | 4,286 (7.1%) | 3,864 (6.2%) |
| 20 to 24 Years | 3,460 (5.7%) | 3,227 (5.2%) |
| 25 to 29 Years | 3,710 (6.1%) | 3,567 (5.7%) |
| 30 to 34 Years | 3,870 (6.4%) | 3,610 (5.8%) |
| 35 to 39 Years | 3,514 (5.8%) | 3,418 (5.5%) |
| 40 to 44 Years | 3,677 (6.1%) | 3,688 (5.9%) |
| 45 to 49 Years | 3,621 (6.0%) | 3,670 (5.9%) |
| 50 to 54 Years | 3,954 (6.5%) | 3,900 (6.3%) |
| 55 to 59 Years | 4,004 (6.6%) | 4,566 (7.3%) |
| 60 to 64 Years | 4,643 (7.7%) | 4,388 (7.1%) |
| 65 to 69 Years | 3,683 (6.1%) | 4,017 (6.5%) |
| 70 to 74 Years | 3,281 (5.4%) | 3,728 (6.0%) |
| 75 to 79 Years | 2,191 (3.6%) | 2,542 (4.1%) |
| 80 to 84 Years | 1,085 (1.8%) | 1,847 (3.0%) |
| 85 Years and over | 983 (1.6%) | 2,259 (3.6%) |
| Total | 60,452 (100.0%) | 62,188 (100.0%) |
Families and Households in Blair County
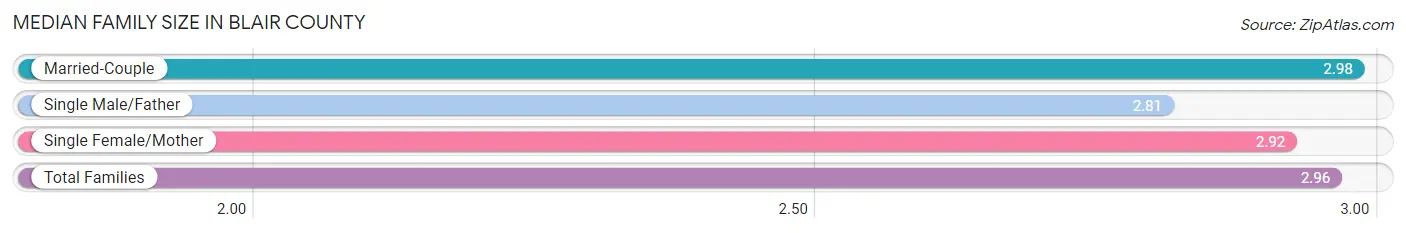
Median Family Size in Blair County
The median family size in Blair County is 2.96 persons per family, with married-couple families (23,392 | 74.1%) accounting for the largest median family size of 2.98 persons per family. On the other hand, single male/father families (2,334 | 7.4%) represent the smallest median family size with 2.81 persons per family.
| Family Type | # Families | Family Size |
| Married-Couple | 23,392 (74.1%) | 2.98 |
| Single Male/Father | 2,334 (7.4%) | 2.81 |
| Single Female/Mother | 5,841 (18.5%) | 2.92 |
| Total Families | 31,567 (100.0%) | 2.96 |
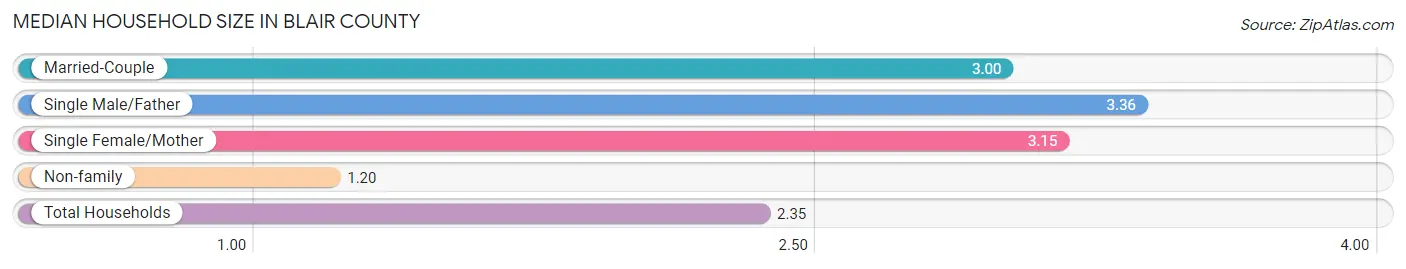
Median Household Size in Blair County
The median household size in Blair County is 2.35 persons per household, with single male/father households (2,334 | 4.6%) accounting for the largest median household size of 3.36 persons per household. non-family households (19,020 | 37.6%) represent the smallest median household size with 1.20 persons per household.
| Household Type | # Households | Household Size |
| Married-Couple | 23,392 (46.2%) | 3.00 |
| Single Male/Father | 2,334 (4.6%) | 3.36 |
| Single Female/Mother | 5,841 (11.6%) | 3.15 |
| Non-family | 19,020 (37.6%) | 1.20 |
| Total Households | 50,587 (100.0%) | 2.35 |
Household Size by Marriage Status in Blair County
Out of a total of 50,587 households in Blair County, 31,567 (62.4%) are family households, while 19,020 (37.6%) are nonfamily households. The most numerous type of family households are 2-person households, comprising 15,014, and the most common type of nonfamily households are 1-person households, comprising 15,823.
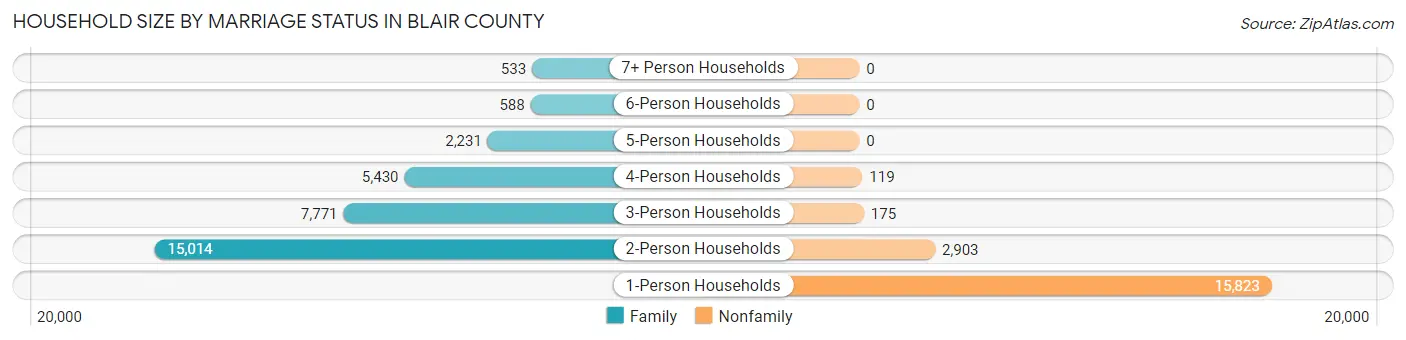
| Household Size | Family Households | Nonfamily Households |
| 1-Person Households | - | 15,823 (31.3%) |
| 2-Person Households | 15,014 (29.7%) | 2,903 (5.7%) |
| 3-Person Households | 7,771 (15.4%) | 175 (0.4%) |
| 4-Person Households | 5,430 (10.7%) | 119 (0.2%) |
| 5-Person Households | 2,231 (4.4%) | 0 (0.0%) |
| 6-Person Households | 588 (1.2%) | 0 (0.0%) |
| 7+ Person Households | 533 (1.1%) | 0 (0.0%) |
| Total | 31,567 (62.4%) | 19,020 (37.6%) |
Female Fertility in Blair County
Fertility by Age in Blair County
Average fertility rate in Blair County is 52.0 births per 1,000 women. Women in the age bracket of 20 to 34 years have the highest fertility rate with 93.0 births per 1,000 women. Women in the age bracket of 20 to 34 years acount for 72.2% of all women with births.
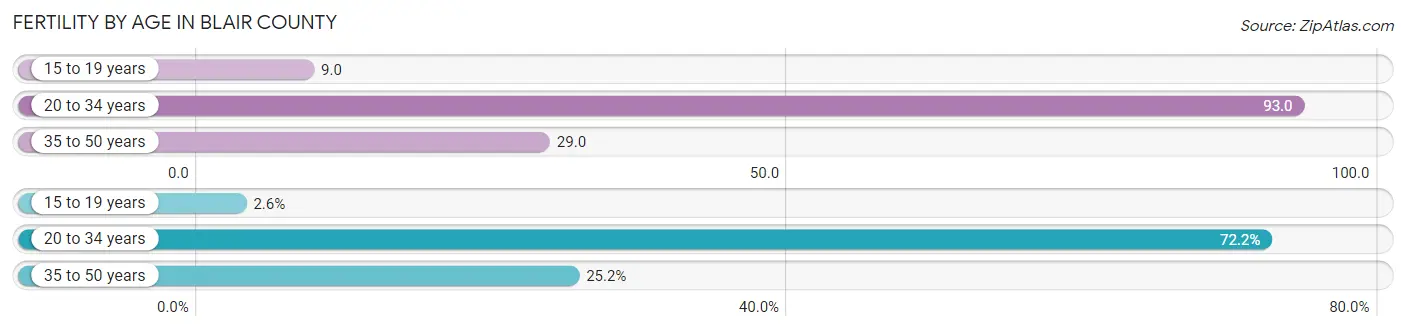
| Age Bracket | Women with Births | Births / 1,000 Women |
| 15 to 19 years | 35 (2.6%) | 9.0 |
| 20 to 34 years | 969 (72.2%) | 93.0 |
| 35 to 50 years | 338 (25.2%) | 29.0 |
| Total | 1,342 (100.0%) | 52.0 |
Fertility by Age by Marriage Status in Blair County
65.9% of women with births (1,342) in Blair County are married. The highest percentage of unmarried women with births falls into 15 to 19 years age bracket with 100.0% of them unmarried at the time of birth, while the lowest percentage of unmarried women with births belong to 35 to 50 years age bracket with 18.6% of them unmarried.
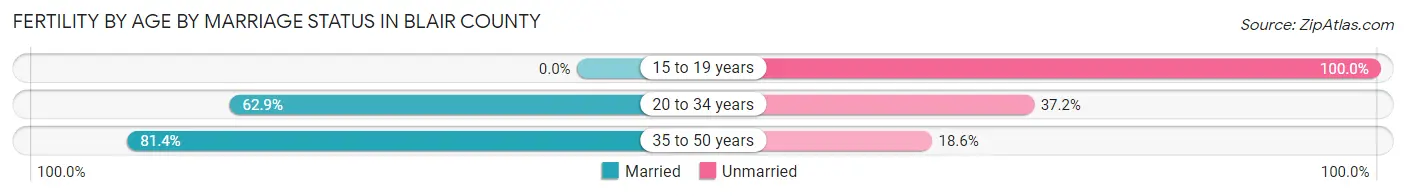
| Age Bracket | Married | Unmarried |
| 15 to 19 years | 0 (0.0%) | 35 (100.0%) |
| 20 to 34 years | 609 (62.8%) | 360 (37.1%) |
| 35 to 50 years | 275 (81.4%) | 63 (18.6%) |
| Total | 884 (65.9%) | 458 (34.1%) |
Fertility by Education in Blair County
Average fertility rate in Blair County is 52.0 births per 1,000 women. Women with the education attainment of graduate degree have the highest fertility rate of 69.0 births per 1,000 women, while women with the education attainment of college or associate's degree have the lowest fertility at 43.0 births per 1,000 women. Women with the education attainment of high school diploma represent 27.8% of all women with births.
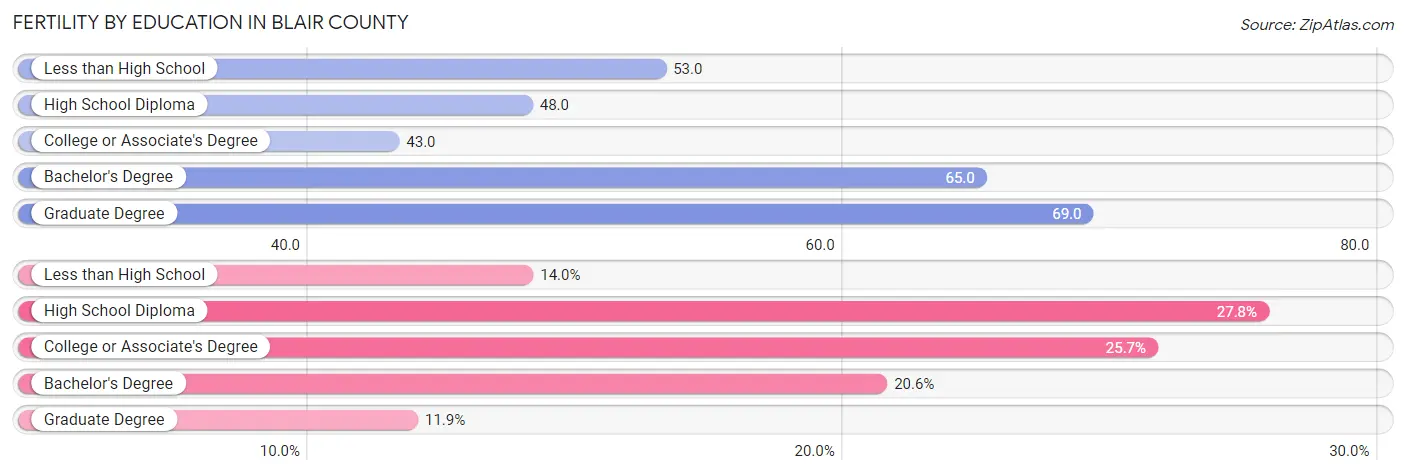
| Educational Attainment | Women with Births | Births / 1,000 Women |
| Less than High School | 188 (14.0%) | 53.0 |
| High School Diploma | 373 (27.8%) | 48.0 |
| College or Associate's Degree | 345 (25.7%) | 43.0 |
| Bachelor's Degree | 277 (20.6%) | 65.0 |
| Graduate Degree | 159 (11.8%) | 69.0 |
| Total | 1,342 (100.0%) | 52.0 |
Fertility by Education by Marriage Status in Blair County
34.1% of women with births in Blair County are unmarried. Women with the educational attainment of bachelor's degree are most likely to be married with 100.0% of them married at childbirth, while women with the educational attainment of high school diploma are least likely to be married with 75.1% of them unmarried at childbirth.
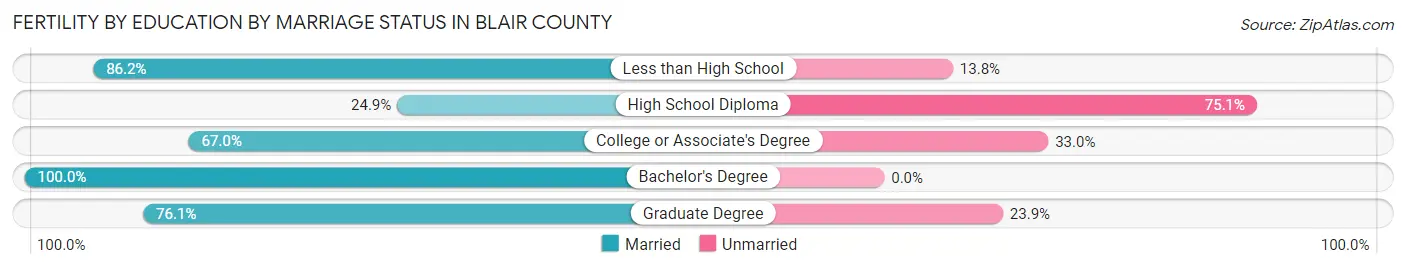
| Educational Attainment | Married | Unmarried |
| Less than High School | 162 (86.2%) | 26 (13.8%) |
| High School Diploma | 93 (24.9%) | 280 (75.1%) |
| College or Associate's Degree | 231 (67.0%) | 114 (33.0%) |
| Bachelor's Degree | 277 (100.0%) | 0 (0.0%) |
| Graduate Degree | 121 (76.1%) | 38 (23.9%) |
| Total | 884 (65.9%) | 458 (34.1%) |
Employment Characteristics in Blair County
Employment by Class of Employer in Blair County
Among the 56,376 employed individuals in Blair County, private company employees (38,746 | 68.7%), not-for-profit organizations (6,127 | 10.9%), and local government employees (3,605 | 6.4%) make up the most common classes of employment.
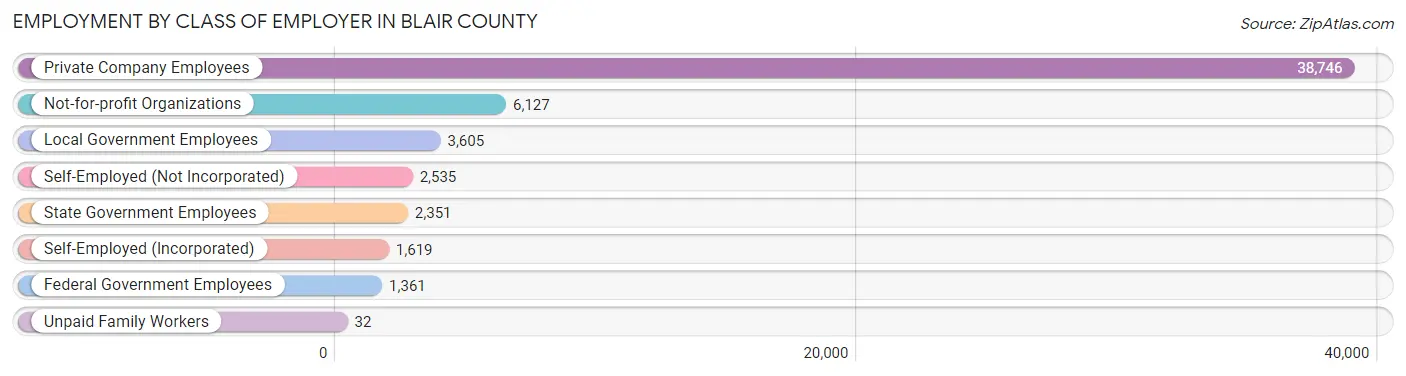
| Employer Class | # Employees | % Employees |
| Private Company Employees | 38,746 | 68.7% |
| Self-Employed (Incorporated) | 1,619 | 2.9% |
| Self-Employed (Not Incorporated) | 2,535 | 4.5% |
| Not-for-profit Organizations | 6,127 | 10.9% |
| Local Government Employees | 3,605 | 6.4% |
| State Government Employees | 2,351 | 4.2% |
| Federal Government Employees | 1,361 | 2.4% |
| Unpaid Family Workers | 32 | 0.1% |
| Total | 56,376 | 100.0% |
Employment Status by Age in Blair County
According to the labor force statistics for Blair County, out of the total population over 16 years of age (101,006), 59.5% or 60,099 individuals are in the labor force, with 4.2% or 2,524 of them unemployed. The age group with the highest labor force participation rate is 25 to 29 years, with 88.5% or 6,440 individuals in the labor force. Within the labor force, the 20 to 24 years age range has the highest percentage of unemployed individuals, with 11.1% or 574 of them being unemployed.
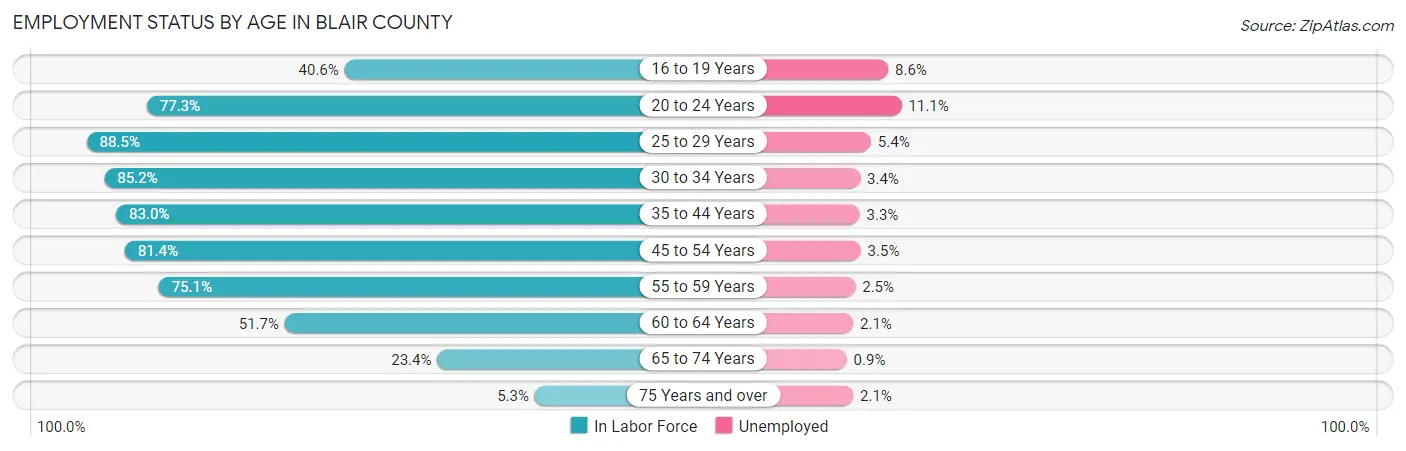
| Age Bracket | In Labor Force | Unemployed |
| 16 to 19 Years | 2,803 (40.6%) | 241 (8.6%) |
| 20 to 24 Years | 5,169 (77.3%) | 574 (11.1%) |
| 25 to 29 Years | 6,440 (88.5%) | 348 (5.4%) |
| 30 to 34 Years | 6,373 (85.2%) | 217 (3.4%) |
| 35 to 44 Years | 11,867 (83.0%) | 392 (3.3%) |
| 45 to 54 Years | 12,328 (81.4%) | 431 (3.5%) |
| 55 to 59 Years | 6,436 (75.1%) | 161 (2.5%) |
| 60 to 64 Years | 4,669 (51.7%) | 98 (2.1%) |
| 65 to 74 Years | 3,442 (23.4%) | 31 (0.9%) |
| 75 Years and over | 578 (5.3%) | 12 (2.1%) |
| Total | 60,099 (59.5%) | 2,524 (4.2%) |
Employment Status by Educational Attainment in Blair County
According to labor force statistics for Blair County, 77.9% of individuals (48,142) out of the total population between 25 and 64 years of age (61,800) are in the labor force, with 3.4% or 1,637 of them being unemployed. The group with the highest labor force participation rate are those with the educational attainment of bachelor's degree or higher, with 87.8% or 13,685 individuals in the labor force. Within the labor force, individuals with less than high school education have the highest percentage of unemployment, with 11.4% or 254 of them being unemployed.
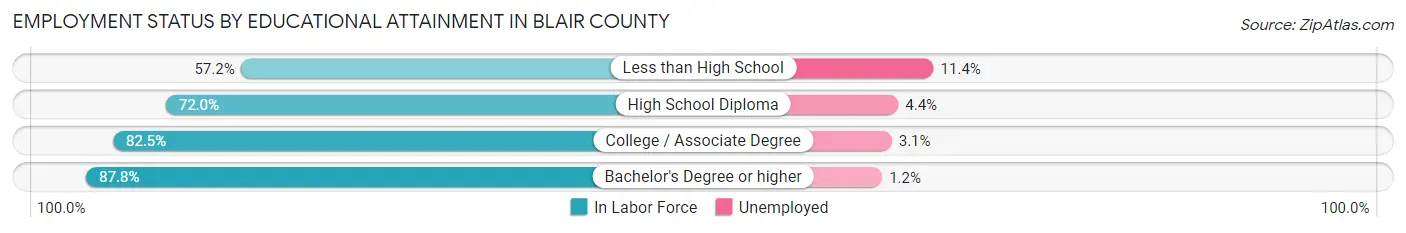
| Educational Attainment | In Labor Force | Unemployed |
| Less than High School | 2,229 (57.2%) | 444 (11.4%) |
| High School Diploma | 18,659 (72.0%) | 1,140 (4.4%) |
| College / Associate Degree | 13,531 (82.5%) | 508 (3.1%) |
| Bachelor's Degree or higher | 13,685 (87.8%) | 187 (1.2%) |
| Total | 48,142 (77.9%) | 2,101 (3.4%) |
Employment Occupations by Sex in Blair County
Management, Business, Science and Arts Occupations
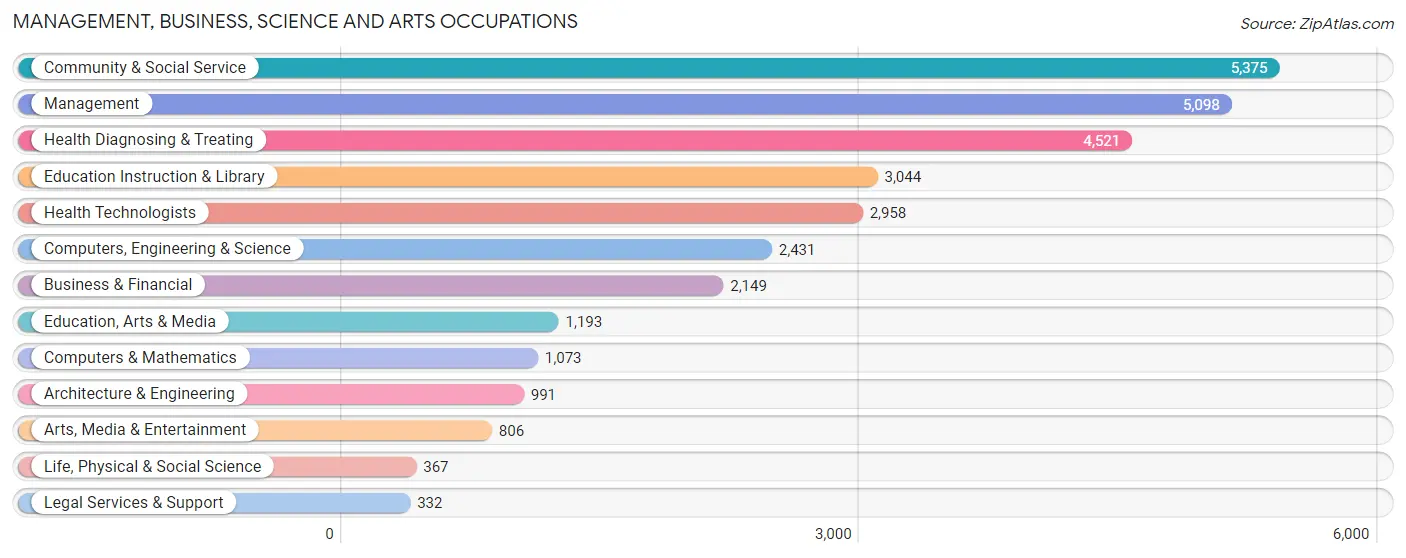
The most common Management, Business, Science and Arts occupations in Blair County are Community & Social Service (5,375 | 9.3%), Management (5,098 | 8.9%), Health Diagnosing & Treating (4,521 | 7.9%), Education Instruction & Library (3,044 | 5.3%), and Health Technologists (2,958 | 5.1%).
Management, Business, Science and Arts Occupations by Sex
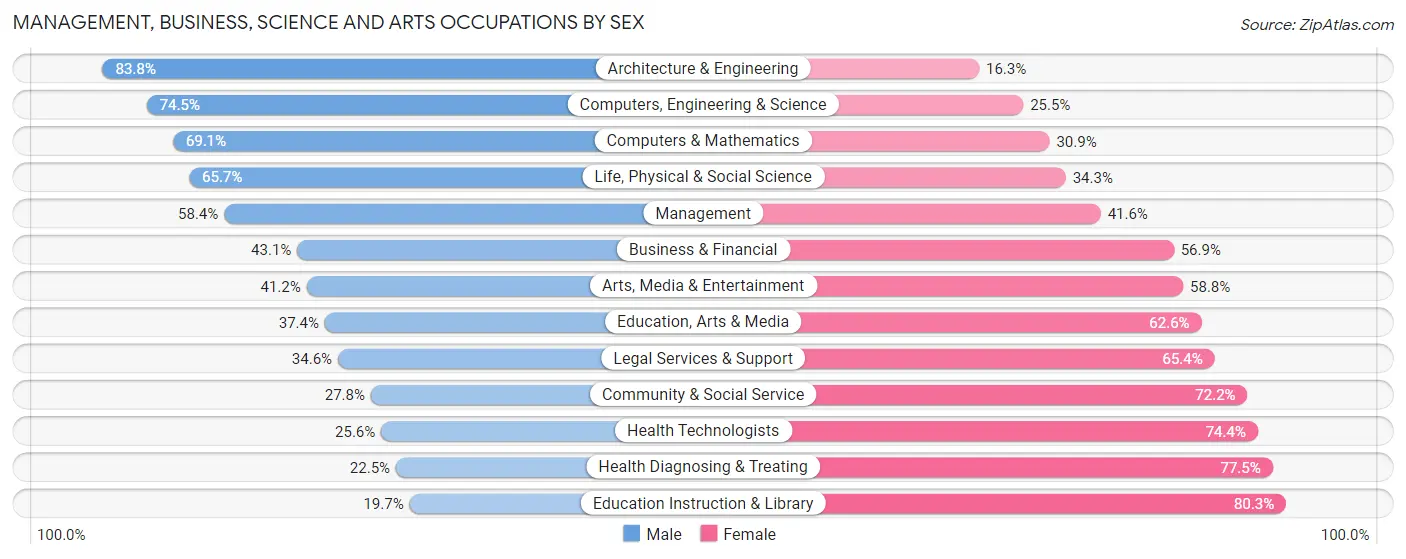
Within the Management, Business, Science and Arts occupations in Blair County, the most male-oriented occupations are Architecture & Engineering (83.8%), Computers, Engineering & Science (74.5%), and Computers & Mathematics (69.1%), while the most female-oriented occupations are Education Instruction & Library (80.3%), Health Diagnosing & Treating (77.5%), and Health Technologists (74.4%).
| Occupation | Male | Female |
| Management | 2,976 (58.4%) | 2,122 (41.6%) |
| Business & Financial | 927 (43.1%) | 1,222 (56.9%) |
| Computers, Engineering & Science | 1,812 (74.5%) | 619 (25.5%) |
| Computers & Mathematics | 741 (69.1%) | 332 (30.9%) |
| Architecture & Engineering | 830 (83.8%) | 161 (16.3%) |
| Life, Physical & Social Science | 241 (65.7%) | 126 (34.3%) |
| Community & Social Service | 1,493 (27.8%) | 3,882 (72.2%) |
| Education, Arts & Media | 446 (37.4%) | 747 (62.6%) |
| Legal Services & Support | 115 (34.6%) | 217 (65.4%) |
| Education Instruction & Library | 600 (19.7%) | 2,444 (80.3%) |
| Arts, Media & Entertainment | 332 (41.2%) | 474 (58.8%) |
| Health Diagnosing & Treating | 1,019 (22.5%) | 3,502 (77.5%) |
| Health Technologists | 758 (25.6%) | 2,200 (74.4%) |
| Total (Category) | 8,227 (42.0%) | 11,347 (58.0%) |
| Total (Overall) | 30,210 (52.5%) | 27,296 (47.5%) |
Services Occupations
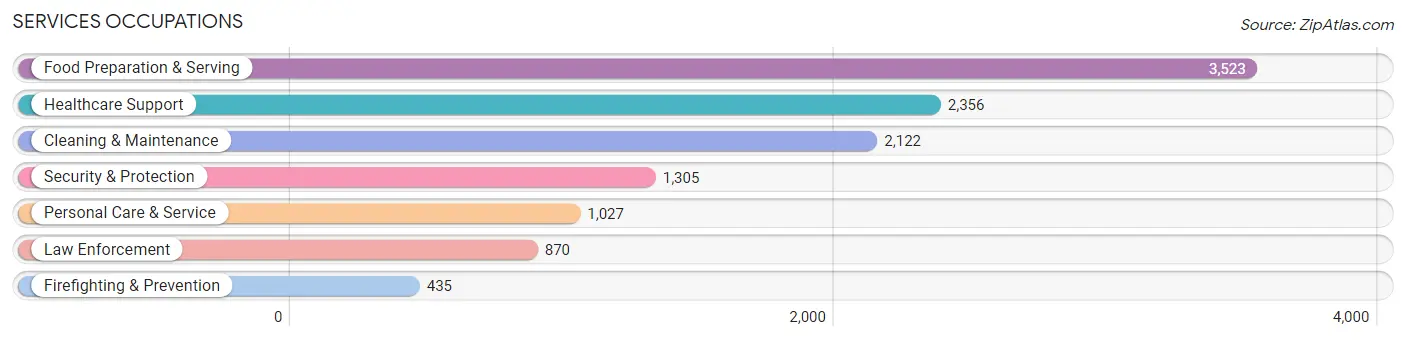
The most common Services occupations in Blair County are Food Preparation & Serving (3,523 | 6.1%), Healthcare Support (2,356 | 4.1%), Cleaning & Maintenance (2,122 | 3.7%), Security & Protection (1,305 | 2.3%), and Personal Care & Service (1,027 | 1.8%).
Services Occupations by Sex
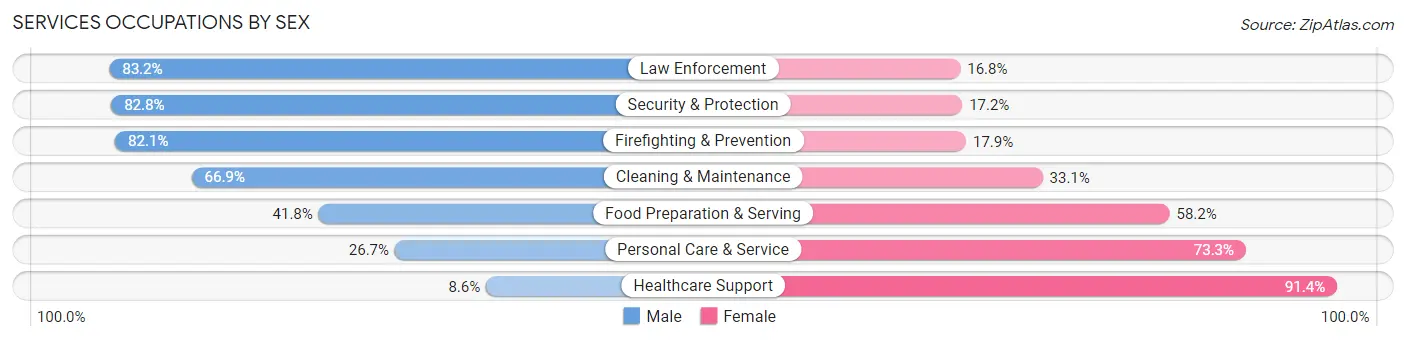
Within the Services occupations in Blair County, the most male-oriented occupations are Law Enforcement (83.2%), Security & Protection (82.8%), and Firefighting & Prevention (82.1%), while the most female-oriented occupations are Healthcare Support (91.4%), Personal Care & Service (73.3%), and Food Preparation & Serving (58.2%).
| Occupation | Male | Female |
| Healthcare Support | 203 (8.6%) | 2,153 (91.4%) |
| Security & Protection | 1,081 (82.8%) | 224 (17.2%) |
| Firefighting & Prevention | 357 (82.1%) | 78 (17.9%) |
| Law Enforcement | 724 (83.2%) | 146 (16.8%) |
| Food Preparation & Serving | 1,472 (41.8%) | 2,051 (58.2%) |
| Cleaning & Maintenance | 1,420 (66.9%) | 702 (33.1%) |
| Personal Care & Service | 274 (26.7%) | 753 (73.3%) |
| Total (Category) | 4,450 (43.1%) | 5,883 (56.9%) |
| Total (Overall) | 30,210 (52.5%) | 27,296 (47.5%) |
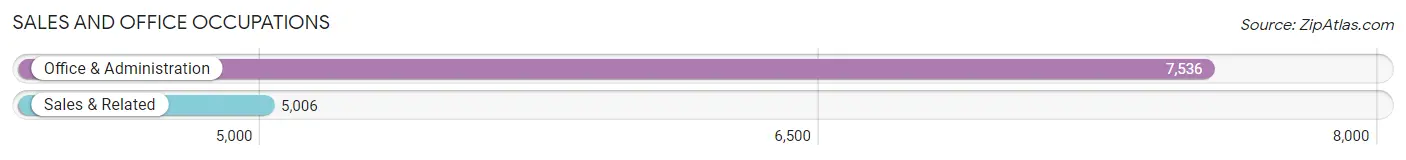
Sales and Office Occupations
The most common Sales and Office occupations in Blair County are Office & Administration (7,536 | 13.1%), and Sales & Related (5,006 | 8.7%).
Sales and Office Occupations by Sex
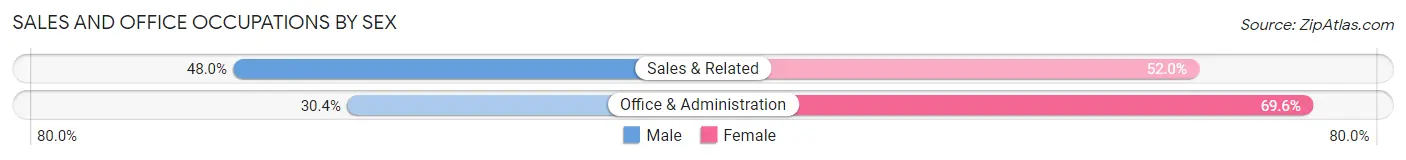
| Occupation | Male | Female |
| Sales & Related | 2,401 (48.0%) | 2,605 (52.0%) |
| Office & Administration | 2,294 (30.4%) | 5,242 (69.6%) |
| Total (Category) | 4,695 (37.4%) | 7,847 (62.6%) |
| Total (Overall) | 30,210 (52.5%) | 27,296 (47.5%) |
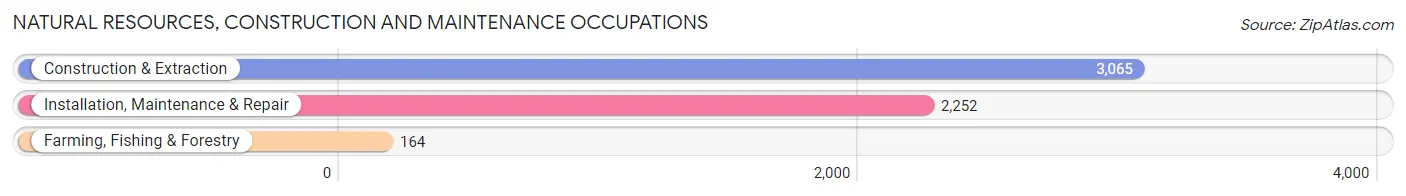
Natural Resources, Construction and Maintenance Occupations
The most common Natural Resources, Construction and Maintenance occupations in Blair County are Construction & Extraction (3,065 | 5.3%), Installation, Maintenance & Repair (2,252 | 3.9%), and Farming, Fishing & Forestry (164 | 0.3%).
Natural Resources, Construction and Maintenance Occupations by Sex
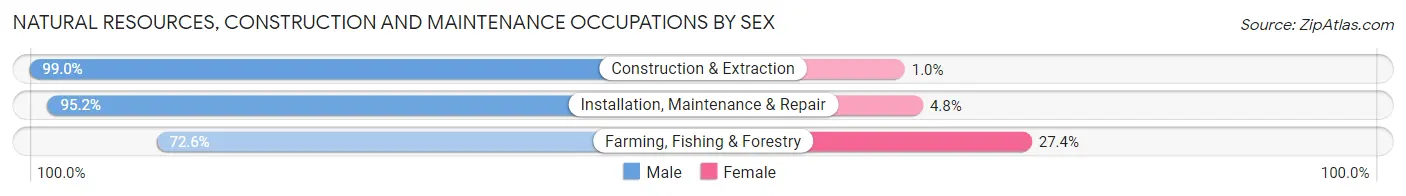
| Occupation | Male | Female |
| Farming, Fishing & Forestry | 119 (72.6%) | 45 (27.4%) |
| Construction & Extraction | 3,034 (99.0%) | 31 (1.0%) |
| Installation, Maintenance & Repair | 2,144 (95.2%) | 108 (4.8%) |
| Total (Category) | 5,297 (96.6%) | 184 (3.4%) |
| Total (Overall) | 30,210 (52.5%) | 27,296 (47.5%) |
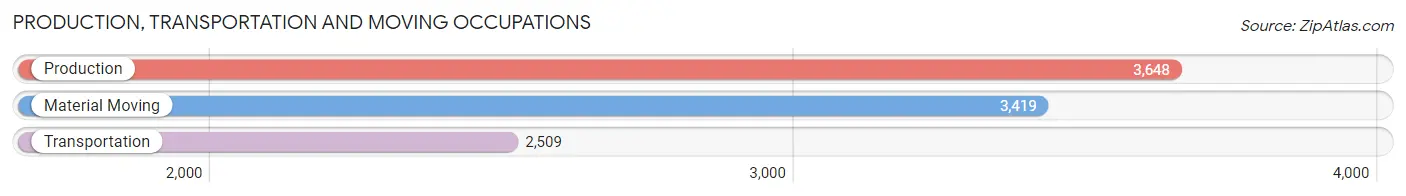
Production, Transportation and Moving Occupations
The most common Production, Transportation and Moving occupations in Blair County are Production (3,648 | 6.3%), Material Moving (3,419 | 5.9%), and Transportation (2,509 | 4.4%).
Production, Transportation and Moving Occupations by Sex
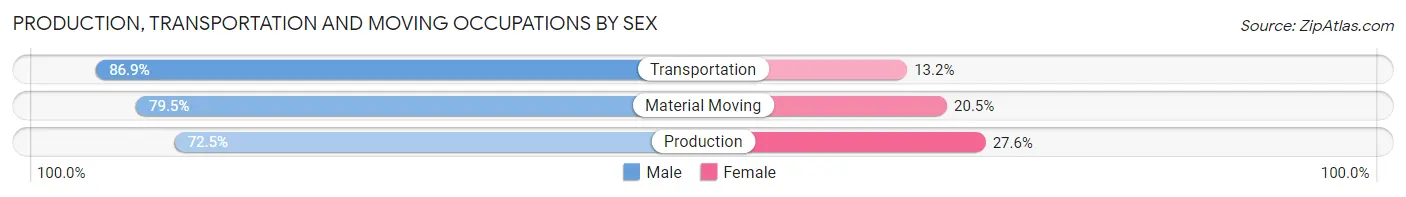
| Occupation | Male | Female |
| Production | 2,643 (72.5%) | 1,005 (27.6%) |
| Transportation | 2,179 (86.9%) | 330 (13.2%) |
| Material Moving | 2,719 (79.5%) | 700 (20.5%) |
| Total (Category) | 7,541 (78.7%) | 2,035 (21.2%) |
| Total (Overall) | 30,210 (52.5%) | 27,296 (47.5%) |
Employment Industries by Sex in Blair County
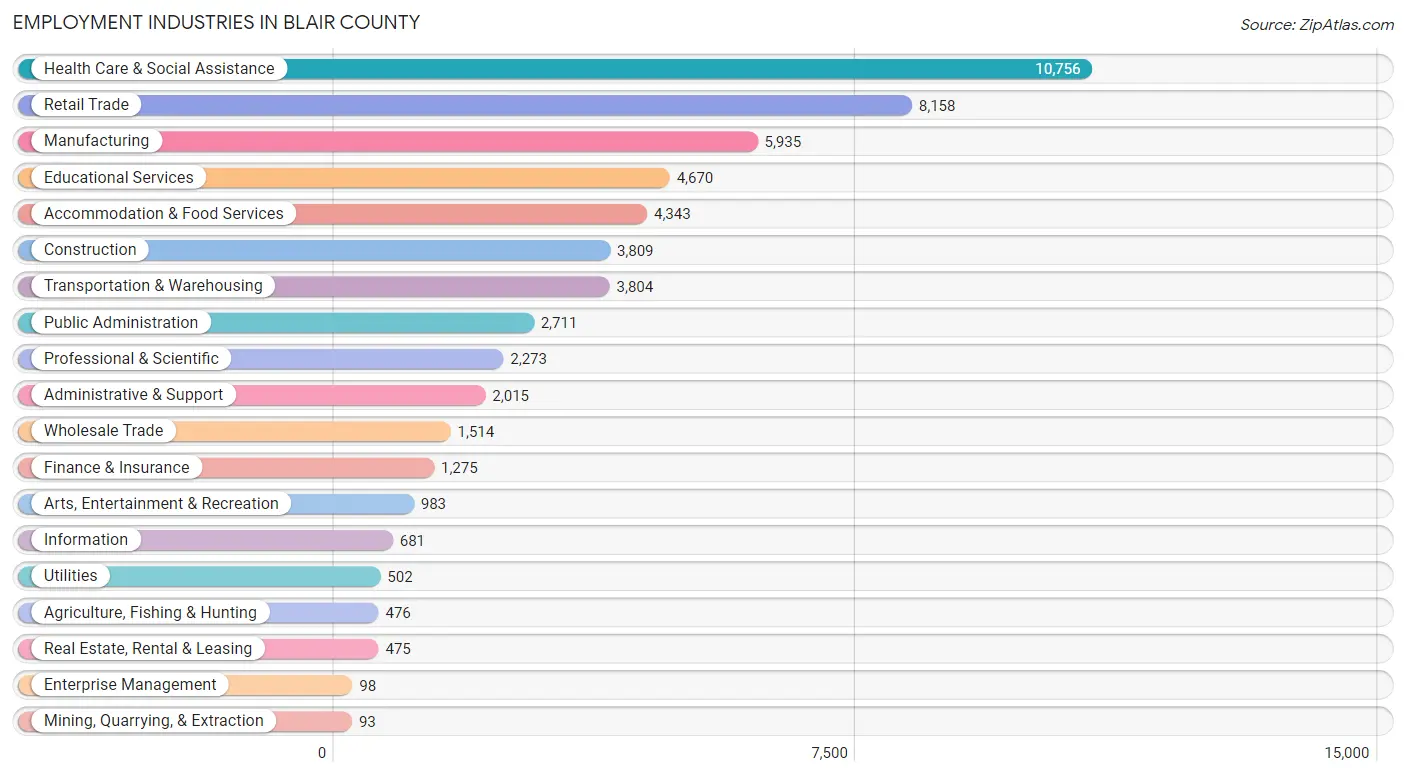
Employment Industries in Blair County
The major employment industries in Blair County include Health Care & Social Assistance (10,756 | 18.7%), Retail Trade (8,158 | 14.2%), Manufacturing (5,935 | 10.3%), Educational Services (4,670 | 8.1%), and Accommodation & Food Services (4,343 | 7.5%).
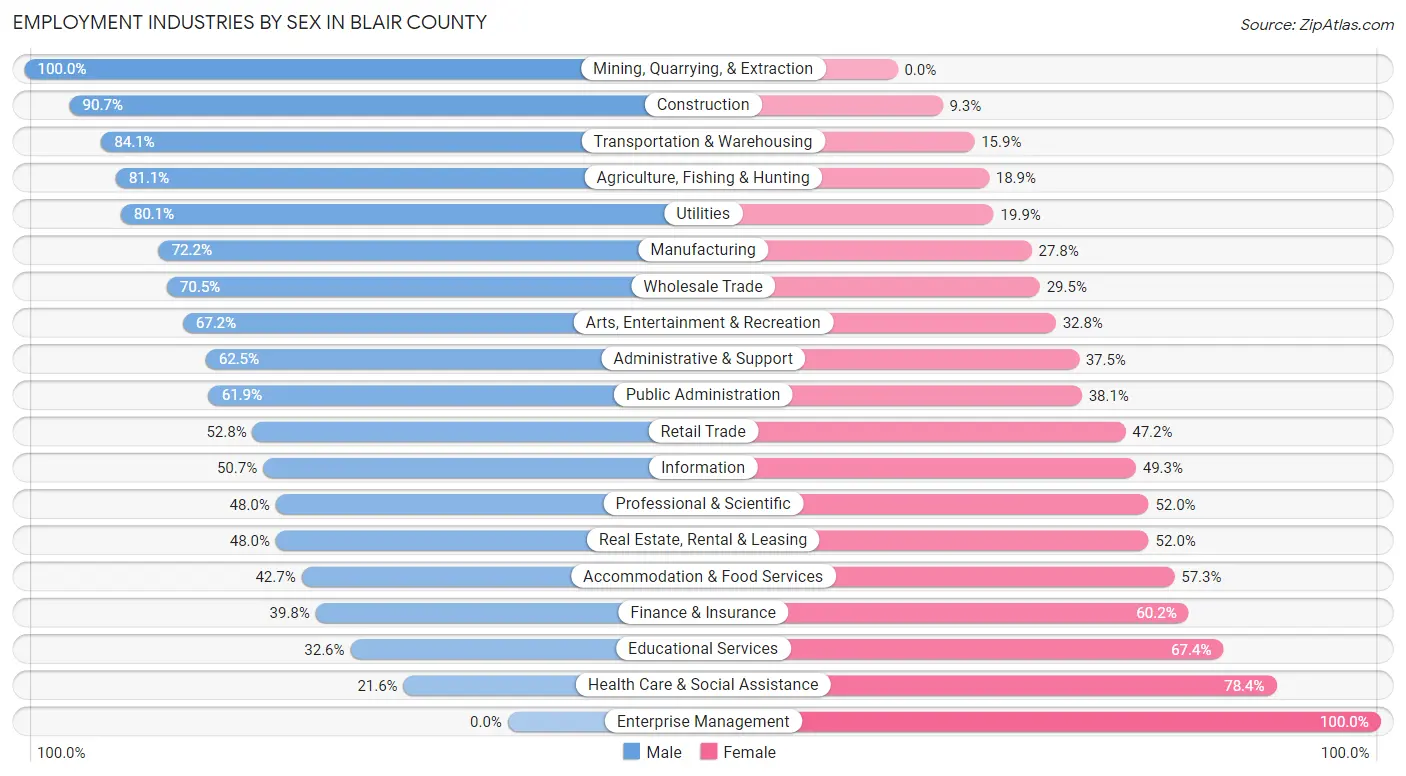
Employment Industries by Sex in Blair County
The Blair County industries that see more men than women are Mining, Quarrying, & Extraction (100.0%), Construction (90.7%), and Transportation & Warehousing (84.1%), whereas the industries that tend to have a higher number of women are Enterprise Management (100.0%), Health Care & Social Assistance (78.4%), and Educational Services (67.4%).
| Industry | Male | Female |
| Agriculture, Fishing & Hunting | 386 (81.1%) | 90 (18.9%) |
| Mining, Quarrying, & Extraction | 93 (100.0%) | 0 (0.0%) |
| Construction | 3,454 (90.7%) | 355 (9.3%) |
| Manufacturing | 4,287 (72.2%) | 1,648 (27.8%) |
| Wholesale Trade | 1,068 (70.5%) | 446 (29.5%) |
| Retail Trade | 4,310 (52.8%) | 3,848 (47.2%) |
| Transportation & Warehousing | 3,199 (84.1%) | 605 (15.9%) |
| Utilities | 402 (80.1%) | 100 (19.9%) |
| Information | 345 (50.7%) | 336 (49.3%) |
| Finance & Insurance | 507 (39.8%) | 768 (60.2%) |
| Real Estate, Rental & Leasing | 228 (48.0%) | 247 (52.0%) |
| Professional & Scientific | 1,092 (48.0%) | 1,181 (52.0%) |
| Enterprise Management | 0 (0.0%) | 98 (100.0%) |
| Administrative & Support | 1,259 (62.5%) | 756 (37.5%) |
| Educational Services | 1,521 (32.6%) | 3,149 (67.4%) |
| Health Care & Social Assistance | 2,321 (21.6%) | 8,435 (78.4%) |
| Arts, Entertainment & Recreation | 661 (67.2%) | 322 (32.8%) |
| Accommodation & Food Services | 1,854 (42.7%) | 2,489 (57.3%) |
| Public Administration | 1,677 (61.9%) | 1,034 (38.1%) |
| Total | 30,210 (52.5%) | 27,296 (47.5%) |
Education in Blair County
School Enrollment in Blair County
The most common levels of schooling among the 25,571 students in Blair County are middle school (5,876 | 23.0%), elementary school (5,873 | 23.0%), and high school (5,856 | 22.9%).
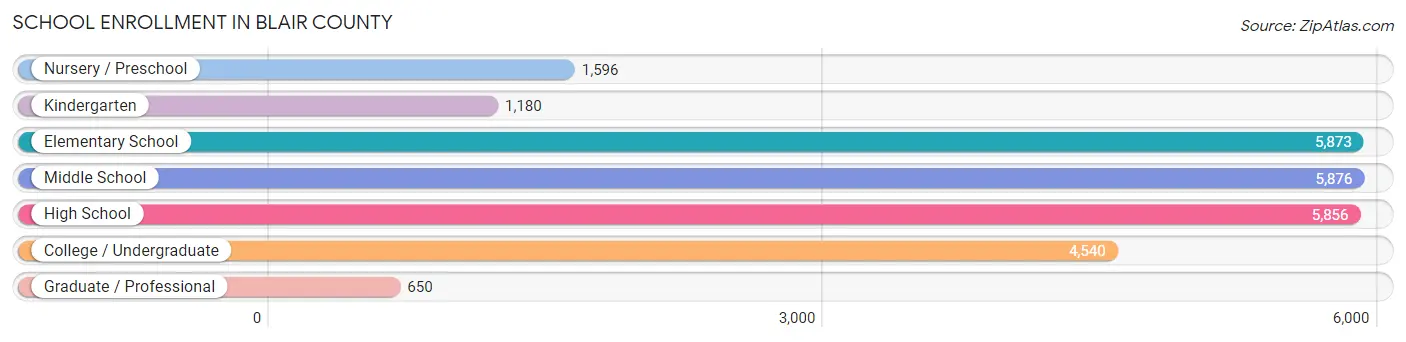
| School Level | # Students | % Students |
| Nursery / Preschool | 1,596 | 6.2% |
| Kindergarten | 1,180 | 4.6% |
| Elementary School | 5,873 | 23.0% |
| Middle School | 5,876 | 23.0% |
| High School | 5,856 | 22.9% |
| College / Undergraduate | 4,540 | 17.7% |
| Graduate / Professional | 650 | 2.5% |
| Total | 25,571 | 100.0% |
School Enrollment by Age by Funding Source in Blair County
Out of a total of 25,571 students who are enrolled in schools in Blair County, 3,503 (13.7%) attend a private institution, while the remaining 22,068 (86.3%) are enrolled in public schools. The age group of 35 years and over has the highest likelihood of being enrolled in private schools, with 323 (33.4% in the age bracket) enrolled. Conversely, the age group of 10 to 14 year olds has the lowest likelihood of being enrolled in a private school, with 6,459 (89.1% in the age bracket) attending a public institution.
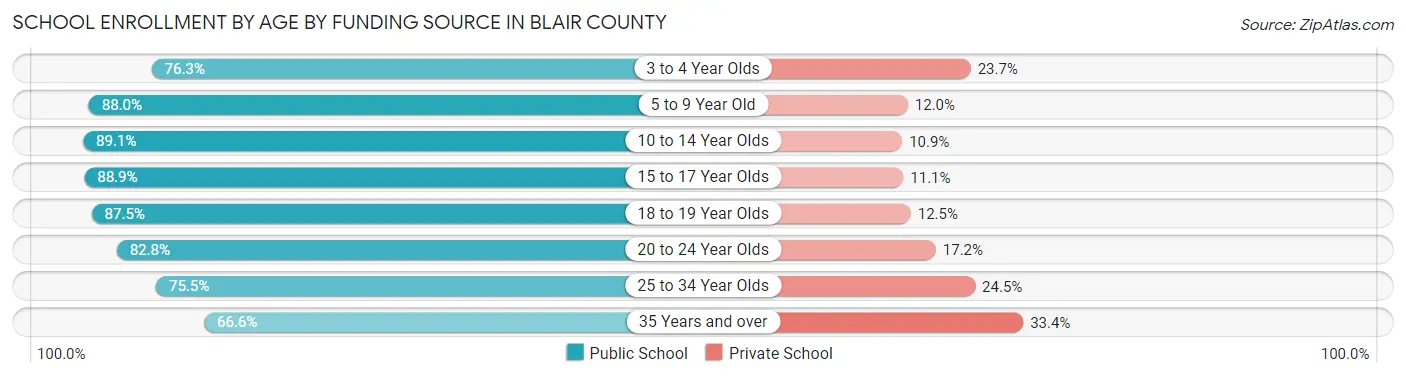
| Age Bracket | Public School | Private School |
| 3 to 4 Year Olds | 968 (76.3%) | 300 (23.7%) |
| 5 to 9 Year Old | 5,740 (88.0%) | 780 (12.0%) |
| 10 to 14 Year Olds | 6,459 (89.1%) | 790 (10.9%) |
| 15 to 17 Year Olds | 3,645 (88.9%) | 456 (11.1%) |
| 18 to 19 Year Olds | 2,638 (87.5%) | 377 (12.5%) |
| 20 to 24 Year Olds | 1,307 (82.8%) | 271 (17.2%) |
| 25 to 34 Year Olds | 660 (75.5%) | 214 (24.5%) |
| 35 Years and over | 643 (66.6%) | 323 (33.4%) |
| Total | 22,068 (86.3%) | 3,503 (13.7%) |
Educational Attainment by Field of Study in Blair County
Education (4,433 | 20.6%), business (3,978 | 18.5%), science & technology (3,608 | 16.8%), arts & humanities (1,776 | 8.3%), and engineering (1,211 | 5.6%) are the most common fields of study among 21,495 individuals in Blair County who have obtained a bachelor's degree or higher.
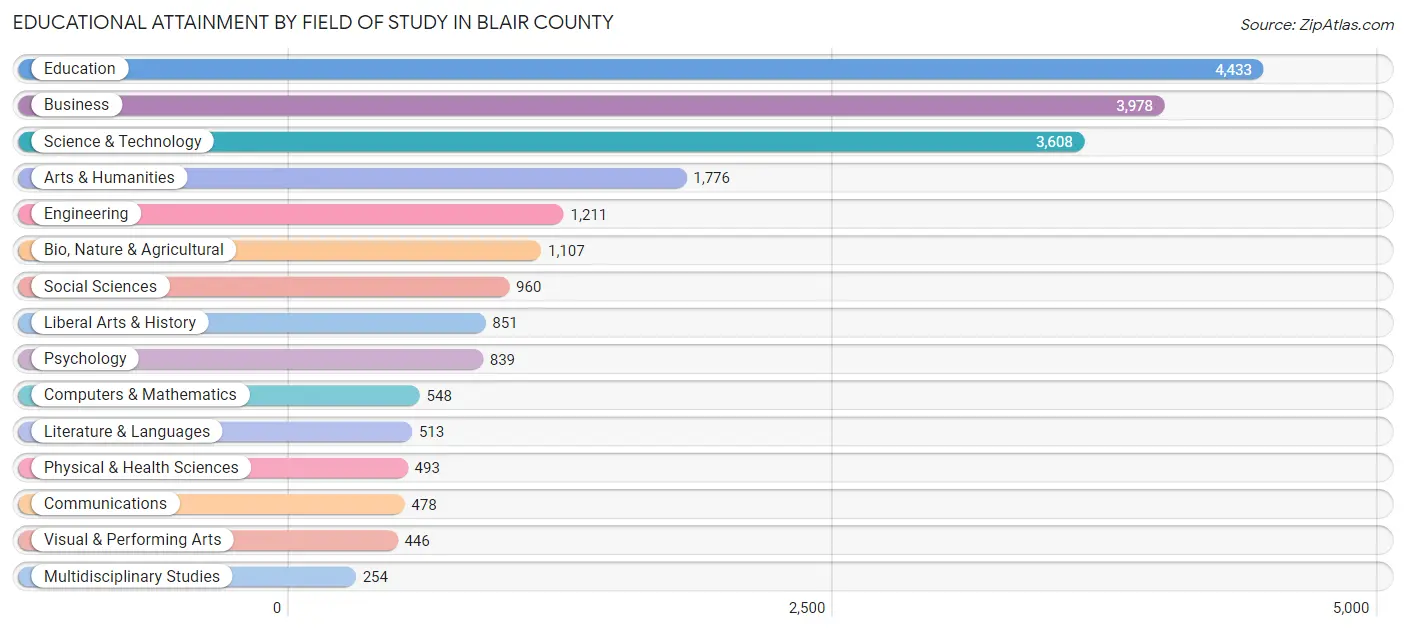
| Field of Study | # Graduates | % Graduates |
| Computers & Mathematics | 548 | 2.5% |
| Bio, Nature & Agricultural | 1,107 | 5.1% |
| Physical & Health Sciences | 493 | 2.3% |
| Psychology | 839 | 3.9% |
| Social Sciences | 960 | 4.5% |
| Engineering | 1,211 | 5.6% |
| Multidisciplinary Studies | 254 | 1.2% |
| Science & Technology | 3,608 | 16.8% |
| Business | 3,978 | 18.5% |
| Education | 4,433 | 20.6% |
| Literature & Languages | 513 | 2.4% |
| Liberal Arts & History | 851 | 4.0% |
| Visual & Performing Arts | 446 | 2.1% |
| Communications | 478 | 2.2% |
| Arts & Humanities | 1,776 | 8.3% |
| Total | 21,495 | 100.0% |
Transportation & Commute in Blair County
Vehicle Availability by Sex in Blair County
The most prevalent vehicle ownership categories in Blair County are males with 2 vehicles (12,515, accounting for 42.5%) and females with 2 vehicles (10,844, making up 46.9%).
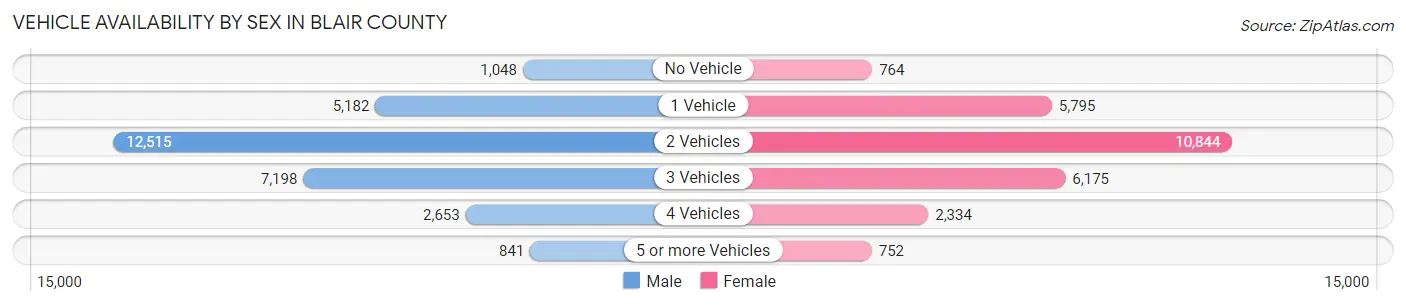
| Vehicles Available | Male | Female |
| No Vehicle | 1,048 (3.6%) | 764 (2.9%) |
| 1 Vehicle | 5,182 (17.6%) | 5,795 (21.7%) |
| 2 Vehicles | 12,515 (42.5%) | 10,844 (40.7%) |
| 3 Vehicles | 7,198 (24.4%) | 6,175 (23.2%) |
| 4 Vehicles | 2,653 (9.0%) | 2,334 (8.7%) |
| 5 or more Vehicles | 841 (2.9%) | 752 (2.8%) |
| Total | 29,437 (100.0%) | 26,664 (100.0%) |
Commute Time in Blair County
The most frequently occuring commute durations in Blair County are 10 to 14 minutes (10,456 commuters, 19.6%), 15 to 19 minutes (9,760 commuters, 18.3%), and 5 to 9 minutes (8,037 commuters, 15.1%).
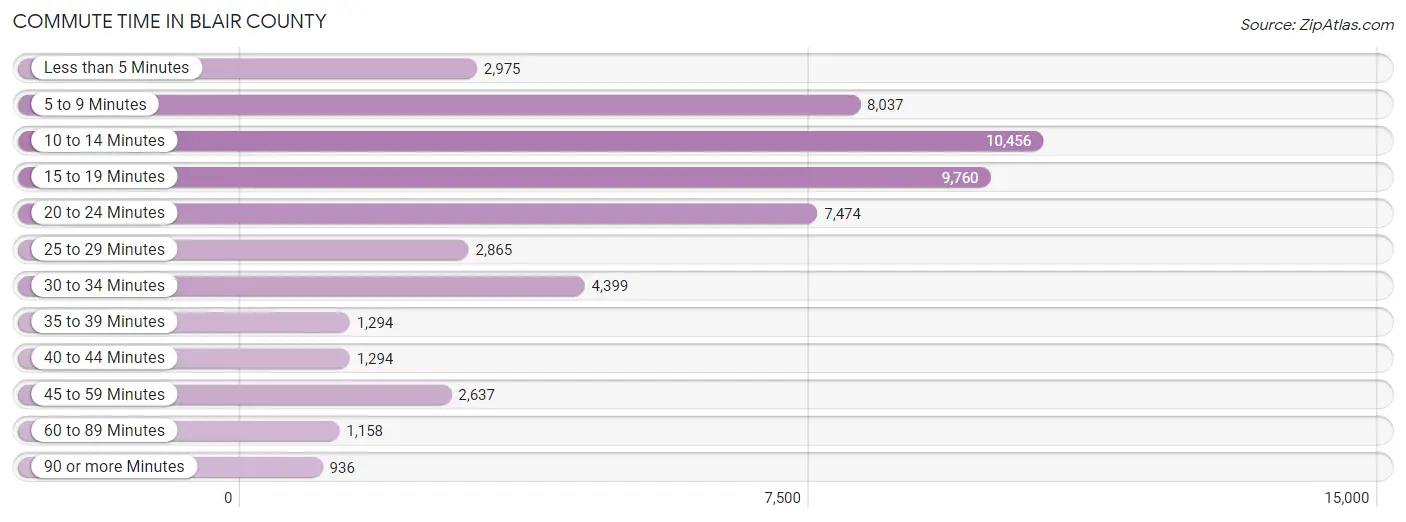
| Commute Time | # Commuters | % Commuters |
| Less than 5 Minutes | 2,975 | 5.6% |
| 5 to 9 Minutes | 8,037 | 15.1% |
| 10 to 14 Minutes | 10,456 | 19.6% |
| 15 to 19 Minutes | 9,760 | 18.3% |
| 20 to 24 Minutes | 7,474 | 14.0% |
| 25 to 29 Minutes | 2,865 | 5.4% |
| 30 to 34 Minutes | 4,399 | 8.3% |
| 35 to 39 Minutes | 1,294 | 2.4% |
| 40 to 44 Minutes | 1,294 | 2.4% |
| 45 to 59 Minutes | 2,637 | 5.0% |
| 60 to 89 Minutes | 1,158 | 2.2% |
| 90 or more Minutes | 936 | 1.8% |
Commute Time by Sex in Blair County
The most common commute times in Blair County are 15 to 19 minutes (5,249 commuters, 18.6%) for males and 10 to 14 minutes (5,536 commuters, 22.1%) for females.
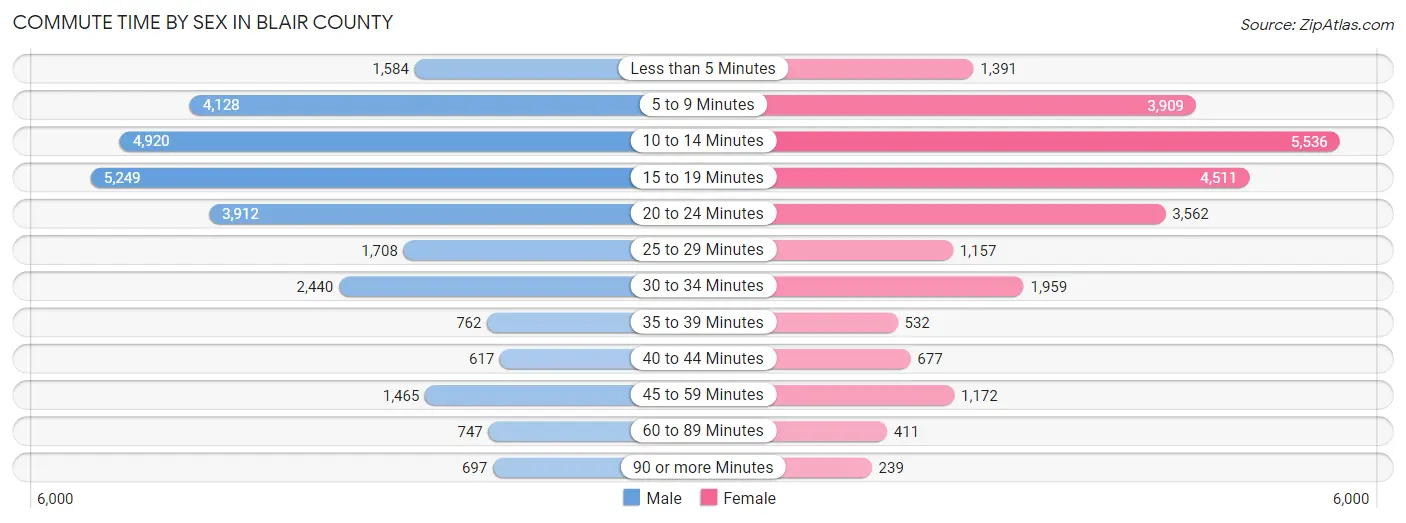
| Commute Time | Male | Female |
| Less than 5 Minutes | 1,584 (5.6%) | 1,391 (5.6%) |
| 5 to 9 Minutes | 4,128 (14.6%) | 3,909 (15.6%) |
| 10 to 14 Minutes | 4,920 (17.4%) | 5,536 (22.1%) |
| 15 to 19 Minutes | 5,249 (18.6%) | 4,511 (18.0%) |
| 20 to 24 Minutes | 3,912 (13.9%) | 3,562 (14.2%) |
| 25 to 29 Minutes | 1,708 (6.0%) | 1,157 (4.6%) |
| 30 to 34 Minutes | 2,440 (8.6%) | 1,959 (7.8%) |
| 35 to 39 Minutes | 762 (2.7%) | 532 (2.1%) |
| 40 to 44 Minutes | 617 (2.2%) | 677 (2.7%) |
| 45 to 59 Minutes | 1,465 (5.2%) | 1,172 (4.7%) |
| 60 to 89 Minutes | 747 (2.6%) | 411 (1.6%) |
| 90 or more Minutes | 697 (2.5%) | 239 (0.9%) |
Time of Departure to Work by Sex in Blair County
The most frequent times of departure to work in Blair County are 7:00 AM to 7:29 AM (3,486, 12.3%) for males and 7:00 AM to 7:29 AM (4,235, 16.9%) for females.
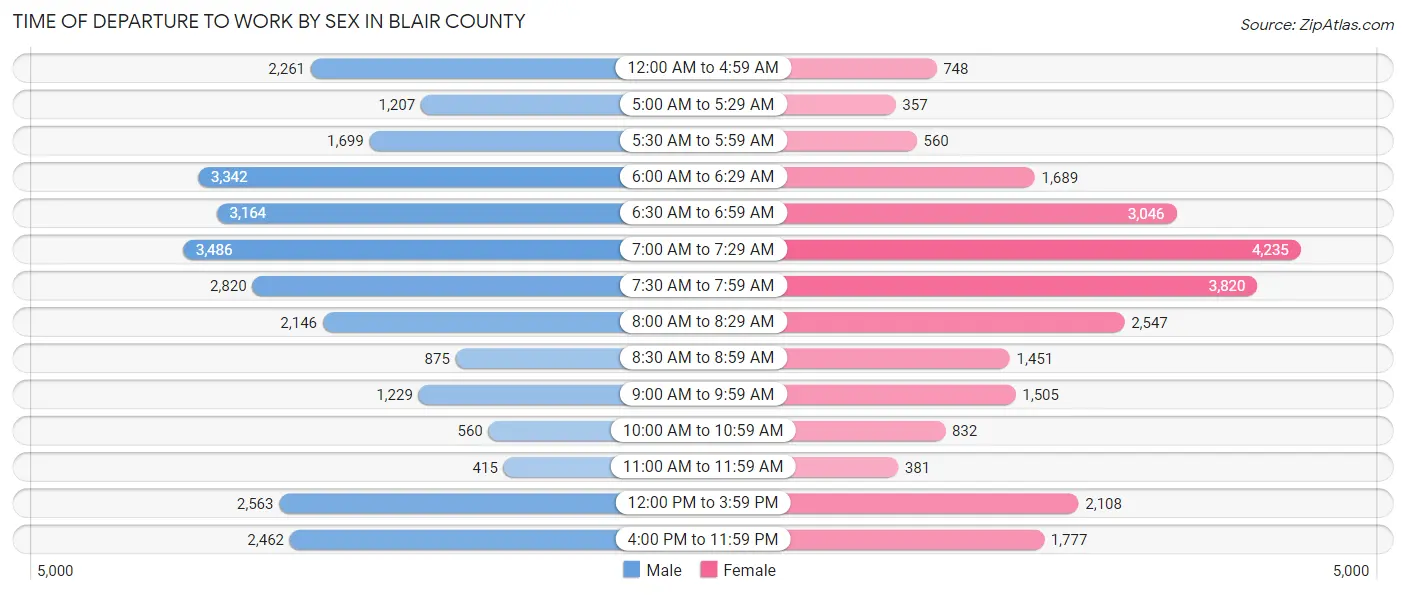
| Time of Departure | Male | Female |
| 12:00 AM to 4:59 AM | 2,261 (8.0%) | 748 (3.0%) |
| 5:00 AM to 5:29 AM | 1,207 (4.3%) | 357 (1.4%) |
| 5:30 AM to 5:59 AM | 1,699 (6.0%) | 560 (2.2%) |
| 6:00 AM to 6:29 AM | 3,342 (11.8%) | 1,689 (6.7%) |
| 6:30 AM to 6:59 AM | 3,164 (11.2%) | 3,046 (12.2%) |
| 7:00 AM to 7:29 AM | 3,486 (12.3%) | 4,235 (16.9%) |
| 7:30 AM to 7:59 AM | 2,820 (10.0%) | 3,820 (15.2%) |
| 8:00 AM to 8:29 AM | 2,146 (7.6%) | 2,547 (10.2%) |
| 8:30 AM to 8:59 AM | 875 (3.1%) | 1,451 (5.8%) |
| 9:00 AM to 9:59 AM | 1,229 (4.3%) | 1,505 (6.0%) |
| 10:00 AM to 10:59 AM | 560 (2.0%) | 832 (3.3%) |
| 11:00 AM to 11:59 AM | 415 (1.5%) | 381 (1.5%) |
| 12:00 PM to 3:59 PM | 2,563 (9.1%) | 2,108 (8.4%) |
| 4:00 PM to 11:59 PM | 2,462 (8.7%) | 1,777 (7.1%) |
| Total | 28,229 (100.0%) | 25,056 (100.0%) |
Housing Occupancy in Blair County
Occupancy by Ownership in Blair County
Of the total 50,587 dwellings in Blair County, owner-occupied units account for 36,671 (72.5%), while renter-occupied units make up 13,916 (27.5%).
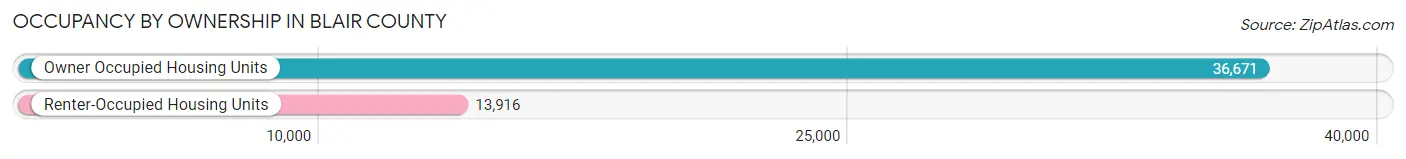
| Occupancy | # Housing Units | % Housing Units |
| Owner Occupied Housing Units | 36,671 | 72.5% |
| Renter-Occupied Housing Units | 13,916 | 27.5% |
| Total Occupied Housing Units | 50,587 | 100.0% |
Occupancy by Household Size in Blair County
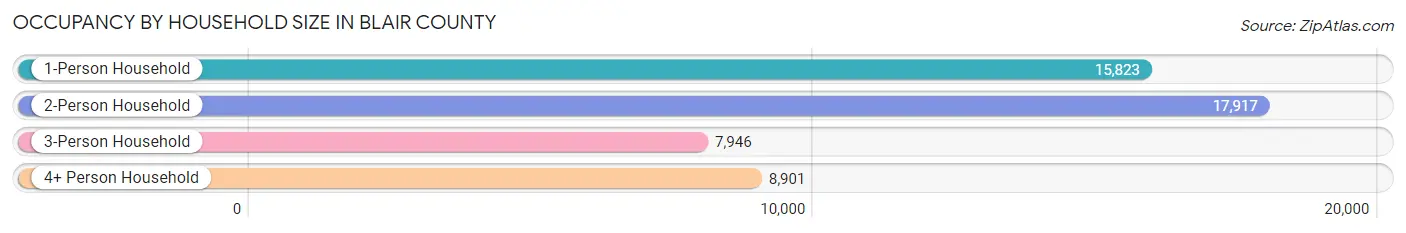
| Household Size | # Housing Units | % Housing Units |
| 1-Person Household | 15,823 | 31.3% |
| 2-Person Household | 17,917 | 35.4% |
| 3-Person Household | 7,946 | 15.7% |
| 4+ Person Household | 8,901 | 17.6% |
| Total Housing Units | 50,587 | 100.0% |
Occupancy by Ownership by Household Size in Blair County
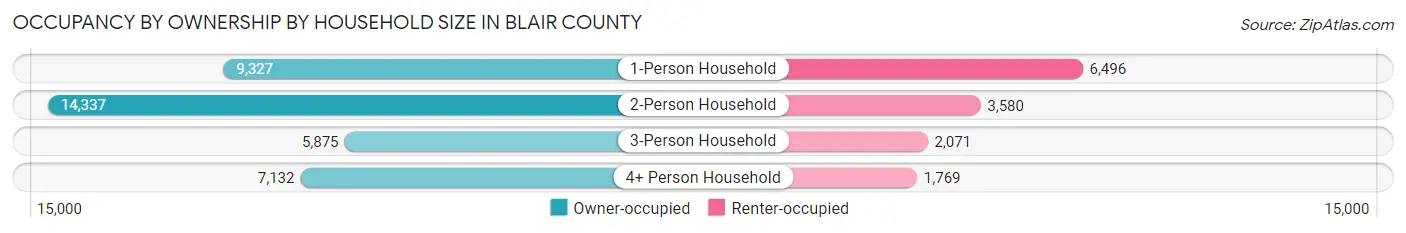
| Household Size | Owner-occupied | Renter-occupied |
| 1-Person Household | 9,327 (59.0%) | 6,496 (41.0%) |
| 2-Person Household | 14,337 (80.0%) | 3,580 (20.0%) |
| 3-Person Household | 5,875 (73.9%) | 2,071 (26.1%) |
| 4+ Person Household | 7,132 (80.1%) | 1,769 (19.9%) |
| Total Housing Units | 36,671 (72.5%) | 13,916 (27.5%) |
Occupancy by Educational Attainment in Blair County
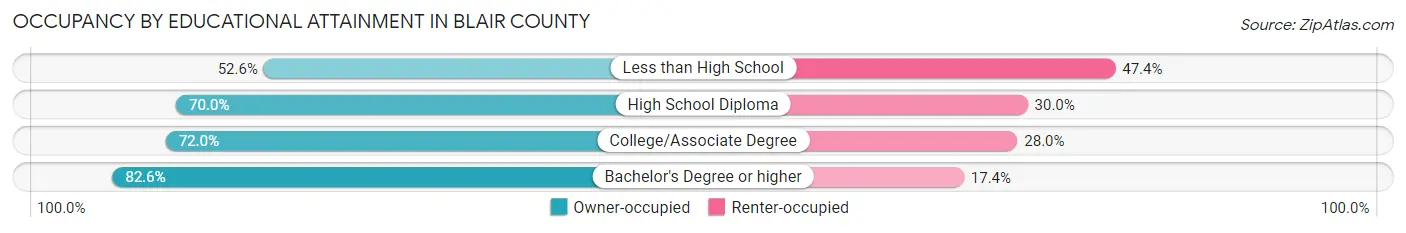
| Household Size | Owner-occupied | Renter-occupied |
| Less than High School | 1,838 (52.6%) | 1,657 (47.4%) |
| High School Diploma | 14,784 (70.0%) | 6,344 (30.0%) |
| College/Associate Degree | 9,515 (72.0%) | 3,698 (28.0%) |
| Bachelor's Degree or higher | 10,534 (82.6%) | 2,217 (17.4%) |
Occupancy by Age of Householder in Blair County
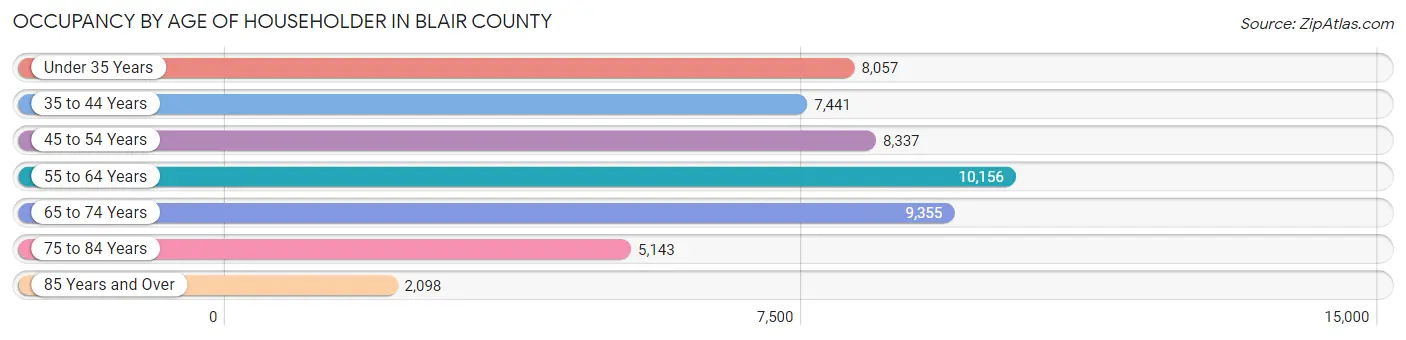
| Age Bracket | # Households | % Households |
| Under 35 Years | 8,057 | 15.9% |
| 35 to 44 Years | 7,441 | 14.7% |
| 45 to 54 Years | 8,337 | 16.5% |
| 55 to 64 Years | 10,156 | 20.1% |
| 65 to 74 Years | 9,355 | 18.5% |
| 75 to 84 Years | 5,143 | 10.2% |
| 85 Years and Over | 2,098 | 4.2% |
| Total | 50,587 | 100.0% |
Housing Finances in Blair County
Median Income by Occupancy in Blair County
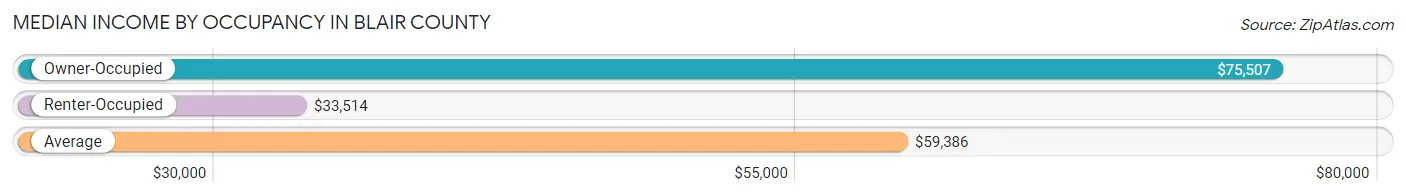
| Occupancy Type | # Households | Median Income |
| Owner-Occupied | 36,671 (72.5%) | $75,507 |
| Renter-Occupied | 13,916 (27.5%) | $33,514 |
| Average | 50,587 (100.0%) | $59,386 |
Occupancy by Householder Income Bracket in Blair County
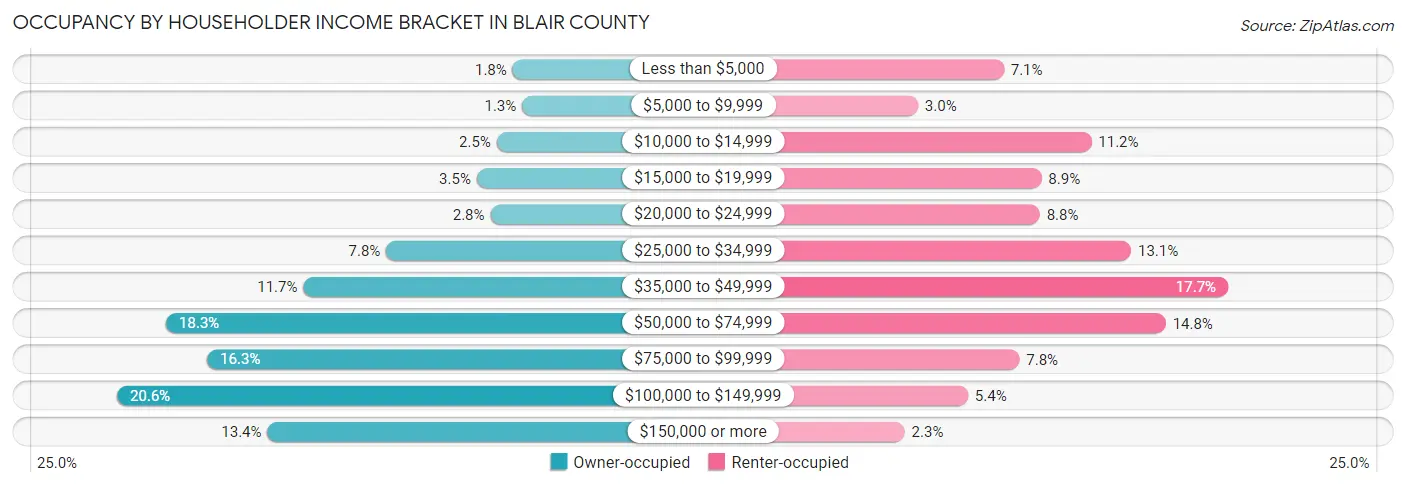
| Income Bracket | Owner-occupied | Renter-occupied |
| Less than $5,000 | 645 (1.8%) | 983 (7.1%) |
| $5,000 to $9,999 | 480 (1.3%) | 414 (3.0%) |
| $10,000 to $14,999 | 923 (2.5%) | 1,563 (11.2%) |
| $15,000 to $19,999 | 1,273 (3.5%) | 1,232 (8.8%) |
| $20,000 to $24,999 | 1,033 (2.8%) | 1,220 (8.8%) |
| $25,000 to $34,999 | 2,854 (7.8%) | 1,826 (13.1%) |
| $35,000 to $49,999 | 4,300 (11.7%) | 2,468 (17.7%) |
| $50,000 to $74,999 | 6,700 (18.3%) | 2,055 (14.8%) |
| $75,000 to $99,999 | 5,980 (16.3%) | 1,085 (7.8%) |
| $100,000 to $149,999 | 7,553 (20.6%) | 745 (5.3%) |
| $150,000 or more | 4,930 (13.4%) | 325 (2.3%) |
| Total | 36,671 (100.0%) | 13,916 (100.0%) |
Monthly Housing Cost Tiers in Blair County
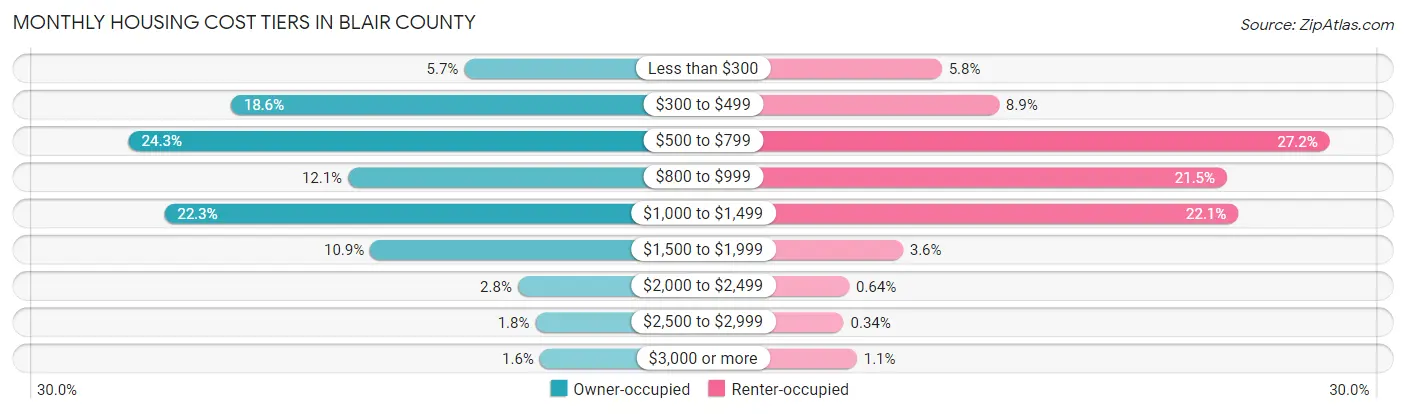
| Monthly Cost | Owner-occupied | Renter-occupied |
| Less than $300 | 2,096 (5.7%) | 801 (5.8%) |
| $300 to $499 | 6,823 (18.6%) | 1,241 (8.9%) |
| $500 to $799 | 8,891 (24.2%) | 3,783 (27.2%) |
| $800 to $999 | 4,451 (12.1%) | 2,993 (21.5%) |
| $1,000 to $1,499 | 8,171 (22.3%) | 3,079 (22.1%) |
| $1,500 to $1,999 | 4,003 (10.9%) | 503 (3.6%) |
| $2,000 to $2,499 | 1,013 (2.8%) | 89 (0.6%) |
| $2,500 to $2,999 | 655 (1.8%) | 47 (0.3%) |
| $3,000 or more | 568 (1.5%) | 149 (1.1%) |
| Total | 36,671 (100.0%) | 13,916 (100.0%) |
Physical Housing Characteristics in Blair County
Housing Structures in Blair County
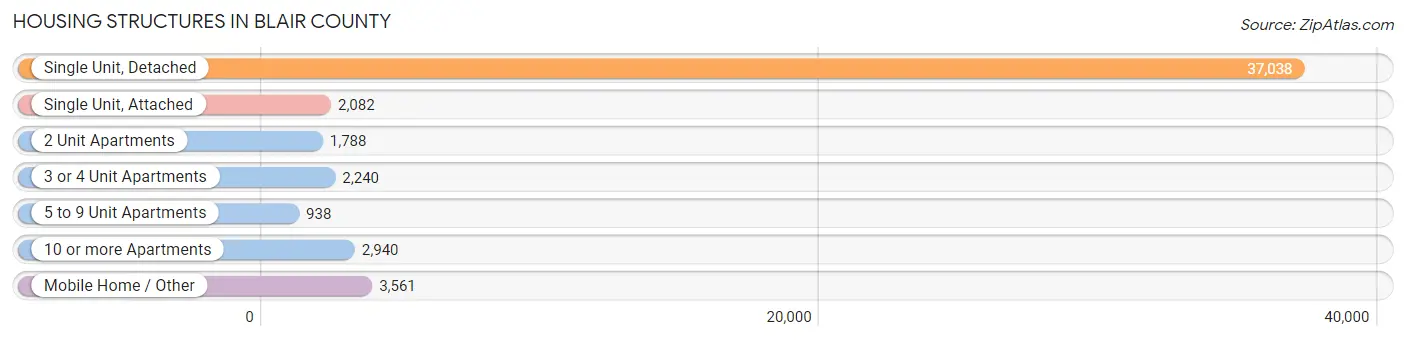
| Structure Type | # Housing Units | % Housing Units |
| Single Unit, Detached | 37,038 | 73.2% |
| Single Unit, Attached | 2,082 | 4.1% |
| 2 Unit Apartments | 1,788 | 3.5% |
| 3 or 4 Unit Apartments | 2,240 | 4.4% |
| 5 to 9 Unit Apartments | 938 | 1.8% |
| 10 or more Apartments | 2,940 | 5.8% |
| Mobile Home / Other | 3,561 | 7.0% |
| Total | 50,587 | 100.0% |
Housing Structures by Occupancy in Blair County
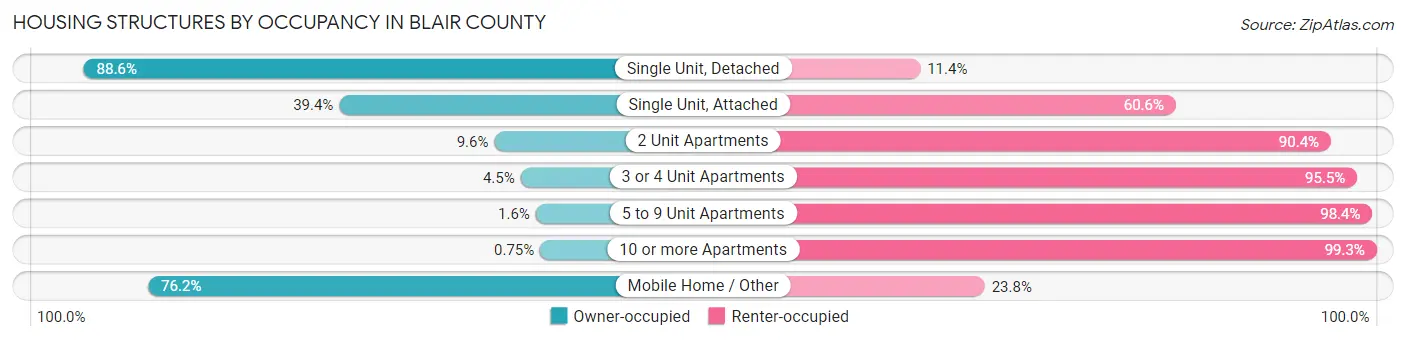
| Structure Type | Owner-occupied | Renter-occupied |
| Single Unit, Detached | 32,827 (88.6%) | 4,211 (11.4%) |
| Single Unit, Attached | 821 (39.4%) | 1,261 (60.6%) |
| 2 Unit Apartments | 171 (9.6%) | 1,617 (90.4%) |
| 3 or 4 Unit Apartments | 101 (4.5%) | 2,139 (95.5%) |
| 5 to 9 Unit Apartments | 15 (1.6%) | 923 (98.4%) |
| 10 or more Apartments | 22 (0.7%) | 2,918 (99.3%) |
| Mobile Home / Other | 2,714 (76.2%) | 847 (23.8%) |
| Total | 36,671 (72.5%) | 13,916 (27.5%) |
Housing Structures by Number of Rooms in Blair County
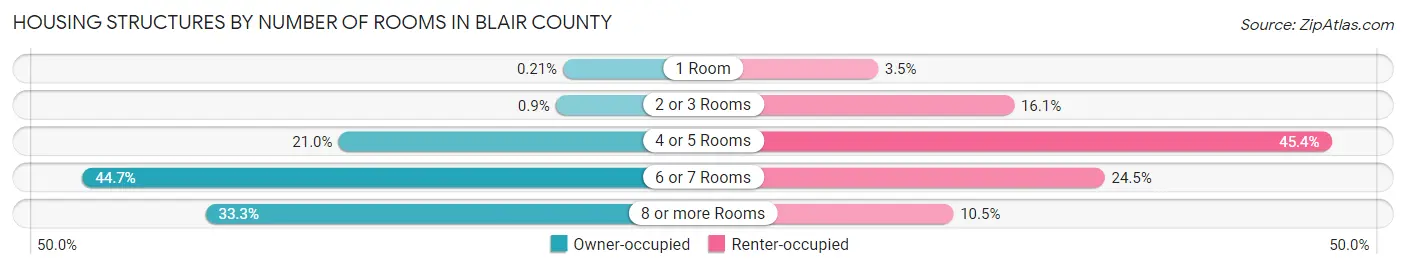
| Number of Rooms | Owner-occupied | Renter-occupied |
| 1 Room | 77 (0.2%) | 487 (3.5%) |
| 2 or 3 Rooms | 331 (0.9%) | 2,241 (16.1%) |
| 4 or 5 Rooms | 7,693 (21.0%) | 6,323 (45.4%) |
| 6 or 7 Rooms | 16,374 (44.7%) | 3,407 (24.5%) |
| 8 or more Rooms | 12,196 (33.3%) | 1,458 (10.5%) |
| Total | 36,671 (100.0%) | 13,916 (100.0%) |
Housing Structure by Heating Type in Blair County
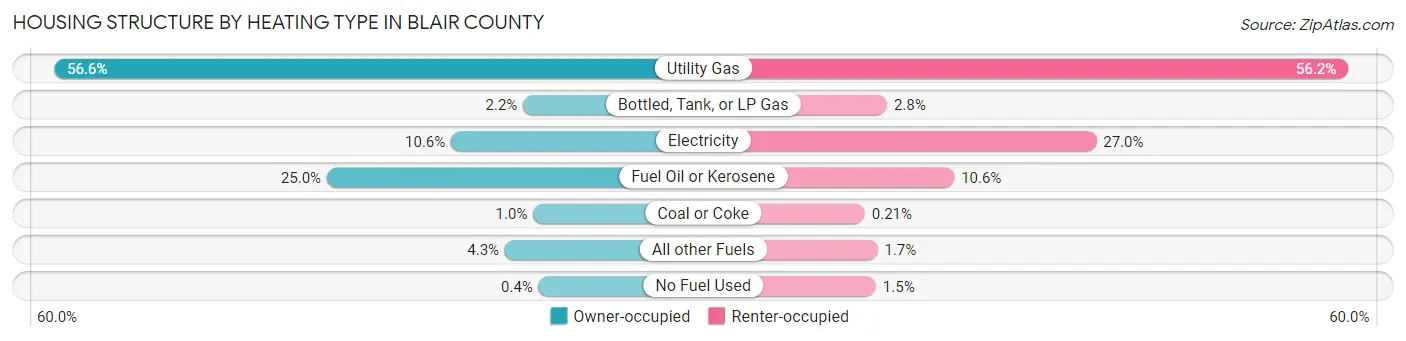
| Heating Type | Owner-occupied | Renter-occupied |
| Utility Gas | 20,747 (56.6%) | 7,826 (56.2%) |
| Bottled, Tank, or LP Gas | 803 (2.2%) | 386 (2.8%) |
| Electricity | 3,869 (10.5%) | 3,763 (27.0%) |
| Fuel Oil or Kerosene | 9,148 (24.9%) | 1,471 (10.6%) |
| Coal or Coke | 377 (1.0%) | 29 (0.2%) |
| All other Fuels | 1,582 (4.3%) | 234 (1.7%) |
| No Fuel Used | 145 (0.4%) | 207 (1.5%) |
| Total | 36,671 (100.0%) | 13,916 (100.0%) |
Household Vehicle Usage in Blair County
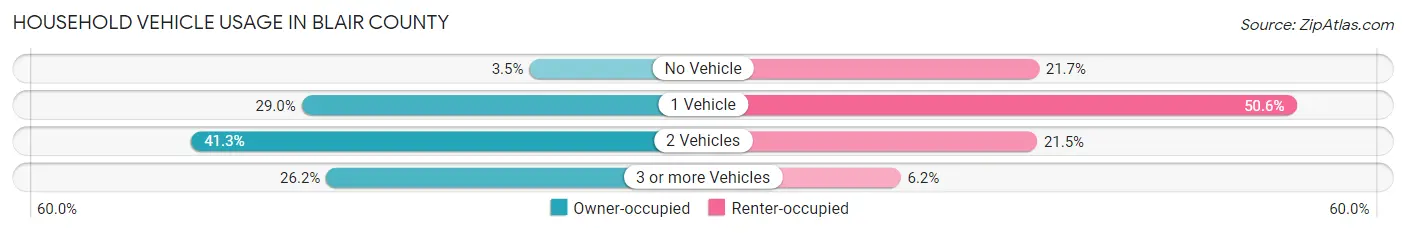
| Vehicles per Household | Owner-occupied | Renter-occupied |
| No Vehicle | 1,270 (3.5%) | 3,022 (21.7%) |
| 1 Vehicle | 10,629 (29.0%) | 7,034 (50.5%) |
| 2 Vehicles | 15,157 (41.3%) | 2,993 (21.5%) |
| 3 or more Vehicles | 9,615 (26.2%) | 867 (6.2%) |
| Total | 36,671 (100.0%) | 13,916 (100.0%) |
Real Estate & Mortgages in Blair County
Real Estate and Mortgage Overview in Blair County
| Characteristic | Without Mortgage | With Mortgage |
| Housing Units | 16,670 | 20,001 |
| Median Property Value | $134,500 | $157,400 |
| Median Household Income | $54,957 | $3,305 |
| Monthly Housing Costs | $491 | $510 |
| Real Estate Taxes | $1,602 | $266 |
Property Value by Mortgage Status in Blair County
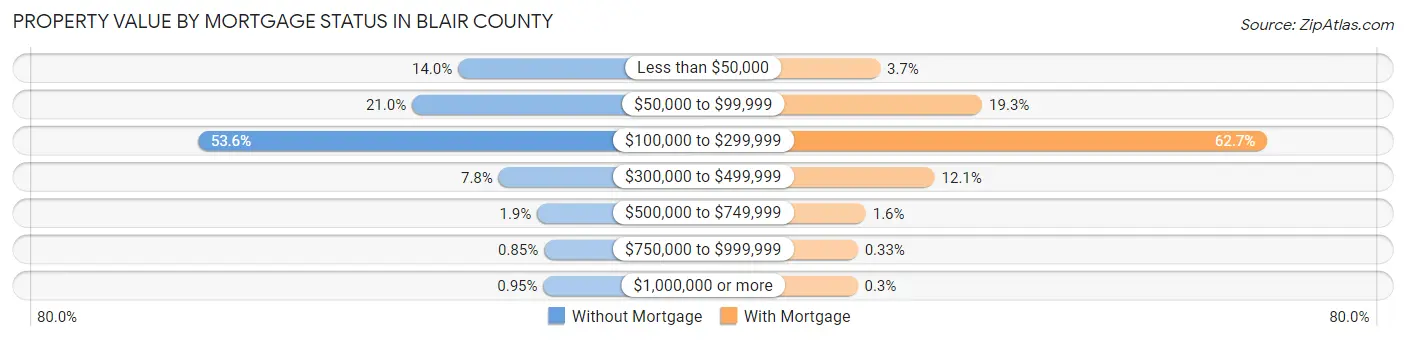
| Property Value | Without Mortgage | With Mortgage |
| Less than $50,000 | 2,325 (14.0%) | 747 (3.7%) |
| $50,000 to $99,999 | 3,496 (21.0%) | 3,859 (19.3%) |
| $100,000 to $299,999 | 8,936 (53.6%) | 12,544 (62.7%) |
| $300,000 to $499,999 | 1,296 (7.8%) | 2,410 (12.0%) |
| $500,000 to $749,999 | 317 (1.9%) | 313 (1.6%) |
| $750,000 to $999,999 | 141 (0.9%) | 67 (0.3%) |
| $1,000,000 or more | 159 (0.9%) | 61 (0.3%) |
| Total | 16,670 (100.0%) | 20,001 (100.0%) |
Household Income by Mortgage Status in Blair County
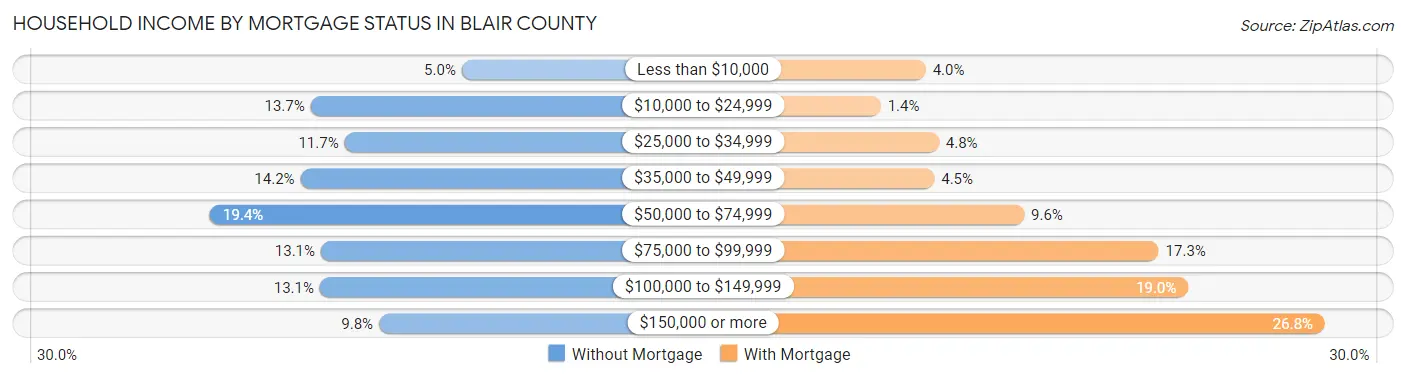
| Household Income | Without Mortgage | With Mortgage |
| Less than $10,000 | 837 (5.0%) | 803 (4.0%) |
| $10,000 to $24,999 | 2,277 (13.7%) | 288 (1.4%) |
| $25,000 to $34,999 | 1,954 (11.7%) | 952 (4.8%) |
| $35,000 to $49,999 | 2,374 (14.2%) | 900 (4.5%) |
| $50,000 to $74,999 | 3,236 (19.4%) | 1,926 (9.6%) |
| $75,000 to $99,999 | 2,178 (13.1%) | 3,464 (17.3%) |
| $100,000 to $149,999 | 2,189 (13.1%) | 3,802 (19.0%) |
| $150,000 or more | 1,625 (9.8%) | 5,364 (26.8%) |
| Total | 16,670 (100.0%) | 20,001 (100.0%) |
Property Value to Household Income Ratio in Blair County
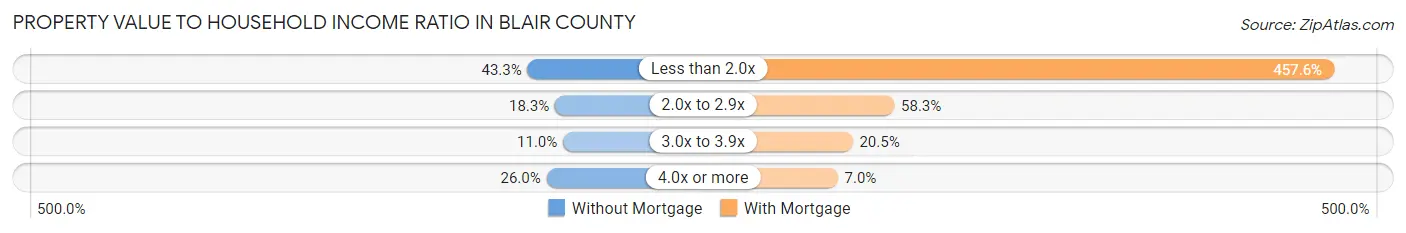
| Value-to-Income Ratio | Without Mortgage | With Mortgage |
| Less than 2.0x | 7,218 (43.3%) | 91,529 (457.6%) |
| 2.0x to 2.9x | 3,051 (18.3%) | 11,654 (58.3%) |
| 3.0x to 3.9x | 1,834 (11.0%) | 4,097 (20.5%) |
| 4.0x or more | 4,340 (26.0%) | 1,400 (7.0%) |
| Total | 16,670 (100.0%) | 20,001 (100.0%) |
Real Estate Taxes by Mortgage Status in Blair County
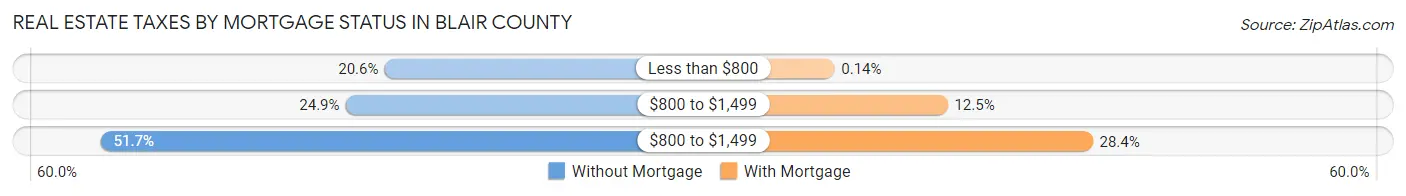
| Property Taxes | Without Mortgage | With Mortgage |
| Less than $800 | 3,430 (20.6%) | 28 (0.1%) |
| $800 to $1,499 | 4,142 (24.8%) | 2,509 (12.5%) |
| $800 to $1,499 | 8,611 (51.7%) | 5,688 (28.4%) |
| Total | 16,670 (100.0%) | 20,001 (100.0%) |
Health & Disability in Blair County
Health Insurance Coverage by Age in Blair County
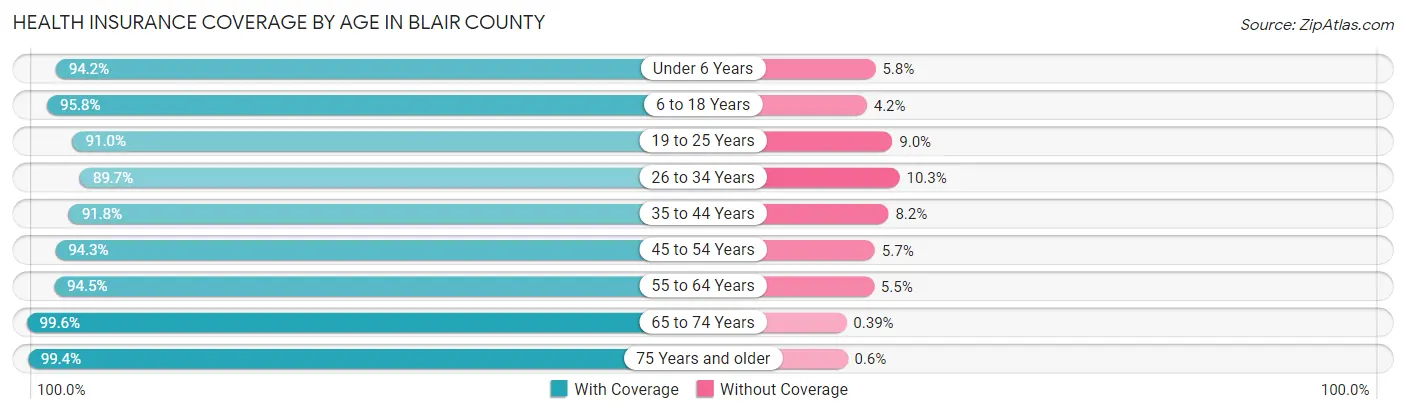
| Age Bracket | With Coverage | Without Coverage |
| Under 6 Years | 6,843 (94.2%) | 423 (5.8%) |
| 6 to 18 Years | 18,892 (95.8%) | 826 (4.2%) |
| 19 to 25 Years | 8,897 (91.0%) | 876 (9.0%) |
| 26 to 34 Years | 11,754 (89.7%) | 1,349 (10.3%) |
| 35 to 44 Years | 13,013 (91.8%) | 1,169 (8.2%) |
| 45 to 54 Years | 14,243 (94.3%) | 863 (5.7%) |
| 55 to 64 Years | 16,571 (94.5%) | 969 (5.5%) |
| 65 to 74 Years | 14,538 (99.6%) | 57 (0.4%) |
| 75 Years and older | 9,587 (99.4%) | 58 (0.6%) |
| Total | 114,338 (94.6%) | 6,590 (5.4%) |
Health Insurance Coverage by Citizenship Status in Blair County
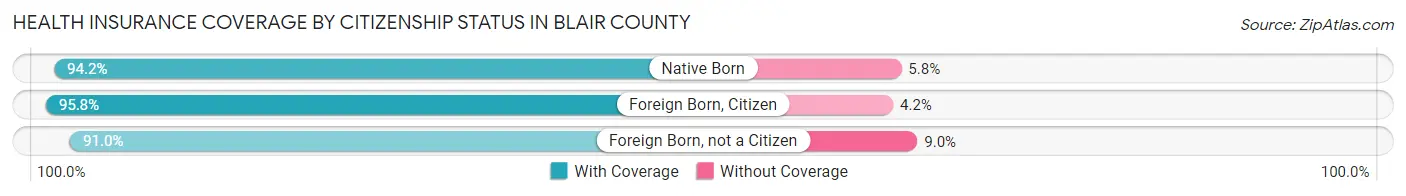
| Citizenship Status | With Coverage | Without Coverage |
| Native Born | 6,843 (94.2%) | 423 (5.8%) |
| Foreign Born, Citizen | 18,892 (95.8%) | 826 (4.2%) |
| Foreign Born, not a Citizen | 8,897 (91.0%) | 876 (9.0%) |
Health Insurance Coverage by Household Income in Blair County
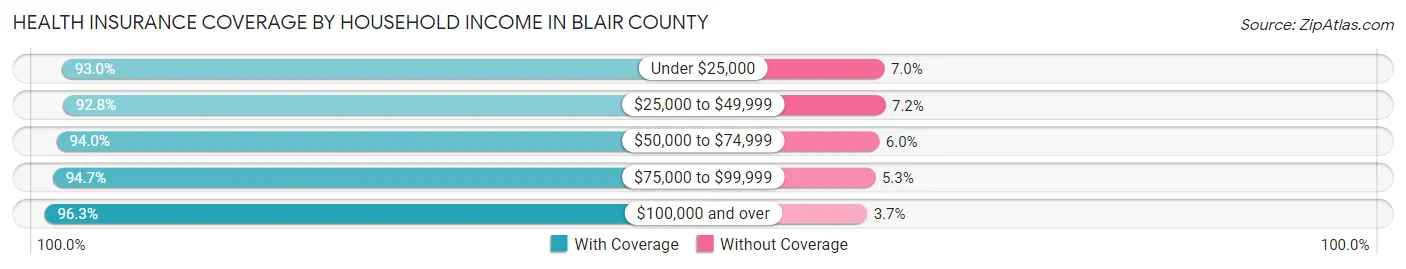
| Household Income | With Coverage | Without Coverage |
| Under $25,000 | 13,996 (93.0%) | 1,049 (7.0%) |
| $25,000 to $49,999 | 20,763 (92.8%) | 1,601 (7.2%) |
| $50,000 to $74,999 | 19,492 (94.0%) | 1,245 (6.0%) |
| $75,000 to $99,999 | 17,994 (94.7%) | 1,004 (5.3%) |
| $100,000 and over | 40,278 (96.3%) | 1,560 (3.7%) |
Public vs Private Health Insurance Coverage by Age in Blair County
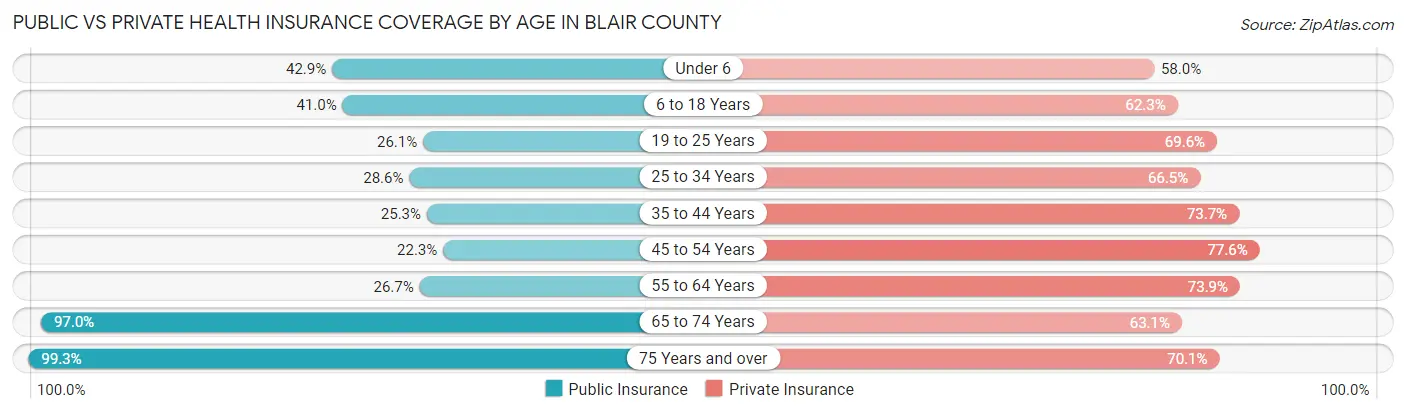
| Age Bracket | Public Insurance | Private Insurance |
| Under 6 | 3,119 (42.9%) | 4,211 (58.0%) |
| 6 to 18 Years | 8,080 (41.0%) | 12,287 (62.3%) |
| 19 to 25 Years | 2,546 (26.1%) | 6,804 (69.6%) |
| 25 to 34 Years | 3,746 (28.6%) | 8,713 (66.5%) |
| 35 to 44 Years | 3,592 (25.3%) | 10,453 (73.7%) |
| 45 to 54 Years | 3,371 (22.3%) | 11,714 (77.5%) |
| 55 to 64 Years | 4,681 (26.7%) | 12,958 (73.9%) |
| 65 to 74 Years | 14,151 (97.0%) | 9,210 (63.1%) |
| 75 Years and over | 9,577 (99.3%) | 6,759 (70.1%) |
| Total | 52,863 (43.7%) | 83,109 (68.7%) |
Disability Status by Sex by Age in Blair County
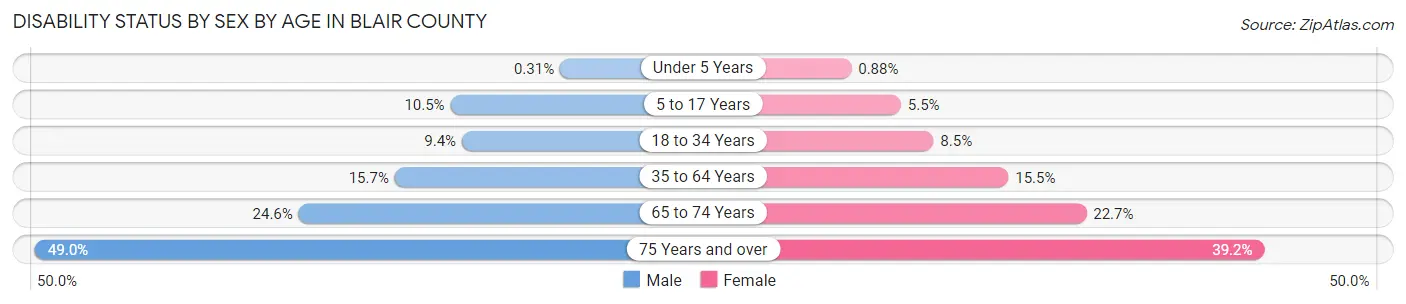
| Age Bracket | Male | Female |
| Under 5 Years | 10 (0.3%) | 26 (0.9%) |
| 5 to 17 Years | 1,005 (10.5%) | 494 (5.5%) |
| 18 to 34 Years | 1,219 (9.4%) | 1,035 (8.5%) |
| 35 to 64 Years | 3,644 (15.7%) | 3,637 (15.4%) |
| 65 to 74 Years | 1,698 (24.6%) | 1,744 (22.7%) |
| 75 Years and over | 1,957 (49.0%) | 2,217 (39.2%) |
Disability Class by Sex by Age in Blair County
Disability Class: Hearing Difficulty
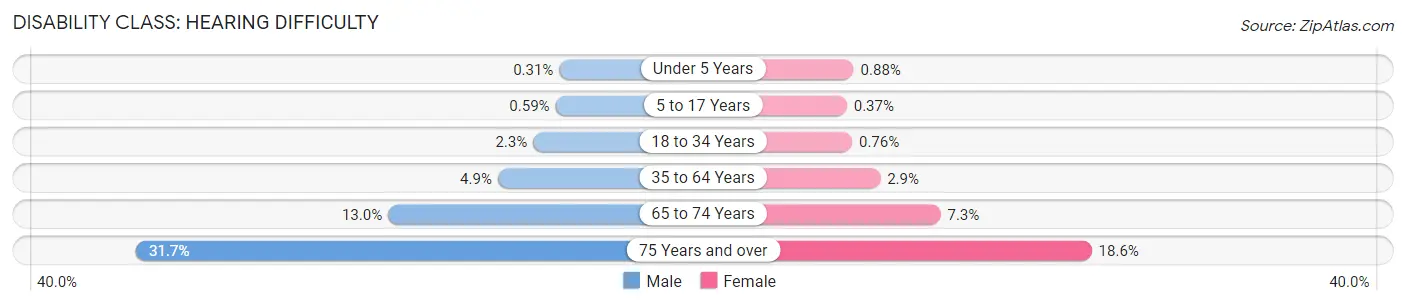
| Age Bracket | Male | Female |
| Under 5 Years | 10 (0.3%) | 26 (0.9%) |
| 5 to 17 Years | 57 (0.6%) | 33 (0.4%) |
| 18 to 34 Years | 291 (2.2%) | 92 (0.8%) |
| 35 to 64 Years | 1,135 (4.9%) | 672 (2.9%) |
| 65 to 74 Years | 900 (13.0%) | 563 (7.3%) |
| 75 Years and over | 1,266 (31.7%) | 1,049 (18.5%) |
Disability Class: Vision Difficulty
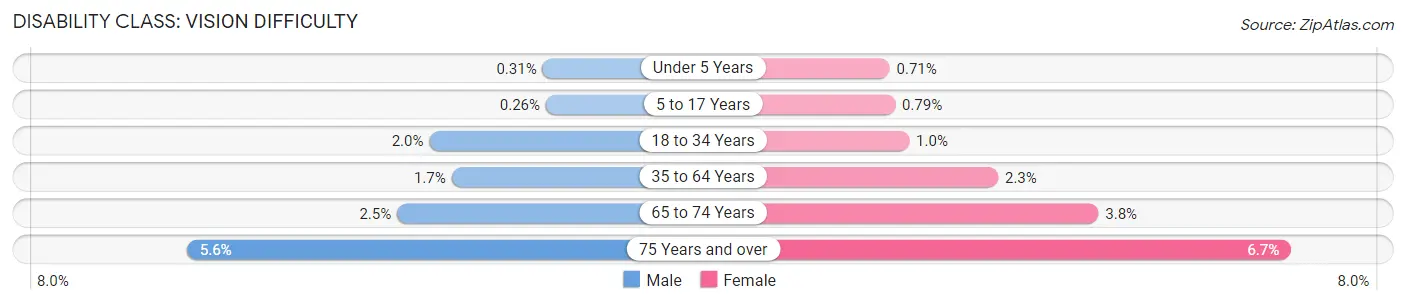
| Age Bracket | Male | Female |
| Under 5 Years | 10 (0.3%) | 21 (0.7%) |
| 5 to 17 Years | 25 (0.3%) | 71 (0.8%) |
| 18 to 34 Years | 258 (2.0%) | 122 (1.0%) |
| 35 to 64 Years | 387 (1.7%) | 546 (2.3%) |
| 65 to 74 Years | 171 (2.5%) | 293 (3.8%) |
| 75 Years and over | 223 (5.6%) | 377 (6.7%) |
Disability Class: Cognitive Difficulty
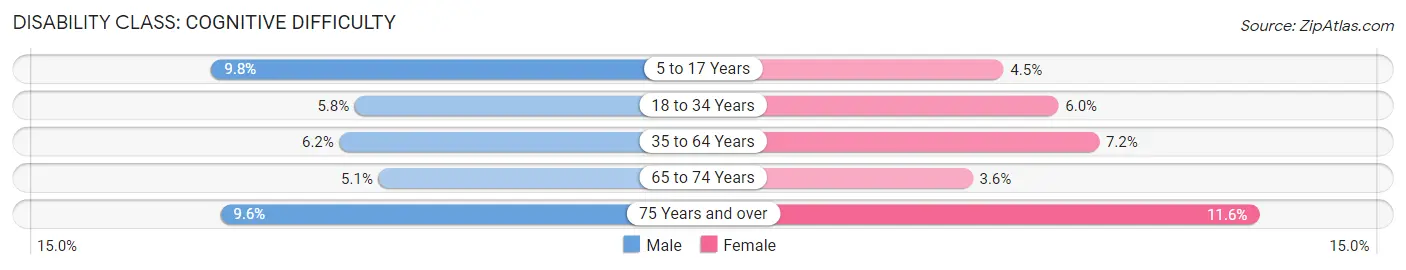
| Age Bracket | Male | Female |
| 5 to 17 Years | 939 (9.8%) | 405 (4.5%) |
| 18 to 34 Years | 751 (5.8%) | 734 (6.0%) |
| 35 to 64 Years | 1,452 (6.2%) | 1,685 (7.2%) |
| 65 to 74 Years | 355 (5.1%) | 280 (3.6%) |
| 75 Years and over | 381 (9.6%) | 657 (11.6%) |
Disability Class: Ambulatory Difficulty
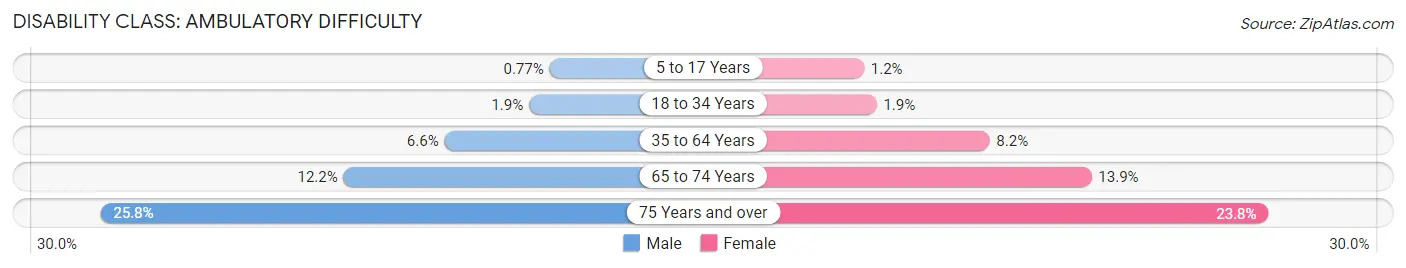
| Age Bracket | Male | Female |
| 5 to 17 Years | 74 (0.8%) | 111 (1.2%) |
| 18 to 34 Years | 248 (1.9%) | 235 (1.9%) |
| 35 to 64 Years | 1,542 (6.6%) | 1,935 (8.2%) |
| 65 to 74 Years | 846 (12.2%) | 1,068 (13.9%) |
| 75 Years and over | 1,029 (25.8%) | 1,343 (23.7%) |
Disability Class: Self-Care Difficulty
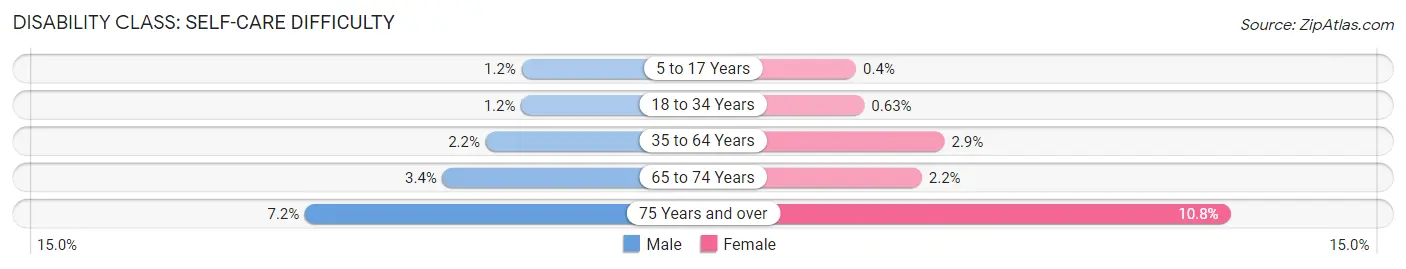
| Age Bracket | Male | Female |
| 5 to 17 Years | 111 (1.2%) | 36 (0.4%) |
| 18 to 34 Years | 152 (1.2%) | 77 (0.6%) |
| 35 to 64 Years | 503 (2.2%) | 673 (2.9%) |
| 65 to 74 Years | 232 (3.4%) | 171 (2.2%) |
| 75 Years and over | 287 (7.2%) | 612 (10.8%) |
Technology Access in Blair County
Computing Device Access in Blair County
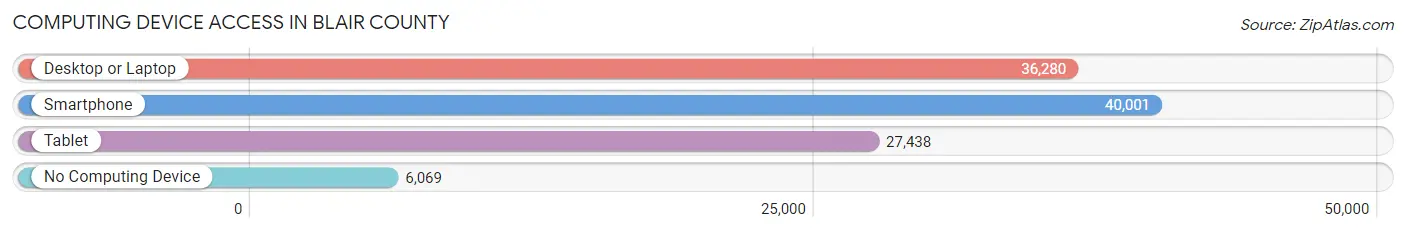
| Device Type | # Households | % Households |
| Desktop or Laptop | 36,280 | 71.7% |
| Smartphone | 40,001 | 79.1% |
| Tablet | 27,438 | 54.2% |
| No Computing Device | 6,069 | 12.0% |
| Total | 50,587 | 100.0% |
Internet Access in Blair County
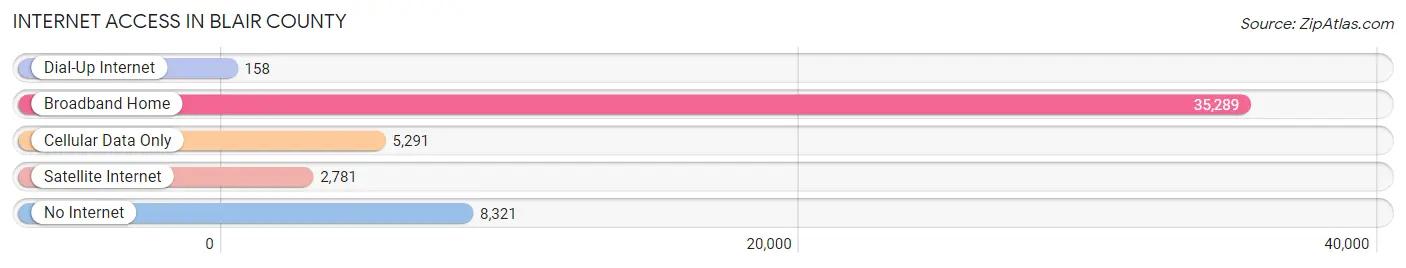
| Internet Type | # Households | % Households |
| Dial-Up Internet | 158 | 0.3% |
| Broadband Home | 35,289 | 69.8% |
| Cellular Data Only | 5,291 | 10.5% |
| Satellite Internet | 2,781 | 5.5% |
| No Internet | 8,321 | 16.5% |
| Total | 50,587 | 100.0% |
Blair County Summary
Blair County is located in the central region of Pennsylvania, and is part of the Altoona Metropolitan Statistical Area. The county was created in 1846 from parts of Huntingdon and Bedford counties. It is named after John Blair, a Pennsylvania Supreme Court justice. The county seat is Hollidaysburg.
Geography
Blair County is located in the Ridge and Valley region of the Appalachian Mountains. The county is bordered by Huntingdon County to the north, Bedford County to the east, Cambria County to the south, and Clearfield County to the west. The county is home to several mountain ranges, including the Allegheny Front, Tussey Mountain, and Brush Mountain. The county is also home to several rivers, including the Juniata River, Raystown Branch Juniata River, and Little Juniata River.
The county has a total area of 545 square miles, of which 543 square miles is land and 2.2 square miles is water. The county is home to several state parks, including Canoe Creek State Park, Greenwood Furnace State Park, and Prince Gallitzin State Park.
Demographics
As of the 2010 United States Census, there were 127,089 people, 50,845 households, and 33,945 families living in the county. The population density was 233.3 people per square mile. The racial makeup of the county was 97.2% White, 1.2% Black or African American, 0.2% Native American, 0.4% Asian, 0.1% Pacific Islander, 0.3% from other races, and 0.7% from two or more races. 1.4% of the population were Hispanic or Latino of any race.
There were 50,845 households, out of which 28.2% had children under the age of 18 living with them, 51.7% were married couples living together, 10.7% had a female householder with no husband present, and 33.2% were non-families. 28.7% of all households were made up of individuals, and 13.2% had someone living alone who was 65 years of age or older. The average household size was 2.41 and the average family size was 2.95.
The median age in the county was 41.3 years. 22.2% of residents were under the age of 18; 7.7% were between the ages of 18 and 24; 25.2% were from 25 to 44; 27.2% were from 45 to 64; and 17.7% were 65 years of age or older. The gender makeup of the county was 48.3% male and 51.7% female.
Economy
Blair County has a diverse economy, with a mix of manufacturing, retail, and service industries. The county is home to several major employers, including Sheetz, Inc., Penn State Altoona, and UPMC Altoona. The county is also home to several major manufacturing companies, including Alcoa, Armstrong World Industries, and JLG Industries.
The county has a strong agricultural sector, with dairy, poultry, and livestock production. The county is also home to several wineries and breweries, including Allegheny Cellars Winery and Gearhouse Brewing Company.
The median household income in the county was $45,945 in 2017, and the median family income was $56,945. The per capita income was $25,945. About 8.7% of families and 11.7% of the population were below the poverty line, including 16.2% of those under age 18 and 8.2% of those age 65 or over.
Conclusion
Blair County is a diverse county located in the central region of Pennsylvania. The county is home to several mountain ranges, rivers, and state parks, and has a diverse economy with a mix of manufacturing, retail, and service industries. The county has a population of 127,089, with a median household income of $45,945. The county is home to several major employers, and has a strong agricultural sector.
Common Questions
What is Per Capita Income in Blair County?
Per Capita income in Blair County is $33,585.
What is the Median Family Income in Blair County?
Median Family Income in Blair County is $80,754.
What is the Median Household income in Blair County?
Median Household Income in Blair County is $59,386.
What is Income or Wage Gap in Blair County?
Income or Wage Gap in Blair County is 25.1%.
Women in Blair County earn 74.9 cents for every dollar earned by a man.
What is Family Income Deficit in Blair County?
Family Income Deficit in Blair County is $9,990.
Families that are below poverty line in Blair County earn $9,990 less on average than the poverty threshold level.
What is Inequality or Gini Index in Blair County?
Inequality or Gini Index in Blair County is 0.45.
What is the Total Population of Blair County?
Total Population of Blair County is 122,640.
What is the Total Male Population of Blair County?
Total Male Population of Blair County is 60,452.
What is the Total Female Population of Blair County?
Total Female Population of Blair County is 62,188.
What is the Ratio of Males per 100 Females in Blair County?
There are 97.21 Males per 100 Females in Blair County.
What is the Ratio of Females per 100 Males in Blair County?
There are 102.87 Females per 100 Males in Blair County.
What is the Median Population Age in Blair County?
Median Population Age in Blair County is 42.9 Years.
What is the Average Family Size in Blair County
Average Family Size in Blair County is 3.0 People.
What is the Average Household Size in Blair County
Average Household Size in Blair County is 2.4 People.
How Large is the Labor Force in Blair County?
There are 60,099 People in the Labor Forcein in Blair County.
What is the Percentage of People in the Labor Force in Blair County?
59.5% of People are in the Labor Force in Blair County.
What is the Unemployment Rate in Blair County?
Unemployment Rate in Blair County is 4.2%.