Bedford County, PA Map & Demographics
Bedford County Map
Bedford County Overview
$31,269
PER CAPITA INCOME
$75,149
AVG FAMILY INCOME
$58,337
AVG HOUSEHOLD INCOME
40.8%
WAGE / INCOME GAP [ % ]
59.2¢/ $1
WAGE / INCOME GAP [ $ ]
$9,407
FAMILY INCOME DEFICIT
0.43
INEQUALITY / GINI INDEX
47,613
TOTAL POPULATION
23,820
MALE POPULATION
23,793
FEMALE POPULATION
100.11
MALES / 100 FEMALES
99.89
FEMALES / 100 MALES
47.3
MEDIAN AGE
3.0
AVG FAMILY SIZE
2.4
AVG HOUSEHOLD SIZE
23,230
LABOR FORCE [ PEOPLE ]
58.5%
PERCENT IN LABOR FORCE
4.3%
UNEMPLOYMENT RATE
Bedford County Area Codes
Income in Bedford County
Income Overview in Bedford County
Per Capita Income in Bedford County is $31,269, while median incomes of families and households are $75,149 and $58,337 respectively.
| Characteristic | Number | Measure |
| Per Capita Income | 47,613 | $31,269 |
| Median Family Income | 12,778 | $75,149 |
| Mean Family Income | 12,778 | $87,951 |
| Median Household Income | 19,571 | $58,337 |
| Mean Household Income | 19,571 | $73,543 |
| Income Deficit | 12,778 | $9,407 |
| Wage / Income Gap (%) | 47,613 | 40.75% |
| Wage / Income Gap ($) | 47,613 | 59.25¢ per $1 |
| Gini / Inequality Index | 47,613 | 0.43 |
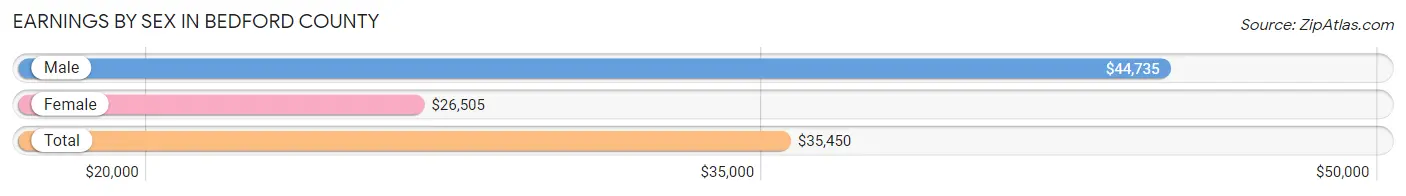
Earnings by Sex in Bedford County
Average Earnings in Bedford County are $35,450, $44,735 for men and $26,505 for women, a difference of 40.7%.
| Sex | Number | Average Earnings |
| Male | 13,430 (55.4%) | $44,735 |
| Female | 10,812 (44.6%) | $26,505 |
| Total | 24,242 (100.0%) | $35,450 |
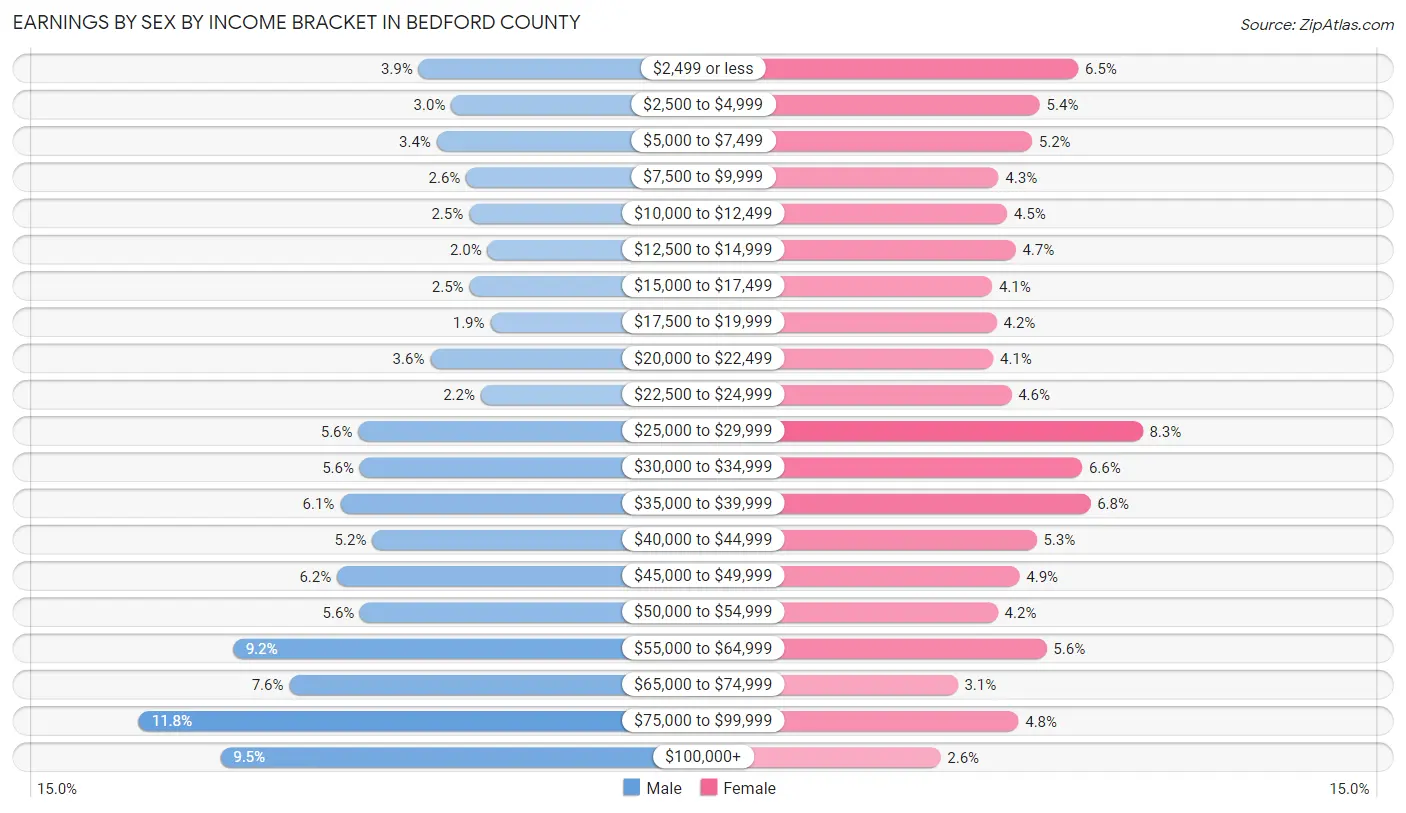
Earnings by Sex by Income Bracket in Bedford County
The most common earnings brackets in Bedford County are $75,000 to $99,999 for men (1,584 | 11.8%) and $25,000 to $29,999 for women (899 | 8.3%).
| Income | Male | Female |
| $2,499 or less | 528 (3.9%) | 703 (6.5%) |
| $2,500 to $4,999 | 404 (3.0%) | 586 (5.4%) |
| $5,000 to $7,499 | 459 (3.4%) | 562 (5.2%) |
| $7,500 to $9,999 | 348 (2.6%) | 461 (4.3%) |
| $10,000 to $12,499 | 337 (2.5%) | 487 (4.5%) |
| $12,500 to $14,999 | 267 (2.0%) | 513 (4.7%) |
| $15,000 to $17,499 | 336 (2.5%) | 441 (4.1%) |
| $17,500 to $19,999 | 257 (1.9%) | 455 (4.2%) |
| $20,000 to $22,499 | 483 (3.6%) | 444 (4.1%) |
| $22,500 to $24,999 | 293 (2.2%) | 500 (4.6%) |
| $25,000 to $29,999 | 755 (5.6%) | 899 (8.3%) |
| $30,000 to $34,999 | 749 (5.6%) | 715 (6.6%) |
| $35,000 to $39,999 | 823 (6.1%) | 740 (6.8%) |
| $40,000 to $44,999 | 703 (5.2%) | 576 (5.3%) |
| $45,000 to $49,999 | 836 (6.2%) | 524 (4.9%) |
| $50,000 to $54,999 | 748 (5.6%) | 458 (4.2%) |
| $55,000 to $64,999 | 1,229 (9.1%) | 607 (5.6%) |
| $65,000 to $74,999 | 1,015 (7.6%) | 336 (3.1%) |
| $75,000 to $99,999 | 1,584 (11.8%) | 521 (4.8%) |
| $100,000+ | 1,276 (9.5%) | 284 (2.6%) |
| Total | 13,430 (100.0%) | 10,812 (100.0%) |
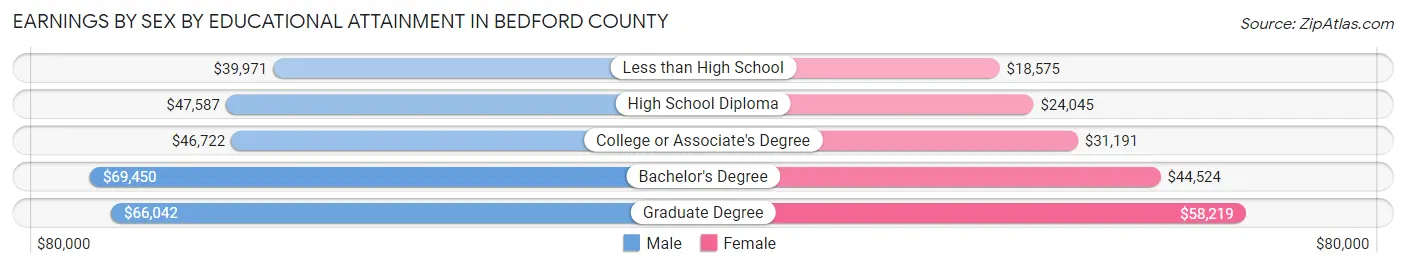
Earnings by Sex by Educational Attainment in Bedford County
Average earnings in Bedford County are $48,832 for men and $30,537 for women, a difference of 37.5%. Men with an educational attainment of bachelor's degree enjoy the highest average annual earnings of $69,450, while those with less than high school education earn the least with $39,971. Women with an educational attainment of graduate degree earn the most with the average annual earnings of $58,219, while those with less than high school education have the smallest earnings of $18,575.
| Educational Attainment | Male Income | Female Income |
| Less than High School | $39,971 | $18,575 |
| High School Diploma | $47,587 | $24,045 |
| College or Associate's Degree | $46,722 | $31,191 |
| Bachelor's Degree | $69,450 | $44,524 |
| Graduate Degree | $66,042 | $58,219 |
| Total | $48,832 | $30,537 |
Family Income in Bedford County
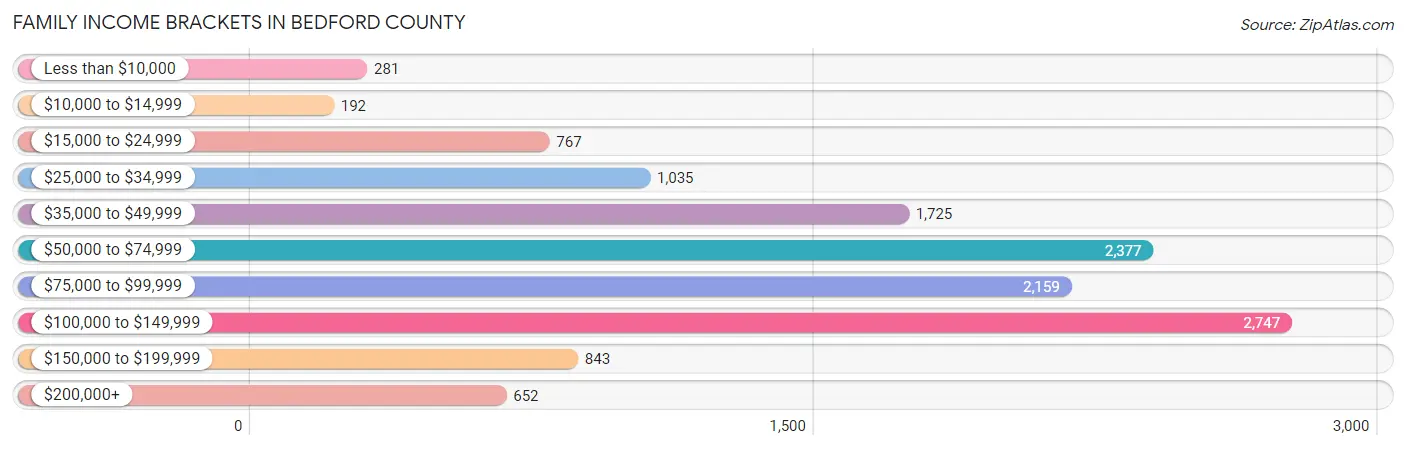
Family Income Brackets in Bedford County
According to the Bedford County family income data, there are 2,747 families falling into the $100,000 to $149,999 income range, which is the most common income bracket and makes up 21.5% of all families. Conversely, the $10,000 to $14,999 income bracket is the least frequent group with only 192 families (1.5%) belonging to this category.
| Income Bracket | # Families | % Families |
| Less than $10,000 | 281 | 2.2% |
| $10,000 to $14,999 | 192 | 1.5% |
| $15,000 to $24,999 | 767 | 6.0% |
| $25,000 to $34,999 | 1,035 | 8.1% |
| $35,000 to $49,999 | 1,725 | 13.5% |
| $50,000 to $74,999 | 2,377 | 18.6% |
| $75,000 to $99,999 | 2,159 | 16.9% |
| $100,000 to $149,999 | 2,747 | 21.5% |
| $150,000 to $199,999 | 843 | 6.6% |
| $200,000+ | 652 | 5.1% |
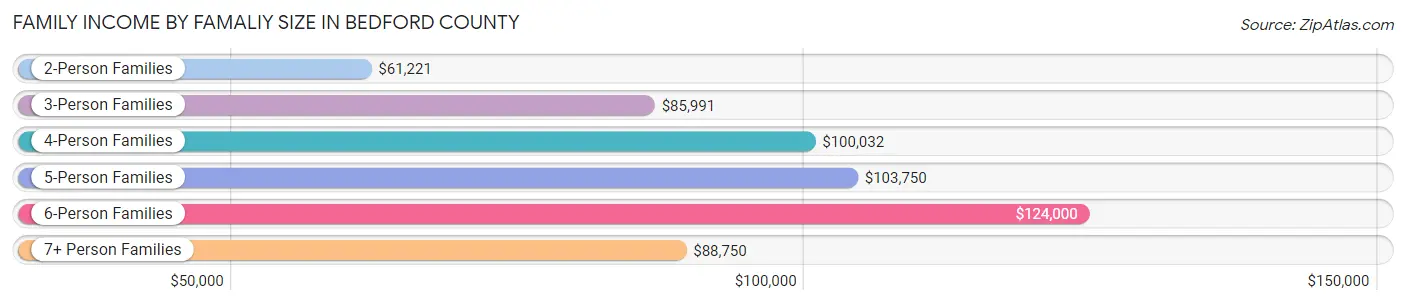
Family Income by Famaliy Size in Bedford County
6-person families (320 | 2.5%) account for the highest median family income in Bedford County with $124,000 per family, while 2-person families (6,877 | 53.8%) have the highest median income of $30,610 per family member.
| Income Bracket | # Families | Median Income |
| 2-Person Families | 6,877 (53.8%) | $61,221 |
| 3-Person Families | 2,621 (20.5%) | $85,991 |
| 4-Person Families | 2,207 (17.3%) | $100,032 |
| 5-Person Families | 645 (5.1%) | $103,750 |
| 6-Person Families | 320 (2.5%) | $124,000 |
| 7+ Person Families | 108 (0.9%) | $88,750 |
| Total | 12,778 (100.0%) | $75,149 |
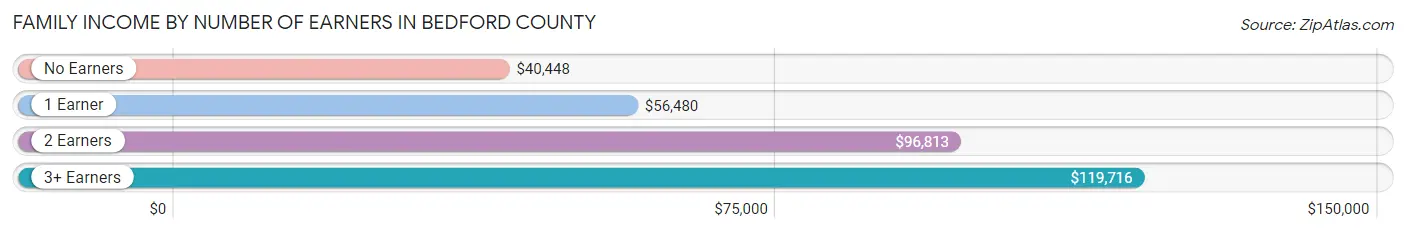
Family Income by Number of Earners in Bedford County
The median family income in Bedford County is $75,149, with families comprising 3+ earners (1,725) having the highest median family income of $119,716, while families with no earners (2,677) have the lowest median family income of $40,448, accounting for 13.5% and 20.9% of families, respectively.
| Number of Earners | # Families | Median Income |
| No Earners | 2,677 (20.9%) | $40,448 |
| 1 Earner | 3,694 (28.9%) | $56,480 |
| 2 Earners | 4,682 (36.6%) | $96,813 |
| 3+ Earners | 1,725 (13.5%) | $119,716 |
| Total | 12,778 (100.0%) | $75,149 |
Household Income in Bedford County
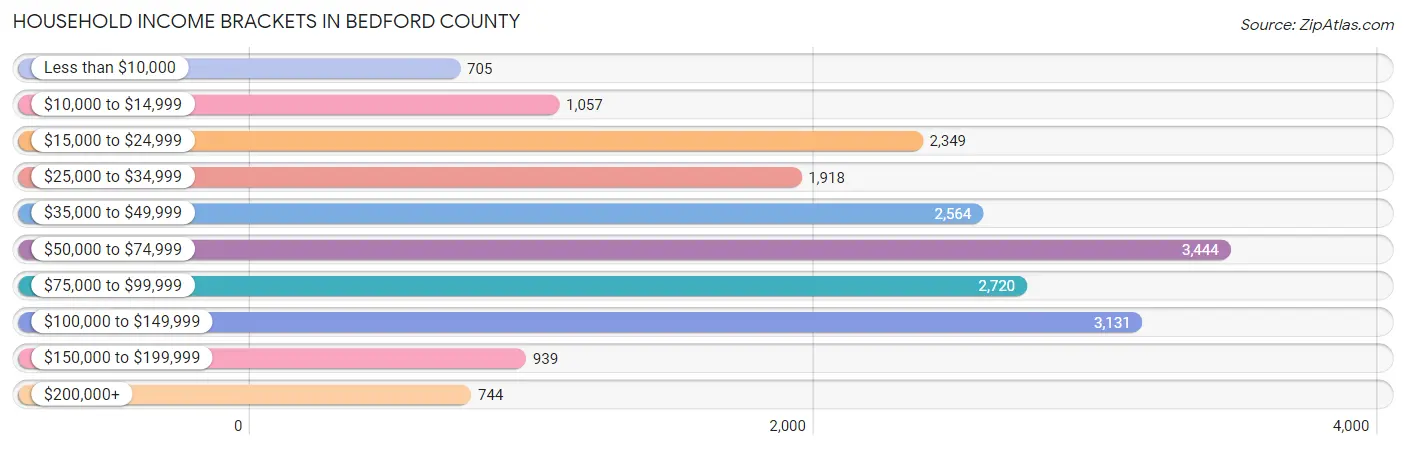
Household Income Brackets in Bedford County
With 3,444 households falling in the category, the $50,000 to $74,999 income range is the most frequent in Bedford County, accounting for 17.6% of all households. In contrast, only 705 households (3.6%) fall into the less than $10,000 income bracket, making it the least populous group.
| Income Bracket | # Households | % Households |
| Less than $10,000 | 705 | 3.6% |
| $10,000 to $14,999 | 1,057 | 5.4% |
| $15,000 to $24,999 | 2,349 | 12.0% |
| $25,000 to $34,999 | 1,918 | 9.8% |
| $35,000 to $49,999 | 2,564 | 13.1% |
| $50,000 to $74,999 | 3,444 | 17.6% |
| $75,000 to $99,999 | 2,720 | 13.9% |
| $100,000 to $149,999 | 3,131 | 16.0% |
| $150,000 to $199,999 | 939 | 4.8% |
| $200,000+ | 744 | 3.8% |
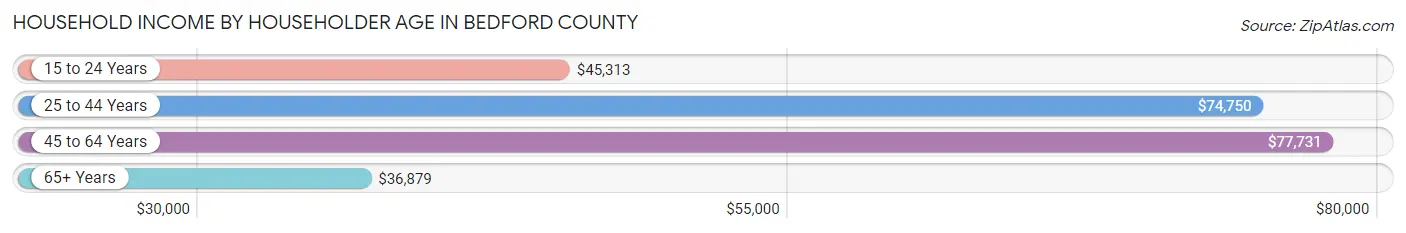
Household Income by Householder Age in Bedford County
The median household income in Bedford County is $58,337, with the highest median household income of $77,731 found in the 45 to 64 years age bracket for the primary householder. A total of 7,707 households (39.4%) fall into this category. Meanwhile, the 65+ years age bracket for the primary householder has the lowest median household income of $36,879, with 6,994 households (35.7%) in this group.
| Income Bracket | # Households | Median Income |
| 15 to 24 Years | 459 (2.4%) | $45,313 |
| 25 to 44 Years | 4,411 (22.5%) | $74,750 |
| 45 to 64 Years | 7,707 (39.4%) | $77,731 |
| 65+ Years | 6,994 (35.7%) | $36,879 |
| Total | 19,571 (100.0%) | $58,337 |
Poverty in Bedford County
Income Below Poverty by Sex and Age in Bedford County
With 9.5% poverty level for males and 12.1% for females among the residents of Bedford County, under 5 year old males and 18 to 24 year old females are the most vulnerable to poverty, with 182 males (15.7%) and 292 females (17.6%) in their respective age groups living below the poverty level.
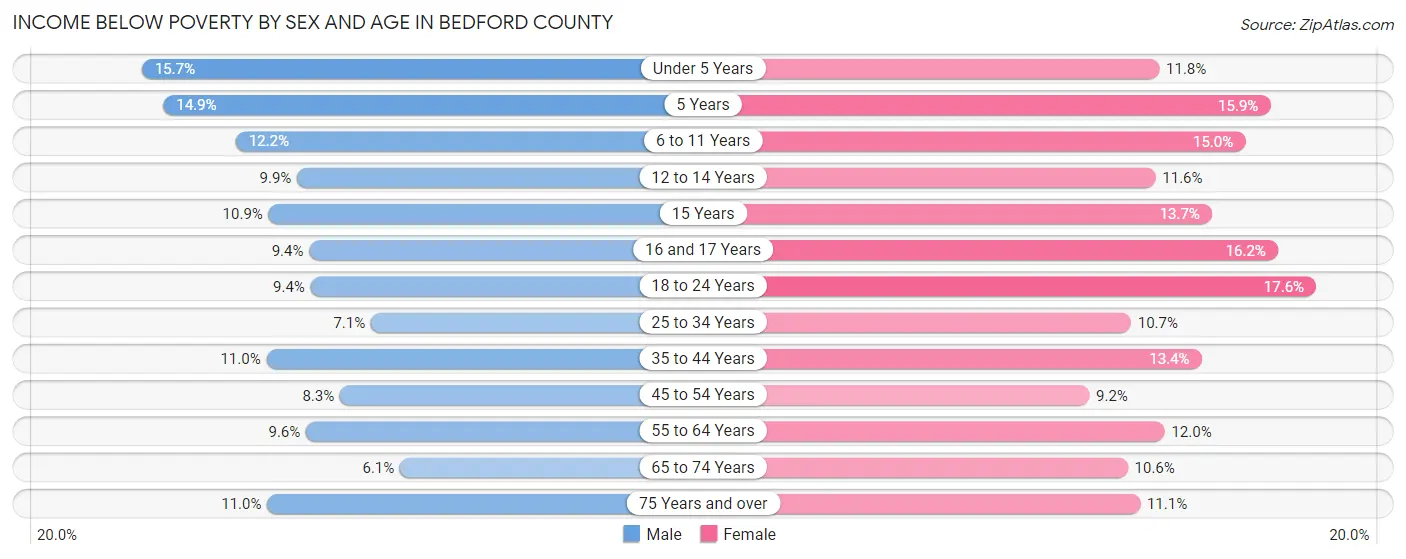
| Age Bracket | Male | Female |
| Under 5 Years | 182 (15.7%) | 130 (11.8%) |
| 5 Years | 49 (14.8%) | 45 (15.9%) |
| 6 to 11 Years | 190 (12.2%) | 210 (15.0%) |
| 12 to 14 Years | 66 (9.9%) | 88 (11.6%) |
| 15 Years | 21 (10.9%) | 28 (13.7%) |
| 16 and 17 Years | 64 (9.4%) | 100 (16.2%) |
| 18 to 24 Years | 174 (9.4%) | 292 (17.6%) |
| 25 to 34 Years | 185 (7.1%) | 258 (10.7%) |
| 35 to 44 Years | 272 (11.0%) | 328 (13.4%) |
| 45 to 54 Years | 264 (8.3%) | 287 (9.2%) |
| 55 to 64 Years | 367 (9.6%) | 442 (12.0%) |
| 65 to 74 Years | 179 (6.1%) | 323 (10.6%) |
| 75 Years and over | 228 (11.0%) | 299 (11.1%) |
| Total | 2,241 (9.5%) | 2,830 (12.1%) |
Income Above Poverty by Sex and Age in Bedford County
According to the poverty statistics in Bedford County, males aged 65 to 74 years and females aged 45 to 54 years are the age groups that are most secure financially, with 93.9% of males and 90.8% of females in these age groups living above the poverty line.
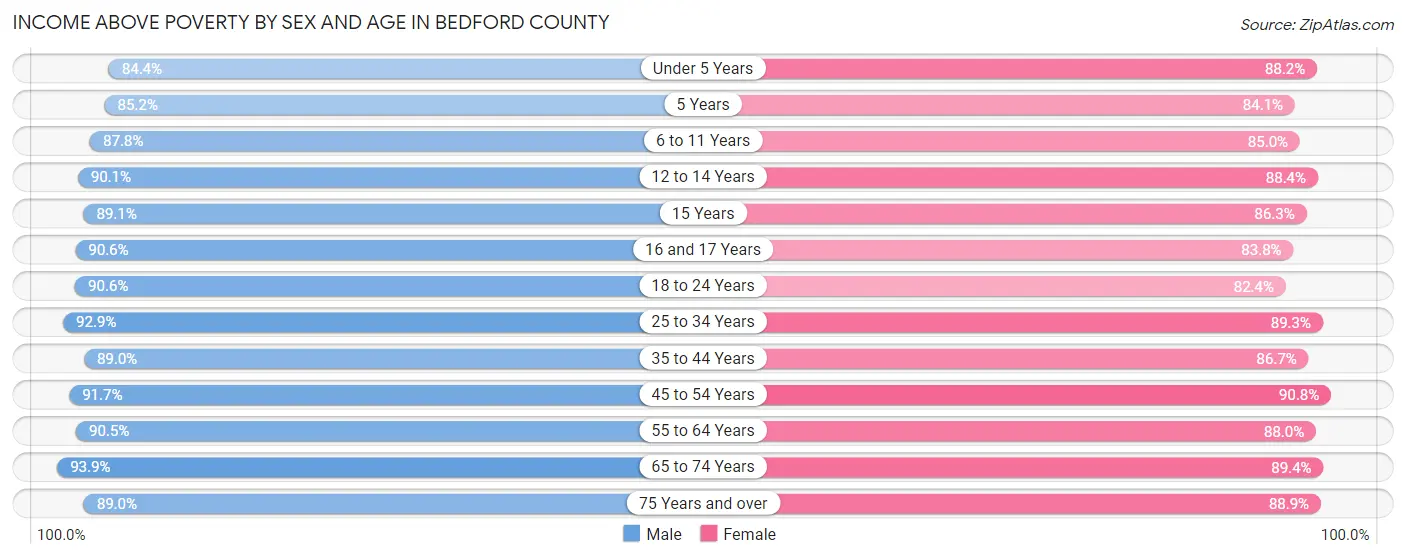
| Age Bracket | Male | Female |
| Under 5 Years | 981 (84.4%) | 974 (88.2%) |
| 5 Years | 281 (85.2%) | 238 (84.1%) |
| 6 to 11 Years | 1,373 (87.8%) | 1,193 (85.0%) |
| 12 to 14 Years | 602 (90.1%) | 668 (88.4%) |
| 15 Years | 171 (89.1%) | 176 (86.3%) |
| 16 and 17 Years | 615 (90.6%) | 518 (83.8%) |
| 18 to 24 Years | 1,681 (90.6%) | 1,367 (82.4%) |
| 25 to 34 Years | 2,405 (92.9%) | 2,146 (89.3%) |
| 35 to 44 Years | 2,197 (89.0%) | 2,129 (86.7%) |
| 45 to 54 Years | 2,922 (91.7%) | 2,839 (90.8%) |
| 55 to 64 Years | 3,474 (90.4%) | 3,248 (88.0%) |
| 65 to 74 Years | 2,775 (93.9%) | 2,720 (89.4%) |
| 75 Years and over | 1,847 (89.0%) | 2,401 (88.9%) |
| Total | 21,324 (90.5%) | 20,617 (87.9%) |
Income Below Poverty Among Married-Couple Families in Bedford County
The poverty statistics for married-couple families in Bedford County show that 4.5% or 470 of the total 10,496 families live below the poverty line. Families with 5 or more children have the highest poverty rate of 14.7%, comprising of 11 families. On the other hand, families with 1 or 2 children have the lowest poverty rate of 4.0%, which includes 114 families.
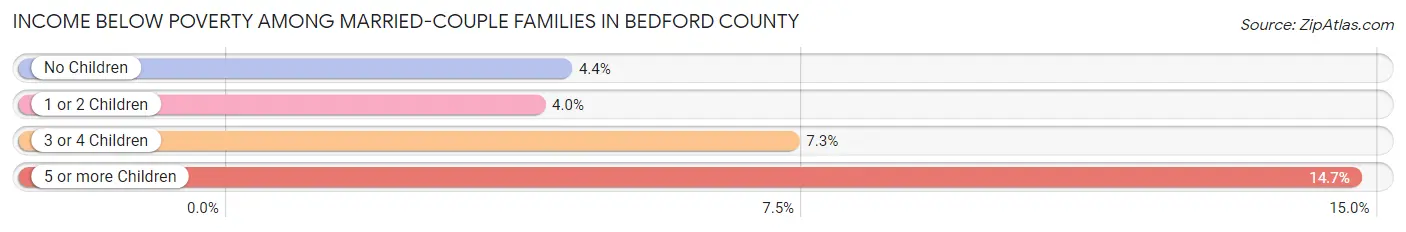
| Children | Above Poverty | Below Poverty |
| No Children | 6,778 (95.6%) | 309 (4.4%) |
| 1 or 2 Children | 2,729 (96.0%) | 114 (4.0%) |
| 3 or 4 Children | 455 (92.7%) | 36 (7.3%) |
| 5 or more Children | 64 (85.3%) | 11 (14.7%) |
| Total | 10,026 (95.5%) | 470 (4.5%) |
Income Below Poverty Among Single-Parent Households in Bedford County
According to the poverty data in Bedford County, 16.9% or 159 single-father households and 21.5% or 288 single-mother households are living below the poverty line. Among single-father households, those with 3 or 4 children have the highest poverty rate, with 34 households (69.4%) experiencing poverty. Likewise, among single-mother households, those with 5 or more children have the highest poverty rate, with 1 households (100.0%) falling below the poverty line.
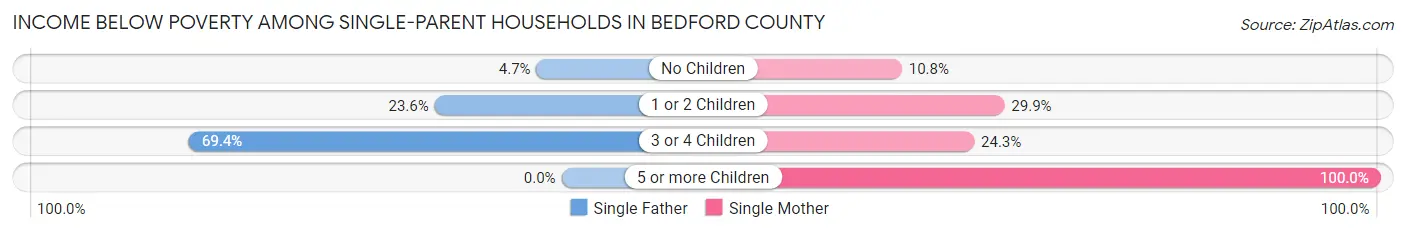
| Children | Single Father | Single Mother |
| No Children | 21 (4.7%) | 61 (10.8%) |
| 1 or 2 Children | 104 (23.6%) | 200 (29.9%) |
| 3 or 4 Children | 34 (69.4%) | 26 (24.3%) |
| 5 or more Children | 0 (0.0%) | 1 (100.0%) |
| Total | 159 (16.9%) | 288 (21.5%) |
Income Below Poverty Among Married-Couple vs Single-Parent Households in Bedford County
The poverty data for Bedford County shows that 470 of the married-couple family households (4.5%) and 447 of the single-parent households (19.6%) are living below the poverty level. Within the married-couple family households, those with 5 or more children have the highest poverty rate, with 11 households (14.7%) falling below the poverty line. Among the single-parent households, those with 3 or 4 children have the highest poverty rate, with 60 household (38.5%) living below poverty.
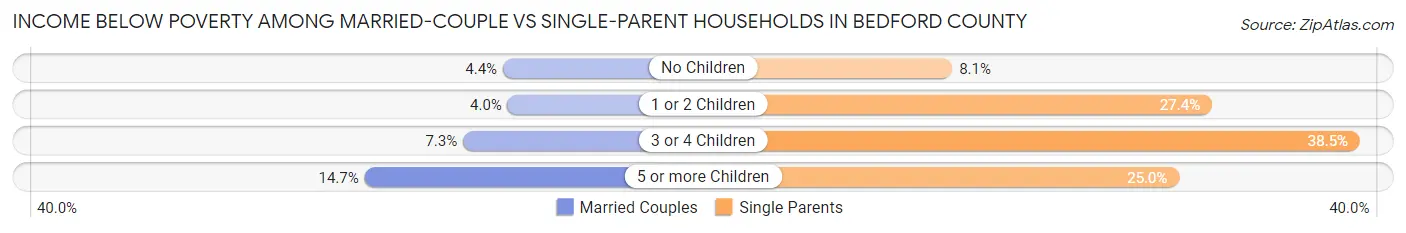
| Children | Married-Couple Families | Single-Parent Households |
| No Children | 309 (4.4%) | 82 (8.1%) |
| 1 or 2 Children | 114 (4.0%) | 304 (27.4%) |
| 3 or 4 Children | 36 (7.3%) | 60 (38.5%) |
| 5 or more Children | 11 (14.7%) | 1 (25.0%) |
| Total | 470 (4.5%) | 447 (19.6%) |
Race in Bedford County
The most populous races in Bedford County are White / Caucasian (45,949 | 96.5%), Two or more Races (910 | 1.9%), and Hispanic or Latino (598 | 1.3%).
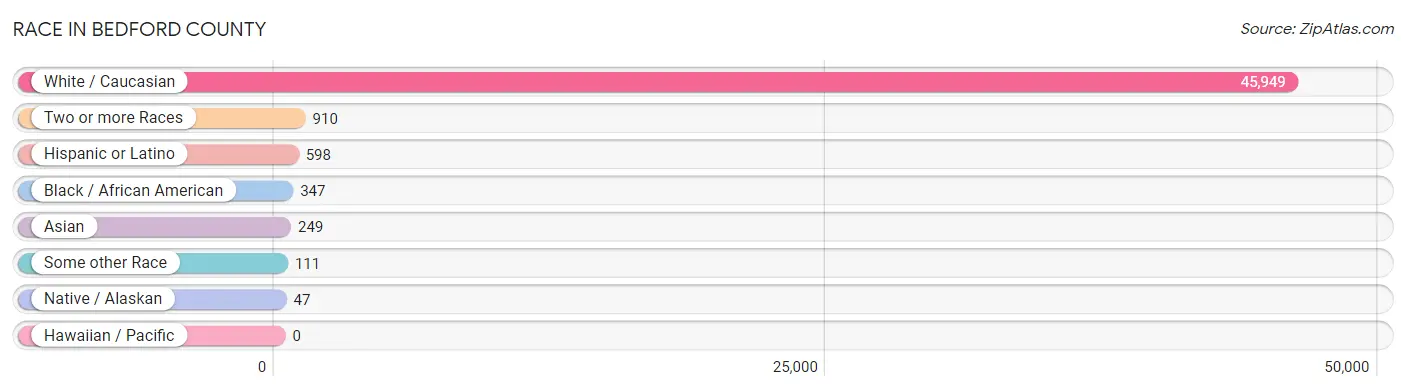
| Race | # Population | % Population |
| Asian | 249 | 0.5% |
| Black / African American | 347 | 0.7% |
| Hawaiian / Pacific | 0 | 0.0% |
| Hispanic or Latino | 598 | 1.3% |
| Native / Alaskan | 47 | 0.1% |
| White / Caucasian | 45,949 | 96.5% |
| Two or more Races | 910 | 1.9% |
| Some other Race | 111 | 0.2% |
| Total | 47,613 | 100.0% |
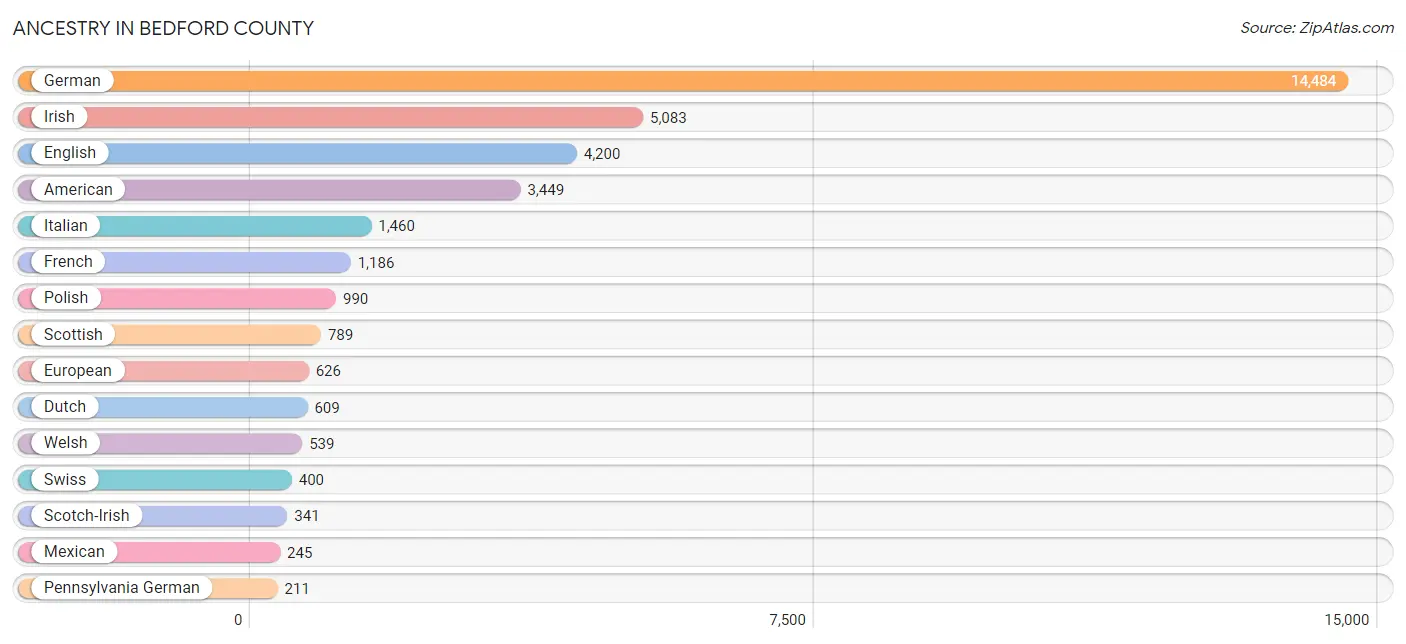
Ancestry in Bedford County
The most populous ancestries reported in Bedford County are German (14,484 | 30.4%), Irish (5,083 | 10.7%), English (4,200 | 8.8%), American (3,449 | 7.2%), and Italian (1,460 | 3.1%), together accounting for 60.2% of all Bedford County residents.
| Ancestry | # Population | % Population |
| African | 38 | 0.1% |
| Alaskan Athabascan | 6 | 0.0% |
| American | 3,449 | 7.2% |
| Arab | 18 | 0.0% |
| Argentinean | 8 | 0.0% |
| Austrian | 121 | 0.3% |
| Belgian | 9 | 0.0% |
| Bhutanese | 60 | 0.1% |
| Blackfeet | 3 | 0.0% |
| British | 154 | 0.3% |
| Bulgarian | 8 | 0.0% |
| Burmese | 41 | 0.1% |
| Canadian | 14 | 0.0% |
| Carpatho Rusyn | 11 | 0.0% |
| Central American | 10 | 0.0% |
| Cherokee | 57 | 0.1% |
| Chippewa | 9 | 0.0% |
| Choctaw | 11 | 0.0% |
| Colombian | 27 | 0.1% |
| Comanche | 1 | 0.0% |
| Croatian | 83 | 0.2% |
| Cuban | 6 | 0.0% |
| Czech | 47 | 0.1% |
| Czechoslovakian | 102 | 0.2% |
| Danish | 13 | 0.0% |
| Delaware | 1 | 0.0% |
| Dominican | 13 | 0.0% |
| Dutch | 609 | 1.3% |
| Eastern European | 161 | 0.3% |
| English | 4,200 | 8.8% |
| European | 626 | 1.3% |
| French | 1,186 | 2.5% |
| French American Indian | 11 | 0.0% |
| French Canadian | 47 | 0.1% |
| German | 14,484 | 30.4% |
| Greek | 206 | 0.4% |
| Hungarian | 145 | 0.3% |
| Indian (Asian) | 48 | 0.1% |
| Irish | 5,083 | 10.7% |
| Iroquois | 6 | 0.0% |
| Italian | 1,460 | 3.1% |
| Jamaican | 2 | 0.0% |
| Korean | 94 | 0.2% |
| Lebanese | 3 | 0.0% |
| Lithuanian | 66 | 0.1% |
| Lumbee | 2 | 0.0% |
| Mexican | 245 | 0.5% |
| Nicaraguan | 8 | 0.0% |
| Nigerian | 41 | 0.1% |
| Northern European | 37 | 0.1% |
| Norwegian | 77 | 0.2% |
| Panamanian | 2 | 0.0% |
| Pennsylvania German | 211 | 0.4% |
| Peruvian | 3 | 0.0% |
| Polish | 990 | 2.1% |
| Portuguese | 25 | 0.1% |
| Puerto Rican | 131 | 0.3% |
| Russian | 138 | 0.3% |
| Samoan | 7 | 0.0% |
| Scandinavian | 36 | 0.1% |
| Scotch-Irish | 341 | 0.7% |
| Scottish | 789 | 1.7% |
| Serbian | 28 | 0.1% |
| Sioux | 5 | 0.0% |
| Slavic | 29 | 0.1% |
| Slovak | 163 | 0.3% |
| Slovene | 45 | 0.1% |
| South African | 25 | 0.1% |
| South American | 38 | 0.1% |
| Spaniard | 13 | 0.0% |
| Spanish | 93 | 0.2% |
| Sri Lankan | 69 | 0.1% |
| Subsaharan African | 104 | 0.2% |
| Swedish | 208 | 0.4% |
| Swiss | 400 | 0.8% |
| Syrian | 4 | 0.0% |
| Thai | 74 | 0.2% |
| Ukrainian | 79 | 0.2% |
| Welsh | 539 | 1.1% |
| Yugoslavian | 5 | 0.0% | View All 80 Rows |
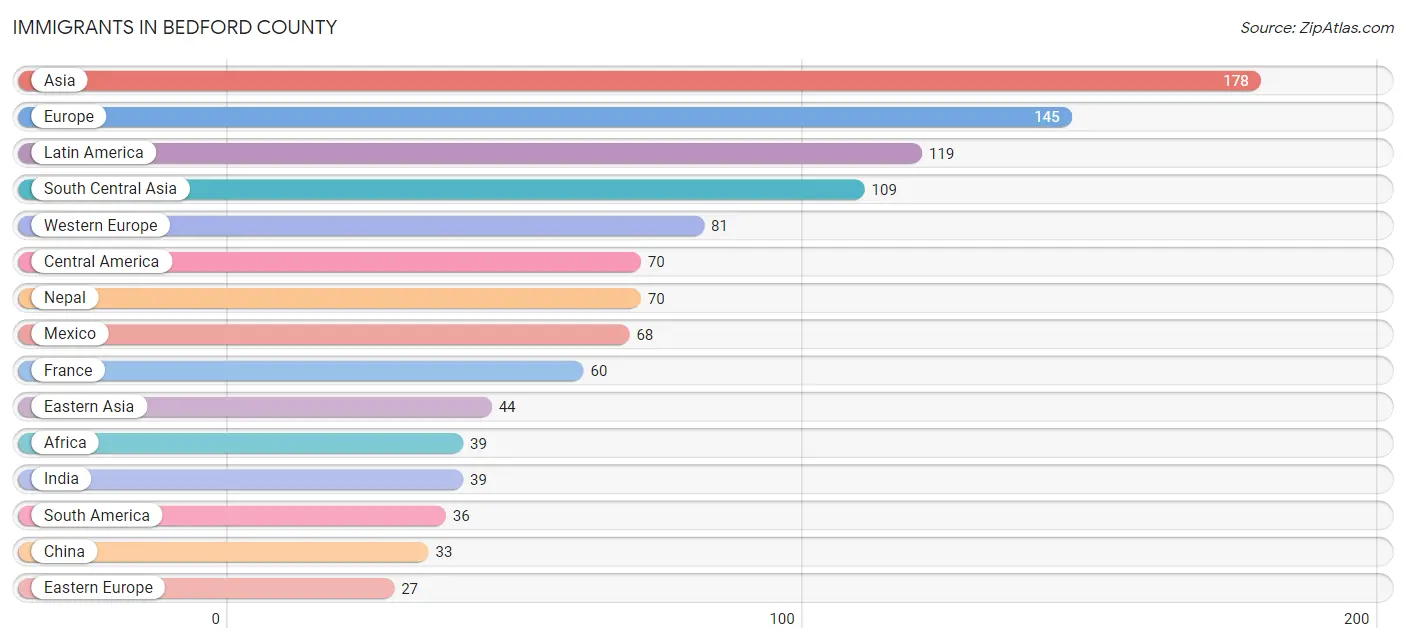
Immigrants in Bedford County
The most numerous immigrant groups reported in Bedford County came from Asia (178 | 0.4%), Europe (145 | 0.3%), Latin America (119 | 0.3%), South Central Asia (109 | 0.2%), and Western Europe (81 | 0.2%), together accounting for 1.3% of all Bedford County residents.
| Immigration Origin | # Population | % Population |
| Africa | 39 | 0.1% |
| Argentina | 8 | 0.0% |
| Asia | 178 | 0.4% |
| Canada | 4 | 0.0% |
| Caribbean | 13 | 0.0% |
| Central America | 70 | 0.2% |
| China | 33 | 0.1% |
| Colombia | 17 | 0.0% |
| Dominican Republic | 13 | 0.0% |
| Eastern Asia | 44 | 0.1% |
| Eastern Europe | 27 | 0.1% |
| England | 8 | 0.0% |
| Europe | 145 | 0.3% |
| France | 60 | 0.1% |
| Germany | 14 | 0.0% |
| India | 39 | 0.1% |
| Ireland | 4 | 0.0% |
| Japan | 5 | 0.0% |
| Korea | 6 | 0.0% |
| Latin America | 119 | 0.3% |
| Mexico | 68 | 0.1% |
| Nepal | 70 | 0.2% |
| Netherlands | 7 | 0.0% |
| Nigeria | 14 | 0.0% |
| Northern Europe | 24 | 0.1% |
| Panama | 2 | 0.0% |
| Peru | 3 | 0.0% |
| Philippines | 14 | 0.0% |
| Russia | 11 | 0.0% |
| Saudi Arabia | 2 | 0.0% |
| South Africa | 25 | 0.1% |
| South America | 36 | 0.1% |
| South Central Asia | 109 | 0.2% |
| South Eastern Asia | 23 | 0.1% |
| Southern Europe | 13 | 0.0% |
| Spain | 13 | 0.0% |
| Ukraine | 16 | 0.0% |
| Uruguay | 8 | 0.0% |
| Vietnam | 9 | 0.0% |
| Western Africa | 14 | 0.0% |
| Western Asia | 2 | 0.0% |
| Western Europe | 81 | 0.2% | View All 42 Rows |
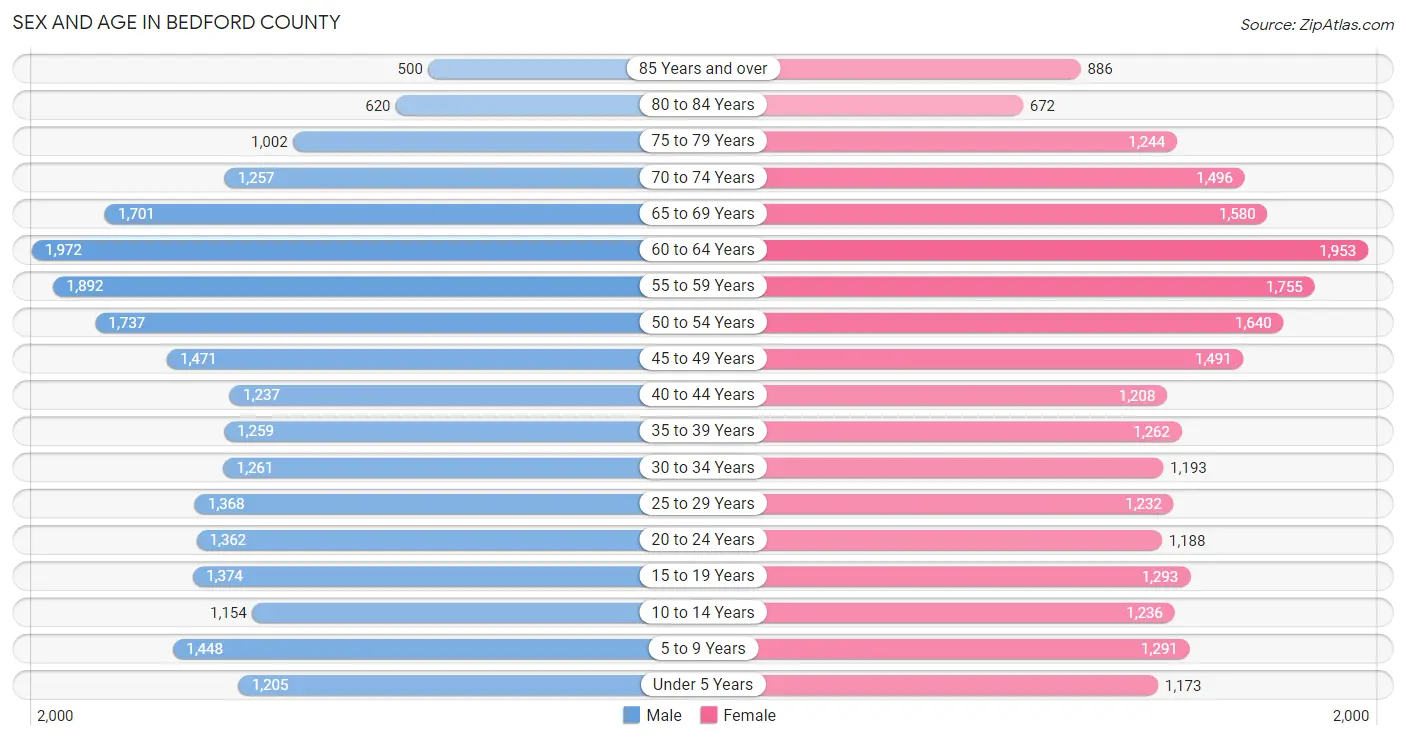
Sex and Age in Bedford County
Sex and Age in Bedford County
The most populous age groups in Bedford County are 60 to 64 Years (1,972 | 8.3%) for men and 60 to 64 Years (1,953 | 8.2%) for women.
| Age Bracket | Male | Female |
| Under 5 Years | 1,205 (5.1%) | 1,173 (4.9%) |
| 5 to 9 Years | 1,448 (6.1%) | 1,291 (5.4%) |
| 10 to 14 Years | 1,154 (4.8%) | 1,236 (5.2%) |
| 15 to 19 Years | 1,374 (5.8%) | 1,293 (5.4%) |
| 20 to 24 Years | 1,362 (5.7%) | 1,188 (5.0%) |
| 25 to 29 Years | 1,368 (5.7%) | 1,232 (5.2%) |
| 30 to 34 Years | 1,261 (5.3%) | 1,193 (5.0%) |
| 35 to 39 Years | 1,259 (5.3%) | 1,262 (5.3%) |
| 40 to 44 Years | 1,237 (5.2%) | 1,208 (5.1%) |
| 45 to 49 Years | 1,471 (6.2%) | 1,491 (6.3%) |
| 50 to 54 Years | 1,737 (7.3%) | 1,640 (6.9%) |
| 55 to 59 Years | 1,892 (7.9%) | 1,755 (7.4%) |
| 60 to 64 Years | 1,972 (8.3%) | 1,953 (8.2%) |
| 65 to 69 Years | 1,701 (7.1%) | 1,580 (6.6%) |
| 70 to 74 Years | 1,257 (5.3%) | 1,496 (6.3%) |
| 75 to 79 Years | 1,002 (4.2%) | 1,244 (5.2%) |
| 80 to 84 Years | 620 (2.6%) | 672 (2.8%) |
| 85 Years and over | 500 (2.1%) | 886 (3.7%) |
| Total | 23,820 (100.0%) | 23,793 (100.0%) |
Families and Households in Bedford County
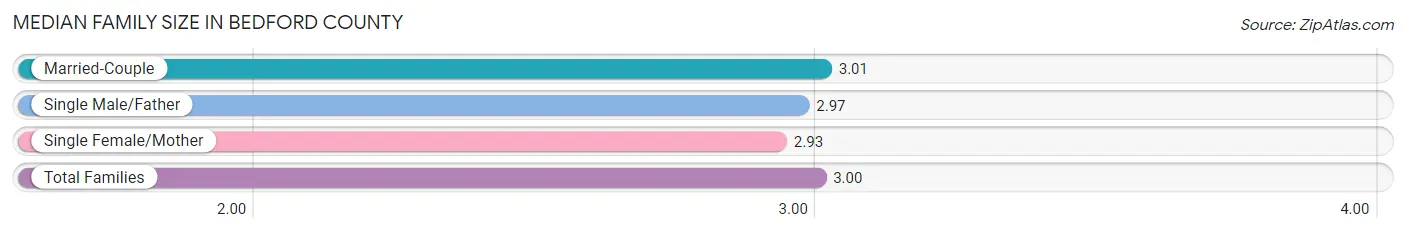
Median Family Size in Bedford County
The median family size in Bedford County is 3.00 persons per family, with married-couple families (10,496 | 82.1%) accounting for the largest median family size of 3.01 persons per family. On the other hand, single female/mother families (1,340 | 10.5%) represent the smallest median family size with 2.93 persons per family.
| Family Type | # Families | Family Size |
| Married-Couple | 10,496 (82.1%) | 3.01 |
| Single Male/Father | 942 (7.4%) | 2.97 |
| Single Female/Mother | 1,340 (10.5%) | 2.93 |
| Total Families | 12,778 (100.0%) | 3.00 |
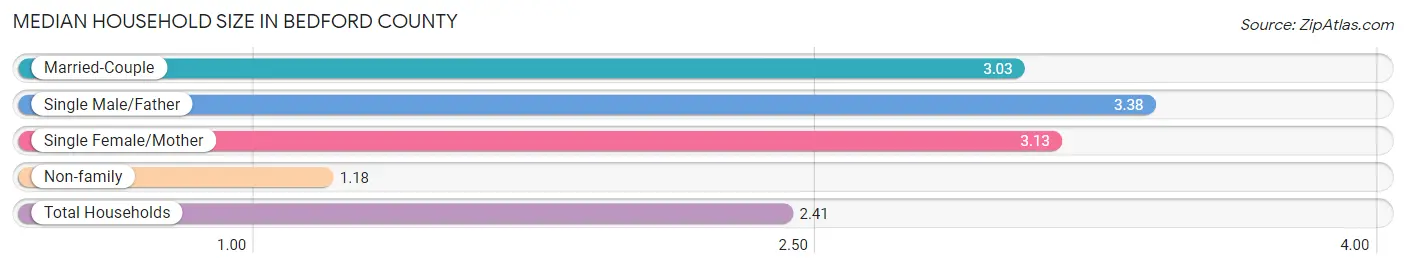
Median Household Size in Bedford County
The median household size in Bedford County is 2.41 persons per household, with single male/father households (942 | 4.8%) accounting for the largest median household size of 3.38 persons per household. non-family households (6,793 | 34.7%) represent the smallest median household size with 1.18 persons per household.
| Household Type | # Households | Household Size |
| Married-Couple | 10,496 (53.6%) | 3.03 |
| Single Male/Father | 942 (4.8%) | 3.38 |
| Single Female/Mother | 1,340 (6.9%) | 3.13 |
| Non-family | 6,793 (34.7%) | 1.18 |
| Total Households | 19,571 (100.0%) | 2.41 |
Household Size by Marriage Status in Bedford County
Out of a total of 19,571 households in Bedford County, 12,778 (65.3%) are family households, while 6,793 (34.7%) are nonfamily households. The most numerous type of family households are 2-person households, comprising 6,646, and the most common type of nonfamily households are 1-person households, comprising 5,800.
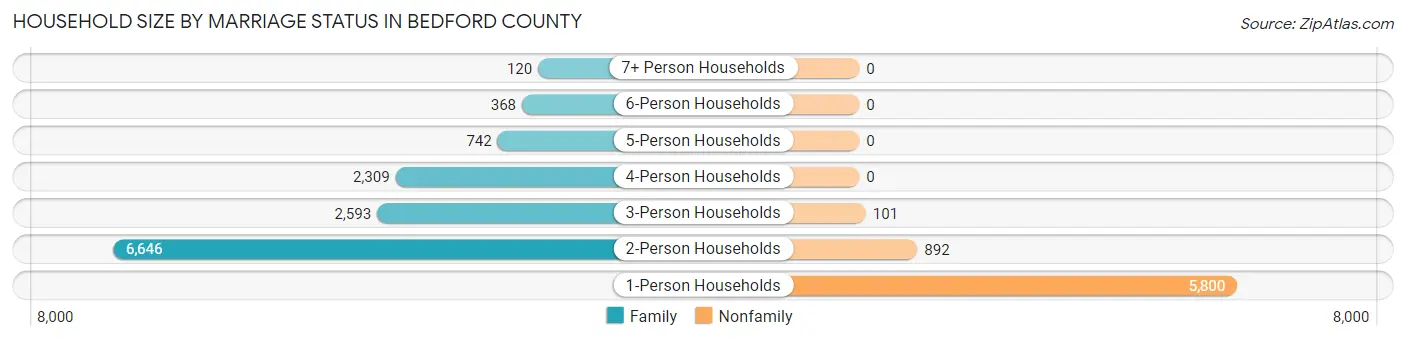
| Household Size | Family Households | Nonfamily Households |
| 1-Person Households | - | 5,800 (29.6%) |
| 2-Person Households | 6,646 (34.0%) | 892 (4.6%) |
| 3-Person Households | 2,593 (13.3%) | 101 (0.5%) |
| 4-Person Households | 2,309 (11.8%) | 0 (0.0%) |
| 5-Person Households | 742 (3.8%) | 0 (0.0%) |
| 6-Person Households | 368 (1.9%) | 0 (0.0%) |
| 7+ Person Households | 120 (0.6%) | 0 (0.0%) |
| Total | 12,778 (65.3%) | 6,793 (34.7%) |
Female Fertility in Bedford County
Fertility by Age in Bedford County
Average fertility rate in Bedford County is 52.0 births per 1,000 women. Women in the age bracket of 20 to 34 years have the highest fertility rate with 99.0 births per 1,000 women. Women in the age bracket of 20 to 34 years acount for 74.6% of all women with births.
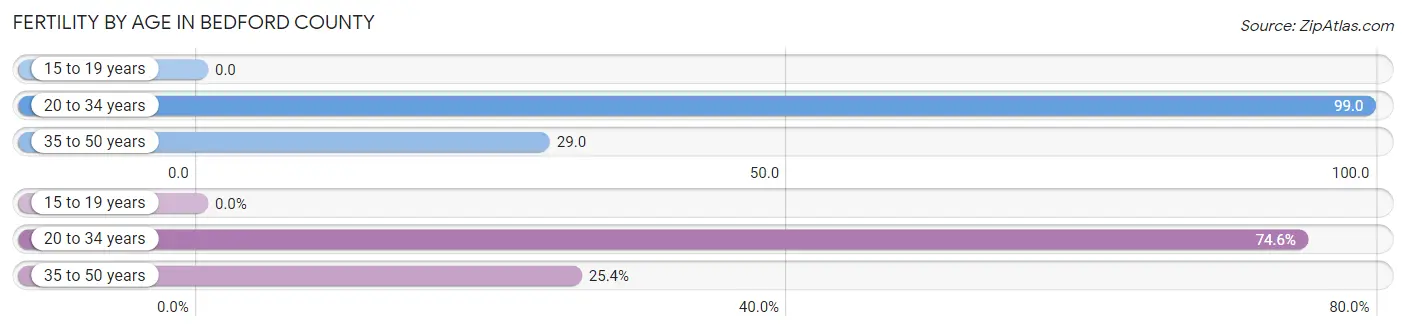
| Age Bracket | Women with Births | Births / 1,000 Women |
| 15 to 19 years | 0 (0.0%) | 0.0 |
| 20 to 34 years | 356 (74.6%) | 99.0 |
| 35 to 50 years | 121 (25.4%) | 29.0 |
| Total | 477 (100.0%) | 52.0 |
Fertility by Age by Marriage Status in Bedford County
83.0% of women with births (477) in Bedford County are married. The highest percentage of unmarried women with births falls into 35 to 50 years age bracket with 23.1% of them unmarried at the time of birth, while the lowest percentage of unmarried women with births belong to 20 to 34 years age bracket with 14.9% of them unmarried.
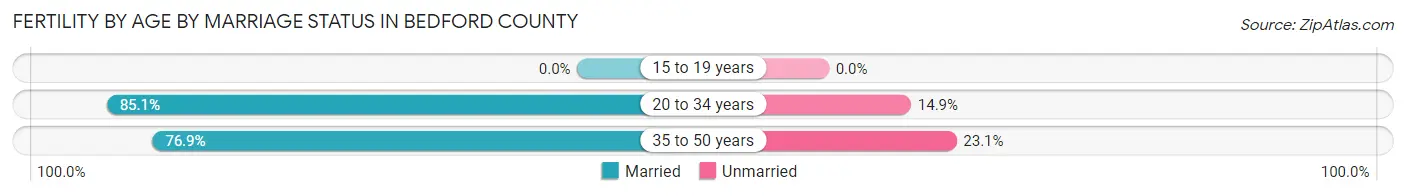
| Age Bracket | Married | Unmarried |
| 15 to 19 years | 0 (0.0%) | 0 (0.0%) |
| 20 to 34 years | 303 (85.1%) | 53 (14.9%) |
| 35 to 50 years | 93 (76.9%) | 28 (23.1%) |
| Total | 396 (83.0%) | 81 (17.0%) |
Fertility by Education in Bedford County
Average fertility rate in Bedford County is 52.0 births per 1,000 women. Women with the education attainment of high school diploma have the highest fertility rate of 67.0 births per 1,000 women, while women with the education attainment of less than high school have the lowest fertility at 31.0 births per 1,000 women. Women with the education attainment of high school diploma represent 42.1% of all women with births.
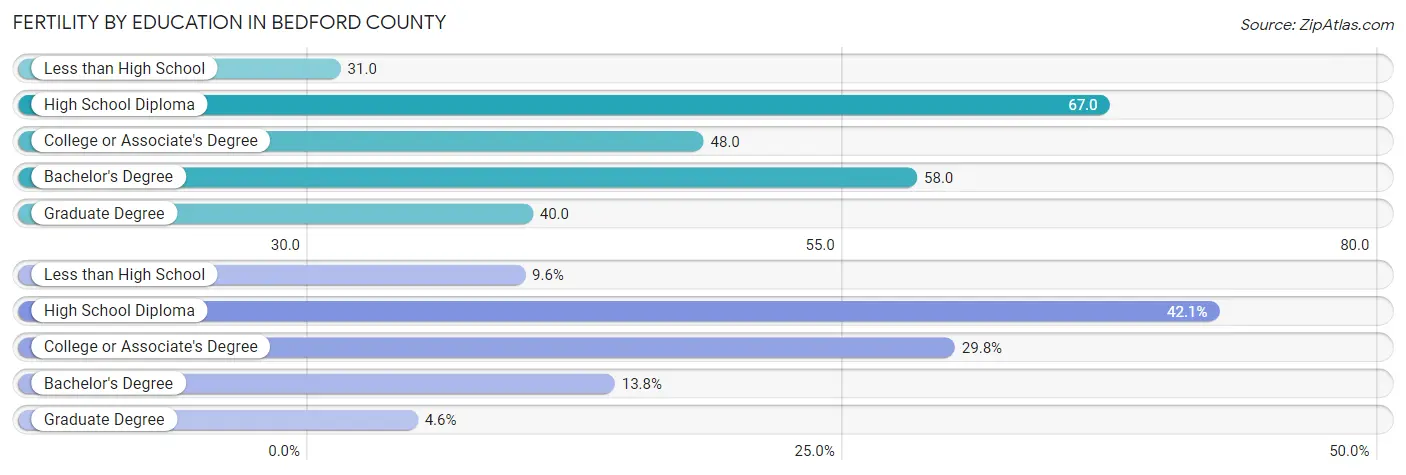
| Educational Attainment | Women with Births | Births / 1,000 Women |
| Less than High School | 46 (9.6%) | 31.0 |
| High School Diploma | 201 (42.1%) | 67.0 |
| College or Associate's Degree | 142 (29.8%) | 48.0 |
| Bachelor's Degree | 66 (13.8%) | 58.0 |
| Graduate Degree | 22 (4.6%) | 40.0 |
| Total | 477 (100.0%) | 52.0 |
Fertility by Education by Marriage Status in Bedford County
17.0% of women with births in Bedford County are unmarried. Women with the educational attainment of graduate degree are most likely to be married with 100.0% of them married at childbirth, while women with the educational attainment of bachelor's degree are least likely to be married with 31.8% of them unmarried at childbirth.
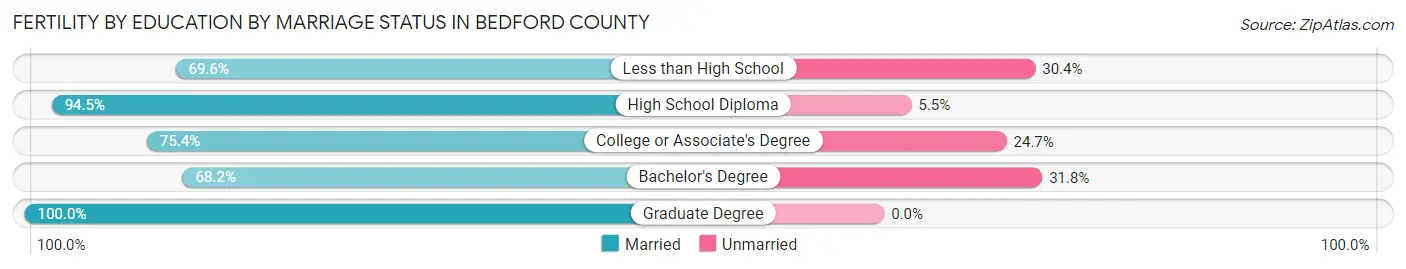
| Educational Attainment | Married | Unmarried |
| Less than High School | 32 (69.6%) | 14 (30.4%) |
| High School Diploma | 190 (94.5%) | 11 (5.5%) |
| College or Associate's Degree | 107 (75.3%) | 35 (24.6%) |
| Bachelor's Degree | 45 (68.2%) | 21 (31.8%) |
| Graduate Degree | 22 (100.0%) | 0 (0.0%) |
| Total | 396 (83.0%) | 81 (17.0%) |
Employment Characteristics in Bedford County
Employment by Class of Employer in Bedford County
Among the 21,872 employed individuals in Bedford County, private company employees (15,625 | 71.4%), not-for-profit organizations (1,718 | 7.9%), and local government employees (1,196 | 5.5%) make up the most common classes of employment.
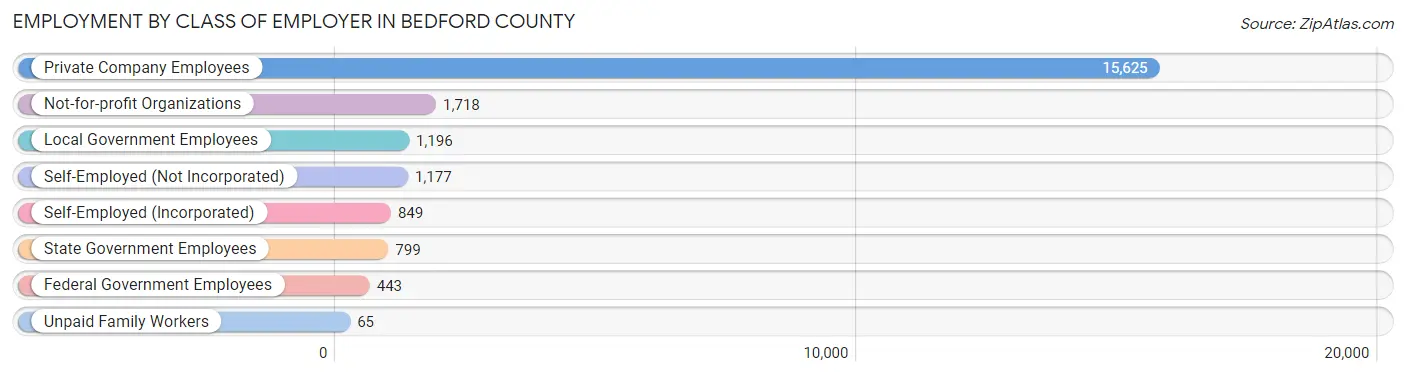
| Employer Class | # Employees | % Employees |
| Private Company Employees | 15,625 | 71.4% |
| Self-Employed (Incorporated) | 849 | 3.9% |
| Self-Employed (Not Incorporated) | 1,177 | 5.4% |
| Not-for-profit Organizations | 1,718 | 7.9% |
| Local Government Employees | 1,196 | 5.5% |
| State Government Employees | 799 | 3.6% |
| Federal Government Employees | 443 | 2.0% |
| Unpaid Family Workers | 65 | 0.3% |
| Total | 21,872 | 100.0% |
Employment Status by Age in Bedford County
According to the labor force statistics for Bedford County, out of the total population over 16 years of age (39,710), 58.5% or 23,230 individuals are in the labor force, with 4.3% or 999 of them unemployed. The age group with the highest labor force participation rate is 20 to 24 years, with 85.9% or 2,190 individuals in the labor force. Within the labor force, the 20 to 24 years age range has the highest percentage of unemployed individuals, with 7.3% or 160 of them being unemployed.
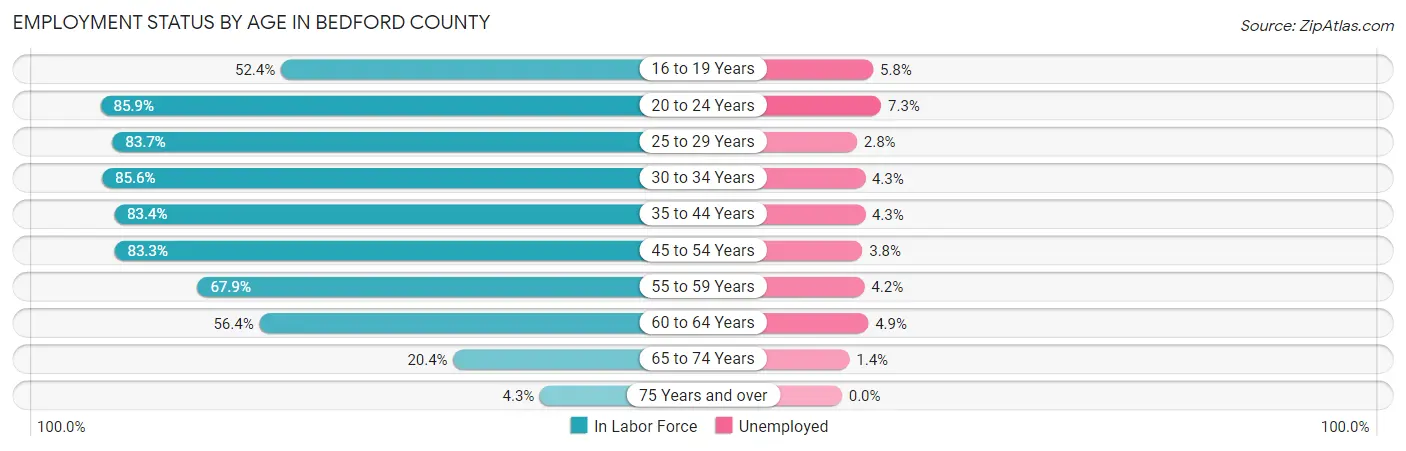
| Age Bracket | In Labor Force | Unemployed |
| 16 to 19 Years | 1,190 (52.4%) | 69 (5.8%) |
| 20 to 24 Years | 2,190 (85.9%) | 160 (7.3%) |
| 25 to 29 Years | 2,176 (83.7%) | 61 (2.8%) |
| 30 to 34 Years | 2,101 (85.6%) | 90 (4.3%) |
| 35 to 44 Years | 4,142 (83.4%) | 178 (4.3%) |
| 45 to 54 Years | 5,280 (83.3%) | 201 (3.8%) |
| 55 to 59 Years | 2,476 (67.9%) | 104 (4.2%) |
| 60 to 64 Years | 2,214 (56.4%) | 108 (4.9%) |
| 65 to 74 Years | 1,231 (20.4%) | 17 (1.4%) |
| 75 Years and over | 212 (4.3%) | 0 (0.0%) |
| Total | 23,230 (58.5%) | 999 (4.3%) |
Employment Status by Educational Attainment in Bedford County
According to labor force statistics for Bedford County, 76.9% of individuals (18,403) out of the total population between 25 and 64 years of age (23,931) are in the labor force, with 4.0% or 736 of them being unemployed. The group with the highest labor force participation rate are those with the educational attainment of bachelor's degree or higher, with 85.9% or 3,620 individuals in the labor force. Within the labor force, individuals with bachelor's degree or higher education have the highest percentage of unemployment, with 4.8% or 174 of them being unemployed.
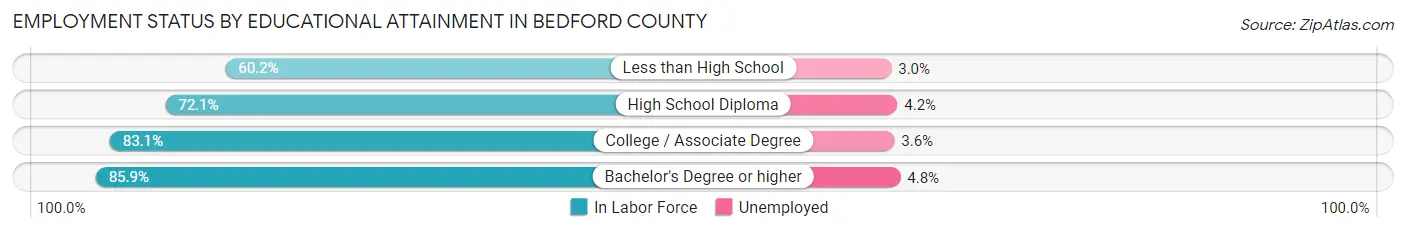
| Educational Attainment | In Labor Force | Unemployed |
| Less than High School | 1,061 (60.2%) | 53 (3.0%) |
| High School Diploma | 7,917 (72.1%) | 461 (4.2%) |
| College / Associate Degree | 5,795 (83.1%) | 251 (3.6%) |
| Bachelor's Degree or higher | 3,620 (85.9%) | 202 (4.8%) |
| Total | 18,403 (76.9%) | 957 (4.0%) |
Employment Occupations by Sex in Bedford County
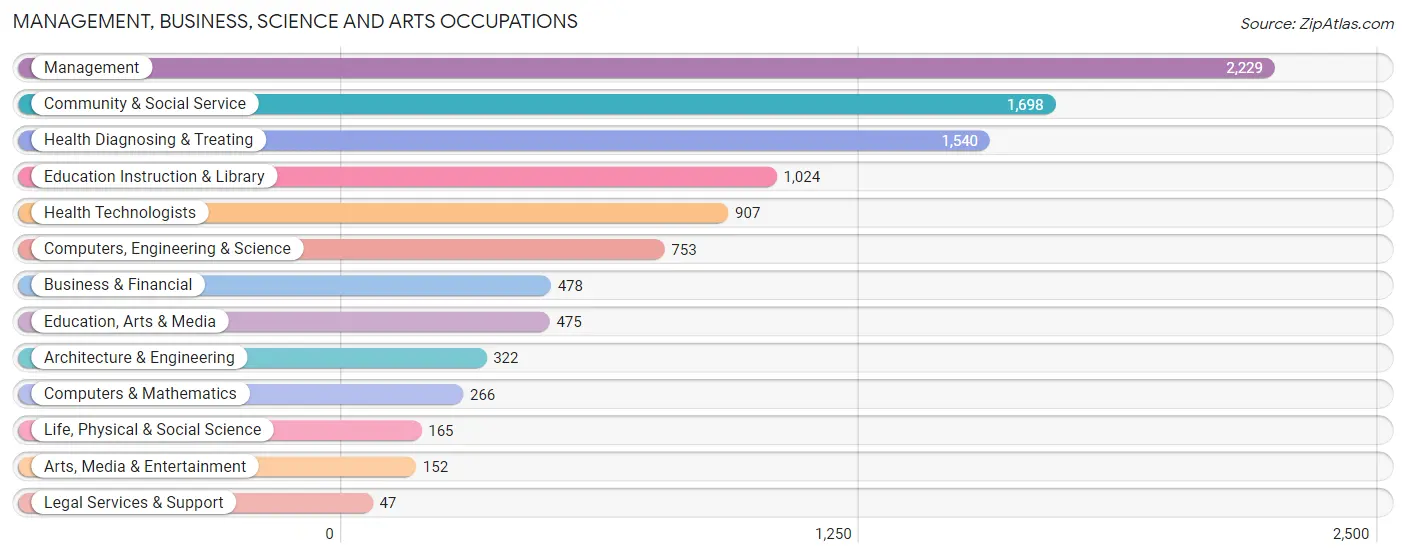
Management, Business, Science and Arts Occupations
The most common Management, Business, Science and Arts occupations in Bedford County are Management (2,229 | 10.0%), Community & Social Service (1,698 | 7.6%), Health Diagnosing & Treating (1,540 | 6.9%), Education Instruction & Library (1,024 | 4.6%), and Health Technologists (907 | 4.1%).
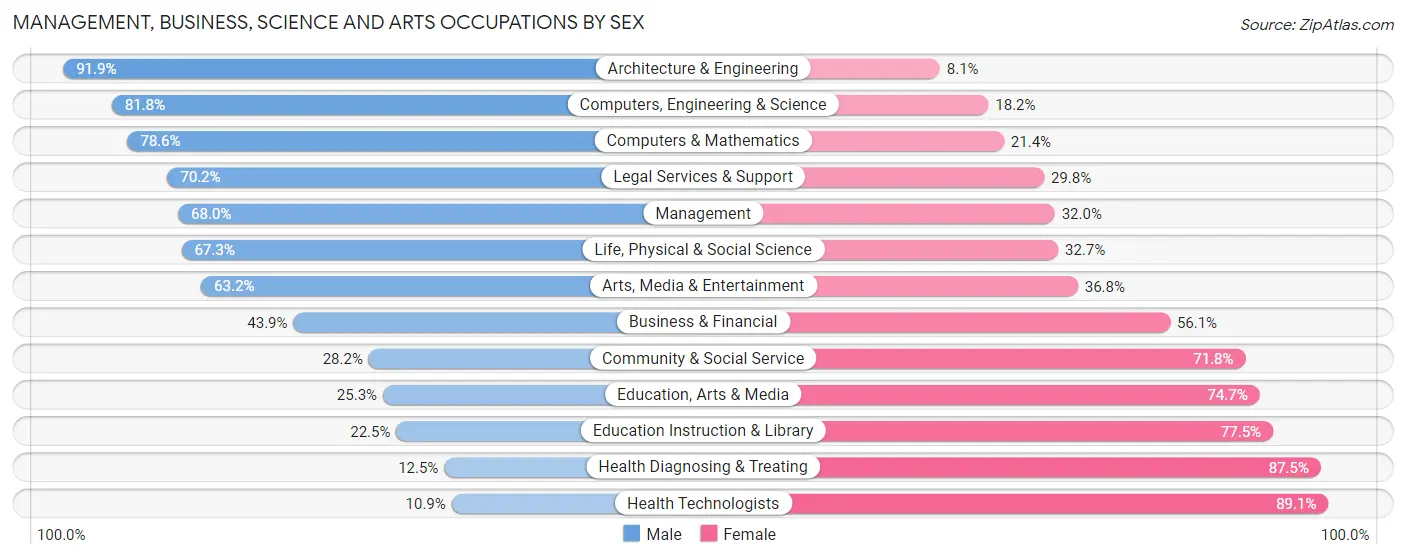
Management, Business, Science and Arts Occupations by Sex
Within the Management, Business, Science and Arts occupations in Bedford County, the most male-oriented occupations are Architecture & Engineering (91.9%), Computers, Engineering & Science (81.8%), and Computers & Mathematics (78.6%), while the most female-oriented occupations are Health Technologists (89.1%), Health Diagnosing & Treating (87.5%), and Education Instruction & Library (77.5%).
| Occupation | Male | Female |
| Management | 1,515 (68.0%) | 714 (32.0%) |
| Business & Financial | 210 (43.9%) | 268 (56.1%) |
| Computers, Engineering & Science | 616 (81.8%) | 137 (18.2%) |
| Computers & Mathematics | 209 (78.6%) | 57 (21.4%) |
| Architecture & Engineering | 296 (91.9%) | 26 (8.1%) |
| Life, Physical & Social Science | 111 (67.3%) | 54 (32.7%) |
| Community & Social Service | 479 (28.2%) | 1,219 (71.8%) |
| Education, Arts & Media | 120 (25.3%) | 355 (74.7%) |
| Legal Services & Support | 33 (70.2%) | 14 (29.8%) |
| Education Instruction & Library | 230 (22.5%) | 794 (77.5%) |
| Arts, Media & Entertainment | 96 (63.2%) | 56 (36.8%) |
| Health Diagnosing & Treating | 192 (12.5%) | 1,348 (87.5%) |
| Health Technologists | 99 (10.9%) | 808 (89.1%) |
| Total (Category) | 3,012 (45.0%) | 3,686 (55.0%) |
| Total (Overall) | 12,304 (55.4%) | 9,916 (44.6%) |
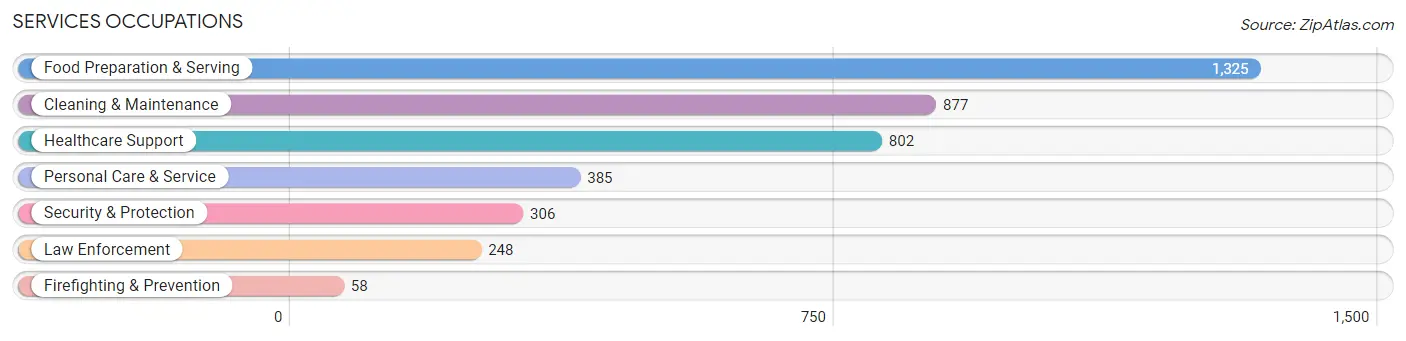
Services Occupations
The most common Services occupations in Bedford County are Food Preparation & Serving (1,325 | 6.0%), Cleaning & Maintenance (877 | 4.0%), Healthcare Support (802 | 3.6%), Personal Care & Service (385 | 1.7%), and Security & Protection (306 | 1.4%).
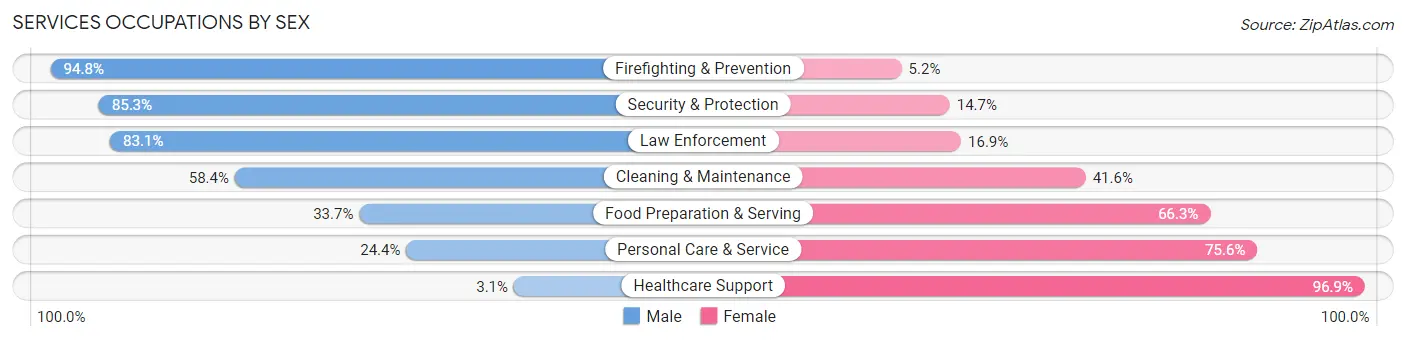
Services Occupations by Sex
Within the Services occupations in Bedford County, the most male-oriented occupations are Firefighting & Prevention (94.8%), Security & Protection (85.3%), and Law Enforcement (83.1%), while the most female-oriented occupations are Healthcare Support (96.9%), Personal Care & Service (75.6%), and Food Preparation & Serving (66.3%).
| Occupation | Male | Female |
| Healthcare Support | 25 (3.1%) | 777 (96.9%) |
| Security & Protection | 261 (85.3%) | 45 (14.7%) |
| Firefighting & Prevention | 55 (94.8%) | 3 (5.2%) |
| Law Enforcement | 206 (83.1%) | 42 (16.9%) |
| Food Preparation & Serving | 447 (33.7%) | 878 (66.3%) |
| Cleaning & Maintenance | 512 (58.4%) | 365 (41.6%) |
| Personal Care & Service | 94 (24.4%) | 291 (75.6%) |
| Total (Category) | 1,339 (36.2%) | 2,356 (63.8%) |
| Total (Overall) | 12,304 (55.4%) | 9,916 (44.6%) |
Sales and Office Occupations
The most common Sales and Office occupations in Bedford County are Office & Administration (2,329 | 10.5%), and Sales & Related (1,973 | 8.9%).

Sales and Office Occupations by Sex
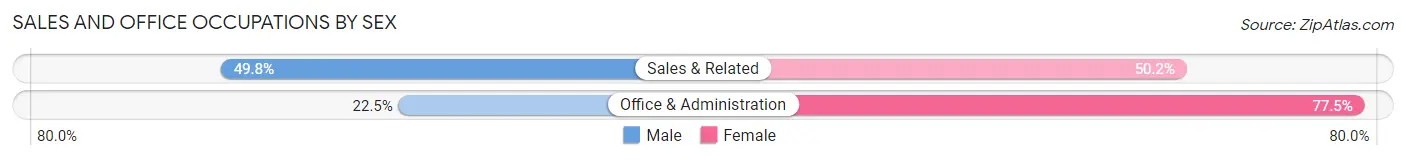
| Occupation | Male | Female |
| Sales & Related | 983 (49.8%) | 990 (50.2%) |
| Office & Administration | 523 (22.5%) | 1,806 (77.5%) |
| Total (Category) | 1,506 (35.0%) | 2,796 (65.0%) |
| Total (Overall) | 12,304 (55.4%) | 9,916 (44.6%) |
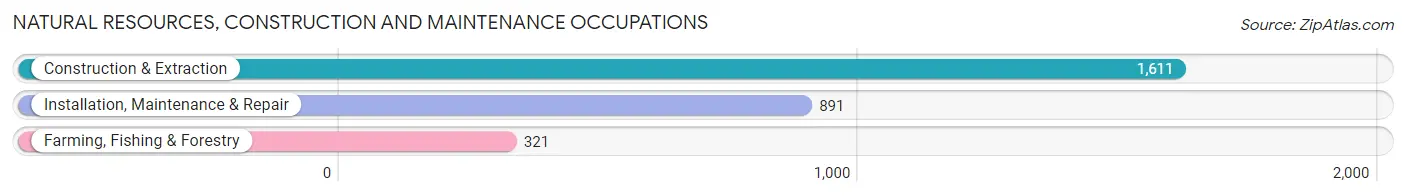
Natural Resources, Construction and Maintenance Occupations
The most common Natural Resources, Construction and Maintenance occupations in Bedford County are Construction & Extraction (1,611 | 7.2%), Installation, Maintenance & Repair (891 | 4.0%), and Farming, Fishing & Forestry (321 | 1.4%).
Natural Resources, Construction and Maintenance Occupations by Sex
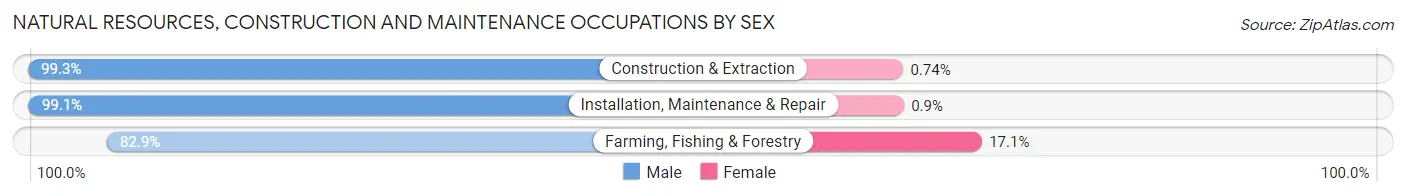
| Occupation | Male | Female |
| Farming, Fishing & Forestry | 266 (82.9%) | 55 (17.1%) |
| Construction & Extraction | 1,599 (99.3%) | 12 (0.7%) |
| Installation, Maintenance & Repair | 883 (99.1%) | 8 (0.9%) |
| Total (Category) | 2,748 (97.3%) | 75 (2.7%) |
| Total (Overall) | 12,304 (55.4%) | 9,916 (44.6%) |
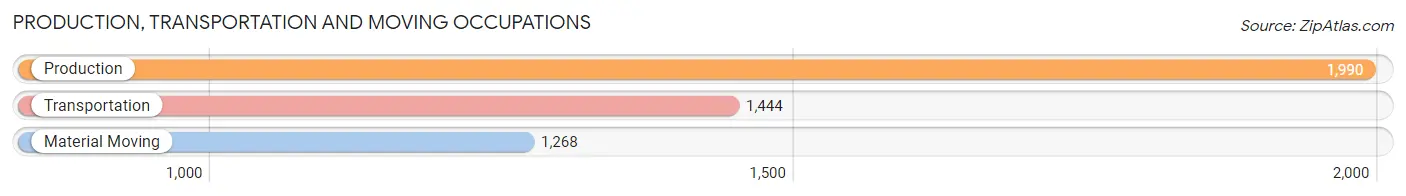
Production, Transportation and Moving Occupations
The most common Production, Transportation and Moving occupations in Bedford County are Production (1,990 | 9.0%), Transportation (1,444 | 6.5%), and Material Moving (1,268 | 5.7%).
Production, Transportation and Moving Occupations by Sex
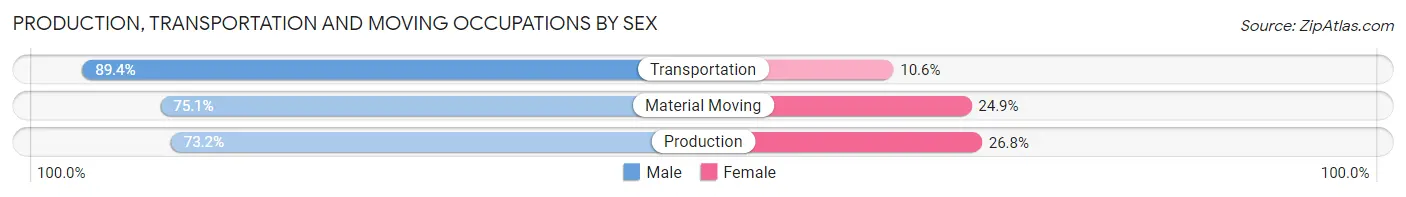
| Occupation | Male | Female |
| Production | 1,456 (73.2%) | 534 (26.8%) |
| Transportation | 1,291 (89.4%) | 153 (10.6%) |
| Material Moving | 952 (75.1%) | 316 (24.9%) |
| Total (Category) | 3,699 (78.7%) | 1,003 (21.3%) |
| Total (Overall) | 12,304 (55.4%) | 9,916 (44.6%) |
Employment Industries by Sex in Bedford County
Employment Industries in Bedford County
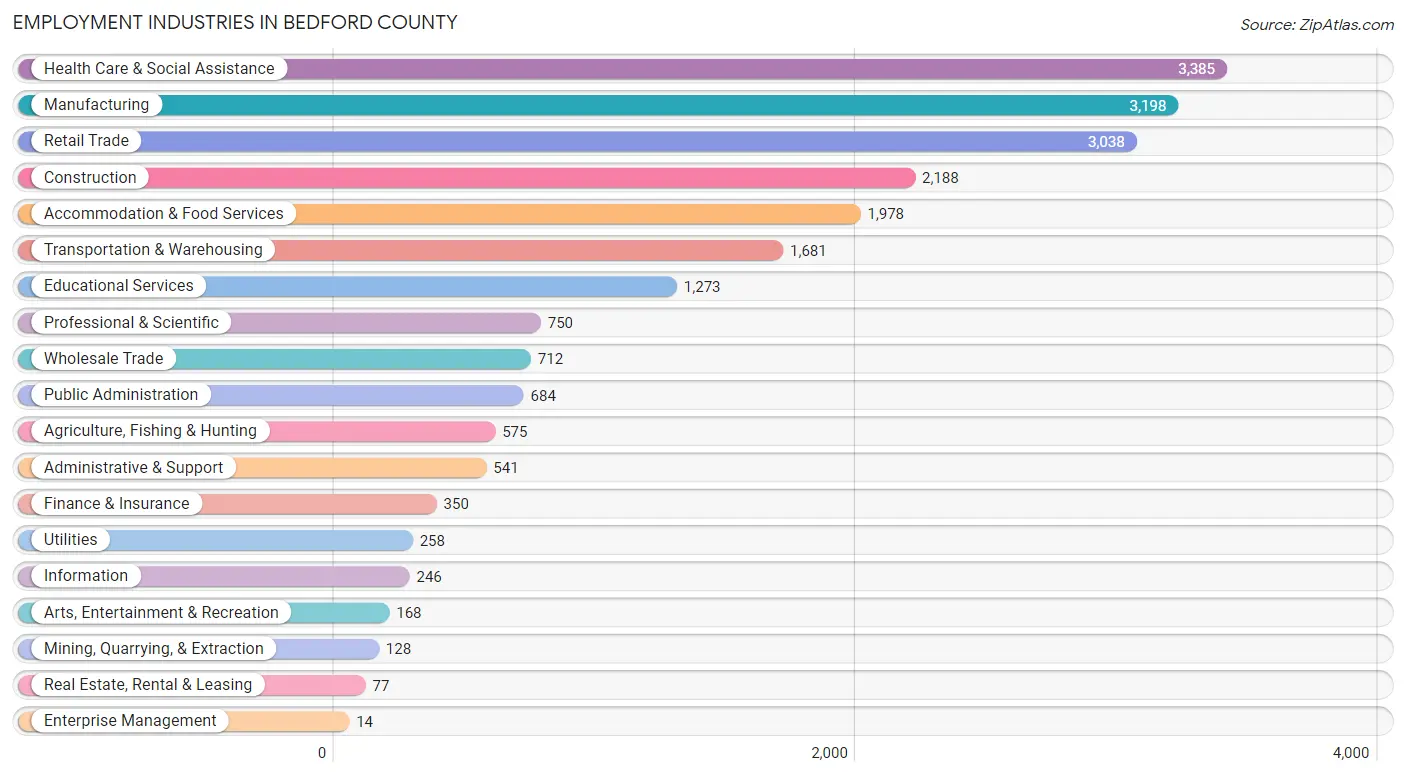
The major employment industries in Bedford County include Health Care & Social Assistance (3,385 | 15.2%), Manufacturing (3,198 | 14.4%), Retail Trade (3,038 | 13.7%), Construction (2,188 | 9.9%), and Accommodation & Food Services (1,978 | 8.9%).
Employment Industries by Sex in Bedford County
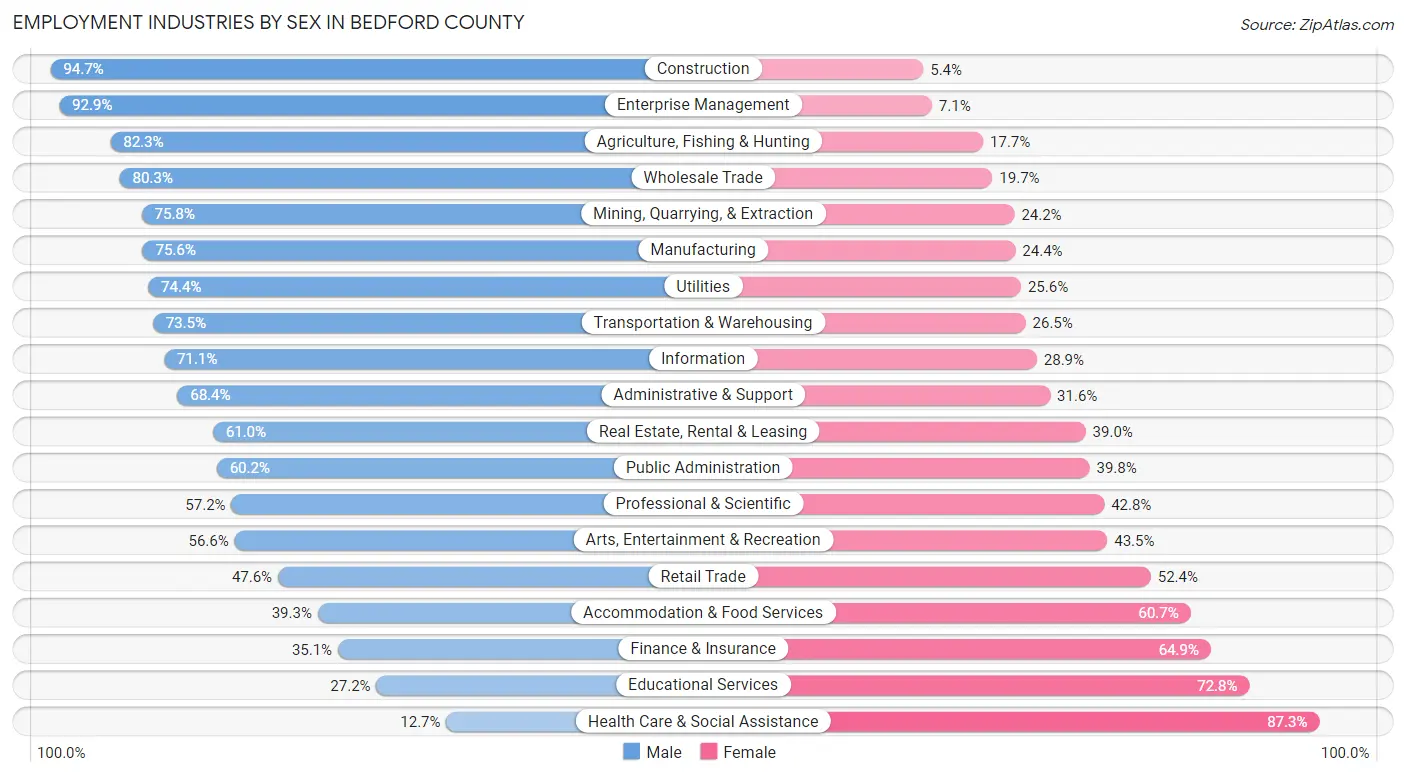
The Bedford County industries that see more men than women are Construction (94.7%), Enterprise Management (92.9%), and Agriculture, Fishing & Hunting (82.3%), whereas the industries that tend to have a higher number of women are Health Care & Social Assistance (87.3%), Educational Services (72.8%), and Finance & Insurance (64.9%).
| Industry | Male | Female |
| Agriculture, Fishing & Hunting | 473 (82.3%) | 102 (17.7%) |
| Mining, Quarrying, & Extraction | 97 (75.8%) | 31 (24.2%) |
| Construction | 2,071 (94.7%) | 117 (5.3%) |
| Manufacturing | 2,417 (75.6%) | 781 (24.4%) |
| Wholesale Trade | 572 (80.3%) | 140 (19.7%) |
| Retail Trade | 1,445 (47.6%) | 1,593 (52.4%) |
| Transportation & Warehousing | 1,235 (73.5%) | 446 (26.5%) |
| Utilities | 192 (74.4%) | 66 (25.6%) |
| Information | 175 (71.1%) | 71 (28.9%) |
| Finance & Insurance | 123 (35.1%) | 227 (64.9%) |
| Real Estate, Rental & Leasing | 47 (61.0%) | 30 (39.0%) |
| Professional & Scientific | 429 (57.2%) | 321 (42.8%) |
| Enterprise Management | 13 (92.9%) | 1 (7.1%) |
| Administrative & Support | 370 (68.4%) | 171 (31.6%) |
| Educational Services | 346 (27.2%) | 927 (72.8%) |
| Health Care & Social Assistance | 430 (12.7%) | 2,955 (87.3%) |
| Arts, Entertainment & Recreation | 95 (56.6%) | 73 (43.4%) |
| Accommodation & Food Services | 778 (39.3%) | 1,200 (60.7%) |
| Public Administration | 412 (60.2%) | 272 (39.8%) |
| Total | 12,304 (55.4%) | 9,916 (44.6%) |
Education in Bedford County
School Enrollment in Bedford County
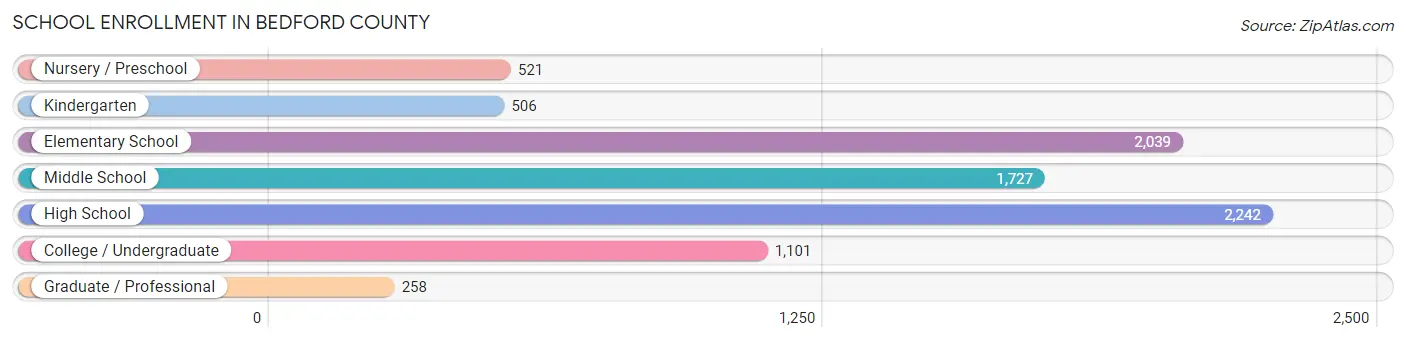
The most common levels of schooling among the 8,394 students in Bedford County are high school (2,242 | 26.7%), elementary school (2,039 | 24.3%), and middle school (1,727 | 20.6%).
| School Level | # Students | % Students |
| Nursery / Preschool | 521 | 6.2% |
| Kindergarten | 506 | 6.0% |
| Elementary School | 2,039 | 24.3% |
| Middle School | 1,727 | 20.6% |
| High School | 2,242 | 26.7% |
| College / Undergraduate | 1,101 | 13.1% |
| Graduate / Professional | 258 | 3.1% |
| Total | 8,394 | 100.0% |
School Enrollment by Age by Funding Source in Bedford County
Out of a total of 8,394 students who are enrolled in schools in Bedford County, 1,192 (14.2%) attend a private institution, while the remaining 7,202 (85.8%) are enrolled in public schools. The age group of 35 years and over has the highest likelihood of being enrolled in private schools, with 115 (32.3% in the age bracket) enrolled. Conversely, the age group of 15 to 17 year olds has the lowest likelihood of being enrolled in a private school, with 1,476 (91.4% in the age bracket) attending a public institution.
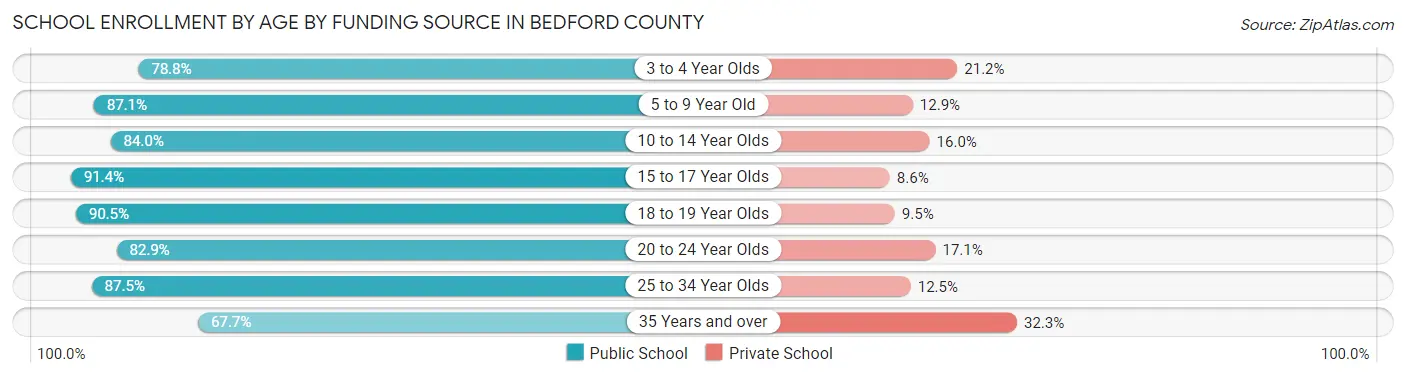
| Age Bracket | Public School | Private School |
| 3 to 4 Year Olds | 253 (78.8%) | 68 (21.2%) |
| 5 to 9 Year Old | 2,140 (87.1%) | 317 (12.9%) |
| 10 to 14 Year Olds | 1,966 (84.0%) | 375 (16.0%) |
| 15 to 17 Year Olds | 1,476 (91.4%) | 139 (8.6%) |
| 18 to 19 Year Olds | 455 (90.5%) | 48 (9.5%) |
| 20 to 24 Year Olds | 465 (82.9%) | 96 (17.1%) |
| 25 to 34 Year Olds | 210 (87.5%) | 30 (12.5%) |
| 35 Years and over | 241 (67.7%) | 115 (32.3%) |
| Total | 7,202 (85.8%) | 1,192 (14.2%) |
Educational Attainment by Field of Study in Bedford County
Education (1,395 | 23.0%), business (954 | 15.7%), science & technology (791 | 13.0%), bio, nature & agricultural (496 | 8.2%), and social sciences (392 | 6.5%) are the most common fields of study among 6,066 individuals in Bedford County who have obtained a bachelor's degree or higher.
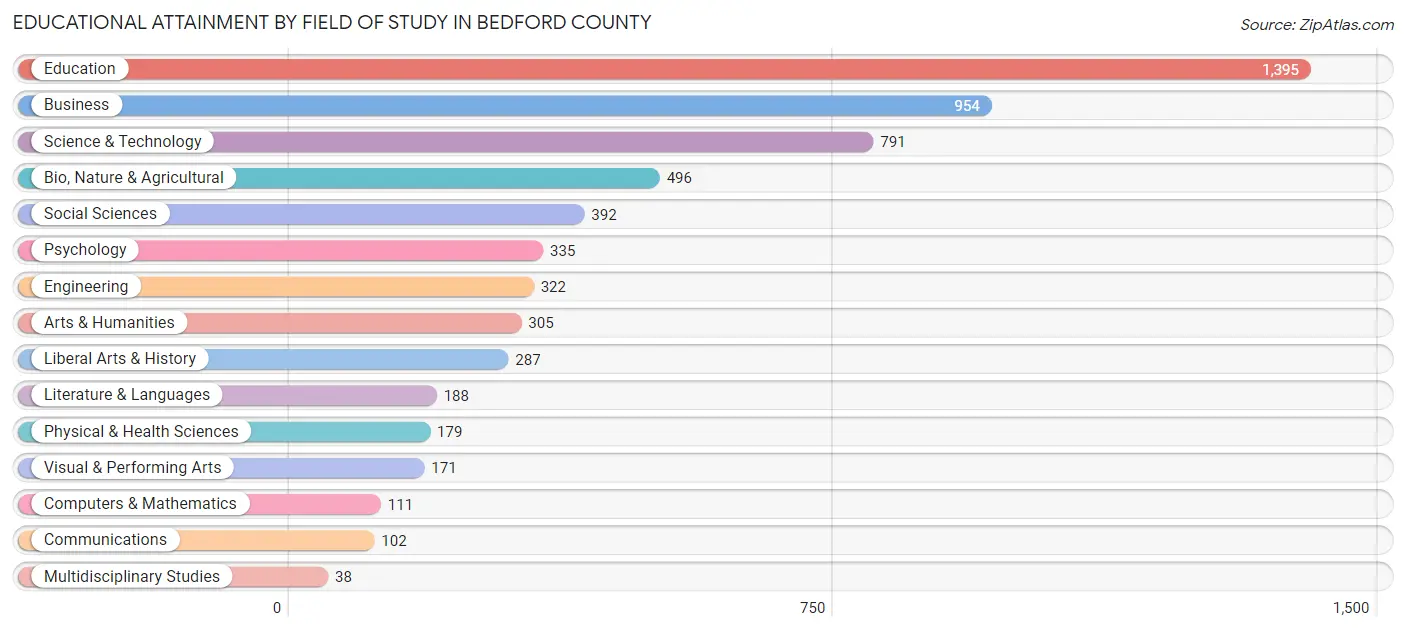
| Field of Study | # Graduates | % Graduates |
| Computers & Mathematics | 111 | 1.8% |
| Bio, Nature & Agricultural | 496 | 8.2% |
| Physical & Health Sciences | 179 | 2.9% |
| Psychology | 335 | 5.5% |
| Social Sciences | 392 | 6.5% |
| Engineering | 322 | 5.3% |
| Multidisciplinary Studies | 38 | 0.6% |
| Science & Technology | 791 | 13.0% |
| Business | 954 | 15.7% |
| Education | 1,395 | 23.0% |
| Literature & Languages | 188 | 3.1% |
| Liberal Arts & History | 287 | 4.7% |
| Visual & Performing Arts | 171 | 2.8% |
| Communications | 102 | 1.7% |
| Arts & Humanities | 305 | 5.0% |
| Total | 6,066 | 100.0% |
Transportation & Commute in Bedford County
Vehicle Availability by Sex in Bedford County
The most prevalent vehicle ownership categories in Bedford County are males with 2 vehicles (4,083, accounting for 33.9%) and females with 2 vehicles (3,533, making up 41.9%).
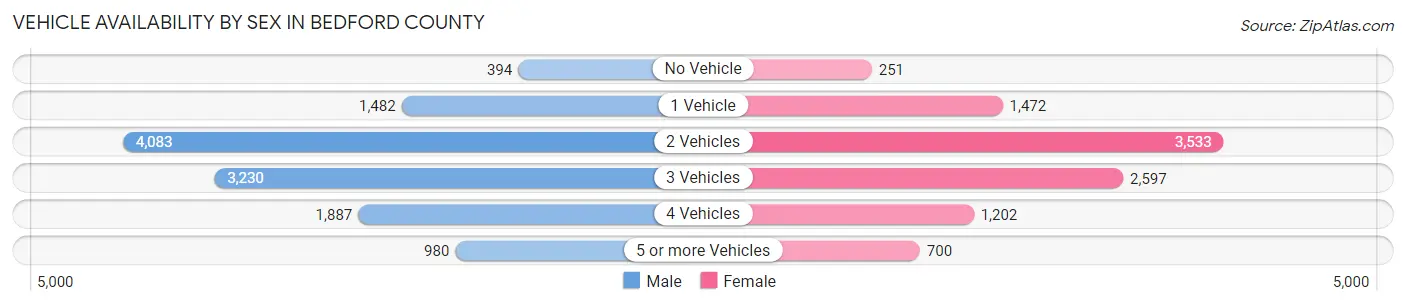
| Vehicles Available | Male | Female |
| No Vehicle | 394 (3.3%) | 251 (2.6%) |
| 1 Vehicle | 1,482 (12.3%) | 1,472 (15.1%) |
| 2 Vehicles | 4,083 (33.9%) | 3,533 (36.2%) |
| 3 Vehicles | 3,230 (26.8%) | 2,597 (26.6%) |
| 4 Vehicles | 1,887 (15.7%) | 1,202 (12.3%) |
| 5 or more Vehicles | 980 (8.1%) | 700 (7.2%) |
| Total | 12,056 (100.0%) | 9,755 (100.0%) |
Commute Time in Bedford County
The most frequently occuring commute durations in Bedford County are 10 to 14 minutes (3,017 commuters, 14.7%), 20 to 24 minutes (3,001 commuters, 14.6%), and 15 to 19 minutes (2,920 commuters, 14.2%).
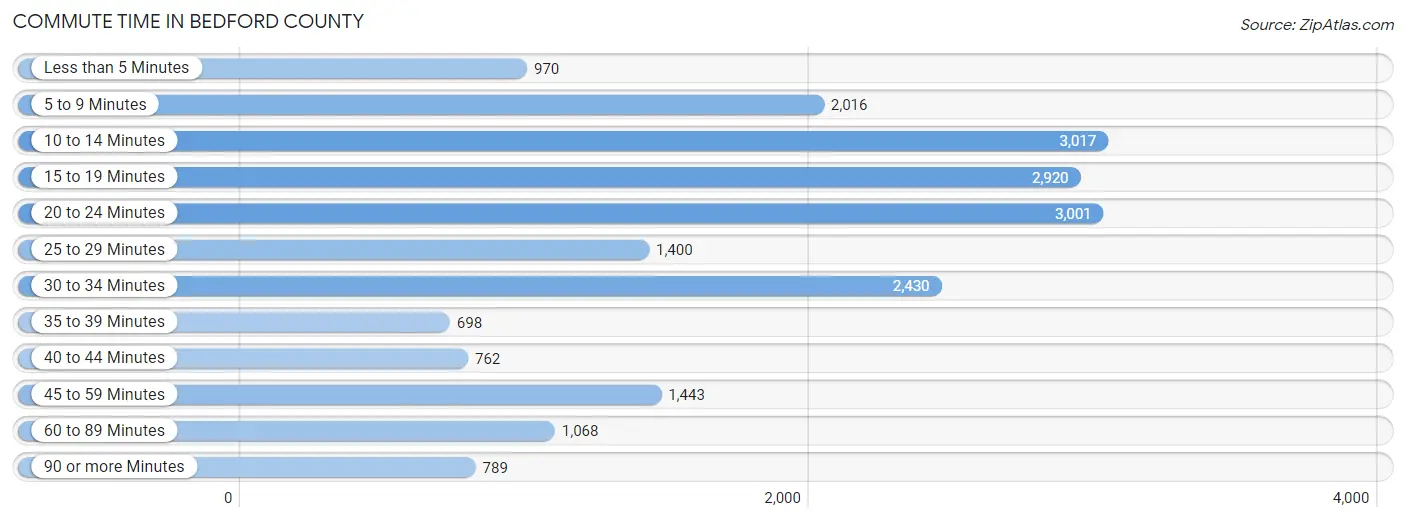
| Commute Time | # Commuters | % Commuters |
| Less than 5 Minutes | 970 | 4.7% |
| 5 to 9 Minutes | 2,016 | 9.8% |
| 10 to 14 Minutes | 3,017 | 14.7% |
| 15 to 19 Minutes | 2,920 | 14.2% |
| 20 to 24 Minutes | 3,001 | 14.6% |
| 25 to 29 Minutes | 1,400 | 6.8% |
| 30 to 34 Minutes | 2,430 | 11.8% |
| 35 to 39 Minutes | 698 | 3.4% |
| 40 to 44 Minutes | 762 | 3.7% |
| 45 to 59 Minutes | 1,443 | 7.0% |
| 60 to 89 Minutes | 1,068 | 5.2% |
| 90 or more Minutes | 789 | 3.8% |
Commute Time by Sex in Bedford County
The most common commute times in Bedford County are 20 to 24 minutes (1,640 commuters, 14.5%) for males and 10 to 14 minutes (1,548 commuters, 16.9%) for females.
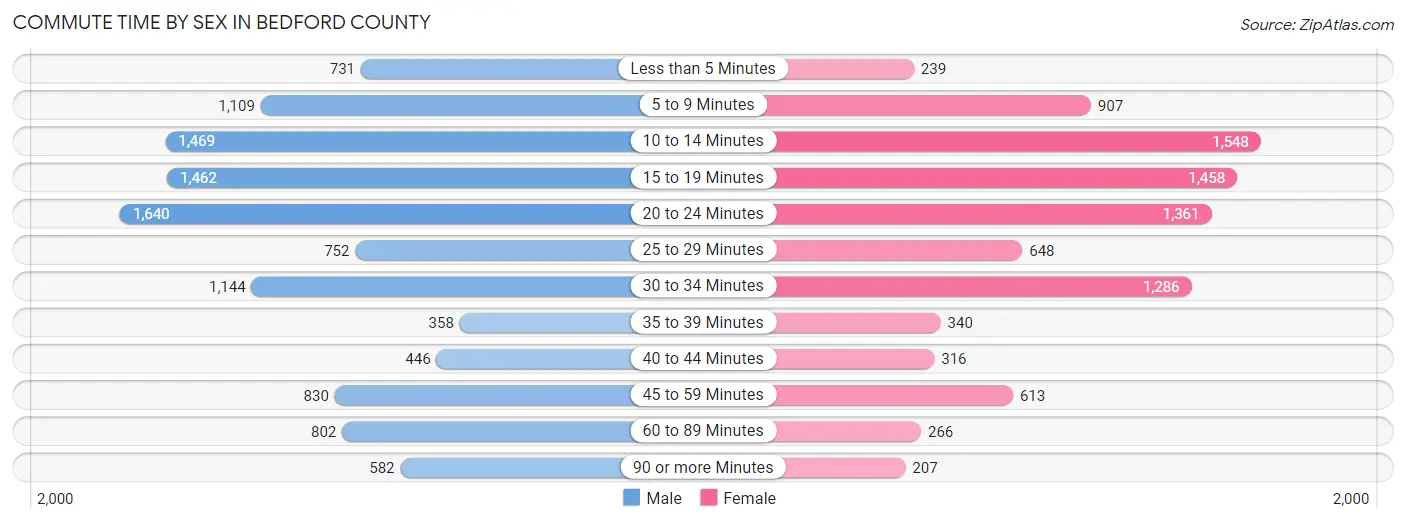
| Commute Time | Male | Female |
| Less than 5 Minutes | 731 (6.5%) | 239 (2.6%) |
| 5 to 9 Minutes | 1,109 (9.8%) | 907 (9.9%) |
| 10 to 14 Minutes | 1,469 (13.0%) | 1,548 (16.9%) |
| 15 to 19 Minutes | 1,462 (12.9%) | 1,458 (15.9%) |
| 20 to 24 Minutes | 1,640 (14.5%) | 1,361 (14.8%) |
| 25 to 29 Minutes | 752 (6.6%) | 648 (7.0%) |
| 30 to 34 Minutes | 1,144 (10.1%) | 1,286 (14.0%) |
| 35 to 39 Minutes | 358 (3.2%) | 340 (3.7%) |
| 40 to 44 Minutes | 446 (3.9%) | 316 (3.4%) |
| 45 to 59 Minutes | 830 (7.3%) | 613 (6.7%) |
| 60 to 89 Minutes | 802 (7.1%) | 266 (2.9%) |
| 90 or more Minutes | 582 (5.1%) | 207 (2.2%) |
Time of Departure to Work by Sex in Bedford County
The most frequent times of departure to work in Bedford County are 12:00 AM to 4:59 AM (1,700, 15.0%) for males and 7:30 AM to 7:59 AM (1,454, 15.8%) for females.
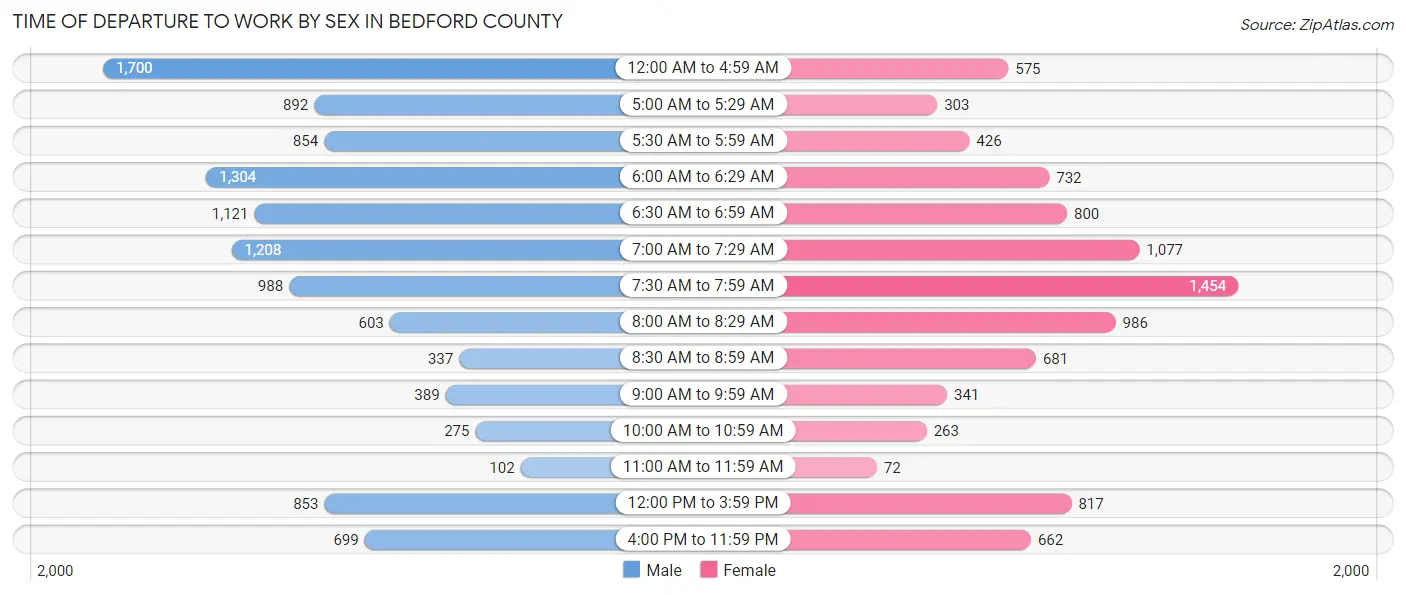
| Time of Departure | Male | Female |
| 12:00 AM to 4:59 AM | 1,700 (15.0%) | 575 (6.3%) |
| 5:00 AM to 5:29 AM | 892 (7.9%) | 303 (3.3%) |
| 5:30 AM to 5:59 AM | 854 (7.5%) | 426 (4.6%) |
| 6:00 AM to 6:29 AM | 1,304 (11.5%) | 732 (8.0%) |
| 6:30 AM to 6:59 AM | 1,121 (9.9%) | 800 (8.7%) |
| 7:00 AM to 7:29 AM | 1,208 (10.7%) | 1,077 (11.7%) |
| 7:30 AM to 7:59 AM | 988 (8.7%) | 1,454 (15.8%) |
| 8:00 AM to 8:29 AM | 603 (5.3%) | 986 (10.7%) |
| 8:30 AM to 8:59 AM | 337 (3.0%) | 681 (7.4%) |
| 9:00 AM to 9:59 AM | 389 (3.4%) | 341 (3.7%) |
| 10:00 AM to 10:59 AM | 275 (2.4%) | 263 (2.9%) |
| 11:00 AM to 11:59 AM | 102 (0.9%) | 72 (0.8%) |
| 12:00 PM to 3:59 PM | 853 (7.5%) | 817 (8.9%) |
| 4:00 PM to 11:59 PM | 699 (6.2%) | 662 (7.2%) |
| Total | 11,325 (100.0%) | 9,189 (100.0%) |
Housing Occupancy in Bedford County
Occupancy by Ownership in Bedford County
Of the total 19,571 dwellings in Bedford County, owner-occupied units account for 15,435 (78.9%), while renter-occupied units make up 4,136 (21.1%).
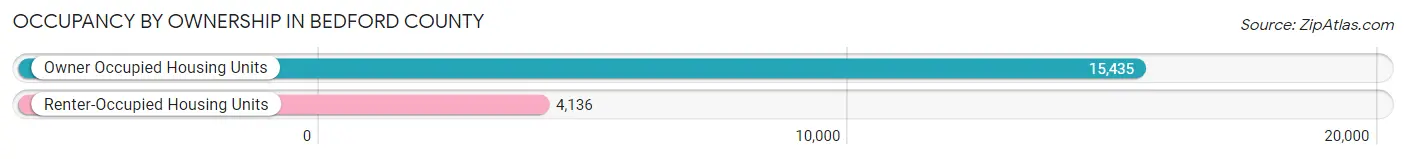
| Occupancy | # Housing Units | % Housing Units |
| Owner Occupied Housing Units | 15,435 | 78.9% |
| Renter-Occupied Housing Units | 4,136 | 21.1% |
| Total Occupied Housing Units | 19,571 | 100.0% |
Occupancy by Household Size in Bedford County
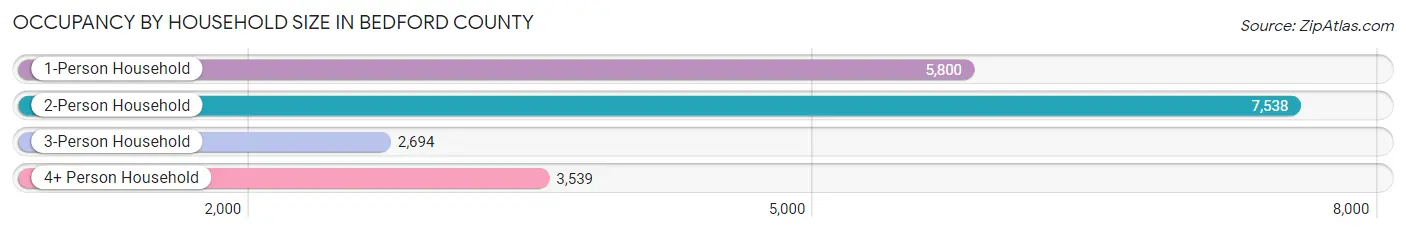
| Household Size | # Housing Units | % Housing Units |
| 1-Person Household | 5,800 | 29.6% |
| 2-Person Household | 7,538 | 38.5% |
| 3-Person Household | 2,694 | 13.8% |
| 4+ Person Household | 3,539 | 18.1% |
| Total Housing Units | 19,571 | 100.0% |
Occupancy by Ownership by Household Size in Bedford County
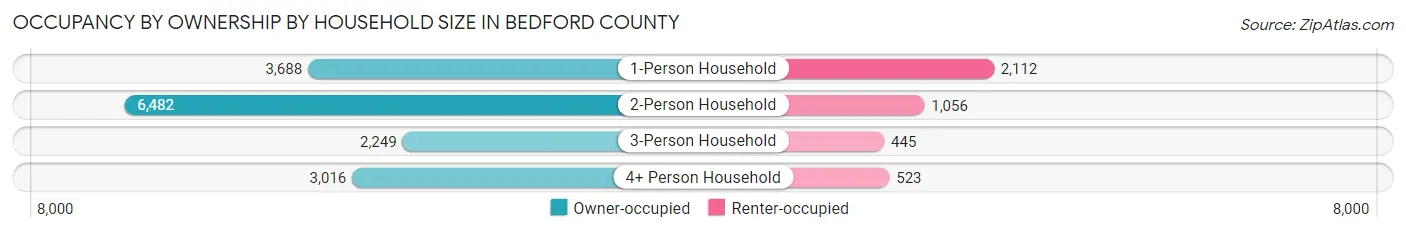
| Household Size | Owner-occupied | Renter-occupied |
| 1-Person Household | 3,688 (63.6%) | 2,112 (36.4%) |
| 2-Person Household | 6,482 (86.0%) | 1,056 (14.0%) |
| 3-Person Household | 2,249 (83.5%) | 445 (16.5%) |
| 4+ Person Household | 3,016 (85.2%) | 523 (14.8%) |
| Total Housing Units | 15,435 (78.9%) | 4,136 (21.1%) |
Occupancy by Educational Attainment in Bedford County
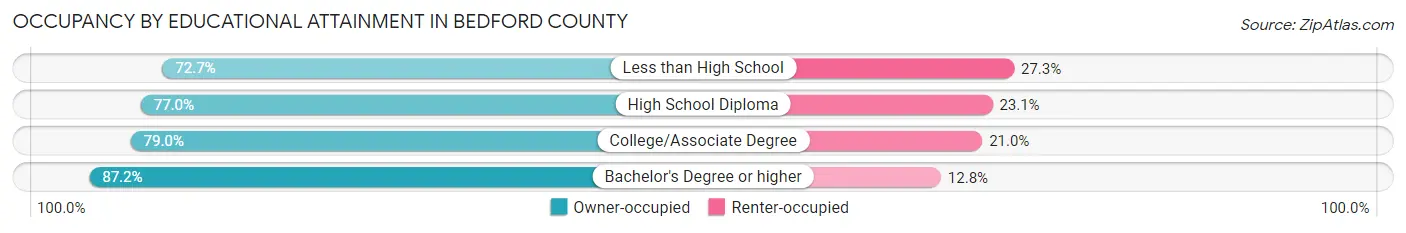
| Household Size | Owner-occupied | Renter-occupied |
| Less than High School | 1,316 (72.7%) | 495 (27.3%) |
| High School Diploma | 7,268 (76.9%) | 2,177 (23.1%) |
| College/Associate Degree | 3,828 (79.0%) | 1,019 (21.0%) |
| Bachelor's Degree or higher | 3,023 (87.2%) | 445 (12.8%) |
Occupancy by Age of Householder in Bedford County
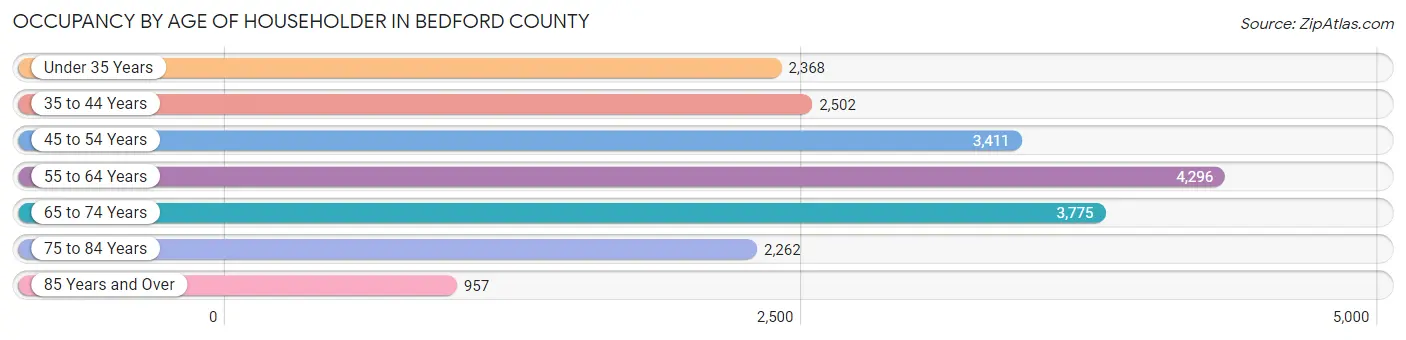
| Age Bracket | # Households | % Households |
| Under 35 Years | 2,368 | 12.1% |
| 35 to 44 Years | 2,502 | 12.8% |
| 45 to 54 Years | 3,411 | 17.4% |
| 55 to 64 Years | 4,296 | 22.0% |
| 65 to 74 Years | 3,775 | 19.3% |
| 75 to 84 Years | 2,262 | 11.6% |
| 85 Years and Over | 957 | 4.9% |
| Total | 19,571 | 100.0% |
Housing Finances in Bedford County
Median Income by Occupancy in Bedford County
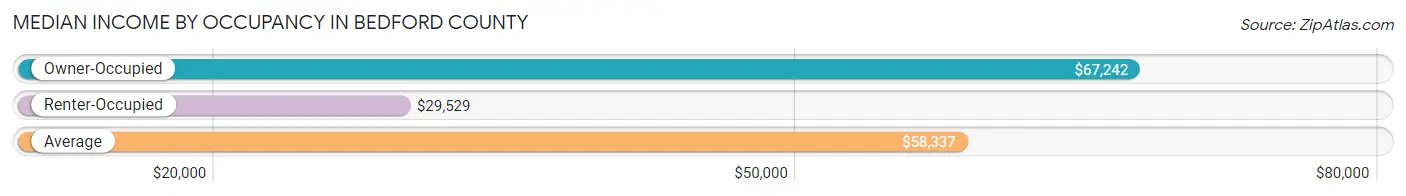
| Occupancy Type | # Households | Median Income |
| Owner-Occupied | 15,435 (78.9%) | $67,242 |
| Renter-Occupied | 4,136 (21.1%) | $29,529 |
| Average | 19,571 (100.0%) | $58,337 |
Occupancy by Householder Income Bracket in Bedford County
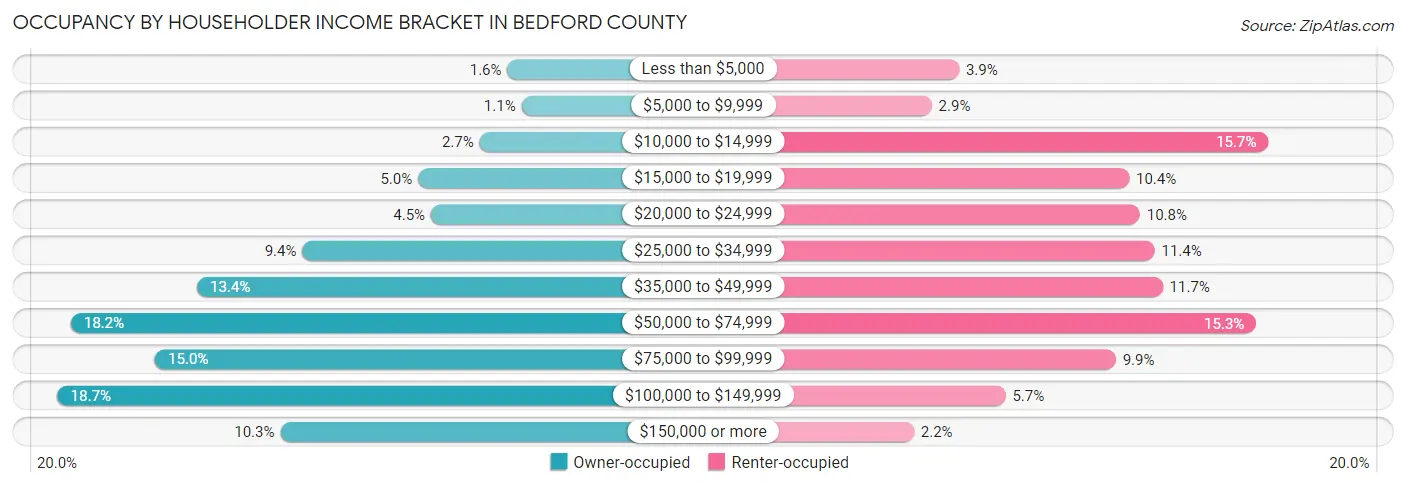
| Income Bracket | Owner-occupied | Renter-occupied |
| Less than $5,000 | 248 (1.6%) | 163 (3.9%) |
| $5,000 to $9,999 | 165 (1.1%) | 120 (2.9%) |
| $10,000 to $14,999 | 412 (2.7%) | 650 (15.7%) |
| $15,000 to $19,999 | 773 (5.0%) | 431 (10.4%) |
| $20,000 to $24,999 | 698 (4.5%) | 448 (10.8%) |
| $25,000 to $34,999 | 1,454 (9.4%) | 471 (11.4%) |
| $35,000 to $49,999 | 2,073 (13.4%) | 484 (11.7%) |
| $50,000 to $74,999 | 2,816 (18.2%) | 631 (15.3%) |
| $75,000 to $99,999 | 2,320 (15.0%) | 410 (9.9%) |
| $100,000 to $149,999 | 2,892 (18.7%) | 236 (5.7%) |
| $150,000 or more | 1,584 (10.3%) | 92 (2.2%) |
| Total | 15,435 (100.0%) | 4,136 (100.0%) |
Monthly Housing Cost Tiers in Bedford County
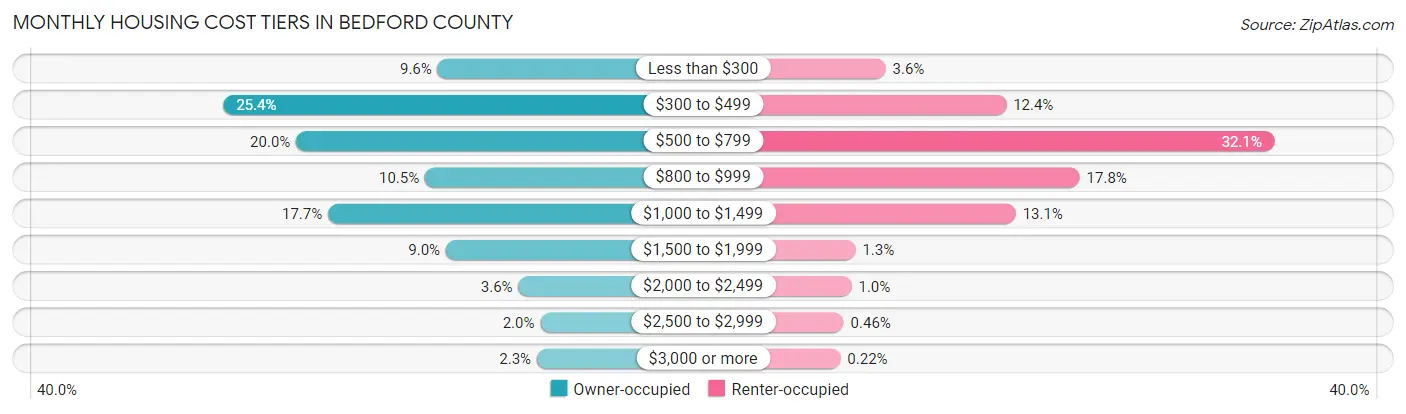
| Monthly Cost | Owner-occupied | Renter-occupied |
| Less than $300 | 1,478 (9.6%) | 147 (3.5%) |
| $300 to $499 | 3,916 (25.4%) | 514 (12.4%) |
| $500 to $799 | 3,087 (20.0%) | 1,329 (32.1%) |
| $800 to $999 | 1,622 (10.5%) | 738 (17.8%) |
| $1,000 to $1,499 | 2,725 (17.6%) | 543 (13.1%) |
| $1,500 to $1,999 | 1,385 (9.0%) | 55 (1.3%) |
| $2,000 to $2,499 | 560 (3.6%) | 43 (1.0%) |
| $2,500 to $2,999 | 312 (2.0%) | 19 (0.5%) |
| $3,000 or more | 350 (2.3%) | 9 (0.2%) |
| Total | 15,435 (100.0%) | 4,136 (100.0%) |
Physical Housing Characteristics in Bedford County
Housing Structures in Bedford County
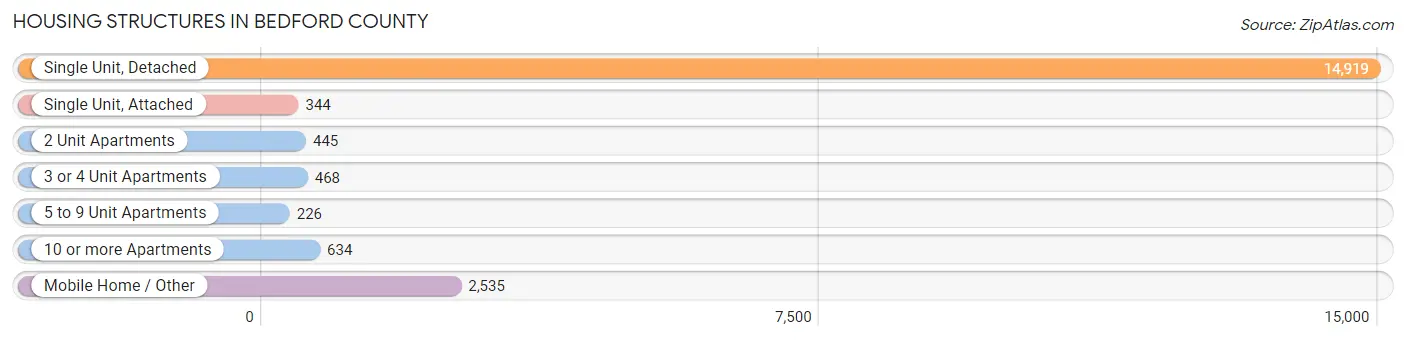
| Structure Type | # Housing Units | % Housing Units |
| Single Unit, Detached | 14,919 | 76.2% |
| Single Unit, Attached | 344 | 1.8% |
| 2 Unit Apartments | 445 | 2.3% |
| 3 or 4 Unit Apartments | 468 | 2.4% |
| 5 to 9 Unit Apartments | 226 | 1.1% |
| 10 or more Apartments | 634 | 3.2% |
| Mobile Home / Other | 2,535 | 13.0% |
| Total | 19,571 | 100.0% |
Housing Structures by Occupancy in Bedford County
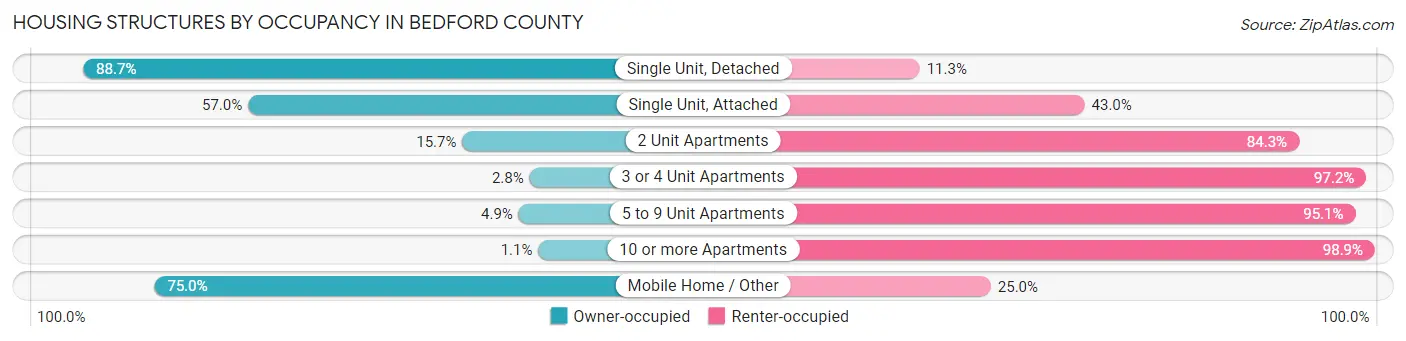
| Structure Type | Owner-occupied | Renter-occupied |
| Single Unit, Detached | 13,236 (88.7%) | 1,683 (11.3%) |
| Single Unit, Attached | 196 (57.0%) | 148 (43.0%) |
| 2 Unit Apartments | 70 (15.7%) | 375 (84.3%) |
| 3 or 4 Unit Apartments | 13 (2.8%) | 455 (97.2%) |
| 5 to 9 Unit Apartments | 11 (4.9%) | 215 (95.1%) |
| 10 or more Apartments | 7 (1.1%) | 627 (98.9%) |
| Mobile Home / Other | 1,902 (75.0%) | 633 (25.0%) |
| Total | 15,435 (78.9%) | 4,136 (21.1%) |
Housing Structures by Number of Rooms in Bedford County
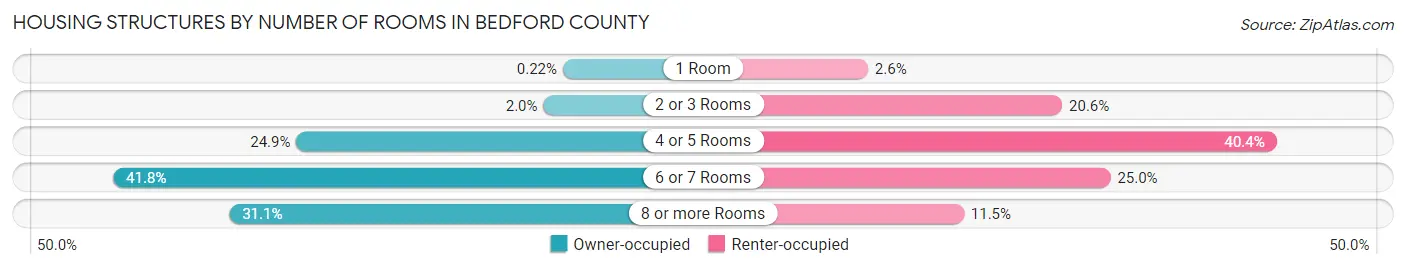
| Number of Rooms | Owner-occupied | Renter-occupied |
| 1 Room | 34 (0.2%) | 107 (2.6%) |
| 2 or 3 Rooms | 312 (2.0%) | 850 (20.5%) |
| 4 or 5 Rooms | 3,839 (24.9%) | 1,670 (40.4%) |
| 6 or 7 Rooms | 6,454 (41.8%) | 1,035 (25.0%) |
| 8 or more Rooms | 4,796 (31.1%) | 474 (11.5%) |
| Total | 15,435 (100.0%) | 4,136 (100.0%) |
Housing Structure by Heating Type in Bedford County
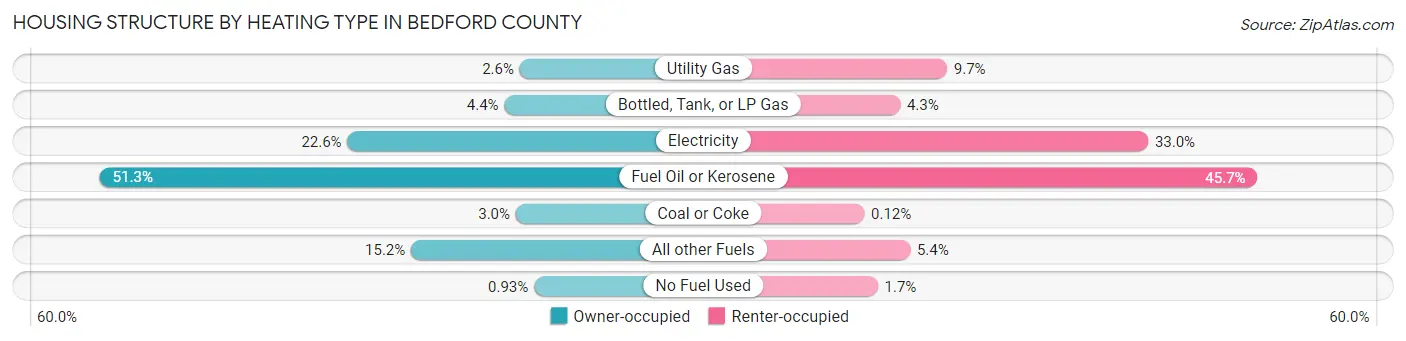
| Heating Type | Owner-occupied | Renter-occupied |
| Utility Gas | 400 (2.6%) | 402 (9.7%) |
| Bottled, Tank, or LP Gas | 675 (4.4%) | 177 (4.3%) |
| Electricity | 3,484 (22.6%) | 1,366 (33.0%) |
| Fuel Oil or Kerosene | 7,918 (51.3%) | 1,891 (45.7%) |
| Coal or Coke | 469 (3.0%) | 5 (0.1%) |
| All other Fuels | 2,345 (15.2%) | 225 (5.4%) |
| No Fuel Used | 144 (0.9%) | 70 (1.7%) |
| Total | 15,435 (100.0%) | 4,136 (100.0%) |
Household Vehicle Usage in Bedford County
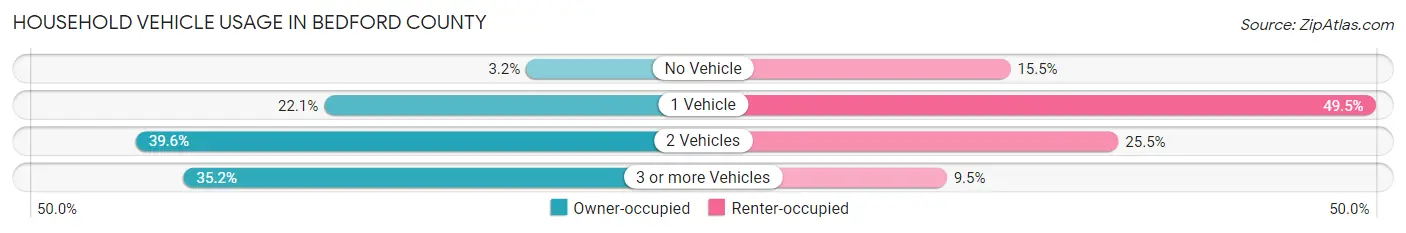
| Vehicles per Household | Owner-occupied | Renter-occupied |
| No Vehicle | 492 (3.2%) | 639 (15.4%) |
| 1 Vehicle | 3,403 (22.1%) | 2,048 (49.5%) |
| 2 Vehicles | 6,115 (39.6%) | 1,056 (25.5%) |
| 3 or more Vehicles | 5,425 (35.1%) | 393 (9.5%) |
| Total | 15,435 (100.0%) | 4,136 (100.0%) |
Real Estate & Mortgages in Bedford County
Real Estate and Mortgage Overview in Bedford County
| Characteristic | Without Mortgage | With Mortgage |
| Housing Units | 8,154 | 7,281 |
| Median Property Value | $146,100 | $181,300 |
| Median Household Income | $49,390 | $970 |
| Monthly Housing Costs | $421 | $345 |
| Real Estate Taxes | $1,299 | $157 |
Property Value by Mortgage Status in Bedford County
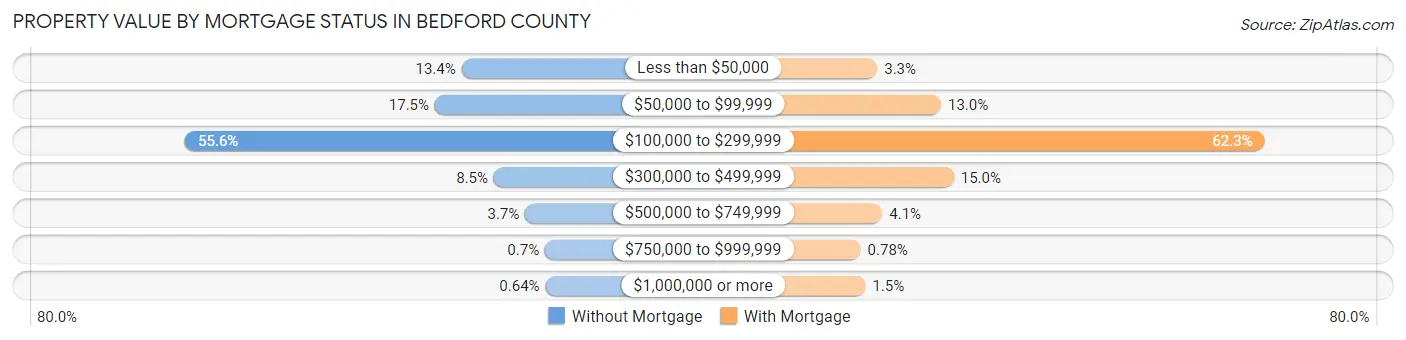
| Property Value | Without Mortgage | With Mortgage |
| Less than $50,000 | 1,094 (13.4%) | 241 (3.3%) |
| $50,000 to $99,999 | 1,425 (17.5%) | 949 (13.0%) |
| $100,000 to $299,999 | 4,530 (55.6%) | 4,537 (62.3%) |
| $300,000 to $499,999 | 692 (8.5%) | 1,090 (15.0%) |
| $500,000 to $749,999 | 304 (3.7%) | 297 (4.1%) |
| $750,000 to $999,999 | 57 (0.7%) | 57 (0.8%) |
| $1,000,000 or more | 52 (0.6%) | 110 (1.5%) |
| Total | 8,154 (100.0%) | 7,281 (100.0%) |
Household Income by Mortgage Status in Bedford County
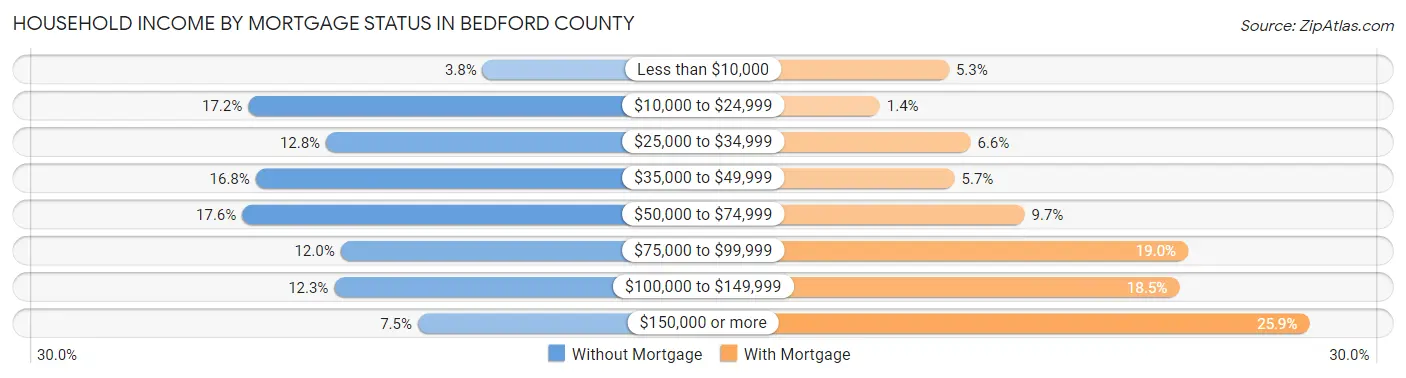
| Household Income | Without Mortgage | With Mortgage |
| Less than $10,000 | 312 (3.8%) | 389 (5.3%) |
| $10,000 to $24,999 | 1,405 (17.2%) | 101 (1.4%) |
| $25,000 to $34,999 | 1,042 (12.8%) | 478 (6.6%) |
| $35,000 to $49,999 | 1,370 (16.8%) | 412 (5.7%) |
| $50,000 to $74,999 | 1,433 (17.6%) | 703 (9.7%) |
| $75,000 to $99,999 | 974 (11.9%) | 1,383 (19.0%) |
| $100,000 to $149,999 | 1,004 (12.3%) | 1,346 (18.5%) |
| $150,000 or more | 614 (7.5%) | 1,888 (25.9%) |
| Total | 8,154 (100.0%) | 7,281 (100.0%) |
Property Value to Household Income Ratio in Bedford County
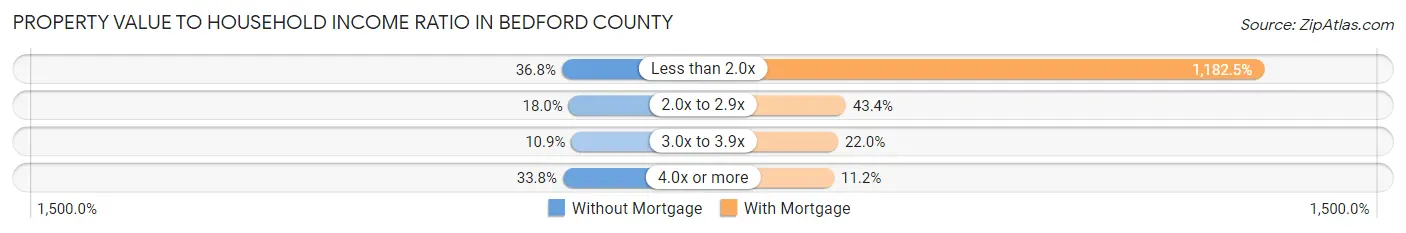
| Value-to-Income Ratio | Without Mortgage | With Mortgage |
| Less than 2.0x | 2,999 (36.8%) | 86,096 (1,182.5%) |
| 2.0x to 2.9x | 1,466 (18.0%) | 3,163 (43.4%) |
| 3.0x to 3.9x | 888 (10.9%) | 1,603 (22.0%) |
| 4.0x or more | 2,753 (33.8%) | 812 (11.2%) |
| Total | 8,154 (100.0%) | 7,281 (100.0%) |
Real Estate Taxes by Mortgage Status in Bedford County
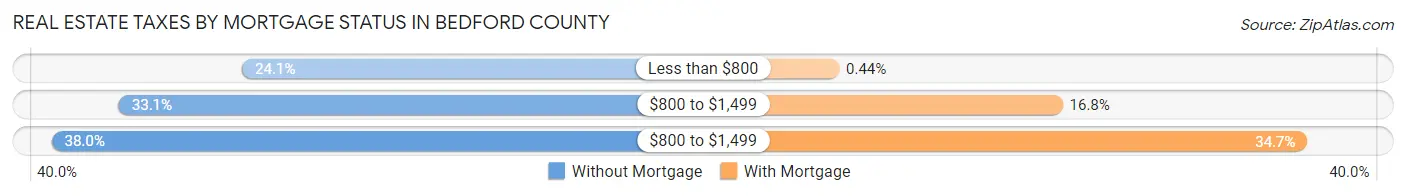
| Property Taxes | Without Mortgage | With Mortgage |
| Less than $800 | 1,966 (24.1%) | 32 (0.4%) |
| $800 to $1,499 | 2,700 (33.1%) | 1,221 (16.8%) |
| $800 to $1,499 | 3,101 (38.0%) | 2,523 (34.6%) |
| Total | 8,154 (100.0%) | 7,281 (100.0%) |
Health & Disability in Bedford County
Health Insurance Coverage by Age in Bedford County
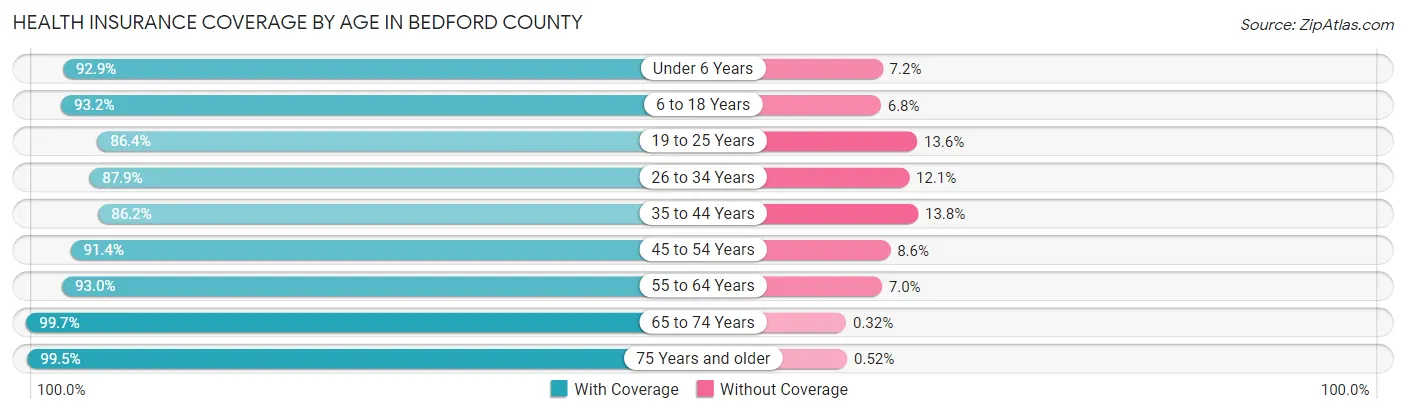
| Age Bracket | With Coverage | Without Coverage |
| Under 6 Years | 2,778 (92.8%) | 214 (7.1%) |
| 6 to 18 Years | 6,297 (93.2%) | 460 (6.8%) |
| 19 to 25 Years | 3,070 (86.4%) | 482 (13.6%) |
| 26 to 34 Years | 3,875 (87.9%) | 532 (12.1%) |
| 35 to 44 Years | 4,248 (86.2%) | 678 (13.8%) |
| 45 to 54 Years | 5,769 (91.4%) | 540 (8.6%) |
| 55 to 64 Years | 7,003 (93.0%) | 528 (7.0%) |
| 65 to 74 Years | 5,978 (99.7%) | 19 (0.3%) |
| 75 Years and older | 4,750 (99.5%) | 25 (0.5%) |
| Total | 43,768 (92.6%) | 3,478 (7.4%) |
Health Insurance Coverage by Citizenship Status in Bedford County
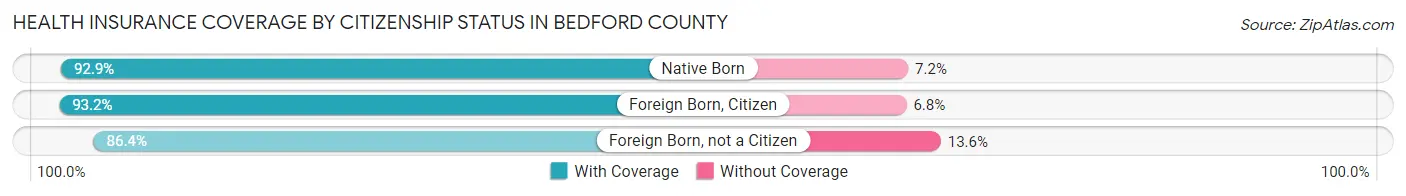
| Citizenship Status | With Coverage | Without Coverage |
| Native Born | 2,778 (92.8%) | 214 (7.1%) |
| Foreign Born, Citizen | 6,297 (93.2%) | 460 (6.8%) |
| Foreign Born, not a Citizen | 3,070 (86.4%) | 482 (13.6%) |
Health Insurance Coverage by Household Income in Bedford County
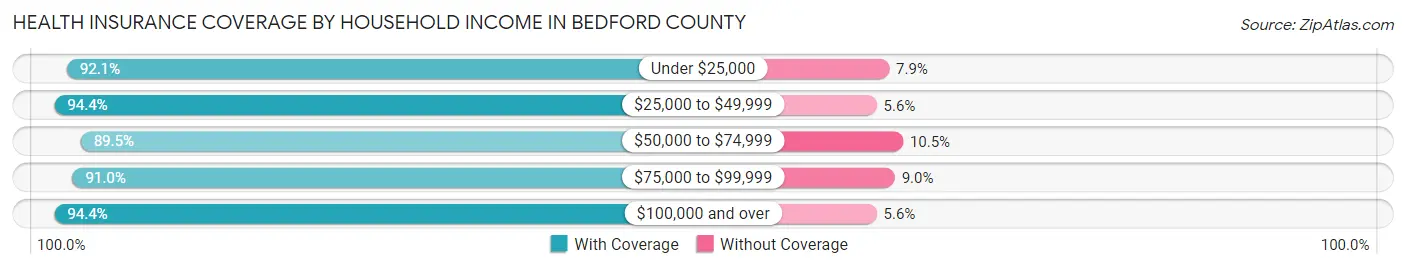
| Household Income | With Coverage | Without Coverage |
| Under $25,000 | 5,709 (92.1%) | 491 (7.9%) |
| $25,000 to $49,999 | 8,882 (94.4%) | 526 (5.6%) |
| $50,000 to $74,999 | 7,533 (89.5%) | 886 (10.5%) |
| $75,000 to $99,999 | 6,763 (91.0%) | 667 (9.0%) |
| $100,000 and over | 14,811 (94.4%) | 877 (5.6%) |
Public vs Private Health Insurance Coverage by Age in Bedford County
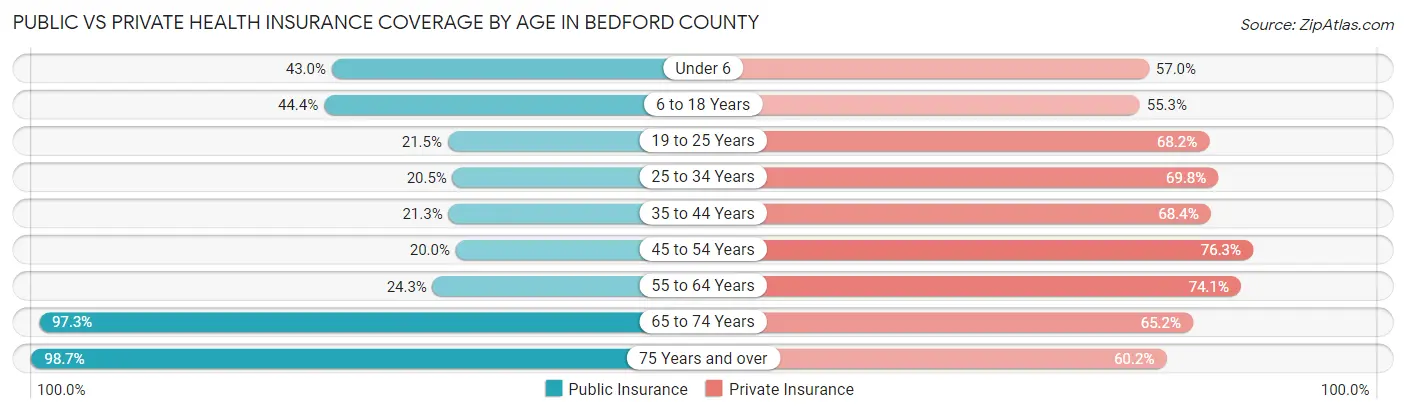
| Age Bracket | Public Insurance | Private Insurance |
| Under 6 | 1,286 (43.0%) | 1,705 (57.0%) |
| 6 to 18 Years | 3,001 (44.4%) | 3,738 (55.3%) |
| 19 to 25 Years | 762 (21.4%) | 2,421 (68.2%) |
| 25 to 34 Years | 905 (20.5%) | 3,078 (69.8%) |
| 35 to 44 Years | 1,050 (21.3%) | 3,371 (68.4%) |
| 45 to 54 Years | 1,260 (20.0%) | 4,813 (76.3%) |
| 55 to 64 Years | 1,826 (24.2%) | 5,577 (74.1%) |
| 65 to 74 Years | 5,837 (97.3%) | 3,907 (65.1%) |
| 75 Years and over | 4,715 (98.7%) | 2,875 (60.2%) |
| Total | 20,642 (43.7%) | 31,485 (66.6%) |
Disability Status by Sex by Age in Bedford County
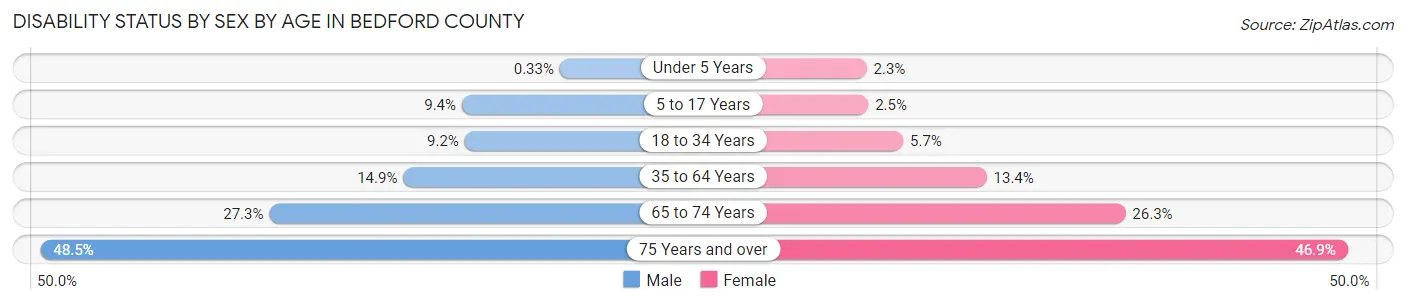
| Age Bracket | Male | Female |
| Under 5 Years | 4 (0.3%) | 27 (2.3%) |
| 5 to 17 Years | 327 (9.4%) | 82 (2.5%) |
| 18 to 34 Years | 407 (9.2%) | 231 (5.7%) |
| 35 to 64 Years | 1,411 (14.9%) | 1,246 (13.4%) |
| 65 to 74 Years | 806 (27.3%) | 801 (26.3%) |
| 75 Years and over | 1,007 (48.5%) | 1,267 (46.9%) |
Disability Class by Sex by Age in Bedford County
Disability Class: Hearing Difficulty
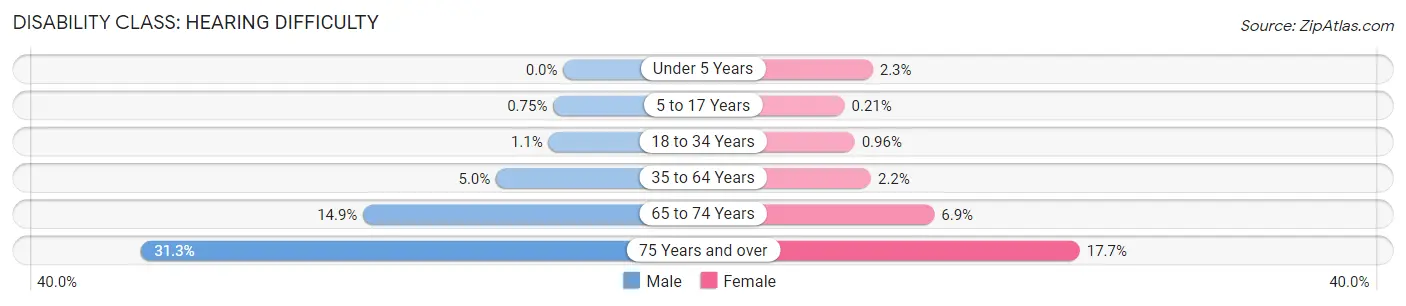
| Age Bracket | Male | Female |
| Under 5 Years | 0 (0.0%) | 27 (2.3%) |
| 5 to 17 Years | 26 (0.7%) | 7 (0.2%) |
| 18 to 34 Years | 49 (1.1%) | 39 (1.0%) |
| 35 to 64 Years | 474 (5.0%) | 201 (2.2%) |
| 65 to 74 Years | 439 (14.9%) | 209 (6.9%) |
| 75 Years and over | 650 (31.3%) | 477 (17.7%) |
Disability Class: Vision Difficulty
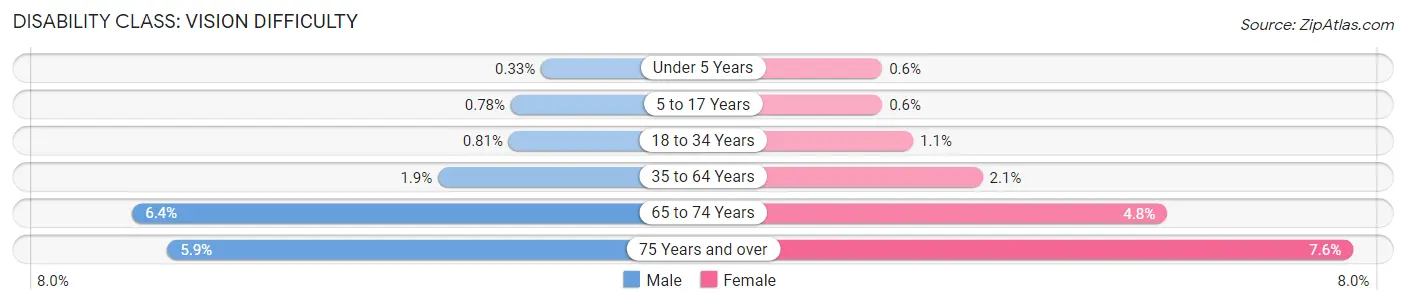
| Age Bracket | Male | Female |
| Under 5 Years | 4 (0.3%) | 7 (0.6%) |
| 5 to 17 Years | 27 (0.8%) | 20 (0.6%) |
| 18 to 34 Years | 36 (0.8%) | 43 (1.1%) |
| 35 to 64 Years | 177 (1.9%) | 194 (2.1%) |
| 65 to 74 Years | 189 (6.4%) | 147 (4.8%) |
| 75 Years and over | 122 (5.9%) | 205 (7.6%) |
Disability Class: Cognitive Difficulty
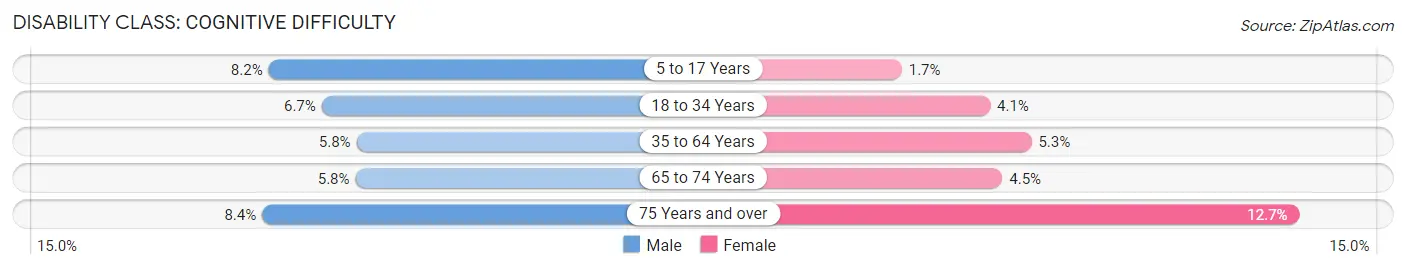
| Age Bracket | Male | Female |
| 5 to 17 Years | 285 (8.2%) | 56 (1.7%) |
| 18 to 34 Years | 299 (6.7%) | 168 (4.1%) |
| 35 to 64 Years | 547 (5.8%) | 489 (5.3%) |
| 65 to 74 Years | 171 (5.8%) | 136 (4.5%) |
| 75 Years and over | 174 (8.4%) | 344 (12.7%) |
Disability Class: Ambulatory Difficulty
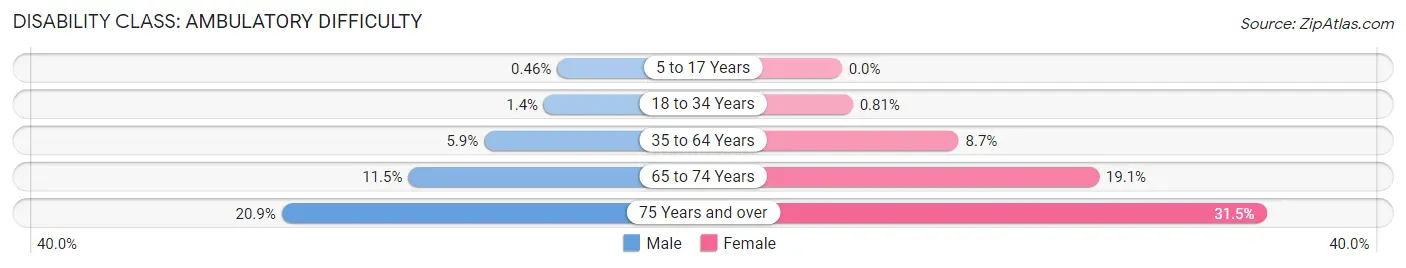
| Age Bracket | Male | Female |
| 5 to 17 Years | 16 (0.5%) | 0 (0.0%) |
| 18 to 34 Years | 64 (1.4%) | 33 (0.8%) |
| 35 to 64 Years | 559 (5.9%) | 804 (8.7%) |
| 65 to 74 Years | 340 (11.5%) | 581 (19.1%) |
| 75 Years and over | 434 (20.9%) | 851 (31.5%) |
Disability Class: Self-Care Difficulty
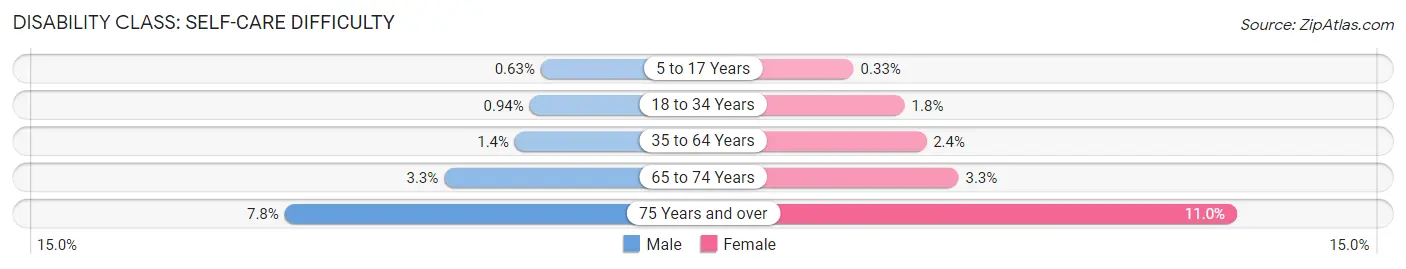
| Age Bracket | Male | Female |
| 5 to 17 Years | 22 (0.6%) | 11 (0.3%) |
| 18 to 34 Years | 42 (0.9%) | 71 (1.8%) |
| 35 to 64 Years | 128 (1.3%) | 218 (2.4%) |
| 65 to 74 Years | 98 (3.3%) | 99 (3.3%) |
| 75 Years and over | 161 (7.8%) | 297 (11.0%) |
Technology Access in Bedford County
Computing Device Access in Bedford County
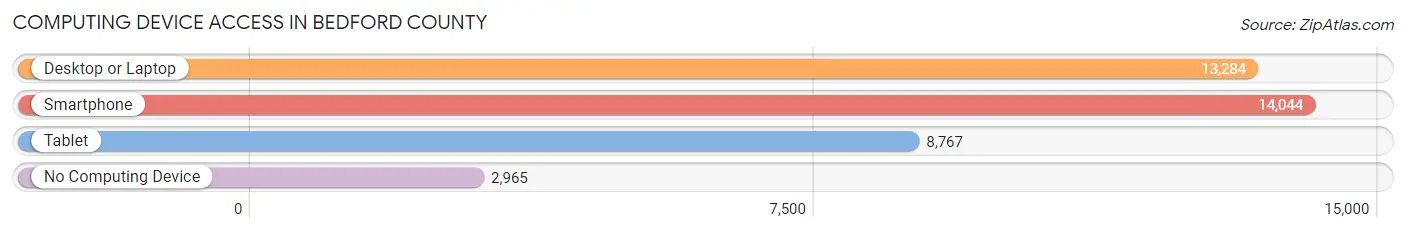
| Device Type | # Households | % Households |
| Desktop or Laptop | 13,284 | 67.9% |
| Smartphone | 14,044 | 71.8% |
| Tablet | 8,767 | 44.8% |
| No Computing Device | 2,965 | 15.1% |
| Total | 19,571 | 100.0% |
Internet Access in Bedford County
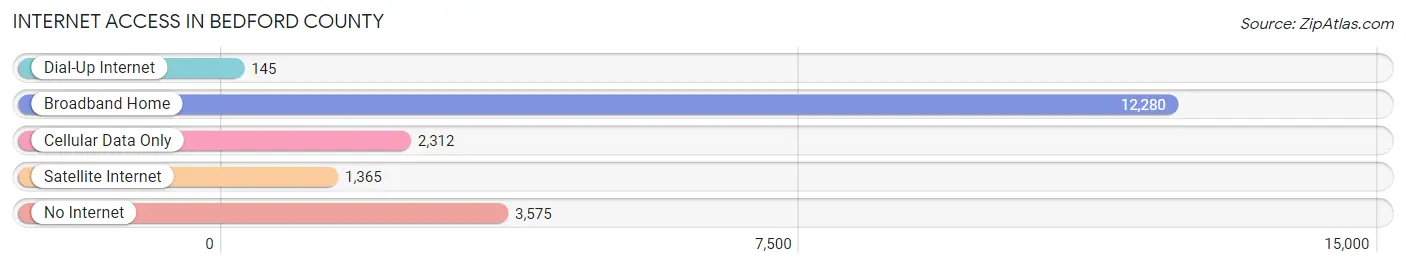
| Internet Type | # Households | % Households |
| Dial-Up Internet | 145 | 0.7% |
| Broadband Home | 12,280 | 62.7% |
| Cellular Data Only | 2,312 | 11.8% |
| Satellite Internet | 1,365 | 7.0% |
| No Internet | 3,575 | 18.3% |
| Total | 19,571 | 100.0% |
Bedford County Summary
Bedford County, Pennsylvania is located in the south-central part of the state and is part of the Allegheny Mountains region. It is bordered by Fulton County to the north, Huntingdon County to the east, Somerset County to the south, and Westmoreland County to the west. The county seat is Bedford, and the county has a total area of 1,017 square miles.
Geography
Bedford County is located in the Allegheny Mountains region of Pennsylvania. The county is mostly mountainous, with the highest point being Tussey Mountain at 2,890 feet. The county is drained by the Raystown Branch of the Juniata River, which flows through the center of the county. The county is also home to several state parks, including Shawnee State Park, Blue Knob State Park, and Greenwood Furnace State Park.
Economy
The economy of Bedford County is largely based on agriculture and tourism. The county is home to several large farms, including the Bedford County Farm Bureau, which is the largest farm in the county. The county is also home to several wineries, including the Bedford County Winery and the Bedford County Vineyard. Tourism is also an important part of the economy, with the county being home to several popular attractions, including the Bedford County Fair, the Bedford County Historical Society, and the Bedford County Railroad Museum.
Demographics
As of the 2010 census, the population of Bedford County was 49,762. The population is largely white (95.2%), with small percentages of African American (2.2%), Hispanic (1.2%), and Asian (0.7%) populations. The median household income in the county is $45,945, and the median home value is $133,400.
Education
Bedford County is served by the Bedford Area School District, which includes seven elementary schools, two middle schools, and one high school. The county is also home to several private schools, including the Bedford Christian Academy and the Bedford County Christian School. The county is also home to several higher education institutions, including the University of Pittsburgh at Johnstown, Penn State Altoona, and the University of Pittsburgh at Greensburg.
Conclusion
Bedford County, Pennsylvania is a rural county located in the Allegheny Mountains region of the state. The county is largely agricultural, with a strong tourism industry. The population is largely white, with small percentages of African American, Hispanic, and Asian populations. The county is served by the Bedford Area School District, as well as several private schools and higher education institutions.
Common Questions
What is Per Capita Income in Bedford County?
Per Capita income in Bedford County is $31,269.
What is the Median Family Income in Bedford County?
Median Family Income in Bedford County is $75,149.
What is the Median Household income in Bedford County?
Median Household Income in Bedford County is $58,337.
What is Income or Wage Gap in Bedford County?
Income or Wage Gap in Bedford County is 40.8%.
Women in Bedford County earn 59.2 cents for every dollar earned by a man.
What is Family Income Deficit in Bedford County?
Family Income Deficit in Bedford County is $9,407.
Families that are below poverty line in Bedford County earn $9,407 less on average than the poverty threshold level.
What is Inequality or Gini Index in Bedford County?
Inequality or Gini Index in Bedford County is 0.43.
What is the Total Population of Bedford County?
Total Population of Bedford County is 47,613.
What is the Total Male Population of Bedford County?
Total Male Population of Bedford County is 23,820.
What is the Total Female Population of Bedford County?
Total Female Population of Bedford County is 23,793.
What is the Ratio of Males per 100 Females in Bedford County?
There are 100.11 Males per 100 Females in Bedford County.
What is the Ratio of Females per 100 Males in Bedford County?
There are 99.89 Females per 100 Males in Bedford County.
What is the Median Population Age in Bedford County?
Median Population Age in Bedford County is 47.3 Years.
What is the Average Family Size in Bedford County
Average Family Size in Bedford County is 3.0 People.
What is the Average Household Size in Bedford County
Average Household Size in Bedford County is 2.4 People.
How Large is the Labor Force in Bedford County?
There are 23,230 People in the Labor Forcein in Bedford County.
What is the Percentage of People in the Labor Force in Bedford County?
58.5% of People are in the Labor Force in Bedford County.
What is the Unemployment Rate in Bedford County?
Unemployment Rate in Bedford County is 4.3%.