Bremen, KY Map & Demographics
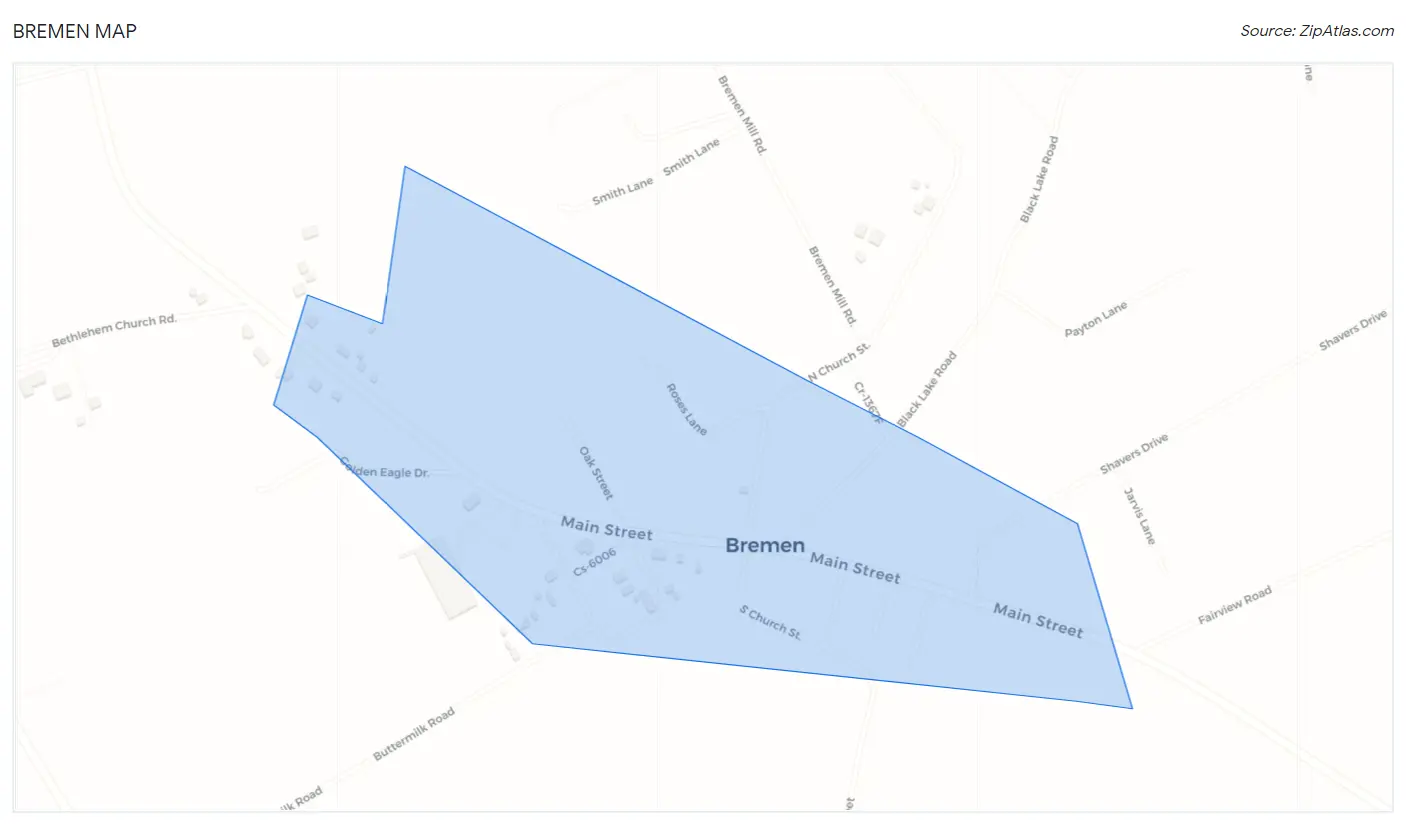
Bremen Map
Bremen Overview
$24,561
PER CAPITA INCOME
$60,000
AVG FAMILY INCOME
$42,650
AVG HOUSEHOLD INCOME
0.49
INEQUALITY / GINI INDEX
383
TOTAL POPULATION
199
MALE POPULATION
184
FEMALE POPULATION
108.15
MALES / 100 FEMALES
92.46
FEMALES / 100 MALES
47.2
MEDIAN AGE
2.7
AVG FAMILY SIZE
2.1
AVG HOUSEHOLD SIZE
154
LABOR FORCE [ PEOPLE ]
47.7%
PERCENT IN LABOR FORCE
12.3%
UNEMPLOYMENT RATE
Bremen Zip Codes
Bremen Area Codes
Income in Bremen
Income Overview in Bremen
Per Capita Income in Bremen is $24,561, while median incomes of families and households are $60,000 and $42,650 respectively.
| Characteristic | Number | Measure |
| Per Capita Income | 383 | $24,561 |
| Median Family Income | 102 | $60,000 |
| Mean Family Income | 102 | $68,868 |
| Median Household Income | 181 | $42,650 |
| Mean Household Income | 181 | $49,569 |
| Income Deficit | 102 | $0 |
| Wage / Income Gap (%) | 383 | 0.00% |
| Wage / Income Gap ($) | 383 | 100.00¢ per $1 |
| Gini / Inequality Index | 383 | 0.49 |
Earnings by Sex in Bremen
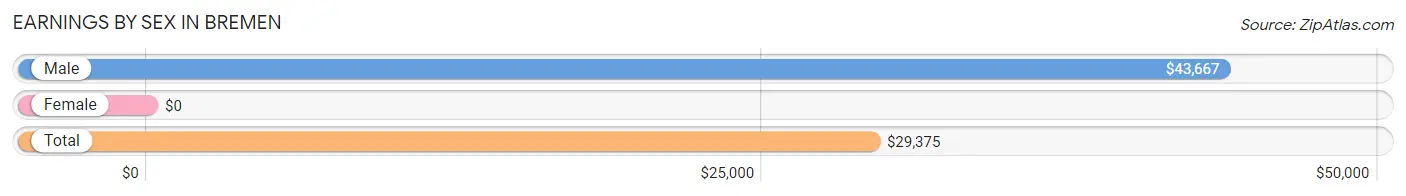
| Sex | Number | Average Earnings |
| Male | 124 (64.9%) | $43,667 |
| Female | 67 (35.1%) | $0 |
| Total | 191 (100.0%) | $29,375 |
Earnings by Sex by Income Bracket in Bremen
The most common earnings brackets in Bremen are $55,000 to $64,999 for men (33 | 26.6%) and $2,499 or less for women (23 | 34.3%).
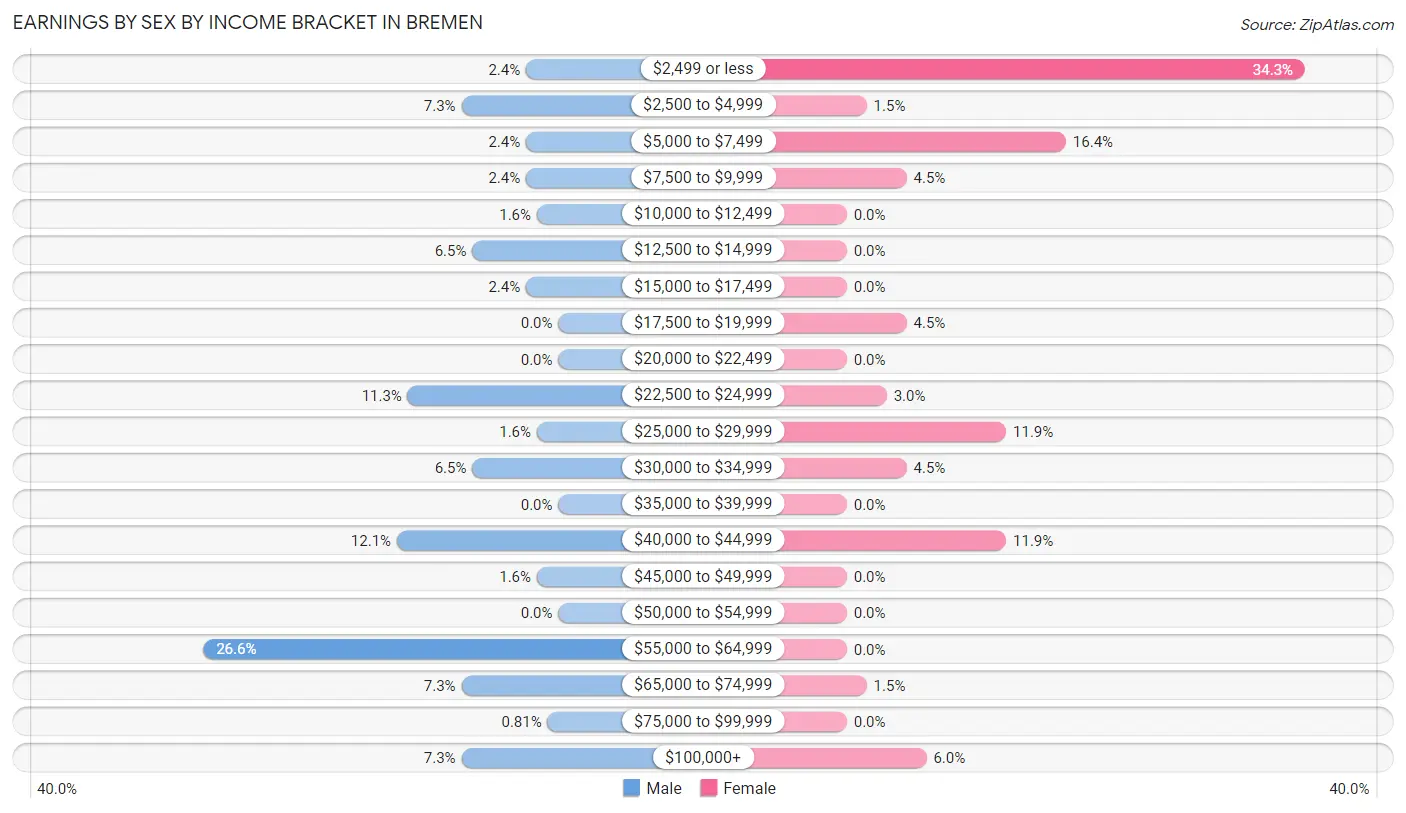
| Income | Male | Female |
| $2,499 or less | 3 (2.4%) | 23 (34.3%) |
| $2,500 to $4,999 | 9 (7.3%) | 1 (1.5%) |
| $5,000 to $7,499 | 3 (2.4%) | 11 (16.4%) |
| $7,500 to $9,999 | 3 (2.4%) | 3 (4.5%) |
| $10,000 to $12,499 | 2 (1.6%) | 0 (0.0%) |
| $12,500 to $14,999 | 8 (6.5%) | 0 (0.0%) |
| $15,000 to $17,499 | 3 (2.4%) | 0 (0.0%) |
| $17,500 to $19,999 | 0 (0.0%) | 3 (4.5%) |
| $20,000 to $22,499 | 0 (0.0%) | 0 (0.0%) |
| $22,500 to $24,999 | 14 (11.3%) | 2 (3.0%) |
| $25,000 to $29,999 | 2 (1.6%) | 8 (11.9%) |
| $30,000 to $34,999 | 8 (6.5%) | 3 (4.5%) |
| $35,000 to $39,999 | 0 (0.0%) | 0 (0.0%) |
| $40,000 to $44,999 | 15 (12.1%) | 8 (11.9%) |
| $45,000 to $49,999 | 2 (1.6%) | 0 (0.0%) |
| $50,000 to $54,999 | 0 (0.0%) | 0 (0.0%) |
| $55,000 to $64,999 | 33 (26.6%) | 0 (0.0%) |
| $65,000 to $74,999 | 9 (7.3%) | 1 (1.5%) |
| $75,000 to $99,999 | 1 (0.8%) | 0 (0.0%) |
| $100,000+ | 9 (7.3%) | 4 (6.0%) |
| Total | 124 (100.0%) | 67 (100.0%) |
Earnings by Sex by Educational Attainment in Bremen
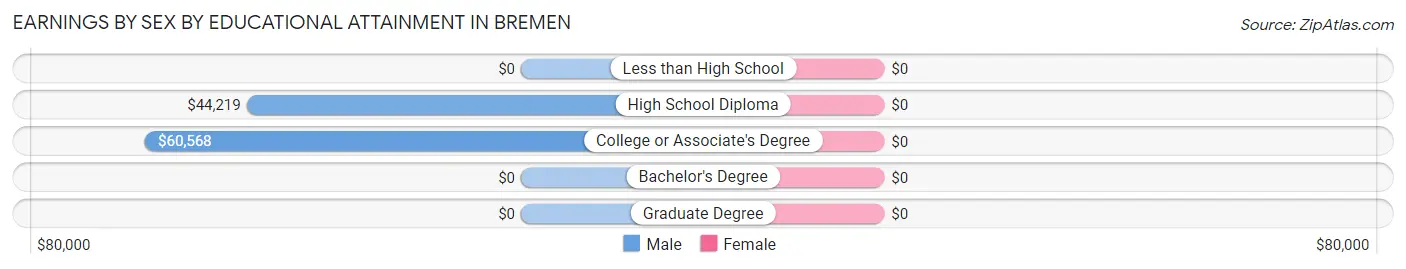
| Educational Attainment | Male Income | Female Income |
| Less than High School | - | - |
| High School Diploma | $44,219 | $0 |
| College or Associate's Degree | $60,568 | $0 |
| Bachelor's Degree | - | - |
| Graduate Degree | - | - |
| Total | $60,227 | $28,125 |
Family Income in Bremen
Family Income Brackets in Bremen
According to the Bremen family income data, there are 35 families falling into the $75,000 to $99,999 income range, which is the most common income bracket and makes up 34.3% of all families.
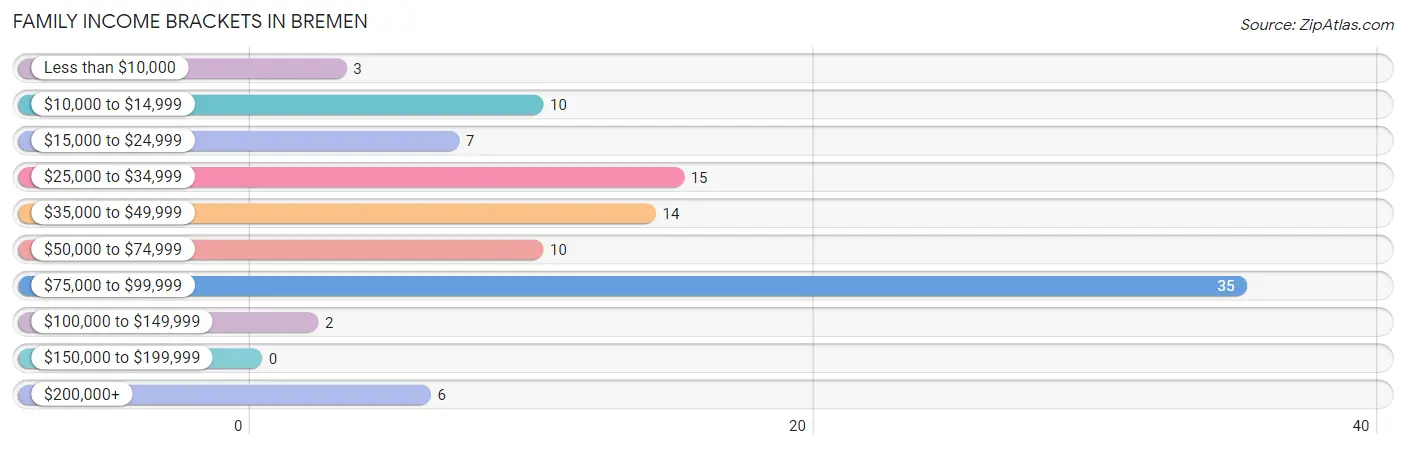
| Income Bracket | # Families | % Families |
| Less than $10,000 | 3 | 2.9% |
| $10,000 to $14,999 | 10 | 9.8% |
| $15,000 to $24,999 | 7 | 6.9% |
| $25,000 to $34,999 | 15 | 14.7% |
| $35,000 to $49,999 | 14 | 13.7% |
| $50,000 to $74,999 | 10 | 9.8% |
| $75,000 to $99,999 | 35 | 34.3% |
| $100,000 to $149,999 | 2 | 2.0% |
| $150,000 to $199,999 | 0 | 0.0% |
| $200,000+ | 6 | 5.9% |
Family Income by Famaliy Size in Bremen
2-person families (63 | 61.8%) account for the highest median family income in Bremen with $80,492 per family, while 2-person families (63 | 61.8%) have the highest median income of $40,246 per family member.
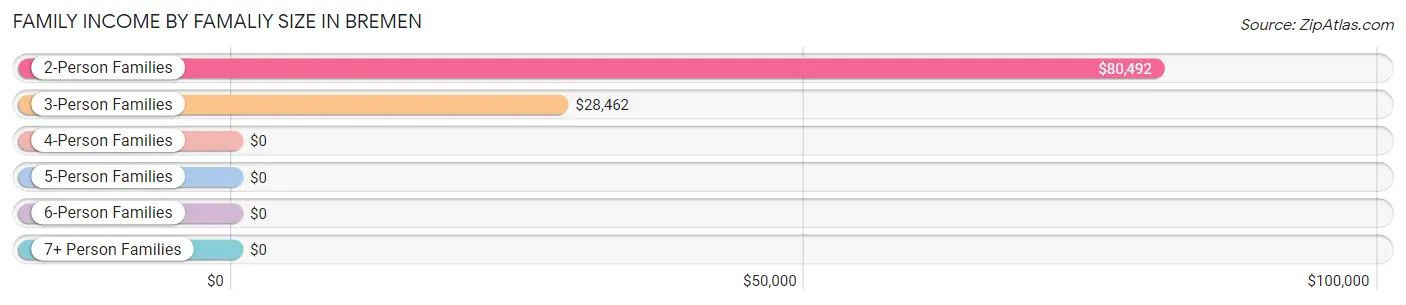
| Income Bracket | # Families | Median Income |
| 2-Person Families | 63 (61.8%) | $80,492 |
| 3-Person Families | 32 (31.4%) | $28,462 |
| 4-Person Families | 4 (3.9%) | $0 |
| 5-Person Families | 3 (2.9%) | $0 |
| 6-Person Families | 0 (0.0%) | $0 |
| 7+ Person Families | 0 (0.0%) | $0 |
| Total | 102 (100.0%) | $60,000 |
Family Income by Number of Earners in Bremen
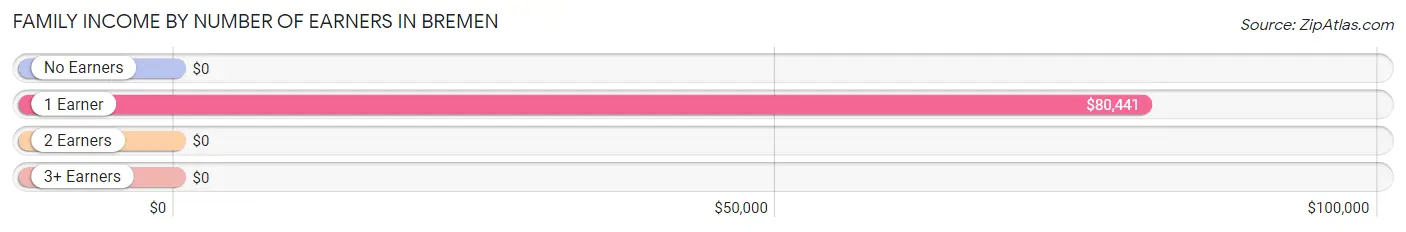
| Number of Earners | # Families | Median Income |
| No Earners | 15 (14.7%) | $0 |
| 1 Earner | 58 (56.9%) | $80,441 |
| 2 Earners | 26 (25.5%) | $0 |
| 3+ Earners | 3 (2.9%) | $0 |
| Total | 102 (100.0%) | $60,000 |
Household Income in Bremen
Household Income Brackets in Bremen
With 37 households falling in the category, the $10,000 to $14,999 income range is the most frequent in Bremen, accounting for 20.4% of all households.
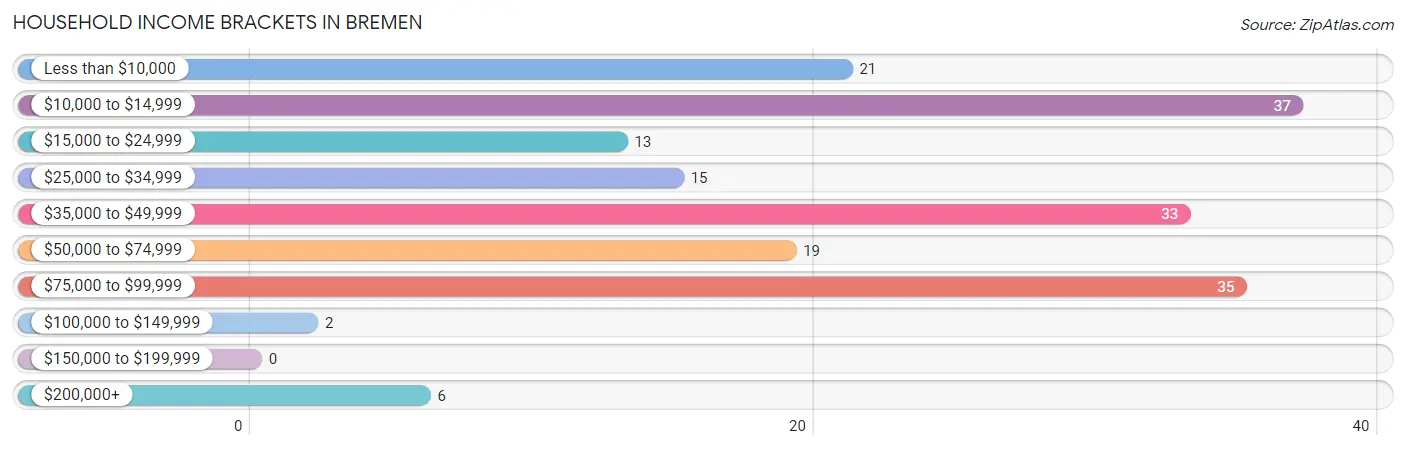
| Income Bracket | # Households | % Households |
| Less than $10,000 | 21 | 11.6% |
| $10,000 to $14,999 | 37 | 20.4% |
| $15,000 to $24,999 | 13 | 7.2% |
| $25,000 to $34,999 | 15 | 8.3% |
| $35,000 to $49,999 | 33 | 18.2% |
| $50,000 to $74,999 | 19 | 10.5% |
| $75,000 to $99,999 | 35 | 19.3% |
| $100,000 to $149,999 | 2 | 1.1% |
| $150,000 to $199,999 | 0 | 0.0% |
| $200,000+ | 6 | 3.3% |
Household Income by Householder Age in Bremen
The median household income in Bremen is $42,650, with the highest median household income of $65,556 found in the 45 to 64 years age bracket for the primary householder. A total of 92 households (50.8%) fall into this category. Meanwhile, the 15 to 24 years age bracket for the primary householder has the lowest median household income of $0, with 24 households (13.3%) in this group.
| Income Bracket | # Households | Median Income |
| 15 to 24 Years | 24 (13.3%) | $0 |
| 25 to 44 Years | 37 (20.4%) | $42,917 |
| 45 to 64 Years | 92 (50.8%) | $65,556 |
| 65+ Years | 28 (15.5%) | $13,750 |
| Total | 181 (100.0%) | $42,650 |
Poverty in Bremen
Income Below Poverty by Sex and Age in Bremen
With 22.1% poverty level for males and 47.8% for females among the residents of Bremen, 6 to 11 year old males and 6 to 11 year old females are the most vulnerable to poverty, with 3 males (100.0%) and 17 females (100.0%) in their respective age groups living below the poverty level.
| Age Bracket | Male | Female |
| Under 5 Years | 4 (18.2%) | 0 (0.0%) |
| 5 Years | 0 (0.0%) | 0 (0.0%) |
| 6 to 11 Years | 3 (100.0%) | 17 (100.0%) |
| 12 to 14 Years | 0 (0.0%) | 12 (100.0%) |
| 15 Years | 0 (0.0%) | 0 (0.0%) |
| 16 and 17 Years | 0 (0.0%) | 0 (0.0%) |
| 18 to 24 Years | 8 (30.8%) | 29 (100.0%) |
| 25 to 34 Years | 0 (0.0%) | 4 (18.2%) |
| 35 to 44 Years | 6 (42.9%) | 11 (84.6%) |
| 45 to 54 Years | 10 (35.7%) | 3 (23.1%) |
| 55 to 64 Years | 6 (8.2%) | 0 (0.0%) |
| 65 to 74 Years | 5 (50.0%) | 9 (20.4%) |
| 75 Years and over | 2 (40.0%) | 3 (33.3%) |
| Total | 44 (22.1%) | 88 (47.8%) |
Income Above Poverty by Sex and Age in Bremen
According to the poverty statistics in Bremen, males aged 15 years and females aged 5 years are the age groups that are most secure financially, with 100.0% of males and 100.0% of females in these age groups living above the poverty line.
| Age Bracket | Male | Female |
| Under 5 Years | 18 (81.8%) | 0 (0.0%) |
| 5 Years | 0 (0.0%) | 4 (100.0%) |
| 6 to 11 Years | 0 (0.0%) | 0 (0.0%) |
| 12 to 14 Years | 0 (0.0%) | 0 (0.0%) |
| 15 Years | 2 (100.0%) | 0 (0.0%) |
| 16 and 17 Years | 1 (100.0%) | 0 (0.0%) |
| 18 to 24 Years | 18 (69.2%) | 0 (0.0%) |
| 25 to 34 Years | 15 (100.0%) | 18 (81.8%) |
| 35 to 44 Years | 8 (57.1%) | 2 (15.4%) |
| 45 to 54 Years | 18 (64.3%) | 10 (76.9%) |
| 55 to 64 Years | 67 (91.8%) | 21 (100.0%) |
| 65 to 74 Years | 5 (50.0%) | 35 (79.5%) |
| 75 Years and over | 3 (60.0%) | 6 (66.7%) |
| Total | 155 (77.9%) | 96 (52.2%) |
Income Below Poverty Among Married-Couple Families in Bremen
The poverty statistics for married-couple families in Bremen show that 8.0% or 7 of the total 88 families live below the poverty line. Families with 3 or 4 children have the highest poverty rate of 100.0%, comprising of 3 families. On the other hand, families with no children have the lowest poverty rate of 2.8%, which includes 2 families.
| Children | Above Poverty | Below Poverty |
| No Children | 69 (97.2%) | 2 (2.8%) |
| 1 or 2 Children | 12 (85.7%) | 2 (14.3%) |
| 3 or 4 Children | 0 (0.0%) | 3 (100.0%) |
| 5 or more Children | 0 (0.0%) | 0 (0.0%) |
| Total | 81 (92.0%) | 7 (8.0%) |
Income Below Poverty Among Single-Parent Households in Bremen
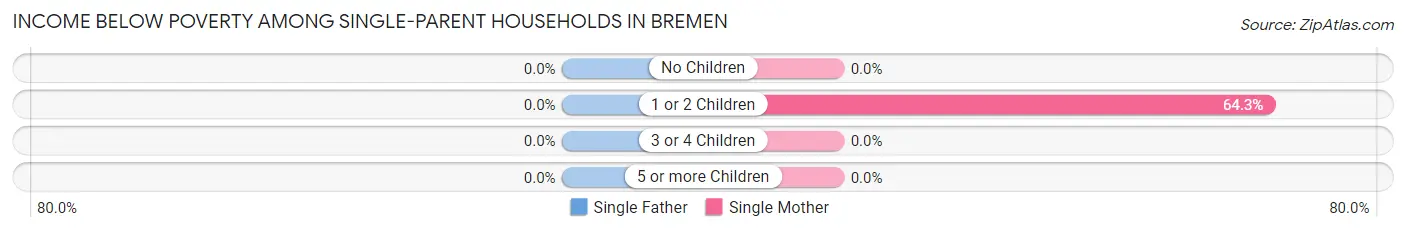
| Children | Single Father | Single Mother |
| No Children | 0 (0.0%) | 0 (0.0%) |
| 1 or 2 Children | 0 (0.0%) | 9 (64.3%) |
| 3 or 4 Children | 0 (0.0%) | 0 (0.0%) |
| 5 or more Children | 0 (0.0%) | 0 (0.0%) |
| Total | 0 (0.0%) | 9 (64.3%) |
Income Below Poverty Among Married-Couple vs Single-Parent Households in Bremen
The poverty data for Bremen shows that 7 of the married-couple family households (8.0%) and 9 of the single-parent households (64.3%) are living below the poverty level. Within the married-couple family households, those with 3 or 4 children have the highest poverty rate, with 3 households (100.0%) falling below the poverty line. Among the single-parent households, those with 1 or 2 children have the highest poverty rate, with 9 household (64.3%) living below poverty.
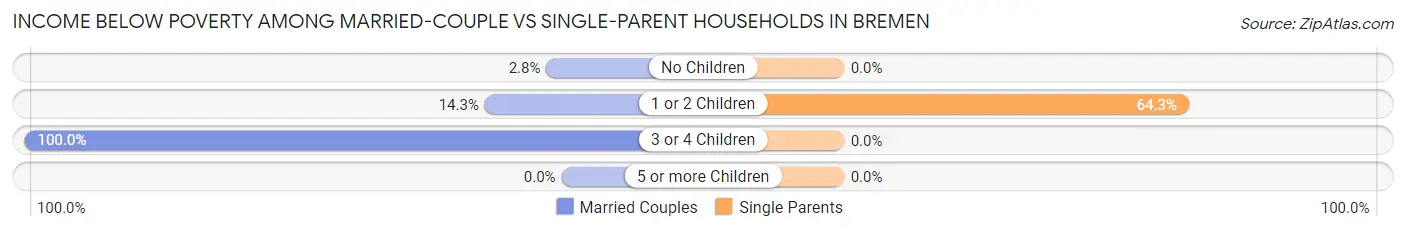
| Children | Married-Couple Families | Single-Parent Households |
| No Children | 2 (2.8%) | 0 (0.0%) |
| 1 or 2 Children | 2 (14.3%) | 9 (64.3%) |
| 3 or 4 Children | 3 (100.0%) | 0 (0.0%) |
| 5 or more Children | 0 (0.0%) | 0 (0.0%) |
| Total | 7 (8.0%) | 9 (64.3%) |
Race in Bremen
The most populous races in Bremen are White / Caucasian (374 | 97.7%), Hispanic or Latino (7 | 1.8%), and Some other Race (7 | 1.8%).
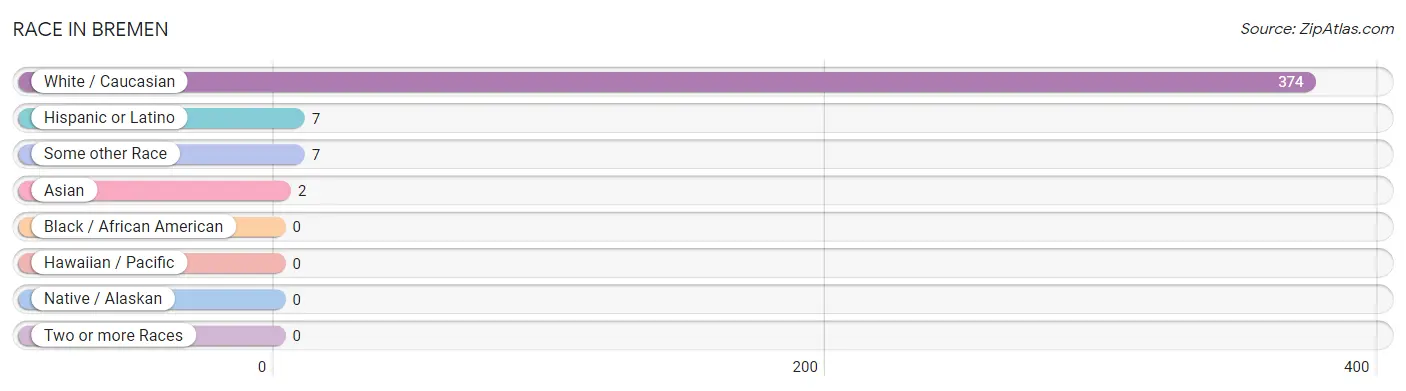
| Race | # Population | % Population |
| Asian | 2 | 0.5% |
| Black / African American | 0 | 0.0% |
| Hawaiian / Pacific | 0 | 0.0% |
| Hispanic or Latino | 7 | 1.8% |
| Native / Alaskan | 0 | 0.0% |
| White / Caucasian | 374 | 97.7% |
| Two or more Races | 0 | 0.0% |
| Some other Race | 7 | 1.8% |
| Total | 383 | 100.0% |
Ancestry in Bremen
The most populous ancestries reported in Bremen are American (40 | 10.4%), English (28 | 7.3%), Irish (19 | 5.0%), German (18 | 4.7%), and Polish (9 | 2.4%), together accounting for 29.8% of all Bremen residents.
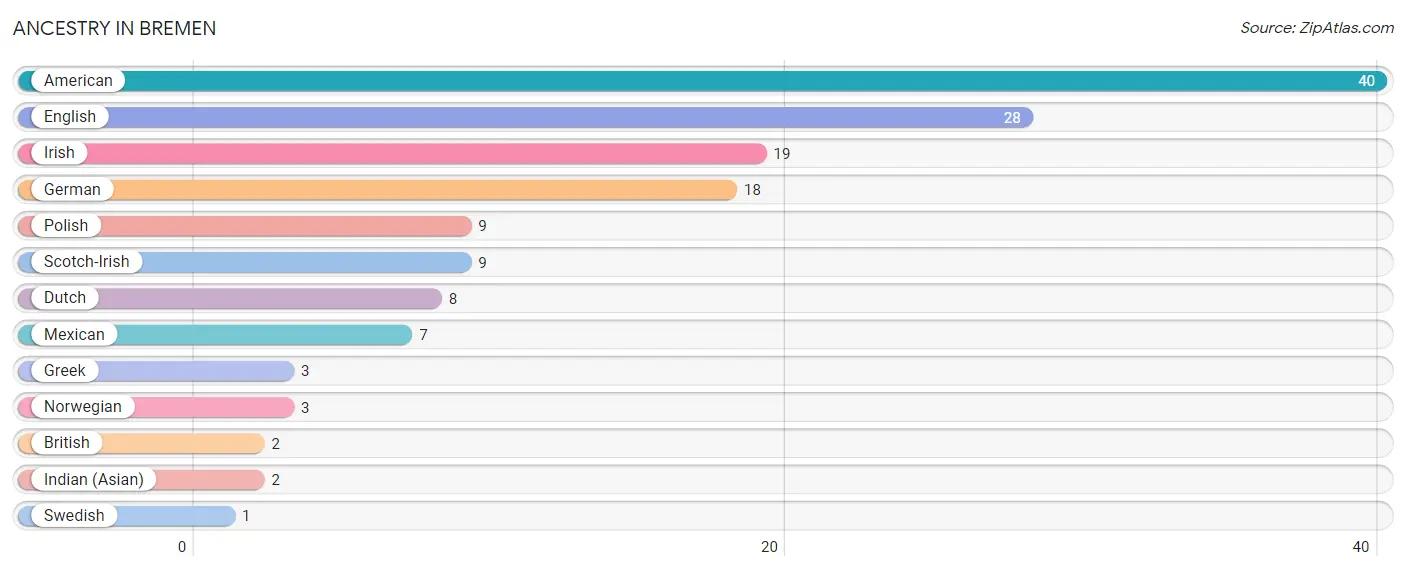
| Ancestry | # Population | % Population |
| American | 40 | 10.4% |
| British | 2 | 0.5% |
| Dutch | 8 | 2.1% |
| English | 28 | 7.3% |
| German | 18 | 4.7% |
| Greek | 3 | 0.8% |
| Indian (Asian) | 2 | 0.5% |
| Irish | 19 | 5.0% |
| Mexican | 7 | 1.8% |
| Norwegian | 3 | 0.8% |
| Polish | 9 | 2.4% |
| Scotch-Irish | 9 | 2.4% |
| Swedish | 1 | 0.3% | View All 13 Rows |
Immigrants in Bremen
The most numerous immigrant groups reported in Bremen came from Asia (2 | 0.5%), China (2 | 0.5%), and Eastern Asia (2 | 0.5%), together accounting for 1.6% of all Bremen residents.
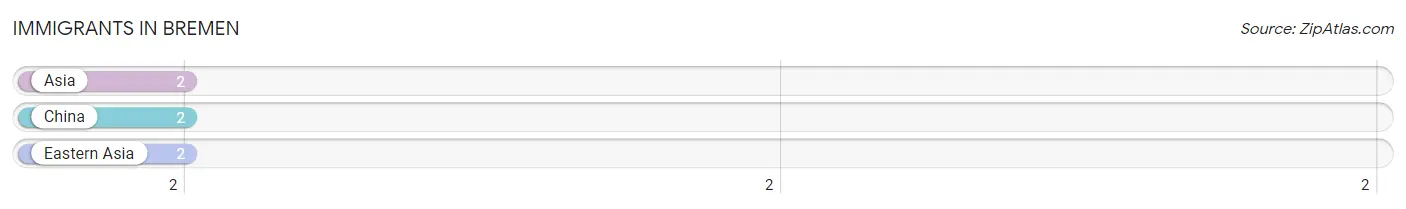
| Immigration Origin | # Population | % Population |
| Asia | 2 | 0.5% |
| China | 2 | 0.5% |
| Eastern Asia | 2 | 0.5% | View All 3 Rows |
Sex and Age in Bremen
Sex and Age in Bremen
The most populous age groups in Bremen are 60 to 64 Years (55 | 27.6%) for men and 65 to 69 Years (42 | 22.8%) for women.
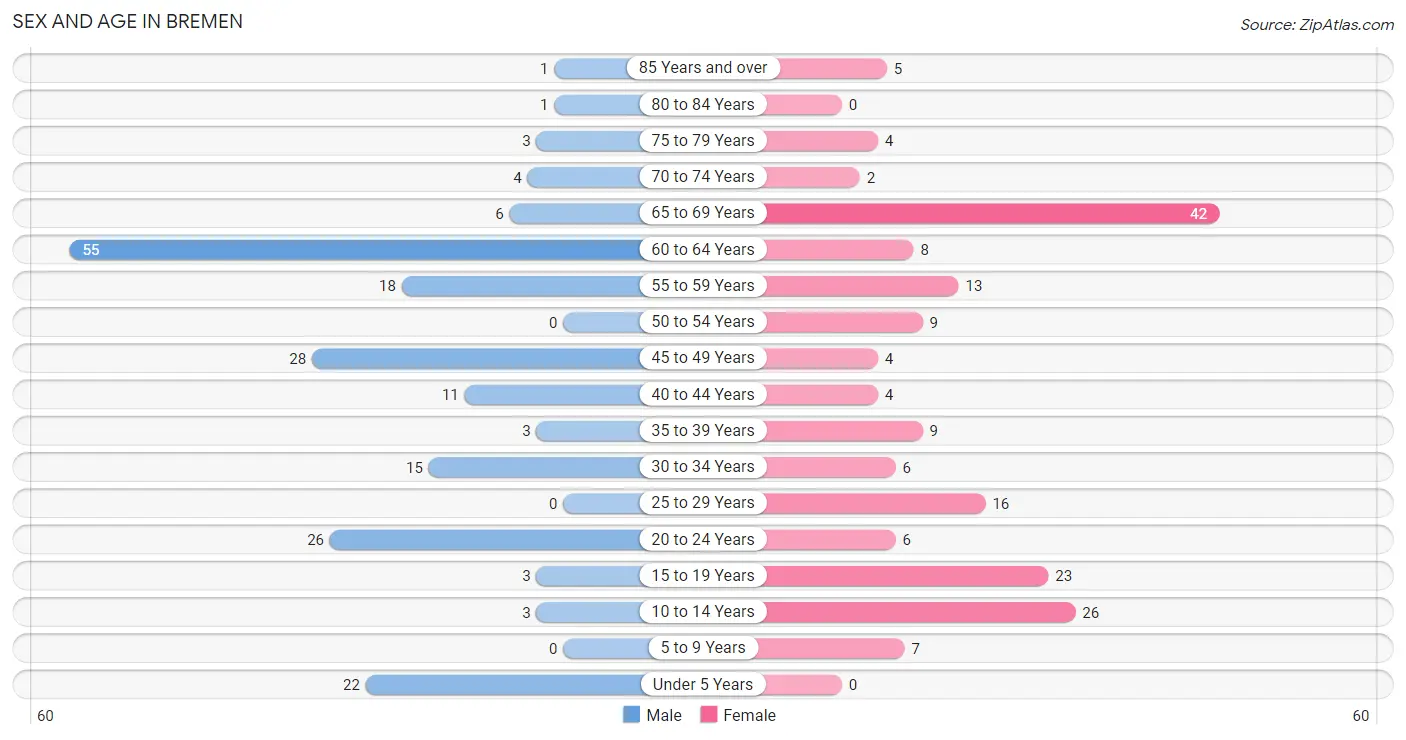
| Age Bracket | Male | Female |
| Under 5 Years | 22 (11.1%) | 0 (0.0%) |
| 5 to 9 Years | 0 (0.0%) | 7 (3.8%) |
| 10 to 14 Years | 3 (1.5%) | 26 (14.1%) |
| 15 to 19 Years | 3 (1.5%) | 23 (12.5%) |
| 20 to 24 Years | 26 (13.1%) | 6 (3.3%) |
| 25 to 29 Years | 0 (0.0%) | 16 (8.7%) |
| 30 to 34 Years | 15 (7.5%) | 6 (3.3%) |
| 35 to 39 Years | 3 (1.5%) | 9 (4.9%) |
| 40 to 44 Years | 11 (5.5%) | 4 (2.2%) |
| 45 to 49 Years | 28 (14.1%) | 4 (2.2%) |
| 50 to 54 Years | 0 (0.0%) | 9 (4.9%) |
| 55 to 59 Years | 18 (9.0%) | 13 (7.1%) |
| 60 to 64 Years | 55 (27.6%) | 8 (4.3%) |
| 65 to 69 Years | 6 (3.0%) | 42 (22.8%) |
| 70 to 74 Years | 4 (2.0%) | 2 (1.1%) |
| 75 to 79 Years | 3 (1.5%) | 4 (2.2%) |
| 80 to 84 Years | 1 (0.5%) | 0 (0.0%) |
| 85 Years and over | 1 (0.5%) | 5 (2.7%) |
| Total | 199 (100.0%) | 184 (100.0%) |
Families and Households in Bremen
Median Family Size in Bremen
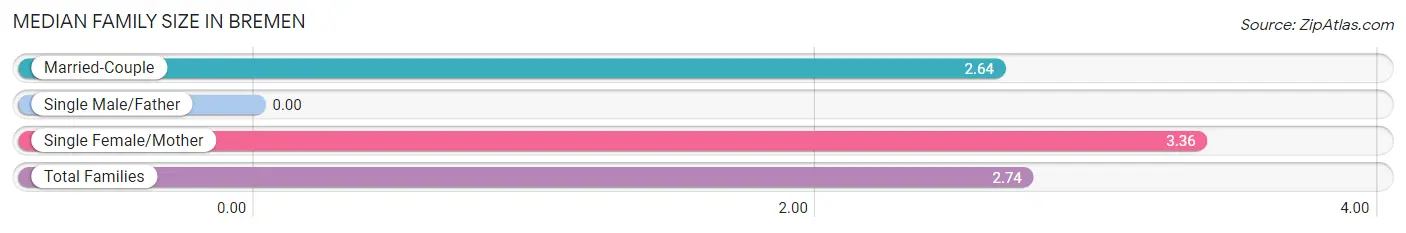
| Family Type | # Families | Family Size |
| Married-Couple | 88 (86.3%) | 2.64 |
| Single Male/Father | 0 (0.0%) | - |
| Single Female/Mother | 14 (13.7%) | 3.36 |
| Total Families | 102 (100.0%) | 2.74 |
Median Household Size in Bremen
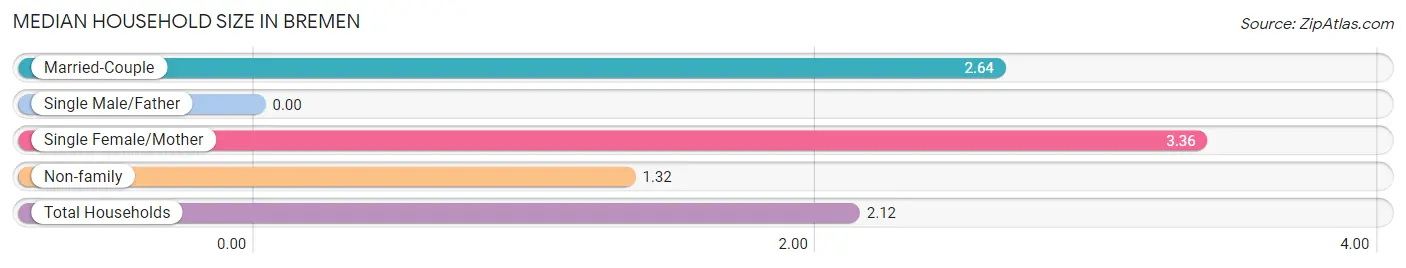
| Household Type | # Households | Household Size |
| Married-Couple | 88 (48.6%) | 2.64 |
| Single Male/Father | 0 (0.0%) | - |
| Single Female/Mother | 14 (7.7%) | 3.36 |
| Non-family | 79 (43.6%) | 1.32 |
| Total Households | 181 (100.0%) | 2.12 |
Household Size by Marriage Status in Bremen
Out of a total of 181 households in Bremen, 102 (56.4%) are family households, while 79 (43.6%) are nonfamily households. The most numerous type of family households are 2-person households, comprising 63, and the most common type of nonfamily households are 1-person households, comprising 60.
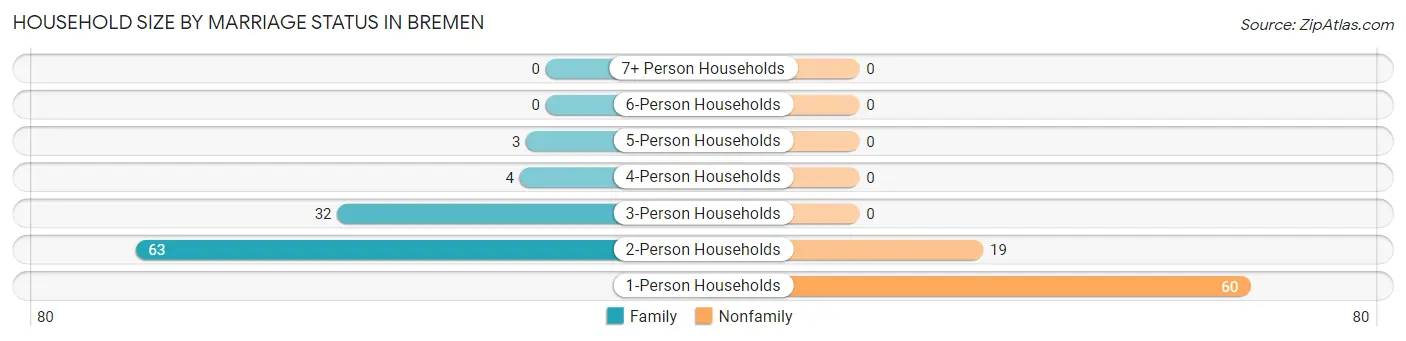
| Household Size | Family Households | Nonfamily Households |
| 1-Person Households | - | 60 (33.2%) |
| 2-Person Households | 63 (34.8%) | 19 (10.5%) |
| 3-Person Households | 32 (17.7%) | 0 (0.0%) |
| 4-Person Households | 4 (2.2%) | 0 (0.0%) |
| 5-Person Households | 3 (1.7%) | 0 (0.0%) |
| 6-Person Households | 0 (0.0%) | 0 (0.0%) |
| 7+ Person Households | 0 (0.0%) | 0 (0.0%) |
| Total | 102 (56.4%) | 79 (43.6%) |
Female Fertility in Bremen
Fertility by Age in Bremen
| Age Bracket | Women with Births | Births / 1,000 Women |
| 15 to 19 years | 0 (0.0%) | 0.0 |
| 20 to 34 years | 0 (0.0%) | 0.0 |
| 35 to 50 years | 0 (0.0%) | 0.0 |
| Total | 0 (0.0%) | 0.0 |
Fertility by Age by Marriage Status in Bremen
| Age Bracket | Married | Unmarried |
| 15 to 19 years | 0 (0.0%) | 0 (0.0%) |
| 20 to 34 years | 0 (0.0%) | 0 (0.0%) |
| 35 to 50 years | 0 (0.0%) | 0 (0.0%) |
| Total | 0 (0.0%) | 0 (0.0%) |
Fertility by Education in Bremen
| Educational Attainment | Women with Births | Births / 1,000 Women |
| Less than High School | 0 (0.0%) | 0.0 |
| High School Diploma | 0 (0.0%) | 0.0 |
| College or Associate's Degree | 0 (0.0%) | 0.0 |
| Bachelor's Degree | 0 (0.0%) | 0.0 |
| Graduate Degree | 0 (0.0%) | 0.0 |
| Total | 0 (0.0%) | 0.0 |
Fertility by Education by Marriage Status in Bremen
| Educational Attainment | Married | Unmarried |
| Less than High School | 0 (0.0%) | 0 (0.0%) |
| High School Diploma | 0 (0.0%) | 0 (0.0%) |
| College or Associate's Degree | 0 (0.0%) | 0 (0.0%) |
| Bachelor's Degree | 0 (0.0%) | 0 (0.0%) |
| Graduate Degree | 0 (0.0%) | 0 (0.0%) |
| Total | 0 (0.0%) | 0 (0.0%) |
Employment Characteristics in Bremen
Employment by Class of Employer in Bremen
Among the 135 employed individuals in Bremen, private company employees (106 | 78.5%), state government employees (14 | 10.4%), and not-for-profit organizations (8 | 5.9%) make up the most common classes of employment.
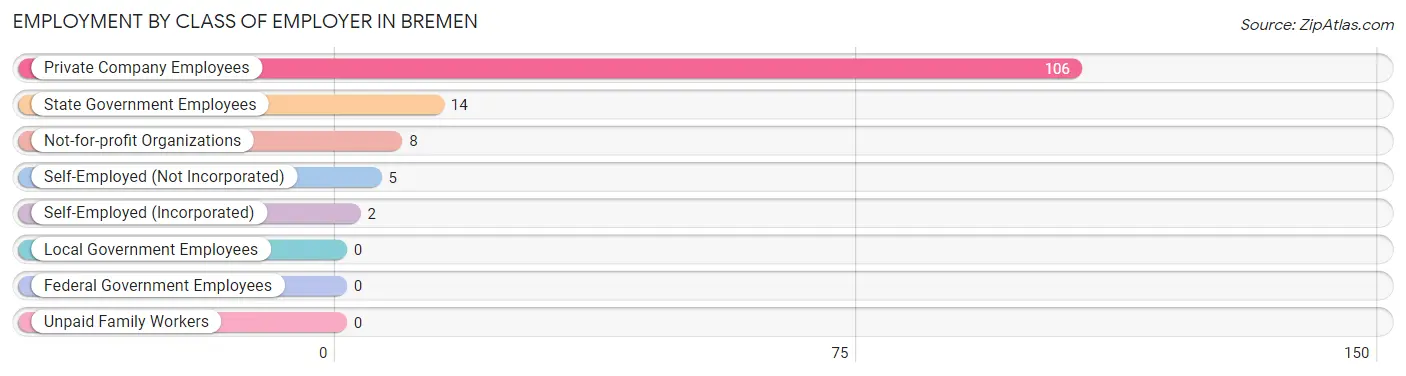
| Employer Class | # Employees | % Employees |
| Private Company Employees | 106 | 78.5% |
| Self-Employed (Incorporated) | 2 | 1.5% |
| Self-Employed (Not Incorporated) | 5 | 3.7% |
| Not-for-profit Organizations | 8 | 5.9% |
| Local Government Employees | 0 | 0.0% |
| State Government Employees | 14 | 10.4% |
| Federal Government Employees | 0 | 0.0% |
| Unpaid Family Workers | 0 | 0.0% |
| Total | 135 | 100.0% |
Employment Status by Age in Bremen
According to the labor force statistics for Bremen, out of the total population over 16 years of age (323), 47.7% or 154 individuals are in the labor force, with 12.3% or 19 of them unemployed. The age group with the highest labor force participation rate is 16 to 19 years, with 95.8% or 23 individuals in the labor force. Within the labor force, the 65 to 74 years age range has the highest percentage of unemployed individuals, with 100.0% or 5 of them being unemployed.
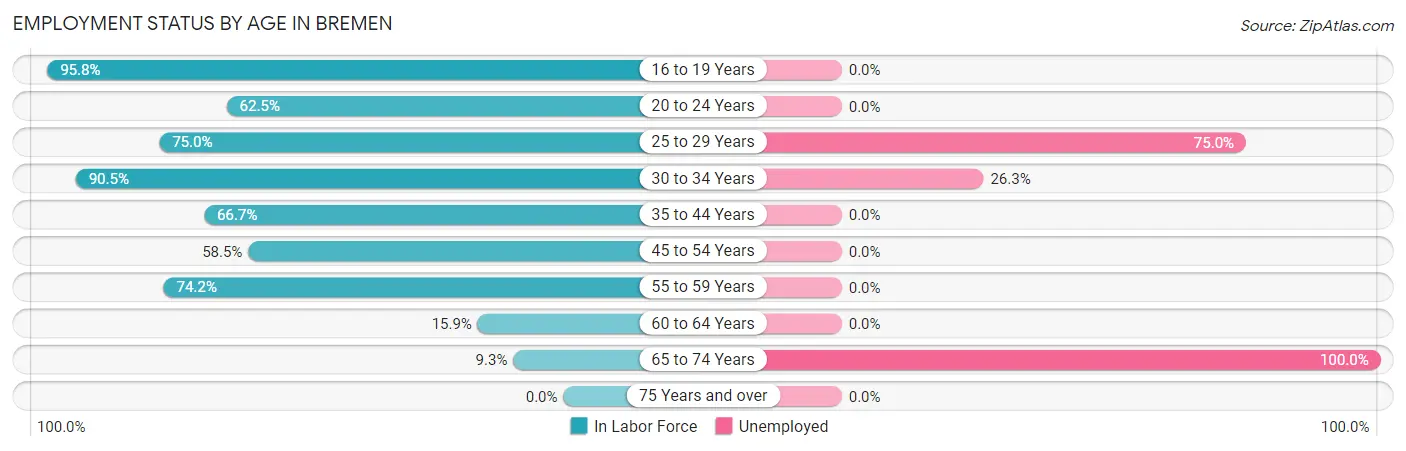
| Age Bracket | In Labor Force | Unemployed |
| 16 to 19 Years | 23 (95.8%) | 0 (0.0%) |
| 20 to 24 Years | 20 (62.5%) | 0 (0.0%) |
| 25 to 29 Years | 12 (75.0%) | 9 (75.0%) |
| 30 to 34 Years | 19 (90.5%) | 5 (26.3%) |
| 35 to 44 Years | 18 (66.7%) | 0 (0.0%) |
| 45 to 54 Years | 24 (58.5%) | 0 (0.0%) |
| 55 to 59 Years | 23 (74.2%) | 0 (0.0%) |
| 60 to 64 Years | 10 (15.9%) | 0 (0.0%) |
| 65 to 74 Years | 5 (9.3%) | 5 (100.0%) |
| 75 Years and over | 0 (0.0%) | 0 (0.0%) |
| Total | 154 (47.7%) | 19 (12.3%) |
Employment Status by Educational Attainment in Bremen
According to labor force statistics for Bremen, 53.3% of individuals (106) out of the total population between 25 and 64 years of age (199) are in the labor force, with 13.2% or 14 of them being unemployed. The group with the highest labor force participation rate are those with the educational attainment of bachelor's degree or higher, with 70.6% or 12 individuals in the labor force. Within the labor force, individuals with high school diploma education have the highest percentage of unemployment, with 25.9% or 14 of them being unemployed.
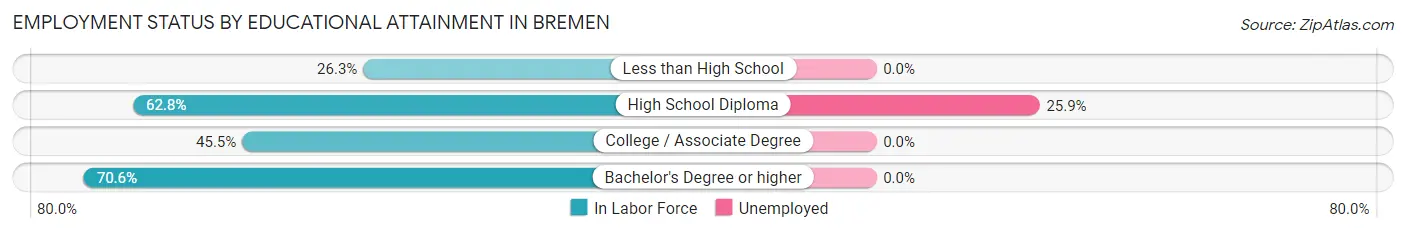
| Educational Attainment | In Labor Force | Unemployed |
| Less than High School | 5 (26.3%) | 0 (0.0%) |
| High School Diploma | 54 (62.8%) | 22 (25.9%) |
| College / Associate Degree | 35 (45.5%) | 0 (0.0%) |
| Bachelor's Degree or higher | 12 (70.6%) | 0 (0.0%) |
| Total | 106 (53.3%) | 26 (13.2%) |
Employment Occupations by Sex in Bremen
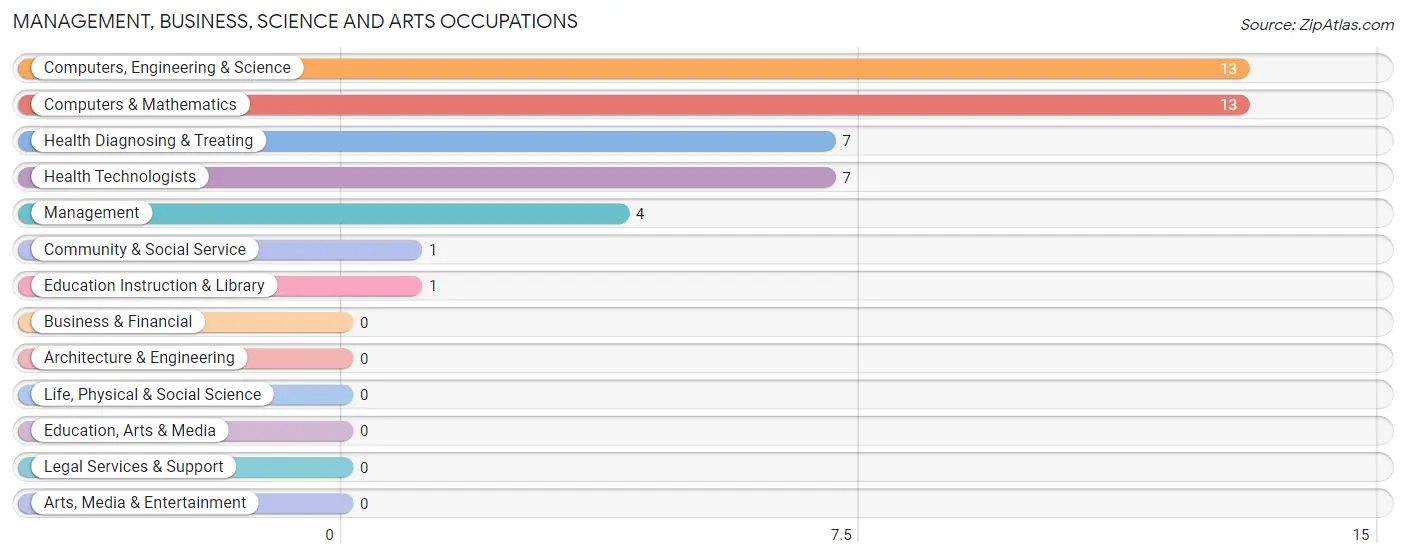
Management, Business, Science and Arts Occupations
The most common Management, Business, Science and Arts occupations in Bremen are Computers, Engineering & Science (13 | 9.6%), Computers & Mathematics (13 | 9.6%), Health Diagnosing & Treating (7 | 5.2%), Health Technologists (7 | 5.2%), and Management (4 | 3.0%).
Management, Business, Science and Arts Occupations by Sex
Within the Management, Business, Science and Arts occupations in Bremen, the most male-oriented occupations are Management (100.0%), Health Diagnosing & Treating (42.9%), and Health Technologists (42.9%), while the most female-oriented occupations are Computers, Engineering & Science (100.0%), Computers & Mathematics (100.0%), and Community & Social Service (100.0%).
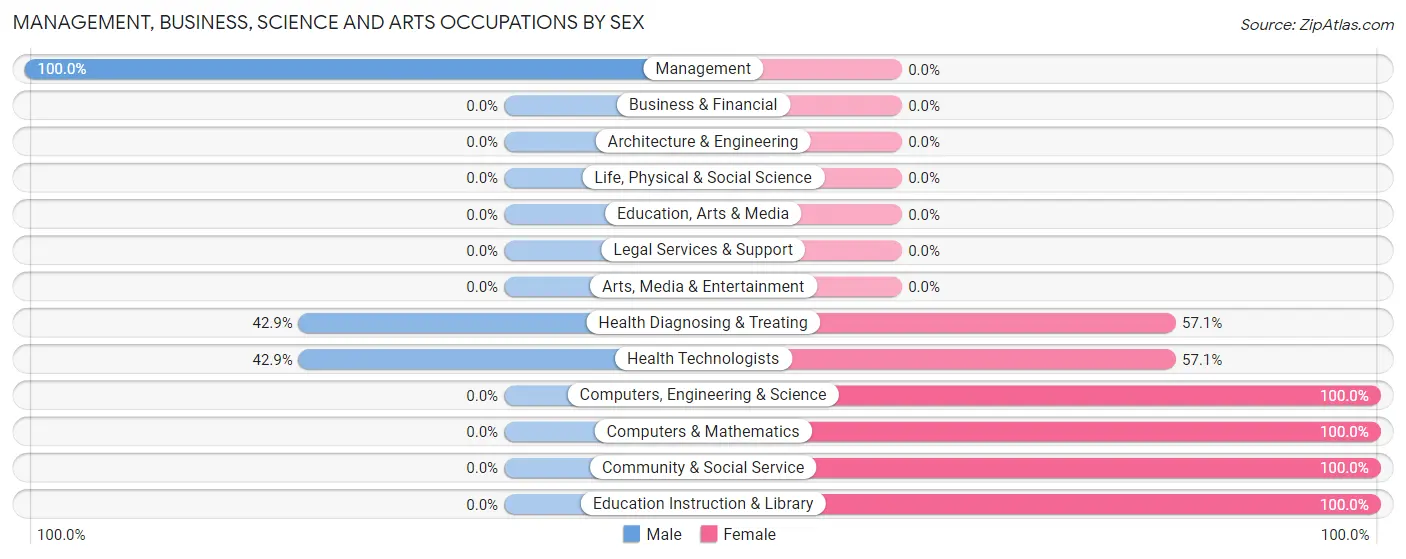
| Occupation | Male | Female |
| Management | 4 (100.0%) | 0 (0.0%) |
| Business & Financial | 0 (0.0%) | 0 (0.0%) |
| Computers, Engineering & Science | 0 (0.0%) | 13 (100.0%) |
| Computers & Mathematics | 0 (0.0%) | 13 (100.0%) |
| Architecture & Engineering | 0 (0.0%) | 0 (0.0%) |
| Life, Physical & Social Science | 0 (0.0%) | 0 (0.0%) |
| Community & Social Service | 0 (0.0%) | 1 (100.0%) |
| Education, Arts & Media | 0 (0.0%) | 0 (0.0%) |
| Legal Services & Support | 0 (0.0%) | 0 (0.0%) |
| Education Instruction & Library | 0 (0.0%) | 1 (100.0%) |
| Arts, Media & Entertainment | 0 (0.0%) | 0 (0.0%) |
| Health Diagnosing & Treating | 3 (42.9%) | 4 (57.1%) |
| Health Technologists | 3 (42.9%) | 4 (57.1%) |
| Total (Category) | 7 (28.0%) | 18 (72.0%) |
| Total (Overall) | 77 (57.0%) | 58 (43.0%) |
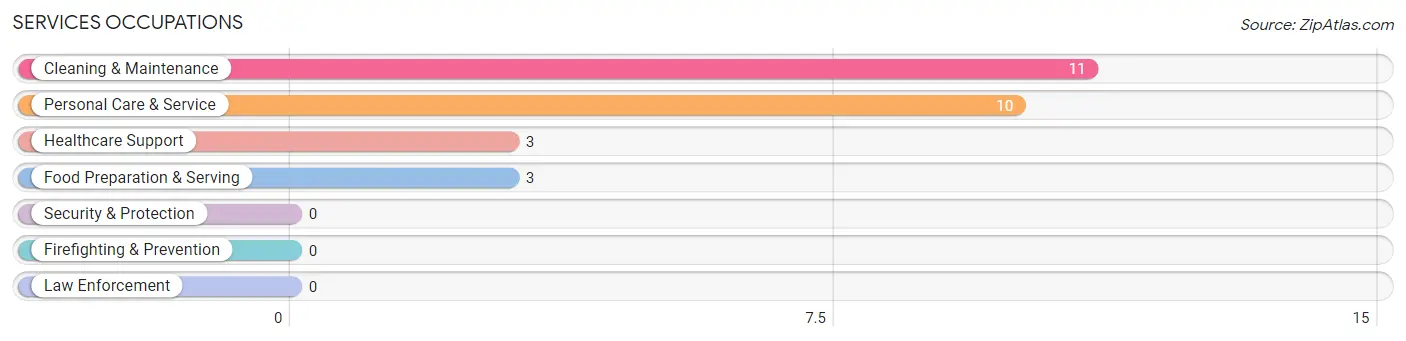
Services Occupations
The most common Services occupations in Bremen are Cleaning & Maintenance (11 | 8.2%), Personal Care & Service (10 | 7.4%), Healthcare Support (3 | 2.2%), and Food Preparation & Serving (3 | 2.2%).
Services Occupations by Sex
Within the Services occupations in Bremen, the most male-oriented occupations are Cleaning & Maintenance (100.0%), and Personal Care & Service (100.0%), while the most female-oriented occupations are Healthcare Support (100.0%), and Food Preparation & Serving (100.0%).
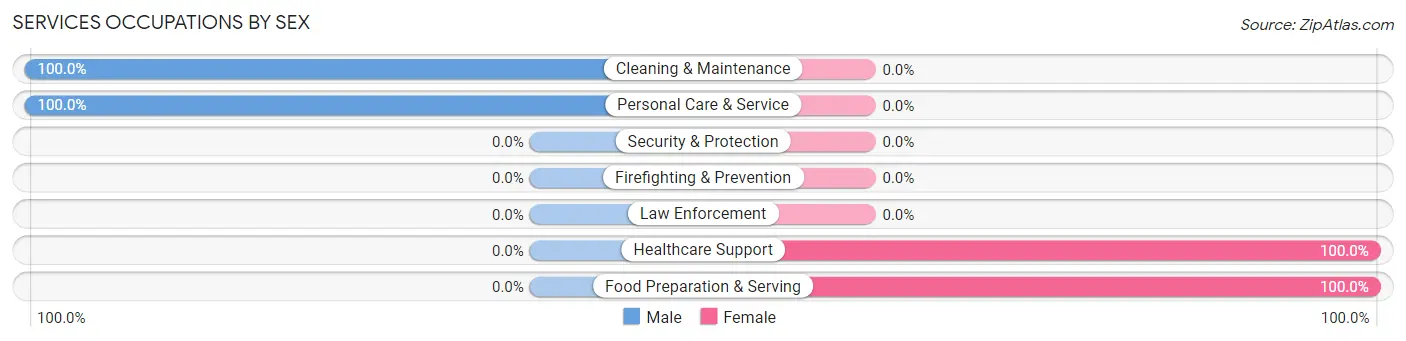
| Occupation | Male | Female |
| Healthcare Support | 0 (0.0%) | 3 (100.0%) |
| Security & Protection | 0 (0.0%) | 0 (0.0%) |
| Firefighting & Prevention | 0 (0.0%) | 0 (0.0%) |
| Law Enforcement | 0 (0.0%) | 0 (0.0%) |
| Food Preparation & Serving | 0 (0.0%) | 3 (100.0%) |
| Cleaning & Maintenance | 11 (100.0%) | 0 (0.0%) |
| Personal Care & Service | 10 (100.0%) | 0 (0.0%) |
| Total (Category) | 21 (77.8%) | 6 (22.2%) |
| Total (Overall) | 77 (57.0%) | 58 (43.0%) |
Sales and Office Occupations
The most common Sales and Office occupations in Bremen are Sales & Related (17 | 12.6%), and Office & Administration (15 | 11.1%).
Sales and Office Occupations by Sex
| Occupation | Male | Female |
| Sales & Related | 0 (0.0%) | 17 (100.0%) |
| Office & Administration | 0 (0.0%) | 15 (100.0%) |
| Total (Category) | 0 (0.0%) | 32 (100.0%) |
| Total (Overall) | 77 (57.0%) | 58 (43.0%) |
Natural Resources, Construction and Maintenance Occupations
The most common Natural Resources, Construction and Maintenance occupations in Bremen are Farming, Fishing & Forestry (4 | 3.0%), Construction & Extraction (3 | 2.2%), and Installation, Maintenance & Repair (2 | 1.5%).
Natural Resources, Construction and Maintenance Occupations by Sex
| Occupation | Male | Female |
| Farming, Fishing & Forestry | 4 (100.0%) | 0 (0.0%) |
| Construction & Extraction | 3 (100.0%) | 0 (0.0%) |
| Installation, Maintenance & Repair | 2 (100.0%) | 0 (0.0%) |
| Total (Category) | 9 (100.0%) | 0 (0.0%) |
| Total (Overall) | 77 (57.0%) | 58 (43.0%) |
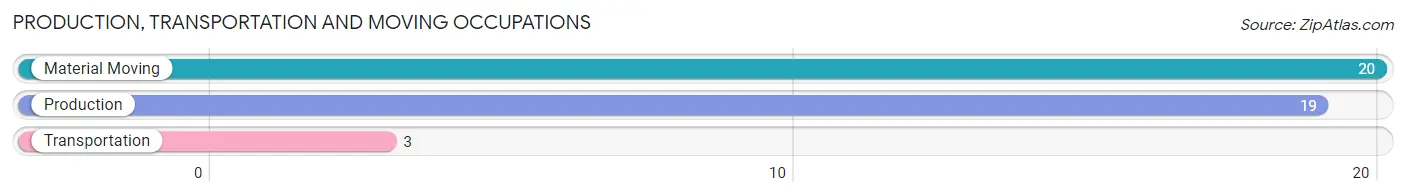
Production, Transportation and Moving Occupations
The most common Production, Transportation and Moving occupations in Bremen are Material Moving (20 | 14.8%), Production (19 | 14.1%), and Transportation (3 | 2.2%).
Production, Transportation and Moving Occupations by Sex
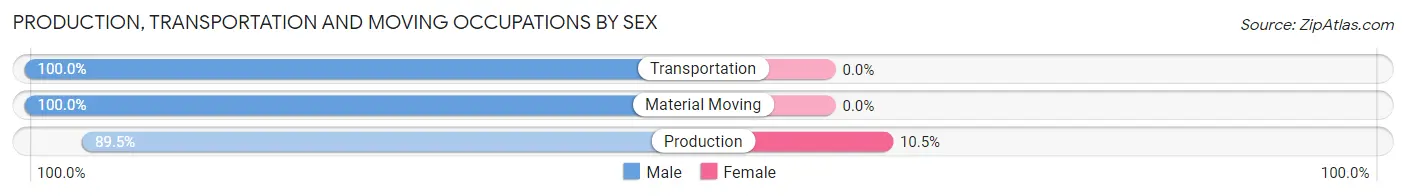
| Occupation | Male | Female |
| Production | 17 (89.5%) | 2 (10.5%) |
| Transportation | 3 (100.0%) | 0 (0.0%) |
| Material Moving | 20 (100.0%) | 0 (0.0%) |
| Total (Category) | 40 (95.2%) | 2 (4.8%) |
| Total (Overall) | 77 (57.0%) | 58 (43.0%) |
Employment Industries by Sex in Bremen
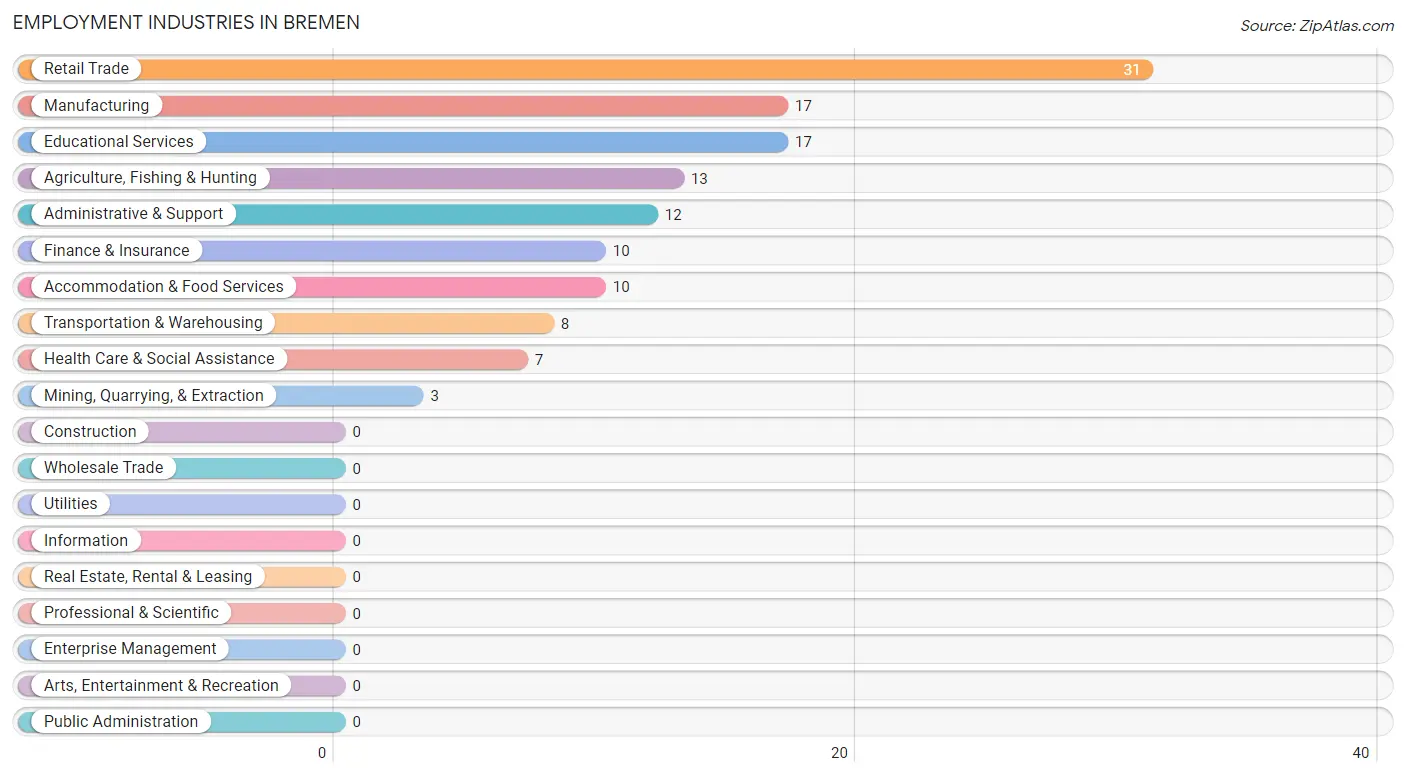
Employment Industries in Bremen
The major employment industries in Bremen include Retail Trade (31 | 23.0%), Manufacturing (17 | 12.6%), Educational Services (17 | 12.6%), Agriculture, Fishing & Hunting (13 | 9.6%), and Administrative & Support (12 | 8.9%).
Employment Industries by Sex in Bremen
The Bremen industries that see more men than women are Agriculture, Fishing & Hunting (100.0%), Mining, Quarrying, & Extraction (100.0%), and Transportation & Warehousing (100.0%), whereas the industries that tend to have a higher number of women are Finance & Insurance (100.0%), Health Care & Social Assistance (100.0%), and Educational Services (82.4%).
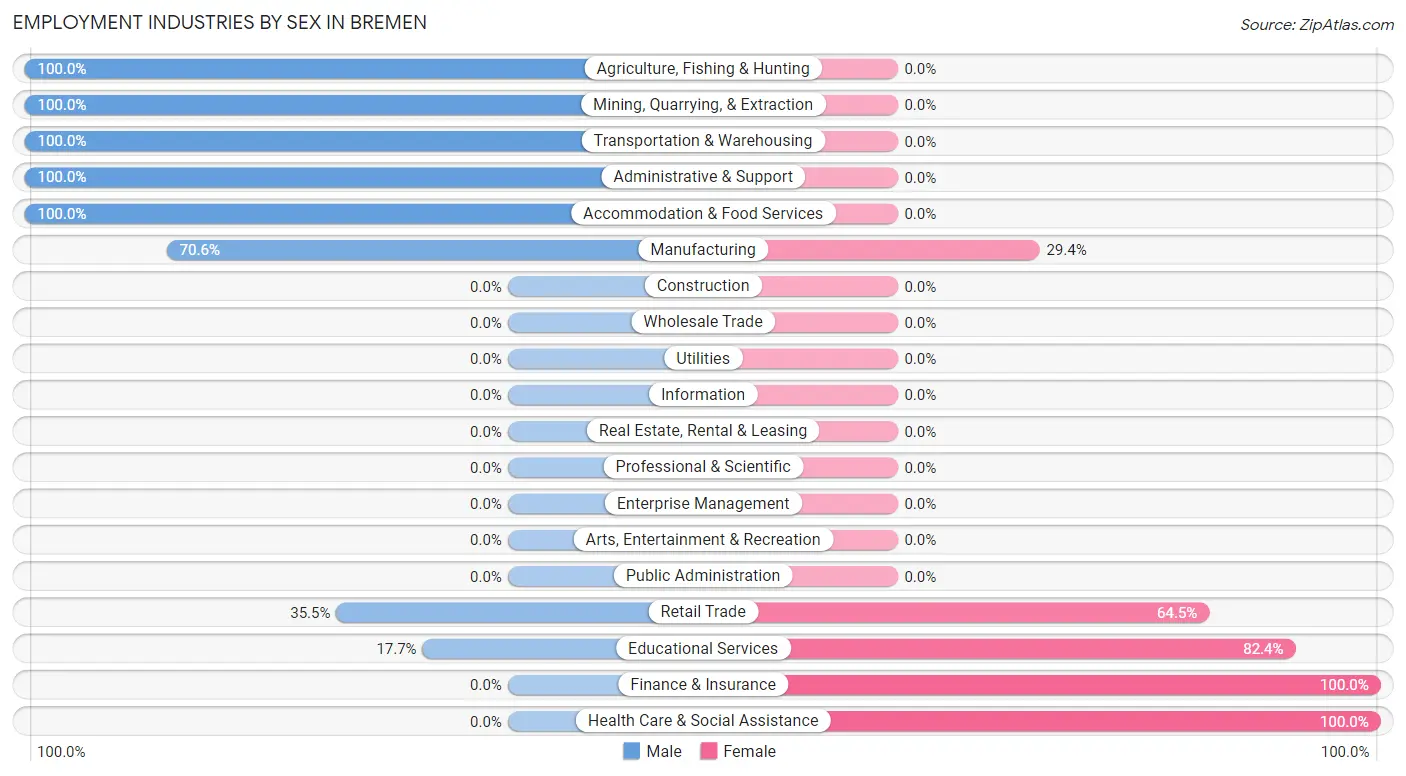
| Industry | Male | Female |
| Agriculture, Fishing & Hunting | 13 (100.0%) | 0 (0.0%) |
| Mining, Quarrying, & Extraction | 3 (100.0%) | 0 (0.0%) |
| Construction | 0 (0.0%) | 0 (0.0%) |
| Manufacturing | 12 (70.6%) | 5 (29.4%) |
| Wholesale Trade | 0 (0.0%) | 0 (0.0%) |
| Retail Trade | 11 (35.5%) | 20 (64.5%) |
| Transportation & Warehousing | 8 (100.0%) | 0 (0.0%) |
| Utilities | 0 (0.0%) | 0 (0.0%) |
| Information | 0 (0.0%) | 0 (0.0%) |
| Finance & Insurance | 0 (0.0%) | 10 (100.0%) |
| Real Estate, Rental & Leasing | 0 (0.0%) | 0 (0.0%) |
| Professional & Scientific | 0 (0.0%) | 0 (0.0%) |
| Enterprise Management | 0 (0.0%) | 0 (0.0%) |
| Administrative & Support | 12 (100.0%) | 0 (0.0%) |
| Educational Services | 3 (17.6%) | 14 (82.4%) |
| Health Care & Social Assistance | 0 (0.0%) | 7 (100.0%) |
| Arts, Entertainment & Recreation | 0 (0.0%) | 0 (0.0%) |
| Accommodation & Food Services | 10 (100.0%) | 0 (0.0%) |
| Public Administration | 0 (0.0%) | 0 (0.0%) |
| Total | 77 (57.0%) | 58 (43.0%) |
Education in Bremen
School Enrollment in Bremen
The most common levels of schooling among the 68 students in Bremen are middle school (29 | 42.6%), college / undergraduate (25 | 36.8%), and nursery / preschool (8 | 11.8%).
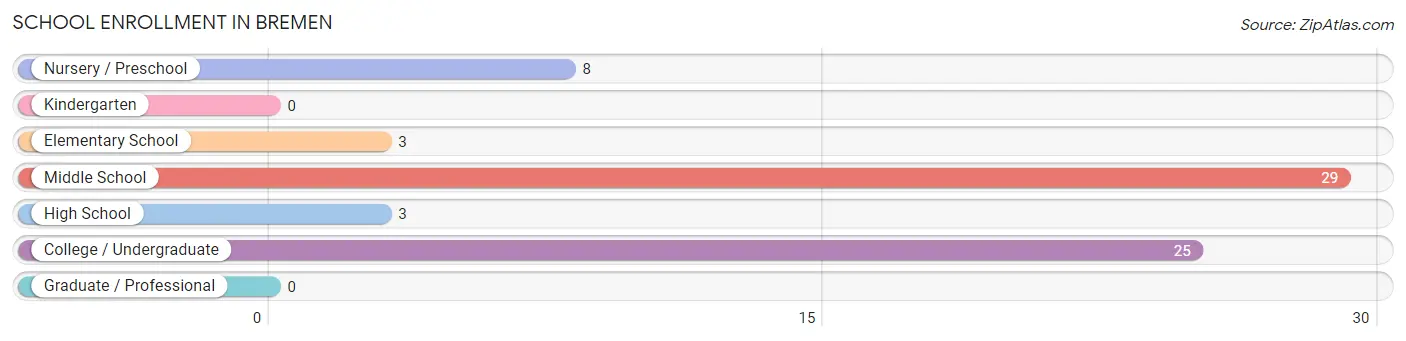
| School Level | # Students | % Students |
| Nursery / Preschool | 8 | 11.8% |
| Kindergarten | 0 | 0.0% |
| Elementary School | 3 | 4.4% |
| Middle School | 29 | 42.6% |
| High School | 3 | 4.4% |
| College / Undergraduate | 25 | 36.8% |
| Graduate / Professional | 0 | 0.0% |
| Total | 68 | 100.0% |
School Enrollment by Age by Funding Source in Bremen
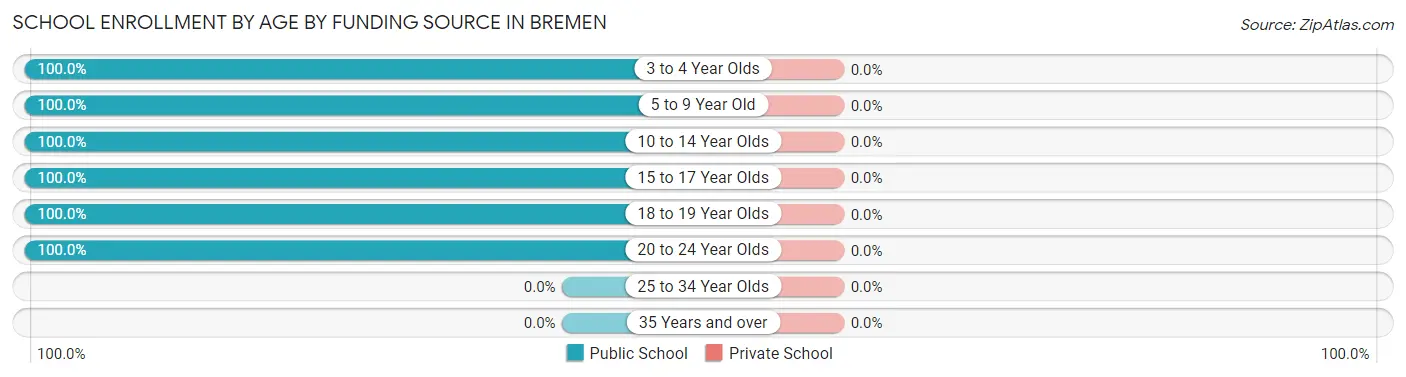
| Age Bracket | Public School | Private School |
| 3 to 4 Year Olds | 4 (100.0%) | 0 (0.0%) |
| 5 to 9 Year Old | 7 (100.0%) | 0 (0.0%) |
| 10 to 14 Year Olds | 29 (100.0%) | 0 (0.0%) |
| 15 to 17 Year Olds | 3 (100.0%) | 0 (0.0%) |
| 18 to 19 Year Olds | 23 (100.0%) | 0 (0.0%) |
| 20 to 24 Year Olds | 2 (100.0%) | 0 (0.0%) |
| 25 to 34 Year Olds | 0 (0.0%) | 0 (0.0%) |
| 35 Years and over | 0 (0.0%) | 0 (0.0%) |
| Total | 68 (100.0%) | 0 (0.0%) |
Educational Attainment by Field of Study in Bremen
Science & technology (4 | 19.1%), education (4 | 19.1%), computers & mathematics (3 | 14.3%), bio, nature & agricultural (3 | 14.3%), and arts & humanities (3 | 14.3%) are the most common fields of study among 21 individuals in Bremen who have obtained a bachelor's degree or higher.
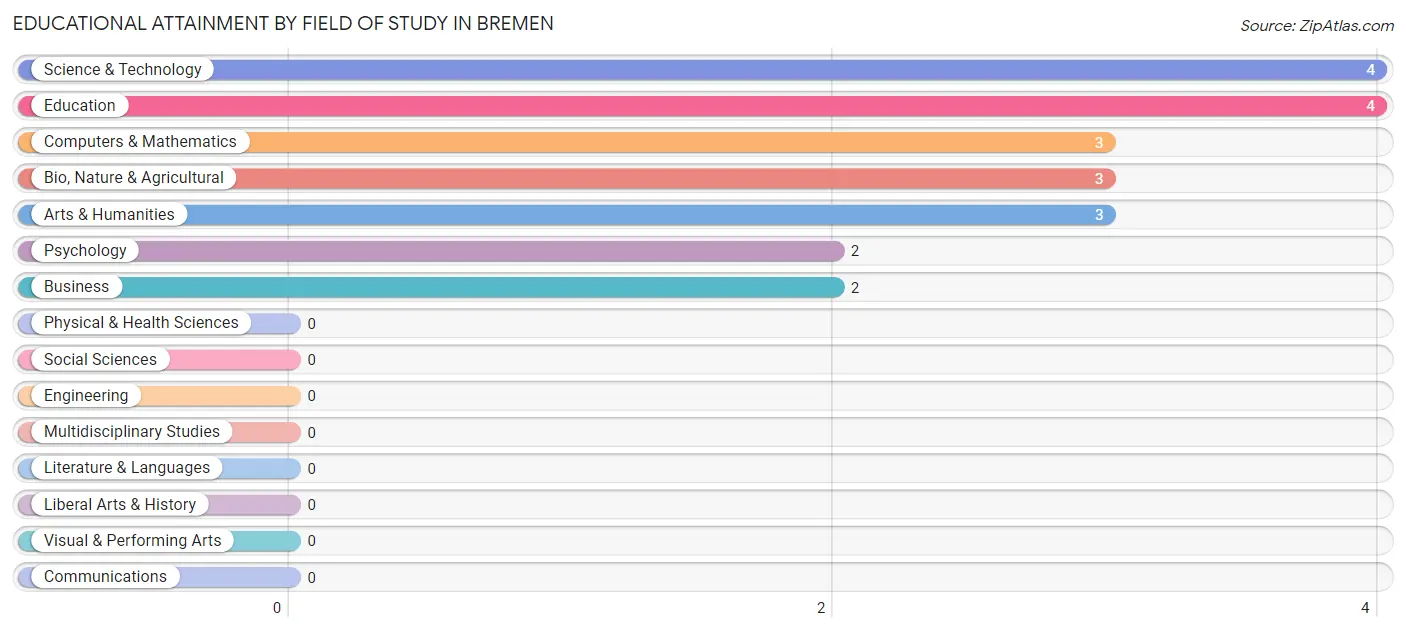
| Field of Study | # Graduates | % Graduates |
| Computers & Mathematics | 3 | 14.3% |
| Bio, Nature & Agricultural | 3 | 14.3% |
| Physical & Health Sciences | 0 | 0.0% |
| Psychology | 2 | 9.5% |
| Social Sciences | 0 | 0.0% |
| Engineering | 0 | 0.0% |
| Multidisciplinary Studies | 0 | 0.0% |
| Science & Technology | 4 | 19.1% |
| Business | 2 | 9.5% |
| Education | 4 | 19.1% |
| Literature & Languages | 0 | 0.0% |
| Liberal Arts & History | 0 | 0.0% |
| Visual & Performing Arts | 0 | 0.0% |
| Communications | 0 | 0.0% |
| Arts & Humanities | 3 | 14.3% |
| Total | 21 | 100.0% |
Transportation & Commute in Bremen
Vehicle Availability by Sex in Bremen
The most prevalent vehicle ownership categories in Bremen are males with 1 vehicle (39, accounting for 50.6%) and females with 1 vehicle (30, making up 67.2%).
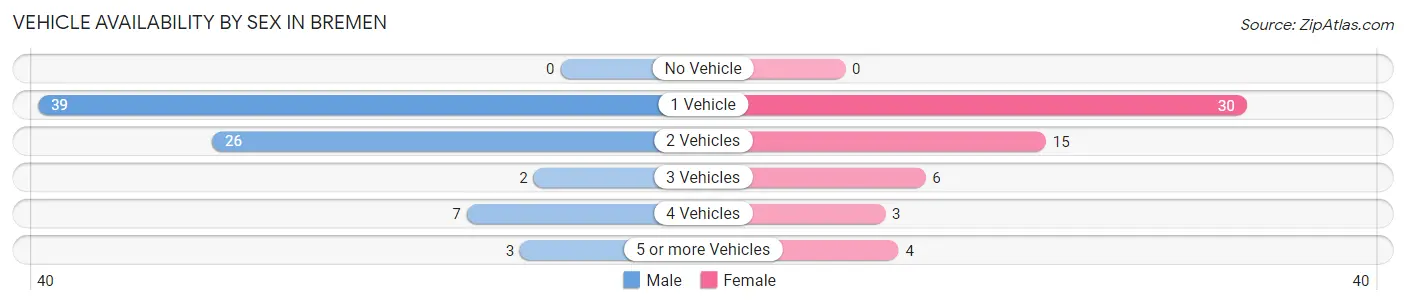
| Vehicles Available | Male | Female |
| No Vehicle | 0 (0.0%) | 0 (0.0%) |
| 1 Vehicle | 39 (50.6%) | 30 (51.7%) |
| 2 Vehicles | 26 (33.8%) | 15 (25.9%) |
| 3 Vehicles | 2 (2.6%) | 6 (10.3%) |
| 4 Vehicles | 7 (9.1%) | 3 (5.2%) |
| 5 or more Vehicles | 3 (3.9%) | 4 (6.9%) |
| Total | 77 (100.0%) | 58 (100.0%) |
Commute Time in Bremen
The most frequently occuring commute durations in Bremen are 10 to 14 minutes (33 commuters, 24.4%), 5 to 9 minutes (26 commuters, 19.3%), and 15 to 19 minutes (23 commuters, 17.0%).
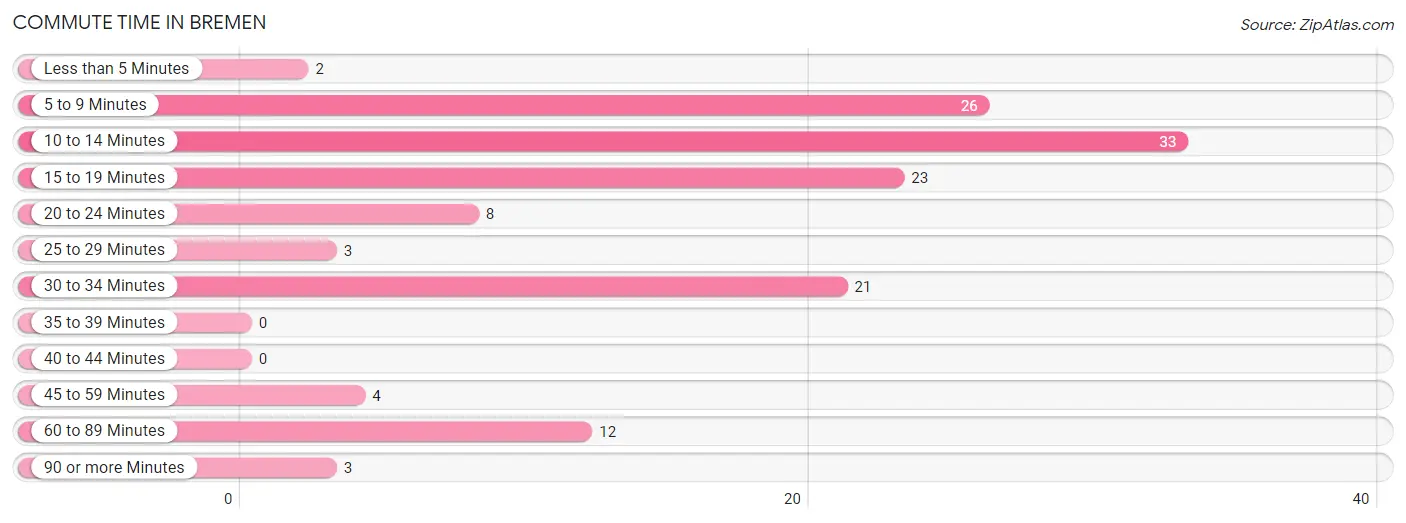
| Commute Time | # Commuters | % Commuters |
| Less than 5 Minutes | 2 | 1.5% |
| 5 to 9 Minutes | 26 | 19.3% |
| 10 to 14 Minutes | 33 | 24.4% |
| 15 to 19 Minutes | 23 | 17.0% |
| 20 to 24 Minutes | 8 | 5.9% |
| 25 to 29 Minutes | 3 | 2.2% |
| 30 to 34 Minutes | 21 | 15.6% |
| 35 to 39 Minutes | 0 | 0.0% |
| 40 to 44 Minutes | 0 | 0.0% |
| 45 to 59 Minutes | 4 | 3.0% |
| 60 to 89 Minutes | 12 | 8.9% |
| 90 or more Minutes | 3 | 2.2% |
Commute Time by Sex in Bremen
The most common commute times in Bremen are 10 to 14 minutes (20 commuters, 26.0%) for males and 15 to 19 minutes (20 commuters, 34.5%) for females.
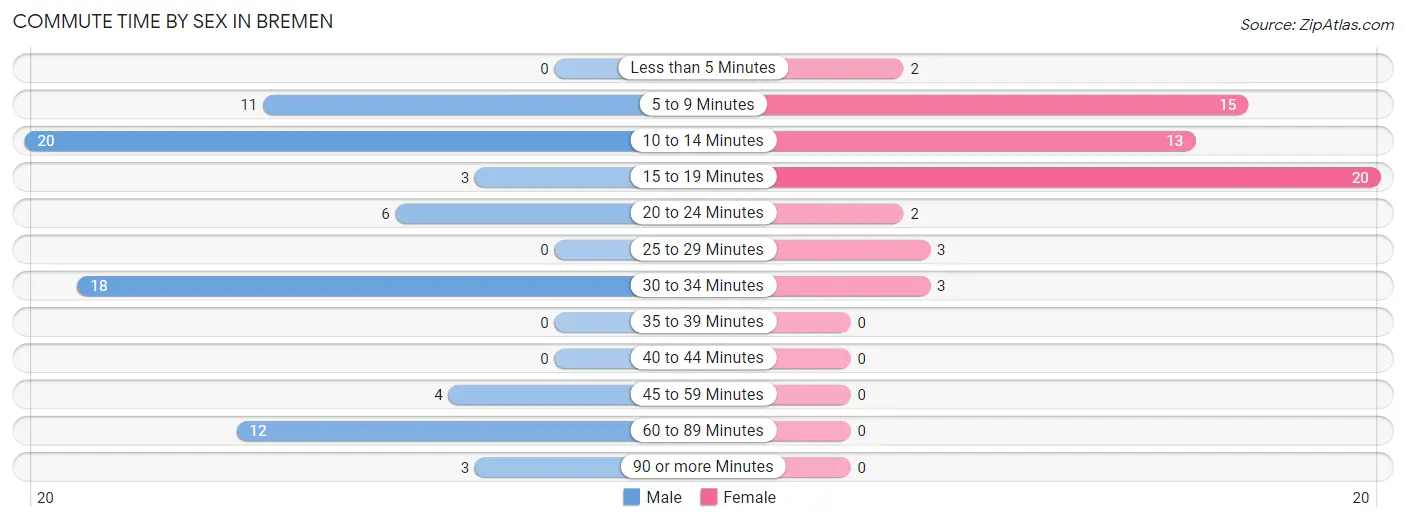
| Commute Time | Male | Female |
| Less than 5 Minutes | 0 (0.0%) | 2 (3.5%) |
| 5 to 9 Minutes | 11 (14.3%) | 15 (25.9%) |
| 10 to 14 Minutes | 20 (26.0%) | 13 (22.4%) |
| 15 to 19 Minutes | 3 (3.9%) | 20 (34.5%) |
| 20 to 24 Minutes | 6 (7.8%) | 2 (3.5%) |
| 25 to 29 Minutes | 0 (0.0%) | 3 (5.2%) |
| 30 to 34 Minutes | 18 (23.4%) | 3 (5.2%) |
| 35 to 39 Minutes | 0 (0.0%) | 0 (0.0%) |
| 40 to 44 Minutes | 0 (0.0%) | 0 (0.0%) |
| 45 to 59 Minutes | 4 (5.2%) | 0 (0.0%) |
| 60 to 89 Minutes | 12 (15.6%) | 0 (0.0%) |
| 90 or more Minutes | 3 (3.9%) | 0 (0.0%) |
Time of Departure to Work by Sex in Bremen
The most frequent times of departure to work in Bremen are 7:00 AM to 7:29 AM (24, 31.2%) for males and 7:30 AM to 7:59 AM (23, 39.7%) for females.
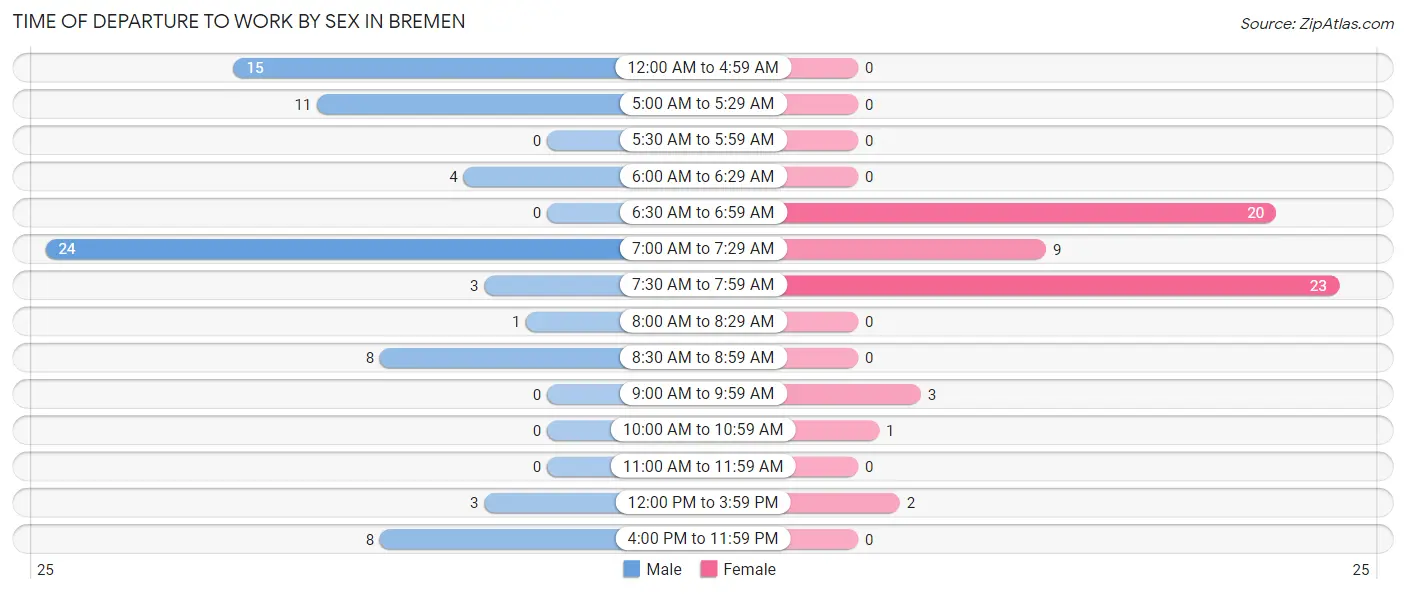
| Time of Departure | Male | Female |
| 12:00 AM to 4:59 AM | 15 (19.5%) | 0 (0.0%) |
| 5:00 AM to 5:29 AM | 11 (14.3%) | 0 (0.0%) |
| 5:30 AM to 5:59 AM | 0 (0.0%) | 0 (0.0%) |
| 6:00 AM to 6:29 AM | 4 (5.2%) | 0 (0.0%) |
| 6:30 AM to 6:59 AM | 0 (0.0%) | 20 (34.5%) |
| 7:00 AM to 7:29 AM | 24 (31.2%) | 9 (15.5%) |
| 7:30 AM to 7:59 AM | 3 (3.9%) | 23 (39.7%) |
| 8:00 AM to 8:29 AM | 1 (1.3%) | 0 (0.0%) |
| 8:30 AM to 8:59 AM | 8 (10.4%) | 0 (0.0%) |
| 9:00 AM to 9:59 AM | 0 (0.0%) | 3 (5.2%) |
| 10:00 AM to 10:59 AM | 0 (0.0%) | 1 (1.7%) |
| 11:00 AM to 11:59 AM | 0 (0.0%) | 0 (0.0%) |
| 12:00 PM to 3:59 PM | 3 (3.9%) | 2 (3.5%) |
| 4:00 PM to 11:59 PM | 8 (10.4%) | 0 (0.0%) |
| Total | 77 (100.0%) | 58 (100.0%) |
Housing Occupancy in Bremen
Occupancy by Ownership in Bremen
Of the total 181 dwellings in Bremen, owner-occupied units account for 92 (50.8%), while renter-occupied units make up 89 (49.2%).
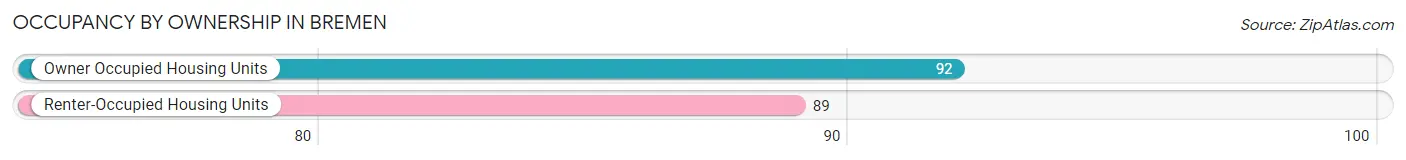
| Occupancy | # Housing Units | % Housing Units |
| Owner Occupied Housing Units | 92 | 50.8% |
| Renter-Occupied Housing Units | 89 | 49.2% |
| Total Occupied Housing Units | 181 | 100.0% |
Occupancy by Household Size in Bremen
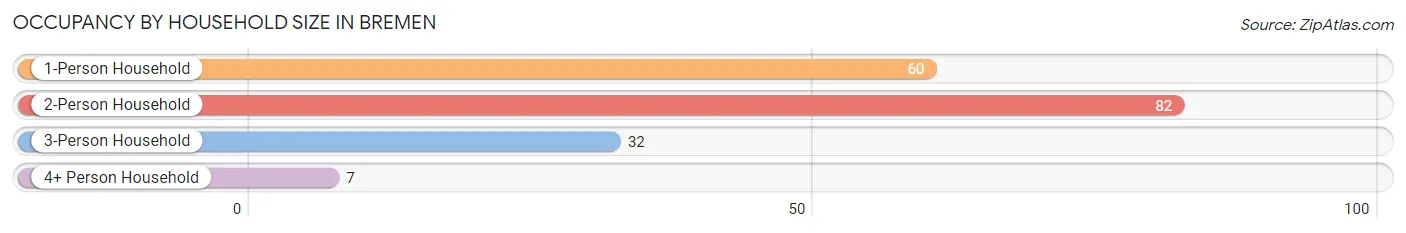
| Household Size | # Housing Units | % Housing Units |
| 1-Person Household | 60 | 33.2% |
| 2-Person Household | 82 | 45.3% |
| 3-Person Household | 32 | 17.7% |
| 4+ Person Household | 7 | 3.9% |
| Total Housing Units | 181 | 100.0% |
Occupancy by Ownership by Household Size in Bremen
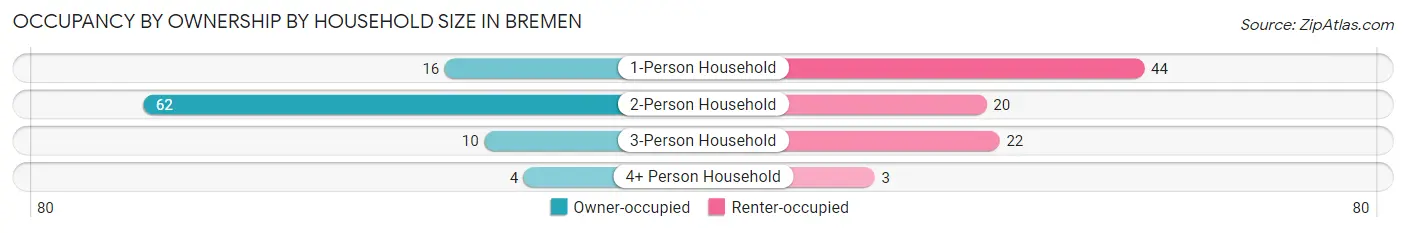
| Household Size | Owner-occupied | Renter-occupied |
| 1-Person Household | 16 (26.7%) | 44 (73.3%) |
| 2-Person Household | 62 (75.6%) | 20 (24.4%) |
| 3-Person Household | 10 (31.2%) | 22 (68.8%) |
| 4+ Person Household | 4 (57.1%) | 3 (42.9%) |
| Total Housing Units | 92 (50.8%) | 89 (49.2%) |
Occupancy by Educational Attainment in Bremen
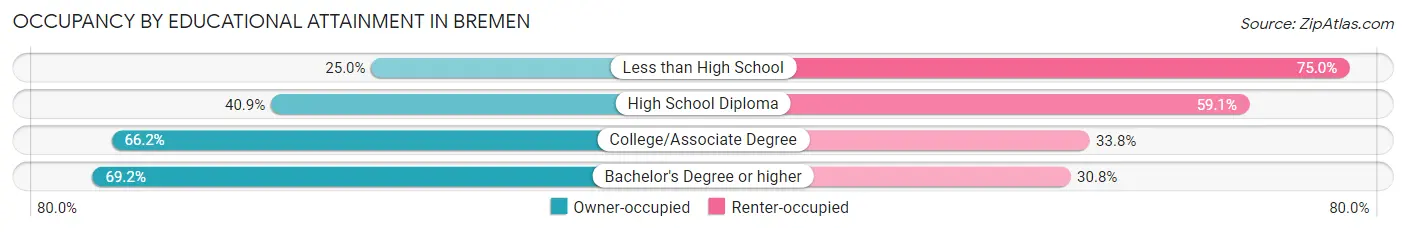
| Household Size | Owner-occupied | Renter-occupied |
| Less than High School | 7 (25.0%) | 21 (75.0%) |
| High School Diploma | 27 (40.9%) | 39 (59.1%) |
| College/Associate Degree | 49 (66.2%) | 25 (33.8%) |
| Bachelor's Degree or higher | 9 (69.2%) | 4 (30.8%) |
Occupancy by Age of Householder in Bremen
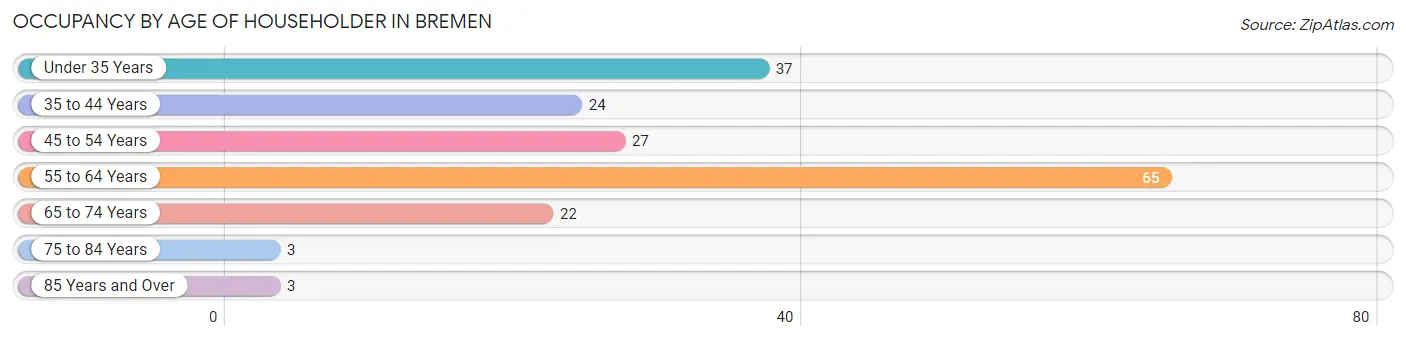
| Age Bracket | # Households | % Households |
| Under 35 Years | 37 | 20.4% |
| 35 to 44 Years | 24 | 13.3% |
| 45 to 54 Years | 27 | 14.9% |
| 55 to 64 Years | 65 | 35.9% |
| 65 to 74 Years | 22 | 12.1% |
| 75 to 84 Years | 3 | 1.7% |
| 85 Years and Over | 3 | 1.7% |
| Total | 181 | 100.0% |
Housing Finances in Bremen
Median Income by Occupancy in Bremen
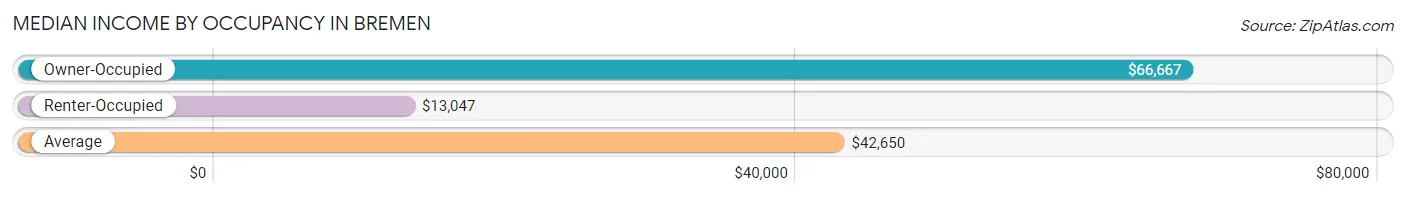
| Occupancy Type | # Households | Median Income |
| Owner-Occupied | 92 (50.8%) | $66,667 |
| Renter-Occupied | 89 (49.2%) | $13,047 |
| Average | 181 (100.0%) | $42,650 |
Occupancy by Householder Income Bracket in Bremen
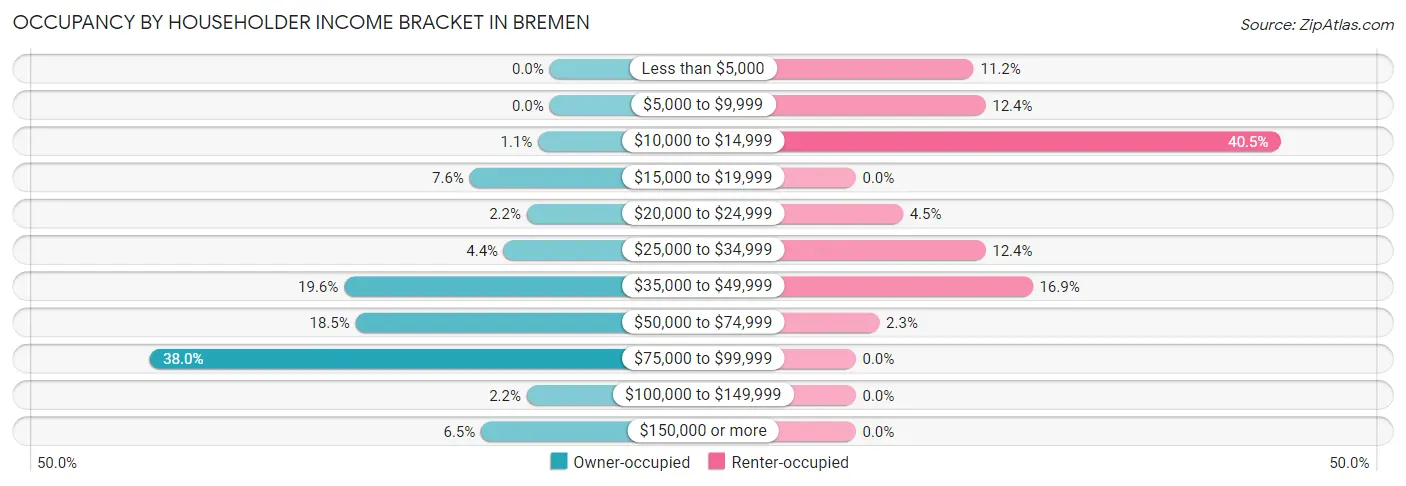
| Income Bracket | Owner-occupied | Renter-occupied |
| Less than $5,000 | 0 (0.0%) | 10 (11.2%) |
| $5,000 to $9,999 | 0 (0.0%) | 11 (12.4%) |
| $10,000 to $14,999 | 1 (1.1%) | 36 (40.5%) |
| $15,000 to $19,999 | 7 (7.6%) | 0 (0.0%) |
| $20,000 to $24,999 | 2 (2.2%) | 4 (4.5%) |
| $25,000 to $34,999 | 4 (4.3%) | 11 (12.4%) |
| $35,000 to $49,999 | 18 (19.6%) | 15 (16.9%) |
| $50,000 to $74,999 | 17 (18.5%) | 2 (2.2%) |
| $75,000 to $99,999 | 35 (38.0%) | 0 (0.0%) |
| $100,000 to $149,999 | 2 (2.2%) | 0 (0.0%) |
| $150,000 or more | 6 (6.5%) | 0 (0.0%) |
| Total | 92 (100.0%) | 89 (100.0%) |
Monthly Housing Cost Tiers in Bremen
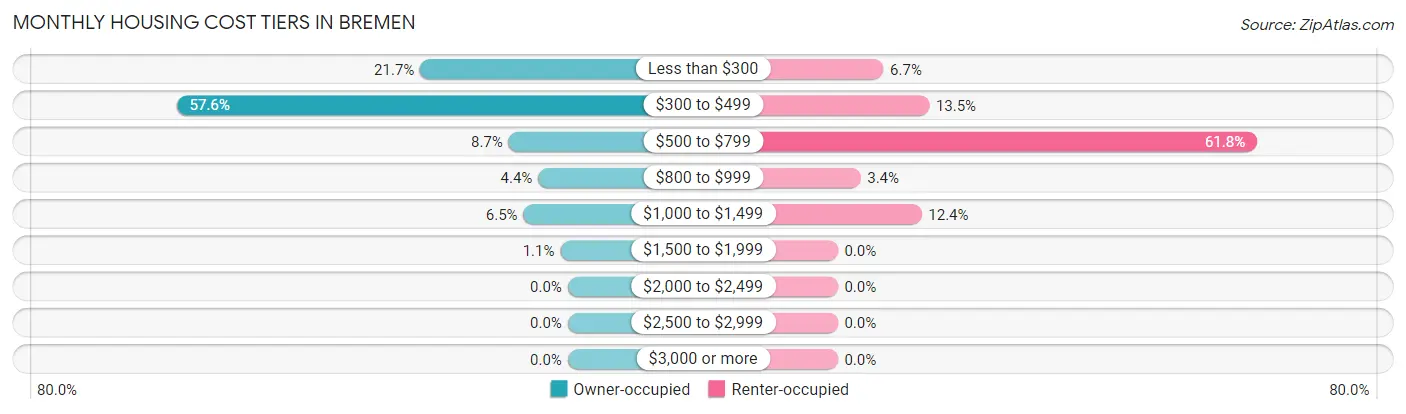
| Monthly Cost | Owner-occupied | Renter-occupied |
| Less than $300 | 20 (21.7%) | 6 (6.7%) |
| $300 to $499 | 53 (57.6%) | 12 (13.5%) |
| $500 to $799 | 8 (8.7%) | 55 (61.8%) |
| $800 to $999 | 4 (4.3%) | 3 (3.4%) |
| $1,000 to $1,499 | 6 (6.5%) | 11 (12.4%) |
| $1,500 to $1,999 | 1 (1.1%) | 0 (0.0%) |
| $2,000 to $2,499 | 0 (0.0%) | 0 (0.0%) |
| $2,500 to $2,999 | 0 (0.0%) | 0 (0.0%) |
| $3,000 or more | 0 (0.0%) | 0 (0.0%) |
| Total | 92 (100.0%) | 89 (100.0%) |
Physical Housing Characteristics in Bremen
Housing Structures in Bremen
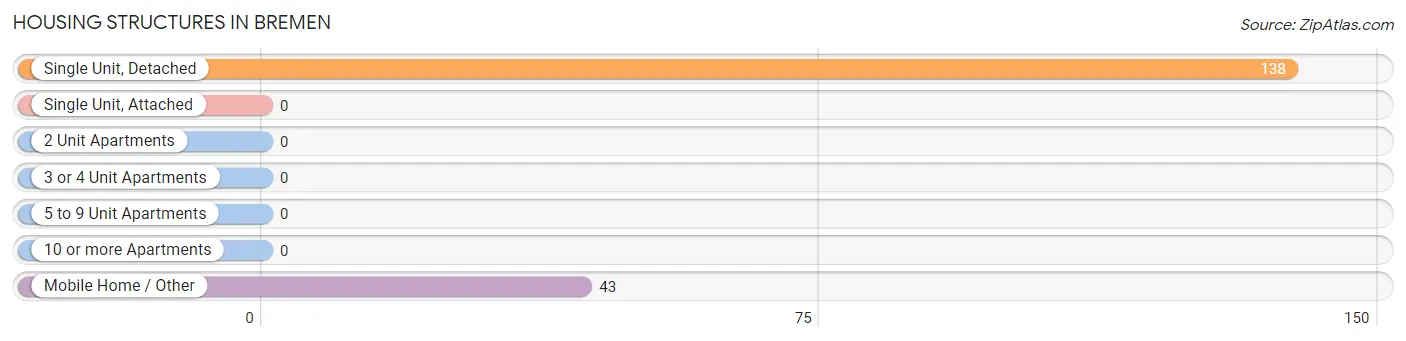
| Structure Type | # Housing Units | % Housing Units |
| Single Unit, Detached | 138 | 76.2% |
| Single Unit, Attached | 0 | 0.0% |
| 2 Unit Apartments | 0 | 0.0% |
| 3 or 4 Unit Apartments | 0 | 0.0% |
| 5 to 9 Unit Apartments | 0 | 0.0% |
| 10 or more Apartments | 0 | 0.0% |
| Mobile Home / Other | 43 | 23.8% |
| Total | 181 | 100.0% |
Housing Structures by Occupancy in Bremen
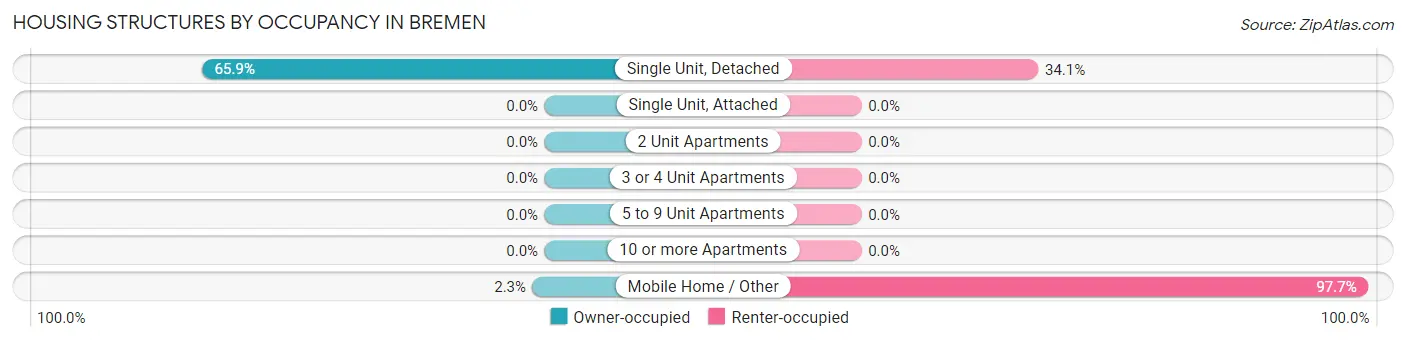
| Structure Type | Owner-occupied | Renter-occupied |
| Single Unit, Detached | 91 (65.9%) | 47 (34.1%) |
| Single Unit, Attached | 0 (0.0%) | 0 (0.0%) |
| 2 Unit Apartments | 0 (0.0%) | 0 (0.0%) |
| 3 or 4 Unit Apartments | 0 (0.0%) | 0 (0.0%) |
| 5 to 9 Unit Apartments | 0 (0.0%) | 0 (0.0%) |
| 10 or more Apartments | 0 (0.0%) | 0 (0.0%) |
| Mobile Home / Other | 1 (2.3%) | 42 (97.7%) |
| Total | 92 (50.8%) | 89 (49.2%) |
Housing Structures by Number of Rooms in Bremen
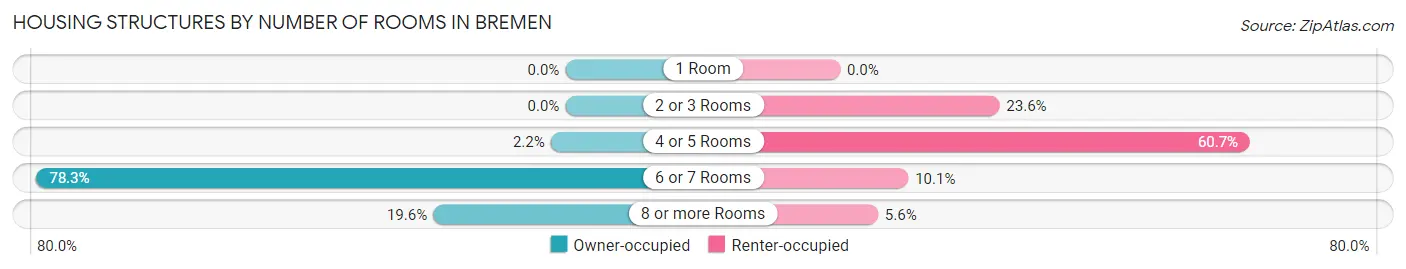
| Number of Rooms | Owner-occupied | Renter-occupied |
| 1 Room | 0 (0.0%) | 0 (0.0%) |
| 2 or 3 Rooms | 0 (0.0%) | 21 (23.6%) |
| 4 or 5 Rooms | 2 (2.2%) | 54 (60.7%) |
| 6 or 7 Rooms | 72 (78.3%) | 9 (10.1%) |
| 8 or more Rooms | 18 (19.6%) | 5 (5.6%) |
| Total | 92 (100.0%) | 89 (100.0%) |
Housing Structure by Heating Type in Bremen
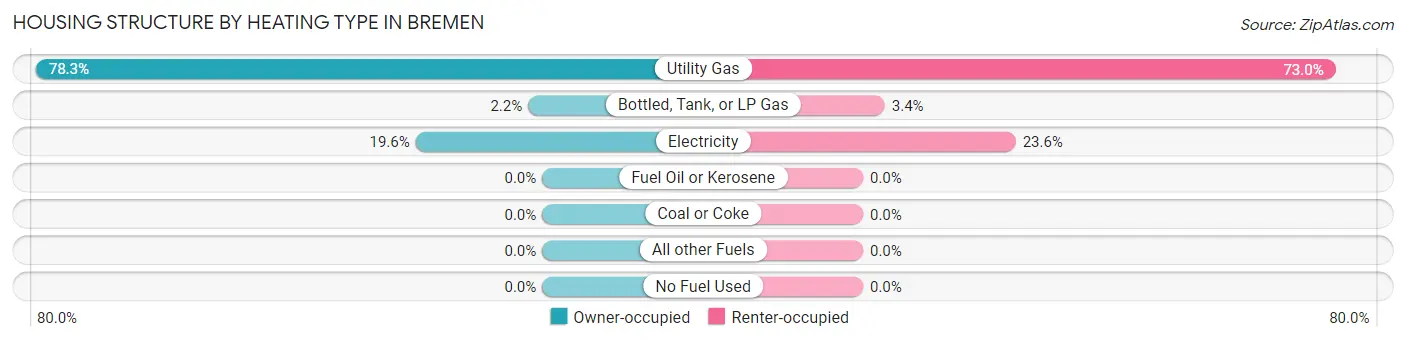
| Heating Type | Owner-occupied | Renter-occupied |
| Utility Gas | 72 (78.3%) | 65 (73.0%) |
| Bottled, Tank, or LP Gas | 2 (2.2%) | 3 (3.4%) |
| Electricity | 18 (19.6%) | 21 (23.6%) |
| Fuel Oil or Kerosene | 0 (0.0%) | 0 (0.0%) |
| Coal or Coke | 0 (0.0%) | 0 (0.0%) |
| All other Fuels | 0 (0.0%) | 0 (0.0%) |
| No Fuel Used | 0 (0.0%) | 0 (0.0%) |
| Total | 92 (100.0%) | 89 (100.0%) |
Household Vehicle Usage in Bremen
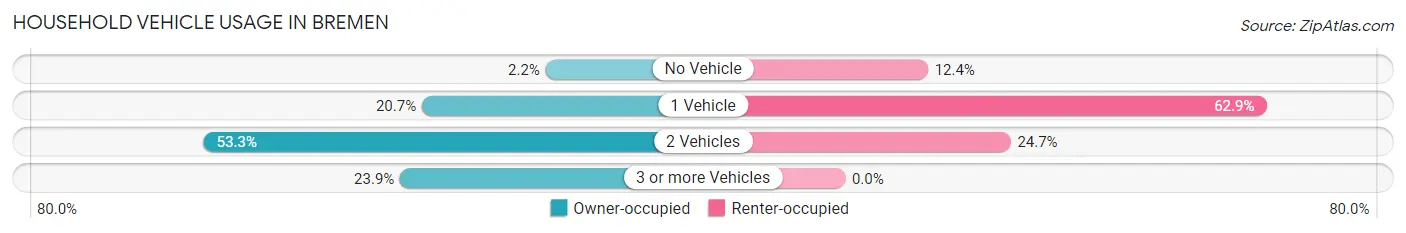
| Vehicles per Household | Owner-occupied | Renter-occupied |
| No Vehicle | 2 (2.2%) | 11 (12.4%) |
| 1 Vehicle | 19 (20.6%) | 56 (62.9%) |
| 2 Vehicles | 49 (53.3%) | 22 (24.7%) |
| 3 or more Vehicles | 22 (23.9%) | 0 (0.0%) |
| Total | 92 (100.0%) | 89 (100.0%) |
Real Estate & Mortgages in Bremen
Real Estate and Mortgage Overview in Bremen
| Characteristic | Without Mortgage | With Mortgage |
| Housing Units | 75 | 17 |
| Median Property Value | $128,400 | $98,300 |
| Median Household Income | $80,037 | $3 |
| Monthly Housing Costs | $361 | $0 |
| Real Estate Taxes | $626 | $1 |
Property Value by Mortgage Status in Bremen
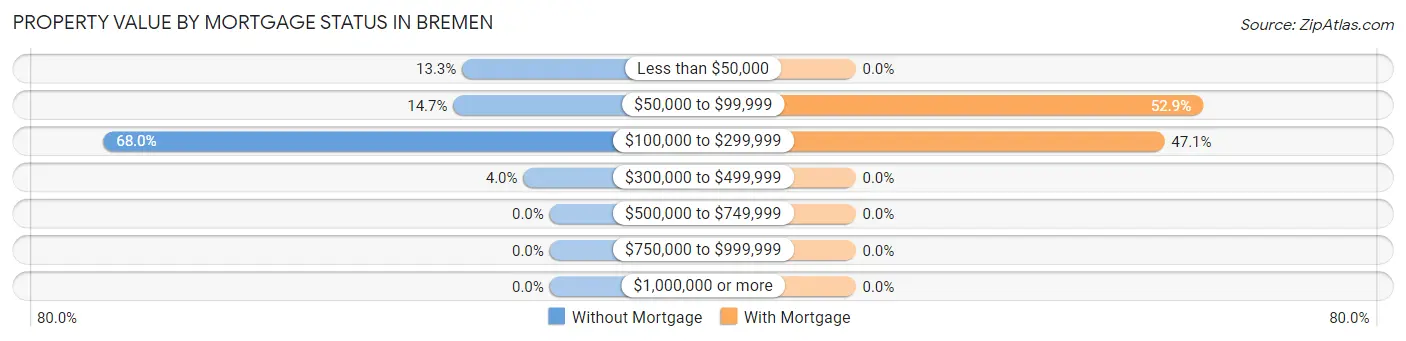
| Property Value | Without Mortgage | With Mortgage |
| Less than $50,000 | 10 (13.3%) | 0 (0.0%) |
| $50,000 to $99,999 | 11 (14.7%) | 9 (52.9%) |
| $100,000 to $299,999 | 51 (68.0%) | 8 (47.1%) |
| $300,000 to $499,999 | 3 (4.0%) | 0 (0.0%) |
| $500,000 to $749,999 | 0 (0.0%) | 0 (0.0%) |
| $750,000 to $999,999 | 0 (0.0%) | 0 (0.0%) |
| $1,000,000 or more | 0 (0.0%) | 0 (0.0%) |
| Total | 75 (100.0%) | 17 (100.0%) |
Household Income by Mortgage Status in Bremen
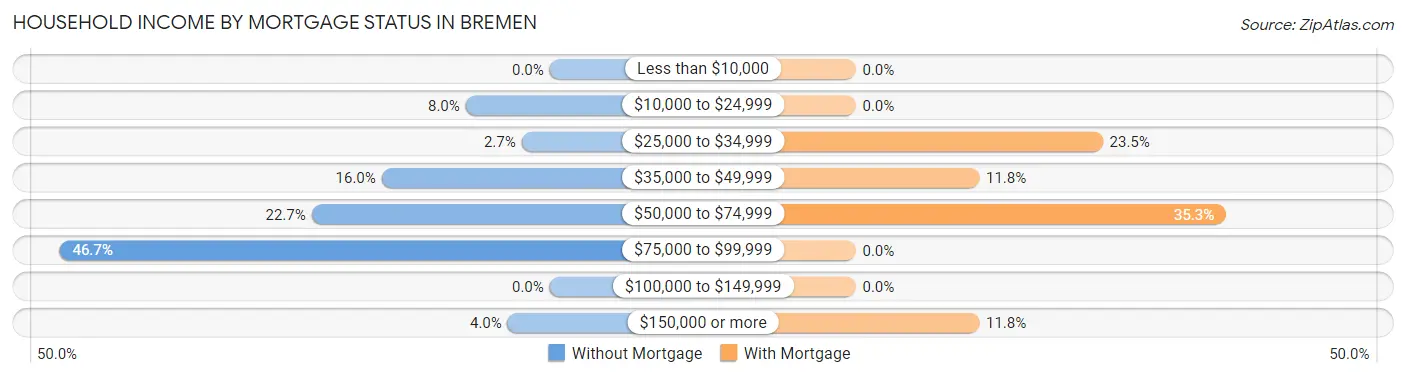
| Household Income | Without Mortgage | With Mortgage |
| Less than $10,000 | 0 (0.0%) | 0 (0.0%) |
| $10,000 to $24,999 | 6 (8.0%) | 0 (0.0%) |
| $25,000 to $34,999 | 2 (2.7%) | 4 (23.5%) |
| $35,000 to $49,999 | 12 (16.0%) | 2 (11.8%) |
| $50,000 to $74,999 | 17 (22.7%) | 6 (35.3%) |
| $75,000 to $99,999 | 35 (46.7%) | 0 (0.0%) |
| $100,000 to $149,999 | 0 (0.0%) | 0 (0.0%) |
| $150,000 or more | 3 (4.0%) | 2 (11.8%) |
| Total | 75 (100.0%) | 17 (100.0%) |
Property Value to Household Income Ratio in Bremen
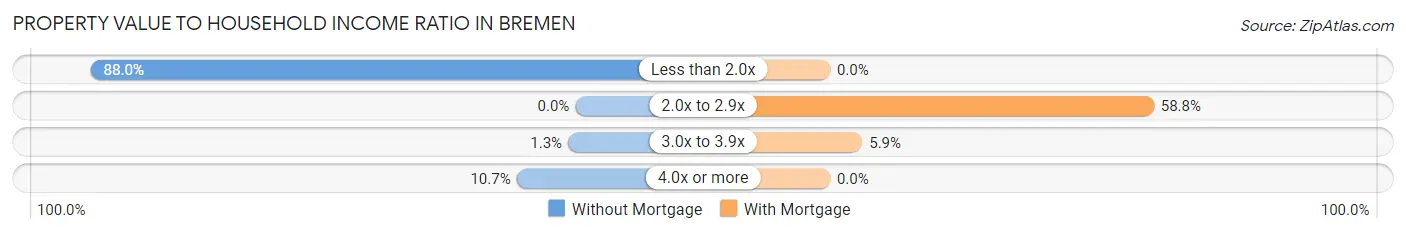
| Value-to-Income Ratio | Without Mortgage | With Mortgage |
| Less than 2.0x | 66 (88.0%) | 0 (0.0%) |
| 2.0x to 2.9x | 0 (0.0%) | 10 (58.8%) |
| 3.0x to 3.9x | 1 (1.3%) | 1 (5.9%) |
| 4.0x or more | 8 (10.7%) | 0 (0.0%) |
| Total | 75 (100.0%) | 17 (100.0%) |
Real Estate Taxes by Mortgage Status in Bremen
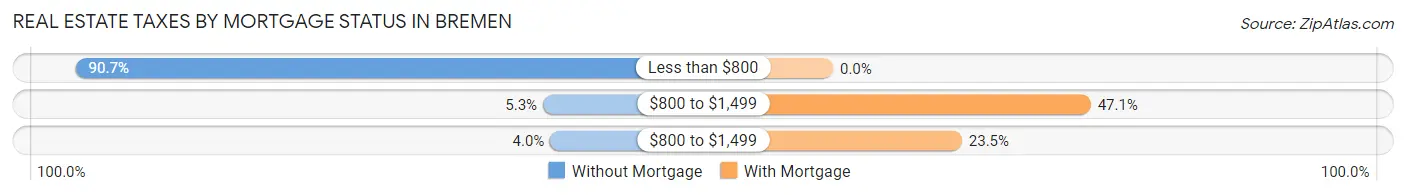
| Property Taxes | Without Mortgage | With Mortgage |
| Less than $800 | 68 (90.7%) | 0 (0.0%) |
| $800 to $1,499 | 4 (5.3%) | 8 (47.1%) |
| $800 to $1,499 | 3 (4.0%) | 4 (23.5%) |
| Total | 75 (100.0%) | 17 (100.0%) |
Health & Disability in Bremen
Health Insurance Coverage by Age in Bremen
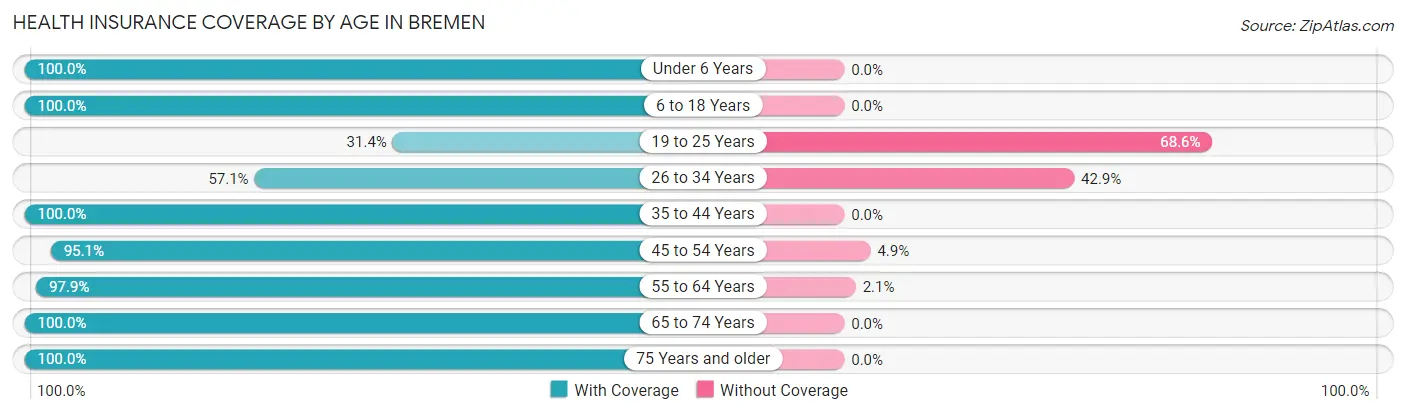
| Age Bracket | With Coverage | Without Coverage |
| Under 6 Years | 26 (100.0%) | 0 (0.0%) |
| 6 to 18 Years | 48 (100.0%) | 0 (0.0%) |
| 19 to 25 Years | 16 (31.4%) | 35 (68.6%) |
| 26 to 34 Years | 16 (57.1%) | 12 (42.9%) |
| 35 to 44 Years | 27 (100.0%) | 0 (0.0%) |
| 45 to 54 Years | 39 (95.1%) | 2 (4.9%) |
| 55 to 64 Years | 92 (97.9%) | 2 (2.1%) |
| 65 to 74 Years | 54 (100.0%) | 0 (0.0%) |
| 75 Years and older | 14 (100.0%) | 0 (0.0%) |
| Total | 332 (86.7%) | 51 (13.3%) |
Health Insurance Coverage by Citizenship Status in Bremen
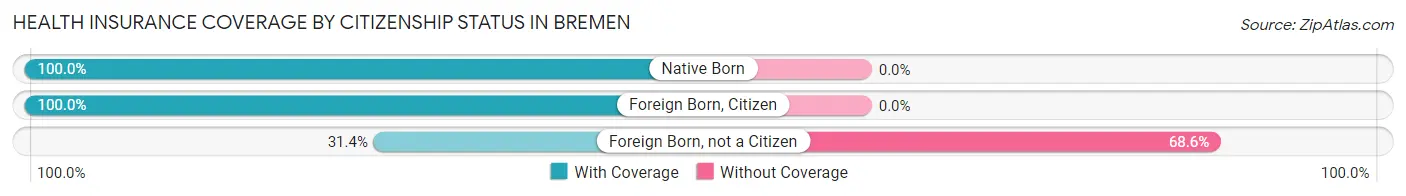
| Citizenship Status | With Coverage | Without Coverage |
| Native Born | 26 (100.0%) | 0 (0.0%) |
| Foreign Born, Citizen | 48 (100.0%) | 0 (0.0%) |
| Foreign Born, not a Citizen | 16 (31.4%) | 35 (68.6%) |
Health Insurance Coverage by Household Income in Bremen
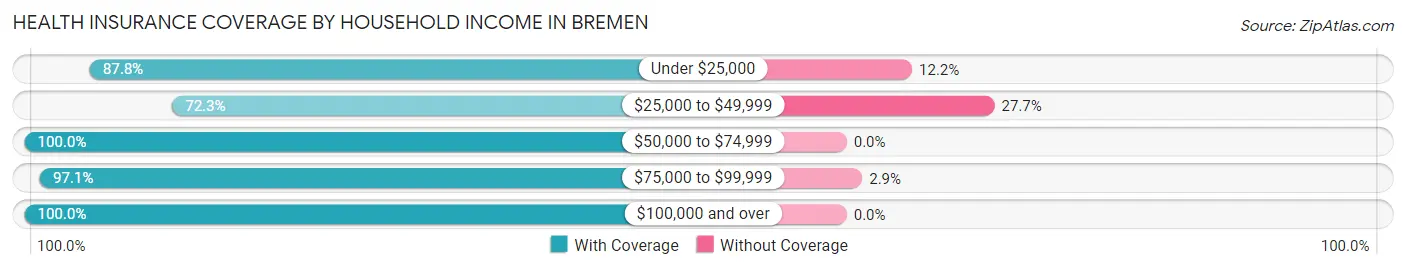
| Household Income | With Coverage | Without Coverage |
| Under $25,000 | 129 (87.8%) | 18 (12.2%) |
| $25,000 to $49,999 | 81 (72.3%) | 31 (27.7%) |
| $50,000 to $74,999 | 29 (100.0%) | 0 (0.0%) |
| $75,000 to $99,999 | 67 (97.1%) | 2 (2.9%) |
| $100,000 and over | 26 (100.0%) | 0 (0.0%) |
Public vs Private Health Insurance Coverage by Age in Bremen
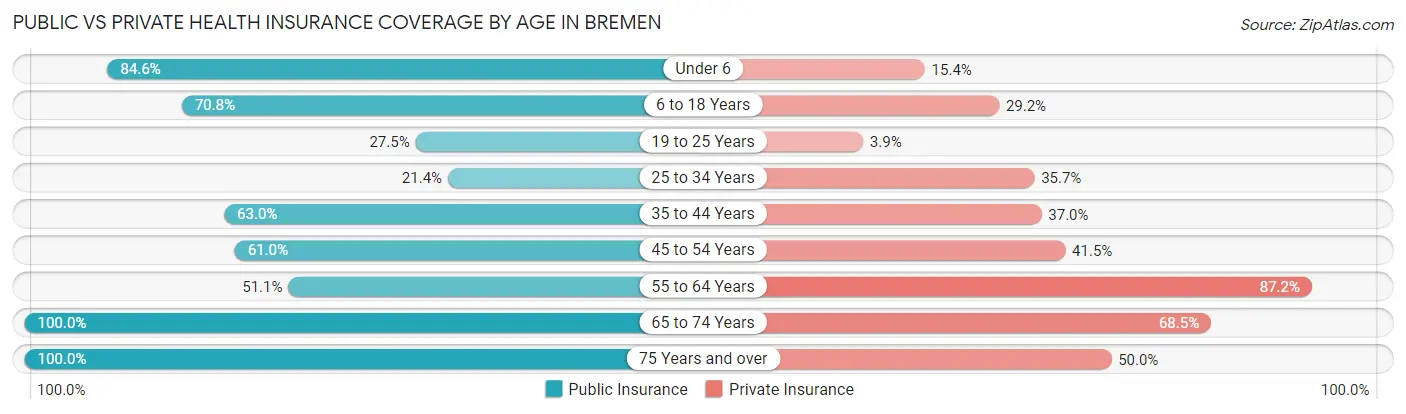
| Age Bracket | Public Insurance | Private Insurance |
| Under 6 | 22 (84.6%) | 4 (15.4%) |
| 6 to 18 Years | 34 (70.8%) | 14 (29.2%) |
| 19 to 25 Years | 14 (27.5%) | 2 (3.9%) |
| 25 to 34 Years | 6 (21.4%) | 10 (35.7%) |
| 35 to 44 Years | 17 (63.0%) | 10 (37.0%) |
| 45 to 54 Years | 25 (61.0%) | 17 (41.5%) |
| 55 to 64 Years | 48 (51.1%) | 82 (87.2%) |
| 65 to 74 Years | 54 (100.0%) | 37 (68.5%) |
| 75 Years and over | 14 (100.0%) | 7 (50.0%) |
| Total | 234 (61.1%) | 183 (47.8%) |
Disability Status by Sex by Age in Bremen
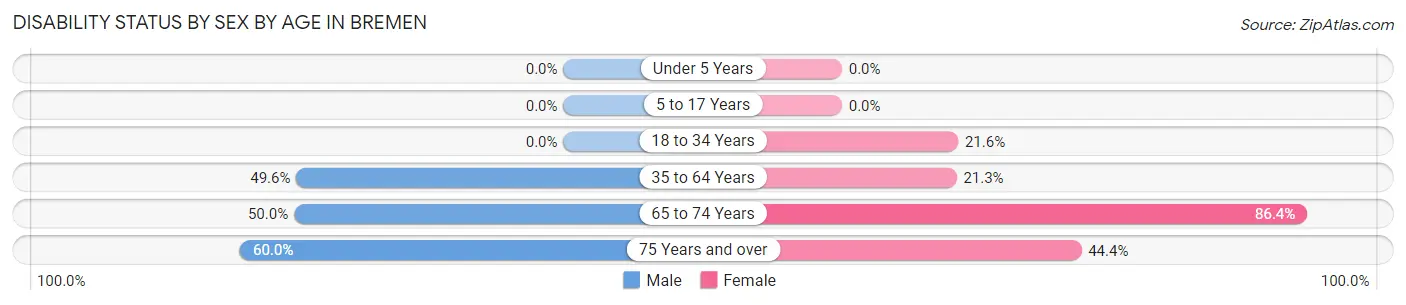
| Age Bracket | Male | Female |
| Under 5 Years | 0 (0.0%) | 0 (0.0%) |
| 5 to 17 Years | 0 (0.0%) | 0 (0.0%) |
| 18 to 34 Years | 0 (0.0%) | 11 (21.6%) |
| 35 to 64 Years | 57 (49.6%) | 10 (21.3%) |
| 65 to 74 Years | 5 (50.0%) | 38 (86.4%) |
| 75 Years and over | 3 (60.0%) | 4 (44.4%) |
Disability Class by Sex by Age in Bremen
Disability Class: Hearing Difficulty
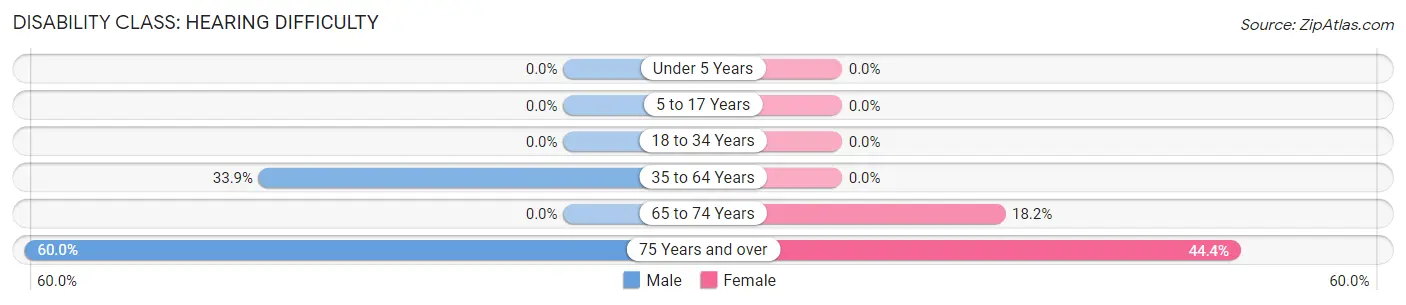
| Age Bracket | Male | Female |
| Under 5 Years | 0 (0.0%) | 0 (0.0%) |
| 5 to 17 Years | 0 (0.0%) | 0 (0.0%) |
| 18 to 34 Years | 0 (0.0%) | 0 (0.0%) |
| 35 to 64 Years | 39 (33.9%) | 0 (0.0%) |
| 65 to 74 Years | 0 (0.0%) | 8 (18.2%) |
| 75 Years and over | 3 (60.0%) | 4 (44.4%) |
Disability Class: Vision Difficulty
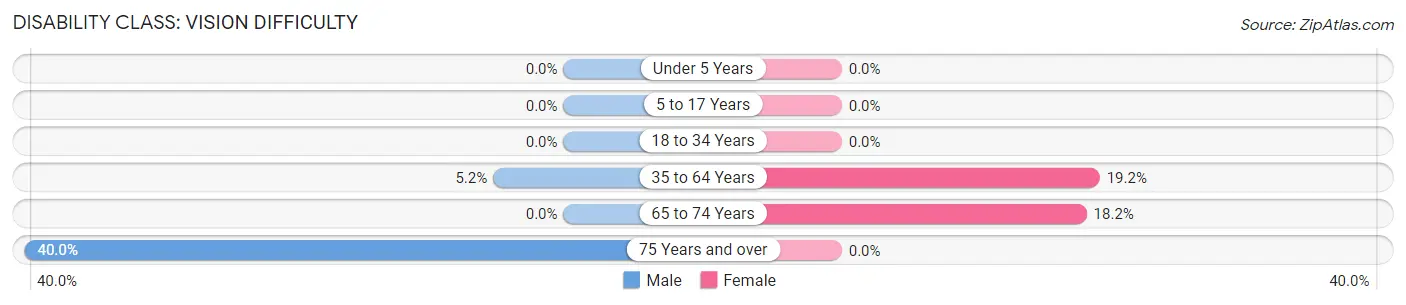
| Age Bracket | Male | Female |
| Under 5 Years | 0 (0.0%) | 0 (0.0%) |
| 5 to 17 Years | 0 (0.0%) | 0 (0.0%) |
| 18 to 34 Years | 0 (0.0%) | 0 (0.0%) |
| 35 to 64 Years | 6 (5.2%) | 9 (19.2%) |
| 65 to 74 Years | 0 (0.0%) | 8 (18.2%) |
| 75 Years and over | 2 (40.0%) | 0 (0.0%) |
Disability Class: Cognitive Difficulty
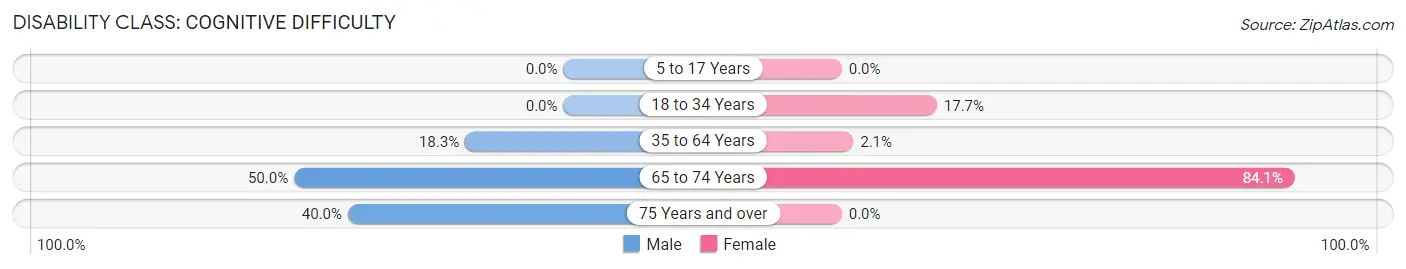
| Age Bracket | Male | Female |
| 5 to 17 Years | 0 (0.0%) | 0 (0.0%) |
| 18 to 34 Years | 0 (0.0%) | 9 (17.6%) |
| 35 to 64 Years | 21 (18.3%) | 1 (2.1%) |
| 65 to 74 Years | 5 (50.0%) | 37 (84.1%) |
| 75 Years and over | 2 (40.0%) | 0 (0.0%) |
Disability Class: Ambulatory Difficulty
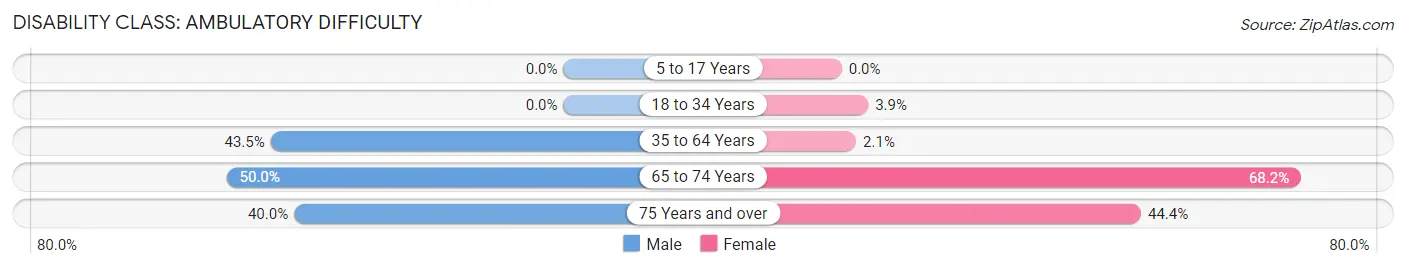
| Age Bracket | Male | Female |
| 5 to 17 Years | 0 (0.0%) | 0 (0.0%) |
| 18 to 34 Years | 0 (0.0%) | 2 (3.9%) |
| 35 to 64 Years | 50 (43.5%) | 1 (2.1%) |
| 65 to 74 Years | 5 (50.0%) | 30 (68.2%) |
| 75 Years and over | 2 (40.0%) | 4 (44.4%) |
Disability Class: Self-Care Difficulty
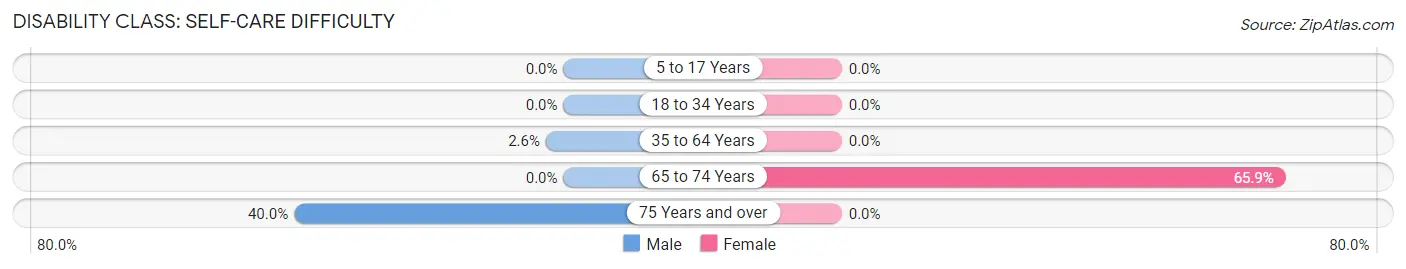
| Age Bracket | Male | Female |
| 5 to 17 Years | 0 (0.0%) | 0 (0.0%) |
| 18 to 34 Years | 0 (0.0%) | 0 (0.0%) |
| 35 to 64 Years | 3 (2.6%) | 0 (0.0%) |
| 65 to 74 Years | 0 (0.0%) | 29 (65.9%) |
| 75 Years and over | 2 (40.0%) | 0 (0.0%) |
Technology Access in Bremen
Computing Device Access in Bremen
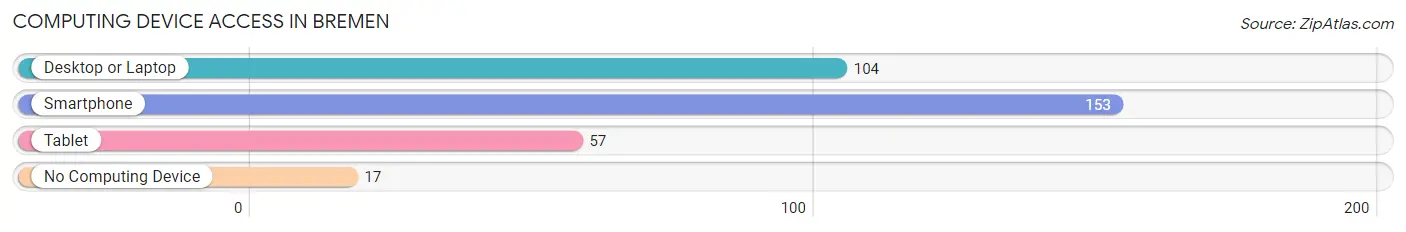
| Device Type | # Households | % Households |
| Desktop or Laptop | 104 | 57.5% |
| Smartphone | 153 | 84.5% |
| Tablet | 57 | 31.5% |
| No Computing Device | 17 | 9.4% |
| Total | 181 | 100.0% |
Internet Access in Bremen
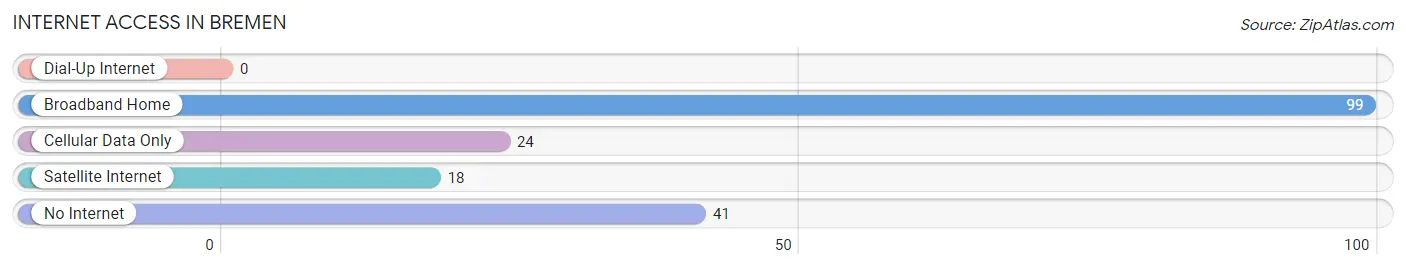
| Internet Type | # Households | % Households |
| Dial-Up Internet | 0 | 0.0% |
| Broadband Home | 99 | 54.7% |
| Cellular Data Only | 24 | 13.3% |
| Satellite Internet | 18 | 9.9% |
| No Internet | 41 | 22.7% |
| Total | 181 | 100.0% |
Bremen Summary
Bremen is a small town located in Muhlenberg County, Kentucky. It is situated on the banks of the Green River, and is part of the Western Coal Fields region of the state. The town was founded in 1820 and has a population of approximately 1,000 people.
Geography
Bremen is located in the Western Coal Fields region of Kentucky, and is situated on the banks of the Green River. The town is located in the northern part of Muhlenberg County, and is bordered by the towns of Central City, Greenville, and Drakesboro. The town is located at an elevation of 545 feet above sea level, and has a total area of 0.7 square miles.
Climate
Bremen has a humid subtropical climate, with hot summers and mild winters. The average annual temperature is around 62 degrees Fahrenheit, with an average high of around 86 degrees in the summer and an average low of around 40 degrees in the winter. The town receives an average of 48 inches of precipitation per year, with most of it falling in the spring and summer months.
Demographics
As of the 2010 census, Bremen had a population of 1,000 people. The racial makeup of the town was 97.2% White, 0.7% African American, 0.3% Native American, 0.2% Asian, 0.1% Pacific Islander, and 1.6% from other races. The median household income was $30,000, and the median family income was $35,000.
Economy
Bremen’s economy is largely based on agriculture and coal mining. The town is home to several small businesses, including a grocery store, a hardware store, and a few restaurants. The town is also home to a number of coal mines, which provide employment for many of the town’s residents.
History
Bremen was founded in 1820 by a group of settlers from Germany. The town was named after the city of Bremen in Germany, and was originally a farming community. In the late 19th century, the town began to develop a coal mining industry, which provided employment for many of the town’s residents. The town was also home to a number of churches, including the First Baptist Church, which was founded in 1845.
In the early 20th century, the town experienced a period of growth and prosperity, as the coal mining industry continued to expand. However, the Great Depression of the 1930s caused a decline in the town’s economy, and many of the town’s residents moved away in search of work. The town’s population began to decline, and by the 1950s, the town had a population of only 500 people.
In the late 20th century, the town began to experience a period of revitalization, as new businesses began to open and the town’s population began to grow. Today, Bremen is a small but vibrant community, with a population of around 1,000 people. The town is home to a number of small businesses, and is a popular destination for tourists who are interested in exploring the area’s history and culture.
Common Questions
What is Per Capita Income in Bremen?
Per Capita income in Bremen is $24,561.
What is the Median Family Income in Bremen?
Median Family Income in Bremen is $60,000.
What is the Median Household income in Bremen?
Median Household Income in Bremen is $42,650.
What is Inequality or Gini Index in Bremen?
Inequality or Gini Index in Bremen is 0.49.
What is the Total Population of Bremen?
Total Population of Bremen is 383.
What is the Total Male Population of Bremen?
Total Male Population of Bremen is 199.
What is the Total Female Population of Bremen?
Total Female Population of Bremen is 184.
What is the Ratio of Males per 100 Females in Bremen?
There are 108.15 Males per 100 Females in Bremen.
What is the Ratio of Females per 100 Males in Bremen?
There are 92.46 Females per 100 Males in Bremen.
What is the Median Population Age in Bremen?
Median Population Age in Bremen is 47.2 Years.
What is the Average Family Size in Bremen
Average Family Size in Bremen is 2.7 People.
What is the Average Household Size in Bremen
Average Household Size in Bremen is 2.1 People.
How Large is the Labor Force in Bremen?
There are 154 People in the Labor Forcein in Bremen.
What is the Percentage of People in the Labor Force in Bremen?
47.7% of People are in the Labor Force in Bremen.
What is the Unemployment Rate in Bremen?
Unemployment Rate in Bremen is 12.3%.