Zip Codes with the Highest Percentage of Population with a Degree in Psychology in Louisville, KY
RELATED REPORTS & OPTIONS
Psychology
Louisville
Compare Zip Codes
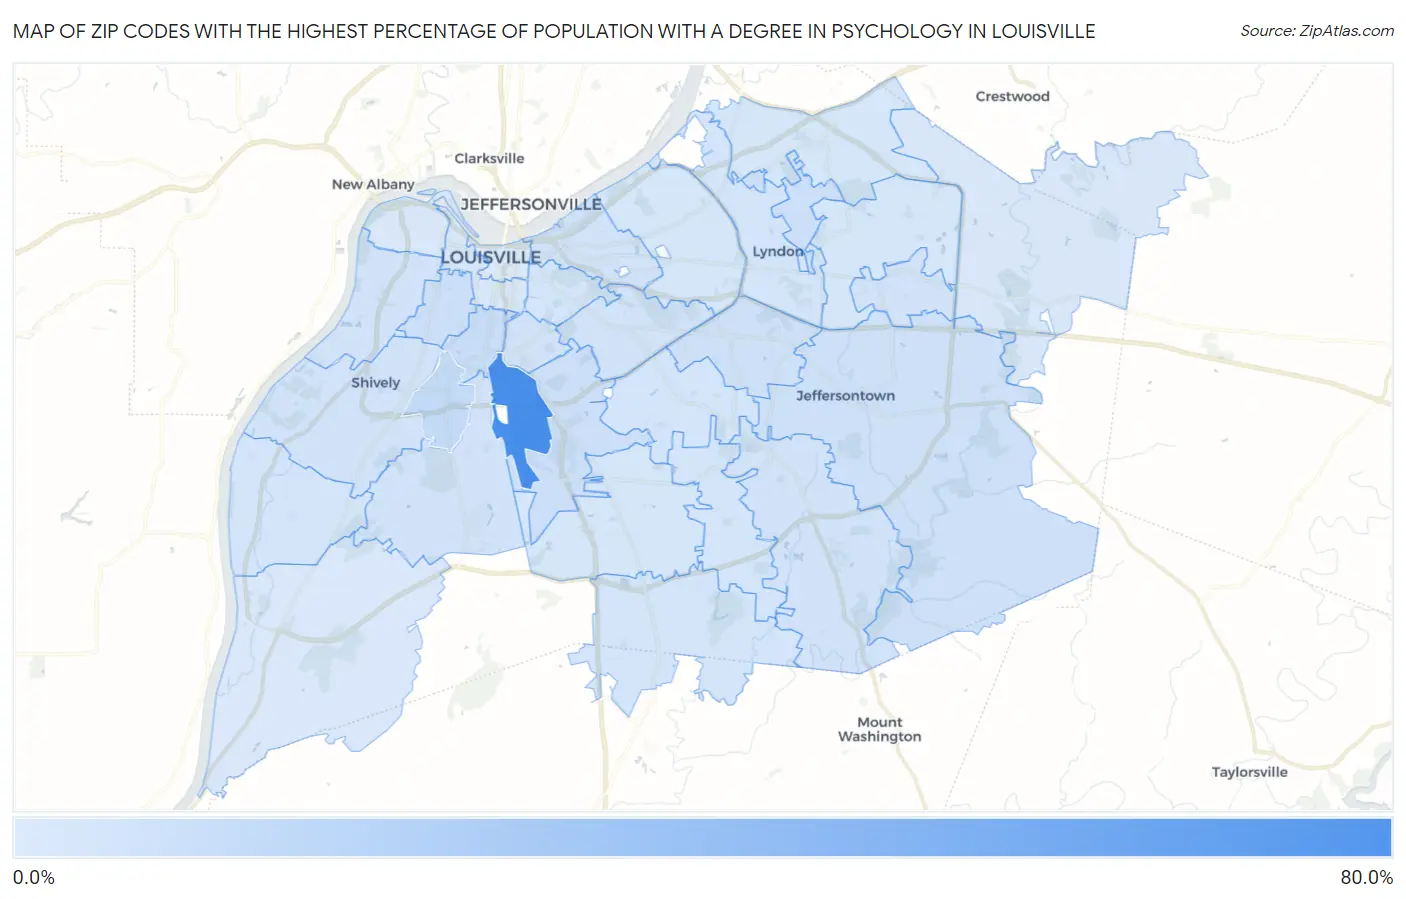
Map of Zip Codes with the Highest Percentage of Population with a Degree in Psychology in Louisville
2.4%
68.4%
Zip Codes with the Highest Percentage of Population with a Degree in Psychology in Louisville, KY
| Zip Code | % Graduates | vs State | vs National | |
| 1. | 40209 | 68.4% | 4.7%(+63.7)#7 | 5.1%(+63.4)#48 |
| 2. | 40215 | 11.7% | 4.7%(+7.00)#63 | 5.1%(+6.67)#1,817 |
| 3. | 40208 | 9.3% | 4.7%(+4.56)#86 | 5.1%(+4.23)#2,926 |
| 4. | 40242 | 8.3% | 4.7%(+3.58)#103 | 5.1%(+3.25)#3,812 |
| 5. | 40210 | 7.8% | 4.7%(+3.04)#111 | 5.1%(+2.71)#4,415 |
| 6. | 40213 | 7.7% | 4.7%(+3.00)#113 | 5.1%(+2.67)#4,461 |
| 7. | 40220 | 7.0% | 4.7%(+2.28)#129 | 5.1%(+1.95)#5,625 |
| 8. | 40299 | 6.9% | 4.7%(+2.19)#130 | 5.1%(+1.86)#5,797 |
| 9. | 40214 | 6.8% | 4.7%(+2.03)#135 | 5.1%(+1.70)#6,099 |
| 10. | 40291 | 6.7% | 4.7%(+1.97)#138 | 5.1%(+1.64)#6,236 |
| 11. | 40243 | 6.7% | 4.7%(+1.96)#140 | 5.1%(+1.63)#6,263 |
| 12. | 40211 | 6.6% | 4.7%(+1.87)#142 | 5.1%(+1.54)#6,470 |
| 13. | 40217 | 6.5% | 4.7%(+1.75)#145 | 5.1%(+1.42)#6,718 |
| 14. | 40216 | 6.4% | 4.7%(+1.69)#148 | 5.1%(+1.36)#6,869 |
| 15. | 40206 | 6.4% | 4.7%(+1.64)#150 | 5.1%(+1.31)#6,988 |
| 16. | 40205 | 6.3% | 4.7%(+1.60)#151 | 5.1%(+1.27)#7,072 |
| 17. | 40204 | 5.9% | 4.7%(+1.16)#167 | 5.1%(+0.826)#8,341 |
| 18. | 40258 | 5.7% | 4.7%(+1.03)#172 | 5.1%(+0.696)#8,741 |
| 19. | 40228 | 5.6% | 4.7%(+0.903)#173 | 5.1%(+0.573)#9,114 |
| 20. | 40218 | 5.6% | 4.7%(+0.843)#174 | 5.1%(+0.513)#9,299 |
| 21. | 40222 | 5.5% | 4.7%(+0.828)#177 | 5.1%(+0.498)#9,373 |
| 22. | 40229 | 5.4% | 4.7%(+0.719)#180 | 5.1%(+0.389)#9,717 |
| 23. | 40241 | 5.1% | 4.7%(+0.399)#193 | 5.1%(+0.069)#10,837 |
| 24. | 40219 | 4.7% | 4.7%(+0.016)#210 | 5.1%(-0.314)#12,173 |
| 25. | 40207 | 4.7% | 4.7%(-0.031)#212 | 5.1%(-0.361)#12,359 |
| 26. | 40223 | 4.5% | 4.7%(-0.186)#218 | 5.1%(-0.517)#12,976 |
| 27. | 40203 | 4.3% | 4.7%(-0.432)#238 | 5.1%(-0.763)#13,897 |
| 28. | 40212 | 4.1% | 4.7%(-0.587)#245 | 5.1%(-0.917)#14,454 |
| 29. | 40245 | 4.1% | 4.7%(-0.605)#246 | 5.1%(-0.935)#14,512 |
| 30. | 40272 | 2.9% | 4.7%(-1.78)#309 | 5.1%(-2.11)#18,420 |
| 31. | 40202 | 2.4% | 4.7%(-2.36)#338 | 5.1%(-2.69)#19,954 |
1
Common Questions
What are the Top 10 Zip Codes with the Highest Percentage of Population with a Degree in Psychology in Louisville, KY?
Top 10 Zip Codes with the Highest Percentage of Population with a Degree in Psychology in Louisville, KY are:
What zip code has the Highest Percentage of Population with a Degree in Psychology in Louisville, KY?
40209 has the Highest Percentage of Population with a Degree in Psychology in Louisville, KY with 68.4%.
What is the Percentage of Population with a Degree in Psychology in Louisville, KY?
Percentage of Population with a Degree in Psychology in Louisville is 5.9%.
What is the Percentage of Population with a Degree in Psychology in Kentucky?
Percentage of Population with a Degree in Psychology in Kentucky is 4.7%.
What is the Percentage of Population with a Degree in Psychology in the United States?
Percentage of Population with a Degree in Psychology in the United States is 5.1%.