Farmington, KY Map & Demographics
Farmington Map
Farmington Overview
$14,553
PER CAPITA INCOME
0.42
INEQUALITY / GINI INDEX
167
TOTAL POPULATION
51
MALE POPULATION
116
FEMALE POPULATION
43.97
MALES / 100 FEMALES
227.45
FEMALES / 100 MALES
52.6
MEDIAN AGE
3.3
AVG FAMILY SIZE
2.1
AVG HOUSEHOLD SIZE
47
LABOR FORCE [ PEOPLE ]
39.2%
PERCENT IN LABOR FORCE
Farmington Zip Codes
Farmington Area Codes
Income in Farmington
Income Overview in Farmington
| Characteristic | Number | Measure |
| Per Capita Income | 167 | $14,553 |
| Median Family Income | 37 | $0 |
| Mean Family Income | 37 | $38,081 |
| Median Household Income | 78 | $0 |
| Mean Household Income | 78 | $30,406 |
| Income Deficit | 37 | $0 |
| Wage / Income Gap (%) | 167 | 0.00% |
| Wage / Income Gap ($) | 167 | 100.00¢ per $1 |
| Gini / Inequality Index | 167 | 0.42 |
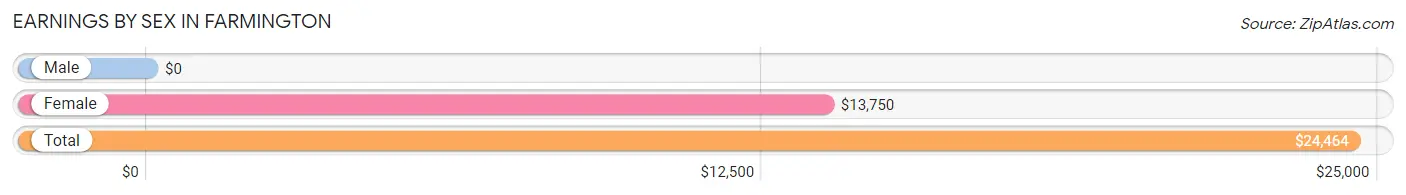
Earnings by Sex in Farmington
| Sex | Number | Average Earnings |
| Male | 20 (35.1%) | $0 |
| Female | 37 (64.9%) | $13,750 |
| Total | 57 (100.0%) | $24,464 |
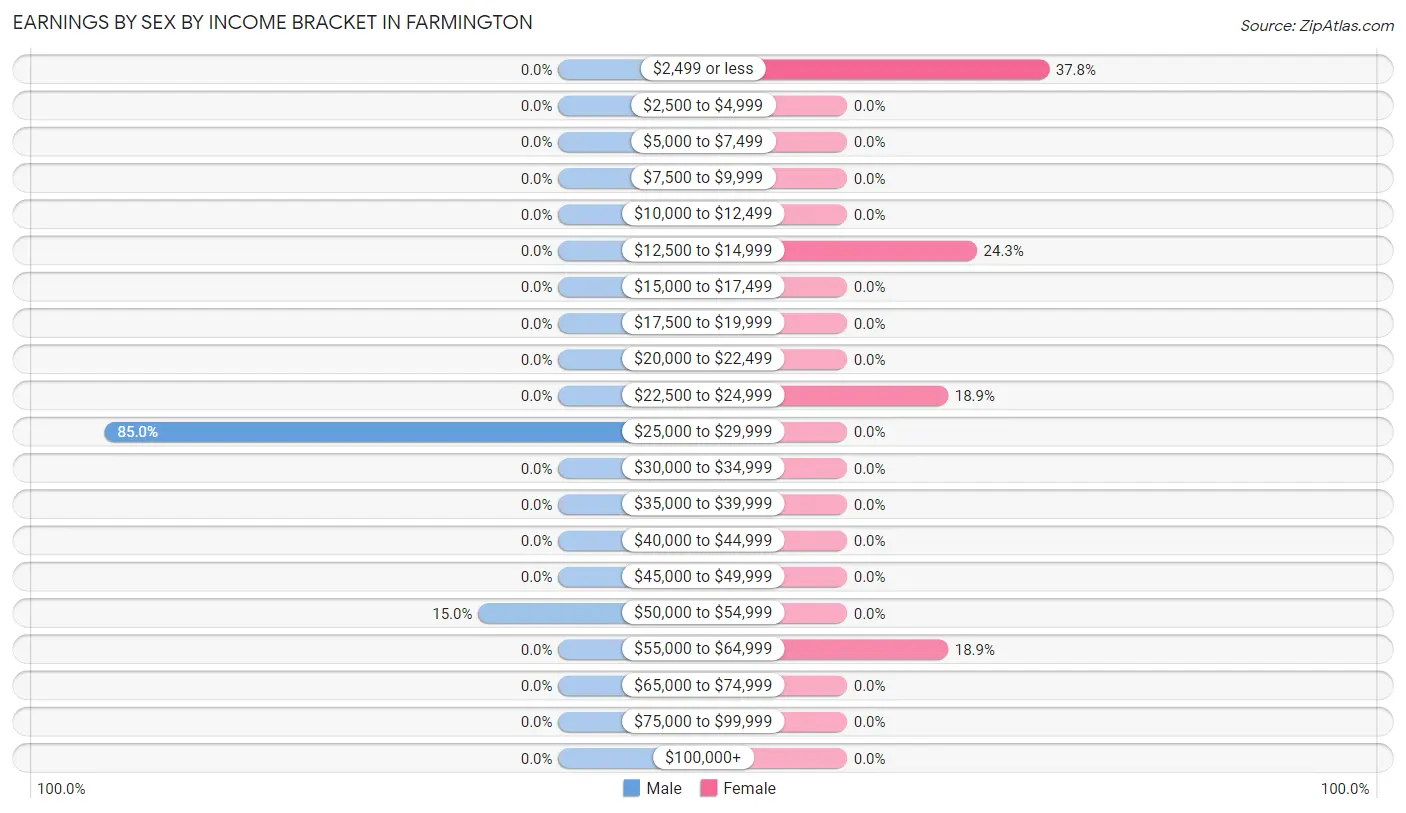
Earnings by Sex by Income Bracket in Farmington
The most common earnings brackets in Farmington are $25,000 to $29,999 for men (17 | 85.0%) and $2,499 or less for women (14 | 37.8%).
| Income | Male | Female |
| $2,499 or less | 0 (0.0%) | 14 (37.8%) |
| $2,500 to $4,999 | 0 (0.0%) | 0 (0.0%) |
| $5,000 to $7,499 | 0 (0.0%) | 0 (0.0%) |
| $7,500 to $9,999 | 0 (0.0%) | 0 (0.0%) |
| $10,000 to $12,499 | 0 (0.0%) | 0 (0.0%) |
| $12,500 to $14,999 | 0 (0.0%) | 9 (24.3%) |
| $15,000 to $17,499 | 0 (0.0%) | 0 (0.0%) |
| $17,500 to $19,999 | 0 (0.0%) | 0 (0.0%) |
| $20,000 to $22,499 | 0 (0.0%) | 0 (0.0%) |
| $22,500 to $24,999 | 0 (0.0%) | 7 (18.9%) |
| $25,000 to $29,999 | 17 (85.0%) | 0 (0.0%) |
| $30,000 to $34,999 | 0 (0.0%) | 0 (0.0%) |
| $35,000 to $39,999 | 0 (0.0%) | 0 (0.0%) |
| $40,000 to $44,999 | 0 (0.0%) | 0 (0.0%) |
| $45,000 to $49,999 | 0 (0.0%) | 0 (0.0%) |
| $50,000 to $54,999 | 3 (15.0%) | 0 (0.0%) |
| $55,000 to $64,999 | 0 (0.0%) | 7 (18.9%) |
| $65,000 to $74,999 | 0 (0.0%) | 0 (0.0%) |
| $75,000 to $99,999 | 0 (0.0%) | 0 (0.0%) |
| $100,000+ | 0 (0.0%) | 0 (0.0%) |
| Total | 20 (100.0%) | 37 (100.0%) |
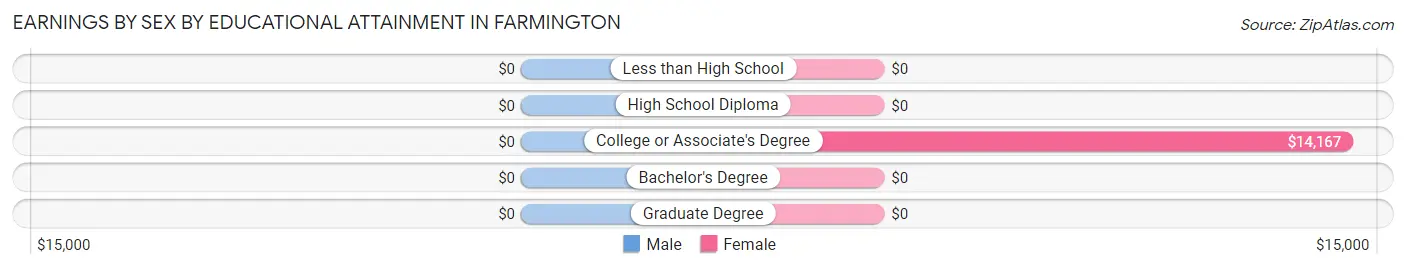
Earnings by Sex by Educational Attainment in Farmington
| Educational Attainment | Male Income | Female Income |
| Less than High School | - | - |
| High School Diploma | - | - |
| College or Associate's Degree | - | - |
| Bachelor's Degree | - | - |
| Graduate Degree | - | - |
| Total | - | - |
Family Income in Farmington
Family Income Brackets in Farmington
According to the Farmington family income data, there are 15 families falling into the $50,000 to $74,999 income range, which is the most common income bracket and makes up 40.5% of all families.
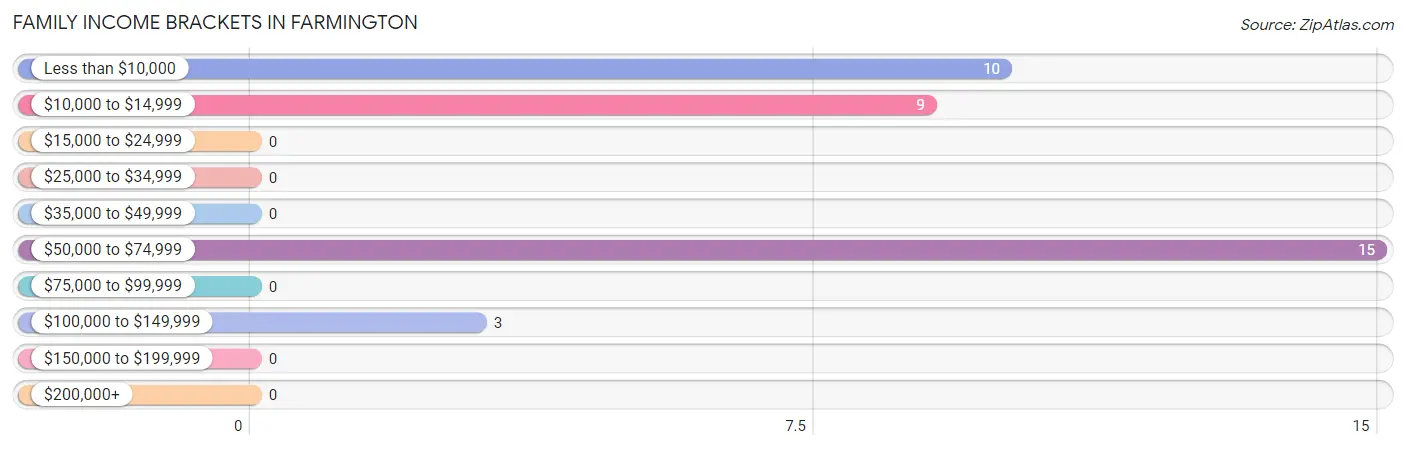
| Income Bracket | # Families | % Families |
| Less than $10,000 | 10 | 27.0% |
| $10,000 to $14,999 | 9 | 24.3% |
| $15,000 to $24,999 | 0 | 0.0% |
| $25,000 to $34,999 | 0 | 0.0% |
| $35,000 to $49,999 | 0 | 0.0% |
| $50,000 to $74,999 | 15 | 40.5% |
| $75,000 to $99,999 | 0 | 0.0% |
| $100,000 to $149,999 | 3 | 8.1% |
| $150,000 to $199,999 | 0 | 0.0% |
| $200,000+ | 0 | 0.0% |
Family Income by Famaliy Size in Farmington
2-person families (27 | 73.0%) account for the highest median family income in Farmington with $58,906 per family, while 2-person families (27 | 73.0%) have the highest median income of $29,453 per family member.
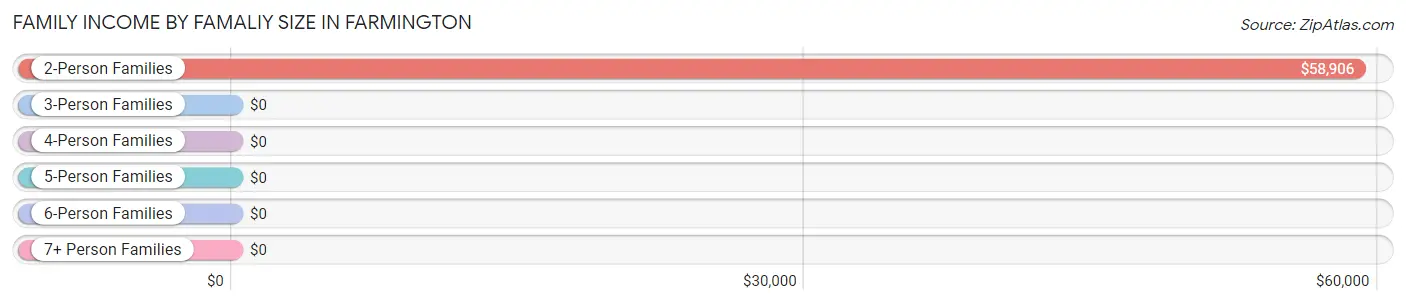
| Income Bracket | # Families | Median Income |
| 2-Person Families | 27 (73.0%) | $58,906 |
| 3-Person Families | 10 (27.0%) | $0 |
| 4-Person Families | 0 (0.0%) | $0 |
| 5-Person Families | 0 (0.0%) | $0 |
| 6-Person Families | 0 (0.0%) | $0 |
| 7+ Person Families | 0 (0.0%) | $0 |
| Total | 37 (100.0%) | $0 |
Family Income by Number of Earners in Farmington
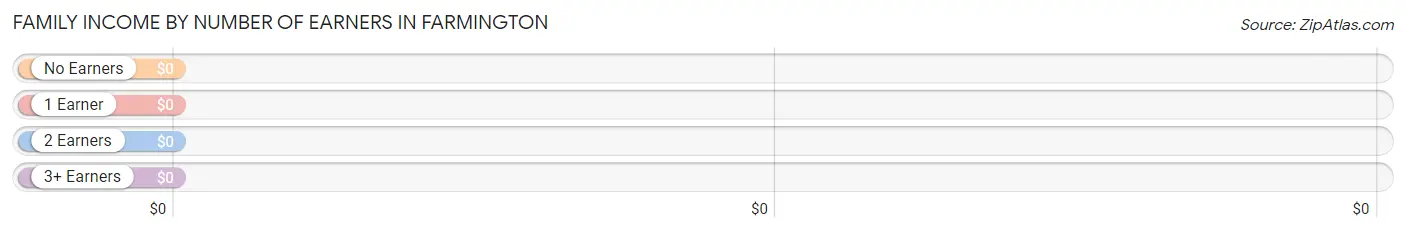
| Number of Earners | # Families | Median Income |
| No Earners | 18 (48.6%) | $0 |
| 1 Earner | 9 (24.3%) | $0 |
| 2 Earners | 10 (27.0%) | $0 |
| 3+ Earners | 0 (0.0%) | $0 |
| Total | 37 (100.0%) | $0 |
Household Income in Farmington
Household Income Brackets in Farmington
With 33 households falling in the category, the $10,000 to $14,999 income range is the most frequent in Farmington, accounting for 42.3% of all households.
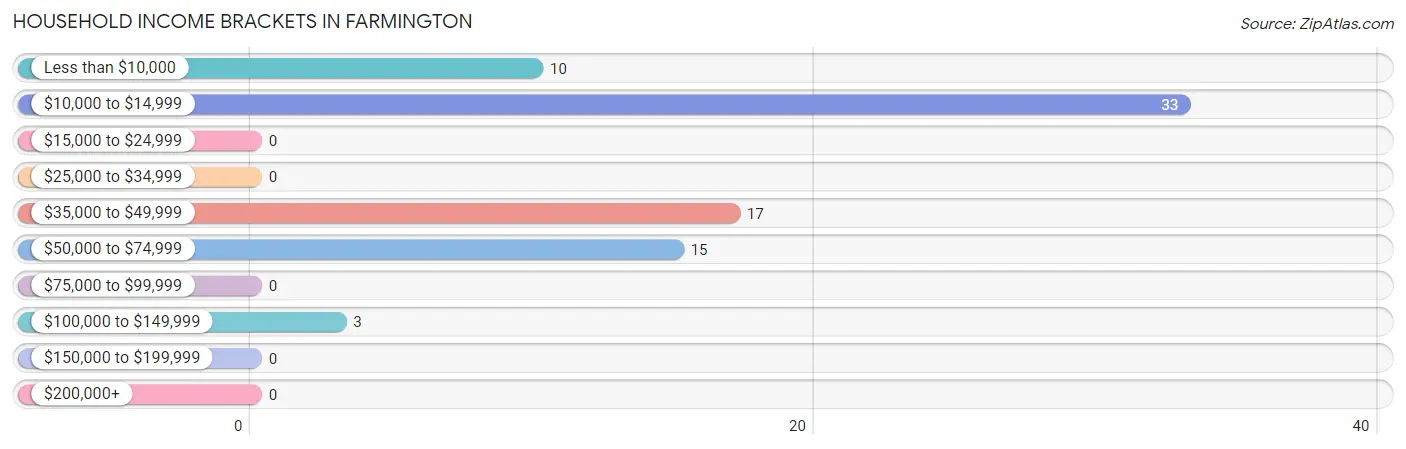
| Income Bracket | # Households | % Households |
| Less than $10,000 | 10 | 12.8% |
| $10,000 to $14,999 | 33 | 42.3% |
| $15,000 to $24,999 | 0 | 0.0% |
| $25,000 to $34,999 | 0 | 0.0% |
| $35,000 to $49,999 | 17 | 21.8% |
| $50,000 to $74,999 | 15 | 19.2% |
| $75,000 to $99,999 | 0 | 0.0% |
| $100,000 to $149,999 | 3 | 3.8% |
| $150,000 to $199,999 | 0 | 0.0% |
| $200,000+ | 0 | 0.0% |
Household Income by Householder Age in Farmington
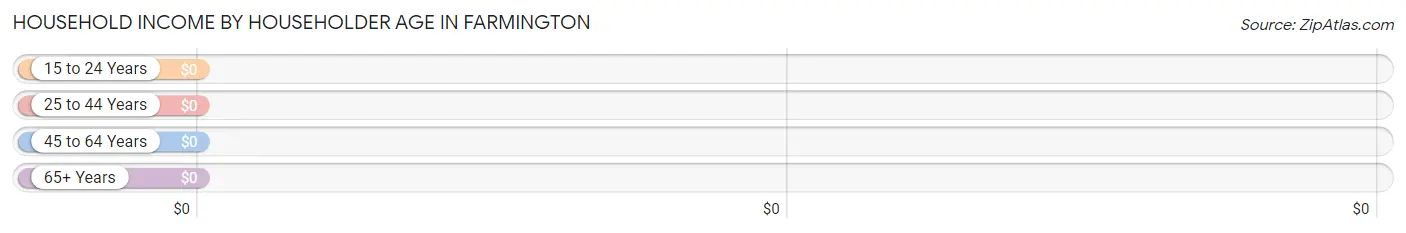
| Income Bracket | # Households | Median Income |
| 15 to 24 Years | 0 (0.0%) | $0 |
| 25 to 44 Years | 9 (11.5%) | $0 |
| 45 to 64 Years | 27 (34.6%) | $0 |
| 65+ Years | 42 (53.8%) | $0 |
| Total | 78 (100.0%) | $0 |
Poverty in Farmington
Income Below Poverty by Sex and Age in Farmington
With 45.1% poverty level for males and 72.4% for females among the residents of Farmington, 35 to 44 year old males and under 5 year old females are the most vulnerable to poverty, with 13 males (100.0%) and 13 females (100.0%) in their respective age groups living below the poverty level.
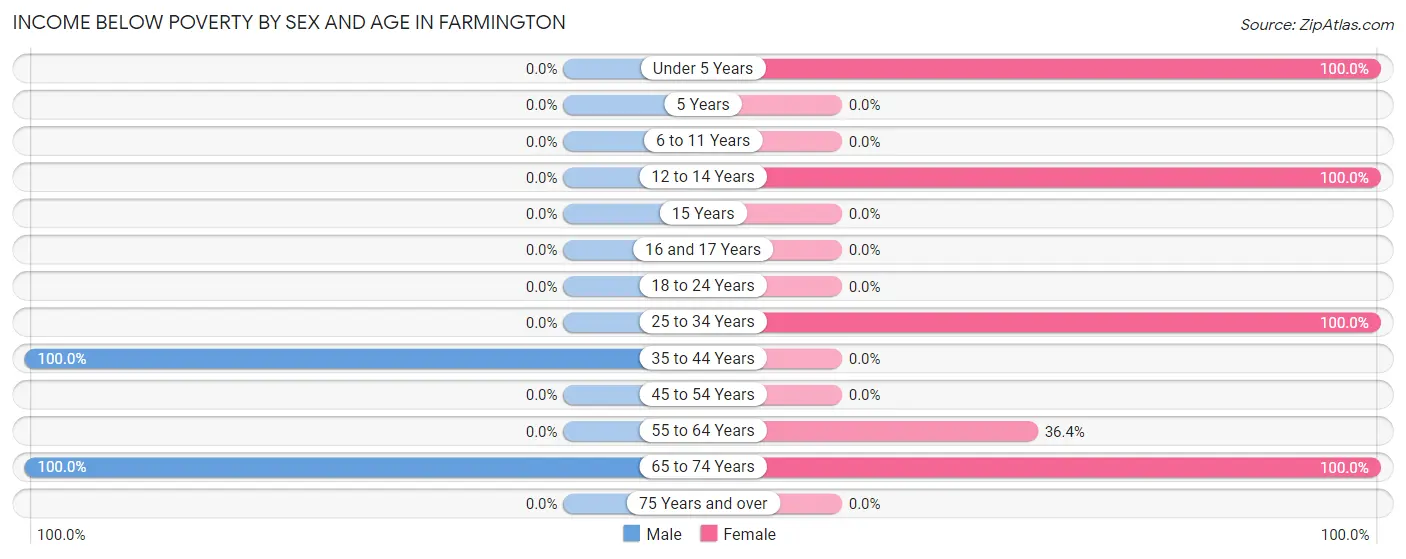
| Age Bracket | Male | Female |
| Under 5 Years | 0 (0.0%) | 13 (100.0%) |
| 5 Years | 0 (0.0%) | 0 (0.0%) |
| 6 to 11 Years | 0 (0.0%) | 0 (0.0%) |
| 12 to 14 Years | 0 (0.0%) | 34 (100.0%) |
| 15 Years | 0 (0.0%) | 0 (0.0%) |
| 16 and 17 Years | 0 (0.0%) | 0 (0.0%) |
| 18 to 24 Years | 0 (0.0%) | 0 (0.0%) |
| 25 to 34 Years | 0 (0.0%) | 9 (100.0%) |
| 35 to 44 Years | 13 (100.0%) | 0 (0.0%) |
| 45 to 54 Years | 0 (0.0%) | 0 (0.0%) |
| 55 to 64 Years | 0 (0.0%) | 4 (36.4%) |
| 65 to 74 Years | 10 (100.0%) | 24 (100.0%) |
| 75 Years and over | 0 (0.0%) | 0 (0.0%) |
| Total | 23 (45.1%) | 84 (72.4%) |
Income Above Poverty by Sex and Age in Farmington
According to the poverty statistics in Farmington, males aged 55 to 64 years and females aged 16 and 17 years are the age groups that are most secure financially, with 100.0% of males and 100.0% of females in these age groups living above the poverty line.
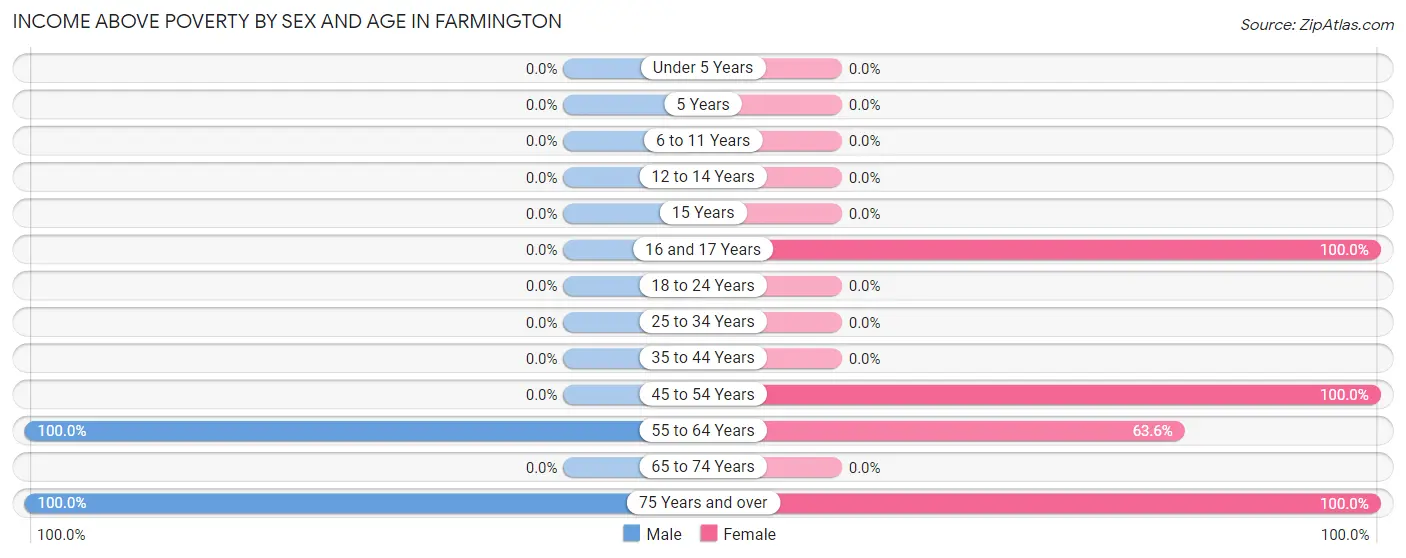
| Age Bracket | Male | Female |
| Under 5 Years | 0 (0.0%) | 0 (0.0%) |
| 5 Years | 0 (0.0%) | 0 (0.0%) |
| 6 to 11 Years | 0 (0.0%) | 0 (0.0%) |
| 12 to 14 Years | 0 (0.0%) | 0 (0.0%) |
| 15 Years | 0 (0.0%) | 0 (0.0%) |
| 16 and 17 Years | 0 (0.0%) | 10 (100.0%) |
| 18 to 24 Years | 0 (0.0%) | 0 (0.0%) |
| 25 to 34 Years | 0 (0.0%) | 0 (0.0%) |
| 35 to 44 Years | 0 (0.0%) | 0 (0.0%) |
| 45 to 54 Years | 0 (0.0%) | 7 (100.0%) |
| 55 to 64 Years | 20 (100.0%) | 7 (63.6%) |
| 65 to 74 Years | 0 (0.0%) | 0 (0.0%) |
| 75 Years and over | 8 (100.0%) | 8 (100.0%) |
| Total | 28 (54.9%) | 32 (27.6%) |
Income Below Poverty Among Married-Couple Families in Farmington
| Children | Above Poverty | Below Poverty |
| No Children | 11 (100.0%) | 0 (0.0%) |
| 1 or 2 Children | 0 (0.0%) | 0 (0.0%) |
| 3 or 4 Children | 0 (0.0%) | 0 (0.0%) |
| 5 or more Children | 0 (0.0%) | 0 (0.0%) |
| Total | 11 (100.0%) | 0 (0.0%) |
Income Below Poverty Among Single-Parent Households in Farmington
According to the poverty data in Farmington, 100.0% or 10 single-father households and 56.2% or 9 single-mother households are living below the poverty line. Among single-father households, those with 1 or 2 children have the highest poverty rate, with 10 households (100.0%) experiencing poverty. Likewise, among single-mother households, those with 1 or 2 children have the highest poverty rate, with 9 households (56.2%) falling below the poverty line.
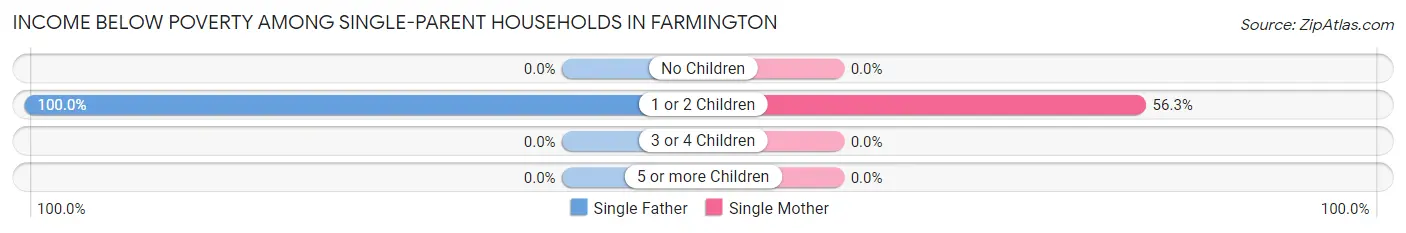
| Children | Single Father | Single Mother |
| No Children | 0 (0.0%) | 0 (0.0%) |
| 1 or 2 Children | 10 (100.0%) | 9 (56.2%) |
| 3 or 4 Children | 0 (0.0%) | 0 (0.0%) |
| 5 or more Children | 0 (0.0%) | 0 (0.0%) |
| Total | 10 (100.0%) | 9 (56.2%) |
Income Below Poverty Among Married-Couple vs Single-Parent Households in Farmington
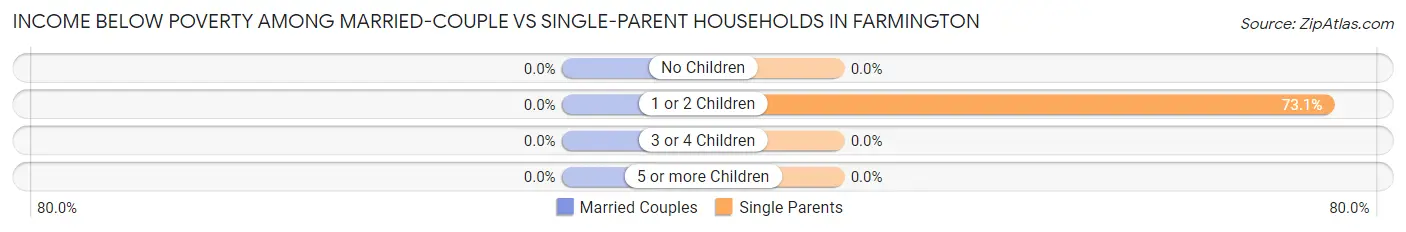
| Children | Married-Couple Families | Single-Parent Households |
| No Children | 0 (0.0%) | 0 (0.0%) |
| 1 or 2 Children | 0 (0.0%) | 19 (73.1%) |
| 3 or 4 Children | 0 (0.0%) | 0 (0.0%) |
| 5 or more Children | 0 (0.0%) | 0 (0.0%) |
| Total | 0 (0.0%) | 19 (73.1%) |
Race in Farmington
The most populous races in Farmington are White / Caucasian (83 | 49.7%), Two or more Races (81 | 48.5%), and Native / Alaskan (3 | 1.8%).
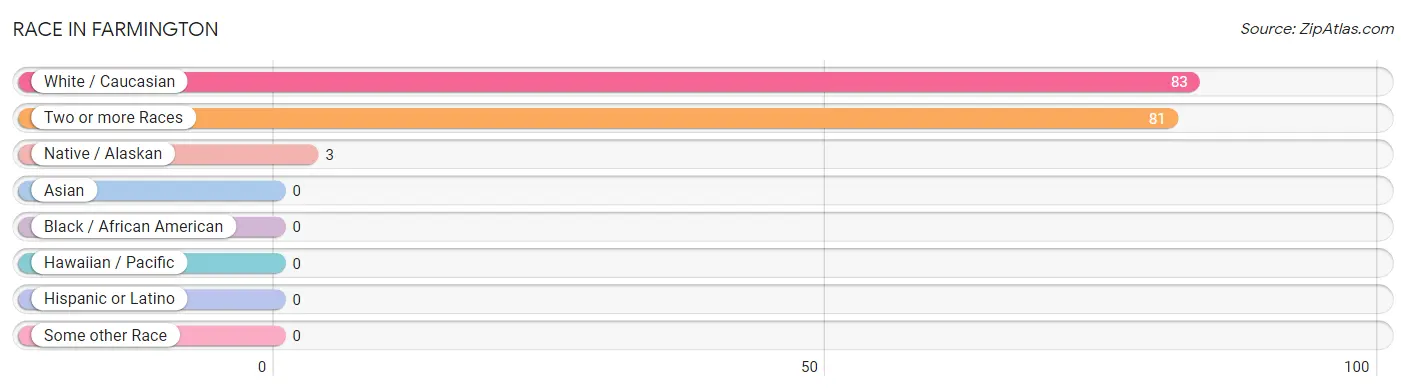
| Race | # Population | % Population |
| Asian | 0 | 0.0% |
| Black / African American | 0 | 0.0% |
| Hawaiian / Pacific | 0 | 0.0% |
| Hispanic or Latino | 0 | 0.0% |
| Native / Alaskan | 3 | 1.8% |
| White / Caucasian | 83 | 49.7% |
| Two or more Races | 81 | 48.5% |
| Some other Race | 0 | 0.0% |
| Total | 167 | 100.0% |
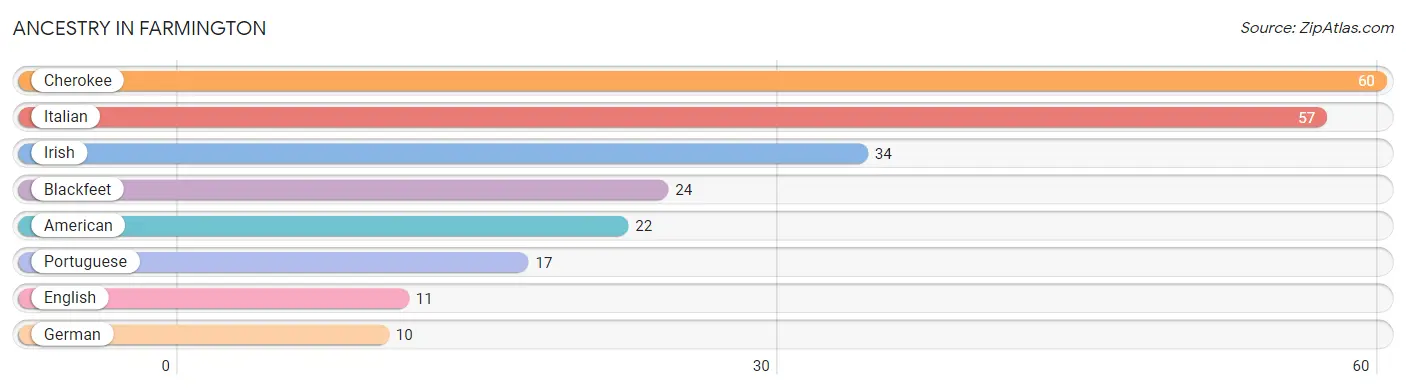
Ancestry in Farmington
The most populous ancestries reported in Farmington are Cherokee (60 | 35.9%), Italian (57 | 34.1%), Irish (34 | 20.4%), Blackfeet (24 | 14.4%), and American (22 | 13.2%), together accounting for 118.0% of all Farmington residents.
| Ancestry | # Population | % Population |
| American | 22 | 13.2% |
| Blackfeet | 24 | 14.4% |
| Cherokee | 60 | 35.9% |
| English | 11 | 6.6% |
| German | 10 | 6.0% |
| Irish | 34 | 20.4% |
| Italian | 57 | 34.1% |
| Portuguese | 17 | 10.2% | View All 8 Rows |
Immigrants in Farmington

| Immigration Origin | # Population | % Population | View All 0 Rows |
Sex and Age in Farmington
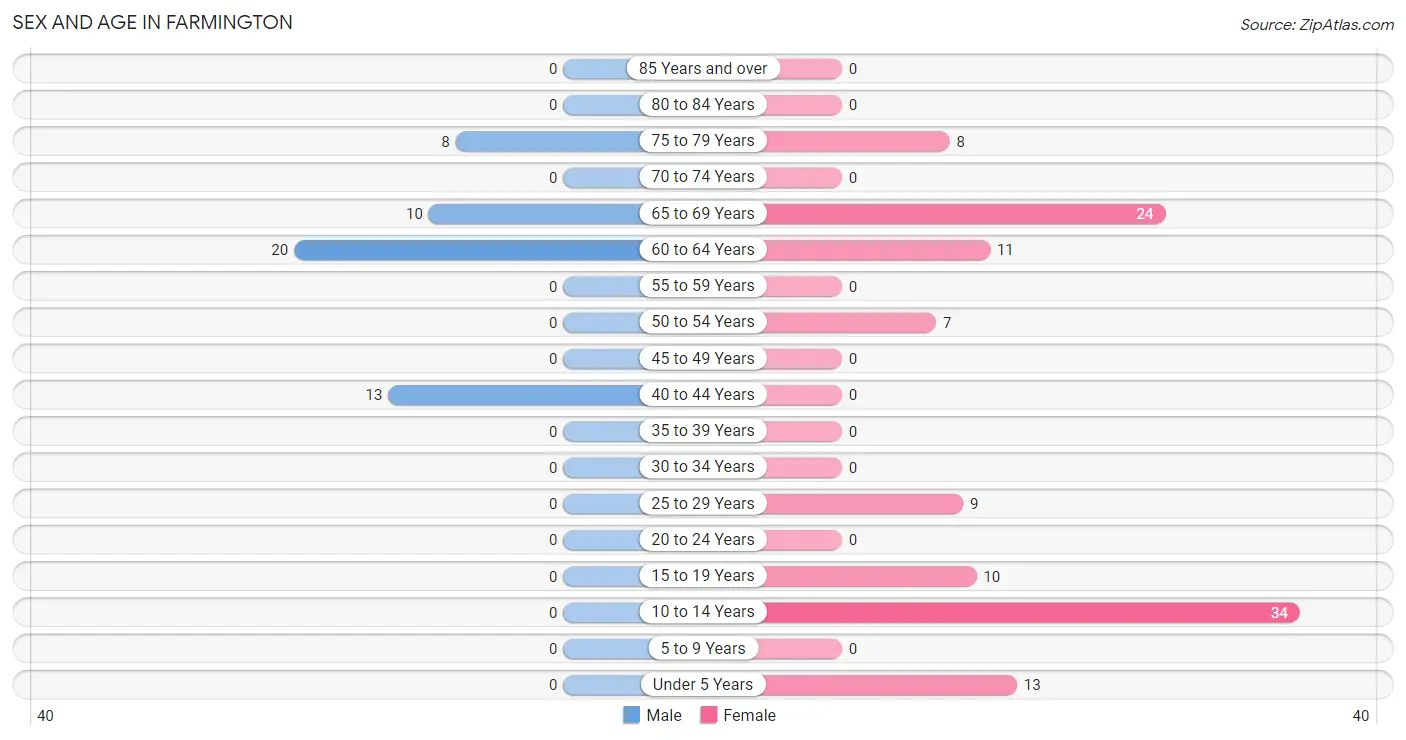
Sex and Age in Farmington
The most populous age groups in Farmington are 60 to 64 Years (20 | 39.2%) for men and 10 to 14 Years (34 | 29.3%) for women.
| Age Bracket | Male | Female |
| Under 5 Years | 0 (0.0%) | 13 (11.2%) |
| 5 to 9 Years | 0 (0.0%) | 0 (0.0%) |
| 10 to 14 Years | 0 (0.0%) | 34 (29.3%) |
| 15 to 19 Years | 0 (0.0%) | 10 (8.6%) |
| 20 to 24 Years | 0 (0.0%) | 0 (0.0%) |
| 25 to 29 Years | 0 (0.0%) | 9 (7.8%) |
| 30 to 34 Years | 0 (0.0%) | 0 (0.0%) |
| 35 to 39 Years | 0 (0.0%) | 0 (0.0%) |
| 40 to 44 Years | 13 (25.5%) | 0 (0.0%) |
| 45 to 49 Years | 0 (0.0%) | 0 (0.0%) |
| 50 to 54 Years | 0 (0.0%) | 7 (6.0%) |
| 55 to 59 Years | 0 (0.0%) | 0 (0.0%) |
| 60 to 64 Years | 20 (39.2%) | 11 (9.5%) |
| 65 to 69 Years | 10 (19.6%) | 24 (20.7%) |
| 70 to 74 Years | 0 (0.0%) | 0 (0.0%) |
| 75 to 79 Years | 8 (15.7%) | 8 (6.9%) |
| 80 to 84 Years | 0 (0.0%) | 0 (0.0%) |
| 85 Years and over | 0 (0.0%) | 0 (0.0%) |
| Total | 51 (100.0%) | 116 (100.0%) |
Families and Households in Farmington
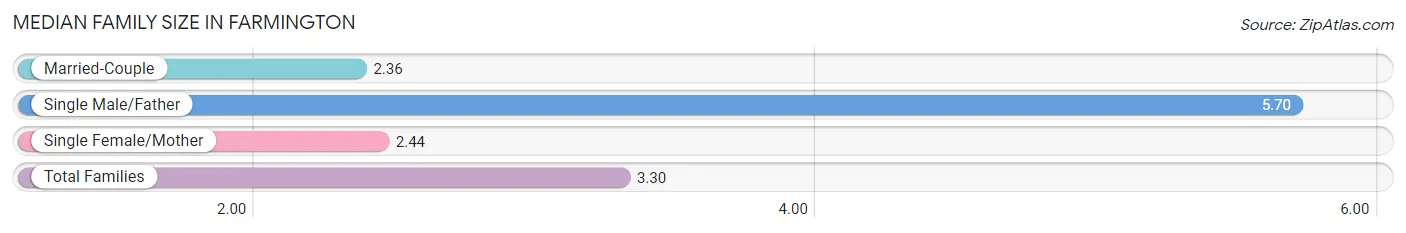
Median Family Size in Farmington
The median family size in Farmington is 3.30 persons per family, with single male/father families (10 | 27.0%) accounting for the largest median family size of 5.7 persons per family. On the other hand, married-couple families (11 | 29.7%) represent the smallest median family size with 2.36 persons per family.
| Family Type | # Families | Family Size |
| Married-Couple | 11 (29.7%) | 2.36 |
| Single Male/Father | 10 (27.0%) | 5.70 |
| Single Female/Mother | 16 (43.2%) | 2.44 |
| Total Families | 37 (100.0%) | 3.30 |
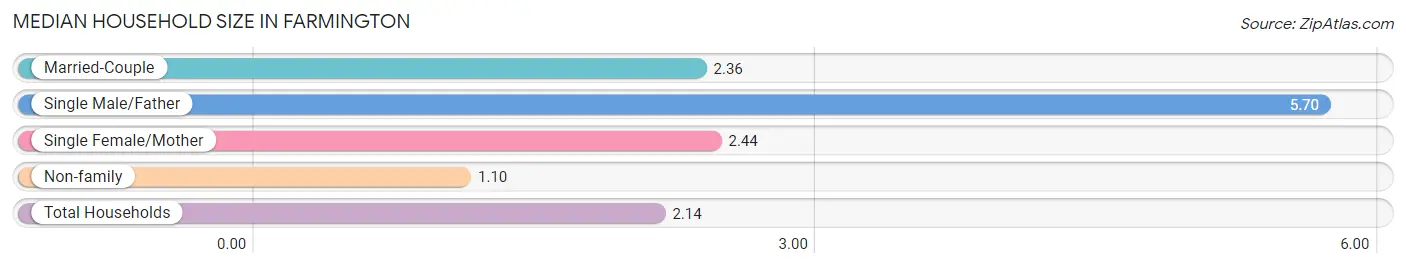
Median Household Size in Farmington
The median household size in Farmington is 2.14 persons per household, with single male/father households (10 | 12.8%) accounting for the largest median household size of 5.7 persons per household. non-family households (41 | 52.6%) represent the smallest median household size with 1.10 persons per household.
| Household Type | # Households | Household Size |
| Married-Couple | 11 (14.1%) | 2.36 |
| Single Male/Father | 10 (12.8%) | 5.70 |
| Single Female/Mother | 16 (20.5%) | 2.44 |
| Non-family | 41 (52.6%) | 1.10 |
| Total Households | 78 (100.0%) | 2.14 |
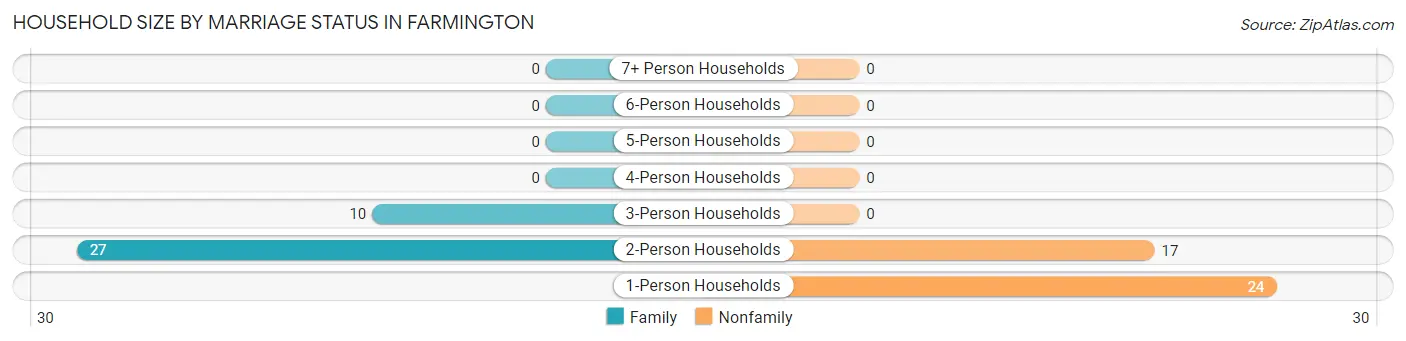
Household Size by Marriage Status in Farmington
Out of a total of 78 households in Farmington, 37 (47.4%) are family households, while 41 (52.6%) are nonfamily households. The most numerous type of family households are 2-person households, comprising 27, and the most common type of nonfamily households are 1-person households, comprising 24.
| Household Size | Family Households | Nonfamily Households |
| 1-Person Households | - | 24 (30.8%) |
| 2-Person Households | 27 (34.6%) | 17 (21.8%) |
| 3-Person Households | 10 (12.8%) | 0 (0.0%) |
| 4-Person Households | 0 (0.0%) | 0 (0.0%) |
| 5-Person Households | 0 (0.0%) | 0 (0.0%) |
| 6-Person Households | 0 (0.0%) | 0 (0.0%) |
| 7+ Person Households | 0 (0.0%) | 0 (0.0%) |
| Total | 37 (47.4%) | 41 (52.6%) |
Female Fertility in Farmington
Fertility by Age in Farmington
| Age Bracket | Women with Births | Births / 1,000 Women |
| 15 to 19 years | 0 (0.0%) | 0.0 |
| 20 to 34 years | 0 (0.0%) | 0.0 |
| 35 to 50 years | 0 (0.0%) | 0.0 |
| Total | 0 (0.0%) | 0.0 |
Fertility by Age by Marriage Status in Farmington
| Age Bracket | Married | Unmarried |
| 15 to 19 years | 0 (0.0%) | 0 (0.0%) |
| 20 to 34 years | 0 (0.0%) | 0 (0.0%) |
| 35 to 50 years | 0 (0.0%) | 0 (0.0%) |
| Total | 0 (0.0%) | 0 (0.0%) |
Fertility by Education in Farmington
| Educational Attainment | Women with Births | Births / 1,000 Women |
| Less than High School | 0 (0.0%) | 0.0 |
| High School Diploma | 0 (0.0%) | 0.0 |
| College or Associate's Degree | 0 (0.0%) | 0.0 |
| Bachelor's Degree | 0 (0.0%) | 0.0 |
| Graduate Degree | 0 (0.0%) | 0.0 |
| Total | 0 (0.0%) | 0.0 |
Fertility by Education by Marriage Status in Farmington
| Educational Attainment | Married | Unmarried |
| Less than High School | 0 (0.0%) | 0 (0.0%) |
| High School Diploma | 0 (0.0%) | 0 (0.0%) |
| College or Associate's Degree | 0 (0.0%) | 0 (0.0%) |
| Bachelor's Degree | 0 (0.0%) | 0 (0.0%) |
| Graduate Degree | 0 (0.0%) | 0 (0.0%) |
| Total | 0 (0.0%) | 0 (0.0%) |
Employment Characteristics in Farmington
Employment by Class of Employer in Farmington
Among the 47 employed individuals in Farmington, , and private company employees (47 | 100.0%) make up the most common classes of employment.
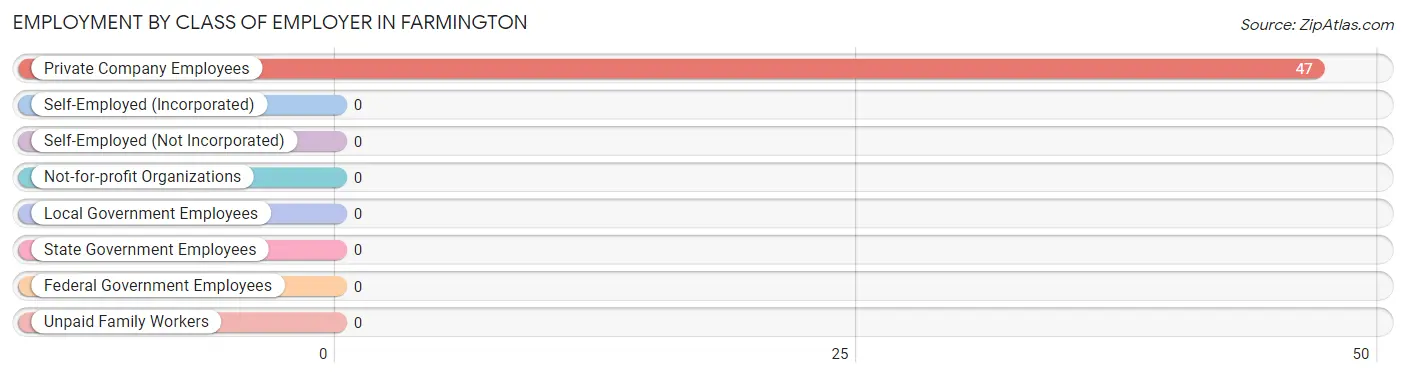
| Employer Class | # Employees | % Employees |
| Private Company Employees | 47 | 100.0% |
| Self-Employed (Incorporated) | 0 | 0.0% |
| Self-Employed (Not Incorporated) | 0 | 0.0% |
| Not-for-profit Organizations | 0 | 0.0% |
| Local Government Employees | 0 | 0.0% |
| State Government Employees | 0 | 0.0% |
| Federal Government Employees | 0 | 0.0% |
| Unpaid Family Workers | 0 | 0.0% |
| Total | 47 | 100.0% |
Employment Status by Age in Farmington
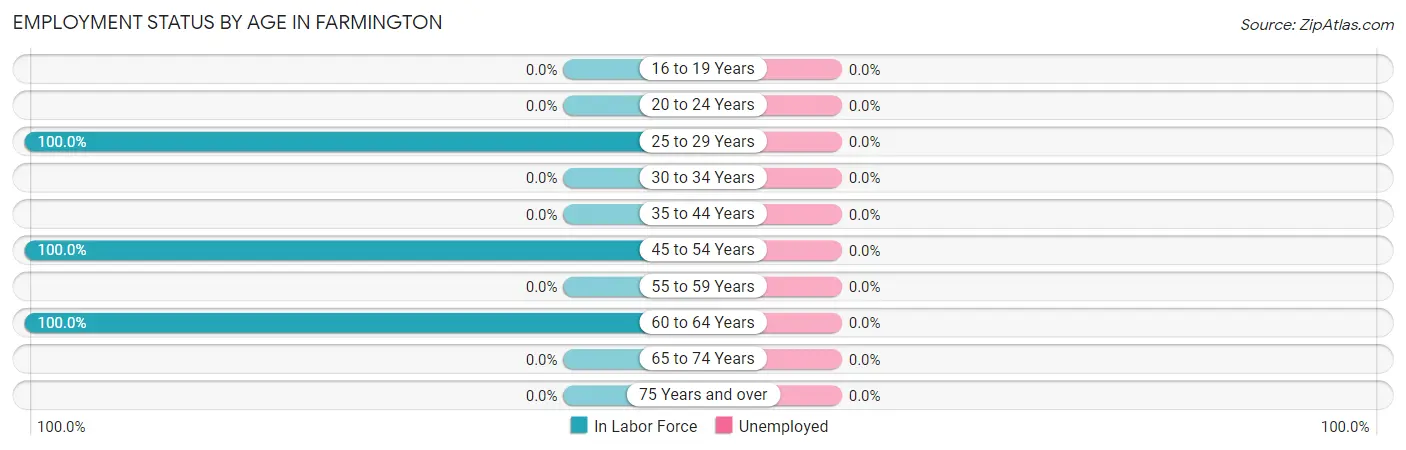
| Age Bracket | In Labor Force | Unemployed |
| 16 to 19 Years | 0 (0.0%) | 0 (0.0%) |
| 20 to 24 Years | 0 (0.0%) | 0 (0.0%) |
| 25 to 29 Years | 9 (100.0%) | 0 (0.0%) |
| 30 to 34 Years | 0 (0.0%) | 0 (0.0%) |
| 35 to 44 Years | 0 (0.0%) | 0 (0.0%) |
| 45 to 54 Years | 7 (100.0%) | 0 (0.0%) |
| 55 to 59 Years | 0 (0.0%) | 0 (0.0%) |
| 60 to 64 Years | 31 (100.0%) | 0 (0.0%) |
| 65 to 74 Years | 0 (0.0%) | 0 (0.0%) |
| 75 Years and over | 0 (0.0%) | 0 (0.0%) |
| Total | 47 (39.2%) | 0 (0.0%) |
Employment Status by Educational Attainment in Farmington
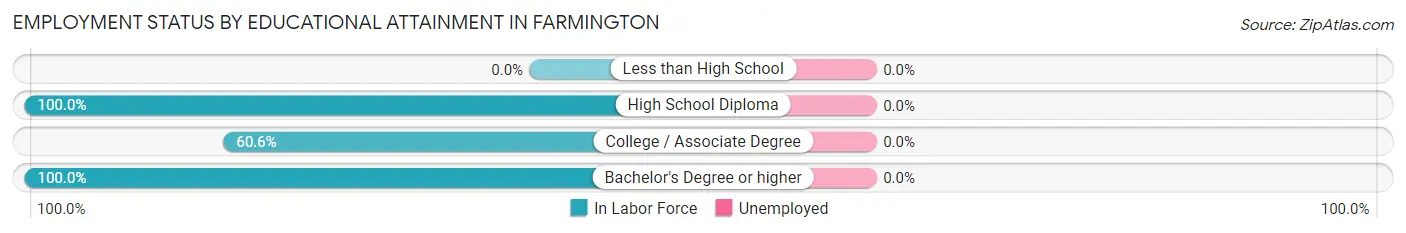
| Educational Attainment | In Labor Force | Unemployed |
| Less than High School | 0 (0.0%) | 0 (0.0%) |
| High School Diploma | 20 (100.0%) | 0 (0.0%) |
| College / Associate Degree | 20 (60.6%) | 0 (0.0%) |
| Bachelor's Degree or higher | 7 (100.0%) | 0 (0.0%) |
| Total | 47 (78.3%) | 0 (0.0%) |
Employment Occupations by Sex in Farmington
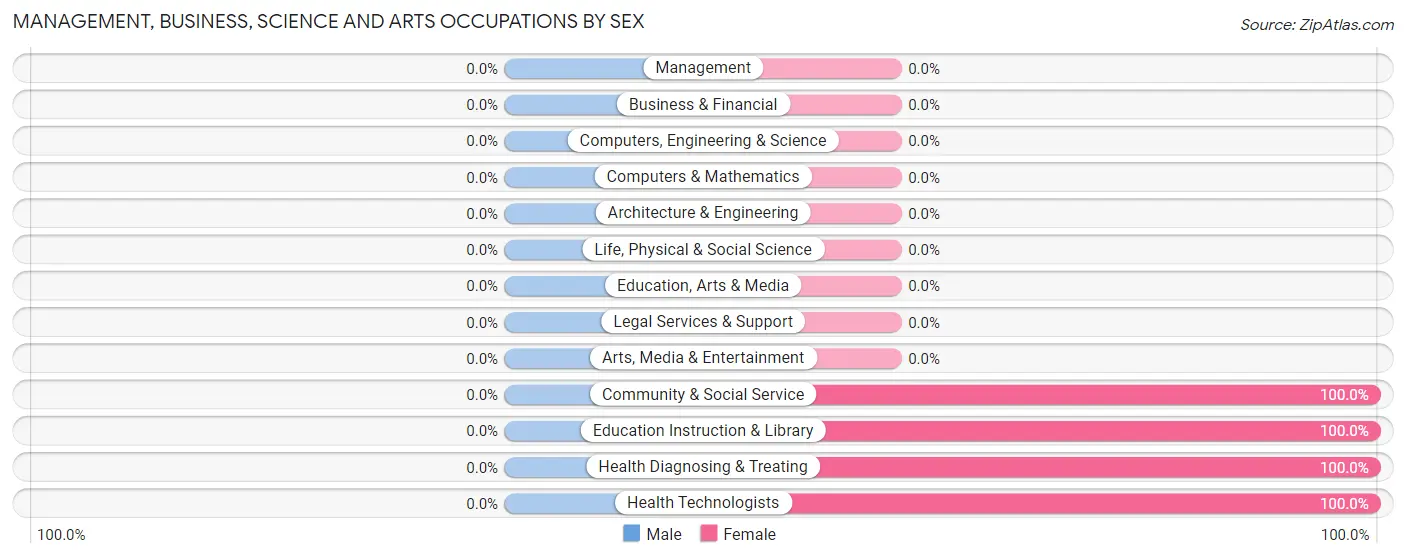
Management, Business, Science and Arts Occupations
The most common Management, Business, Science and Arts occupations in Farmington are Community & Social Service (7 | 14.9%), Education Instruction & Library (7 | 14.9%), Health Diagnosing & Treating (7 | 14.9%), and Health Technologists (7 | 14.9%).
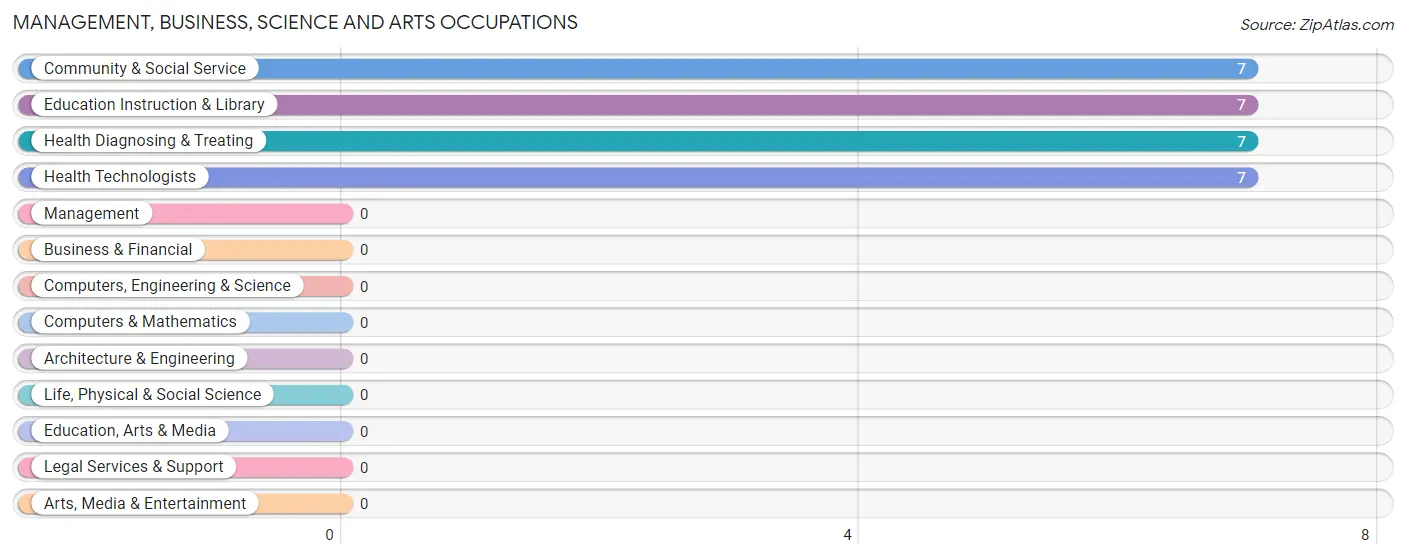
Management, Business, Science and Arts Occupations by Sex
| Occupation | Male | Female |
| Management | 0 (0.0%) | 0 (0.0%) |
| Business & Financial | 0 (0.0%) | 0 (0.0%) |
| Computers, Engineering & Science | 0 (0.0%) | 0 (0.0%) |
| Computers & Mathematics | 0 (0.0%) | 0 (0.0%) |
| Architecture & Engineering | 0 (0.0%) | 0 (0.0%) |
| Life, Physical & Social Science | 0 (0.0%) | 0 (0.0%) |
| Community & Social Service | 0 (0.0%) | 7 (100.0%) |
| Education, Arts & Media | 0 (0.0%) | 0 (0.0%) |
| Legal Services & Support | 0 (0.0%) | 0 (0.0%) |
| Education Instruction & Library | 0 (0.0%) | 7 (100.0%) |
| Arts, Media & Entertainment | 0 (0.0%) | 0 (0.0%) |
| Health Diagnosing & Treating | 0 (0.0%) | 7 (100.0%) |
| Health Technologists | 0 (0.0%) | 7 (100.0%) |
| Total (Category) | 0 (0.0%) | 14 (100.0%) |
| Total (Overall) | 20 (42.5%) | 27 (57.5%) |
Services Occupations
Services Occupations by Sex
| Occupation | Male | Female |
| Healthcare Support | 0 (0.0%) | 0 (0.0%) |
| Security & Protection | 0 (0.0%) | 0 (0.0%) |
| Firefighting & Prevention | 0 (0.0%) | 0 (0.0%) |
| Law Enforcement | 0 (0.0%) | 0 (0.0%) |
| Food Preparation & Serving | 0 (0.0%) | 0 (0.0%) |
| Cleaning & Maintenance | 0 (0.0%) | 0 (0.0%) |
| Personal Care & Service | 0 (0.0%) | 0 (0.0%) |
| Total (Category) | 0 (0.0%) | 0 (0.0%) |
| Total (Overall) | 20 (42.5%) | 27 (57.5%) |
Sales and Office Occupations
The most common Sales and Office occupations in Farmington are , and Sales & Related (4 | 8.5%).
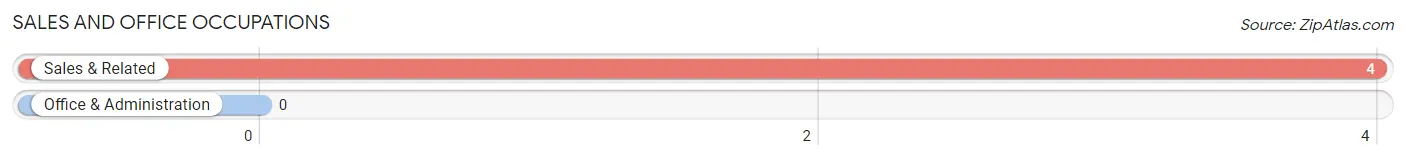
Sales and Office Occupations by Sex
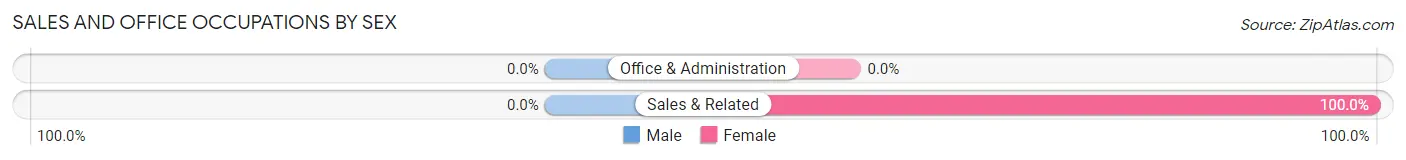
| Occupation | Male | Female |
| Sales & Related | 0 (0.0%) | 4 (100.0%) |
| Office & Administration | 0 (0.0%) | 0 (0.0%) |
| Total (Category) | 0 (0.0%) | 4 (100.0%) |
| Total (Overall) | 20 (42.5%) | 27 (57.5%) |
Natural Resources, Construction and Maintenance Occupations
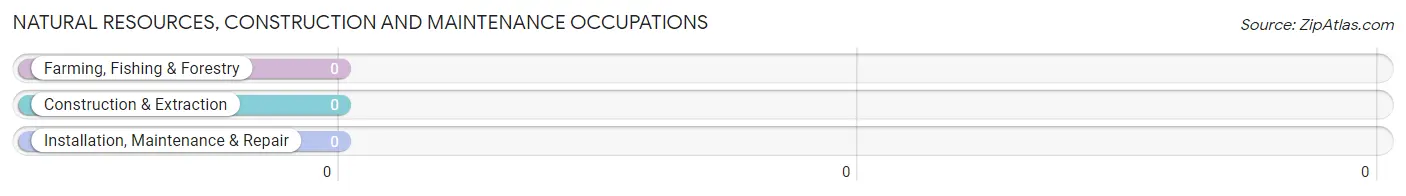
Natural Resources, Construction and Maintenance Occupations by Sex
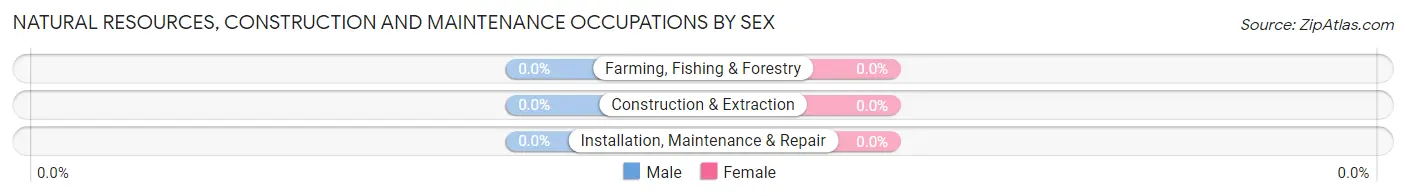
| Occupation | Male | Female |
| Farming, Fishing & Forestry | 0 (0.0%) | 0 (0.0%) |
| Construction & Extraction | 0 (0.0%) | 0 (0.0%) |
| Installation, Maintenance & Repair | 0 (0.0%) | 0 (0.0%) |
| Total (Category) | 0 (0.0%) | 0 (0.0%) |
| Total (Overall) | 20 (42.5%) | 27 (57.5%) |
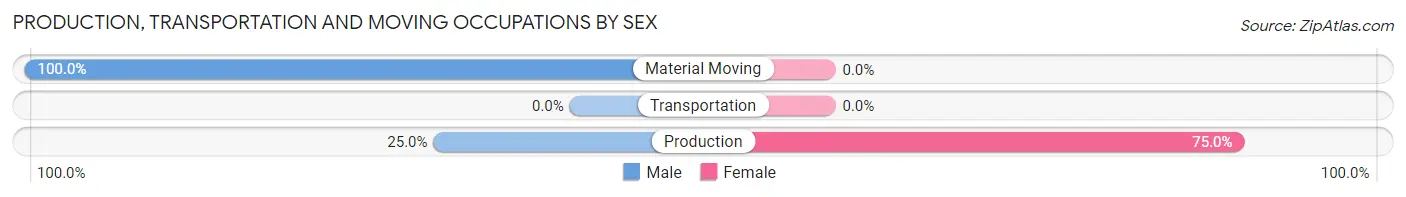
Production, Transportation and Moving Occupations
The most common Production, Transportation and Moving occupations in Farmington are Material Moving (17 | 36.2%), and Production (12 | 25.5%).
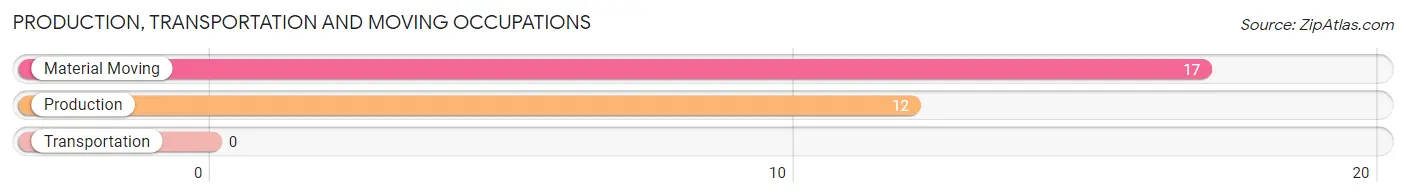
Production, Transportation and Moving Occupations by Sex
| Occupation | Male | Female |
| Production | 3 (25.0%) | 9 (75.0%) |
| Transportation | 0 (0.0%) | 0 (0.0%) |
| Material Moving | 17 (100.0%) | 0 (0.0%) |
| Total (Category) | 20 (69.0%) | 9 (31.0%) |
| Total (Overall) | 20 (42.5%) | 27 (57.5%) |
Employment Industries by Sex in Farmington
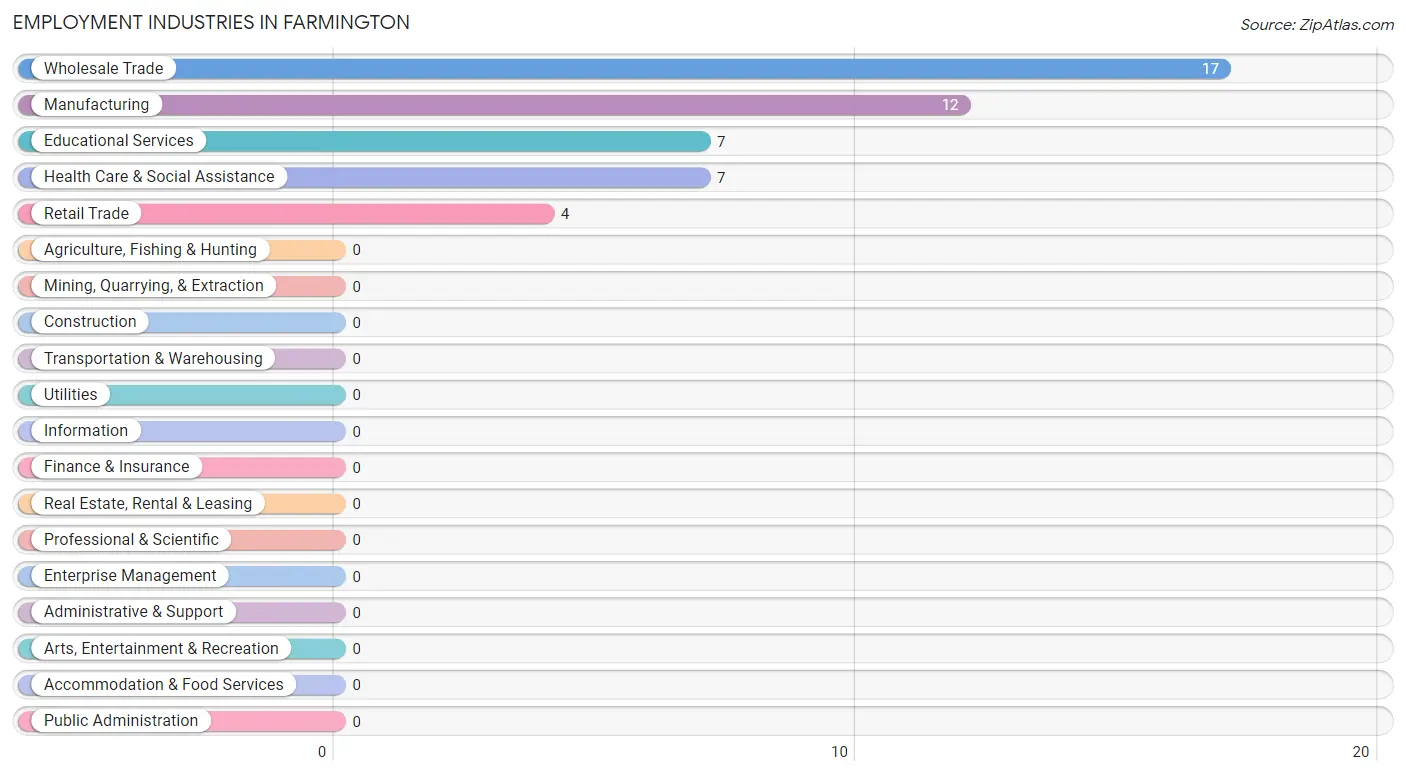
Employment Industries in Farmington
The major employment industries in Farmington include Wholesale Trade (17 | 36.2%), Manufacturing (12 | 25.5%), Educational Services (7 | 14.9%), Health Care & Social Assistance (7 | 14.9%), and Retail Trade (4 | 8.5%).
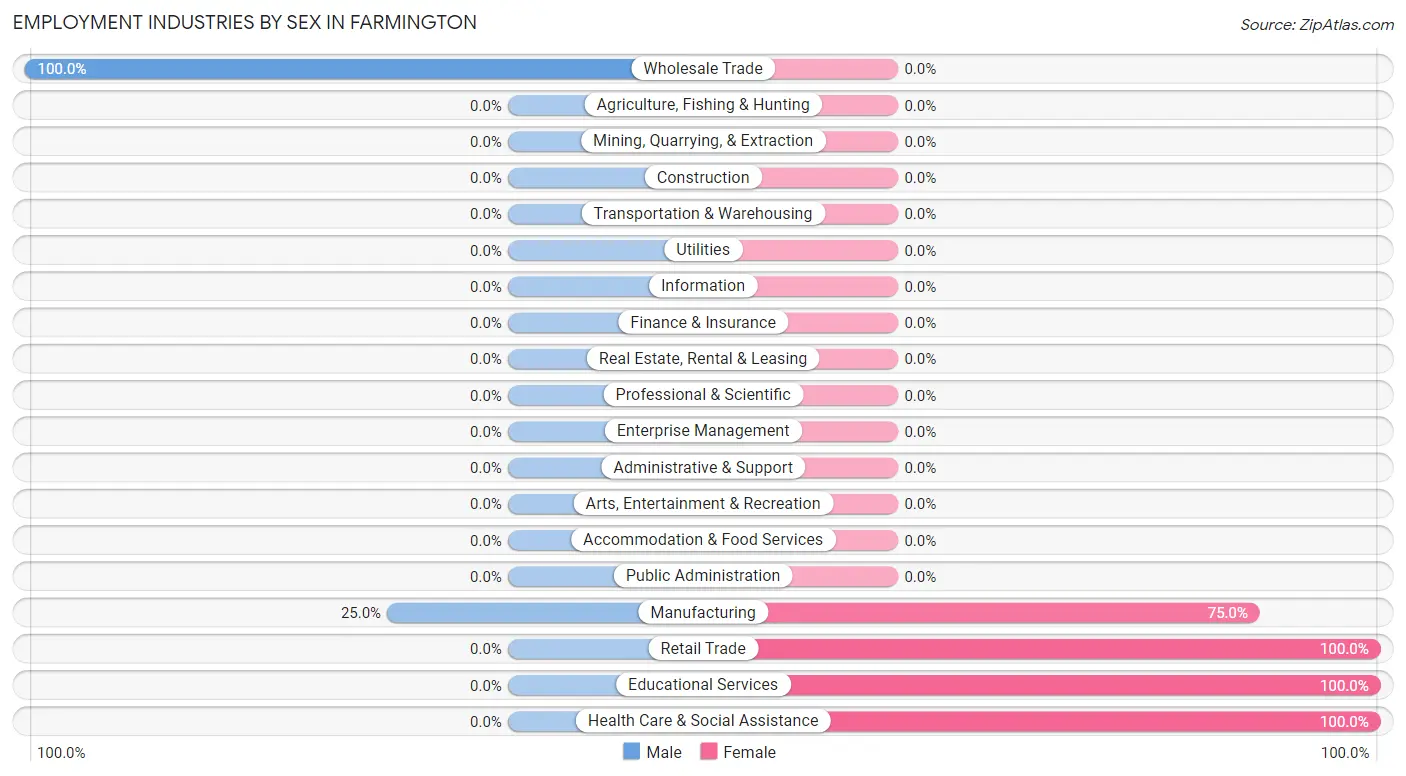
Employment Industries by Sex in Farmington
The Farmington industries that see more men than women are Wholesale Trade (100.0%), and Manufacturing (25.0%), whereas the industries that tend to have a higher number of women are Retail Trade (100.0%), Educational Services (100.0%), and Health Care & Social Assistance (100.0%).
| Industry | Male | Female |
| Agriculture, Fishing & Hunting | 0 (0.0%) | 0 (0.0%) |
| Mining, Quarrying, & Extraction | 0 (0.0%) | 0 (0.0%) |
| Construction | 0 (0.0%) | 0 (0.0%) |
| Manufacturing | 3 (25.0%) | 9 (75.0%) |
| Wholesale Trade | 17 (100.0%) | 0 (0.0%) |
| Retail Trade | 0 (0.0%) | 4 (100.0%) |
| Transportation & Warehousing | 0 (0.0%) | 0 (0.0%) |
| Utilities | 0 (0.0%) | 0 (0.0%) |
| Information | 0 (0.0%) | 0 (0.0%) |
| Finance & Insurance | 0 (0.0%) | 0 (0.0%) |
| Real Estate, Rental & Leasing | 0 (0.0%) | 0 (0.0%) |
| Professional & Scientific | 0 (0.0%) | 0 (0.0%) |
| Enterprise Management | 0 (0.0%) | 0 (0.0%) |
| Administrative & Support | 0 (0.0%) | 0 (0.0%) |
| Educational Services | 0 (0.0%) | 7 (100.0%) |
| Health Care & Social Assistance | 0 (0.0%) | 7 (100.0%) |
| Arts, Entertainment & Recreation | 0 (0.0%) | 0 (0.0%) |
| Accommodation & Food Services | 0 (0.0%) | 0 (0.0%) |
| Public Administration | 0 (0.0%) | 0 (0.0%) |
| Total | 20 (42.5%) | 27 (57.5%) |
Education in Farmington
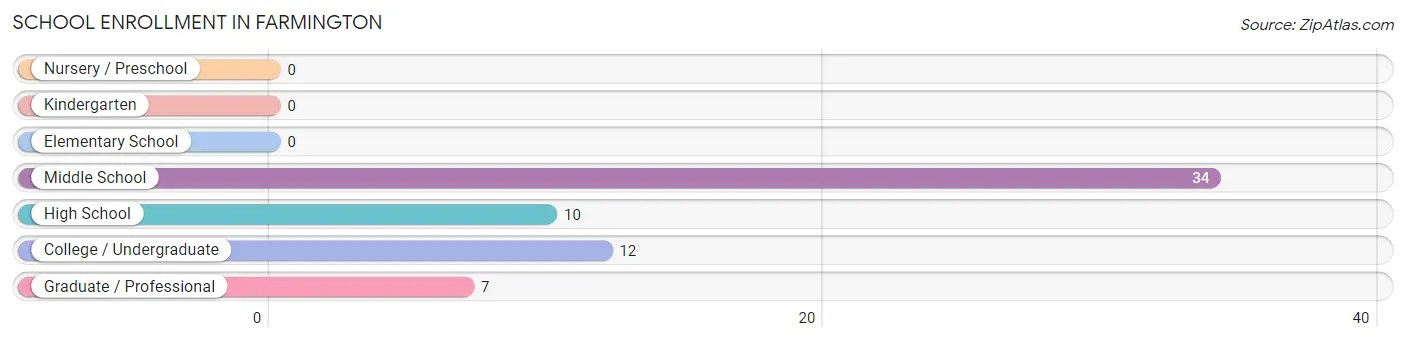
School Enrollment in Farmington
The most common levels of schooling among the 63 students in Farmington are middle school (34 | 54.0%), college / undergraduate (12 | 19.1%), and high school (10 | 15.9%).
| School Level | # Students | % Students |
| Nursery / Preschool | 0 | 0.0% |
| Kindergarten | 0 | 0.0% |
| Elementary School | 0 | 0.0% |
| Middle School | 34 | 54.0% |
| High School | 10 | 15.9% |
| College / Undergraduate | 12 | 19.1% |
| Graduate / Professional | 7 | 11.1% |
| Total | 63 | 100.0% |
School Enrollment by Age by Funding Source in Farmington
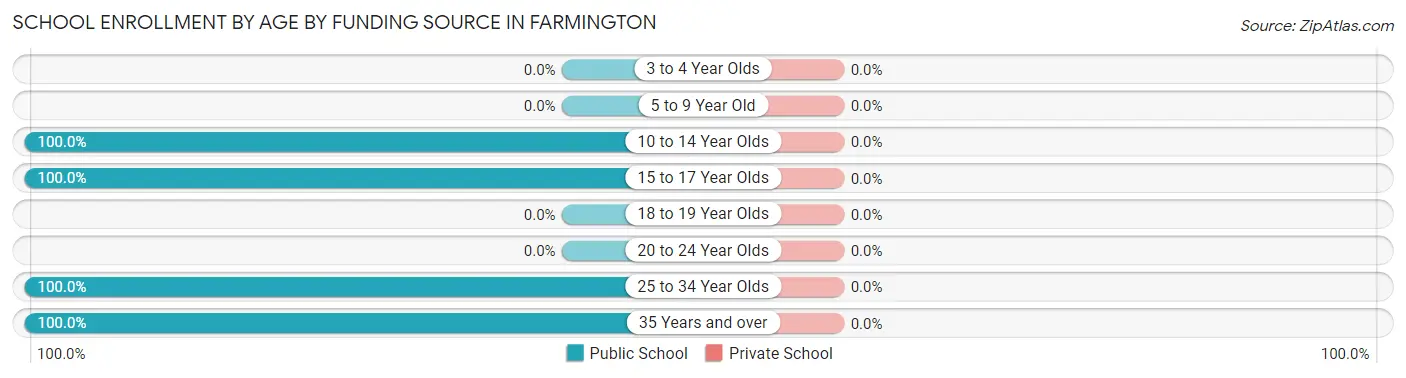
| Age Bracket | Public School | Private School |
| 3 to 4 Year Olds | 0 (0.0%) | 0 (0.0%) |
| 5 to 9 Year Old | 0 (0.0%) | 0 (0.0%) |
| 10 to 14 Year Olds | 34 (100.0%) | 0 (0.0%) |
| 15 to 17 Year Olds | 10 (100.0%) | 0 (0.0%) |
| 18 to 19 Year Olds | 0 (0.0%) | 0 (0.0%) |
| 20 to 24 Year Olds | 0 (0.0%) | 0 (0.0%) |
| 25 to 34 Year Olds | 9 (100.0%) | 0 (0.0%) |
| 35 Years and over | 10 (100.0%) | 0 (0.0%) |
| Total | 63 (100.0%) | 0 (0.0%) |
Educational Attainment by Field of Study in Farmington
, and business (7 | 100.0%) are the most common fields of study among 7 individuals in Farmington who have obtained a bachelor's degree or higher.
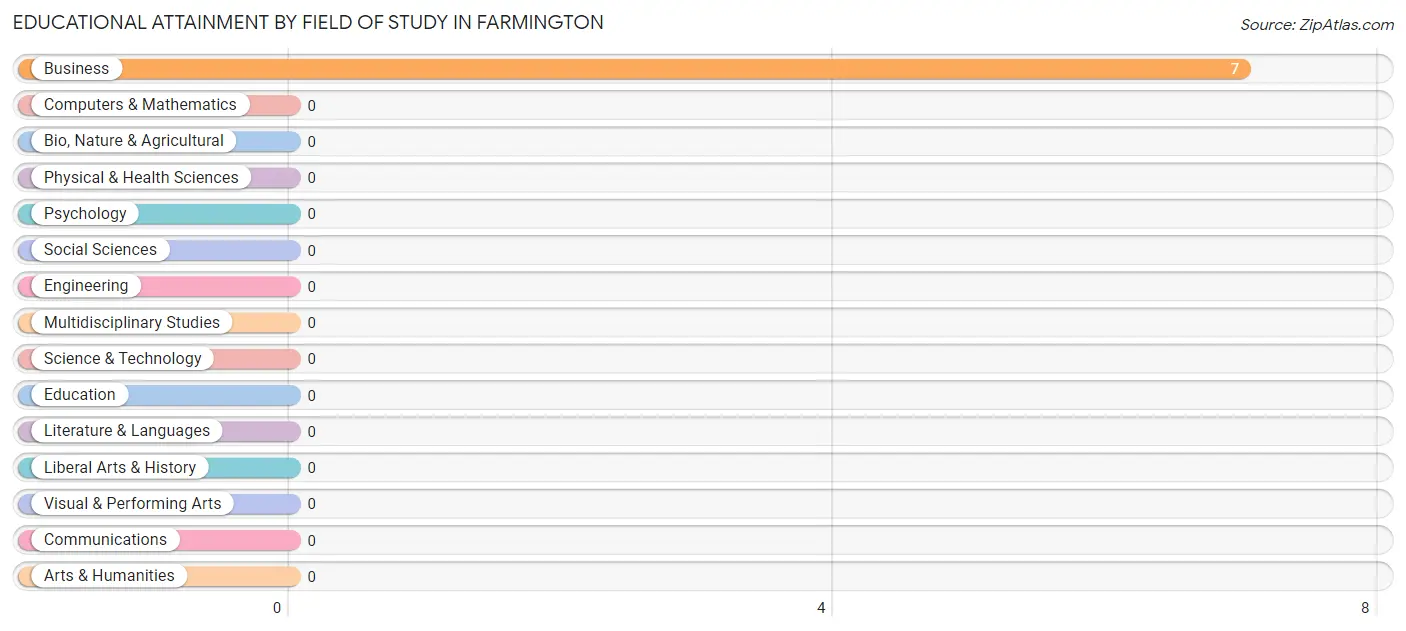
| Field of Study | # Graduates | % Graduates |
| Computers & Mathematics | 0 | 0.0% |
| Bio, Nature & Agricultural | 0 | 0.0% |
| Physical & Health Sciences | 0 | 0.0% |
| Psychology | 0 | 0.0% |
| Social Sciences | 0 | 0.0% |
| Engineering | 0 | 0.0% |
| Multidisciplinary Studies | 0 | 0.0% |
| Science & Technology | 0 | 0.0% |
| Business | 7 | 100.0% |
| Education | 0 | 0.0% |
| Literature & Languages | 0 | 0.0% |
| Liberal Arts & History | 0 | 0.0% |
| Visual & Performing Arts | 0 | 0.0% |
| Communications | 0 | 0.0% |
| Arts & Humanities | 0 | 0.0% |
| Total | 7 | 100.0% |
Transportation & Commute in Farmington
Vehicle Availability by Sex in Farmington
The most prevalent vehicle ownership categories in Farmington are males with 2 vehicles (20, accounting for 100.0%) and females with 2 vehicles (18, making up 74.1%).
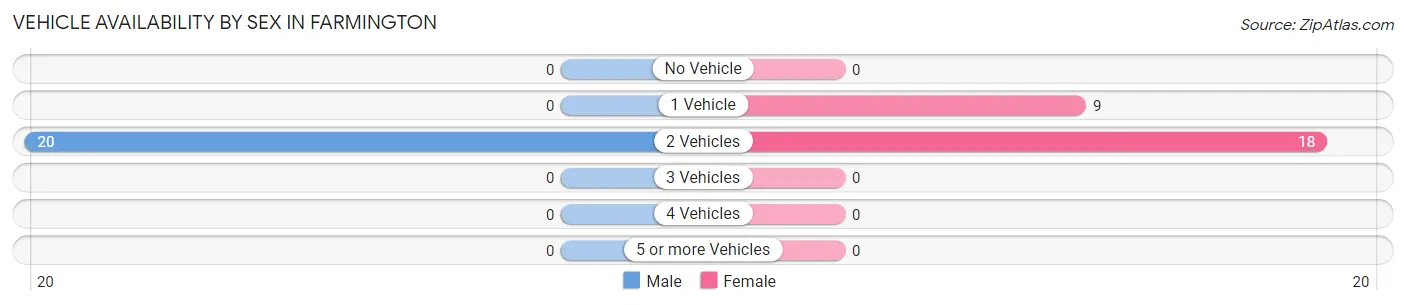
| Vehicles Available | Male | Female |
| No Vehicle | 0 (0.0%) | 0 (0.0%) |
| 1 Vehicle | 0 (0.0%) | 9 (33.3%) |
| 2 Vehicles | 20 (100.0%) | 18 (66.7%) |
| 3 Vehicles | 0 (0.0%) | 0 (0.0%) |
| 4 Vehicles | 0 (0.0%) | 0 (0.0%) |
| 5 or more Vehicles | 0 (0.0%) | 0 (0.0%) |
| Total | 20 (100.0%) | 27 (100.0%) |
Commute Time in Farmington
The most frequently occuring commute durations in Farmington are 30 to 34 minutes (17 commuters, 36.2%), 20 to 24 minutes (16 commuters, 34.0%), and 15 to 19 minutes (7 commuters, 14.9%).
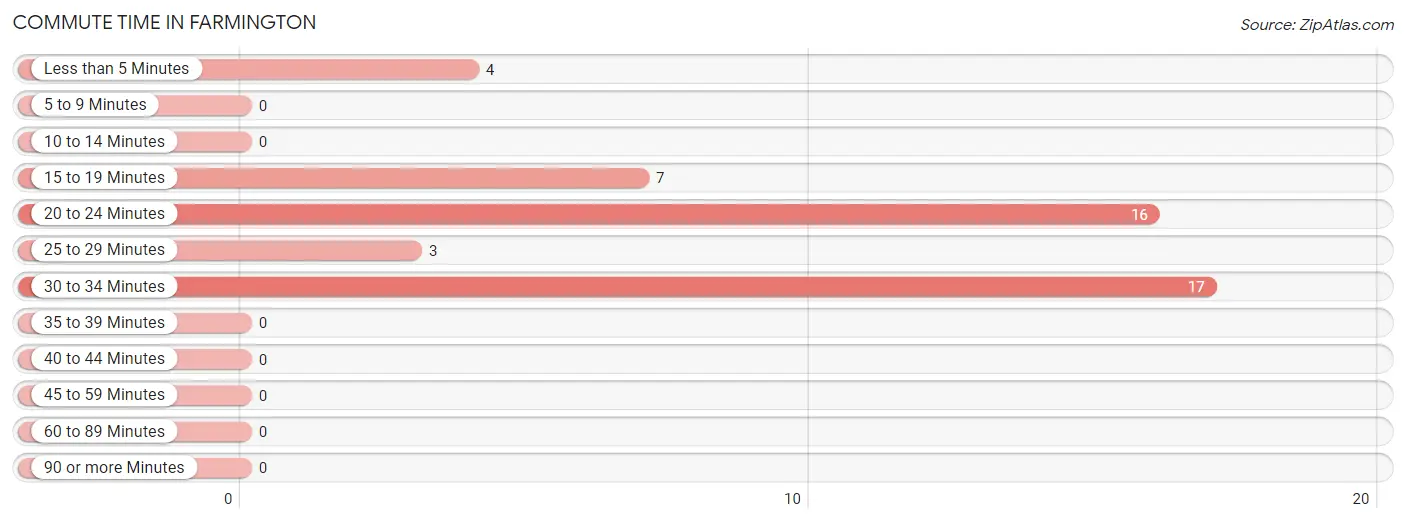
| Commute Time | # Commuters | % Commuters |
| Less than 5 Minutes | 4 | 8.5% |
| 5 to 9 Minutes | 0 | 0.0% |
| 10 to 14 Minutes | 0 | 0.0% |
| 15 to 19 Minutes | 7 | 14.9% |
| 20 to 24 Minutes | 16 | 34.0% |
| 25 to 29 Minutes | 3 | 6.4% |
| 30 to 34 Minutes | 17 | 36.2% |
| 35 to 39 Minutes | 0 | 0.0% |
| 40 to 44 Minutes | 0 | 0.0% |
| 45 to 59 Minutes | 0 | 0.0% |
| 60 to 89 Minutes | 0 | 0.0% |
| 90 or more Minutes | 0 | 0.0% |
Commute Time by Sex in Farmington
The most common commute times in Farmington are 30 to 34 minutes (17 commuters, 85.0%) for males and 20 to 24 minutes (16 commuters, 59.3%) for females.
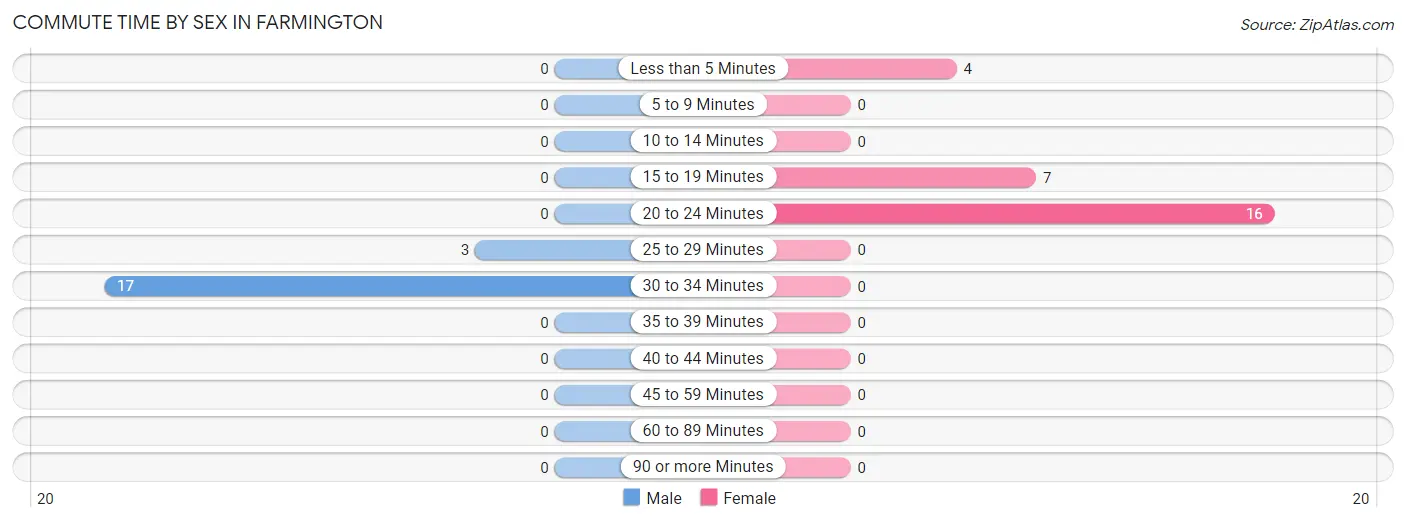
| Commute Time | Male | Female |
| Less than 5 Minutes | 0 (0.0%) | 4 (14.8%) |
| 5 to 9 Minutes | 0 (0.0%) | 0 (0.0%) |
| 10 to 14 Minutes | 0 (0.0%) | 0 (0.0%) |
| 15 to 19 Minutes | 0 (0.0%) | 7 (25.9%) |
| 20 to 24 Minutes | 0 (0.0%) | 16 (59.3%) |
| 25 to 29 Minutes | 3 (15.0%) | 0 (0.0%) |
| 30 to 34 Minutes | 17 (85.0%) | 0 (0.0%) |
| 35 to 39 Minutes | 0 (0.0%) | 0 (0.0%) |
| 40 to 44 Minutes | 0 (0.0%) | 0 (0.0%) |
| 45 to 59 Minutes | 0 (0.0%) | 0 (0.0%) |
| 60 to 89 Minutes | 0 (0.0%) | 0 (0.0%) |
| 90 or more Minutes | 0 (0.0%) | 0 (0.0%) |
Time of Departure to Work by Sex in Farmington
The most frequent times of departure to work in Farmington are 6:30 AM to 6:59 AM (17, 85.0%) for males and 7:00 AM to 7:29 AM (14, 51.8%) for females.
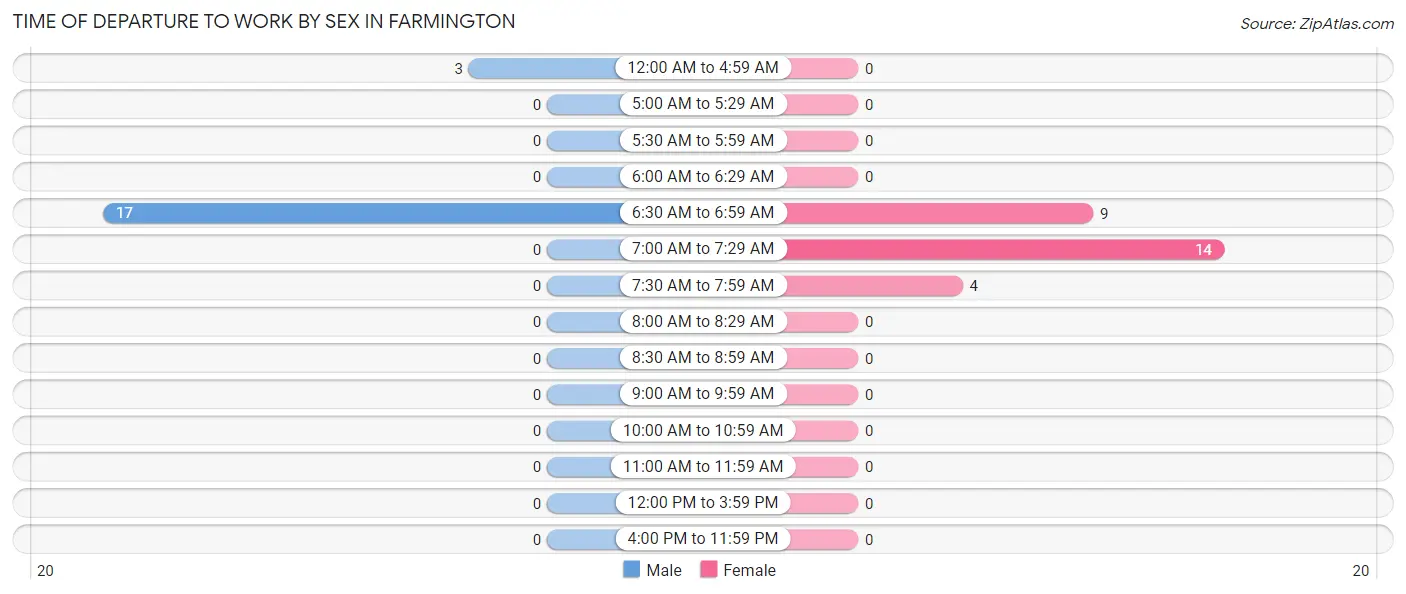
| Time of Departure | Male | Female |
| 12:00 AM to 4:59 AM | 3 (15.0%) | 0 (0.0%) |
| 5:00 AM to 5:29 AM | 0 (0.0%) | 0 (0.0%) |
| 5:30 AM to 5:59 AM | 0 (0.0%) | 0 (0.0%) |
| 6:00 AM to 6:29 AM | 0 (0.0%) | 0 (0.0%) |
| 6:30 AM to 6:59 AM | 17 (85.0%) | 9 (33.3%) |
| 7:00 AM to 7:29 AM | 0 (0.0%) | 14 (51.8%) |
| 7:30 AM to 7:59 AM | 0 (0.0%) | 4 (14.8%) |
| 8:00 AM to 8:29 AM | 0 (0.0%) | 0 (0.0%) |
| 8:30 AM to 8:59 AM | 0 (0.0%) | 0 (0.0%) |
| 9:00 AM to 9:59 AM | 0 (0.0%) | 0 (0.0%) |
| 10:00 AM to 10:59 AM | 0 (0.0%) | 0 (0.0%) |
| 11:00 AM to 11:59 AM | 0 (0.0%) | 0 (0.0%) |
| 12:00 PM to 3:59 PM | 0 (0.0%) | 0 (0.0%) |
| 4:00 PM to 11:59 PM | 0 (0.0%) | 0 (0.0%) |
| Total | 20 (100.0%) | 27 (100.0%) |
Housing Occupancy in Farmington
Occupancy by Ownership in Farmington
Of the total 78 dwellings in Farmington, owner-occupied units account for 69 (88.5%), while renter-occupied units make up 9 (11.5%).
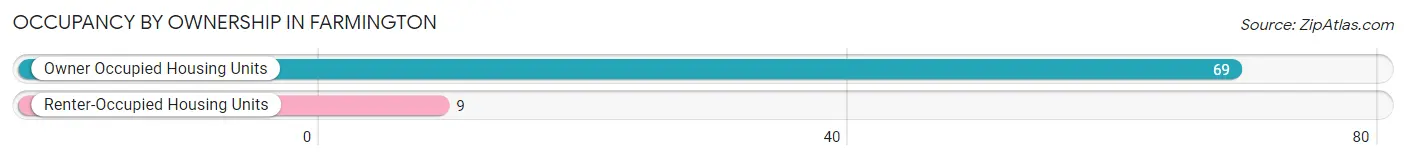
| Occupancy | # Housing Units | % Housing Units |
| Owner Occupied Housing Units | 69 | 88.5% |
| Renter-Occupied Housing Units | 9 | 11.5% |
| Total Occupied Housing Units | 78 | 100.0% |
Occupancy by Household Size in Farmington
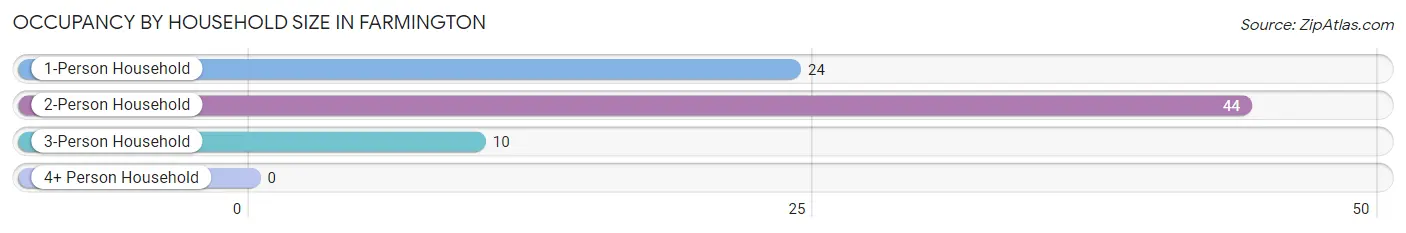
| Household Size | # Housing Units | % Housing Units |
| 1-Person Household | 24 | 30.8% |
| 2-Person Household | 44 | 56.4% |
| 3-Person Household | 10 | 12.8% |
| 4+ Person Household | 0 | 0.0% |
| Total Housing Units | 78 | 100.0% |
Occupancy by Ownership by Household Size in Farmington
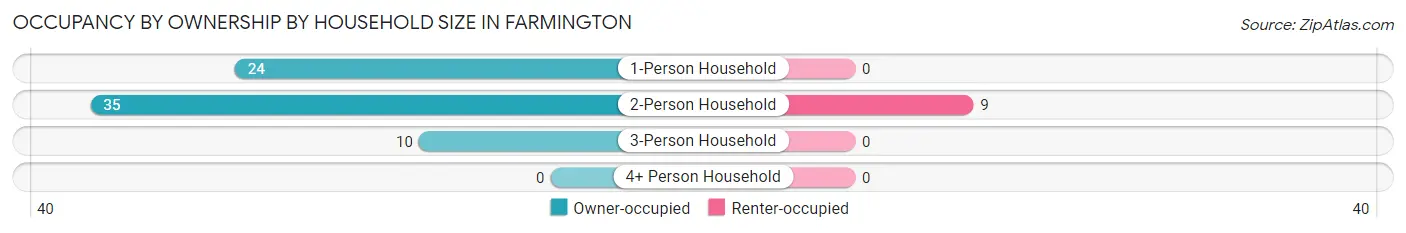
| Household Size | Owner-occupied | Renter-occupied |
| 1-Person Household | 24 (100.0%) | 0 (0.0%) |
| 2-Person Household | 35 (79.5%) | 9 (20.4%) |
| 3-Person Household | 10 (100.0%) | 0 (0.0%) |
| 4+ Person Household | 0 (0.0%) | 0 (0.0%) |
| Total Housing Units | 69 (88.5%) | 9 (11.5%) |
Occupancy by Educational Attainment in Farmington
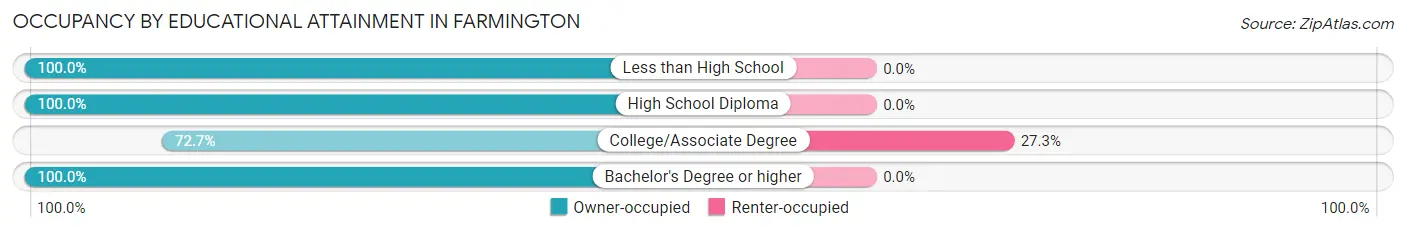
| Household Size | Owner-occupied | Renter-occupied |
| Less than High School | 8 (100.0%) | 0 (0.0%) |
| High School Diploma | 30 (100.0%) | 0 (0.0%) |
| College/Associate Degree | 24 (72.7%) | 9 (27.3%) |
| Bachelor's Degree or higher | 7 (100.0%) | 0 (0.0%) |
Occupancy by Age of Householder in Farmington
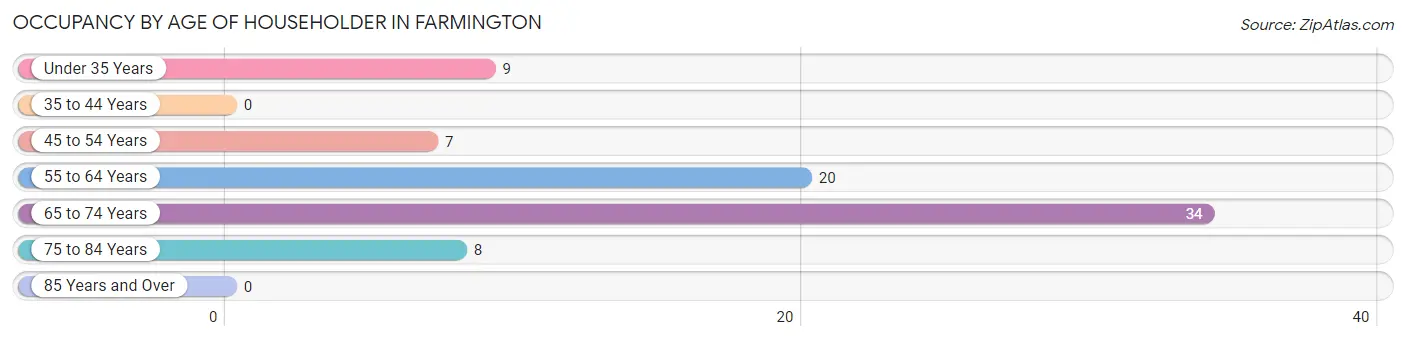
| Age Bracket | # Households | % Households |
| Under 35 Years | 9 | 11.5% |
| 35 to 44 Years | 0 | 0.0% |
| 45 to 54 Years | 7 | 9.0% |
| 55 to 64 Years | 20 | 25.6% |
| 65 to 74 Years | 34 | 43.6% |
| 75 to 84 Years | 8 | 10.3% |
| 85 Years and Over | 0 | 0.0% |
| Total | 78 | 100.0% |
Housing Finances in Farmington
Median Income by Occupancy in Farmington
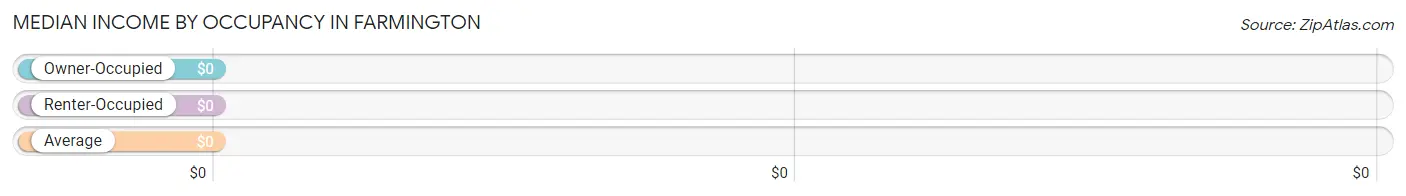
| Occupancy Type | # Households | Median Income |
| Owner-Occupied | 69 (88.5%) | $0 |
| Renter-Occupied | 9 (11.5%) | $0 |
| Average | 78 (100.0%) | $0 |
Occupancy by Householder Income Bracket in Farmington
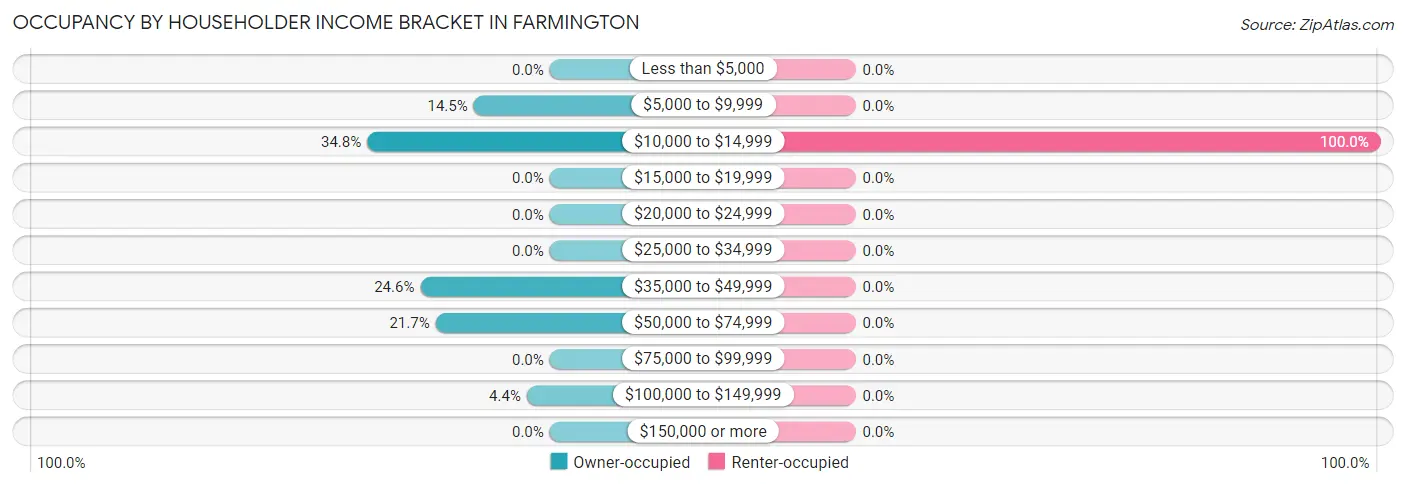
| Income Bracket | Owner-occupied | Renter-occupied |
| Less than $5,000 | 0 (0.0%) | 0 (0.0%) |
| $5,000 to $9,999 | 10 (14.5%) | 0 (0.0%) |
| $10,000 to $14,999 | 24 (34.8%) | 9 (100.0%) |
| $15,000 to $19,999 | 0 (0.0%) | 0 (0.0%) |
| $20,000 to $24,999 | 0 (0.0%) | 0 (0.0%) |
| $25,000 to $34,999 | 0 (0.0%) | 0 (0.0%) |
| $35,000 to $49,999 | 17 (24.6%) | 0 (0.0%) |
| $50,000 to $74,999 | 15 (21.7%) | 0 (0.0%) |
| $75,000 to $99,999 | 0 (0.0%) | 0 (0.0%) |
| $100,000 to $149,999 | 3 (4.3%) | 0 (0.0%) |
| $150,000 or more | 0 (0.0%) | 0 (0.0%) |
| Total | 69 (100.0%) | 9 (100.0%) |
Monthly Housing Cost Tiers in Farmington
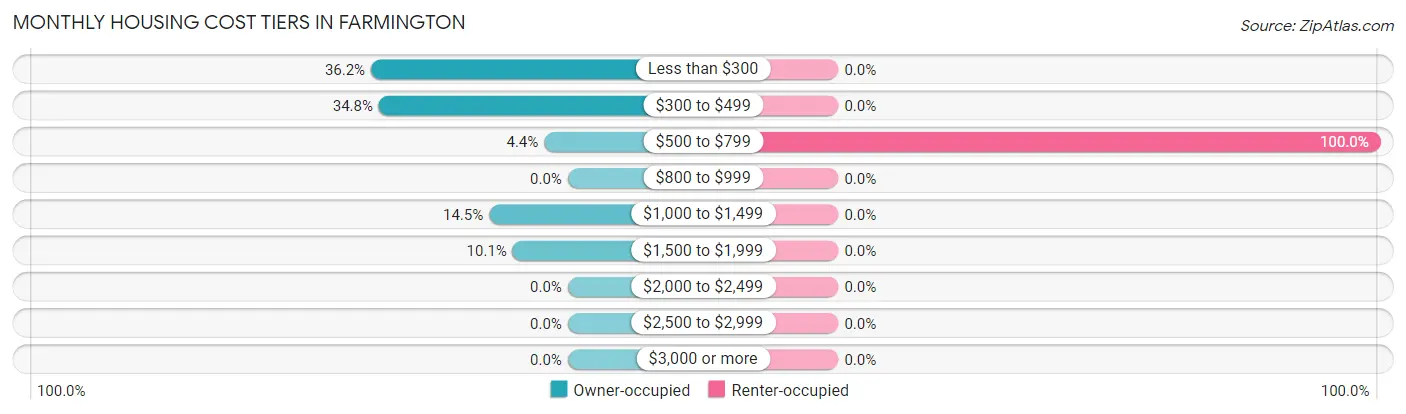
| Monthly Cost | Owner-occupied | Renter-occupied |
| Less than $300 | 25 (36.2%) | 0 (0.0%) |
| $300 to $499 | 24 (34.8%) | 0 (0.0%) |
| $500 to $799 | 3 (4.3%) | 9 (100.0%) |
| $800 to $999 | 0 (0.0%) | 0 (0.0%) |
| $1,000 to $1,499 | 10 (14.5%) | 0 (0.0%) |
| $1,500 to $1,999 | 7 (10.1%) | 0 (0.0%) |
| $2,000 to $2,499 | 0 (0.0%) | 0 (0.0%) |
| $2,500 to $2,999 | 0 (0.0%) | 0 (0.0%) |
| $3,000 or more | 0 (0.0%) | 0 (0.0%) |
| Total | 69 (100.0%) | 9 (100.0%) |
Physical Housing Characteristics in Farmington
Housing Structures in Farmington
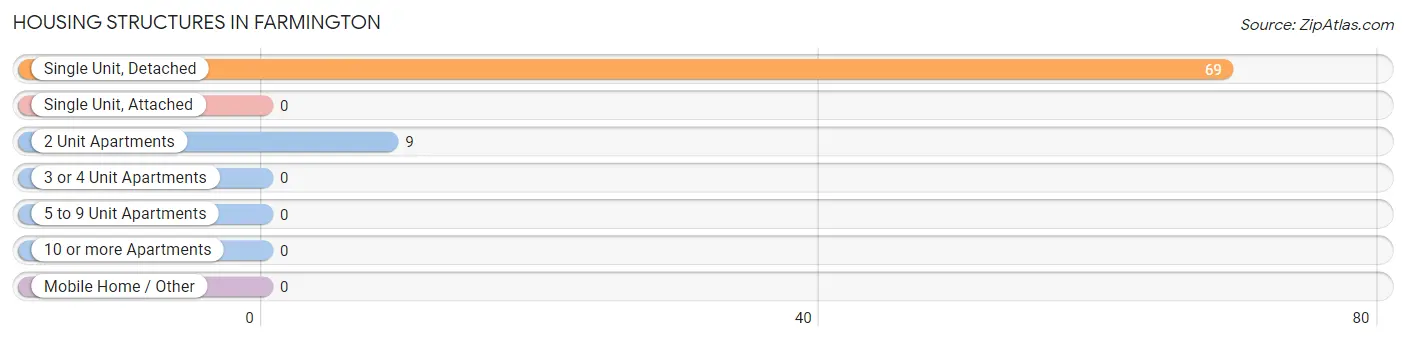
| Structure Type | # Housing Units | % Housing Units |
| Single Unit, Detached | 69 | 88.5% |
| Single Unit, Attached | 0 | 0.0% |
| 2 Unit Apartments | 9 | 11.5% |
| 3 or 4 Unit Apartments | 0 | 0.0% |
| 5 to 9 Unit Apartments | 0 | 0.0% |
| 10 or more Apartments | 0 | 0.0% |
| Mobile Home / Other | 0 | 0.0% |
| Total | 78 | 100.0% |
Housing Structures by Occupancy in Farmington
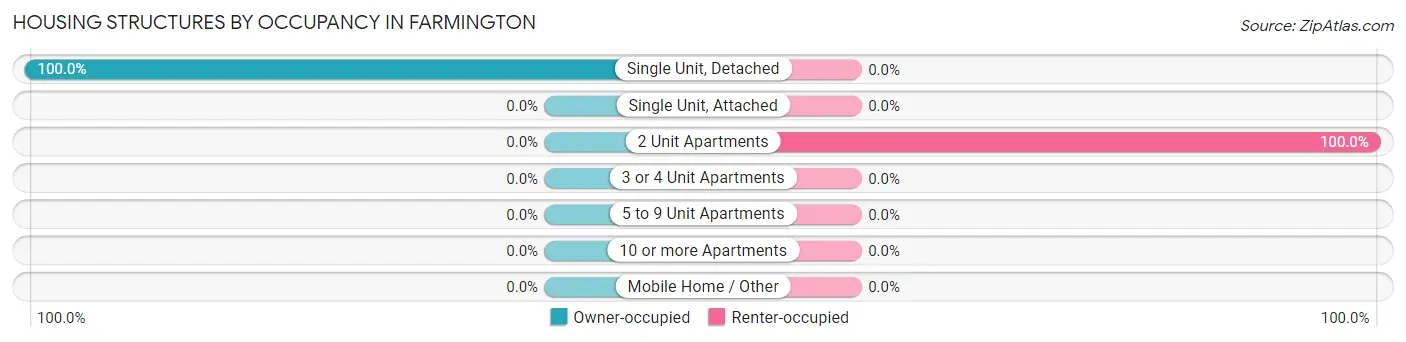
| Structure Type | Owner-occupied | Renter-occupied |
| Single Unit, Detached | 69 (100.0%) | 0 (0.0%) |
| Single Unit, Attached | 0 (0.0%) | 0 (0.0%) |
| 2 Unit Apartments | 0 (0.0%) | 9 (100.0%) |
| 3 or 4 Unit Apartments | 0 (0.0%) | 0 (0.0%) |
| 5 to 9 Unit Apartments | 0 (0.0%) | 0 (0.0%) |
| 10 or more Apartments | 0 (0.0%) | 0 (0.0%) |
| Mobile Home / Other | 0 (0.0%) | 0 (0.0%) |
| Total | 69 (88.5%) | 9 (11.5%) |
Housing Structures by Number of Rooms in Farmington
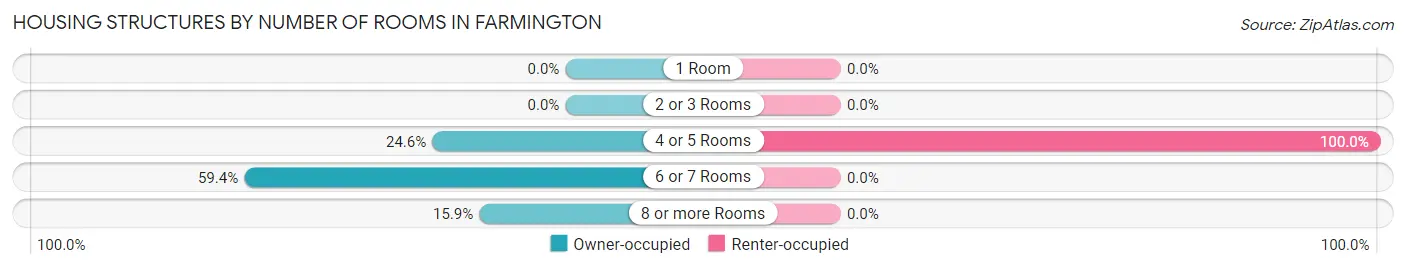
| Number of Rooms | Owner-occupied | Renter-occupied |
| 1 Room | 0 (0.0%) | 0 (0.0%) |
| 2 or 3 Rooms | 0 (0.0%) | 0 (0.0%) |
| 4 or 5 Rooms | 17 (24.6%) | 9 (100.0%) |
| 6 or 7 Rooms | 41 (59.4%) | 0 (0.0%) |
| 8 or more Rooms | 11 (15.9%) | 0 (0.0%) |
| Total | 69 (100.0%) | 9 (100.0%) |
Housing Structure by Heating Type in Farmington
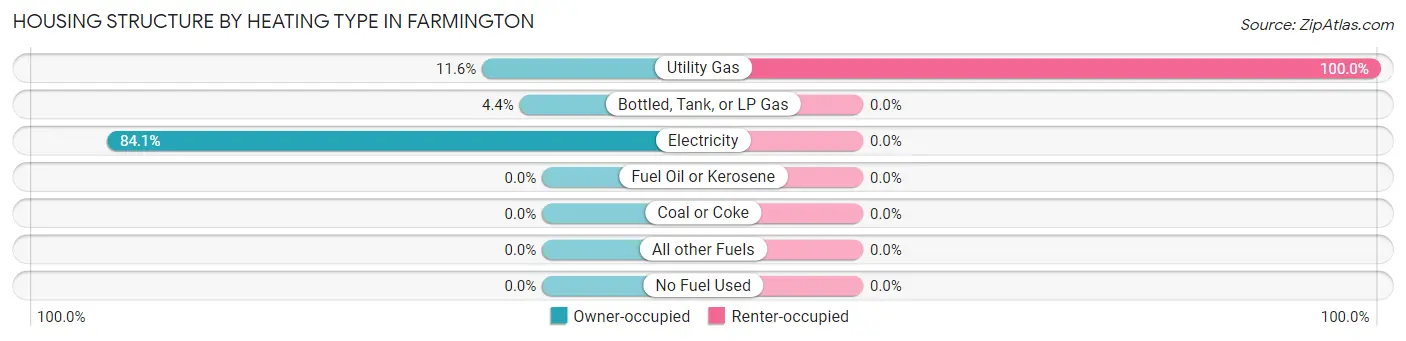
| Heating Type | Owner-occupied | Renter-occupied |
| Utility Gas | 8 (11.6%) | 9 (100.0%) |
| Bottled, Tank, or LP Gas | 3 (4.3%) | 0 (0.0%) |
| Electricity | 58 (84.1%) | 0 (0.0%) |
| Fuel Oil or Kerosene | 0 (0.0%) | 0 (0.0%) |
| Coal or Coke | 0 (0.0%) | 0 (0.0%) |
| All other Fuels | 0 (0.0%) | 0 (0.0%) |
| No Fuel Used | 0 (0.0%) | 0 (0.0%) |
| Total | 69 (100.0%) | 9 (100.0%) |
Household Vehicle Usage in Farmington
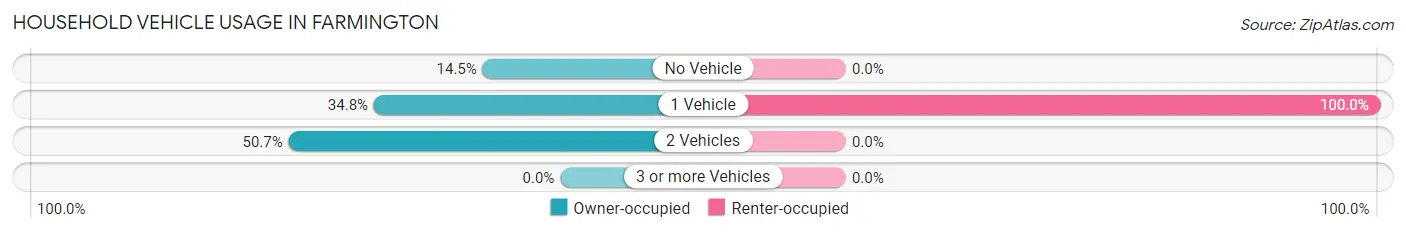
| Vehicles per Household | Owner-occupied | Renter-occupied |
| No Vehicle | 10 (14.5%) | 0 (0.0%) |
| 1 Vehicle | 24 (34.8%) | 9 (100.0%) |
| 2 Vehicles | 35 (50.7%) | 0 (0.0%) |
| 3 or more Vehicles | 0 (0.0%) | 0 (0.0%) |
| Total | 69 (100.0%) | 9 (100.0%) |
Real Estate & Mortgages in Farmington
Real Estate and Mortgage Overview in Farmington
| Characteristic | Without Mortgage | With Mortgage |
| Housing Units | 52 | 17 |
| Median Property Value | $72,800 | $0 |
| Median Household Income | - | - |
| Monthly Housing Costs | $302 | $0 |
| Real Estate Taxes | $408 | $0 |
Property Value by Mortgage Status in Farmington
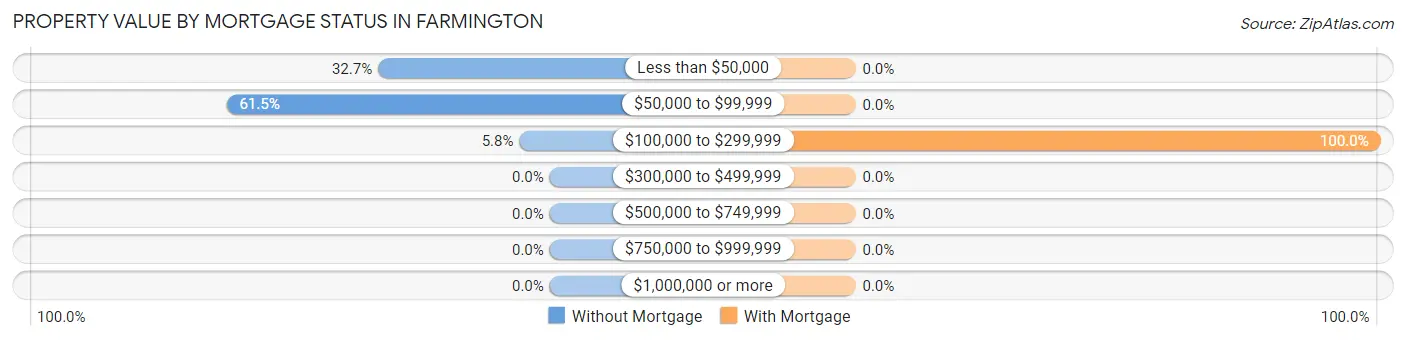
| Property Value | Without Mortgage | With Mortgage |
| Less than $50,000 | 17 (32.7%) | 0 (0.0%) |
| $50,000 to $99,999 | 32 (61.5%) | 0 (0.0%) |
| $100,000 to $299,999 | 3 (5.8%) | 17 (100.0%) |
| $300,000 to $499,999 | 0 (0.0%) | 0 (0.0%) |
| $500,000 to $749,999 | 0 (0.0%) | 0 (0.0%) |
| $750,000 to $999,999 | 0 (0.0%) | 0 (0.0%) |
| $1,000,000 or more | 0 (0.0%) | 0 (0.0%) |
| Total | 52 (100.0%) | 17 (100.0%) |
Household Income by Mortgage Status in Farmington
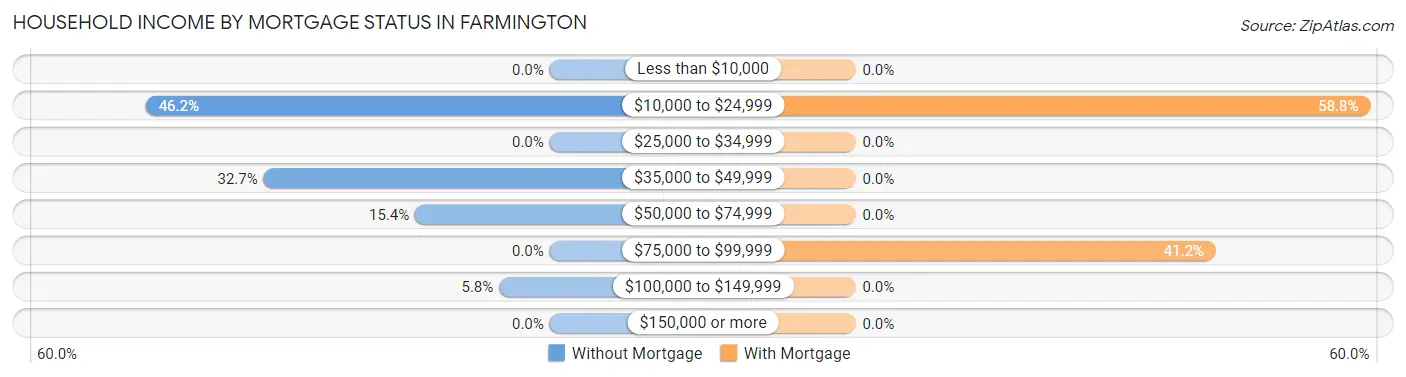
| Household Income | Without Mortgage | With Mortgage |
| Less than $10,000 | 0 (0.0%) | 0 (0.0%) |
| $10,000 to $24,999 | 24 (46.2%) | 10 (58.8%) |
| $25,000 to $34,999 | 0 (0.0%) | 0 (0.0%) |
| $35,000 to $49,999 | 17 (32.7%) | 0 (0.0%) |
| $50,000 to $74,999 | 8 (15.4%) | 0 (0.0%) |
| $75,000 to $99,999 | 0 (0.0%) | 7 (41.2%) |
| $100,000 to $149,999 | 3 (5.8%) | 0 (0.0%) |
| $150,000 or more | 0 (0.0%) | 0 (0.0%) |
| Total | 52 (100.0%) | 17 (100.0%) |
Property Value to Household Income Ratio in Farmington
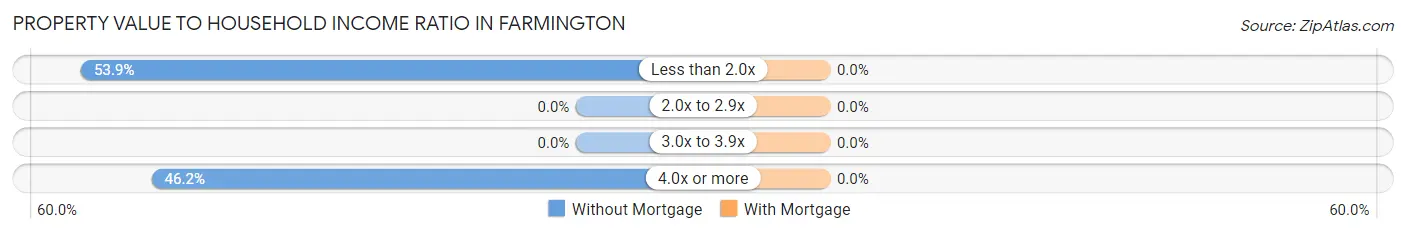
| Value-to-Income Ratio | Without Mortgage | With Mortgage |
| Less than 2.0x | 28 (53.8%) | 0 (0.0%) |
| 2.0x to 2.9x | 0 (0.0%) | 0 (0.0%) |
| 3.0x to 3.9x | 0 (0.0%) | 0 (0.0%) |
| 4.0x or more | 24 (46.2%) | 0 (0.0%) |
| Total | 52 (100.0%) | 17 (100.0%) |
Real Estate Taxes by Mortgage Status in Farmington
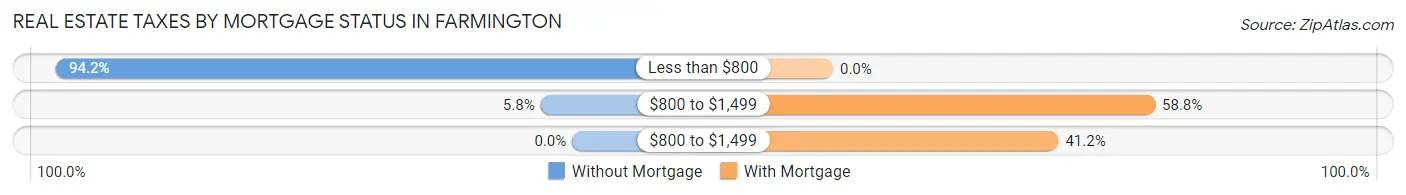
| Property Taxes | Without Mortgage | With Mortgage |
| Less than $800 | 49 (94.2%) | 0 (0.0%) |
| $800 to $1,499 | 3 (5.8%) | 10 (58.8%) |
| $800 to $1,499 | 0 (0.0%) | 7 (41.2%) |
| Total | 52 (100.0%) | 17 (100.0%) |
Health & Disability in Farmington
Health Insurance Coverage by Age in Farmington
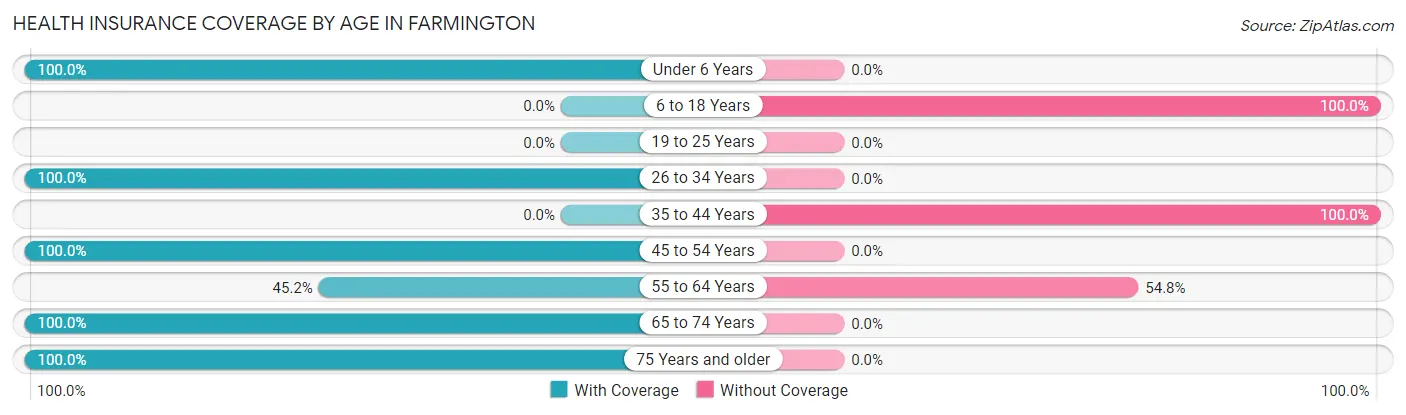
| Age Bracket | With Coverage | Without Coverage |
| Under 6 Years | 13 (100.0%) | 0 (0.0%) |
| 6 to 18 Years | 0 (0.0%) | 44 (100.0%) |
| 19 to 25 Years | 0 (0.0%) | 0 (0.0%) |
| 26 to 34 Years | 9 (100.0%) | 0 (0.0%) |
| 35 to 44 Years | 0 (0.0%) | 13 (100.0%) |
| 45 to 54 Years | 7 (100.0%) | 0 (0.0%) |
| 55 to 64 Years | 14 (45.2%) | 17 (54.8%) |
| 65 to 74 Years | 34 (100.0%) | 0 (0.0%) |
| 75 Years and older | 16 (100.0%) | 0 (0.0%) |
| Total | 93 (55.7%) | 74 (44.3%) |
Health Insurance Coverage by Citizenship Status in Farmington
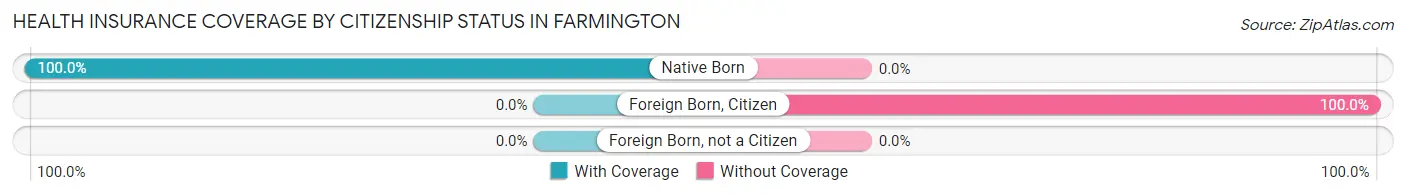
| Citizenship Status | With Coverage | Without Coverage |
| Native Born | 13 (100.0%) | 0 (0.0%) |
| Foreign Born, Citizen | 0 (0.0%) | 44 (100.0%) |
| Foreign Born, not a Citizen | 0 (0.0%) | 0 (0.0%) |
Health Insurance Coverage by Household Income in Farmington
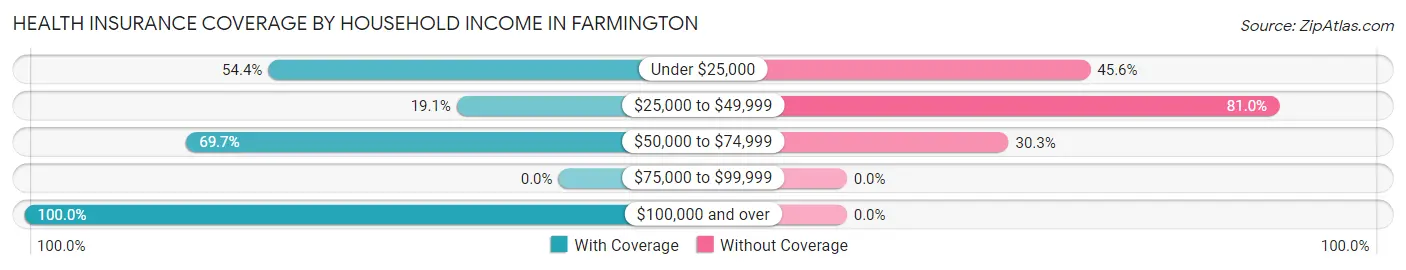
| Household Income | With Coverage | Without Coverage |
| Under $25,000 | 56 (54.4%) | 47 (45.6%) |
| $25,000 to $49,999 | 4 (19.1%) | 17 (80.9%) |
| $50,000 to $74,999 | 23 (69.7%) | 10 (30.3%) |
| $75,000 to $99,999 | 0 (0.0%) | 0 (0.0%) |
| $100,000 and over | 10 (100.0%) | 0 (0.0%) |
Public vs Private Health Insurance Coverage by Age in Farmington
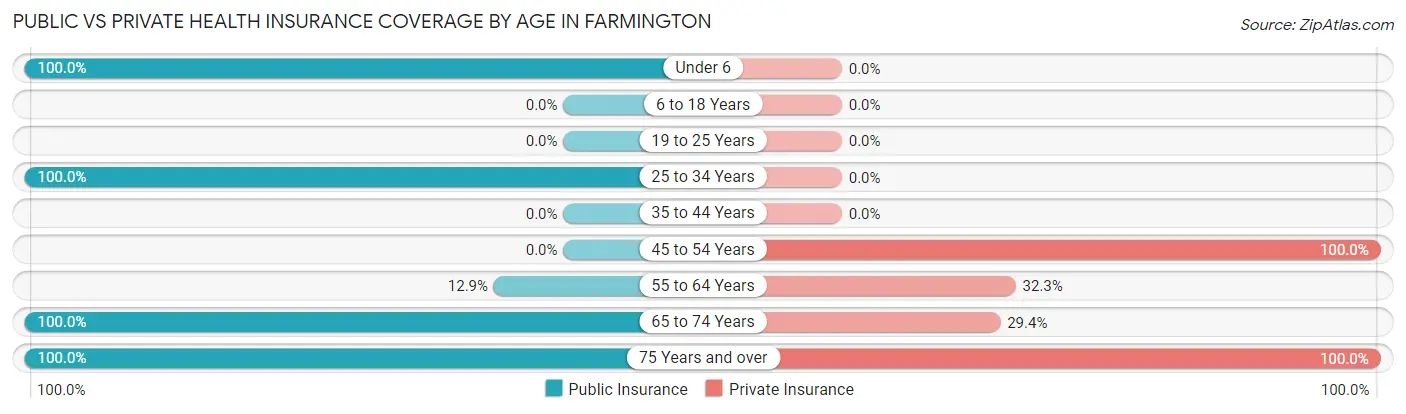
| Age Bracket | Public Insurance | Private Insurance |
| Under 6 | 13 (100.0%) | 0 (0.0%) |
| 6 to 18 Years | 0 (0.0%) | 0 (0.0%) |
| 19 to 25 Years | 0 (0.0%) | 0 (0.0%) |
| 25 to 34 Years | 9 (100.0%) | 0 (0.0%) |
| 35 to 44 Years | 0 (0.0%) | 0 (0.0%) |
| 45 to 54 Years | 0 (0.0%) | 7 (100.0%) |
| 55 to 64 Years | 4 (12.9%) | 10 (32.3%) |
| 65 to 74 Years | 34 (100.0%) | 10 (29.4%) |
| 75 Years and over | 16 (100.0%) | 16 (100.0%) |
| Total | 76 (45.5%) | 43 (25.8%) |
Disability Status by Sex by Age in Farmington
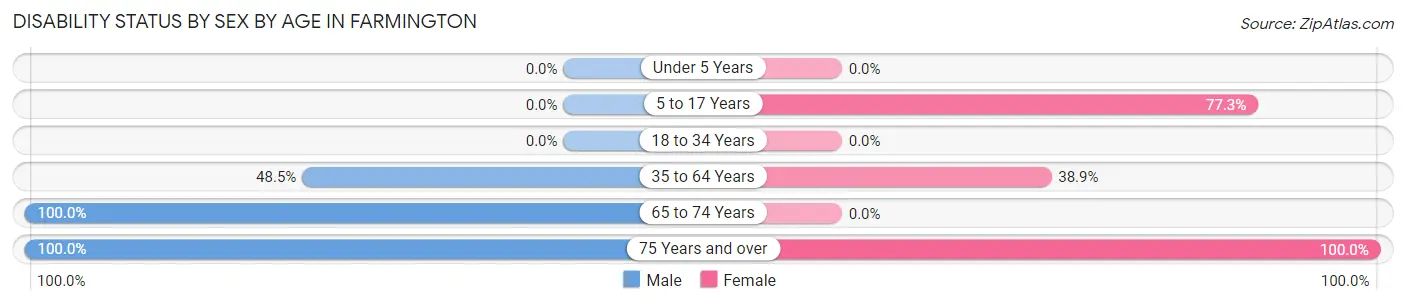
| Age Bracket | Male | Female |
| Under 5 Years | 0 (0.0%) | 0 (0.0%) |
| 5 to 17 Years | 0 (0.0%) | 34 (77.3%) |
| 18 to 34 Years | 0 (0.0%) | 0 (0.0%) |
| 35 to 64 Years | 16 (48.5%) | 7 (38.9%) |
| 65 to 74 Years | 10 (100.0%) | 0 (0.0%) |
| 75 Years and over | 8 (100.0%) | 8 (100.0%) |
Disability Class by Sex by Age in Farmington
Disability Class: Hearing Difficulty
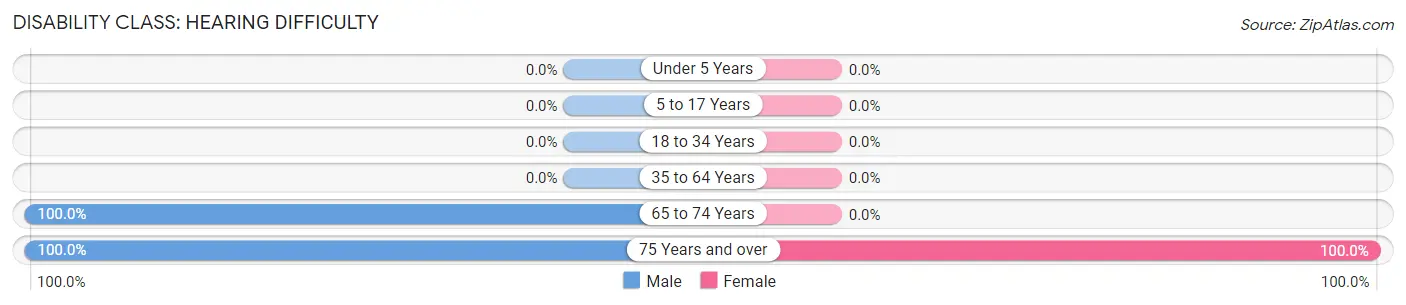
| Age Bracket | Male | Female |
| Under 5 Years | 0 (0.0%) | 0 (0.0%) |
| 5 to 17 Years | 0 (0.0%) | 0 (0.0%) |
| 18 to 34 Years | 0 (0.0%) | 0 (0.0%) |
| 35 to 64 Years | 0 (0.0%) | 0 (0.0%) |
| 65 to 74 Years | 10 (100.0%) | 0 (0.0%) |
| 75 Years and over | 8 (100.0%) | 8 (100.0%) |
Disability Class: Vision Difficulty
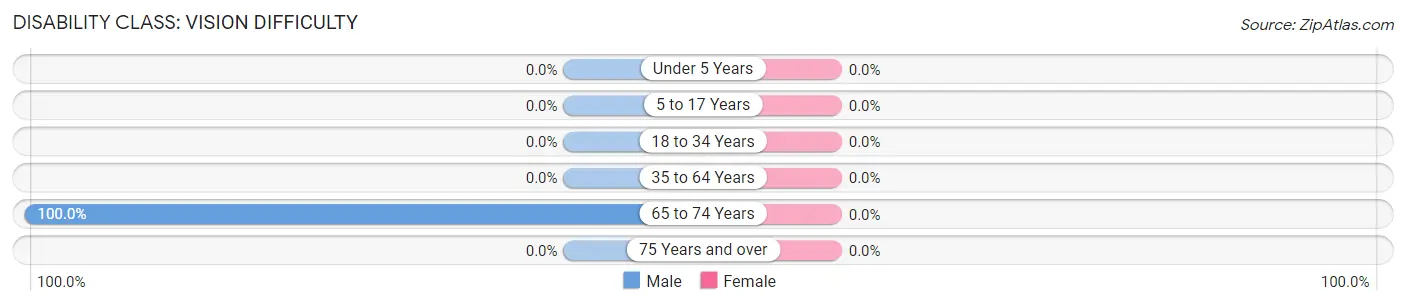
| Age Bracket | Male | Female |
| Under 5 Years | 0 (0.0%) | 0 (0.0%) |
| 5 to 17 Years | 0 (0.0%) | 0 (0.0%) |
| 18 to 34 Years | 0 (0.0%) | 0 (0.0%) |
| 35 to 64 Years | 0 (0.0%) | 0 (0.0%) |
| 65 to 74 Years | 10 (100.0%) | 0 (0.0%) |
| 75 Years and over | 0 (0.0%) | 0 (0.0%) |
Disability Class: Cognitive Difficulty
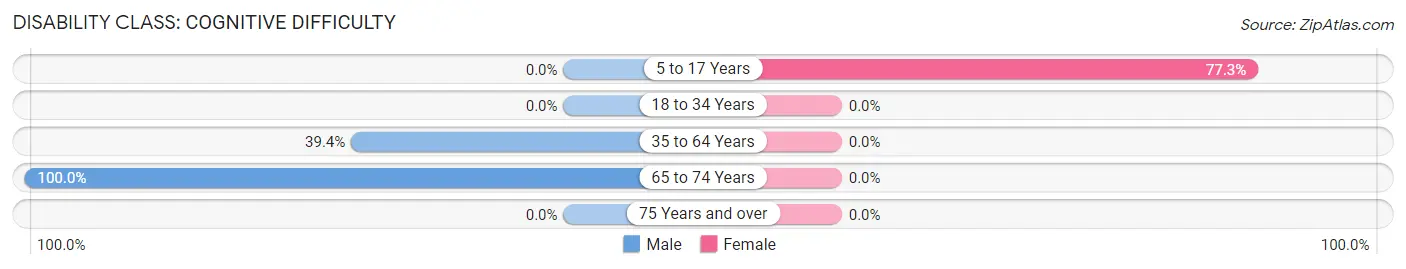
| Age Bracket | Male | Female |
| 5 to 17 Years | 0 (0.0%) | 34 (77.3%) |
| 18 to 34 Years | 0 (0.0%) | 0 (0.0%) |
| 35 to 64 Years | 13 (39.4%) | 0 (0.0%) |
| 65 to 74 Years | 10 (100.0%) | 0 (0.0%) |
| 75 Years and over | 0 (0.0%) | 0 (0.0%) |
Disability Class: Ambulatory Difficulty
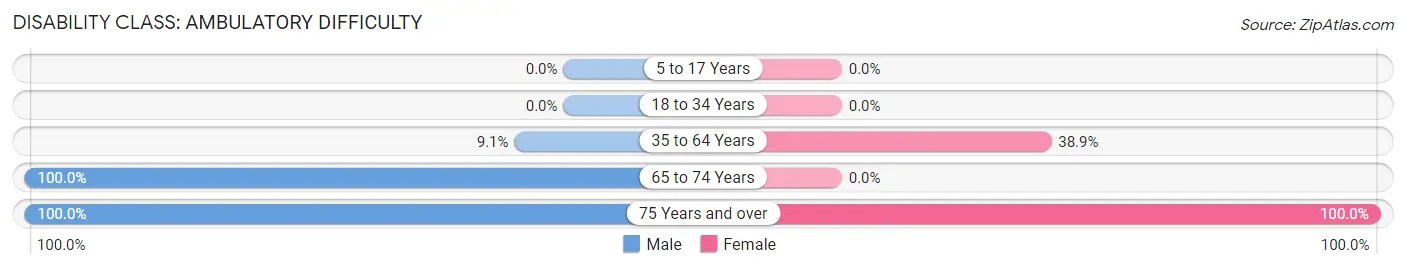
| Age Bracket | Male | Female |
| 5 to 17 Years | 0 (0.0%) | 0 (0.0%) |
| 18 to 34 Years | 0 (0.0%) | 0 (0.0%) |
| 35 to 64 Years | 3 (9.1%) | 7 (38.9%) |
| 65 to 74 Years | 10 (100.0%) | 0 (0.0%) |
| 75 Years and over | 8 (100.0%) | 8 (100.0%) |
Disability Class: Self-Care Difficulty
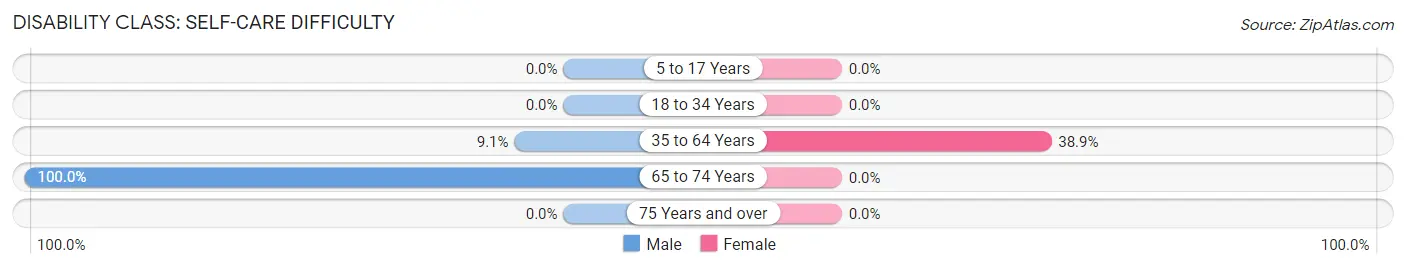
| Age Bracket | Male | Female |
| 5 to 17 Years | 0 (0.0%) | 0 (0.0%) |
| 18 to 34 Years | 0 (0.0%) | 0 (0.0%) |
| 35 to 64 Years | 3 (9.1%) | 7 (38.9%) |
| 65 to 74 Years | 10 (100.0%) | 0 (0.0%) |
| 75 Years and over | 0 (0.0%) | 0 (0.0%) |
Technology Access in Farmington
Computing Device Access in Farmington
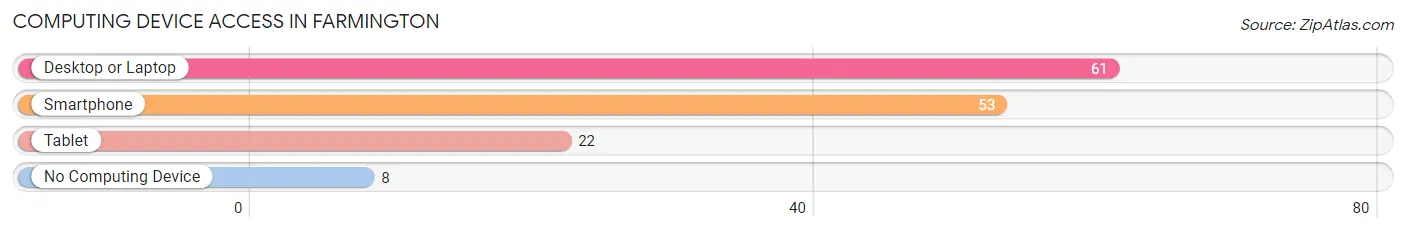
| Device Type | # Households | % Households |
| Desktop or Laptop | 61 | 78.2% |
| Smartphone | 53 | 67.9% |
| Tablet | 22 | 28.2% |
| No Computing Device | 8 | 10.3% |
| Total | 78 | 100.0% |
Internet Access in Farmington
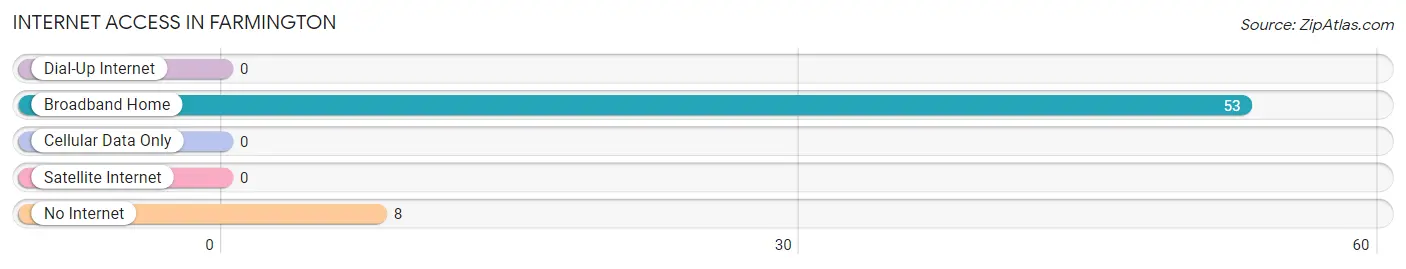
| Internet Type | # Households | % Households |
| Dial-Up Internet | 0 | 0.0% |
| Broadband Home | 53 | 67.9% |
| Cellular Data Only | 0 | 0.0% |
| Satellite Internet | 0 | 0.0% |
| No Internet | 8 | 10.3% |
| Total | 78 | 100.0% |
Farmington Summary
History
The city of Farmington, Kentucky is located in the western part of the state, in the foothills of the Appalachian Mountains. It is situated in the county of Union, and is the county seat. The city was founded in 1819, and was originally known as Uniontown. The name was changed to Farmington in 1820, in honor of the local farming community.
The city was an important stop on the Louisville and Nashville Railroad, which was built in the late 1800s. This allowed the city to become a major hub for the transportation of goods and services. The railroad also helped to spur the growth of the city, as it allowed for the easy transportation of goods and services to and from the city.
The city was also home to a number of important industries, including coal mining, timber, and manufacturing. The coal mining industry was particularly important to the city, as it provided jobs and income for many of the city’s residents. The timber industry was also important, as it provided the raw materials for the manufacturing industry.
The city was also home to a number of important educational institutions, including the University of Kentucky, which was founded in 1865. The university was an important part of the city’s economy, as it provided jobs and income for many of the city’s residents.
Geography
Farmington is located in the western part of Kentucky, in the foothills of the Appalachian Mountains. The city is situated in the county of Union, and is the county seat. The city is located at the intersection of US Route 60 and Kentucky Route 15.
The city is located in a hilly region, with the highest point being the summit of the nearby Pine Mountain. The city is located in a temperate climate, with hot summers and cold winters. The average annual temperature is around 60 degrees Fahrenheit.
The city is located near a number of important rivers, including the Cumberland River, the Kentucky River, and the Big South Fork of the Cumberland River. These rivers provide the city with a number of recreational opportunities, including fishing, boating, and swimming.
Economy
The economy of Farmington is largely based on agriculture and manufacturing. The city is home to a number of important industries, including coal mining, timber, and manufacturing. The coal mining industry was particularly important to the city, as it provided jobs and income for many of the city’s residents. The timber industry was also important, as it provided the raw materials for the manufacturing industry.
The city is also home to a number of important educational institutions, including the University of Kentucky, which was founded in 1865. The university is an important part of the city’s economy, as it provides jobs and income for many of the city’s residents.
Demographics
As of the 2010 census, the population of Farmington was 2,845. The racial makeup of the city was 95.3% White, 1.2% African American, 0.3% Native American, 0.3% Asian, 0.1% Pacific Islander, and 2.8% from other races. The median household income was $37,917, and the median family income was $45,917.
The city is home to a number of important religious institutions, including the First Baptist Church, the First Presbyterian Church, and the Church of Christ. The city is also home to a number of important educational institutions, including the University of Kentucky, which was founded in 1865.
Conclusion
Farmington, Kentucky is a small city located in the western part of the state, in the foothills of the Appalachian Mountains. The city was founded in 1819, and was originally known as Uniontown. The city is home to a number of important industries, including coal mining, timber, and manufacturing. The city is also home to a number of important educational institutions, including the University of Kentucky, which was founded in 1865. The city has a population of 2,845, and the median household income is $37,917. The city is home to a number of important religious institutions, and is an important part of the local economy.
Common Questions
What is Per Capita Income in Farmington?
Per Capita income in Farmington is $14,553.
What is Inequality or Gini Index in Farmington?
Inequality or Gini Index in Farmington is 0.42.
What is the Total Population of Farmington?
Total Population of Farmington is 167.
What is the Total Male Population of Farmington?
Total Male Population of Farmington is 51.
What is the Total Female Population of Farmington?
Total Female Population of Farmington is 116.
What is the Ratio of Males per 100 Females in Farmington?
There are 43.97 Males per 100 Females in Farmington.
What is the Ratio of Females per 100 Males in Farmington?
There are 227.45 Females per 100 Males in Farmington.
What is the Median Population Age in Farmington?
Median Population Age in Farmington is 52.6 Years.
What is the Average Family Size in Farmington
Average Family Size in Farmington is 3.3 People.
What is the Average Household Size in Farmington
Average Household Size in Farmington is 2.1 People.
How Large is the Labor Force in Farmington?
There are 47 People in the Labor Forcein in Farmington.
What is the Percentage of People in the Labor Force in Farmington?
39.2% of People are in the Labor Force in Farmington.