Zip Codes with the Highest Poverty Level Among Children Under the Age of 5 in Kentucky
RELATED REPORTS & OPTIONS
Highest Poverty | Child 0-5
Kentucky
Compare Zip Codes
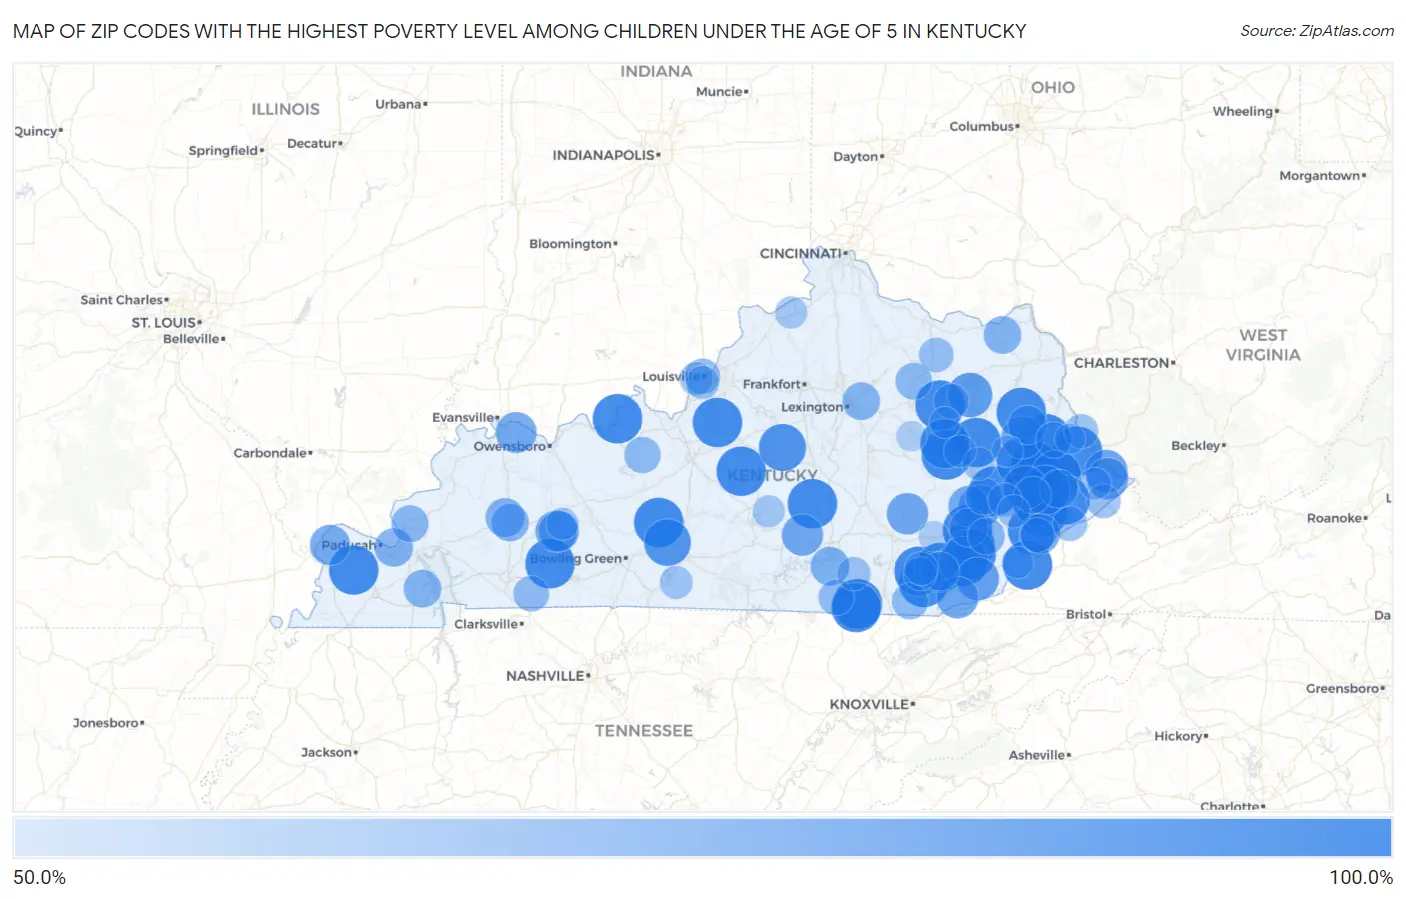
Map of Zip Codes with the Highest Poverty Level Among Children Under the Age of 5 in Kentucky
50.0%
100.0%
Zip Codes with the Highest Poverty Level Among Children Under the Age of 5 in Kentucky
| Zip Code | Child Poverty | vs State | vs National | |
| 1. | 42635 | 100.0% | 23.3%(+76.7)#1 | 18.1%(+81.9)#6 |
| 2. | 42649 | 100.0% | 23.3%(+76.7)#2 | 18.1%(+81.9)#46 |
| 3. | 42259 | 100.0% | 23.3%(+76.7)#3 | 18.1%(+81.9)#72 |
| 4. | 41332 | 100.0% | 23.3%(+76.7)#4 | 18.1%(+81.9)#84 |
| 5. | 40868 | 100.0% | 23.3%(+76.7)#5 | 18.1%(+81.9)#86 |
| 6. | 40170 | 100.0% | 23.3%(+76.7)#6 | 18.1%(+81.9)#97 |
| 7. | 41824 | 100.0% | 23.3%(+76.7)#7 | 18.1%(+81.9)#100 |
| 8. | 41250 | 100.0% | 23.3%(+76.7)#8 | 18.1%(+81.9)#101 |
| 9. | 40358 | 100.0% | 23.3%(+76.7)#9 | 18.1%(+81.9)#103 |
| 10. | 41260 | 100.0% | 23.3%(+76.7)#10 | 18.1%(+81.9)#116 |
| 11. | 42035 | 100.0% | 23.3%(+76.7)#11 | 18.1%(+81.9)#133 |
| 12. | 40903 | 100.0% | 23.3%(+76.7)#12 | 18.1%(+81.9)#137 |
| 13. | 40855 | 100.0% | 23.3%(+76.7)#13 | 18.1%(+81.9)#147 |
| 14. | 41828 | 100.0% | 23.3%(+76.7)#14 | 18.1%(+81.9)#185 |
| 15. | 41616 | 100.0% | 23.3%(+76.7)#15 | 18.1%(+81.9)#201 |
| 16. | 41365 | 100.0% | 23.3%(+76.7)#16 | 18.1%(+81.9)#212 |
| 17. | 41159 | 100.0% | 23.3%(+76.7)#17 | 18.1%(+81.9)#219 |
| 18. | 40949 | 100.0% | 23.3%(+76.7)#18 | 18.1%(+81.9)#239 |
| 19. | 41317 | 100.0% | 23.3%(+76.7)#19 | 18.1%(+81.9)#243 |
| 20. | 40110 | 100.0% | 23.3%(+76.7)#20 | 18.1%(+81.9)#251 |
| 21. | 41766 | 100.0% | 23.3%(+76.7)#21 | 18.1%(+81.9)#254 |
| 22. | 41360 | 100.0% | 23.3%(+76.7)#22 | 18.1%(+81.9)#257 |
| 23. | 42280 | 100.0% | 23.3%(+76.7)#23 | 18.1%(+81.9)#265 |
| 24. | 40982 | 100.0% | 23.3%(+76.7)#24 | 18.1%(+81.9)#274 |
| 25. | 41464 | 100.0% | 23.3%(+76.7)#25 | 18.1%(+81.9)#298 |
| 26. | 41861 | 100.0% | 23.3%(+76.7)#26 | 18.1%(+81.9)#300 |
| 27. | 41607 | 100.0% | 23.3%(+76.7)#27 | 18.1%(+81.9)#310 |
| 28. | 41663 | 100.0% | 23.3%(+76.7)#28 | 18.1%(+81.9)#338 |
| 29. | 42541 | 100.0% | 23.3%(+76.7)#29 | 18.1%(+81.9)#347 |
| 30. | 41560 | 100.0% | 23.3%(+76.7)#30 | 18.1%(+81.9)#376 |
| 31. | 41651 | 100.0% | 23.3%(+76.7)#31 | 18.1%(+81.9)#436 |
| 32. | 40858 | 100.0% | 23.3%(+76.7)#32 | 18.1%(+81.9)#448 |
| 33. | 40874 | 100.0% | 23.3%(+76.7)#33 | 18.1%(+81.9)#495 |
| 34. | 40062 | 100.0% | 23.3%(+76.7)#34 | 18.1%(+81.9)#507 |
| 35. | 40040 | 94.7% | 23.3%(+71.4)#35 | 18.1%(+76.7)#584 |
| 36. | 42160 | 93.9% | 23.3%(+70.6)#36 | 18.1%(+75.9)#593 |
| 37. | 40313 | 89.0% | 23.3%(+65.7)#37 | 18.1%(+70.9)#642 |
| 38. | 41640 | 86.6% | 23.3%(+63.3)#38 | 18.1%(+68.5)#681 |
| 39. | 40854 | 85.5% | 23.3%(+62.1)#39 | 18.1%(+67.4)#696 |
| 40. | 41531 | 84.6% | 23.3%(+61.3)#40 | 18.1%(+66.6)#714 |
| 41. | 41727 | 84.5% | 23.3%(+61.2)#41 | 18.1%(+66.4)#719 |
| 42. | 41238 | 84.2% | 23.3%(+60.9)#42 | 18.1%(+66.1)#729 |
| 43. | 40856 | 82.8% | 23.3%(+59.5)#43 | 18.1%(+64.7)#751 |
| 44. | 42321 | 82.4% | 23.3%(+59.0)#44 | 18.1%(+64.3)#763 |
| 45. | 41558 | 82.1% | 23.3%(+58.8)#45 | 18.1%(+64.1)#767 |
| 46. | 40402 | 82.0% | 23.3%(+58.7)#46 | 18.1%(+64.0)#769 |
| 47. | 42565 | 81.8% | 23.3%(+58.5)#47 | 18.1%(+63.8)#771 |
| 48. | 42451 | 80.6% | 23.3%(+57.3)#48 | 18.1%(+62.6)#798 |
| 49. | 41745 | 80.5% | 23.3%(+57.1)#49 | 18.1%(+62.4)#801 |
| 50. | 42323 | 80.0% | 23.3%(+56.7)#50 | 18.1%(+61.9)#809 |
| 51. | 42024 | 79.2% | 23.3%(+55.9)#51 | 18.1%(+61.2)#839 |
| 52. | 41815 | 78.8% | 23.3%(+55.5)#52 | 18.1%(+60.7)#849 |
| 53. | 42518 | 76.4% | 23.3%(+53.1)#53 | 18.1%(+58.4)#913 |
| 54. | 42410 | 76.3% | 23.3%(+53.0)#54 | 18.1%(+58.3)#918 |
| 55. | 41219 | 76.0% | 23.3%(+52.7)#55 | 18.1%(+57.9)#926 |
| 56. | 40935 | 75.9% | 23.3%(+52.6)#56 | 18.1%(+57.8)#929 |
| 57. | 41749 | 75.7% | 23.3%(+52.4)#57 | 18.1%(+57.6)#940 |
| 58. | 42058 | 75.3% | 23.3%(+52.0)#58 | 18.1%(+57.3)#947 |
| 59. | 41635 | 75.0% | 23.3%(+51.7)#59 | 18.1%(+56.9)#952 |
| 60. | 42440 | 74.0% | 23.3%(+50.7)#60 | 18.1%(+56.0)#1,008 |
| 61. | 41141 | 73.9% | 23.3%(+50.5)#61 | 18.1%(+55.8)#1,012 |
| 62. | 42048 | 73.8% | 23.3%(+50.4)#62 | 18.1%(+55.7)#1,017 |
| 63. | 40516 | 73.5% | 23.3%(+50.2)#63 | 18.1%(+55.5)#1,027 |
| 64. | 41839 | 72.2% | 23.3%(+48.9)#64 | 18.1%(+54.2)#1,076 |
| 65. | 41776 | 72.1% | 23.3%(+48.8)#65 | 18.1%(+54.1)#1,079 |
| 66. | 42028 | 72.0% | 23.3%(+48.7)#66 | 18.1%(+53.9)#1,084 |
| 67. | 41348 | 71.8% | 23.3%(+48.5)#67 | 18.1%(+53.8)#1,093 |
| 68. | 40374 | 71.6% | 23.3%(+48.3)#68 | 18.1%(+53.6)#1,095 |
| 69. | 40140 | 70.7% | 23.3%(+47.4)#69 | 18.1%(+52.7)#1,126 |
| 70. | 40763 | 70.7% | 23.3%(+47.4)#70 | 18.1%(+52.7)#1,127 |
| 71. | 41204 | 69.9% | 23.3%(+46.6)#71 | 18.1%(+51.8)#1,153 |
| 72. | 42286 | 69.3% | 23.3%(+46.0)#72 | 18.1%(+51.2)#1,178 |
| 73. | 42647 | 68.9% | 23.3%(+45.6)#73 | 18.1%(+50.9)#1,197 |
| 74. | 40203 | 68.5% | 23.3%(+45.2)#74 | 18.1%(+50.5)#1,209 |
| 75. | 40371 | 67.6% | 23.3%(+44.3)#75 | 18.1%(+49.6)#1,246 |
| 76. | 41041 | 67.0% | 23.3%(+43.7)#76 | 18.1%(+48.9)#1,271 |
| 77. | 41563 | 66.7% | 23.3%(+43.3)#77 | 18.1%(+48.6)#1,300 |
| 78. | 41858 | 66.1% | 23.3%(+42.8)#78 | 18.1%(+48.1)#1,336 |
| 79. | 41267 | 65.9% | 23.3%(+42.5)#79 | 18.1%(+47.8)#1,349 |
| 80. | 41548 | 65.5% | 23.3%(+42.2)#80 | 18.1%(+47.5)#1,362 |
| 81. | 41722 | 65.0% | 23.3%(+41.7)#81 | 18.1%(+46.9)#1,380 |
| 82. | 42634 | 64.6% | 23.3%(+41.3)#82 | 18.1%(+46.6)#1,404 |
| 83. | 40211 | 64.3% | 23.3%(+40.9)#83 | 18.1%(+46.2)#1,435 |
| 84. | 40208 | 64.2% | 23.3%(+40.9)#84 | 18.1%(+46.2)#1,436 |
| 85. | 40906 | 64.1% | 23.3%(+40.8)#85 | 18.1%(+46.0)#1,441 |
| 86. | 40923 | 63.9% | 23.3%(+40.6)#86 | 18.1%(+45.9)#1,455 |
| 87. | 42123 | 63.5% | 23.3%(+40.2)#87 | 18.1%(+45.4)#1,476 |
| 88. | 41725 | 62.6% | 23.3%(+39.3)#88 | 18.1%(+44.6)#1,519 |
| 89. | 41385 | 62.5% | 23.3%(+39.2)#89 | 18.1%(+44.4)#1,526 |
| 90. | 42337 | 61.8% | 23.3%(+38.4)#90 | 18.1%(+43.7)#1,574 |
| 91. | 41083 | 61.7% | 23.3%(+38.4)#91 | 18.1%(+43.7)#1,577 |
| 92. | 41539 | 61.7% | 23.3%(+38.4)#92 | 18.1%(+43.6)#1,580 |
| 93. | 41301 | 61.7% | 23.3%(+38.3)#93 | 18.1%(+43.6)#1,581 |
| 94. | 42733 | 61.5% | 23.3%(+38.2)#94 | 18.1%(+43.5)#1,588 |
| 95. | 40823 | 60.1% | 23.3%(+36.8)#95 | 18.1%(+42.0)#1,668 |
| 96. | 40322 | 59.8% | 23.3%(+36.5)#96 | 18.1%(+41.7)#1,713 |
| 97. | 41465 | 59.5% | 23.3%(+36.2)#97 | 18.1%(+41.5)#1,724 |
| 98. | 40962 | 58.0% | 23.3%(+34.7)#98 | 18.1%(+39.9)#1,829 |
| 99. | 41224 | 58.0% | 23.3%(+34.6)#99 | 18.1%(+39.9)#1,830 |
| 100. | 40312 | 57.7% | 23.3%(+34.4)#100 | 18.1%(+39.6)#1,853 |
Common Questions
What are the Top 10 Zip Codes with the Highest Poverty Level Among Children Under the Age of 5 in Kentucky?
Top 10 Zip Codes with the Highest Poverty Level Among Children Under the Age of 5 in Kentucky are:
What zip code has the Highest Poverty Level Among Children Under the Age of 5 in Kentucky?
42635 has the Highest Poverty Level Among Children Under the Age of 5 in Kentucky with 100.0%.
What is the Poverty Level Among Children Under the Age of 5 in the State of Kentucky?
Poverty Level Among Children Under the Age of 5 in Kentucky is 23.3%.
What is the Poverty Level Among Children Under the Age of 5 in the United States?
Poverty Level Among Children Under the Age of 5 in the United States is 18.1%.