Irvington, KY Map & Demographics
Irvington Map
Irvington Overview
$24,924
PER CAPITA INCOME
$49,167
AVG FAMILY INCOME
$48,714
AVG HOUSEHOLD INCOME
57.4%
WAGE / INCOME GAP [ % ]
42.6¢/ $1
WAGE / INCOME GAP [ $ ]
$13,709
FAMILY INCOME DEFICIT
0.37
INEQUALITY / GINI INDEX
1,387
TOTAL POPULATION
578
MALE POPULATION
809
FEMALE POPULATION
71.45
MALES / 100 FEMALES
139.97
FEMALES / 100 MALES
38.5
MEDIAN AGE
3.2
AVG FAMILY SIZE
2.4
AVG HOUSEHOLD SIZE
660
LABOR FORCE [ PEOPLE ]
62.9%
PERCENT IN LABOR FORCE
11.4%
UNEMPLOYMENT RATE
Irvington Zip Codes
Irvington Area Codes
Income in Irvington
Income Overview in Irvington
Per Capita Income in Irvington is $24,924, while median incomes of families and households are $49,167 and $48,714 respectively.
| Characteristic | Number | Measure |
| Per Capita Income | 1,387 | $24,924 |
| Median Family Income | 344 | $49,167 |
| Mean Family Income | 344 | $59,724 |
| Median Household Income | 575 | $48,714 |
| Mean Household Income | 575 | $55,055 |
| Income Deficit | 344 | $13,709 |
| Wage / Income Gap (%) | 1,387 | 57.44% |
| Wage / Income Gap ($) | 1,387 | 42.56¢ per $1 |
| Gini / Inequality Index | 1,387 | 0.37 |
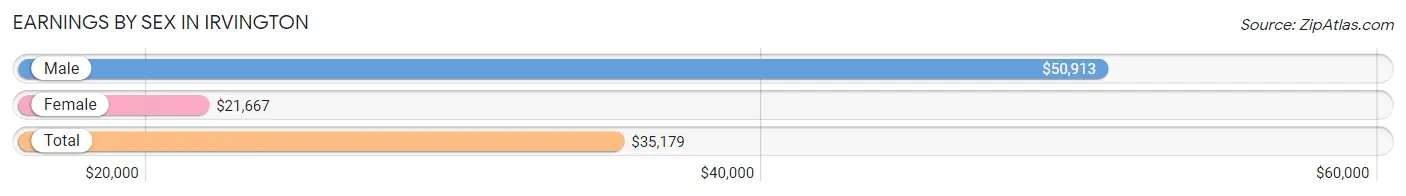
Earnings by Sex in Irvington
Average Earnings in Irvington are $35,179, $50,913 for men and $21,667 for women, a difference of 57.4%.
| Sex | Number | Average Earnings |
| Male | 360 (52.2%) | $50,913 |
| Female | 330 (47.8%) | $21,667 |
| Total | 690 (100.0%) | $35,179 |
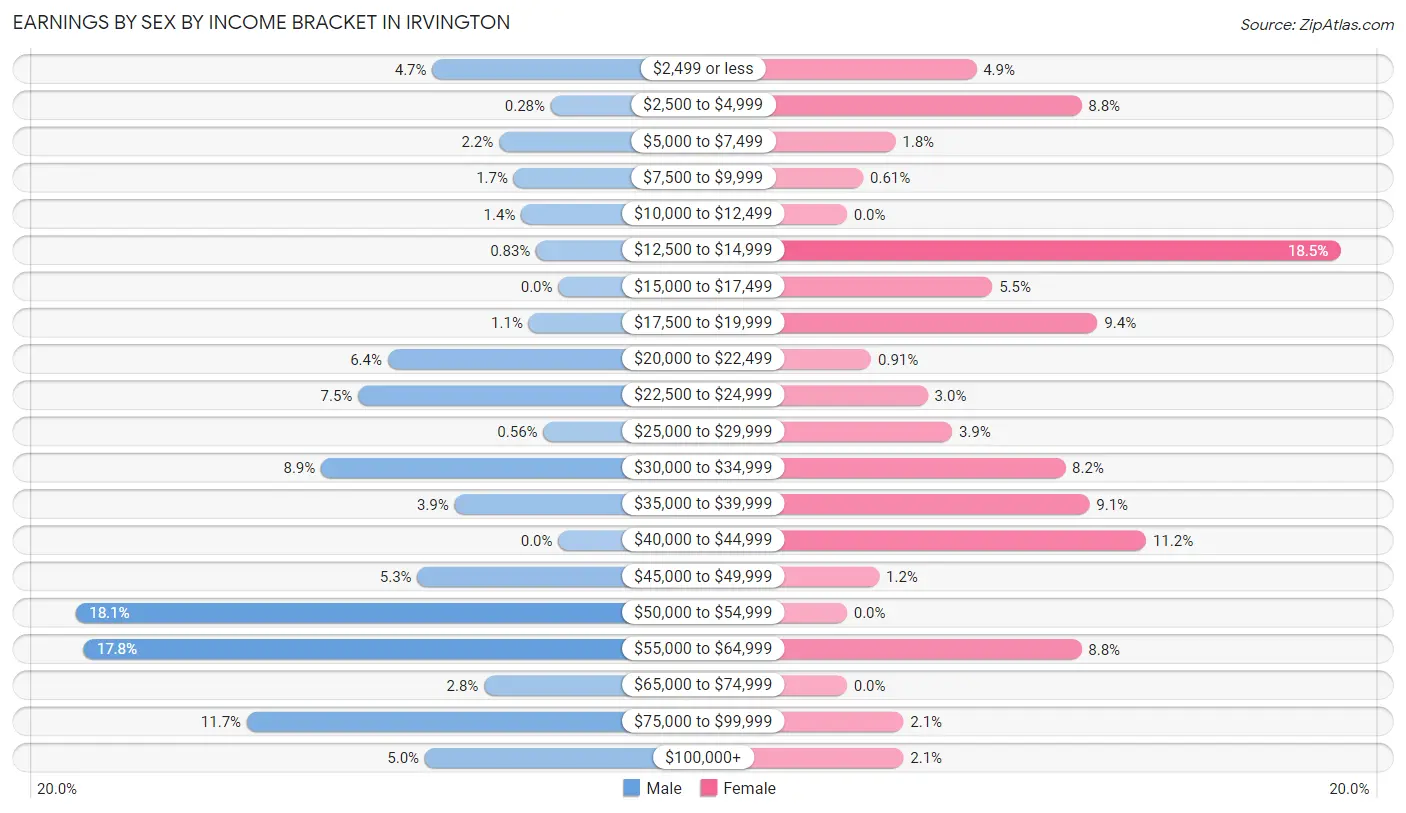
Earnings by Sex by Income Bracket in Irvington
The most common earnings brackets in Irvington are $50,000 to $54,999 for men (65 | 18.1%) and $12,500 to $14,999 for women (61 | 18.5%).
| Income | Male | Female |
| $2,499 or less | 17 (4.7%) | 16 (4.9%) |
| $2,500 to $4,999 | 1 (0.3%) | 29 (8.8%) |
| $5,000 to $7,499 | 8 (2.2%) | 6 (1.8%) |
| $7,500 to $9,999 | 6 (1.7%) | 2 (0.6%) |
| $10,000 to $12,499 | 5 (1.4%) | 0 (0.0%) |
| $12,500 to $14,999 | 3 (0.8%) | 61 (18.5%) |
| $15,000 to $17,499 | 0 (0.0%) | 18 (5.4%) |
| $17,500 to $19,999 | 4 (1.1%) | 31 (9.4%) |
| $20,000 to $22,499 | 23 (6.4%) | 3 (0.9%) |
| $22,500 to $24,999 | 27 (7.5%) | 10 (3.0%) |
| $25,000 to $29,999 | 2 (0.6%) | 13 (3.9%) |
| $30,000 to $34,999 | 32 (8.9%) | 27 (8.2%) |
| $35,000 to $39,999 | 14 (3.9%) | 30 (9.1%) |
| $40,000 to $44,999 | 0 (0.0%) | 37 (11.2%) |
| $45,000 to $49,999 | 19 (5.3%) | 4 (1.2%) |
| $50,000 to $54,999 | 65 (18.1%) | 0 (0.0%) |
| $55,000 to $64,999 | 64 (17.8%) | 29 (8.8%) |
| $65,000 to $74,999 | 10 (2.8%) | 0 (0.0%) |
| $75,000 to $99,999 | 42 (11.7%) | 7 (2.1%) |
| $100,000+ | 18 (5.0%) | 7 (2.1%) |
| Total | 360 (100.0%) | 330 (100.0%) |
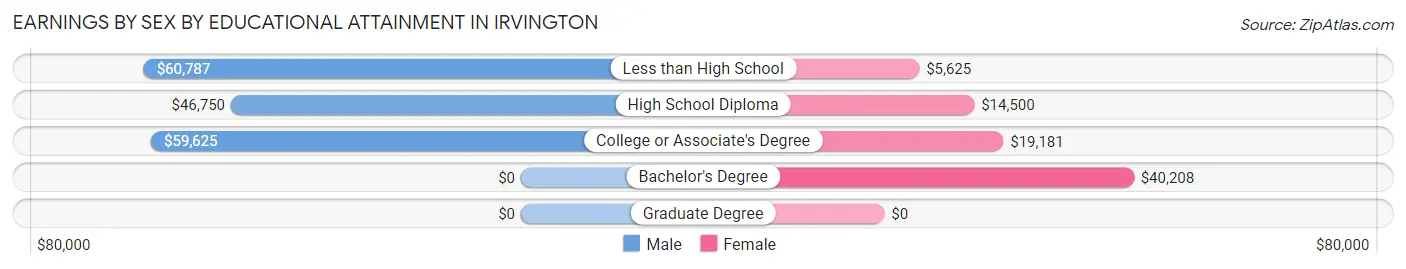
Earnings by Sex by Educational Attainment in Irvington
Average earnings in Irvington are $51,923 for men and $18,266 for women, a difference of 64.8%. Men with an educational attainment of less than high school enjoy the highest average annual earnings of $60,787, while those with high school diploma education earn the least with $46,750. Women with an educational attainment of bachelor's degree earn the most with the average annual earnings of $40,208, while those with less than high school education have the smallest earnings of $5,625.
| Educational Attainment | Male Income | Female Income |
| Less than High School | $60,787 | $5,625 |
| High School Diploma | $46,750 | $14,500 |
| College or Associate's Degree | $59,625 | $19,181 |
| Bachelor's Degree | - | - |
| Graduate Degree | - | - |
| Total | $51,923 | $18,266 |
Family Income in Irvington
Family Income Brackets in Irvington
According to the Irvington family income data, there are 105 families falling into the $35,000 to $49,999 income range, which is the most common income bracket and makes up 30.5% of all families.
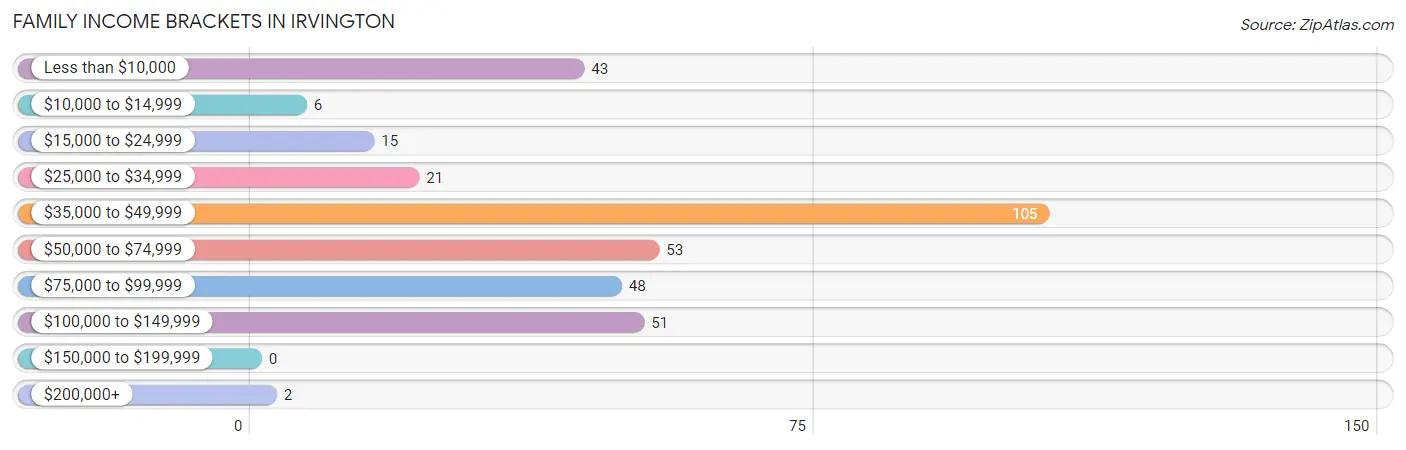
| Income Bracket | # Families | % Families |
| Less than $10,000 | 43 | 12.5% |
| $10,000 to $14,999 | 6 | 1.7% |
| $15,000 to $24,999 | 15 | 4.4% |
| $25,000 to $34,999 | 21 | 6.1% |
| $35,000 to $49,999 | 105 | 30.5% |
| $50,000 to $74,999 | 53 | 15.4% |
| $75,000 to $99,999 | 48 | 14.0% |
| $100,000 to $149,999 | 51 | 14.8% |
| $150,000 to $199,999 | 0 | 0.0% |
| $200,000+ | 2 | 0.6% |
Family Income by Famaliy Size in Irvington
3-person families (58 | 16.9%) account for the highest median family income in Irvington with $68,750 per family, while 2-person families (196 | 57.0%) have the highest median income of $24,653 per family member.
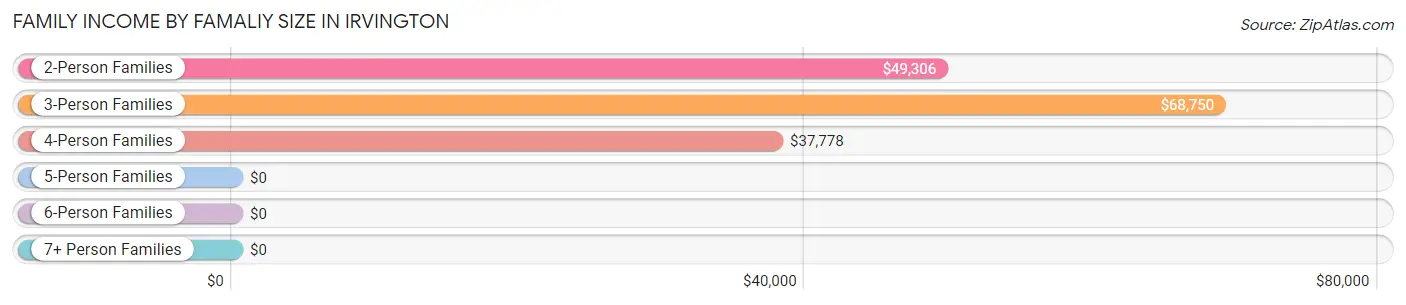
| Income Bracket | # Families | Median Income |
| 2-Person Families | 196 (57.0%) | $49,306 |
| 3-Person Families | 58 (16.9%) | $68,750 |
| 4-Person Families | 42 (12.2%) | $37,778 |
| 5-Person Families | 25 (7.3%) | $0 |
| 6-Person Families | 15 (4.4%) | $0 |
| 7+ Person Families | 8 (2.3%) | $0 |
| Total | 344 (100.0%) | $49,167 |
Family Income by Number of Earners in Irvington
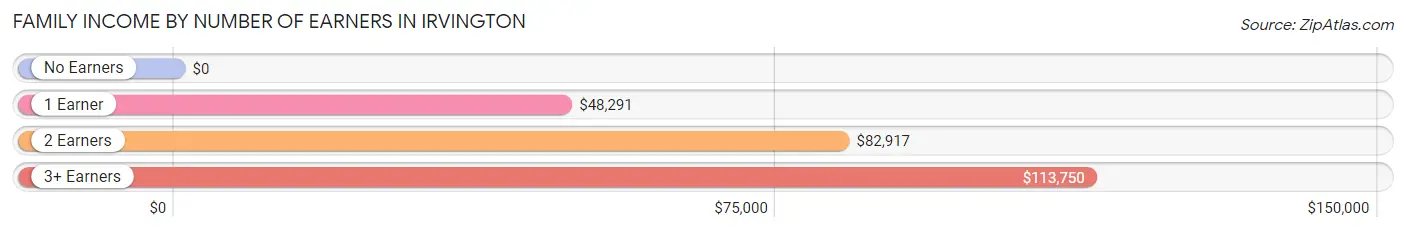
| Number of Earners | # Families | Median Income |
| No Earners | 57 (16.6%) | $0 |
| 1 Earner | 157 (45.6%) | $48,291 |
| 2 Earners | 116 (33.7%) | $82,917 |
| 3+ Earners | 14 (4.1%) | $113,750 |
| Total | 344 (100.0%) | $49,167 |
Household Income in Irvington
Household Income Brackets in Irvington
With 167 households falling in the category, the $35,000 to $49,999 income range is the most frequent in Irvington, accounting for 29.0% of all households.
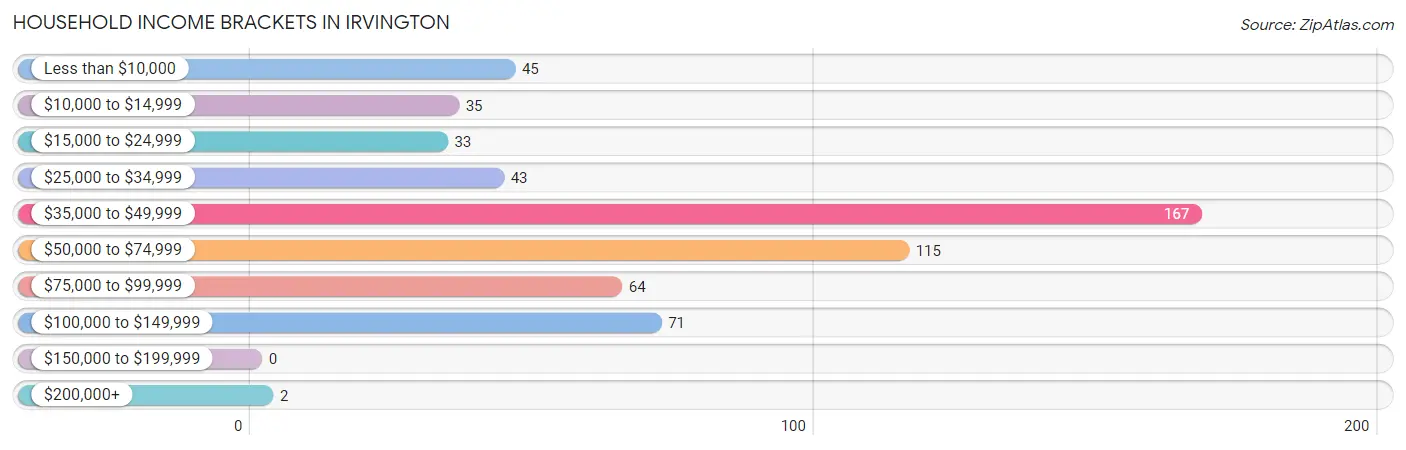
| Income Bracket | # Households | % Households |
| Less than $10,000 | 45 | 7.8% |
| $10,000 to $14,999 | 35 | 6.1% |
| $15,000 to $24,999 | 33 | 5.7% |
| $25,000 to $34,999 | 43 | 7.5% |
| $35,000 to $49,999 | 167 | 29.0% |
| $50,000 to $74,999 | 115 | 20.0% |
| $75,000 to $99,999 | 64 | 11.1% |
| $100,000 to $149,999 | 71 | 12.3% |
| $150,000 to $199,999 | 0 | 0.0% |
| $200,000+ | 2 | 0.3% |
Household Income by Householder Age in Irvington
The median household income in Irvington is $48,714, with the highest median household income of $52,216 found in the 45 to 64 years age bracket for the primary householder. A total of 195 households (33.9%) fall into this category. Meanwhile, the 15 to 24 years age bracket for the primary householder has the lowest median household income of $0, with 31 households (5.4%) in this group.
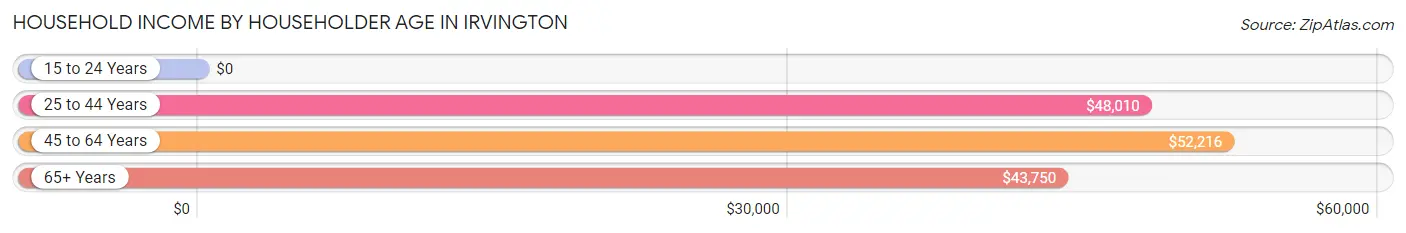
| Income Bracket | # Households | Median Income |
| 15 to 24 Years | 31 (5.4%) | $0 |
| 25 to 44 Years | 232 (40.4%) | $48,010 |
| 45 to 64 Years | 195 (33.9%) | $52,216 |
| 65+ Years | 117 (20.3%) | $43,750 |
| Total | 575 (100.0%) | $48,714 |
Poverty in Irvington
Income Below Poverty by Sex and Age in Irvington
With 17.8% poverty level for males and 31.4% for females among the residents of Irvington, under 5 year old males and 6 to 11 year old females are the most vulnerable to poverty, with 7 males (35.0%) and 32 females (91.4%) in their respective age groups living below the poverty level.
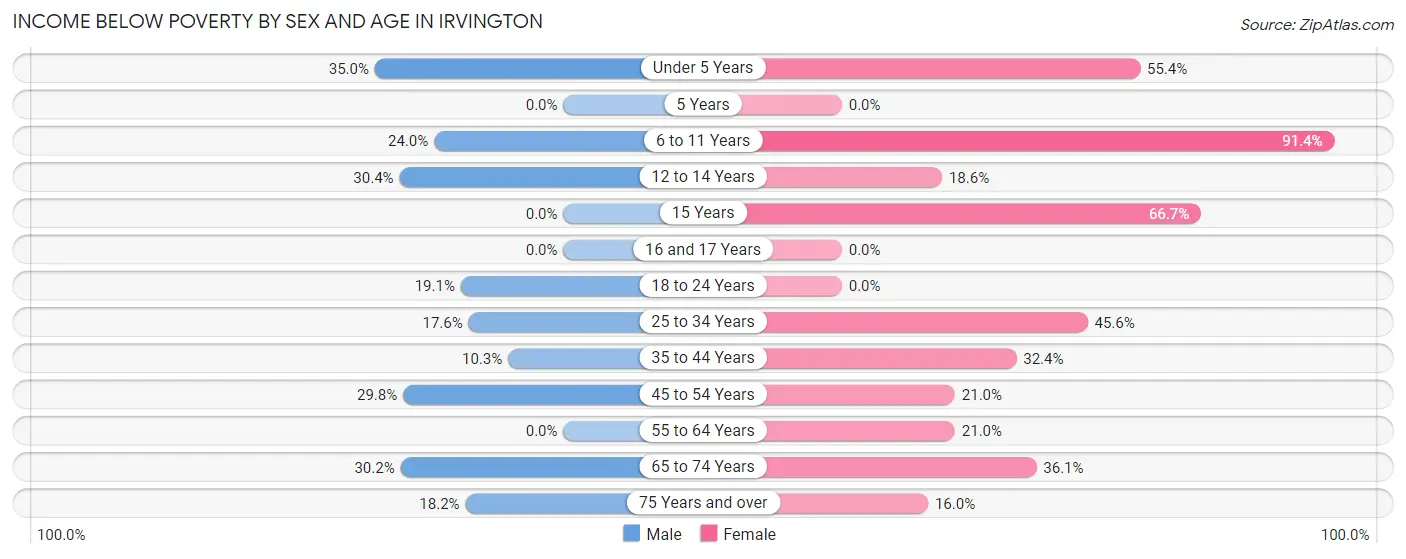
| Age Bracket | Male | Female |
| Under 5 Years | 7 (35.0%) | 62 (55.4%) |
| 5 Years | 0 (0.0%) | 0 (0.0%) |
| 6 to 11 Years | 12 (24.0%) | 32 (91.4%) |
| 12 to 14 Years | 7 (30.4%) | 16 (18.6%) |
| 15 Years | 0 (0.0%) | 4 (66.7%) |
| 16 and 17 Years | 0 (0.0%) | 0 (0.0%) |
| 18 to 24 Years | 8 (19.1%) | 0 (0.0%) |
| 25 to 34 Years | 19 (17.6%) | 26 (45.6%) |
| 35 to 44 Years | 8 (10.3%) | 46 (32.4%) |
| 45 to 54 Years | 25 (29.8%) | 17 (21.0%) |
| 55 to 64 Years | 0 (0.0%) | 17 (21.0%) |
| 65 to 74 Years | 13 (30.2%) | 26 (36.1%) |
| 75 Years and over | 4 (18.2%) | 8 (16.0%) |
| Total | 103 (17.8%) | 254 (31.4%) |
Income Above Poverty by Sex and Age in Irvington
According to the poverty statistics in Irvington, males aged 16 and 17 years and females aged 5 years are the age groups that are most secure financially, with 100.0% of males and 100.0% of females in these age groups living above the poverty line.
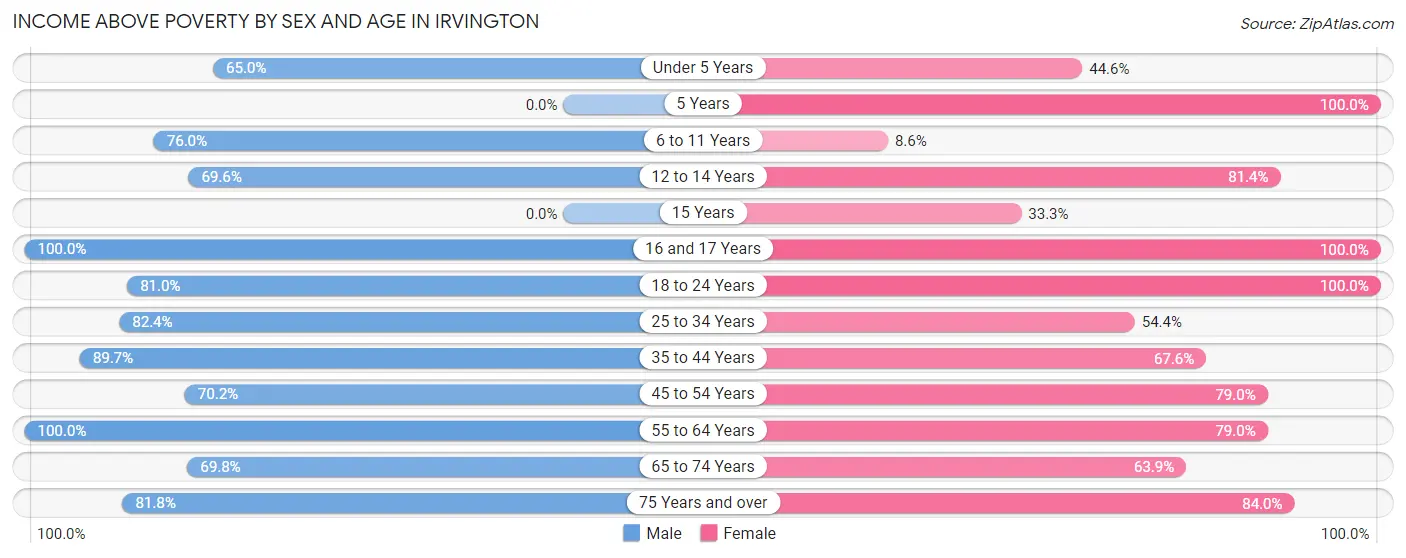
| Age Bracket | Male | Female |
| Under 5 Years | 13 (65.0%) | 50 (44.6%) |
| 5 Years | 0 (0.0%) | 5 (100.0%) |
| 6 to 11 Years | 38 (76.0%) | 3 (8.6%) |
| 12 to 14 Years | 16 (69.6%) | 70 (81.4%) |
| 15 Years | 0 (0.0%) | 2 (33.3%) |
| 16 and 17 Years | 12 (100.0%) | 6 (100.0%) |
| 18 to 24 Years | 34 (80.9%) | 76 (100.0%) |
| 25 to 34 Years | 89 (82.4%) | 31 (54.4%) |
| 35 to 44 Years | 70 (89.7%) | 96 (67.6%) |
| 45 to 54 Years | 59 (70.2%) | 64 (79.0%) |
| 55 to 64 Years | 96 (100.0%) | 64 (79.0%) |
| 65 to 74 Years | 30 (69.8%) | 46 (63.9%) |
| 75 Years and over | 18 (81.8%) | 42 (84.0%) |
| Total | 475 (82.2%) | 555 (68.6%) |
Income Below Poverty Among Married-Couple Families in Irvington
The poverty statistics for married-couple families in Irvington show that 17.7% or 39 of the total 220 families live below the poverty line. Families with 1 or 2 children have the highest poverty rate of 27.9%, comprising of 17 families. On the other hand, families with no children have the lowest poverty rate of 13.2%, which includes 17 families.
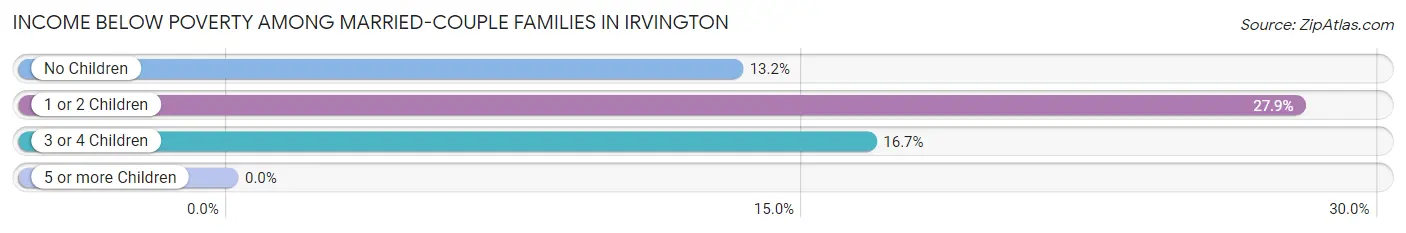
| Children | Above Poverty | Below Poverty |
| No Children | 112 (86.8%) | 17 (13.2%) |
| 1 or 2 Children | 44 (72.1%) | 17 (27.9%) |
| 3 or 4 Children | 25 (83.3%) | 5 (16.7%) |
| 5 or more Children | 0 (0.0%) | 0 (0.0%) |
| Total | 181 (82.3%) | 39 (17.7%) |
Income Below Poverty Among Single-Parent Households in Irvington
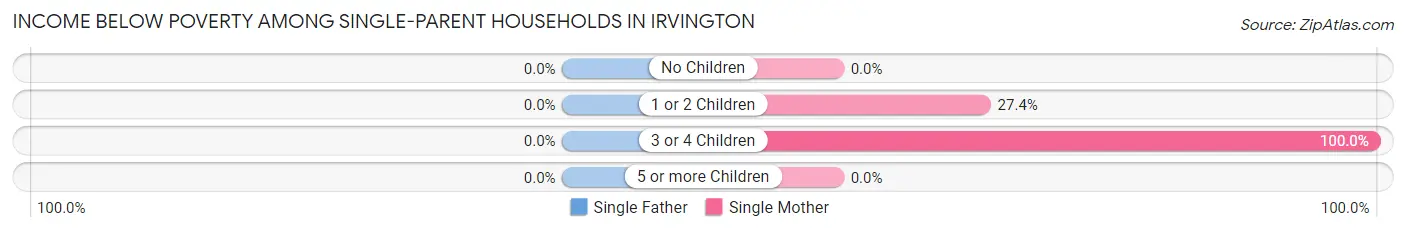
| Children | Single Father | Single Mother |
| No Children | 0 (0.0%) | 0 (0.0%) |
| 1 or 2 Children | 0 (0.0%) | 23 (27.4%) |
| 3 or 4 Children | 0 (0.0%) | 13 (100.0%) |
| 5 or more Children | 0 (0.0%) | 0 (0.0%) |
| Total | 0 (0.0%) | 36 (31.0%) |
Income Below Poverty Among Married-Couple vs Single-Parent Households in Irvington
The poverty data for Irvington shows that 39 of the married-couple family households (17.7%) and 36 of the single-parent households (29.0%) are living below the poverty level. Within the married-couple family households, those with 1 or 2 children have the highest poverty rate, with 17 households (27.9%) falling below the poverty line. Among the single-parent households, those with 3 or 4 children have the highest poverty rate, with 13 household (100.0%) living below poverty.
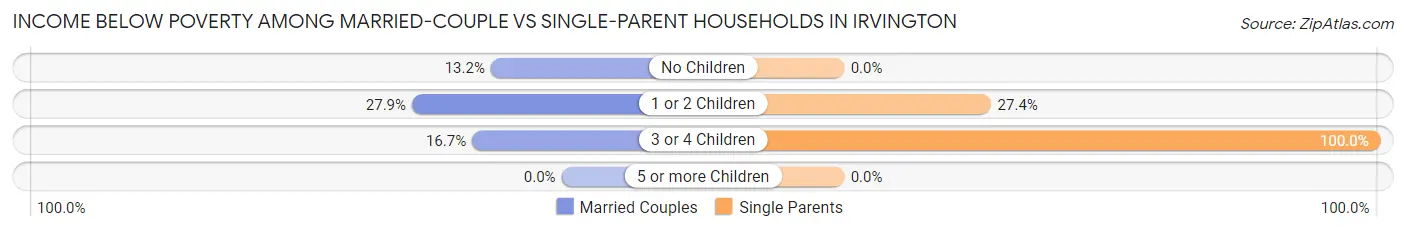
| Children | Married-Couple Families | Single-Parent Households |
| No Children | 17 (13.2%) | 0 (0.0%) |
| 1 or 2 Children | 17 (27.9%) | 23 (27.4%) |
| 3 or 4 Children | 5 (16.7%) | 13 (100.0%) |
| 5 or more Children | 0 (0.0%) | 0 (0.0%) |
| Total | 39 (17.7%) | 36 (29.0%) |
Race in Irvington
The most populous races in Irvington are White / Caucasian (1,103 | 79.5%), Black / African American (161 | 11.6%), and Two or more Races (97 | 7.0%).
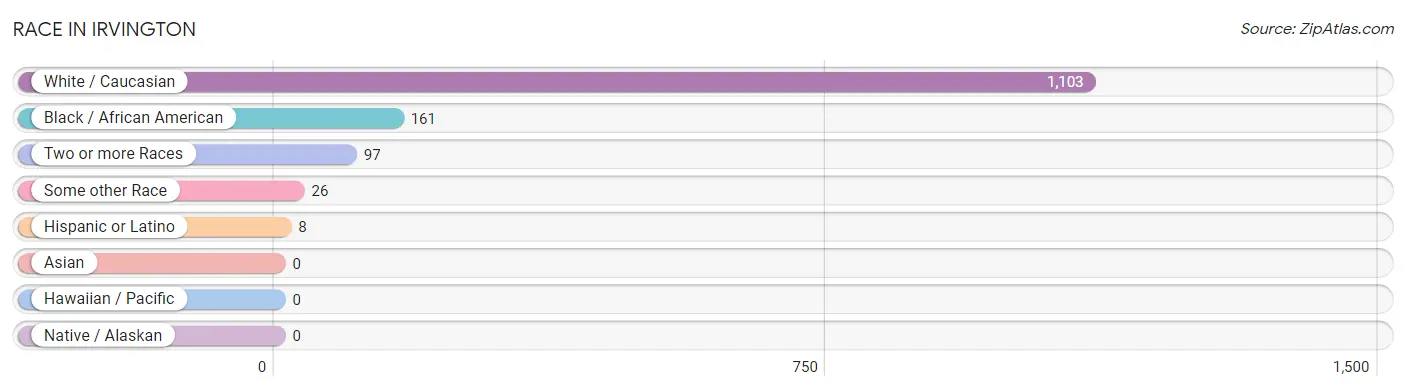
| Race | # Population | % Population |
| Asian | 0 | 0.0% |
| Black / African American | 161 | 11.6% |
| Hawaiian / Pacific | 0 | 0.0% |
| Hispanic or Latino | 8 | 0.6% |
| Native / Alaskan | 0 | 0.0% |
| White / Caucasian | 1,103 | 79.5% |
| Two or more Races | 97 | 7.0% |
| Some other Race | 26 | 1.9% |
| Total | 1,387 | 100.0% |
Ancestry in Irvington
The most populous ancestries reported in Irvington are Irish (196 | 14.1%), American (153 | 11.0%), German (153 | 11.0%), Italian (134 | 9.7%), and Polish (97 | 7.0%), together accounting for 52.8% of all Irvington residents.
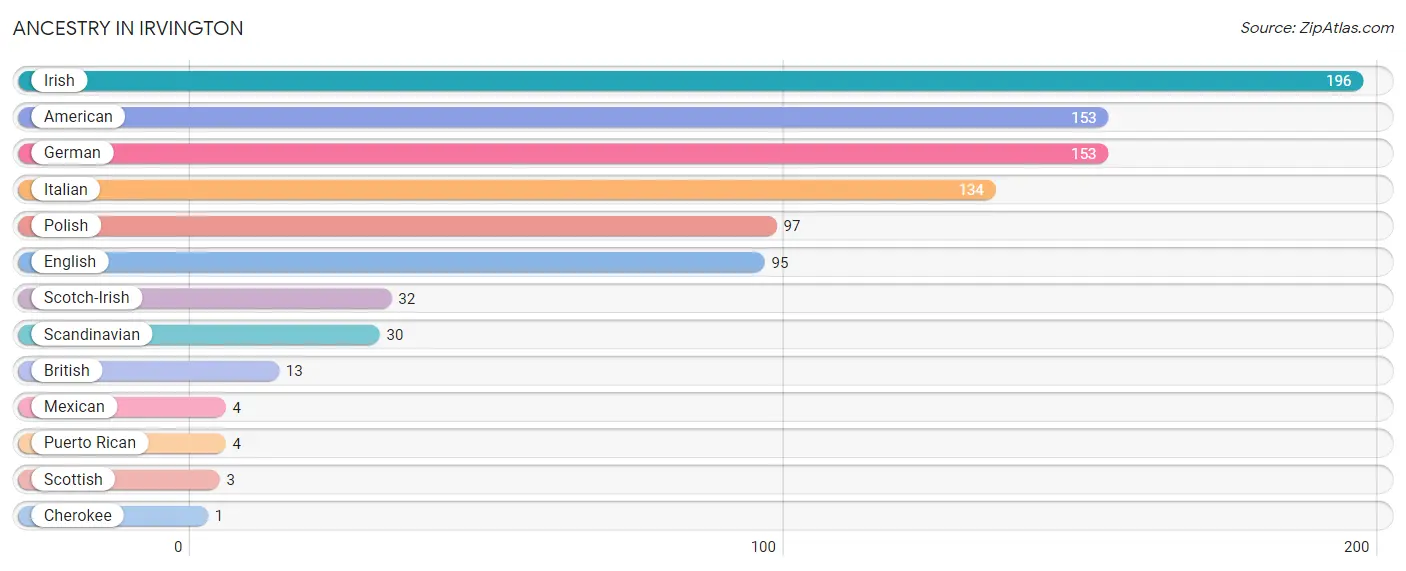
| Ancestry | # Population | % Population |
| American | 153 | 11.0% |
| British | 13 | 0.9% |
| Cherokee | 1 | 0.1% |
| English | 95 | 6.9% |
| German | 153 | 11.0% |
| Irish | 196 | 14.1% |
| Italian | 134 | 9.7% |
| Mexican | 4 | 0.3% |
| Polish | 97 | 7.0% |
| Puerto Rican | 4 | 0.3% |
| Scandinavian | 30 | 2.2% |
| Scotch-Irish | 32 | 2.3% |
| Scottish | 3 | 0.2% | View All 13 Rows |
Immigrants in Irvington
The most numerous immigrant groups reported in Irvington came from Europe (3 | 0.2%), Germany (3 | 0.2%), and Western Europe (3 | 0.2%), together accounting for 0.7% of all Irvington residents.
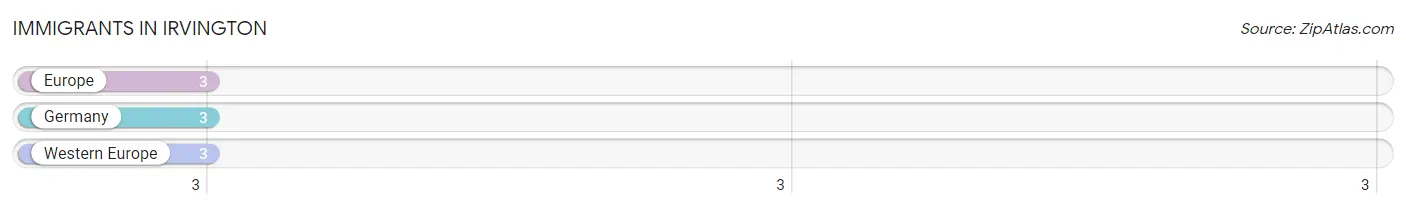
| Immigration Origin | # Population | % Population |
| Europe | 3 | 0.2% |
| Germany | 3 | 0.2% |
| Western Europe | 3 | 0.2% | View All 3 Rows |
Sex and Age in Irvington
Sex and Age in Irvington
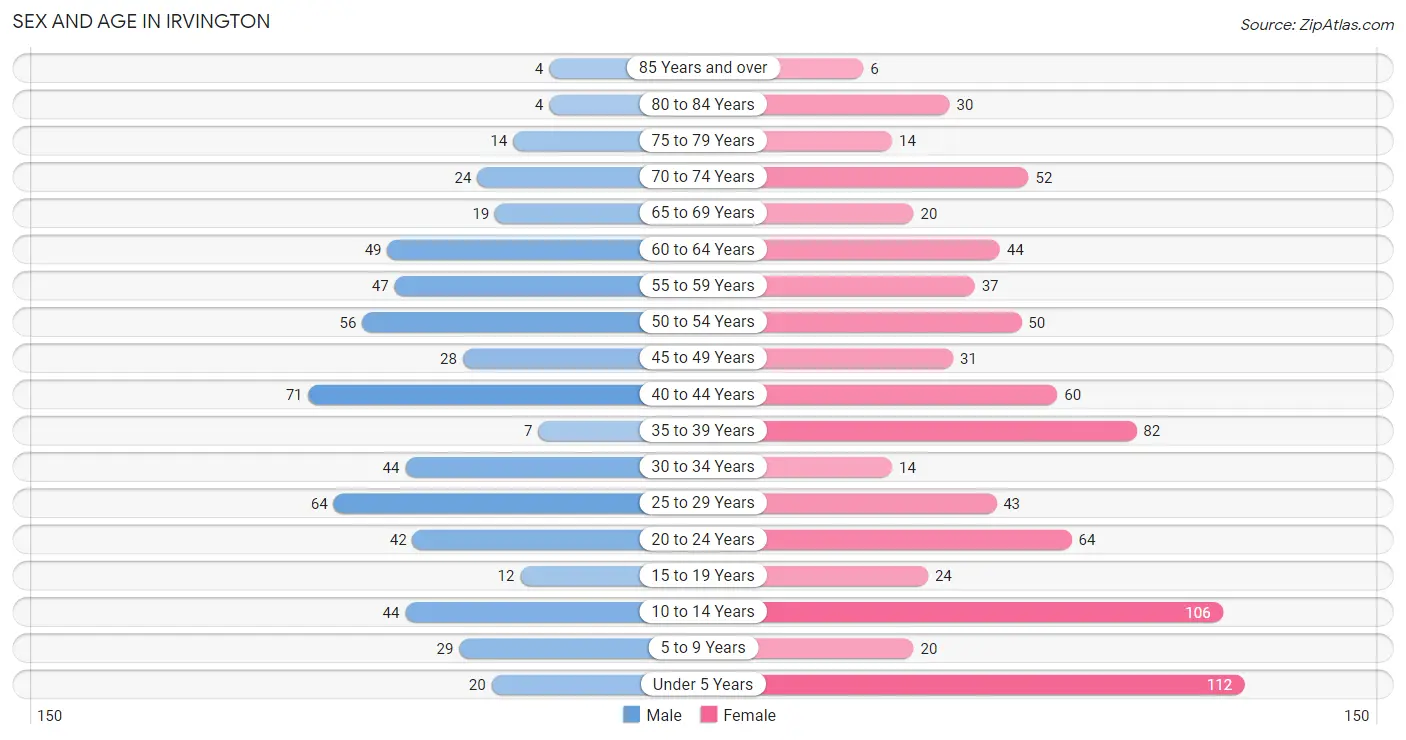
The most populous age groups in Irvington are 40 to 44 Years (71 | 12.3%) for men and Under 5 Years (112 | 13.8%) for women.
| Age Bracket | Male | Female |
| Under 5 Years | 20 (3.5%) | 112 (13.8%) |
| 5 to 9 Years | 29 (5.0%) | 20 (2.5%) |
| 10 to 14 Years | 44 (7.6%) | 106 (13.1%) |
| 15 to 19 Years | 12 (2.1%) | 24 (3.0%) |
| 20 to 24 Years | 42 (7.3%) | 64 (7.9%) |
| 25 to 29 Years | 64 (11.1%) | 43 (5.3%) |
| 30 to 34 Years | 44 (7.6%) | 14 (1.7%) |
| 35 to 39 Years | 7 (1.2%) | 82 (10.1%) |
| 40 to 44 Years | 71 (12.3%) | 60 (7.4%) |
| 45 to 49 Years | 28 (4.8%) | 31 (3.8%) |
| 50 to 54 Years | 56 (9.7%) | 50 (6.2%) |
| 55 to 59 Years | 47 (8.1%) | 37 (4.6%) |
| 60 to 64 Years | 49 (8.5%) | 44 (5.4%) |
| 65 to 69 Years | 19 (3.3%) | 20 (2.5%) |
| 70 to 74 Years | 24 (4.2%) | 52 (6.4%) |
| 75 to 79 Years | 14 (2.4%) | 14 (1.7%) |
| 80 to 84 Years | 4 (0.7%) | 30 (3.7%) |
| 85 Years and over | 4 (0.7%) | 6 (0.7%) |
| Total | 578 (100.0%) | 809 (100.0%) |
Families and Households in Irvington
Median Family Size in Irvington
The median family size in Irvington is 3.24 persons per family, with married-couple families (220 | 63.9%) accounting for the largest median family size of 3.32 persons per family. On the other hand, single male/father families (8 | 2.3%) represent the smallest median family size with 2.63 persons per family.
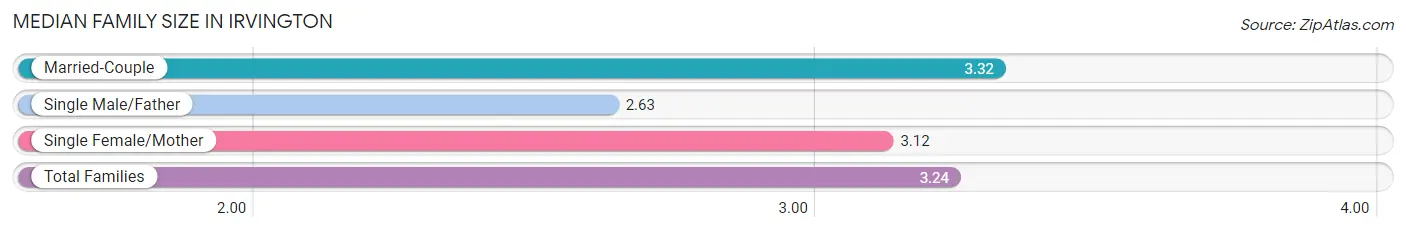
| Family Type | # Families | Family Size |
| Married-Couple | 220 (63.9%) | 3.32 |
| Single Male/Father | 8 (2.3%) | 2.63 |
| Single Female/Mother | 116 (33.7%) | 3.12 |
| Total Families | 344 (100.0%) | 3.24 |
Median Household Size in Irvington
The median household size in Irvington is 2.41 persons per household, with single female/mother households (116 | 20.2%) accounting for the largest median household size of 3.4 persons per household. non-family households (231 | 40.2%) represent the smallest median household size with 1.04 persons per household.
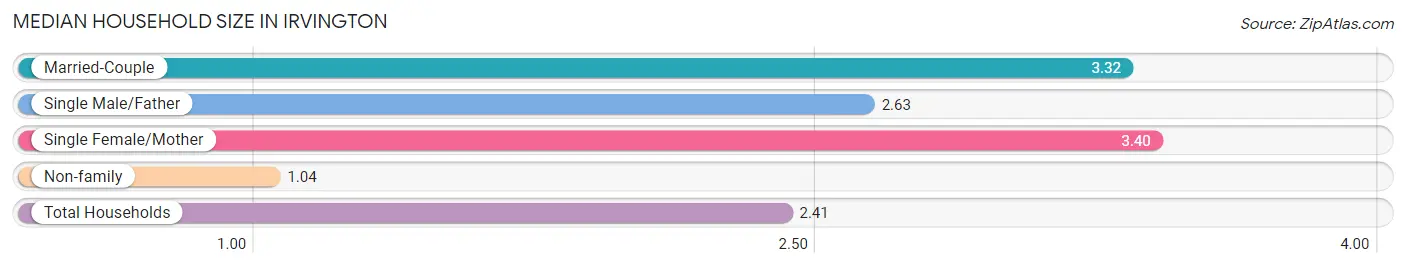
| Household Type | # Households | Household Size |
| Married-Couple | 220 (38.3%) | 3.32 |
| Single Male/Father | 8 (1.4%) | 2.63 |
| Single Female/Mother | 116 (20.2%) | 3.40 |
| Non-family | 231 (40.2%) | 1.04 |
| Total Households | 575 (100.0%) | 2.41 |
Household Size by Marriage Status in Irvington
Out of a total of 575 households in Irvington, 344 (59.8%) are family households, while 231 (40.2%) are nonfamily households. The most numerous type of family households are 2-person households, comprising 196, and the most common type of nonfamily households are 1-person households, comprising 219.
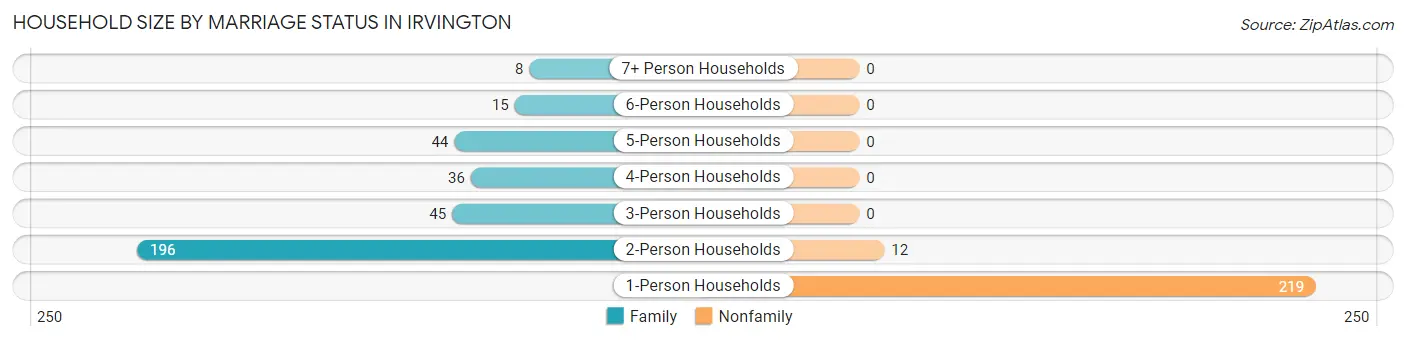
| Household Size | Family Households | Nonfamily Households |
| 1-Person Households | - | 219 (38.1%) |
| 2-Person Households | 196 (34.1%) | 12 (2.1%) |
| 3-Person Households | 45 (7.8%) | 0 (0.0%) |
| 4-Person Households | 36 (6.3%) | 0 (0.0%) |
| 5-Person Households | 44 (7.6%) | 0 (0.0%) |
| 6-Person Households | 15 (2.6%) | 0 (0.0%) |
| 7+ Person Households | 8 (1.4%) | 0 (0.0%) |
| Total | 344 (59.8%) | 231 (40.2%) |
Female Fertility in Irvington
Fertility by Age in Irvington
Average fertility rate in Irvington is 148.0 births per 1,000 women. Women in the age bracket of 20 to 34 years have the highest fertility rate with 231.0 births per 1,000 women. Women in the age bracket of 20 to 34 years acount for 59.6% of all women with births.
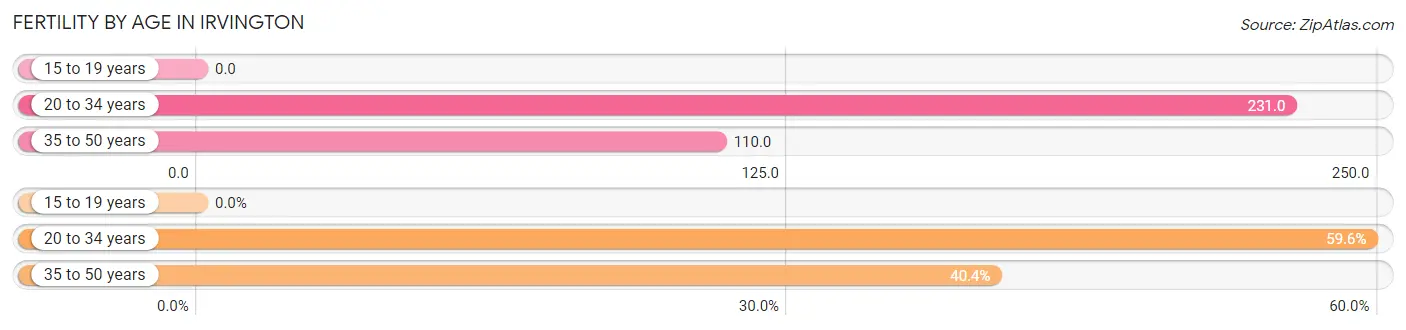
| Age Bracket | Women with Births | Births / 1,000 Women |
| 15 to 19 years | 0 (0.0%) | 0.0 |
| 20 to 34 years | 28 (59.6%) | 231.0 |
| 35 to 50 years | 19 (40.4%) | 110.0 |
| Total | 47 (100.0%) | 148.0 |
Fertility by Age by Marriage Status in Irvington
36.2% of women with births (47) in Irvington are married. The highest percentage of unmarried women with births falls into 35 to 50 years age bracket with 100.0% of them unmarried at the time of birth, while the lowest percentage of unmarried women with births belong to 20 to 34 years age bracket with 39.3% of them unmarried.
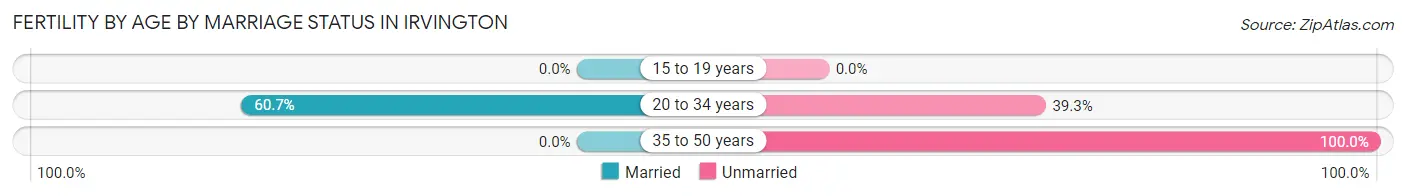
| Age Bracket | Married | Unmarried |
| 15 to 19 years | 0 (0.0%) | 0 (0.0%) |
| 20 to 34 years | 17 (60.7%) | 11 (39.3%) |
| 35 to 50 years | 0 (0.0%) | 19 (100.0%) |
| Total | 17 (36.2%) | 30 (63.8%) |
Fertility by Education in Irvington
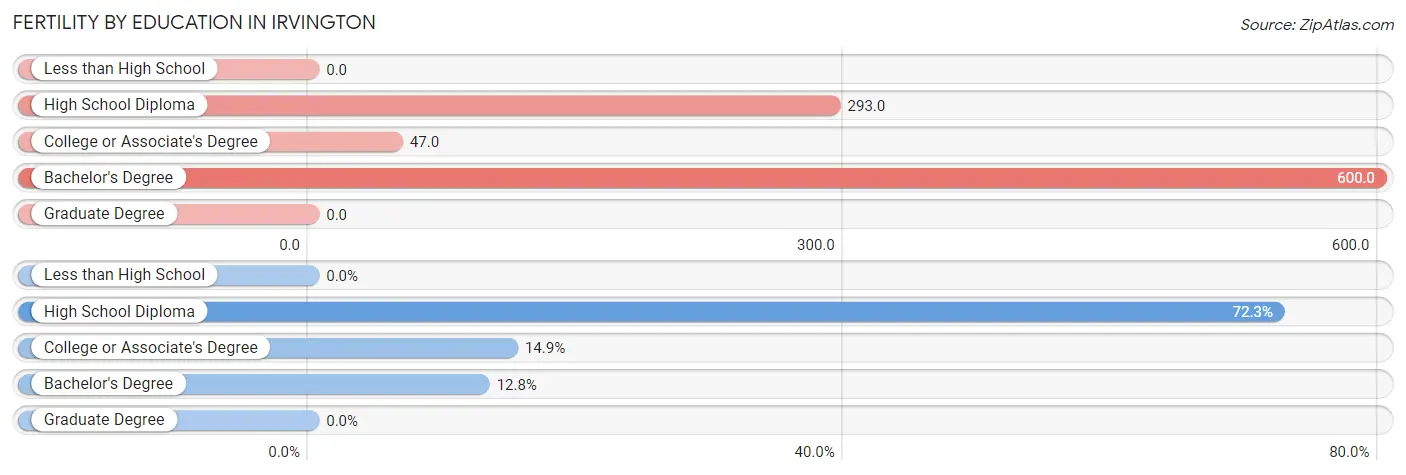
| Educational Attainment | Women with Births | Births / 1,000 Women |
| Less than High School | 0 (0.0%) | 0.0 |
| High School Diploma | 34 (72.3%) | 293.0 |
| College or Associate's Degree | 7 (14.9%) | 47.0 |
| Bachelor's Degree | 6 (12.8%) | 600.0 |
| Graduate Degree | 0 (0.0%) | 0.0 |
| Total | 47 (100.0%) | 148.0 |
Fertility by Education by Marriage Status in Irvington
63.8% of women with births in Irvington are unmarried. Women with the educational attainment of college or associate's degree are most likely to be married with 100.0% of them married at childbirth, while women with the educational attainment of bachelor's degree are least likely to be married with 100.0% of them unmarried at childbirth.
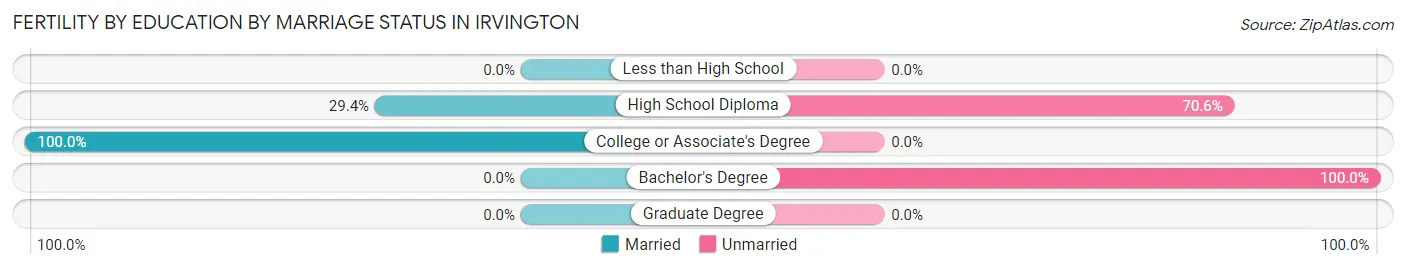
| Educational Attainment | Married | Unmarried |
| Less than High School | 0 (0.0%) | 0 (0.0%) |
| High School Diploma | 10 (29.4%) | 24 (70.6%) |
| College or Associate's Degree | 7 (100.0%) | 0 (0.0%) |
| Bachelor's Degree | 0 (0.0%) | 6 (100.0%) |
| Graduate Degree | 0 (0.0%) | 0 (0.0%) |
| Total | 17 (36.2%) | 30 (63.8%) |
Employment Characteristics in Irvington
Employment by Class of Employer in Irvington
Among the 573 employed individuals in Irvington, private company employees (469 | 81.9%), not-for-profit organizations (36 | 6.3%), and self-employed (not incorporated) (34 | 5.9%) make up the most common classes of employment.
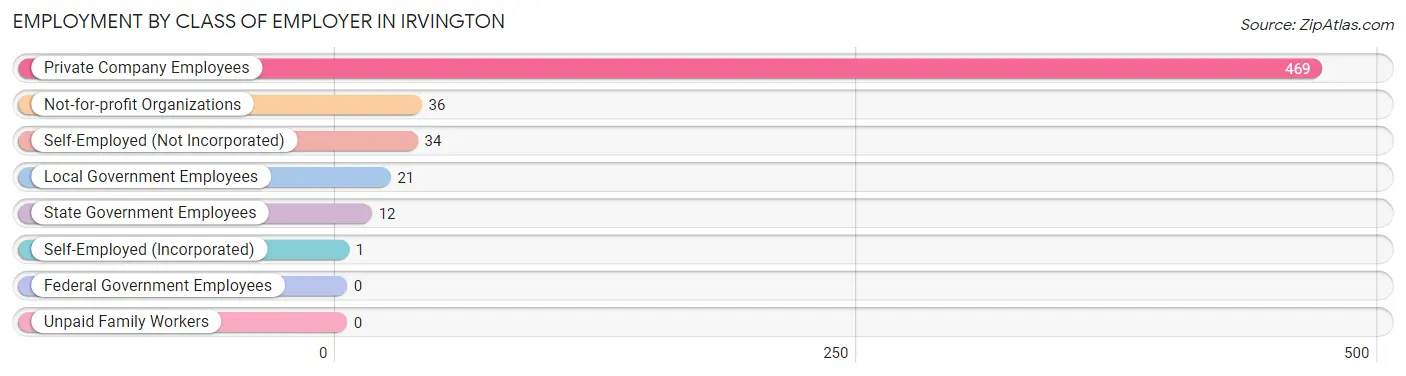
| Employer Class | # Employees | % Employees |
| Private Company Employees | 469 | 81.9% |
| Self-Employed (Incorporated) | 1 | 0.2% |
| Self-Employed (Not Incorporated) | 34 | 5.9% |
| Not-for-profit Organizations | 36 | 6.3% |
| Local Government Employees | 21 | 3.7% |
| State Government Employees | 12 | 2.1% |
| Federal Government Employees | 0 | 0.0% |
| Unpaid Family Workers | 0 | 0.0% |
| Total | 573 | 100.0% |
Employment Status by Age in Irvington
According to the labor force statistics for Irvington, out of the total population over 16 years of age (1,050), 62.9% or 660 individuals are in the labor force, with 11.4% or 75 of them unemployed. The age group with the highest labor force participation rate is 30 to 34 years, with 91.4% or 53 individuals in the labor force. Within the labor force, the 35 to 44 years age range has the highest percentage of unemployed individuals, with 32.1% or 50 of them being unemployed.
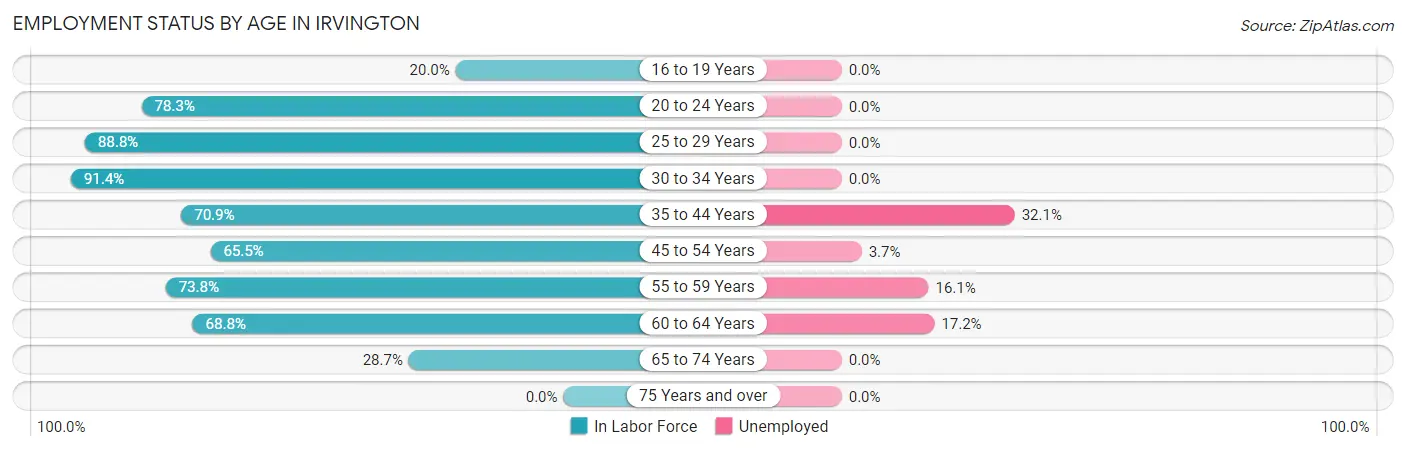
| Age Bracket | In Labor Force | Unemployed |
| 16 to 19 Years | 6 (20.0%) | 0 (0.0%) |
| 20 to 24 Years | 83 (78.3%) | 0 (0.0%) |
| 25 to 29 Years | 95 (88.8%) | 0 (0.0%) |
| 30 to 34 Years | 53 (91.4%) | 0 (0.0%) |
| 35 to 44 Years | 156 (70.9%) | 50 (32.1%) |
| 45 to 54 Years | 108 (65.5%) | 4 (3.7%) |
| 55 to 59 Years | 62 (73.8%) | 10 (16.1%) |
| 60 to 64 Years | 64 (68.8%) | 11 (17.2%) |
| 65 to 74 Years | 33 (28.7%) | 0 (0.0%) |
| 75 Years and over | 0 (0.0%) | 0 (0.0%) |
| Total | 660 (62.9%) | 75 (11.4%) |
Employment Status by Educational Attainment in Irvington
According to labor force statistics for Irvington, 74.0% of individuals (538) out of the total population between 25 and 64 years of age (727) are in the labor force, with 13.9% or 75 of them being unemployed. The group with the highest labor force participation rate are those with the educational attainment of bachelor's degree or higher, with 100.0% or 26 individuals in the labor force. Within the labor force, individuals with college / associate degree education have the highest percentage of unemployment, with 26.3% or 66 of them being unemployed.
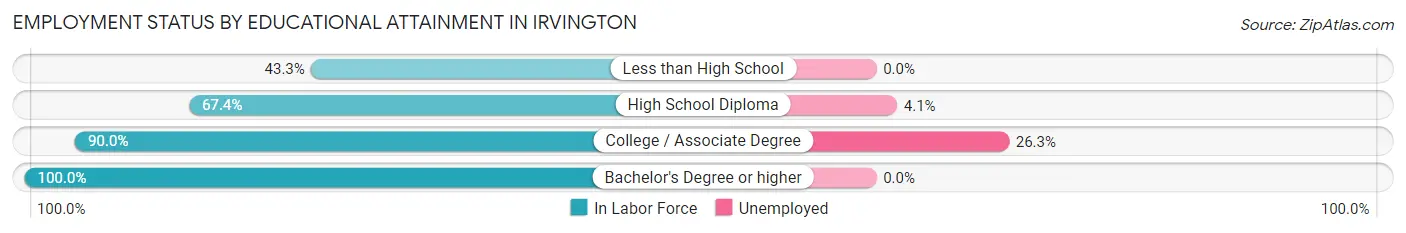
| Educational Attainment | In Labor Force | Unemployed |
| Less than High School | 42 (43.3%) | 0 (0.0%) |
| High School Diploma | 219 (67.4%) | 13 (4.1%) |
| College / Associate Degree | 251 (90.0%) | 73 (26.3%) |
| Bachelor's Degree or higher | 26 (100.0%) | 0 (0.0%) |
| Total | 538 (74.0%) | 101 (13.9%) |
Employment Occupations by Sex in Irvington
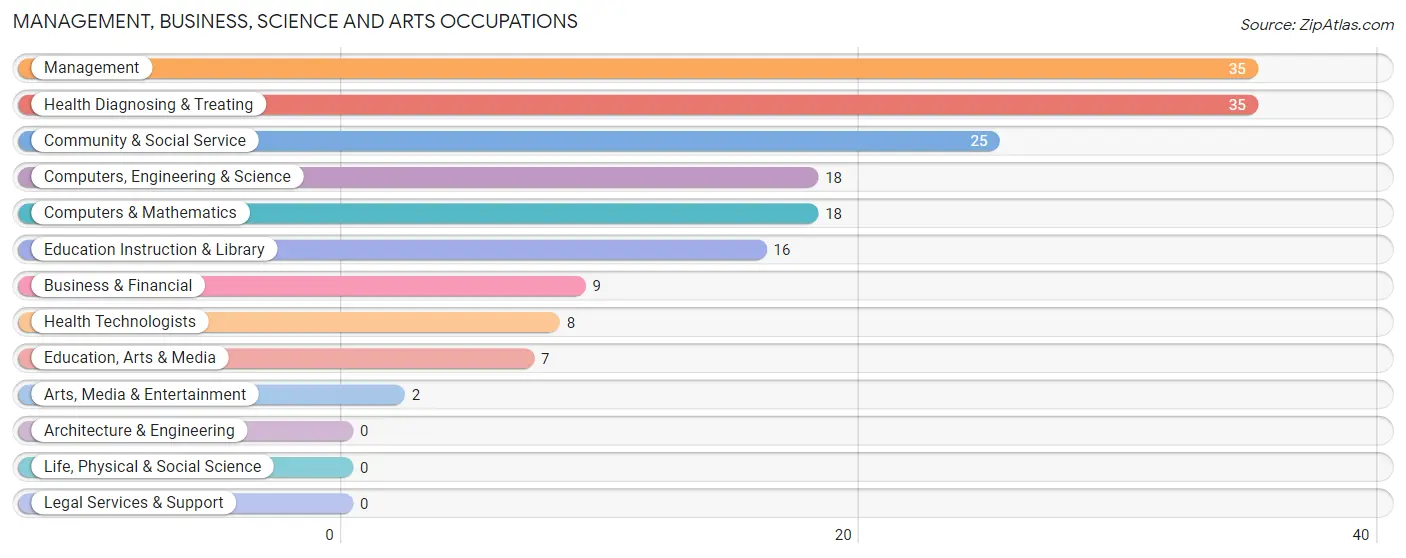
Management, Business, Science and Arts Occupations
The most common Management, Business, Science and Arts occupations in Irvington are Management (35 | 6.0%), Health Diagnosing & Treating (35 | 6.0%), Community & Social Service (25 | 4.3%), Computers, Engineering & Science (18 | 3.1%), and Computers & Mathematics (18 | 3.1%).
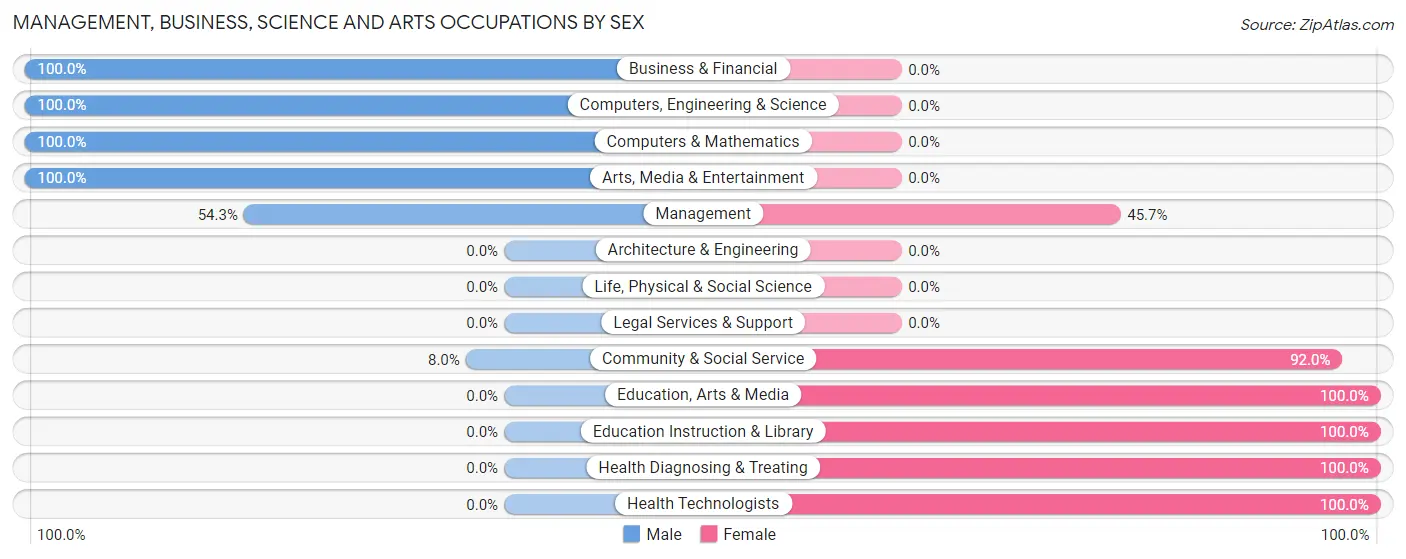
Management, Business, Science and Arts Occupations by Sex
Within the Management, Business, Science and Arts occupations in Irvington, the most male-oriented occupations are Business & Financial (100.0%), Computers, Engineering & Science (100.0%), and Computers & Mathematics (100.0%), while the most female-oriented occupations are Education, Arts & Media (100.0%), Education Instruction & Library (100.0%), and Health Diagnosing & Treating (100.0%).
| Occupation | Male | Female |
| Management | 19 (54.3%) | 16 (45.7%) |
| Business & Financial | 9 (100.0%) | 0 (0.0%) |
| Computers, Engineering & Science | 18 (100.0%) | 0 (0.0%) |
| Computers & Mathematics | 18 (100.0%) | 0 (0.0%) |
| Architecture & Engineering | 0 (0.0%) | 0 (0.0%) |
| Life, Physical & Social Science | 0 (0.0%) | 0 (0.0%) |
| Community & Social Service | 2 (8.0%) | 23 (92.0%) |
| Education, Arts & Media | 0 (0.0%) | 7 (100.0%) |
| Legal Services & Support | 0 (0.0%) | 0 (0.0%) |
| Education Instruction & Library | 0 (0.0%) | 16 (100.0%) |
| Arts, Media & Entertainment | 2 (100.0%) | 0 (0.0%) |
| Health Diagnosing & Treating | 0 (0.0%) | 35 (100.0%) |
| Health Technologists | 0 (0.0%) | 8 (100.0%) |
| Total (Category) | 48 (39.3%) | 74 (60.7%) |
| Total (Overall) | 352 (60.2%) | 233 (39.8%) |
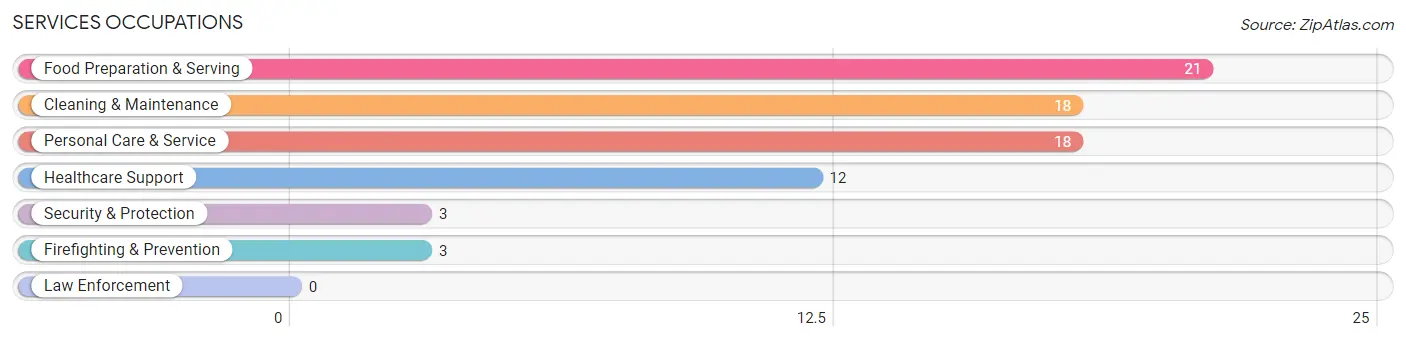
Services Occupations
The most common Services occupations in Irvington are Food Preparation & Serving (21 | 3.6%), Cleaning & Maintenance (18 | 3.1%), Personal Care & Service (18 | 3.1%), Healthcare Support (12 | 2.1%), and Security & Protection (3 | 0.5%).
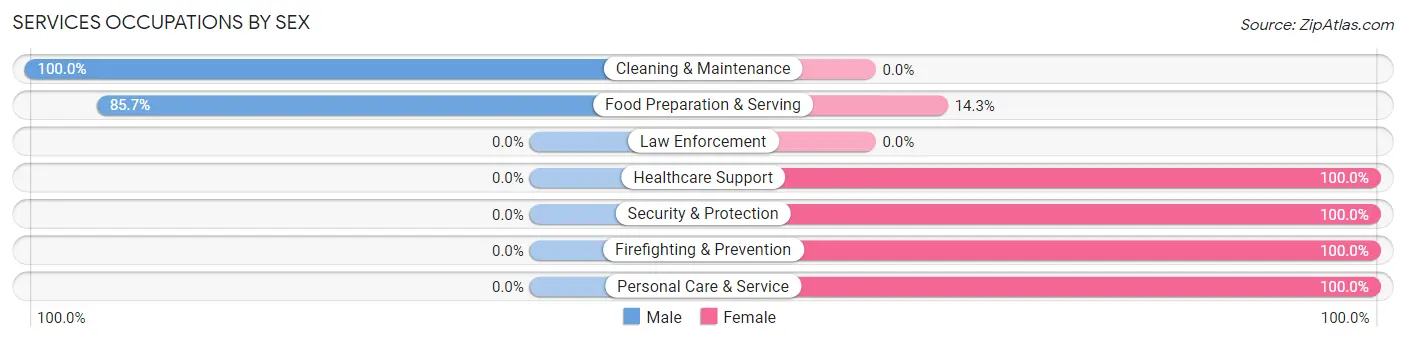
Services Occupations by Sex
Within the Services occupations in Irvington, the most male-oriented occupations are Cleaning & Maintenance (100.0%), and Food Preparation & Serving (85.7%), while the most female-oriented occupations are Healthcare Support (100.0%), Security & Protection (100.0%), and Firefighting & Prevention (100.0%).
| Occupation | Male | Female |
| Healthcare Support | 0 (0.0%) | 12 (100.0%) |
| Security & Protection | 0 (0.0%) | 3 (100.0%) |
| Firefighting & Prevention | 0 (0.0%) | 3 (100.0%) |
| Law Enforcement | 0 (0.0%) | 0 (0.0%) |
| Food Preparation & Serving | 18 (85.7%) | 3 (14.3%) |
| Cleaning & Maintenance | 18 (100.0%) | 0 (0.0%) |
| Personal Care & Service | 0 (0.0%) | 18 (100.0%) |
| Total (Category) | 36 (50.0%) | 36 (50.0%) |
| Total (Overall) | 352 (60.2%) | 233 (39.8%) |
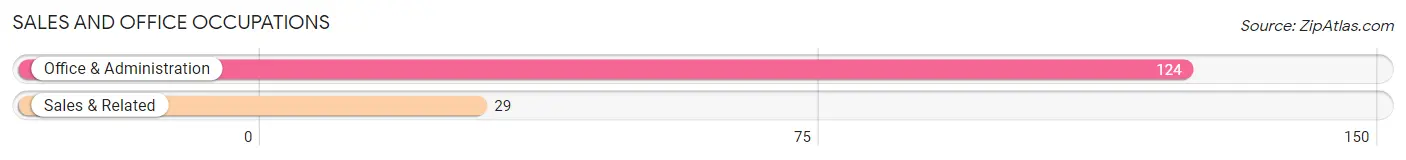
Sales and Office Occupations
The most common Sales and Office occupations in Irvington are Office & Administration (124 | 21.2%), and Sales & Related (29 | 5.0%).
Sales and Office Occupations by Sex
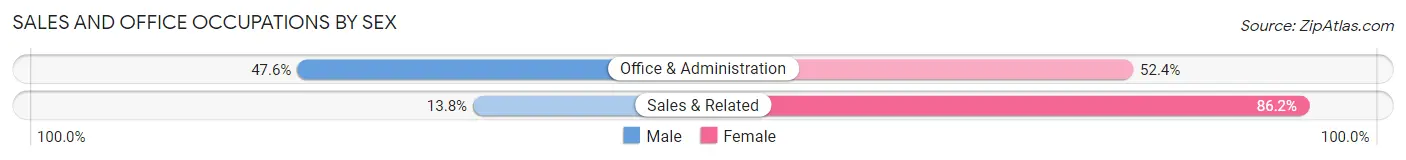
| Occupation | Male | Female |
| Sales & Related | 4 (13.8%) | 25 (86.2%) |
| Office & Administration | 59 (47.6%) | 65 (52.4%) |
| Total (Category) | 63 (41.2%) | 90 (58.8%) |
| Total (Overall) | 352 (60.2%) | 233 (39.8%) |
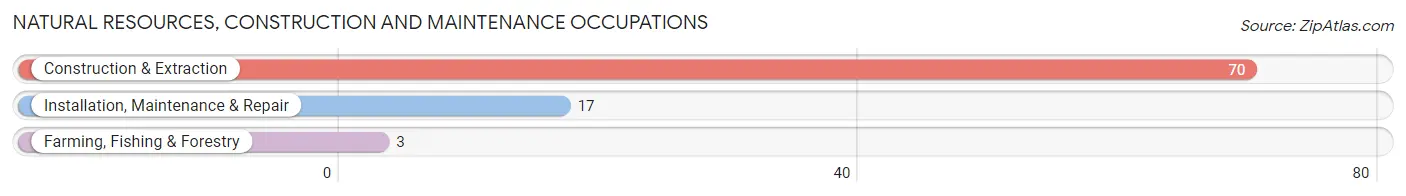
Natural Resources, Construction and Maintenance Occupations
The most common Natural Resources, Construction and Maintenance occupations in Irvington are Construction & Extraction (70 | 12.0%), Installation, Maintenance & Repair (17 | 2.9%), and Farming, Fishing & Forestry (3 | 0.5%).
Natural Resources, Construction and Maintenance Occupations by Sex
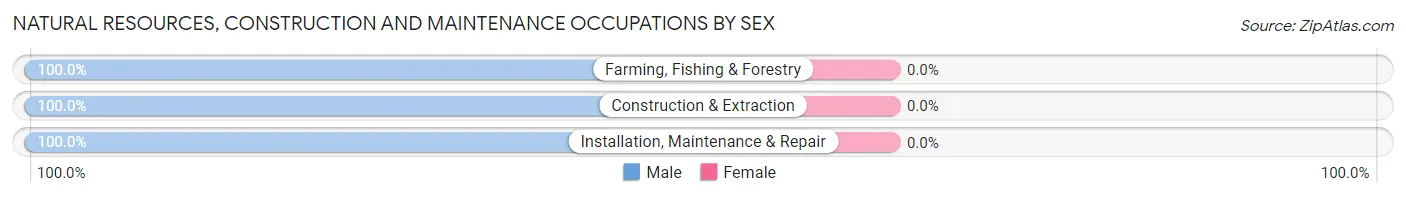
| Occupation | Male | Female |
| Farming, Fishing & Forestry | 3 (100.0%) | 0 (0.0%) |
| Construction & Extraction | 70 (100.0%) | 0 (0.0%) |
| Installation, Maintenance & Repair | 17 (100.0%) | 0 (0.0%) |
| Total (Category) | 90 (100.0%) | 0 (0.0%) |
| Total (Overall) | 352 (60.2%) | 233 (39.8%) |
Production, Transportation and Moving Occupations
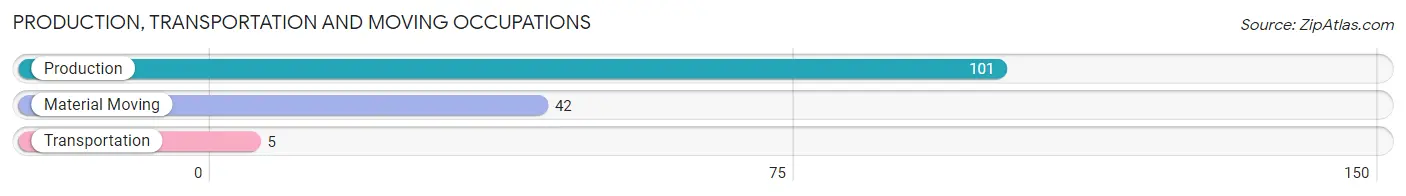
The most common Production, Transportation and Moving occupations in Irvington are Production (101 | 17.3%), Material Moving (42 | 7.2%), and Transportation (5 | 0.9%).
Production, Transportation and Moving Occupations by Sex
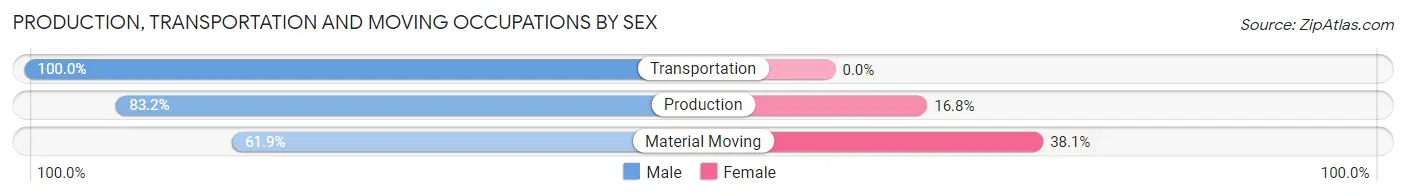
| Occupation | Male | Female |
| Production | 84 (83.2%) | 17 (16.8%) |
| Transportation | 5 (100.0%) | 0 (0.0%) |
| Material Moving | 26 (61.9%) | 16 (38.1%) |
| Total (Category) | 115 (77.7%) | 33 (22.3%) |
| Total (Overall) | 352 (60.2%) | 233 (39.8%) |
Employment Industries by Sex in Irvington
Employment Industries in Irvington
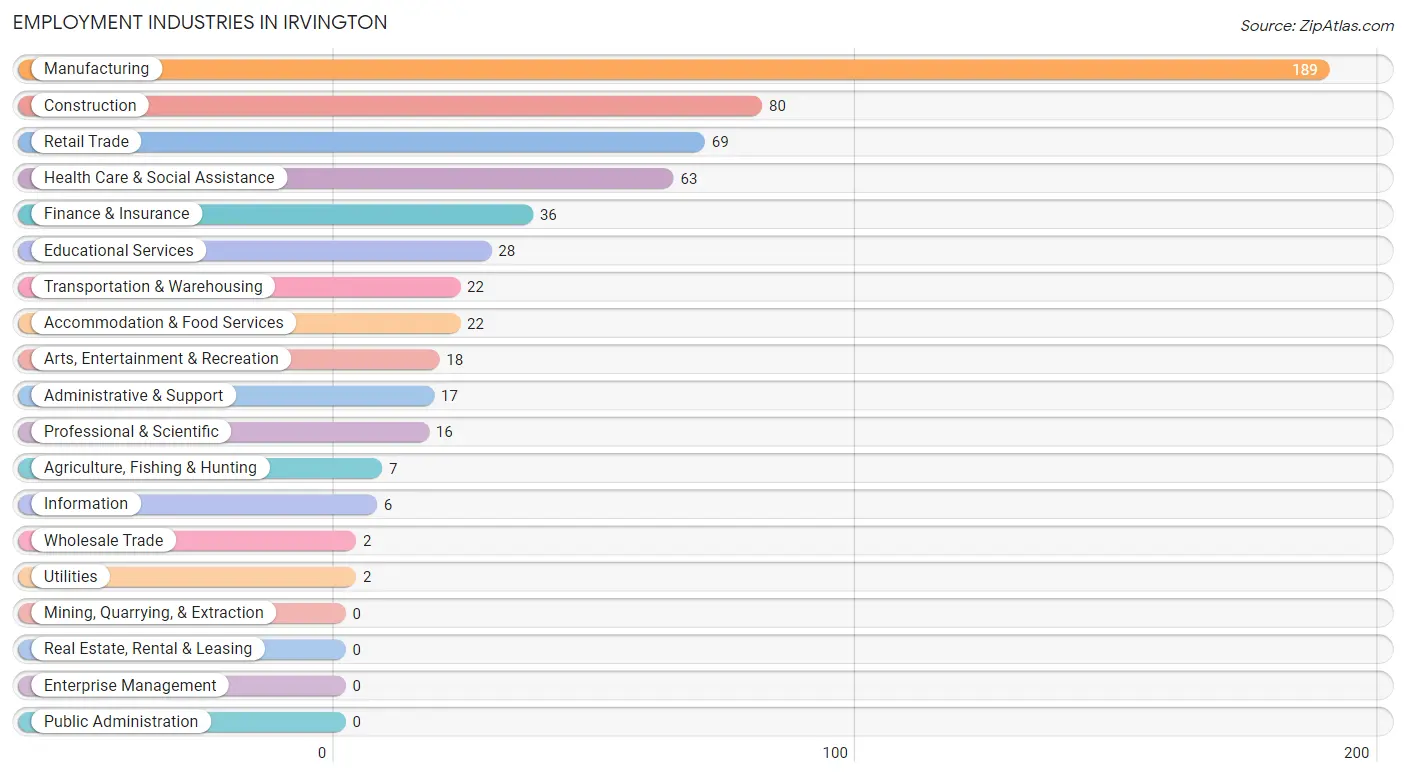
The major employment industries in Irvington include Manufacturing (189 | 32.3%), Construction (80 | 13.7%), Retail Trade (69 | 11.8%), Health Care & Social Assistance (63 | 10.8%), and Finance & Insurance (36 | 6.1%).
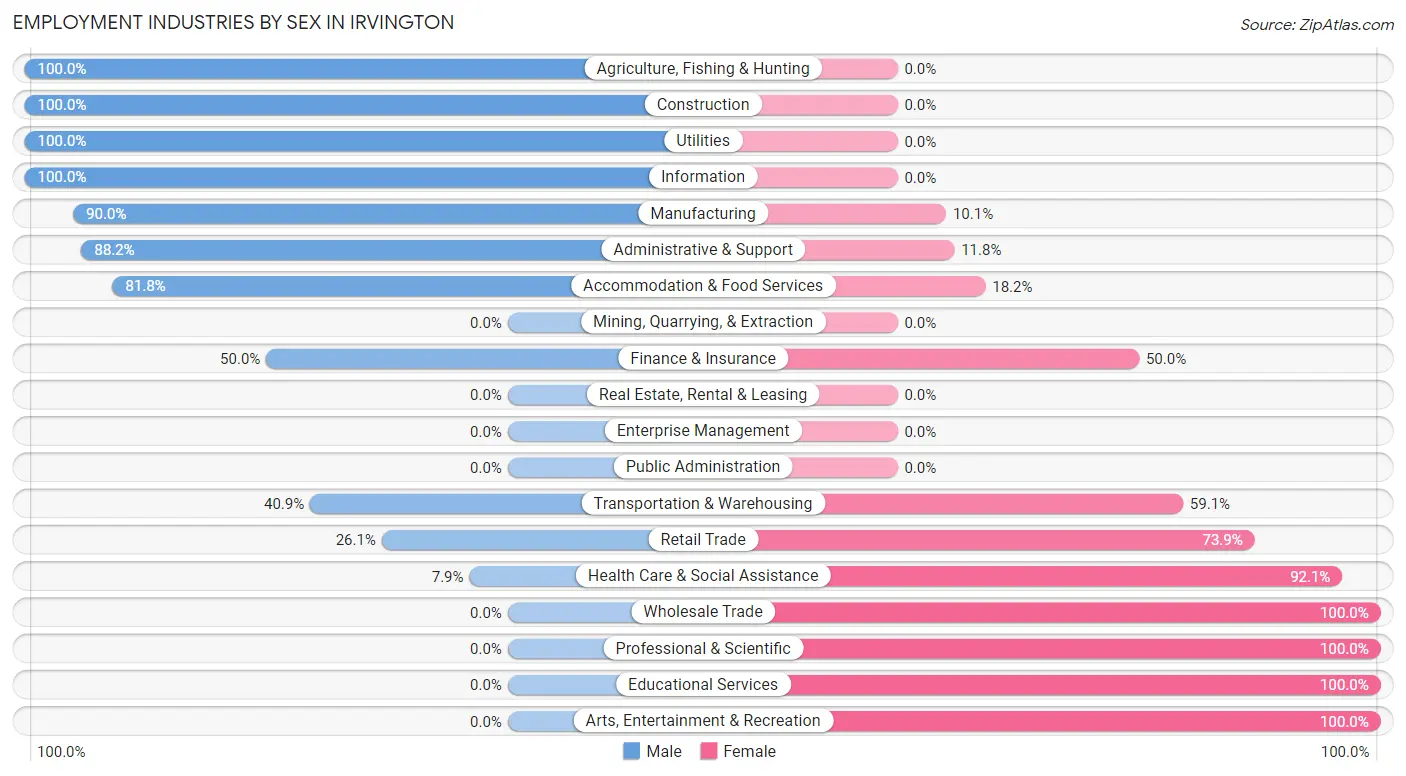
Employment Industries by Sex in Irvington
The Irvington industries that see more men than women are Agriculture, Fishing & Hunting (100.0%), Construction (100.0%), and Utilities (100.0%), whereas the industries that tend to have a higher number of women are Wholesale Trade (100.0%), Professional & Scientific (100.0%), and Educational Services (100.0%).
| Industry | Male | Female |
| Agriculture, Fishing & Hunting | 7 (100.0%) | 0 (0.0%) |
| Mining, Quarrying, & Extraction | 0 (0.0%) | 0 (0.0%) |
| Construction | 80 (100.0%) | 0 (0.0%) |
| Manufacturing | 170 (89.9%) | 19 (10.1%) |
| Wholesale Trade | 0 (0.0%) | 2 (100.0%) |
| Retail Trade | 18 (26.1%) | 51 (73.9%) |
| Transportation & Warehousing | 9 (40.9%) | 13 (59.1%) |
| Utilities | 2 (100.0%) | 0 (0.0%) |
| Information | 6 (100.0%) | 0 (0.0%) |
| Finance & Insurance | 18 (50.0%) | 18 (50.0%) |
| Real Estate, Rental & Leasing | 0 (0.0%) | 0 (0.0%) |
| Professional & Scientific | 0 (0.0%) | 16 (100.0%) |
| Enterprise Management | 0 (0.0%) | 0 (0.0%) |
| Administrative & Support | 15 (88.2%) | 2 (11.8%) |
| Educational Services | 0 (0.0%) | 28 (100.0%) |
| Health Care & Social Assistance | 5 (7.9%) | 58 (92.1%) |
| Arts, Entertainment & Recreation | 0 (0.0%) | 18 (100.0%) |
| Accommodation & Food Services | 18 (81.8%) | 4 (18.2%) |
| Public Administration | 0 (0.0%) | 0 (0.0%) |
| Total | 352 (60.2%) | 233 (39.8%) |
Education in Irvington
School Enrollment in Irvington
The most common levels of schooling among the 267 students in Irvington are middle school (97 | 36.3%), high school (74 | 27.7%), and elementary school (47 | 17.6%).
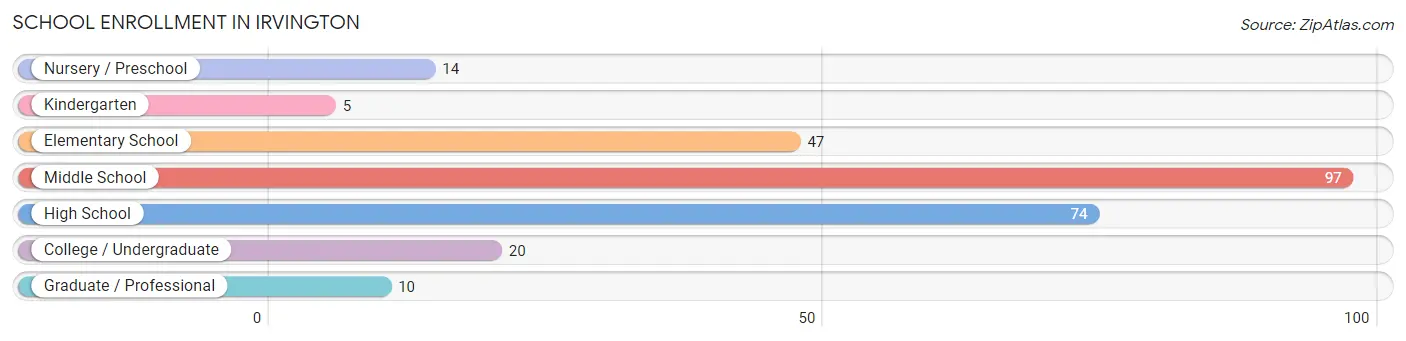
| School Level | # Students | % Students |
| Nursery / Preschool | 14 | 5.2% |
| Kindergarten | 5 | 1.9% |
| Elementary School | 47 | 17.6% |
| Middle School | 97 | 36.3% |
| High School | 74 | 27.7% |
| College / Undergraduate | 20 | 7.5% |
| Graduate / Professional | 10 | 3.7% |
| Total | 267 | 100.0% |
School Enrollment by Age by Funding Source in Irvington
Out of a total of 267 students who are enrolled in schools in Irvington, 23 (8.6%) attend a private institution, while the remaining 244 (91.4%) are enrolled in public schools. The age group of 35 years and over has the highest likelihood of being enrolled in private schools, with 6 (100.0% in the age bracket) enrolled. Conversely, the age group of 3 to 4 year olds has the lowest likelihood of being enrolled in a private school, with 14 (100.0% in the age bracket) attending a public institution.
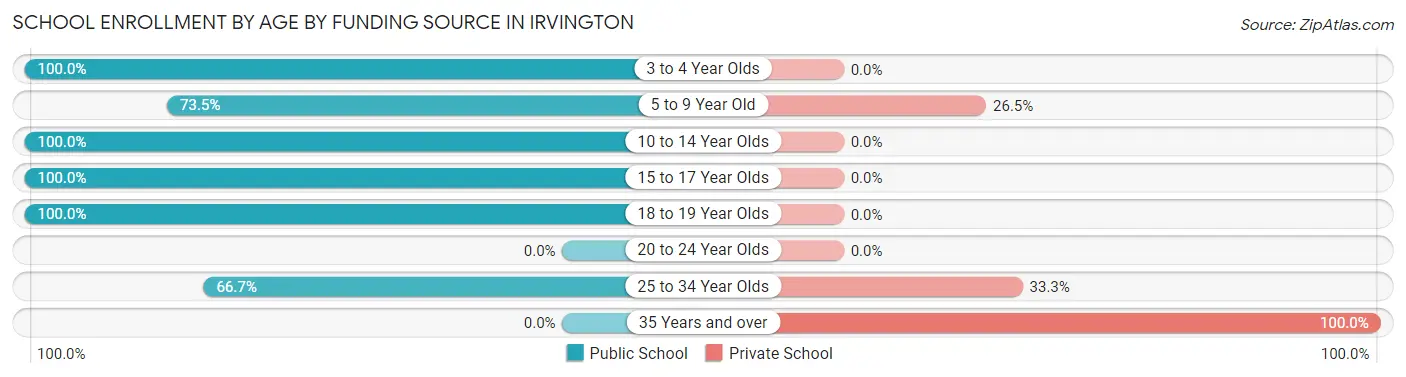
| Age Bracket | Public School | Private School |
| 3 to 4 Year Olds | 14 (100.0%) | 0 (0.0%) |
| 5 to 9 Year Old | 36 (73.5%) | 13 (26.5%) |
| 10 to 14 Year Olds | 150 (100.0%) | 0 (0.0%) |
| 15 to 17 Year Olds | 24 (100.0%) | 0 (0.0%) |
| 18 to 19 Year Olds | 12 (100.0%) | 0 (0.0%) |
| 20 to 24 Year Olds | 0 (0.0%) | 0 (0.0%) |
| 25 to 34 Year Olds | 8 (66.7%) | 4 (33.3%) |
| 35 Years and over | 0 (0.0%) | 6 (100.0%) |
| Total | 244 (91.4%) | 23 (8.6%) |
Educational Attainment by Field of Study in Irvington
Education (20 | 47.6%), science & technology (7 | 16.7%), social sciences (4 | 9.5%), computers & mathematics (3 | 7.1%), and psychology (3 | 7.1%) are the most common fields of study among 42 individuals in Irvington who have obtained a bachelor's degree or higher.
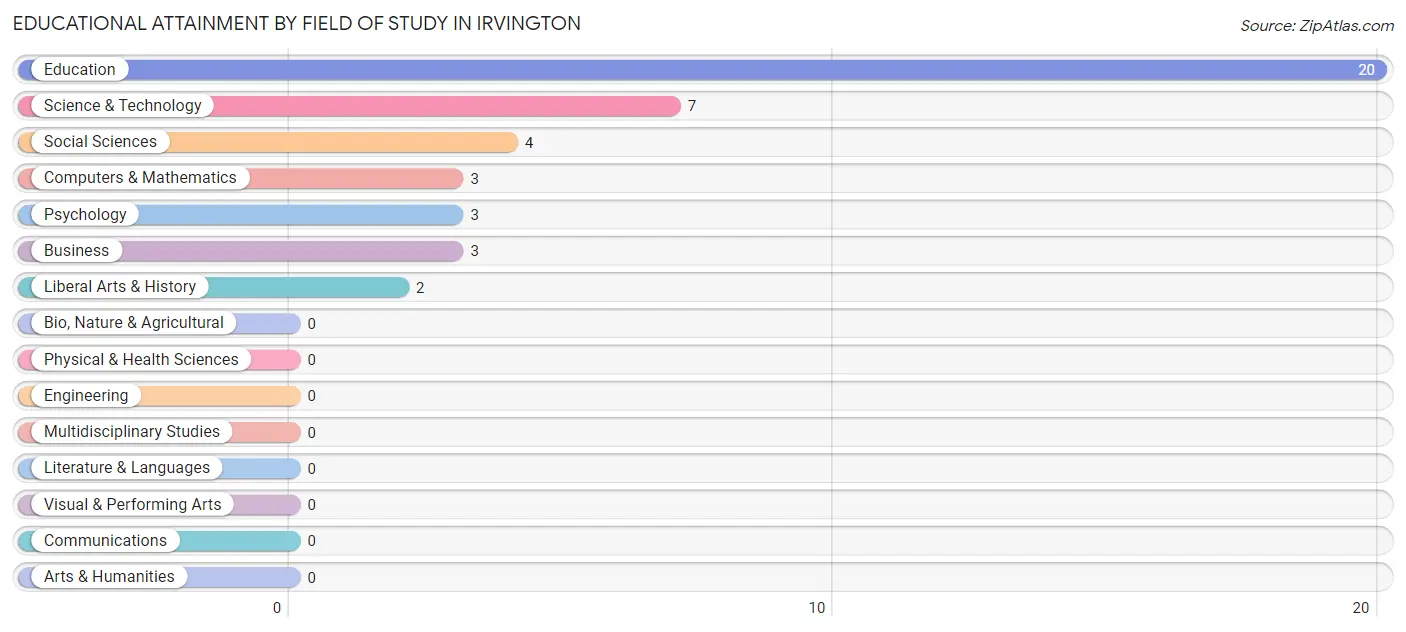
| Field of Study | # Graduates | % Graduates |
| Computers & Mathematics | 3 | 7.1% |
| Bio, Nature & Agricultural | 0 | 0.0% |
| Physical & Health Sciences | 0 | 0.0% |
| Psychology | 3 | 7.1% |
| Social Sciences | 4 | 9.5% |
| Engineering | 0 | 0.0% |
| Multidisciplinary Studies | 0 | 0.0% |
| Science & Technology | 7 | 16.7% |
| Business | 3 | 7.1% |
| Education | 20 | 47.6% |
| Literature & Languages | 0 | 0.0% |
| Liberal Arts & History | 2 | 4.8% |
| Visual & Performing Arts | 0 | 0.0% |
| Communications | 0 | 0.0% |
| Arts & Humanities | 0 | 0.0% |
| Total | 42 | 100.0% |
Transportation & Commute in Irvington
Vehicle Availability by Sex in Irvington
The most prevalent vehicle ownership categories in Irvington are males with 2 vehicles (136, accounting for 38.6%) and females with 2 vehicles (61, making up 61.5%).
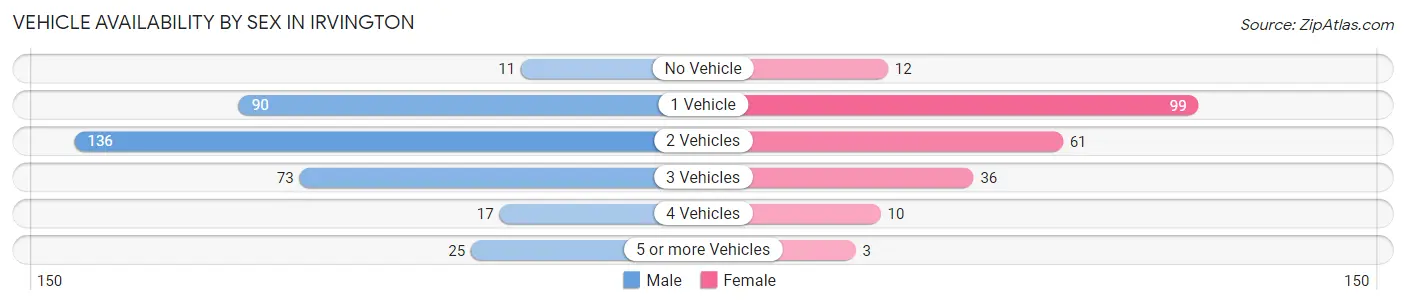
| Vehicles Available | Male | Female |
| No Vehicle | 11 (3.1%) | 12 (5.4%) |
| 1 Vehicle | 90 (25.6%) | 99 (44.8%) |
| 2 Vehicles | 136 (38.6%) | 61 (27.6%) |
| 3 Vehicles | 73 (20.7%) | 36 (16.3%) |
| 4 Vehicles | 17 (4.8%) | 10 (4.5%) |
| 5 or more Vehicles | 25 (7.1%) | 3 (1.4%) |
| Total | 352 (100.0%) | 221 (100.0%) |
Commute Time in Irvington
The most frequently occuring commute durations in Irvington are 60 to 89 minutes (121 commuters, 21.2%), 5 to 9 minutes (76 commuters, 13.3%), and 15 to 19 minutes (61 commuters, 10.7%).
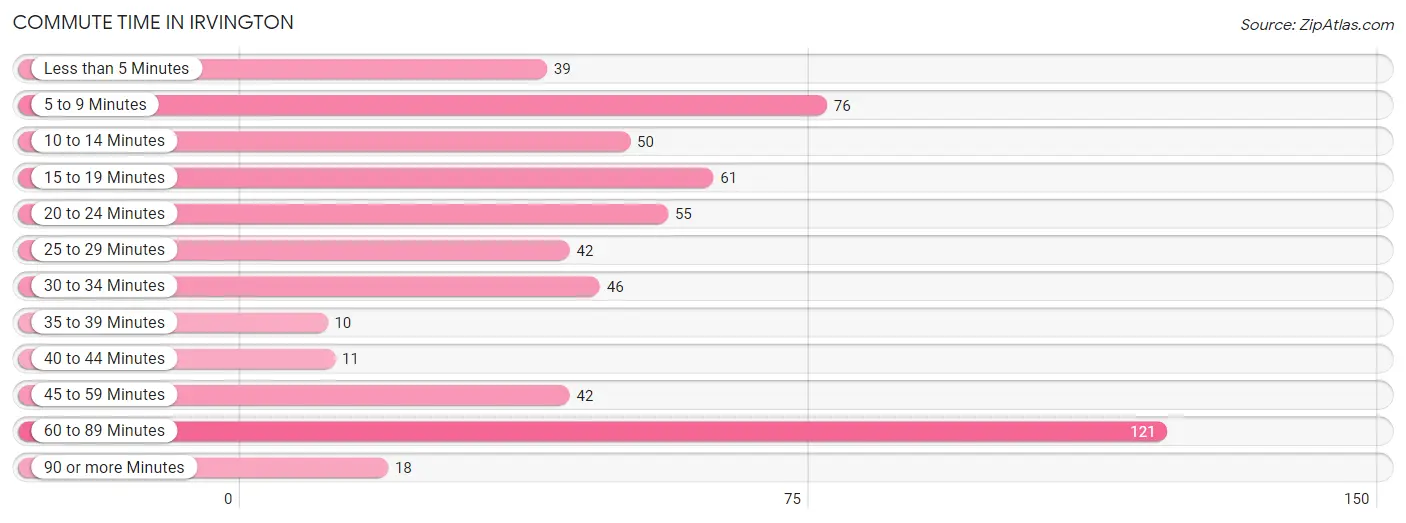
| Commute Time | # Commuters | % Commuters |
| Less than 5 Minutes | 39 | 6.8% |
| 5 to 9 Minutes | 76 | 13.3% |
| 10 to 14 Minutes | 50 | 8.8% |
| 15 to 19 Minutes | 61 | 10.7% |
| 20 to 24 Minutes | 55 | 9.6% |
| 25 to 29 Minutes | 42 | 7.4% |
| 30 to 34 Minutes | 46 | 8.1% |
| 35 to 39 Minutes | 10 | 1.8% |
| 40 to 44 Minutes | 11 | 1.9% |
| 45 to 59 Minutes | 42 | 7.4% |
| 60 to 89 Minutes | 121 | 21.2% |
| 90 or more Minutes | 18 | 3.2% |
Commute Time by Sex in Irvington
The most common commute times in Irvington are 60 to 89 minutes (70 commuters, 19.9%) for males and 60 to 89 minutes (51 commuters, 23.3%) for females.
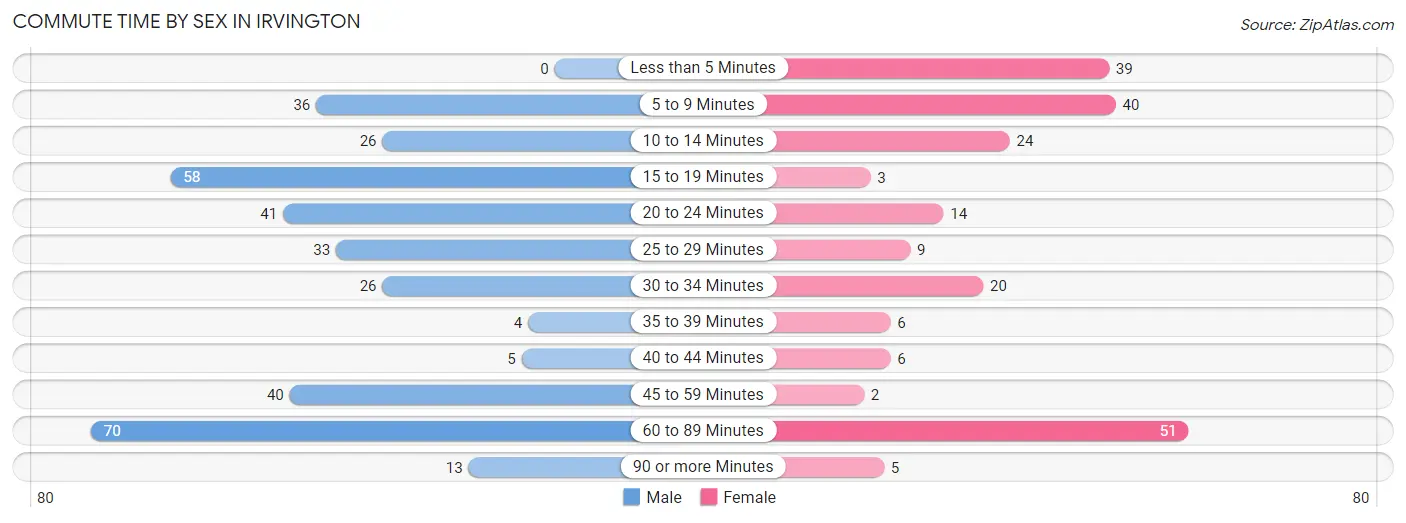
| Commute Time | Male | Female |
| Less than 5 Minutes | 0 (0.0%) | 39 (17.8%) |
| 5 to 9 Minutes | 36 (10.2%) | 40 (18.3%) |
| 10 to 14 Minutes | 26 (7.4%) | 24 (11.0%) |
| 15 to 19 Minutes | 58 (16.5%) | 3 (1.4%) |
| 20 to 24 Minutes | 41 (11.7%) | 14 (6.4%) |
| 25 to 29 Minutes | 33 (9.4%) | 9 (4.1%) |
| 30 to 34 Minutes | 26 (7.4%) | 20 (9.1%) |
| 35 to 39 Minutes | 4 (1.1%) | 6 (2.7%) |
| 40 to 44 Minutes | 5 (1.4%) | 6 (2.7%) |
| 45 to 59 Minutes | 40 (11.4%) | 2 (0.9%) |
| 60 to 89 Minutes | 70 (19.9%) | 51 (23.3%) |
| 90 or more Minutes | 13 (3.7%) | 5 (2.3%) |
Time of Departure to Work by Sex in Irvington
The most frequent times of departure to work in Irvington are 6:30 AM to 6:59 AM (80, 22.7%) for males and 7:00 AM to 7:29 AM (48, 21.9%) for females.
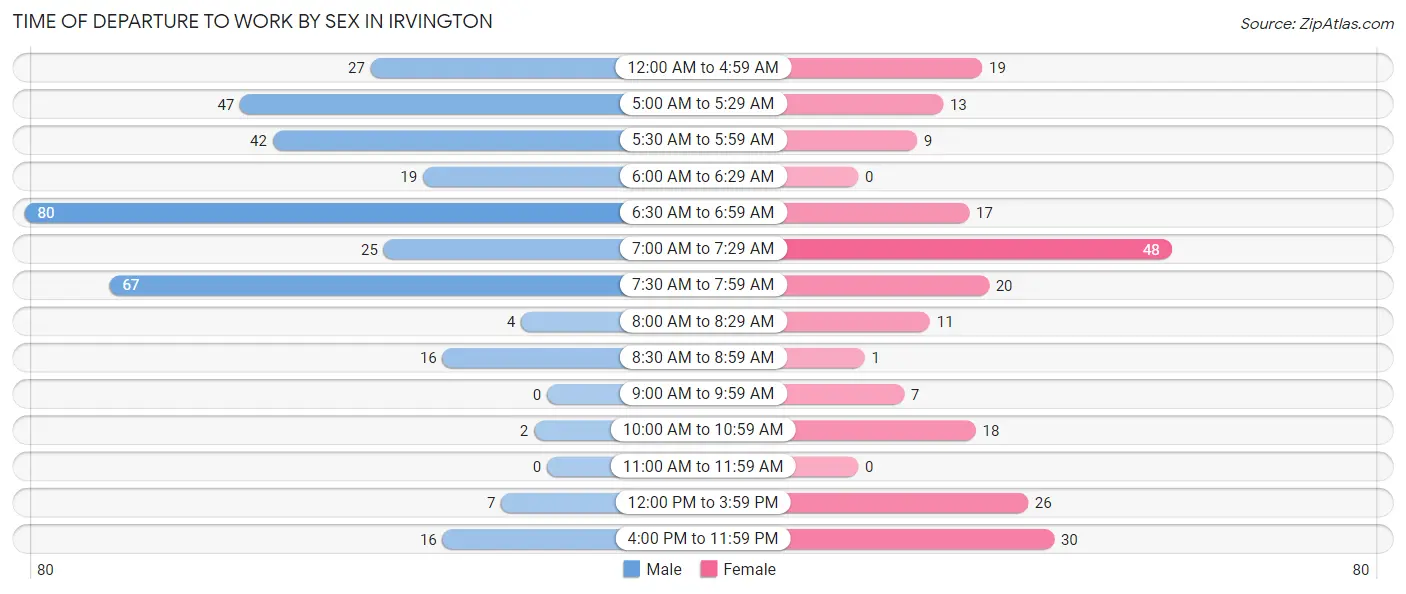
| Time of Departure | Male | Female |
| 12:00 AM to 4:59 AM | 27 (7.7%) | 19 (8.7%) |
| 5:00 AM to 5:29 AM | 47 (13.4%) | 13 (5.9%) |
| 5:30 AM to 5:59 AM | 42 (11.9%) | 9 (4.1%) |
| 6:00 AM to 6:29 AM | 19 (5.4%) | 0 (0.0%) |
| 6:30 AM to 6:59 AM | 80 (22.7%) | 17 (7.8%) |
| 7:00 AM to 7:29 AM | 25 (7.1%) | 48 (21.9%) |
| 7:30 AM to 7:59 AM | 67 (19.0%) | 20 (9.1%) |
| 8:00 AM to 8:29 AM | 4 (1.1%) | 11 (5.0%) |
| 8:30 AM to 8:59 AM | 16 (4.5%) | 1 (0.5%) |
| 9:00 AM to 9:59 AM | 0 (0.0%) | 7 (3.2%) |
| 10:00 AM to 10:59 AM | 2 (0.6%) | 18 (8.2%) |
| 11:00 AM to 11:59 AM | 0 (0.0%) | 0 (0.0%) |
| 12:00 PM to 3:59 PM | 7 (2.0%) | 26 (11.9%) |
| 4:00 PM to 11:59 PM | 16 (4.5%) | 30 (13.7%) |
| Total | 352 (100.0%) | 219 (100.0%) |
Housing Occupancy in Irvington
Occupancy by Ownership in Irvington
Of the total 575 dwellings in Irvington, owner-occupied units account for 364 (63.3%), while renter-occupied units make up 211 (36.7%).
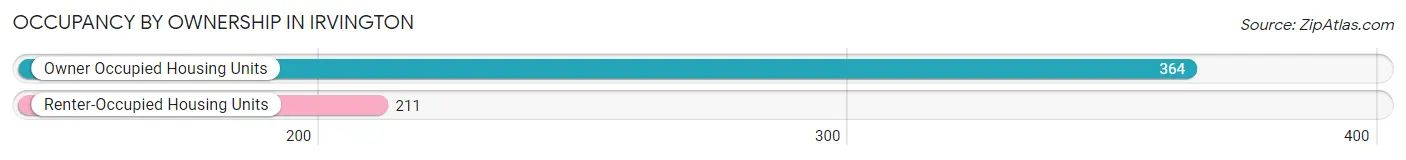
| Occupancy | # Housing Units | % Housing Units |
| Owner Occupied Housing Units | 364 | 63.3% |
| Renter-Occupied Housing Units | 211 | 36.7% |
| Total Occupied Housing Units | 575 | 100.0% |
Occupancy by Household Size in Irvington
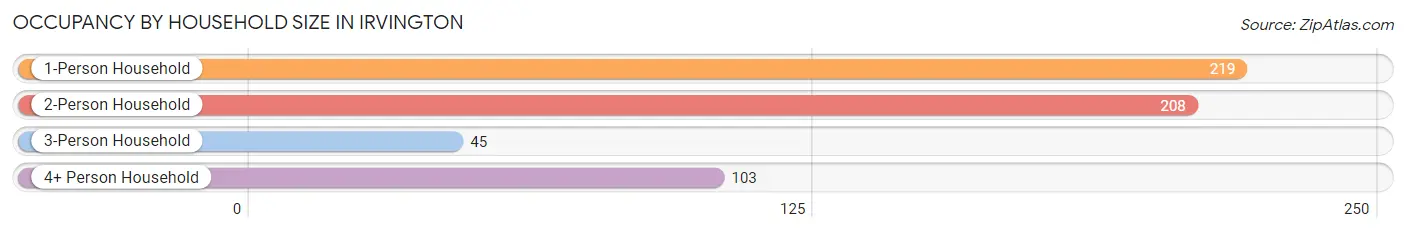
| Household Size | # Housing Units | % Housing Units |
| 1-Person Household | 219 | 38.1% |
| 2-Person Household | 208 | 36.2% |
| 3-Person Household | 45 | 7.8% |
| 4+ Person Household | 103 | 17.9% |
| Total Housing Units | 575 | 100.0% |
Occupancy by Ownership by Household Size in Irvington
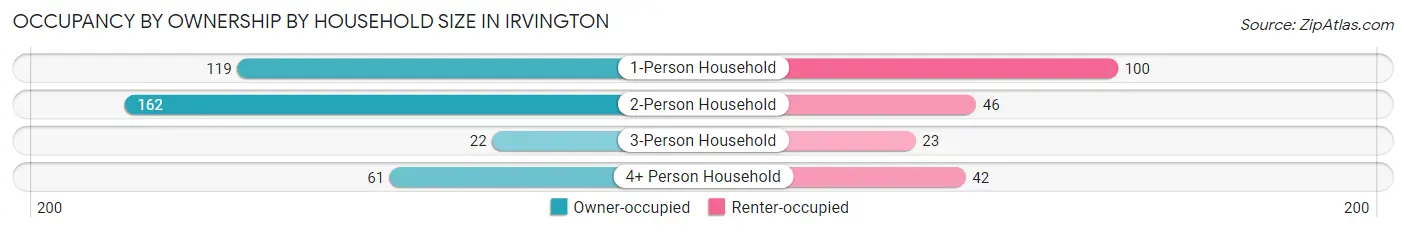
| Household Size | Owner-occupied | Renter-occupied |
| 1-Person Household | 119 (54.3%) | 100 (45.7%) |
| 2-Person Household | 162 (77.9%) | 46 (22.1%) |
| 3-Person Household | 22 (48.9%) | 23 (51.1%) |
| 4+ Person Household | 61 (59.2%) | 42 (40.8%) |
| Total Housing Units | 364 (63.3%) | 211 (36.7%) |
Occupancy by Educational Attainment in Irvington
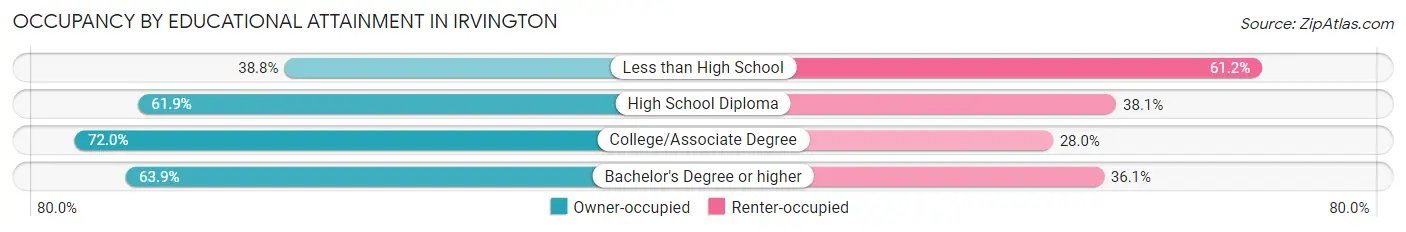
| Household Size | Owner-occupied | Renter-occupied |
| Less than High School | 26 (38.8%) | 41 (61.2%) |
| High School Diploma | 153 (61.9%) | 94 (38.1%) |
| College/Associate Degree | 162 (72.0%) | 63 (28.0%) |
| Bachelor's Degree or higher | 23 (63.9%) | 13 (36.1%) |
Occupancy by Age of Householder in Irvington
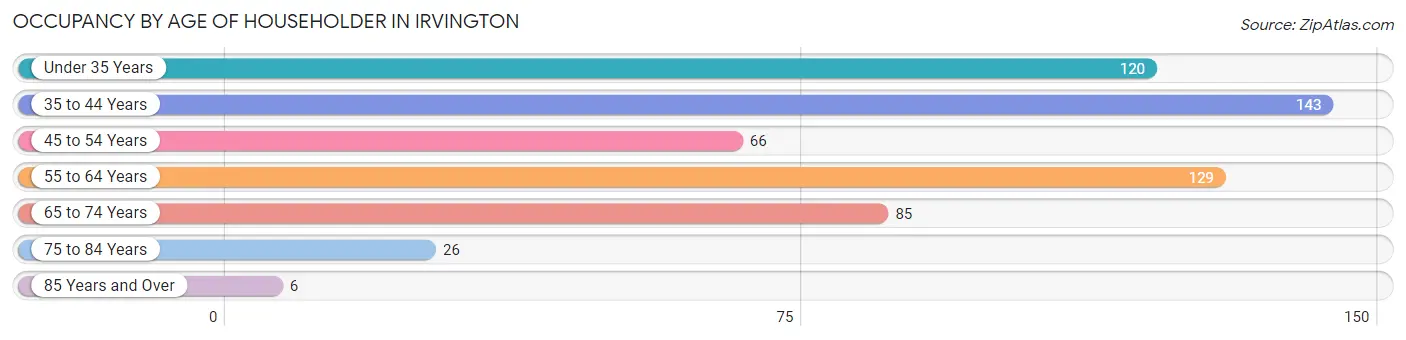
| Age Bracket | # Households | % Households |
| Under 35 Years | 120 | 20.9% |
| 35 to 44 Years | 143 | 24.9% |
| 45 to 54 Years | 66 | 11.5% |
| 55 to 64 Years | 129 | 22.4% |
| 65 to 74 Years | 85 | 14.8% |
| 75 to 84 Years | 26 | 4.5% |
| 85 Years and Over | 6 | 1.0% |
| Total | 575 | 100.0% |
Housing Finances in Irvington
Median Income by Occupancy in Irvington
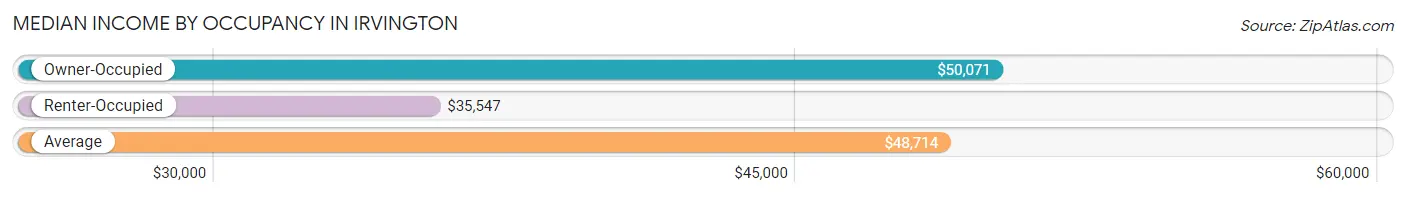
| Occupancy Type | # Households | Median Income |
| Owner-Occupied | 364 (63.3%) | $50,071 |
| Renter-Occupied | 211 (36.7%) | $35,547 |
| Average | 575 (100.0%) | $48,714 |
Occupancy by Householder Income Bracket in Irvington
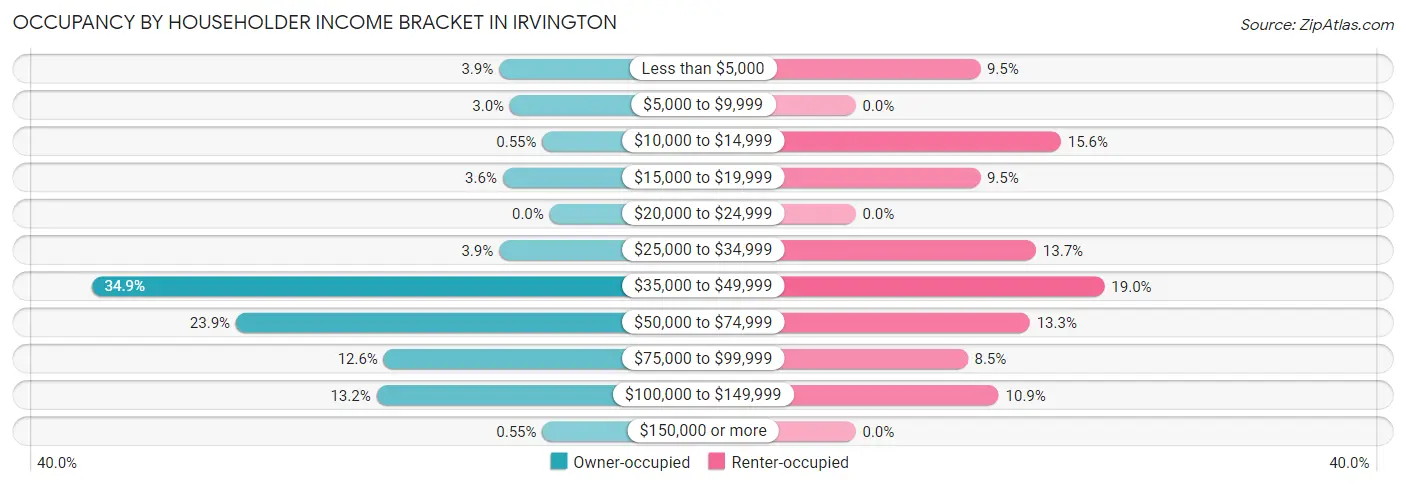
| Income Bracket | Owner-occupied | Renter-occupied |
| Less than $5,000 | 14 (3.8%) | 20 (9.5%) |
| $5,000 to $9,999 | 11 (3.0%) | 0 (0.0%) |
| $10,000 to $14,999 | 2 (0.5%) | 33 (15.6%) |
| $15,000 to $19,999 | 13 (3.6%) | 20 (9.5%) |
| $20,000 to $24,999 | 0 (0.0%) | 0 (0.0%) |
| $25,000 to $34,999 | 14 (3.8%) | 29 (13.7%) |
| $35,000 to $49,999 | 127 (34.9%) | 40 (19.0%) |
| $50,000 to $74,999 | 87 (23.9%) | 28 (13.3%) |
| $75,000 to $99,999 | 46 (12.6%) | 18 (8.5%) |
| $100,000 to $149,999 | 48 (13.2%) | 23 (10.9%) |
| $150,000 or more | 2 (0.5%) | 0 (0.0%) |
| Total | 364 (100.0%) | 211 (100.0%) |
Monthly Housing Cost Tiers in Irvington
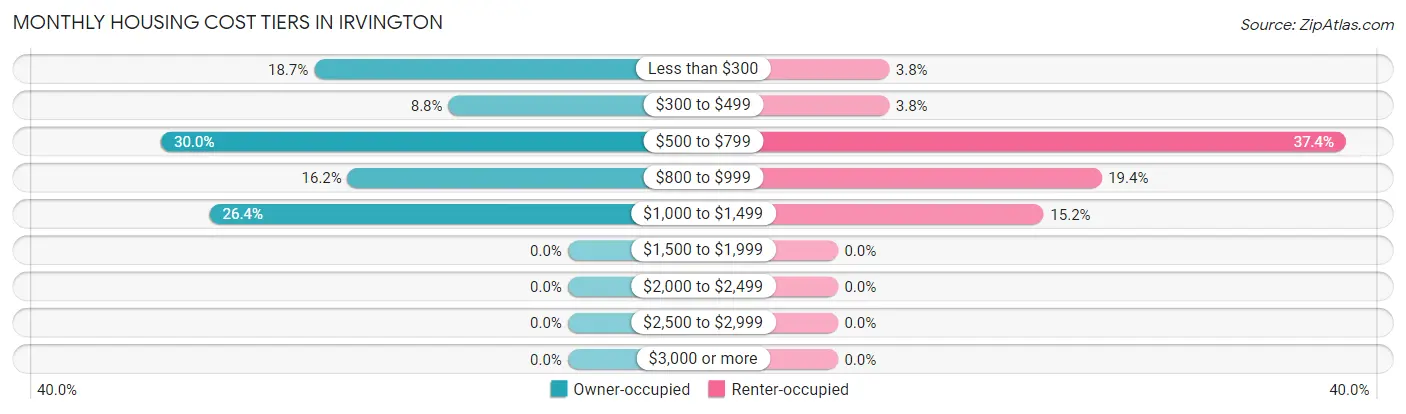
| Monthly Cost | Owner-occupied | Renter-occupied |
| Less than $300 | 68 (18.7%) | 8 (3.8%) |
| $300 to $499 | 32 (8.8%) | 8 (3.8%) |
| $500 to $799 | 109 (29.9%) | 79 (37.4%) |
| $800 to $999 | 59 (16.2%) | 41 (19.4%) |
| $1,000 to $1,499 | 96 (26.4%) | 32 (15.2%) |
| $1,500 to $1,999 | 0 (0.0%) | 0 (0.0%) |
| $2,000 to $2,499 | 0 (0.0%) | 0 (0.0%) |
| $2,500 to $2,999 | 0 (0.0%) | 0 (0.0%) |
| $3,000 or more | 0 (0.0%) | 0 (0.0%) |
| Total | 364 (100.0%) | 211 (100.0%) |
Physical Housing Characteristics in Irvington
Housing Structures in Irvington
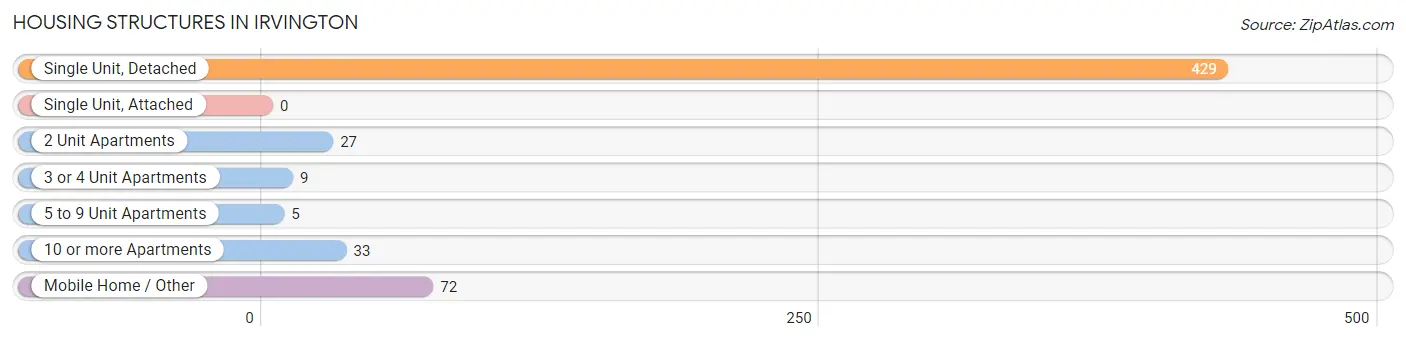
| Structure Type | # Housing Units | % Housing Units |
| Single Unit, Detached | 429 | 74.6% |
| Single Unit, Attached | 0 | 0.0% |
| 2 Unit Apartments | 27 | 4.7% |
| 3 or 4 Unit Apartments | 9 | 1.6% |
| 5 to 9 Unit Apartments | 5 | 0.9% |
| 10 or more Apartments | 33 | 5.7% |
| Mobile Home / Other | 72 | 12.5% |
| Total | 575 | 100.0% |
Housing Structures by Occupancy in Irvington
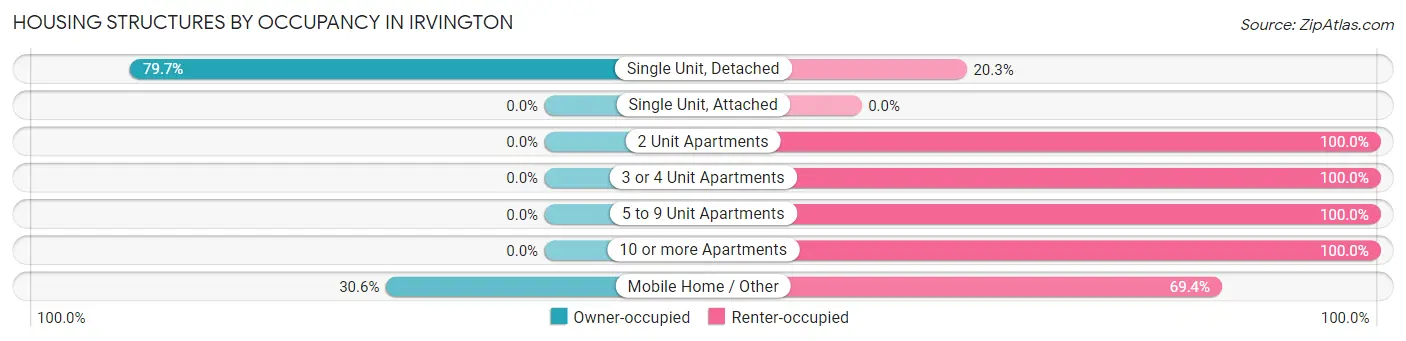
| Structure Type | Owner-occupied | Renter-occupied |
| Single Unit, Detached | 342 (79.7%) | 87 (20.3%) |
| Single Unit, Attached | 0 (0.0%) | 0 (0.0%) |
| 2 Unit Apartments | 0 (0.0%) | 27 (100.0%) |
| 3 or 4 Unit Apartments | 0 (0.0%) | 9 (100.0%) |
| 5 to 9 Unit Apartments | 0 (0.0%) | 5 (100.0%) |
| 10 or more Apartments | 0 (0.0%) | 33 (100.0%) |
| Mobile Home / Other | 22 (30.6%) | 50 (69.4%) |
| Total | 364 (63.3%) | 211 (36.7%) |
Housing Structures by Number of Rooms in Irvington
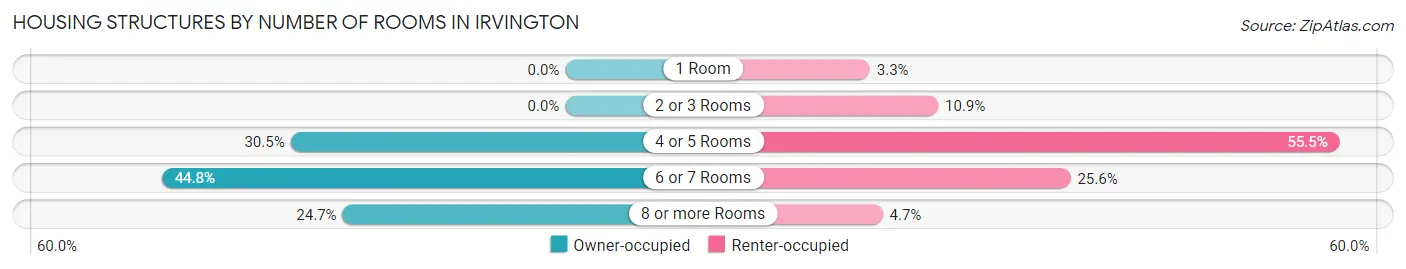
| Number of Rooms | Owner-occupied | Renter-occupied |
| 1 Room | 0 (0.0%) | 7 (3.3%) |
| 2 or 3 Rooms | 0 (0.0%) | 23 (10.9%) |
| 4 or 5 Rooms | 111 (30.5%) | 117 (55.4%) |
| 6 or 7 Rooms | 163 (44.8%) | 54 (25.6%) |
| 8 or more Rooms | 90 (24.7%) | 10 (4.7%) |
| Total | 364 (100.0%) | 211 (100.0%) |
Housing Structure by Heating Type in Irvington
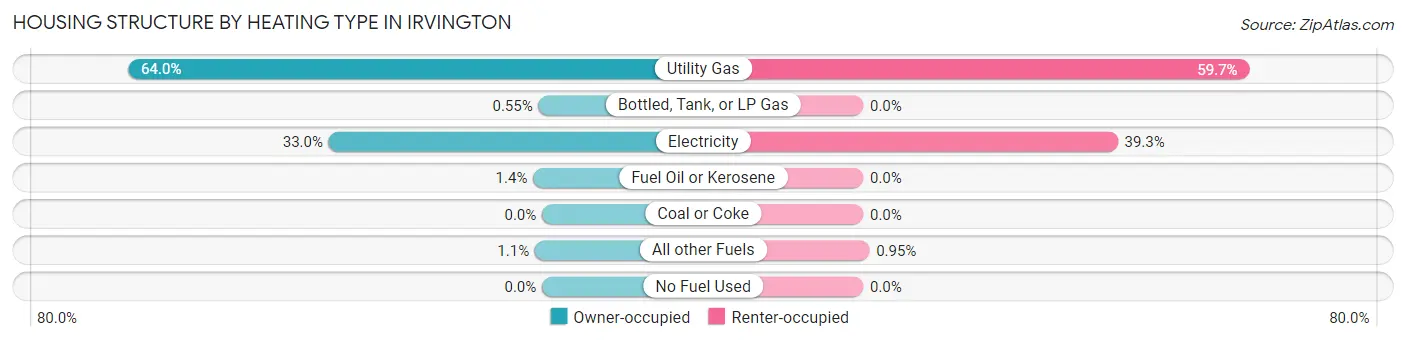
| Heating Type | Owner-occupied | Renter-occupied |
| Utility Gas | 233 (64.0%) | 126 (59.7%) |
| Bottled, Tank, or LP Gas | 2 (0.5%) | 0 (0.0%) |
| Electricity | 120 (33.0%) | 83 (39.3%) |
| Fuel Oil or Kerosene | 5 (1.4%) | 0 (0.0%) |
| Coal or Coke | 0 (0.0%) | 0 (0.0%) |
| All other Fuels | 4 (1.1%) | 2 (0.9%) |
| No Fuel Used | 0 (0.0%) | 0 (0.0%) |
| Total | 364 (100.0%) | 211 (100.0%) |
Household Vehicle Usage in Irvington
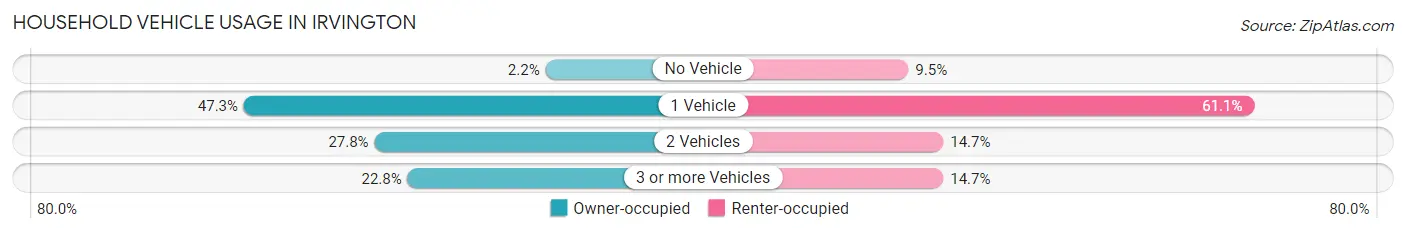
| Vehicles per Household | Owner-occupied | Renter-occupied |
| No Vehicle | 8 (2.2%) | 20 (9.5%) |
| 1 Vehicle | 172 (47.2%) | 129 (61.1%) |
| 2 Vehicles | 101 (27.8%) | 31 (14.7%) |
| 3 or more Vehicles | 83 (22.8%) | 31 (14.7%) |
| Total | 364 (100.0%) | 211 (100.0%) |
Real Estate & Mortgages in Irvington
Real Estate and Mortgage Overview in Irvington
| Characteristic | Without Mortgage | With Mortgage |
| Housing Units | 130 | 234 |
| Median Property Value | $106,300 | $119,300 |
| Median Household Income | $51,477 | $0 |
| Monthly Housing Costs | $295 | $0 |
| Real Estate Taxes | $533 | $8 |
Property Value by Mortgage Status in Irvington
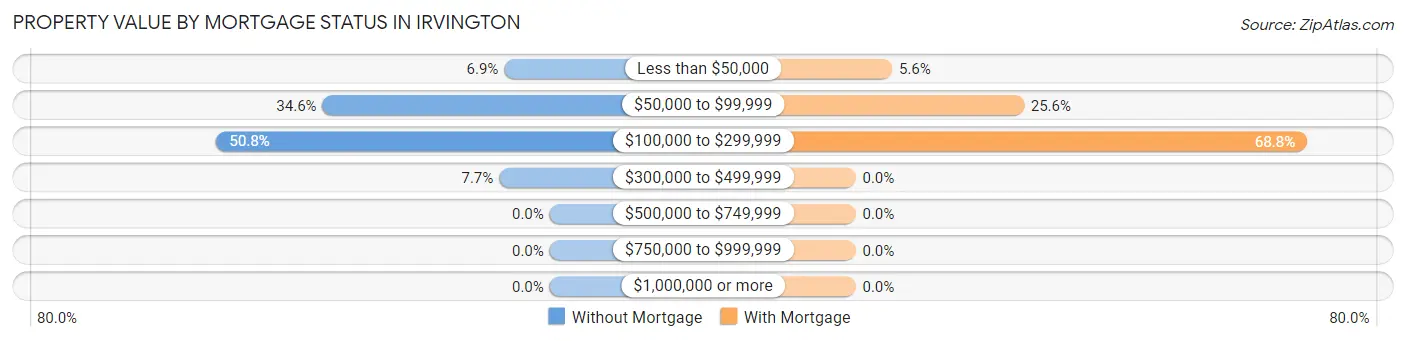
| Property Value | Without Mortgage | With Mortgage |
| Less than $50,000 | 9 (6.9%) | 13 (5.6%) |
| $50,000 to $99,999 | 45 (34.6%) | 60 (25.6%) |
| $100,000 to $299,999 | 66 (50.8%) | 161 (68.8%) |
| $300,000 to $499,999 | 10 (7.7%) | 0 (0.0%) |
| $500,000 to $749,999 | 0 (0.0%) | 0 (0.0%) |
| $750,000 to $999,999 | 0 (0.0%) | 0 (0.0%) |
| $1,000,000 or more | 0 (0.0%) | 0 (0.0%) |
| Total | 130 (100.0%) | 234 (100.0%) |
Household Income by Mortgage Status in Irvington
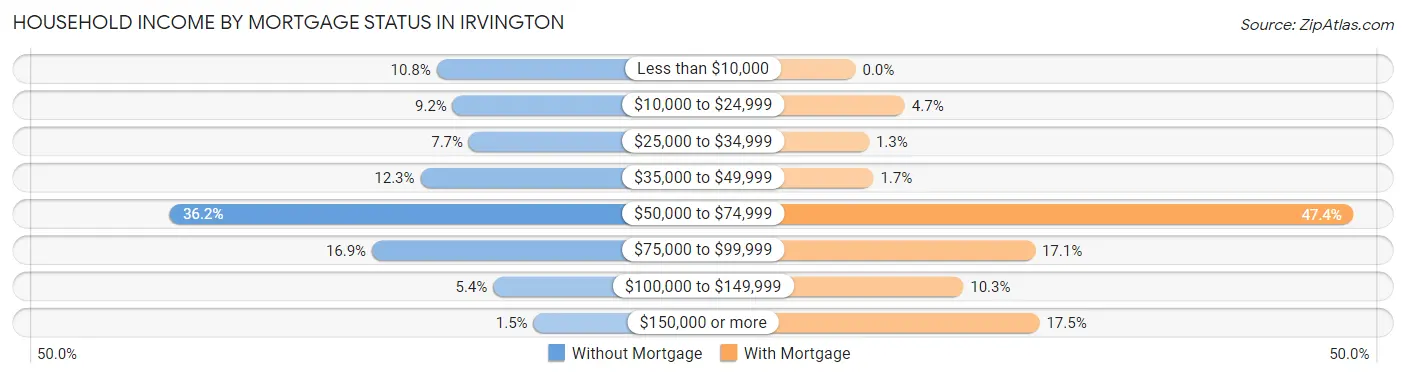
| Household Income | Without Mortgage | With Mortgage |
| Less than $10,000 | 14 (10.8%) | 0 (0.0%) |
| $10,000 to $24,999 | 12 (9.2%) | 11 (4.7%) |
| $25,000 to $34,999 | 10 (7.7%) | 3 (1.3%) |
| $35,000 to $49,999 | 16 (12.3%) | 4 (1.7%) |
| $50,000 to $74,999 | 47 (36.1%) | 111 (47.4%) |
| $75,000 to $99,999 | 22 (16.9%) | 40 (17.1%) |
| $100,000 to $149,999 | 7 (5.4%) | 24 (10.3%) |
| $150,000 or more | 2 (1.5%) | 41 (17.5%) |
| Total | 130 (100.0%) | 234 (100.0%) |
Property Value to Household Income Ratio in Irvington
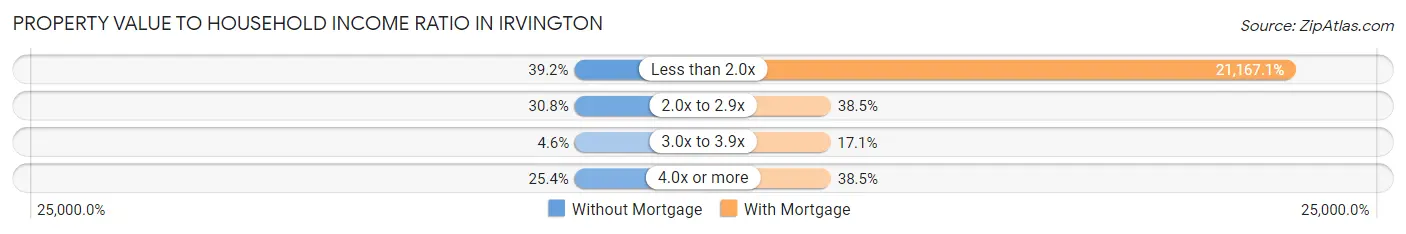
| Value-to-Income Ratio | Without Mortgage | With Mortgage |
| Less than 2.0x | 51 (39.2%) | 49,531 (21,167.1%) |
| 2.0x to 2.9x | 40 (30.8%) | 90 (38.5%) |
| 3.0x to 3.9x | 6 (4.6%) | 40 (17.1%) |
| 4.0x or more | 33 (25.4%) | 90 (38.5%) |
| Total | 130 (100.0%) | 234 (100.0%) |
Real Estate Taxes by Mortgage Status in Irvington
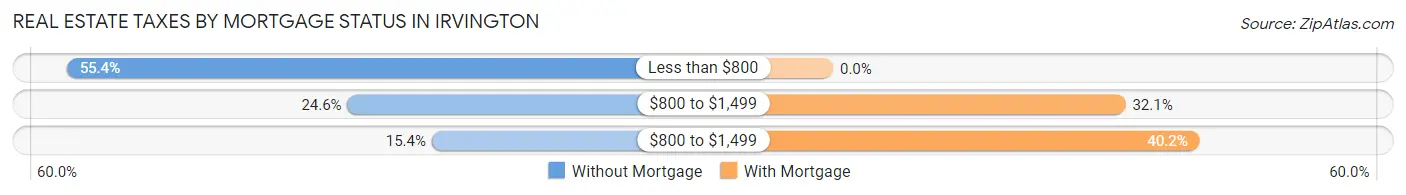
| Property Taxes | Without Mortgage | With Mortgage |
| Less than $800 | 72 (55.4%) | 0 (0.0%) |
| $800 to $1,499 | 32 (24.6%) | 75 (32.1%) |
| $800 to $1,499 | 20 (15.4%) | 94 (40.2%) |
| Total | 130 (100.0%) | 234 (100.0%) |
Health & Disability in Irvington
Health Insurance Coverage by Age in Irvington
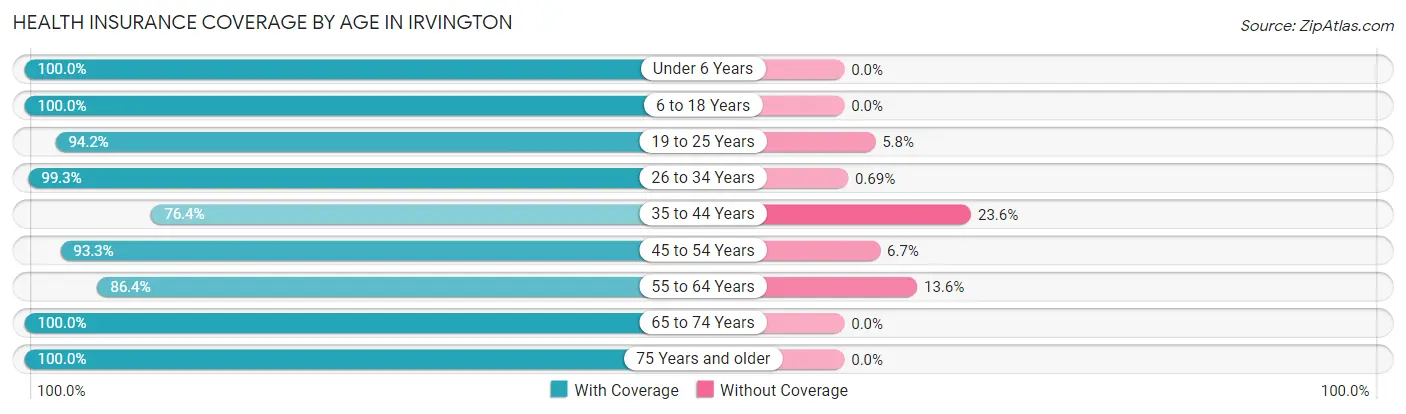
| Age Bracket | With Coverage | Without Coverage |
| Under 6 Years | 137 (100.0%) | 0 (0.0%) |
| 6 to 18 Years | 218 (100.0%) | 0 (0.0%) |
| 19 to 25 Years | 131 (94.2%) | 8 (5.8%) |
| 26 to 34 Years | 143 (99.3%) | 1 (0.7%) |
| 35 to 44 Years | 168 (76.4%) | 52 (23.6%) |
| 45 to 54 Years | 154 (93.3%) | 11 (6.7%) |
| 55 to 64 Years | 153 (86.4%) | 24 (13.6%) |
| 65 to 74 Years | 115 (100.0%) | 0 (0.0%) |
| 75 Years and older | 72 (100.0%) | 0 (0.0%) |
| Total | 1,291 (93.1%) | 96 (6.9%) |
Health Insurance Coverage by Citizenship Status in Irvington
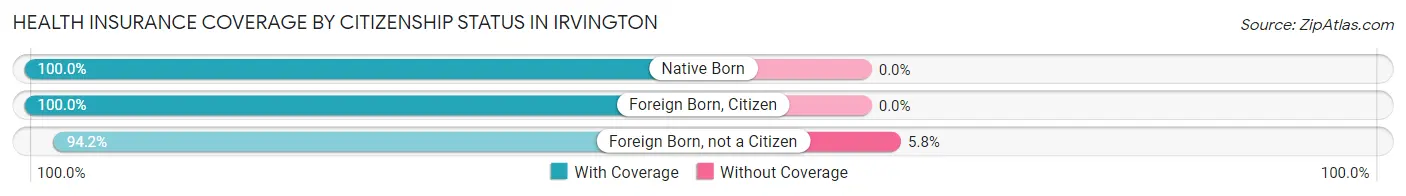
| Citizenship Status | With Coverage | Without Coverage |
| Native Born | 137 (100.0%) | 0 (0.0%) |
| Foreign Born, Citizen | 218 (100.0%) | 0 (0.0%) |
| Foreign Born, not a Citizen | 131 (94.2%) | 8 (5.8%) |
Health Insurance Coverage by Household Income in Irvington
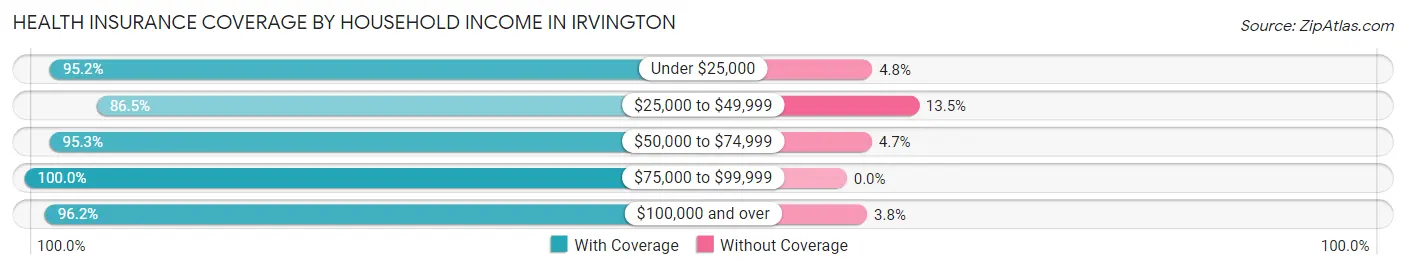
| Household Income | With Coverage | Without Coverage |
| Under $25,000 | 220 (95.2%) | 11 (4.8%) |
| $25,000 to $49,999 | 397 (86.5%) | 62 (13.5%) |
| $50,000 to $74,999 | 305 (95.3%) | 15 (4.7%) |
| $75,000 to $99,999 | 167 (100.0%) | 0 (0.0%) |
| $100,000 and over | 202 (96.2%) | 8 (3.8%) |
Public vs Private Health Insurance Coverage by Age in Irvington
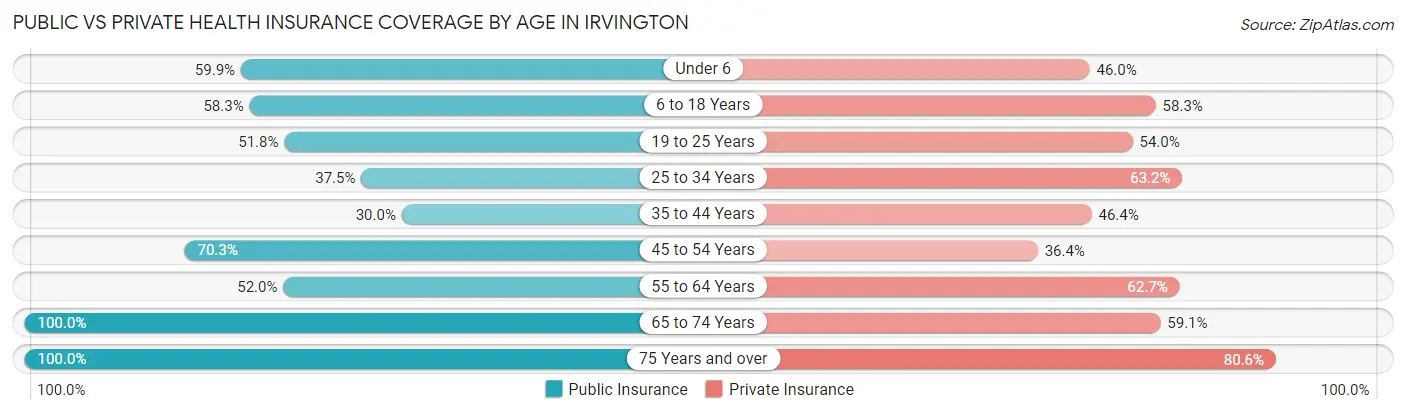
| Age Bracket | Public Insurance | Private Insurance |
| Under 6 | 82 (59.9%) | 63 (46.0%) |
| 6 to 18 Years | 127 (58.3%) | 127 (58.3%) |
| 19 to 25 Years | 72 (51.8%) | 75 (54.0%) |
| 25 to 34 Years | 54 (37.5%) | 91 (63.2%) |
| 35 to 44 Years | 66 (30.0%) | 102 (46.4%) |
| 45 to 54 Years | 116 (70.3%) | 60 (36.4%) |
| 55 to 64 Years | 92 (52.0%) | 111 (62.7%) |
| 65 to 74 Years | 115 (100.0%) | 68 (59.1%) |
| 75 Years and over | 72 (100.0%) | 58 (80.6%) |
| Total | 796 (57.4%) | 755 (54.4%) |
Disability Status by Sex by Age in Irvington
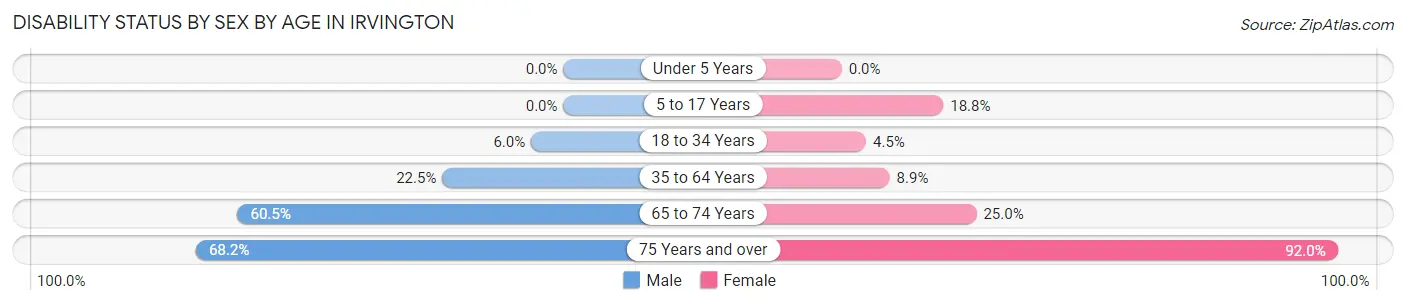
| Age Bracket | Male | Female |
| Under 5 Years | 0 (0.0%) | 0 (0.0%) |
| 5 to 17 Years | 0 (0.0%) | 26 (18.8%) |
| 18 to 34 Years | 9 (6.0%) | 6 (4.5%) |
| 35 to 64 Years | 58 (22.5%) | 27 (8.9%) |
| 65 to 74 Years | 26 (60.5%) | 18 (25.0%) |
| 75 Years and over | 15 (68.2%) | 46 (92.0%) |
Disability Class by Sex by Age in Irvington
Disability Class: Hearing Difficulty
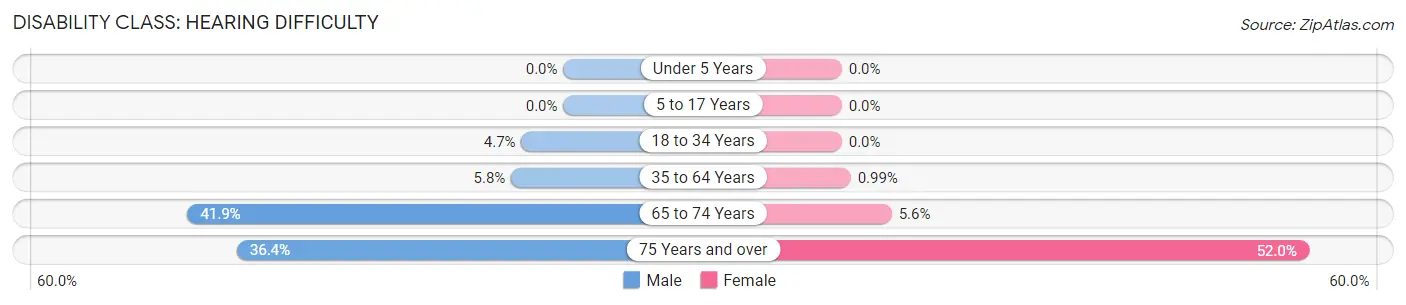
| Age Bracket | Male | Female |
| Under 5 Years | 0 (0.0%) | 0 (0.0%) |
| 5 to 17 Years | 0 (0.0%) | 0 (0.0%) |
| 18 to 34 Years | 7 (4.7%) | 0 (0.0%) |
| 35 to 64 Years | 15 (5.8%) | 3 (1.0%) |
| 65 to 74 Years | 18 (41.9%) | 4 (5.6%) |
| 75 Years and over | 8 (36.4%) | 26 (52.0%) |
Disability Class: Vision Difficulty
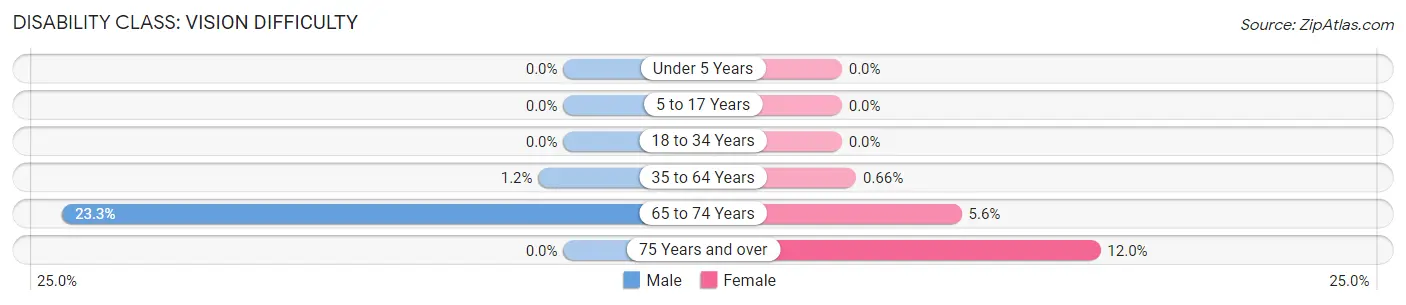
| Age Bracket | Male | Female |
| Under 5 Years | 0 (0.0%) | 0 (0.0%) |
| 5 to 17 Years | 0 (0.0%) | 0 (0.0%) |
| 18 to 34 Years | 0 (0.0%) | 0 (0.0%) |
| 35 to 64 Years | 3 (1.2%) | 2 (0.7%) |
| 65 to 74 Years | 10 (23.3%) | 4 (5.6%) |
| 75 Years and over | 0 (0.0%) | 6 (12.0%) |
Disability Class: Cognitive Difficulty
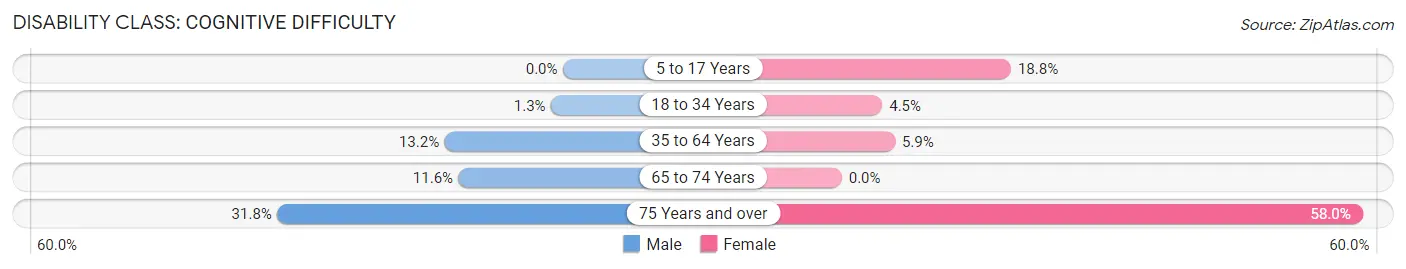
| Age Bracket | Male | Female |
| 5 to 17 Years | 0 (0.0%) | 26 (18.8%) |
| 18 to 34 Years | 2 (1.3%) | 6 (4.5%) |
| 35 to 64 Years | 34 (13.2%) | 18 (5.9%) |
| 65 to 74 Years | 5 (11.6%) | 0 (0.0%) |
| 75 Years and over | 7 (31.8%) | 29 (58.0%) |
Disability Class: Ambulatory Difficulty
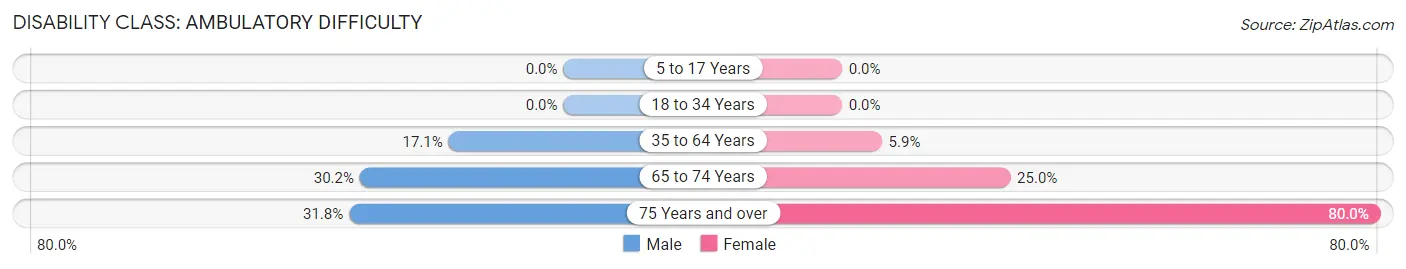
| Age Bracket | Male | Female |
| 5 to 17 Years | 0 (0.0%) | 0 (0.0%) |
| 18 to 34 Years | 0 (0.0%) | 0 (0.0%) |
| 35 to 64 Years | 44 (17.1%) | 18 (5.9%) |
| 65 to 74 Years | 13 (30.2%) | 18 (25.0%) |
| 75 Years and over | 7 (31.8%) | 40 (80.0%) |
Disability Class: Self-Care Difficulty
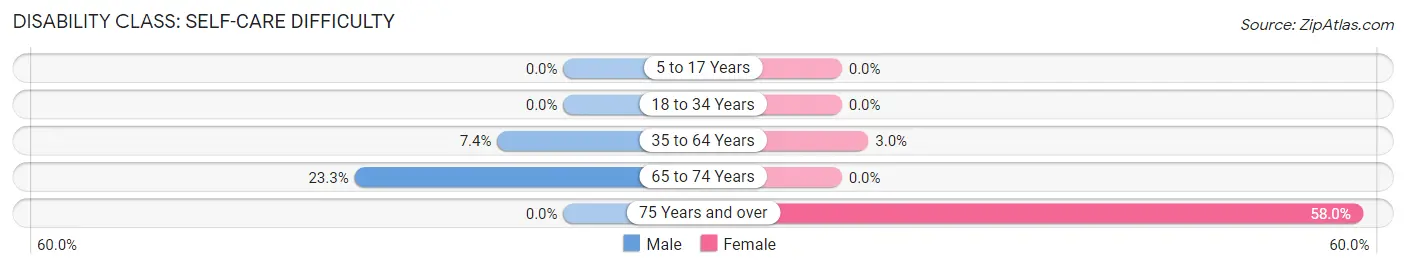
| Age Bracket | Male | Female |
| 5 to 17 Years | 0 (0.0%) | 0 (0.0%) |
| 18 to 34 Years | 0 (0.0%) | 0 (0.0%) |
| 35 to 64 Years | 19 (7.4%) | 9 (3.0%) |
| 65 to 74 Years | 10 (23.3%) | 0 (0.0%) |
| 75 Years and over | 0 (0.0%) | 29 (58.0%) |
Technology Access in Irvington
Computing Device Access in Irvington
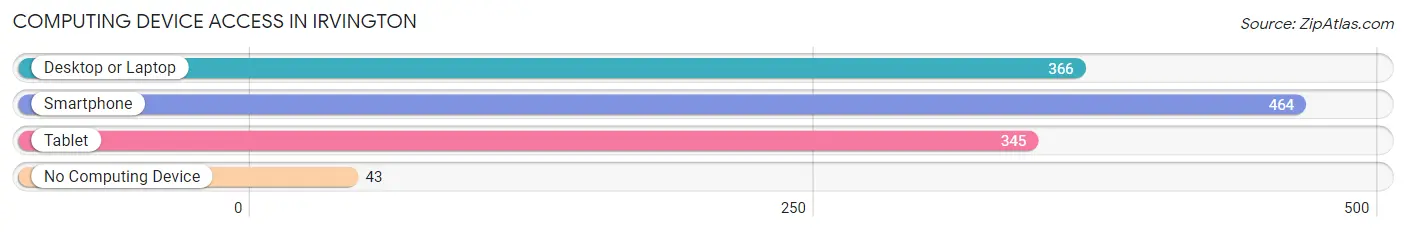
| Device Type | # Households | % Households |
| Desktop or Laptop | 366 | 63.6% |
| Smartphone | 464 | 80.7% |
| Tablet | 345 | 60.0% |
| No Computing Device | 43 | 7.5% |
| Total | 575 | 100.0% |
Internet Access in Irvington
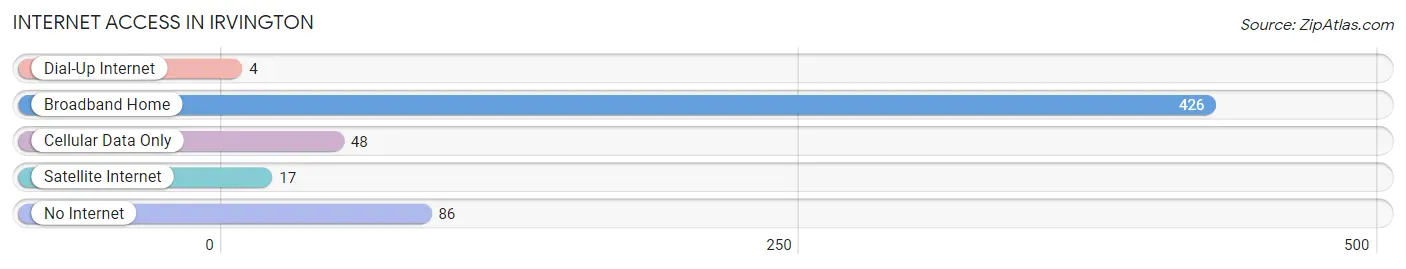
| Internet Type | # Households | % Households |
| Dial-Up Internet | 4 | 0.7% |
| Broadband Home | 426 | 74.1% |
| Cellular Data Only | 48 | 8.4% |
| Satellite Internet | 17 | 3.0% |
| No Internet | 86 | 15.0% |
| Total | 575 | 100.0% |
Irvington Summary
Irvington, Kentucky is a small town located in Breckinridge County, Kentucky. It is situated on the banks of the Ohio River, and is part of the Louisville metropolitan area. The town has a population of approximately 1,500 people, and is known for its rural charm and small-town atmosphere.
History
Irvington was founded in 1818 by William Irving, a Revolutionary War veteran. The town was named after him, and was originally known as Irvinton. The town was incorporated in 1837, and was the county seat of Breckinridge County until 1891.
In the late 19th century, Irvington was a thriving river port, and was home to several businesses, including a sawmill, a grist mill, and a tobacco warehouse. The town was also home to a number of churches, including the First Baptist Church, which was founded in 1845.
In the early 20th century, Irvington was a popular tourist destination, and was home to several resorts and hotels. The town was also home to a number of businesses, including a canning factory, a flour mill, and a furniture factory.
Geography
Irvington is located in Breckinridge County, Kentucky, on the banks of the Ohio River. The town is situated at an elevation of 545 feet above sea level. The town is located approximately 30 miles south of Louisville, and is part of the Louisville metropolitan area.
The climate in Irvington is humid subtropical, with hot, humid summers and mild winters. The average annual temperature is 61 degrees Fahrenheit, and the average annual precipitation is 44 inches.
Economy
The economy of Irvington is largely based on agriculture and tourism. The town is home to several farms, and is known for its production of tobacco, corn, and soybeans. The town is also home to several wineries, and is a popular destination for wine tours.
The town is also home to several small businesses, including restaurants, shops, and a hardware store. The town is also home to a number of bed and breakfasts, and is a popular destination for tourists.
Demographics
As of the 2010 census, the population of Irvington was 1,500. The racial makeup of the town was 97.3% White, 0.7% African American, 0.3% Native American, 0.3% Asian, and 1.3% from other races. The median household income was $37,500, and the median family income was $45,000.
Conclusion
Irvington, Kentucky is a small town located in Breckinridge County, Kentucky. It is situated on the banks of the Ohio River, and is part of the Louisville metropolitan area. The town has a population of approximately 1,500 people, and is known for its rural charm and small-town atmosphere. The economy of Irvington is largely based on agriculture and tourism, and the town is home to several farms, wineries, and small businesses. The racial makeup of the town is predominantly White, with a small percentage of African American, Native American, and Asian residents.
Common Questions
What is Per Capita Income in Irvington?
Per Capita income in Irvington is $24,924.
What is the Median Family Income in Irvington?
Median Family Income in Irvington is $49,167.
What is the Median Household income in Irvington?
Median Household Income in Irvington is $48,714.
What is Income or Wage Gap in Irvington?
Income or Wage Gap in Irvington is 57.4%.
Women in Irvington earn 42.6 cents for every dollar earned by a man.
What is Family Income Deficit in Irvington?
Family Income Deficit in Irvington is $13,709.
Families that are below poverty line in Irvington earn $13,709 less on average than the poverty threshold level.
What is Inequality or Gini Index in Irvington?
Inequality or Gini Index in Irvington is 0.37.
What is the Total Population of Irvington?
Total Population of Irvington is 1,387.
What is the Total Male Population of Irvington?
Total Male Population of Irvington is 578.
What is the Total Female Population of Irvington?
Total Female Population of Irvington is 809.
What is the Ratio of Males per 100 Females in Irvington?
There are 71.45 Males per 100 Females in Irvington.
What is the Ratio of Females per 100 Males in Irvington?
There are 139.97 Females per 100 Males in Irvington.
What is the Median Population Age in Irvington?
Median Population Age in Irvington is 38.5 Years.
What is the Average Family Size in Irvington
Average Family Size in Irvington is 3.2 People.
What is the Average Household Size in Irvington
Average Household Size in Irvington is 2.4 People.
How Large is the Labor Force in Irvington?
There are 660 People in the Labor Forcein in Irvington.
What is the Percentage of People in the Labor Force in Irvington?
62.9% of People are in the Labor Force in Irvington.
What is the Unemployment Rate in Irvington?
Unemployment Rate in Irvington is 11.4%.