Ironville, KY Map & Demographics
Ironville Map
Ironville Overview
$22,118
PER CAPITA INCOME
$46,875
AVG FAMILY INCOME
$46,386
AVG HOUSEHOLD INCOME
0.29
INEQUALITY / GINI INDEX
735
TOTAL POPULATION
345
MALE POPULATION
390
FEMALE POPULATION
88.46
MALES / 100 FEMALES
113.04
FEMALES / 100 MALES
37.1
MEDIAN AGE
2.9
AVG FAMILY SIZE
2.8
AVG HOUSEHOLD SIZE
383
LABOR FORCE [ PEOPLE ]
69.6%
PERCENT IN LABOR FORCE
Income in Ironville
Income Overview in Ironville
Per Capita Income in Ironville is $22,118, while median incomes of families and households are $46,875 and $46,386 respectively.
| Characteristic | Number | Measure |
| Per Capita Income | 735 | $22,118 |
| Median Family Income | 196 | $46,875 |
| Mean Family Income | 196 | $59,155 |
| Median Household Income | 264 | $46,386 |
| Mean Household Income | 264 | $59,726 |
| Income Deficit | 196 | $0 |
| Wage / Income Gap (%) | 735 | 0.00% |
| Wage / Income Gap ($) | 735 | 100.00¢ per $1 |
| Gini / Inequality Index | 735 | 0.29 |
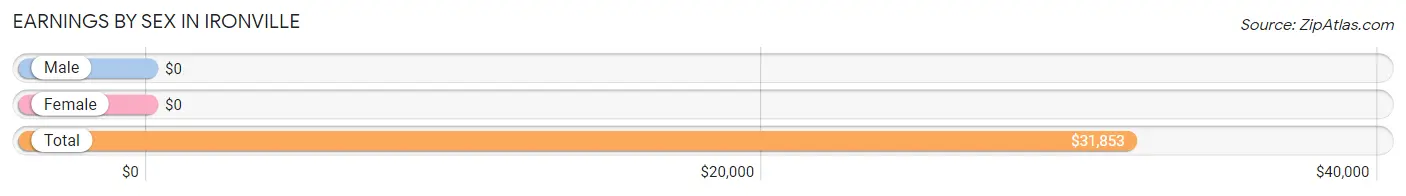
Earnings by Sex in Ironville
| Sex | Number | Average Earnings |
| Male | 180 (47.0%) | $0 |
| Female | 203 (53.0%) | $0 |
| Total | 383 (100.0%) | $31,853 |
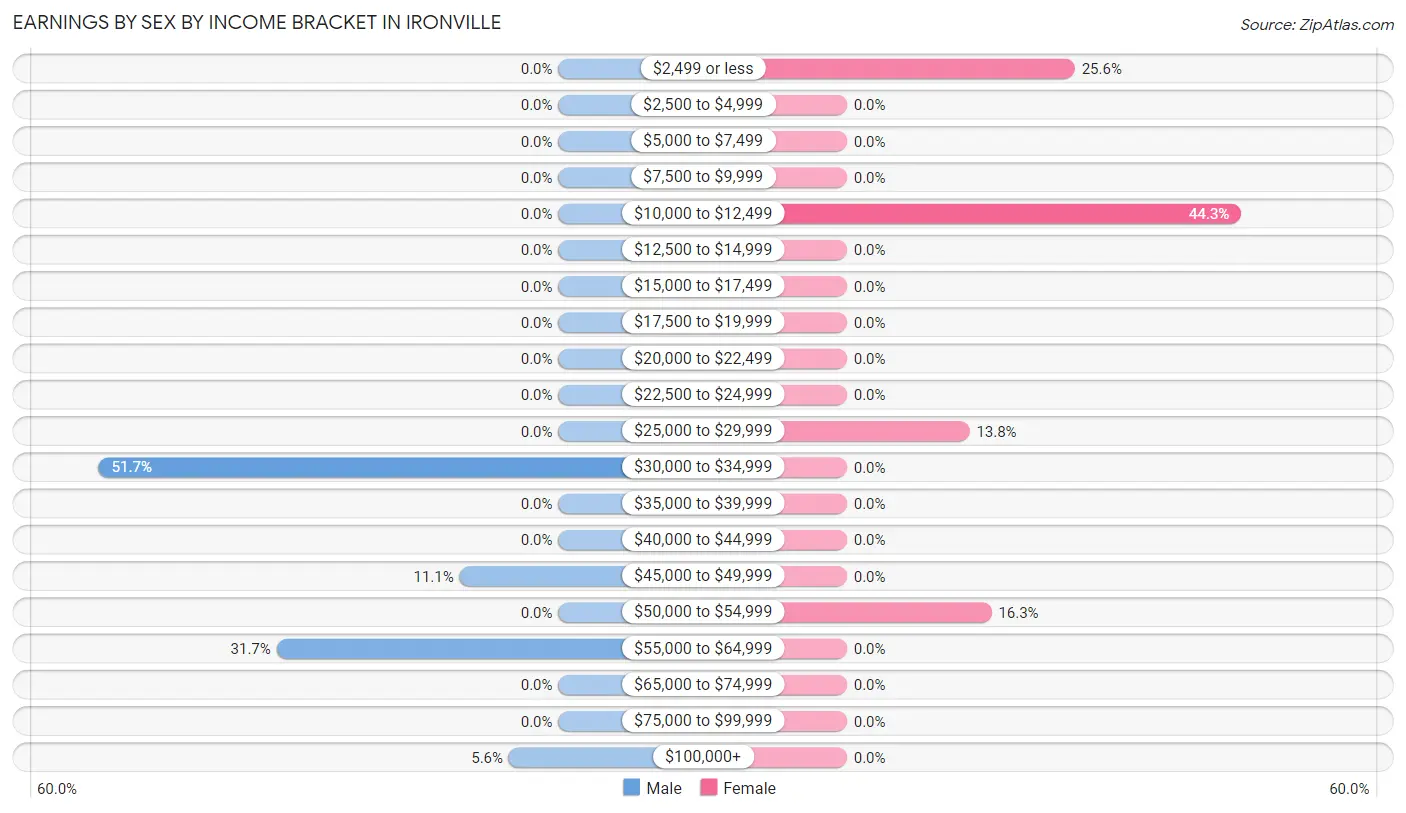
Earnings by Sex by Income Bracket in Ironville
The most common earnings brackets in Ironville are $30,000 to $34,999 for men (93 | 51.7%) and $10,000 to $12,499 for women (90 | 44.3%).
| Income | Male | Female |
| $2,499 or less | 0 (0.0%) | 52 (25.6%) |
| $2,500 to $4,999 | 0 (0.0%) | 0 (0.0%) |
| $5,000 to $7,499 | 0 (0.0%) | 0 (0.0%) |
| $7,500 to $9,999 | 0 (0.0%) | 0 (0.0%) |
| $10,000 to $12,499 | 0 (0.0%) | 90 (44.3%) |
| $12,500 to $14,999 | 0 (0.0%) | 0 (0.0%) |
| $15,000 to $17,499 | 0 (0.0%) | 0 (0.0%) |
| $17,500 to $19,999 | 0 (0.0%) | 0 (0.0%) |
| $20,000 to $22,499 | 0 (0.0%) | 0 (0.0%) |
| $22,500 to $24,999 | 0 (0.0%) | 0 (0.0%) |
| $25,000 to $29,999 | 0 (0.0%) | 28 (13.8%) |
| $30,000 to $34,999 | 93 (51.7%) | 0 (0.0%) |
| $35,000 to $39,999 | 0 (0.0%) | 0 (0.0%) |
| $40,000 to $44,999 | 0 (0.0%) | 0 (0.0%) |
| $45,000 to $49,999 | 20 (11.1%) | 0 (0.0%) |
| $50,000 to $54,999 | 0 (0.0%) | 33 (16.3%) |
| $55,000 to $64,999 | 57 (31.7%) | 0 (0.0%) |
| $65,000 to $74,999 | 0 (0.0%) | 0 (0.0%) |
| $75,000 to $99,999 | 0 (0.0%) | 0 (0.0%) |
| $100,000+ | 10 (5.6%) | 0 (0.0%) |
| Total | 180 (100.0%) | 203 (100.0%) |
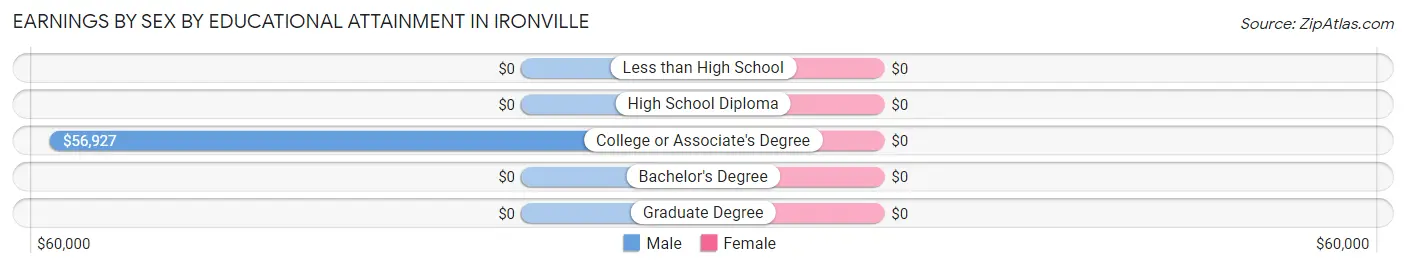
Earnings by Sex by Educational Attainment in Ironville
| Educational Attainment | Male Income | Female Income |
| Less than High School | - | - |
| High School Diploma | - | - |
| College or Associate's Degree | $56,927 | $0 |
| Bachelor's Degree | - | - |
| Graduate Degree | - | - |
| Total | $48,938 | $0 |
Family Income in Ironville
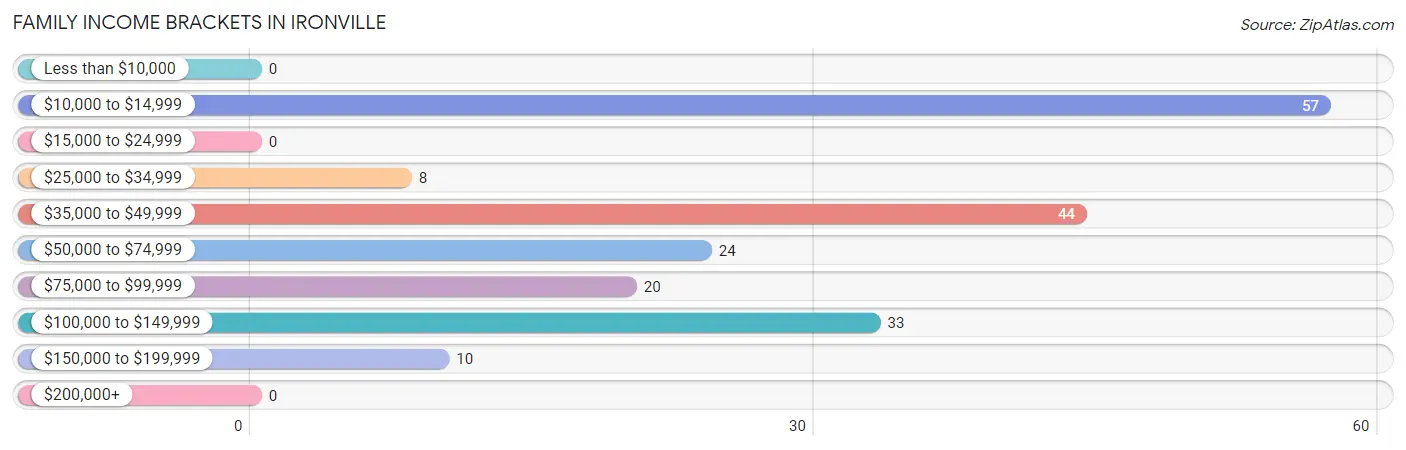
Family Income Brackets in Ironville
According to the Ironville family income data, there are 57 families falling into the $10,000 to $14,999 income range, which is the most common income bracket and makes up 29.1% of all families.
| Income Bracket | # Families | % Families |
| Less than $10,000 | 0 | 0.0% |
| $10,000 to $14,999 | 57 | 29.1% |
| $15,000 to $24,999 | 0 | 0.0% |
| $25,000 to $34,999 | 8 | 4.1% |
| $35,000 to $49,999 | 44 | 22.4% |
| $50,000 to $74,999 | 24 | 12.2% |
| $75,000 to $99,999 | 20 | 10.2% |
| $100,000 to $149,999 | 33 | 16.8% |
| $150,000 to $199,999 | 10 | 5.1% |
| $200,000+ | 0 | 0.0% |
Family Income by Famaliy Size in Ironville
| Income Bracket | # Families | Median Income |
| 2-Person Families | 74 (37.8%) | $0 |
| 3-Person Families | 57 (29.1%) | $0 |
| 4-Person Families | 65 (33.2%) | $0 |
| 5-Person Families | 0 (0.0%) | $0 |
| 6-Person Families | 0 (0.0%) | $0 |
| 7+ Person Families | 0 (0.0%) | $0 |
| Total | 196 (100.0%) | $46,875 |
Family Income by Number of Earners in Ironville
| Number of Earners | # Families | Median Income |
| No Earners | 44 (22.5%) | $0 |
| 1 Earner | 42 (21.4%) | $0 |
| 2 Earners | 110 (56.1%) | $0 |
| 3+ Earners | 0 (0.0%) | $0 |
| Total | 196 (100.0%) | $46,875 |
Household Income in Ironville
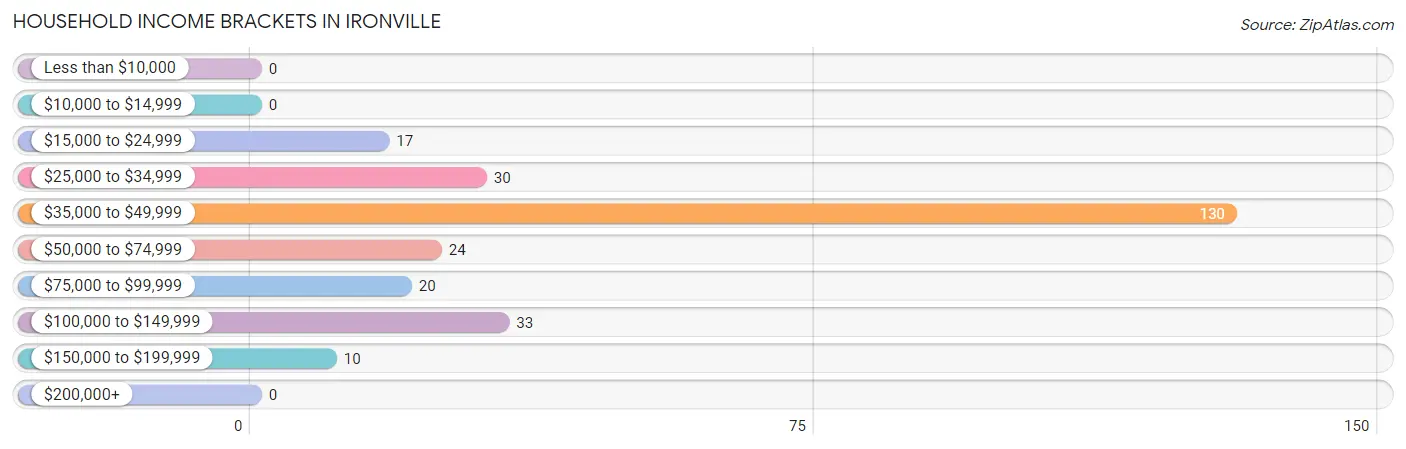
Household Income Brackets in Ironville
With 130 households falling in the category, the $35,000 to $49,999 income range is the most frequent in Ironville, accounting for 49.2% of all households.
| Income Bracket | # Households | % Households |
| Less than $10,000 | 0 | 0.0% |
| $10,000 to $14,999 | 0 | 0.0% |
| $15,000 to $24,999 | 17 | 6.4% |
| $25,000 to $34,999 | 30 | 11.4% |
| $35,000 to $49,999 | 130 | 49.2% |
| $50,000 to $74,999 | 24 | 9.1% |
| $75,000 to $99,999 | 20 | 7.6% |
| $100,000 to $149,999 | 33 | 12.5% |
| $150,000 to $199,999 | 10 | 3.8% |
| $200,000+ | 0 | 0.0% |
Household Income by Householder Age in Ironville
The median household income in Ironville is $46,386, with the highest median household income of $55,625 found in the 25 to 44 years age bracket for the primary householder. A total of 142 households (53.8%) fall into this category. Meanwhile, the 15 to 24 years age bracket for the primary householder has the lowest median household income of $0, with 29 households (11.0%) in this group.
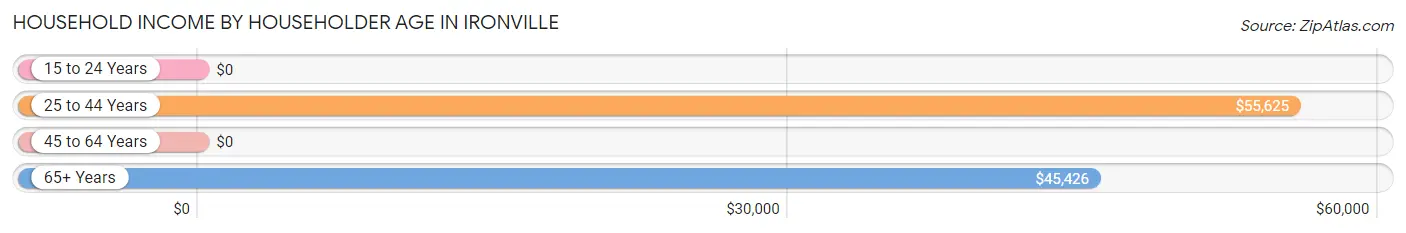
| Income Bracket | # Households | Median Income |
| 15 to 24 Years | 29 (11.0%) | $0 |
| 25 to 44 Years | 142 (53.8%) | $55,625 |
| 45 to 64 Years | 0 (0.0%) | $0 |
| 65+ Years | 93 (35.2%) | $45,426 |
| Total | 264 (100.0%) | $46,386 |
Poverty in Ironville
Income Below Poverty by Sex and Age in Ironville
With 17.4% poverty level for males and 60.0% for females among the residents of Ironville, under 5 year old males and 6 to 11 year old females are the most vulnerable to poverty, with 14 males (100.0%) and 11 females (100.0%) in their respective age groups living below the poverty level.
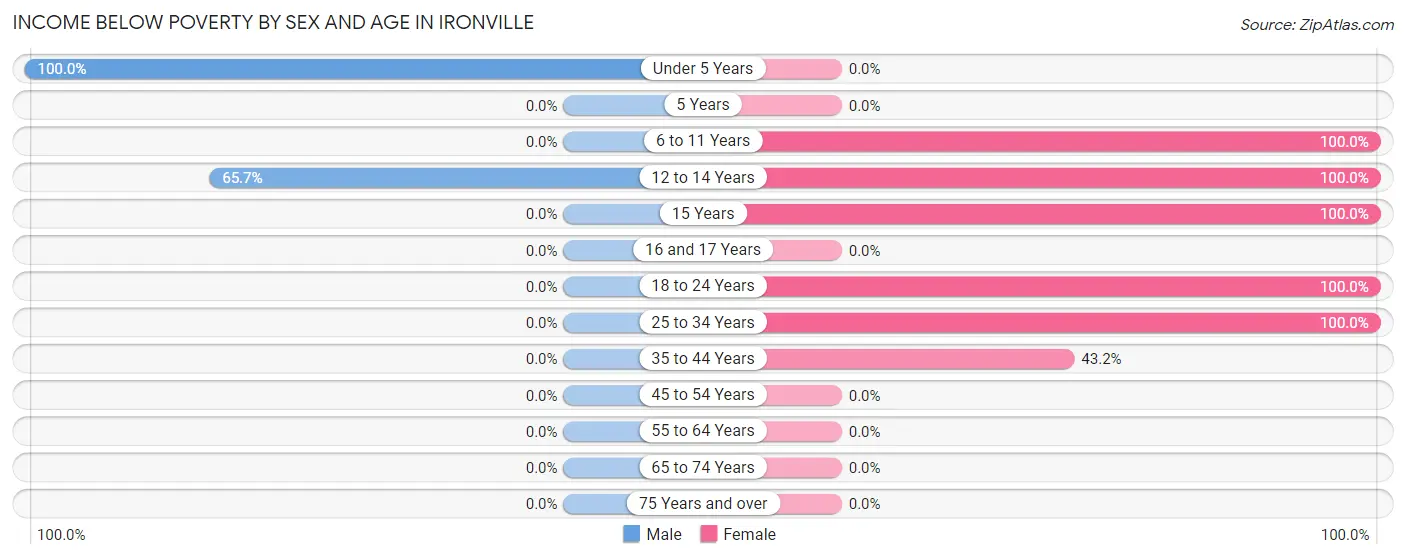
| Age Bracket | Male | Female |
| Under 5 Years | 14 (100.0%) | 0 (0.0%) |
| 5 Years | 0 (0.0%) | 0 (0.0%) |
| 6 to 11 Years | 0 (0.0%) | 11 (100.0%) |
| 12 to 14 Years | 46 (65.7%) | 11 (100.0%) |
| 15 Years | 0 (0.0%) | 62 (100.0%) |
| 16 and 17 Years | 0 (0.0%) | 0 (0.0%) |
| 18 to 24 Years | 0 (0.0%) | 85 (100.0%) |
| 25 to 34 Years | 0 (0.0%) | 8 (100.0%) |
| 35 to 44 Years | 0 (0.0%) | 57 (43.2%) |
| 45 to 54 Years | 0 (0.0%) | 0 (0.0%) |
| 55 to 64 Years | 0 (0.0%) | 0 (0.0%) |
| 65 to 74 Years | 0 (0.0%) | 0 (0.0%) |
| 75 Years and over | 0 (0.0%) | 0 (0.0%) |
| Total | 60 (17.4%) | 234 (60.0%) |
Income Above Poverty by Sex and Age in Ironville
According to the poverty statistics in Ironville, males aged 6 to 11 years and females aged 55 to 64 years are the age groups that are most secure financially, with 100.0% of males and 100.0% of females in these age groups living above the poverty line.
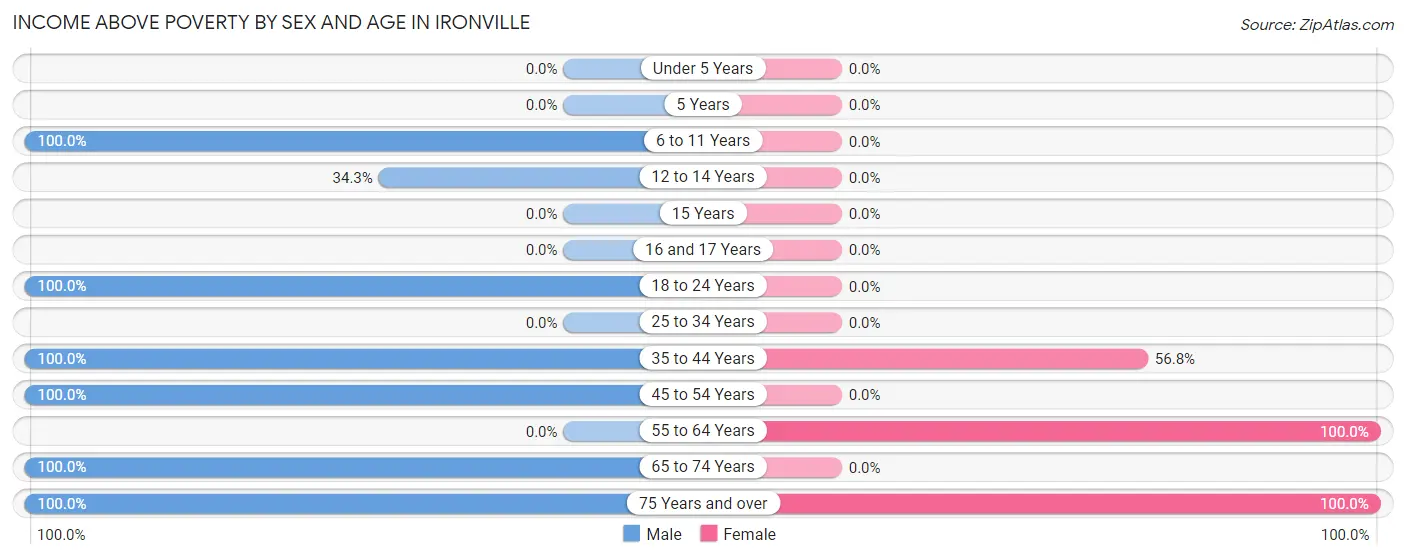
| Age Bracket | Male | Female |
| Under 5 Years | 0 (0.0%) | 0 (0.0%) |
| 5 Years | 0 (0.0%) | 0 (0.0%) |
| 6 to 11 Years | 17 (100.0%) | 0 (0.0%) |
| 12 to 14 Years | 24 (34.3%) | 0 (0.0%) |
| 15 Years | 0 (0.0%) | 0 (0.0%) |
| 16 and 17 Years | 0 (0.0%) | 0 (0.0%) |
| 18 to 24 Years | 29 (100.0%) | 0 (0.0%) |
| 25 to 34 Years | 0 (0.0%) | 0 (0.0%) |
| 35 to 44 Years | 44 (100.0%) | 75 (56.8%) |
| 45 to 54 Years | 97 (100.0%) | 0 (0.0%) |
| 55 to 64 Years | 0 (0.0%) | 11 (100.0%) |
| 65 to 74 Years | 10 (100.0%) | 0 (0.0%) |
| 75 Years and over | 64 (100.0%) | 70 (100.0%) |
| Total | 285 (82.6%) | 156 (40.0%) |
Income Below Poverty Among Married-Couple Families in Ironville
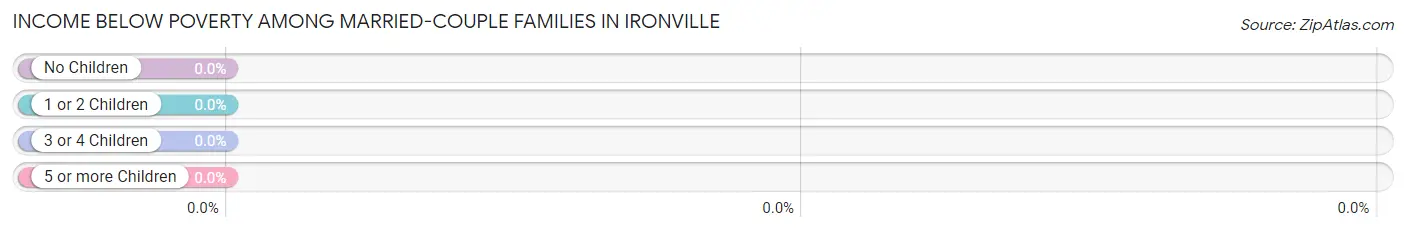
| Children | Above Poverty | Below Poverty |
| No Children | 74 (100.0%) | 0 (0.0%) |
| 1 or 2 Children | 57 (100.0%) | 0 (0.0%) |
| 3 or 4 Children | 0 (0.0%) | 0 (0.0%) |
| 5 or more Children | 0 (0.0%) | 0 (0.0%) |
| Total | 131 (100.0%) | 0 (0.0%) |
Income Below Poverty Among Single-Parent Households in Ironville
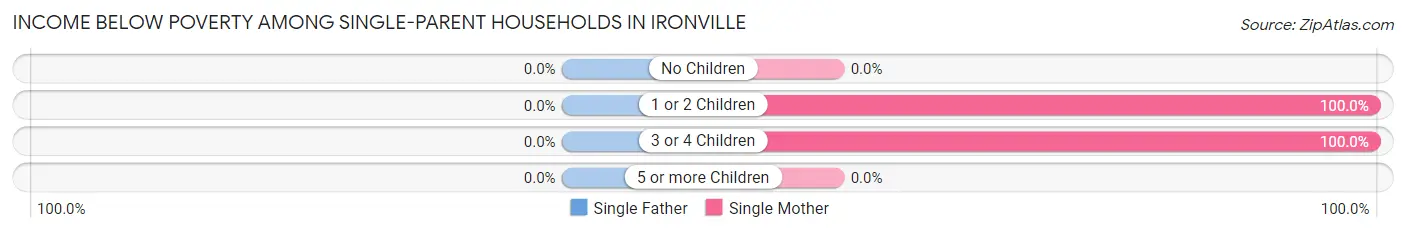
| Children | Single Father | Single Mother |
| No Children | 0 (0.0%) | 0 (0.0%) |
| 1 or 2 Children | 0 (0.0%) | 57 (100.0%) |
| 3 or 4 Children | 0 (0.0%) | 8 (100.0%) |
| 5 or more Children | 0 (0.0%) | 0 (0.0%) |
| Total | 0 (0.0%) | 65 (100.0%) |
Income Below Poverty Among Married-Couple vs Single-Parent Households in Ironville
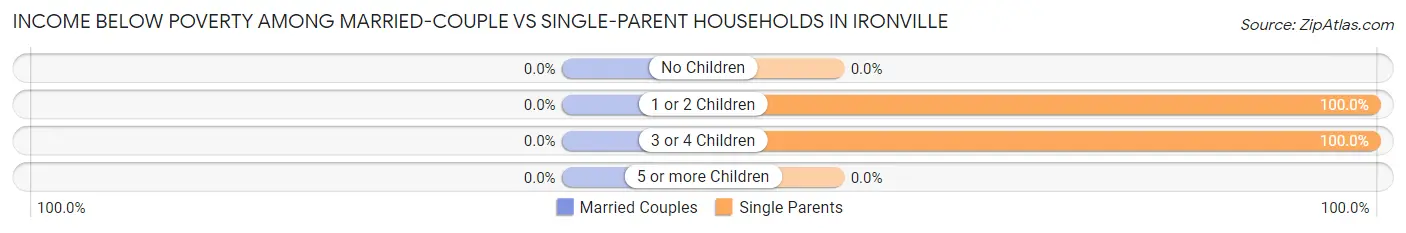
| Children | Married-Couple Families | Single-Parent Households |
| No Children | 0 (0.0%) | 0 (0.0%) |
| 1 or 2 Children | 0 (0.0%) | 57 (100.0%) |
| 3 or 4 Children | 0 (0.0%) | 8 (100.0%) |
| 5 or more Children | 0 (0.0%) | 0 (0.0%) |
| Total | 0 (0.0%) | 65 (100.0%) |
Race in Ironville
The most populous races in Ironville are White / Caucasian (735 | 100.0%), and Hispanic or Latino (33 | 4.5%).
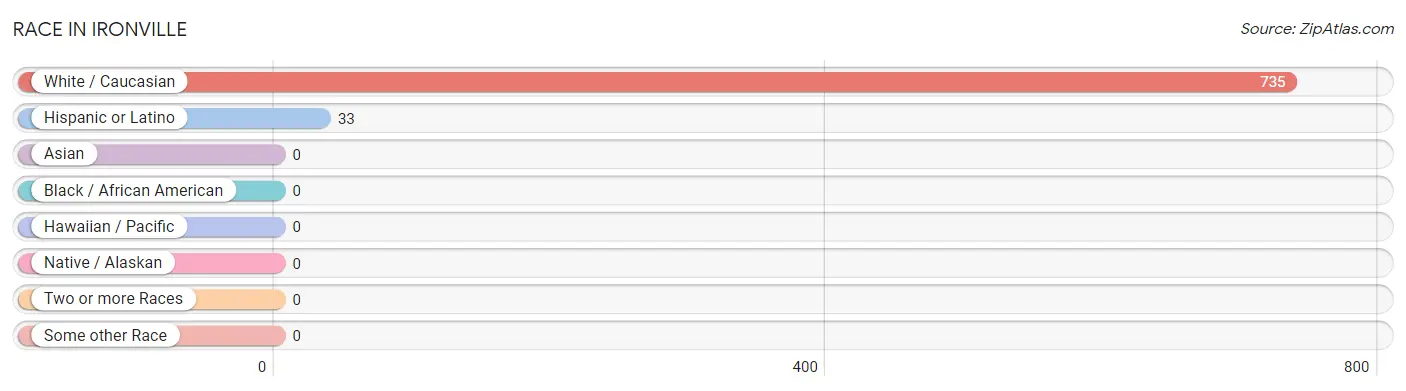
| Race | # Population | % Population |
| Asian | 0 | 0.0% |
| Black / African American | 0 | 0.0% |
| Hawaiian / Pacific | 0 | 0.0% |
| Hispanic or Latino | 33 | 4.5% |
| Native / Alaskan | 0 | 0.0% |
| White / Caucasian | 735 | 100.0% |
| Two or more Races | 0 | 0.0% |
| Some other Race | 0 | 0.0% |
| Total | 735 | 100.0% |
Ancestry in Ironville
The most populous ancestries reported in Ironville are Irish (227 | 30.9%), American (163 | 22.2%), English (115 | 15.7%), Puerto Rican (33 | 4.5%), and German (32 | 4.3%), together accounting for 77.5% of all Ironville residents.
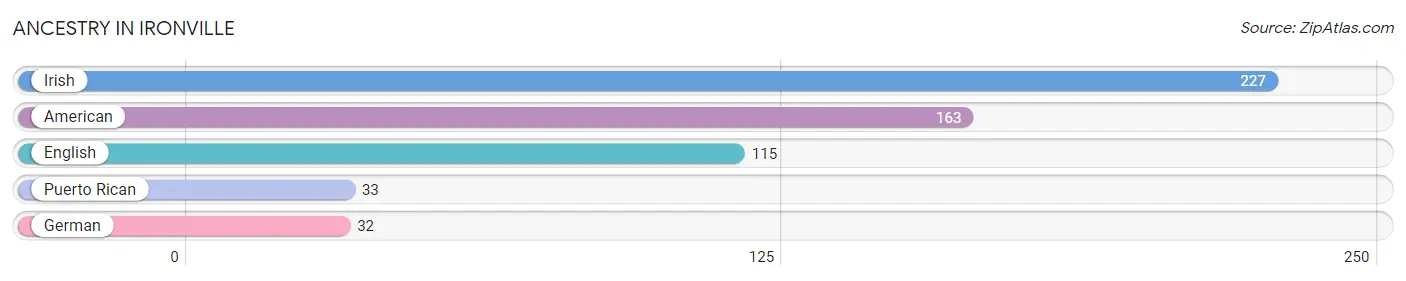
| Ancestry | # Population | % Population |
| American | 163 | 22.2% |
| English | 115 | 15.7% |
| German | 32 | 4.3% |
| Irish | 227 | 30.9% |
| Puerto Rican | 33 | 4.5% | View All 5 Rows |
Immigrants in Ironville

| Immigration Origin | # Population | % Population | View All 0 Rows |
Sex and Age in Ironville
Sex and Age in Ironville
The most populous age groups in Ironville are 45 to 49 Years (97 | 28.1%) for men and 35 to 39 Years (132 | 33.9%) for women.
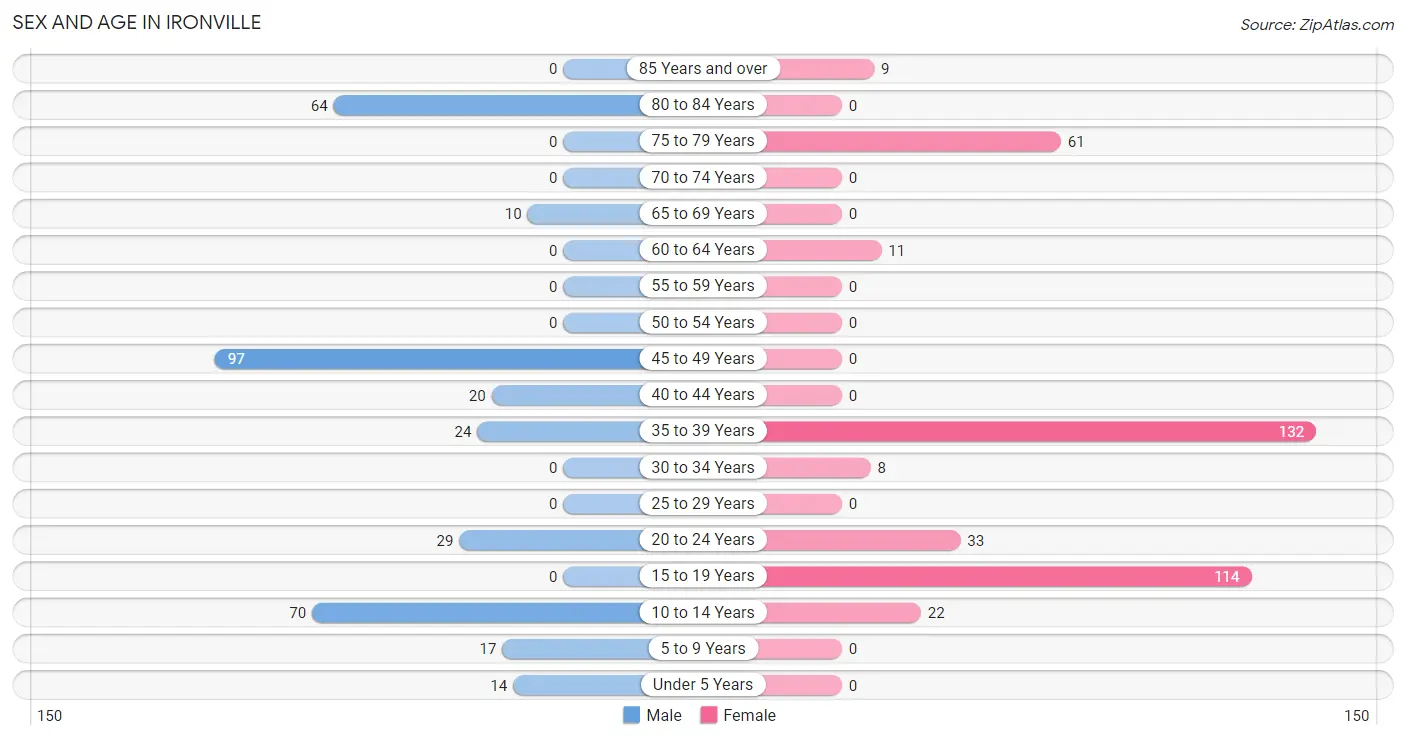
| Age Bracket | Male | Female |
| Under 5 Years | 14 (4.1%) | 0 (0.0%) |
| 5 to 9 Years | 17 (4.9%) | 0 (0.0%) |
| 10 to 14 Years | 70 (20.3%) | 22 (5.6%) |
| 15 to 19 Years | 0 (0.0%) | 114 (29.2%) |
| 20 to 24 Years | 29 (8.4%) | 33 (8.5%) |
| 25 to 29 Years | 0 (0.0%) | 0 (0.0%) |
| 30 to 34 Years | 0 (0.0%) | 8 (2.1%) |
| 35 to 39 Years | 24 (7.0%) | 132 (33.9%) |
| 40 to 44 Years | 20 (5.8%) | 0 (0.0%) |
| 45 to 49 Years | 97 (28.1%) | 0 (0.0%) |
| 50 to 54 Years | 0 (0.0%) | 0 (0.0%) |
| 55 to 59 Years | 0 (0.0%) | 0 (0.0%) |
| 60 to 64 Years | 0 (0.0%) | 11 (2.8%) |
| 65 to 69 Years | 10 (2.9%) | 0 (0.0%) |
| 70 to 74 Years | 0 (0.0%) | 0 (0.0%) |
| 75 to 79 Years | 0 (0.0%) | 61 (15.6%) |
| 80 to 84 Years | 64 (18.5%) | 0 (0.0%) |
| 85 Years and over | 0 (0.0%) | 9 (2.3%) |
| Total | 345 (100.0%) | 390 (100.0%) |
Families and Households in Ironville
Median Family Size in Ironville
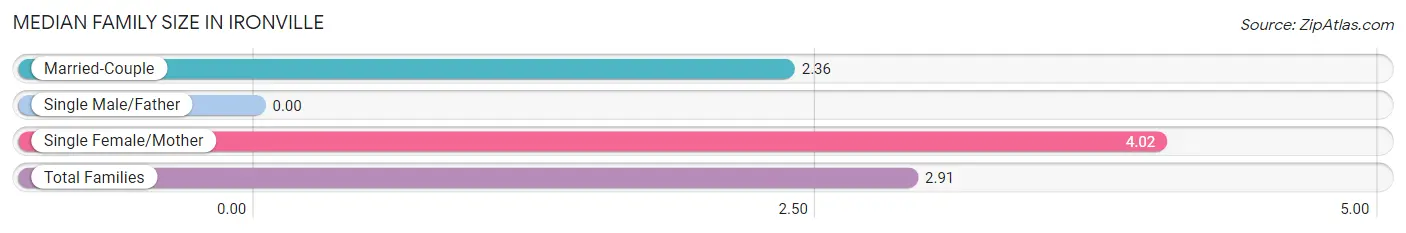
| Family Type | # Families | Family Size |
| Married-Couple | 131 (66.8%) | 2.36 |
| Single Male/Father | 0 (0.0%) | - |
| Single Female/Mother | 65 (33.2%) | 4.02 |
| Total Families | 196 (100.0%) | 2.91 |
Median Household Size in Ironville
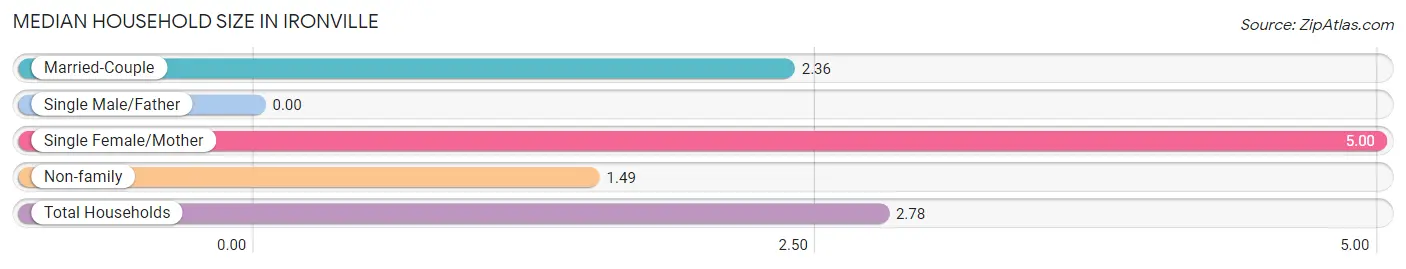
| Household Type | # Households | Household Size |
| Married-Couple | 131 (49.6%) | 2.36 |
| Single Male/Father | 0 (0.0%) | - |
| Single Female/Mother | 65 (24.6%) | 5.00 |
| Non-family | 68 (25.8%) | 1.49 |
| Total Households | 264 (100.0%) | 2.78 |
Household Size by Marriage Status in Ironville
Out of a total of 264 households in Ironville, 196 (74.2%) are family households, while 68 (25.8%) are nonfamily households. The most numerous type of family households are 2-person households, comprising 74, and the most common type of nonfamily households are 1-person households, comprising 39.
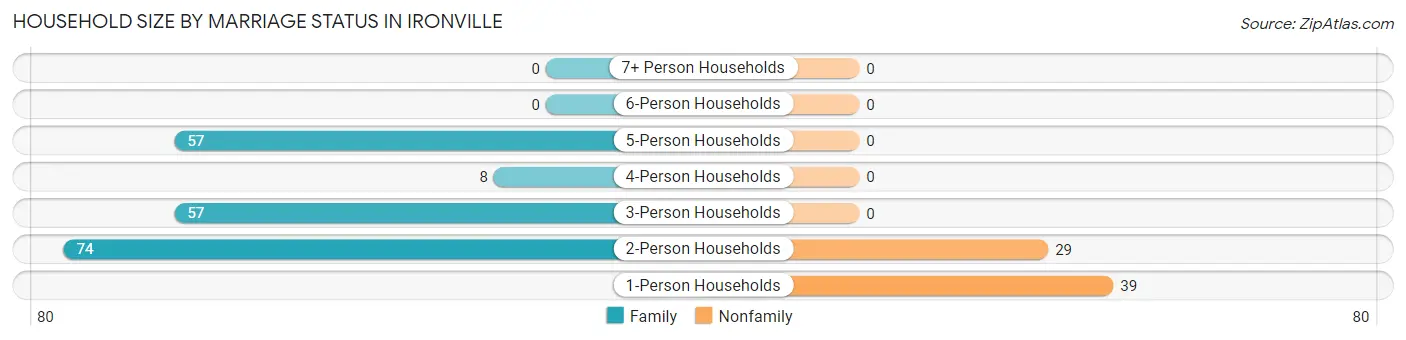
| Household Size | Family Households | Nonfamily Households |
| 1-Person Households | - | 39 (14.8%) |
| 2-Person Households | 74 (28.0%) | 29 (11.0%) |
| 3-Person Households | 57 (21.6%) | 0 (0.0%) |
| 4-Person Households | 8 (3.0%) | 0 (0.0%) |
| 5-Person Households | 57 (21.6%) | 0 (0.0%) |
| 6-Person Households | 0 (0.0%) | 0 (0.0%) |
| 7+ Person Households | 0 (0.0%) | 0 (0.0%) |
| Total | 196 (74.2%) | 68 (25.8%) |
Female Fertility in Ironville
Fertility by Age in Ironville
| Age Bracket | Women with Births | Births / 1,000 Women |
| 15 to 19 years | 0 (0.0%) | 0.0 |
| 20 to 34 years | 0 (0.0%) | 0.0 |
| 35 to 50 years | 0 (0.0%) | 0.0 |
| Total | 0 (0.0%) | 0.0 |
Fertility by Age by Marriage Status in Ironville
| Age Bracket | Married | Unmarried |
| 15 to 19 years | 0 (0.0%) | 0 (0.0%) |
| 20 to 34 years | 0 (0.0%) | 0 (0.0%) |
| 35 to 50 years | 0 (0.0%) | 0 (0.0%) |
| Total | 0 (0.0%) | 0 (0.0%) |
Fertility by Education in Ironville
| Educational Attainment | Women with Births | Births / 1,000 Women |
| Less than High School | 0 (0.0%) | 0.0 |
| High School Diploma | 0 (0.0%) | 0.0 |
| College or Associate's Degree | 0 (0.0%) | 0.0 |
| Bachelor's Degree | 0 (0.0%) | 0.0 |
| Graduate Degree | 0 (0.0%) | 0.0 |
| Total | 0 (0.0%) | 0.0 |
Fertility by Education by Marriage Status in Ironville
| Educational Attainment | Married | Unmarried |
| Less than High School | 0 (0.0%) | 0 (0.0%) |
| High School Diploma | 0 (0.0%) | 0 (0.0%) |
| College or Associate's Degree | 0 (0.0%) | 0 (0.0%) |
| Bachelor's Degree | 0 (0.0%) | 0 (0.0%) |
| Graduate Degree | 0 (0.0%) | 0 (0.0%) |
| Total | 0 (0.0%) | 0 (0.0%) |
Employment Characteristics in Ironville
Employment by Class of Employer in Ironville
Among the 383 employed individuals in Ironville, private company employees (363 | 94.8%), and federal government employees (20 | 5.2%) make up the most common classes of employment.
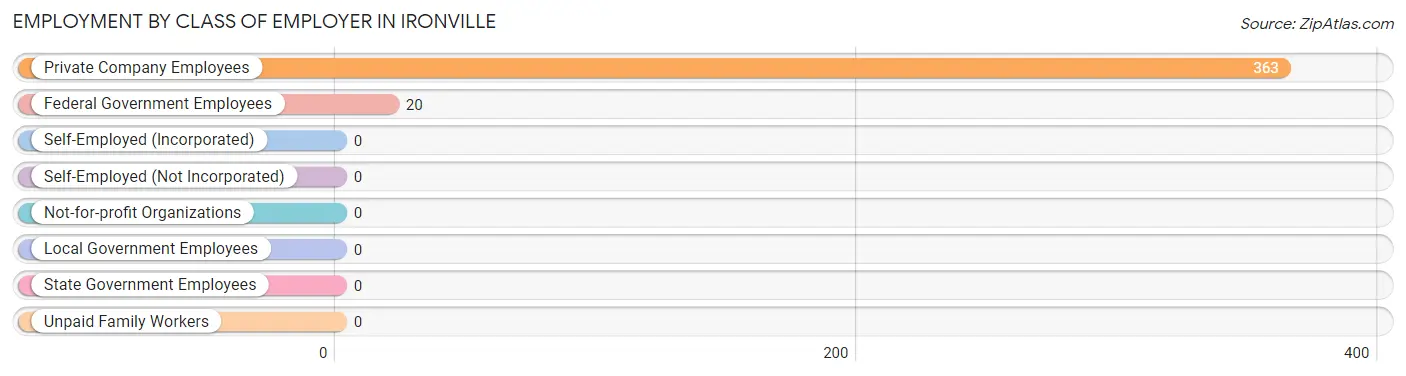
| Employer Class | # Employees | % Employees |
| Private Company Employees | 363 | 94.8% |
| Self-Employed (Incorporated) | 0 | 0.0% |
| Self-Employed (Not Incorporated) | 0 | 0.0% |
| Not-for-profit Organizations | 0 | 0.0% |
| Local Government Employees | 0 | 0.0% |
| State Government Employees | 0 | 0.0% |
| Federal Government Employees | 20 | 5.2% |
| Unpaid Family Workers | 0 | 0.0% |
| Total | 383 | 100.0% |
Employment Status by Age in Ironville
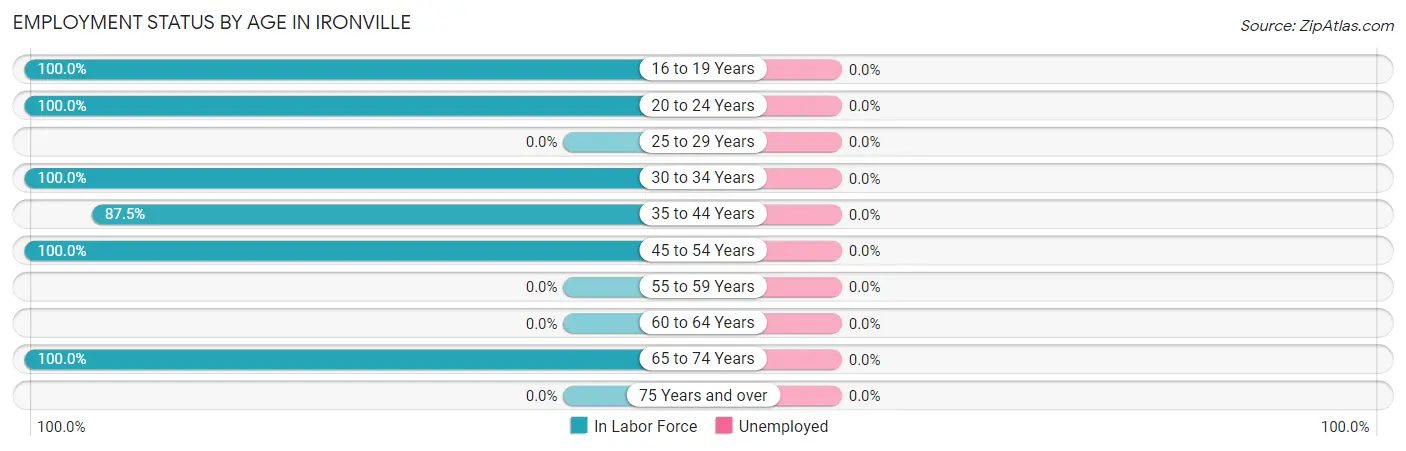
| Age Bracket | In Labor Force | Unemployed |
| 16 to 19 Years | 52 (100.0%) | 0 (0.0%) |
| 20 to 24 Years | 62 (100.0%) | 0 (0.0%) |
| 25 to 29 Years | 0 (0.0%) | 0 (0.0%) |
| 30 to 34 Years | 8 (100.0%) | 0 (0.0%) |
| 35 to 44 Years | 154 (87.5%) | 0 (0.0%) |
| 45 to 54 Years | 97 (100.0%) | 0 (0.0%) |
| 55 to 59 Years | 0 (0.0%) | 0 (0.0%) |
| 60 to 64 Years | 0 (0.0%) | 0 (0.0%) |
| 65 to 74 Years | 10 (100.0%) | 0 (0.0%) |
| 75 Years and over | 0 (0.0%) | 0 (0.0%) |
| Total | 383 (69.6%) | 0 (0.0%) |
Employment Status by Educational Attainment in Ironville
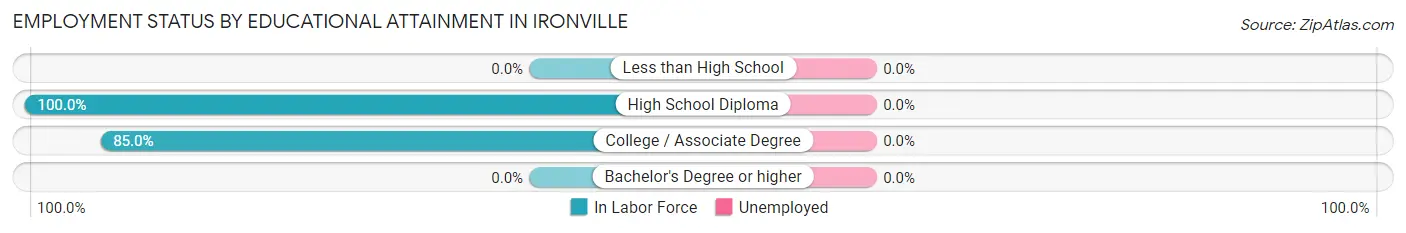
| Educational Attainment | In Labor Force | Unemployed |
| Less than High School | 0 (0.0%) | 0 (0.0%) |
| High School Diploma | 72 (100.0%) | 0 (0.0%) |
| College / Associate Degree | 187 (85.0%) | 0 (0.0%) |
| Bachelor's Degree or higher | 0 (0.0%) | 0 (0.0%) |
| Total | 259 (88.7%) | 0 (0.0%) |
Employment Occupations by Sex in Ironville
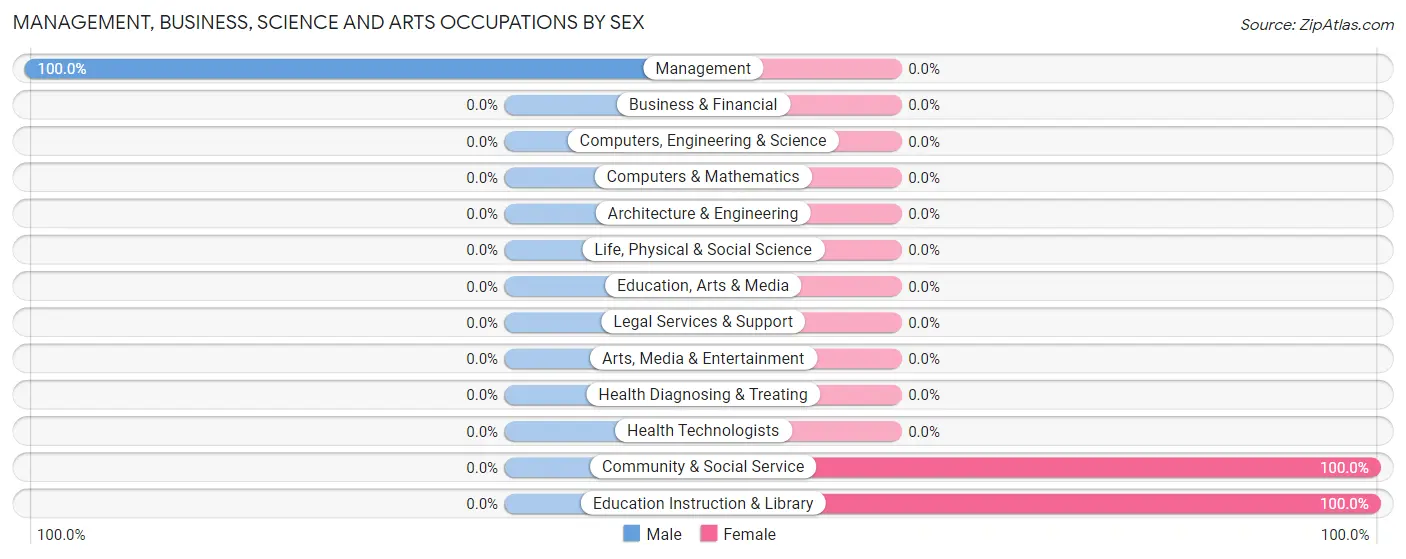
Management, Business, Science and Arts Occupations
The most common Management, Business, Science and Arts occupations in Ironville are Management (74 | 19.3%), Community & Social Service (33 | 8.6%), and Education Instruction & Library (33 | 8.6%).
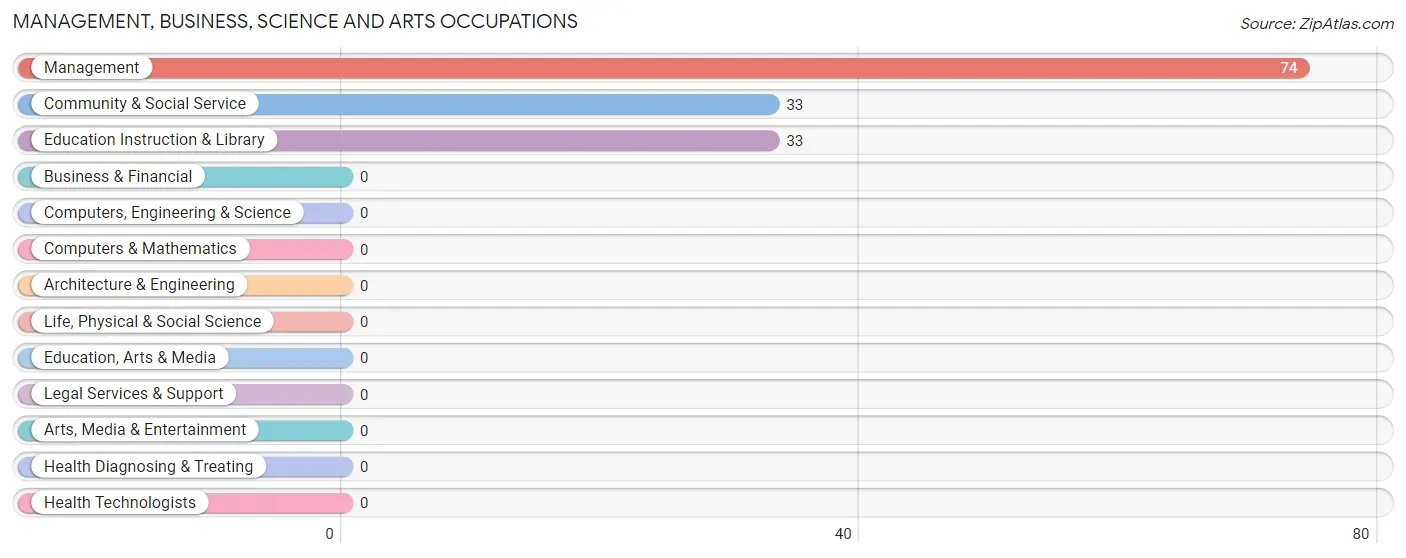
Management, Business, Science and Arts Occupations by Sex
| Occupation | Male | Female |
| Management | 74 (100.0%) | 0 (0.0%) |
| Business & Financial | 0 (0.0%) | 0 (0.0%) |
| Computers, Engineering & Science | 0 (0.0%) | 0 (0.0%) |
| Computers & Mathematics | 0 (0.0%) | 0 (0.0%) |
| Architecture & Engineering | 0 (0.0%) | 0 (0.0%) |
| Life, Physical & Social Science | 0 (0.0%) | 0 (0.0%) |
| Community & Social Service | 0 (0.0%) | 33 (100.0%) |
| Education, Arts & Media | 0 (0.0%) | 0 (0.0%) |
| Legal Services & Support | 0 (0.0%) | 0 (0.0%) |
| Education Instruction & Library | 0 (0.0%) | 33 (100.0%) |
| Arts, Media & Entertainment | 0 (0.0%) | 0 (0.0%) |
| Health Diagnosing & Treating | 0 (0.0%) | 0 (0.0%) |
| Health Technologists | 0 (0.0%) | 0 (0.0%) |
| Total (Category) | 74 (69.2%) | 33 (30.8%) |
| Total (Overall) | 180 (47.0%) | 203 (53.0%) |
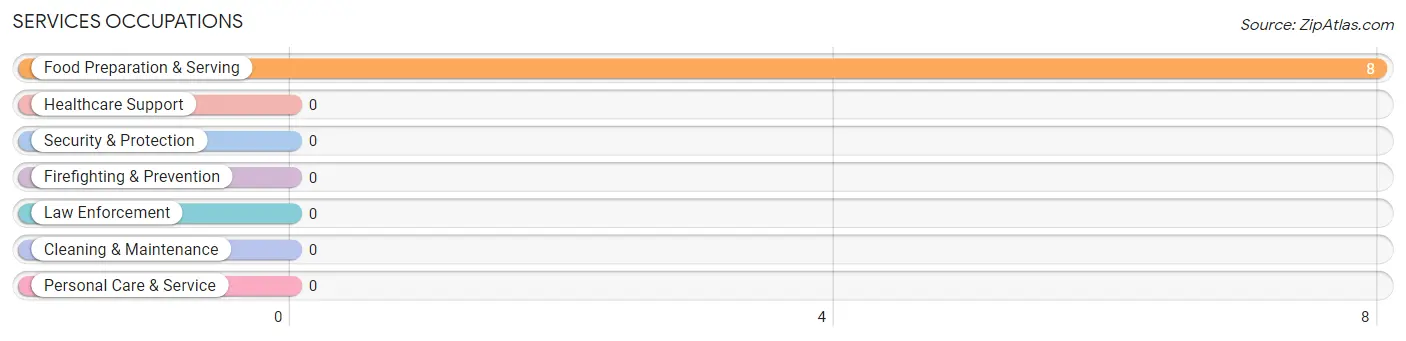
Services Occupations
The most common Services occupations in Ironville are , and Food Preparation & Serving (8 | 2.1%).
Services Occupations by Sex
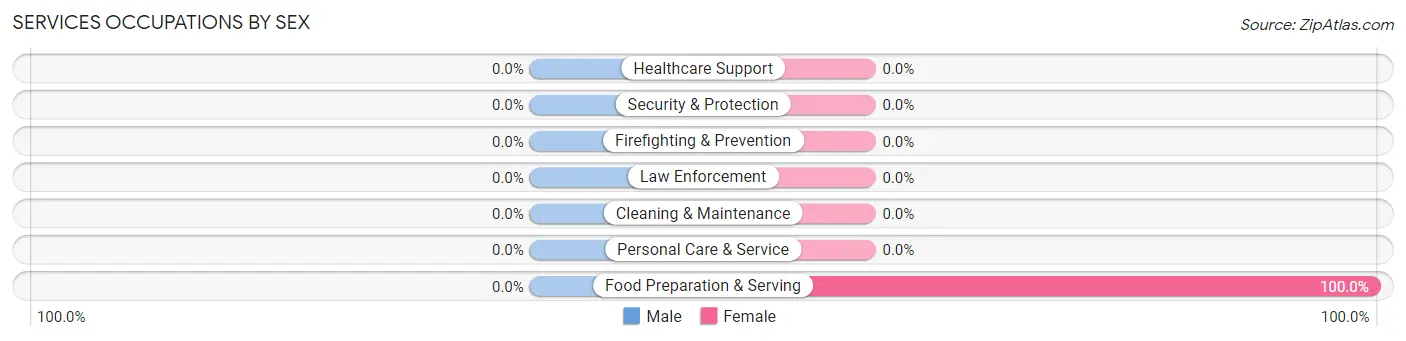
| Occupation | Male | Female |
| Healthcare Support | 0 (0.0%) | 0 (0.0%) |
| Security & Protection | 0 (0.0%) | 0 (0.0%) |
| Firefighting & Prevention | 0 (0.0%) | 0 (0.0%) |
| Law Enforcement | 0 (0.0%) | 0 (0.0%) |
| Food Preparation & Serving | 0 (0.0%) | 8 (100.0%) |
| Cleaning & Maintenance | 0 (0.0%) | 0 (0.0%) |
| Personal Care & Service | 0 (0.0%) | 0 (0.0%) |
| Total (Category) | 0 (0.0%) | 8 (100.0%) |
| Total (Overall) | 180 (47.0%) | 203 (53.0%) |
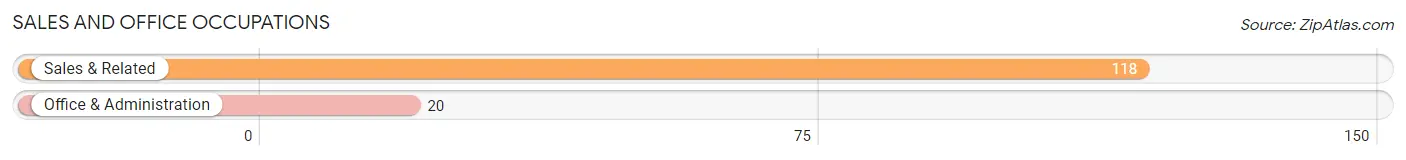
Sales and Office Occupations
The most common Sales and Office occupations in Ironville are Sales & Related (118 | 30.8%), and Office & Administration (20 | 5.2%).
Sales and Office Occupations by Sex
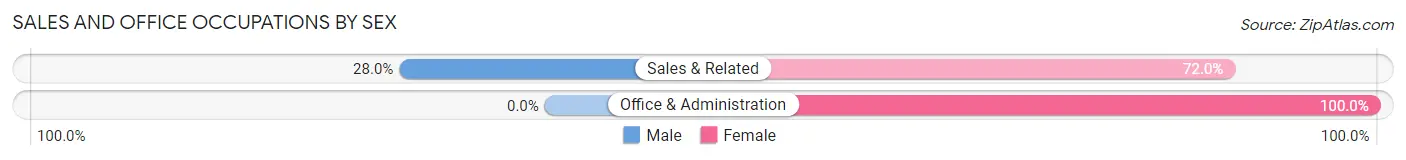
| Occupation | Male | Female |
| Sales & Related | 33 (28.0%) | 85 (72.0%) |
| Office & Administration | 0 (0.0%) | 20 (100.0%) |
| Total (Category) | 33 (23.9%) | 105 (76.1%) |
| Total (Overall) | 180 (47.0%) | 203 (53.0%) |
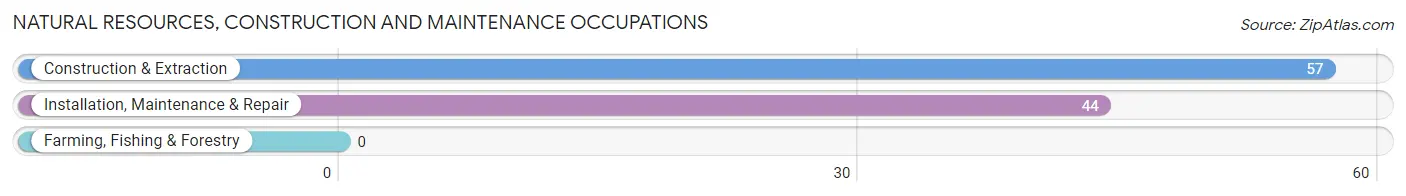
Natural Resources, Construction and Maintenance Occupations
The most common Natural Resources, Construction and Maintenance occupations in Ironville are Construction & Extraction (57 | 14.9%), and Installation, Maintenance & Repair (44 | 11.5%).
Natural Resources, Construction and Maintenance Occupations by Sex
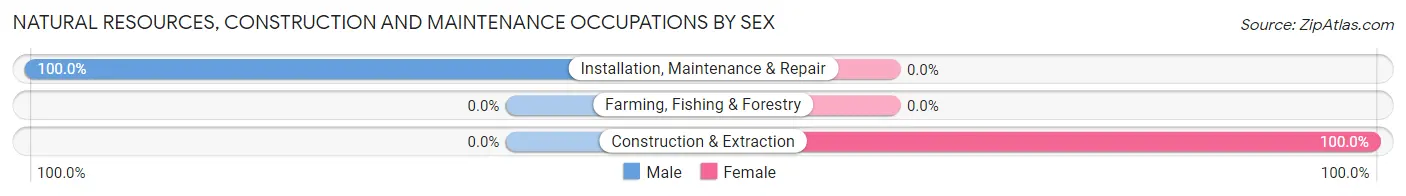
| Occupation | Male | Female |
| Farming, Fishing & Forestry | 0 (0.0%) | 0 (0.0%) |
| Construction & Extraction | 0 (0.0%) | 57 (100.0%) |
| Installation, Maintenance & Repair | 44 (100.0%) | 0 (0.0%) |
| Total (Category) | 44 (43.6%) | 57 (56.4%) |
| Total (Overall) | 180 (47.0%) | 203 (53.0%) |
Production, Transportation and Moving Occupations
The most common Production, Transportation and Moving occupations in Ironville are , and Material Moving (29 | 7.6%).
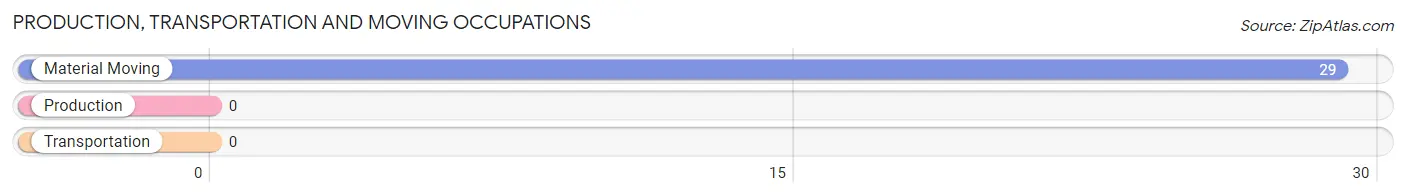
Production, Transportation and Moving Occupations by Sex
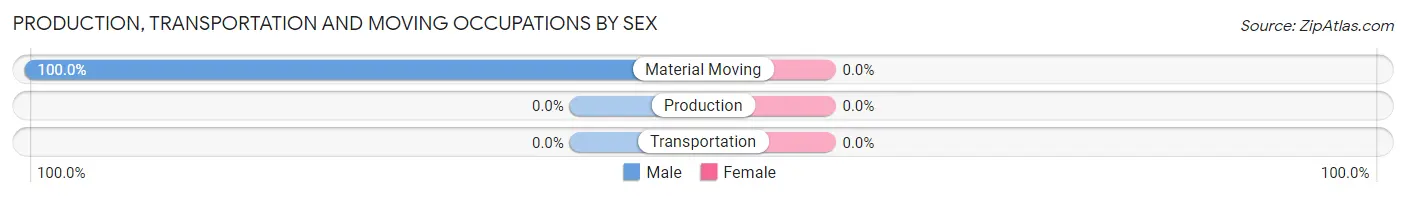
| Occupation | Male | Female |
| Production | 0 (0.0%) | 0 (0.0%) |
| Transportation | 0 (0.0%) | 0 (0.0%) |
| Material Moving | 29 (100.0%) | 0 (0.0%) |
| Total (Category) | 29 (100.0%) | 0 (0.0%) |
| Total (Overall) | 180 (47.0%) | 203 (53.0%) |
Employment Industries by Sex in Ironville
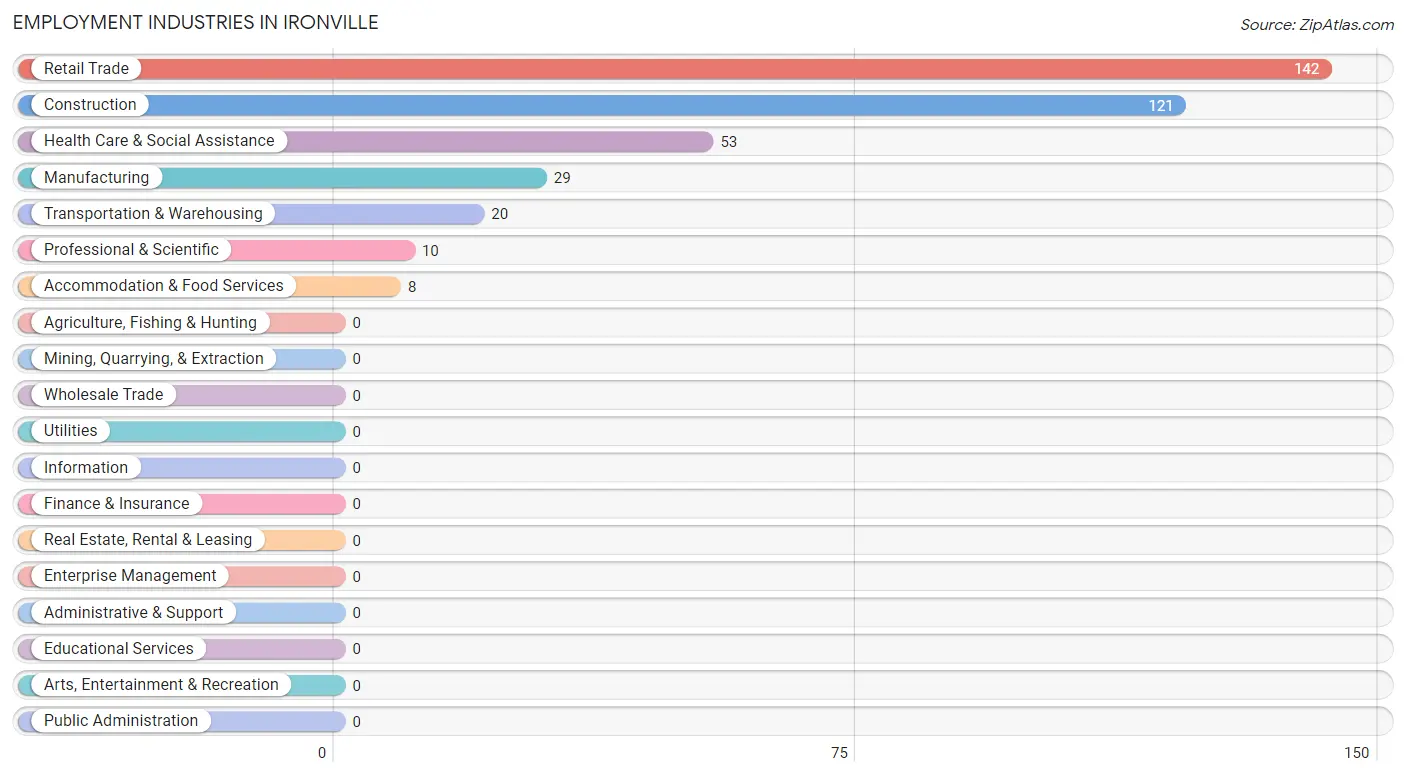
Employment Industries in Ironville
The major employment industries in Ironville include Retail Trade (142 | 37.1%), Construction (121 | 31.6%), Health Care & Social Assistance (53 | 13.8%), Manufacturing (29 | 7.6%), and Transportation & Warehousing (20 | 5.2%).
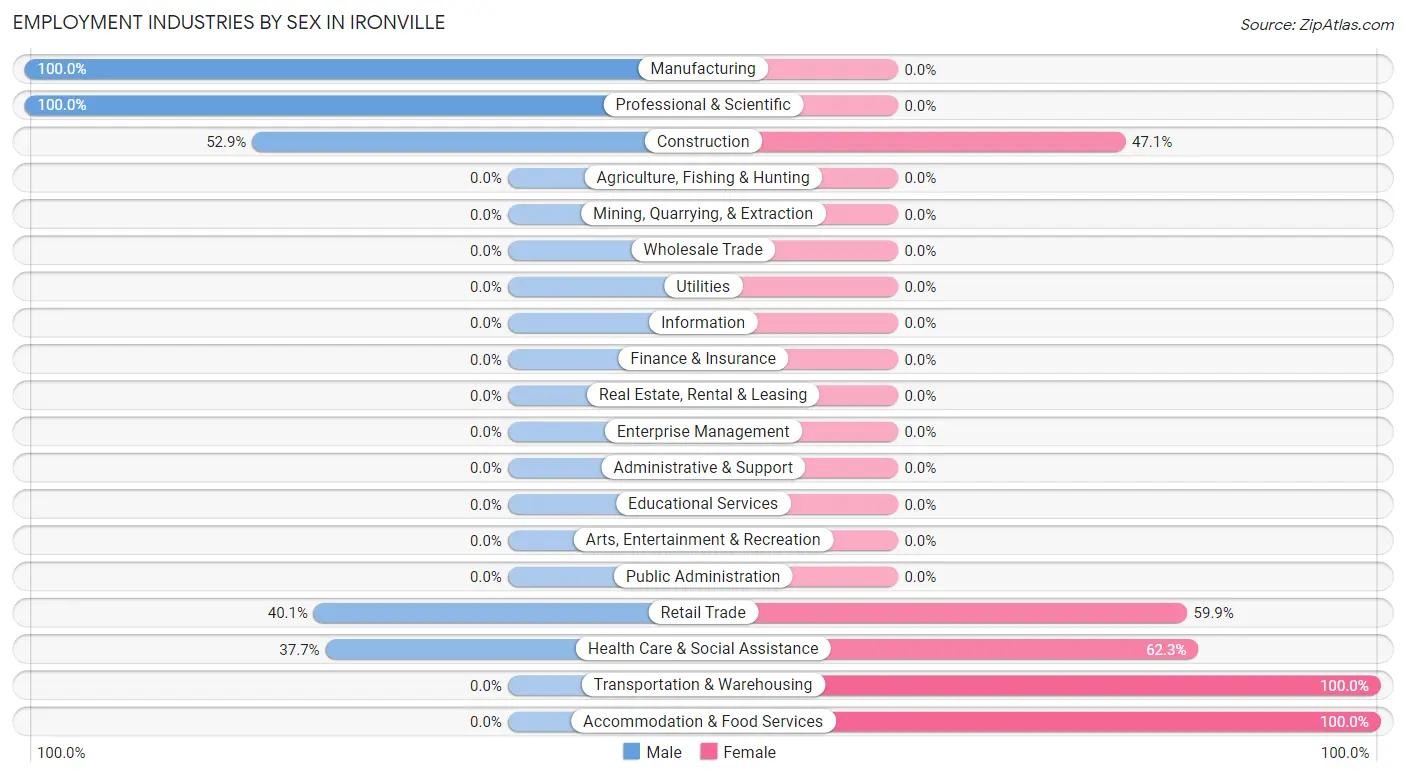
Employment Industries by Sex in Ironville
The Ironville industries that see more men than women are Manufacturing (100.0%), Professional & Scientific (100.0%), and Construction (52.9%), whereas the industries that tend to have a higher number of women are Transportation & Warehousing (100.0%), Accommodation & Food Services (100.0%), and Health Care & Social Assistance (62.3%).
| Industry | Male | Female |
| Agriculture, Fishing & Hunting | 0 (0.0%) | 0 (0.0%) |
| Mining, Quarrying, & Extraction | 0 (0.0%) | 0 (0.0%) |
| Construction | 64 (52.9%) | 57 (47.1%) |
| Manufacturing | 29 (100.0%) | 0 (0.0%) |
| Wholesale Trade | 0 (0.0%) | 0 (0.0%) |
| Retail Trade | 57 (40.1%) | 85 (59.9%) |
| Transportation & Warehousing | 0 (0.0%) | 20 (100.0%) |
| Utilities | 0 (0.0%) | 0 (0.0%) |
| Information | 0 (0.0%) | 0 (0.0%) |
| Finance & Insurance | 0 (0.0%) | 0 (0.0%) |
| Real Estate, Rental & Leasing | 0 (0.0%) | 0 (0.0%) |
| Professional & Scientific | 10 (100.0%) | 0 (0.0%) |
| Enterprise Management | 0 (0.0%) | 0 (0.0%) |
| Administrative & Support | 0 (0.0%) | 0 (0.0%) |
| Educational Services | 0 (0.0%) | 0 (0.0%) |
| Health Care & Social Assistance | 20 (37.7%) | 33 (62.3%) |
| Arts, Entertainment & Recreation | 0 (0.0%) | 0 (0.0%) |
| Accommodation & Food Services | 0 (0.0%) | 8 (100.0%) |
| Public Administration | 0 (0.0%) | 0 (0.0%) |
| Total | 180 (47.0%) | 203 (53.0%) |
Education in Ironville
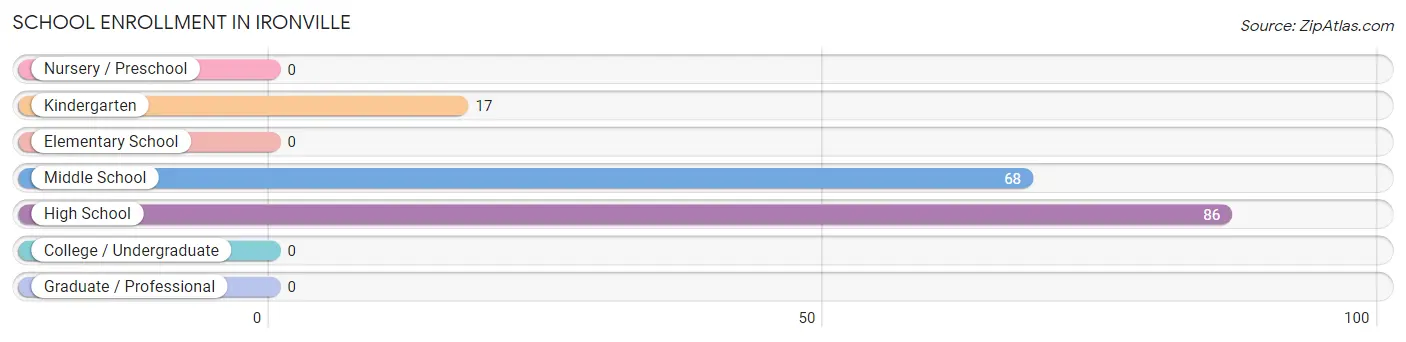
School Enrollment in Ironville
The most common levels of schooling among the 171 students in Ironville are high school (86 | 50.3%), middle school (68 | 39.8%), and kindergarten (17 | 9.9%).
| School Level | # Students | % Students |
| Nursery / Preschool | 0 | 0.0% |
| Kindergarten | 17 | 9.9% |
| Elementary School | 0 | 0.0% |
| Middle School | 68 | 39.8% |
| High School | 86 | 50.3% |
| College / Undergraduate | 0 | 0.0% |
| Graduate / Professional | 0 | 0.0% |
| Total | 171 | 100.0% |
School Enrollment by Age by Funding Source in Ironville
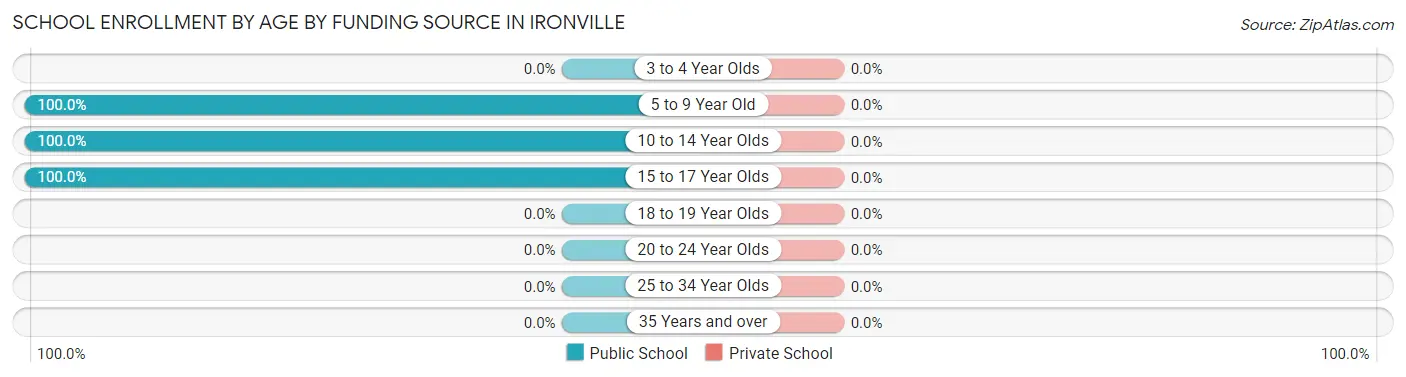
| Age Bracket | Public School | Private School |
| 3 to 4 Year Olds | 0 (0.0%) | 0 (0.0%) |
| 5 to 9 Year Old | 17 (100.0%) | 0 (0.0%) |
| 10 to 14 Year Olds | 92 (100.0%) | 0 (0.0%) |
| 15 to 17 Year Olds | 62 (100.0%) | 0 (0.0%) |
| 18 to 19 Year Olds | 0 (0.0%) | 0 (0.0%) |
| 20 to 24 Year Olds | 0 (0.0%) | 0 (0.0%) |
| 25 to 34 Year Olds | 0 (0.0%) | 0 (0.0%) |
| 35 Years and over | 0 (0.0%) | 0 (0.0%) |
| Total | 171 (100.0%) | 0 (0.0%) |
Educational Attainment by Field of Study in Ironville
, and business (10 | 100.0%) are the most common fields of study among 10 individuals in Ironville who have obtained a bachelor's degree or higher.
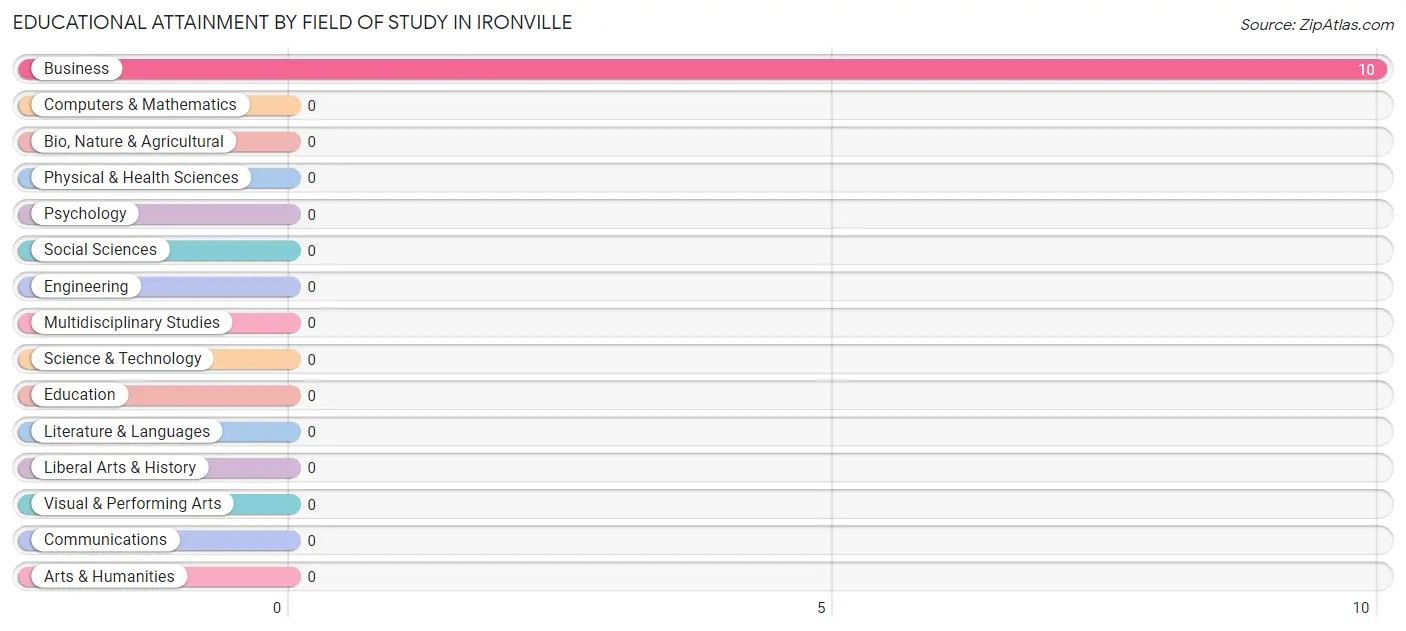
| Field of Study | # Graduates | % Graduates |
| Computers & Mathematics | 0 | 0.0% |
| Bio, Nature & Agricultural | 0 | 0.0% |
| Physical & Health Sciences | 0 | 0.0% |
| Psychology | 0 | 0.0% |
| Social Sciences | 0 | 0.0% |
| Engineering | 0 | 0.0% |
| Multidisciplinary Studies | 0 | 0.0% |
| Science & Technology | 0 | 0.0% |
| Business | 10 | 100.0% |
| Education | 0 | 0.0% |
| Literature & Languages | 0 | 0.0% |
| Liberal Arts & History | 0 | 0.0% |
| Visual & Performing Arts | 0 | 0.0% |
| Communications | 0 | 0.0% |
| Arts & Humanities | 0 | 0.0% |
| Total | 10 | 100.0% |
Transportation & Commute in Ironville
Vehicle Availability by Sex in Ironville
The most prevalent vehicle ownership categories in Ironville are males with 2 vehicles (180, accounting for 100.0%) and females with 2 vehicles (195, making up 88.7%).
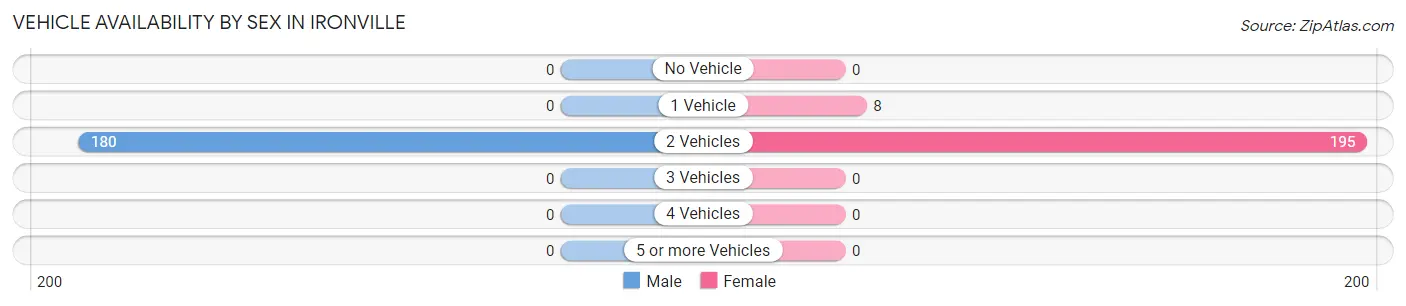
| Vehicles Available | Male | Female |
| No Vehicle | 0 (0.0%) | 0 (0.0%) |
| 1 Vehicle | 0 (0.0%) | 8 (3.9%) |
| 2 Vehicles | 180 (100.0%) | 195 (96.1%) |
| 3 Vehicles | 0 (0.0%) | 0 (0.0%) |
| 4 Vehicles | 0 (0.0%) | 0 (0.0%) |
| 5 or more Vehicles | 0 (0.0%) | 0 (0.0%) |
| Total | 180 (100.0%) | 203 (100.0%) |
Commute Time in Ironville
The most frequently occuring commute durations in Ironville are 15 to 19 minutes (121 commuters, 31.6%), 5 to 9 minutes (76 commuters, 19.8%), and 20 to 24 minutes (73 commuters, 19.1%).
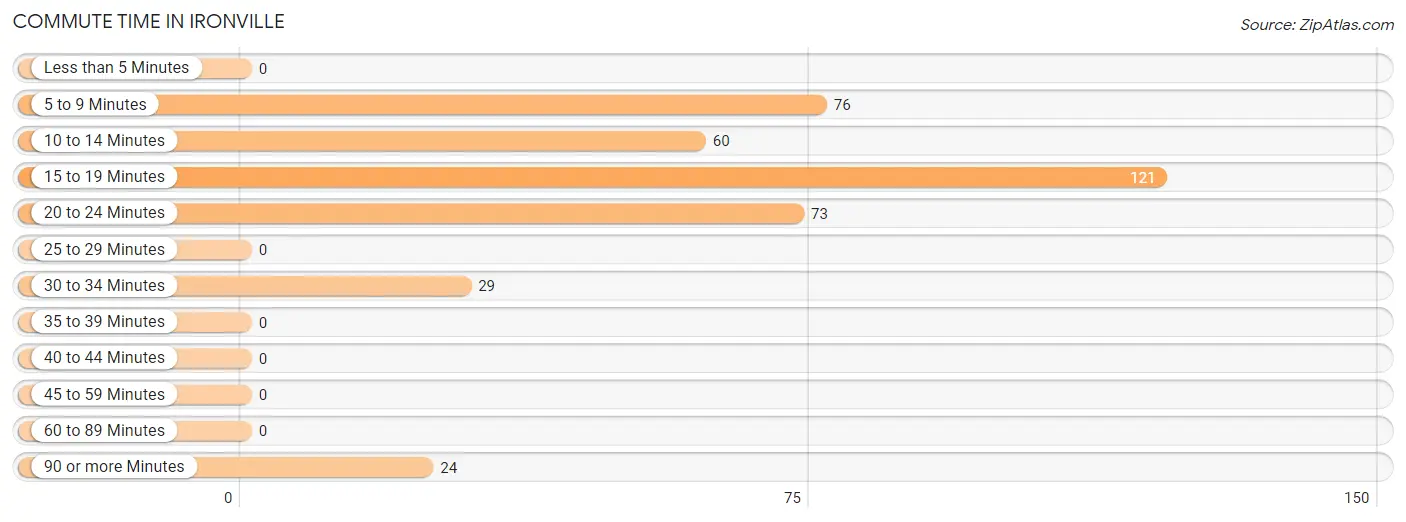
| Commute Time | # Commuters | % Commuters |
| Less than 5 Minutes | 0 | 0.0% |
| 5 to 9 Minutes | 76 | 19.8% |
| 10 to 14 Minutes | 60 | 15.7% |
| 15 to 19 Minutes | 121 | 31.6% |
| 20 to 24 Minutes | 73 | 19.1% |
| 25 to 29 Minutes | 0 | 0.0% |
| 30 to 34 Minutes | 29 | 7.6% |
| 35 to 39 Minutes | 0 | 0.0% |
| 40 to 44 Minutes | 0 | 0.0% |
| 45 to 59 Minutes | 0 | 0.0% |
| 60 to 89 Minutes | 0 | 0.0% |
| 90 or more Minutes | 24 | 6.3% |
Commute Time by Sex in Ironville
The most common commute times in Ironville are 15 to 19 minutes (64 commuters, 35.6%) for males and 10 to 14 minutes (60 commuters, 29.6%) for females.
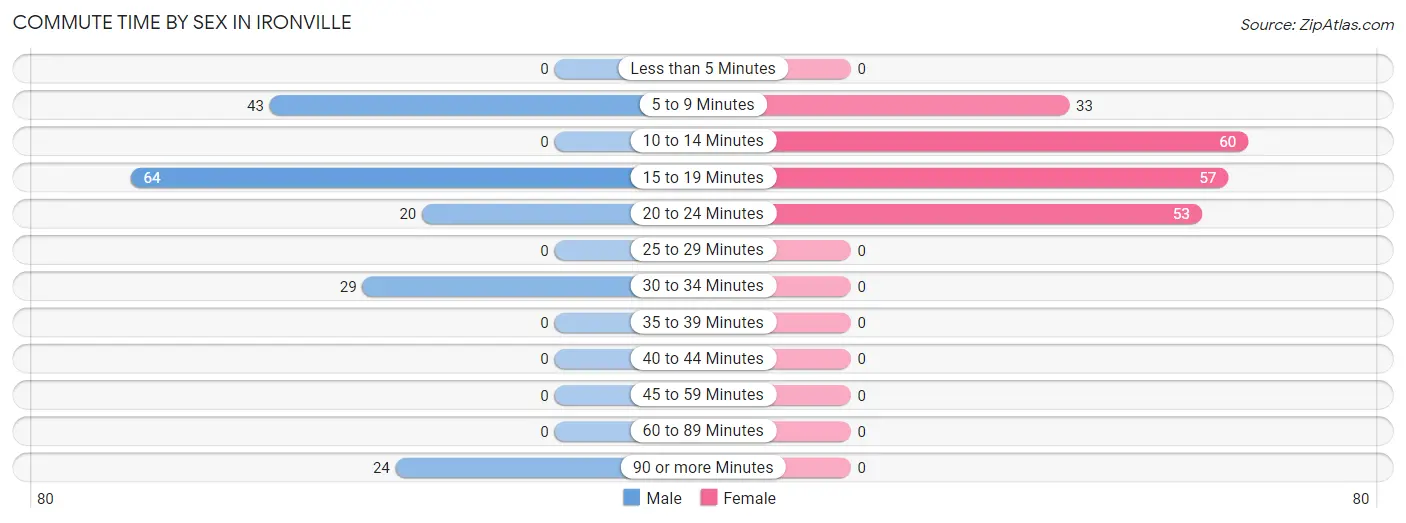
| Commute Time | Male | Female |
| Less than 5 Minutes | 0 (0.0%) | 0 (0.0%) |
| 5 to 9 Minutes | 43 (23.9%) | 33 (16.3%) |
| 10 to 14 Minutes | 0 (0.0%) | 60 (29.6%) |
| 15 to 19 Minutes | 64 (35.6%) | 57 (28.1%) |
| 20 to 24 Minutes | 20 (11.1%) | 53 (26.1%) |
| 25 to 29 Minutes | 0 (0.0%) | 0 (0.0%) |
| 30 to 34 Minutes | 29 (16.1%) | 0 (0.0%) |
| 35 to 39 Minutes | 0 (0.0%) | 0 (0.0%) |
| 40 to 44 Minutes | 0 (0.0%) | 0 (0.0%) |
| 45 to 59 Minutes | 0 (0.0%) | 0 (0.0%) |
| 60 to 89 Minutes | 0 (0.0%) | 0 (0.0%) |
| 90 or more Minutes | 24 (13.3%) | 0 (0.0%) |
Time of Departure to Work by Sex in Ironville
The most frequent times of departure to work in Ironville are 7:00 AM to 7:29 AM (64, 35.6%) for males and 7:00 AM to 7:29 AM (57, 28.1%) for females.
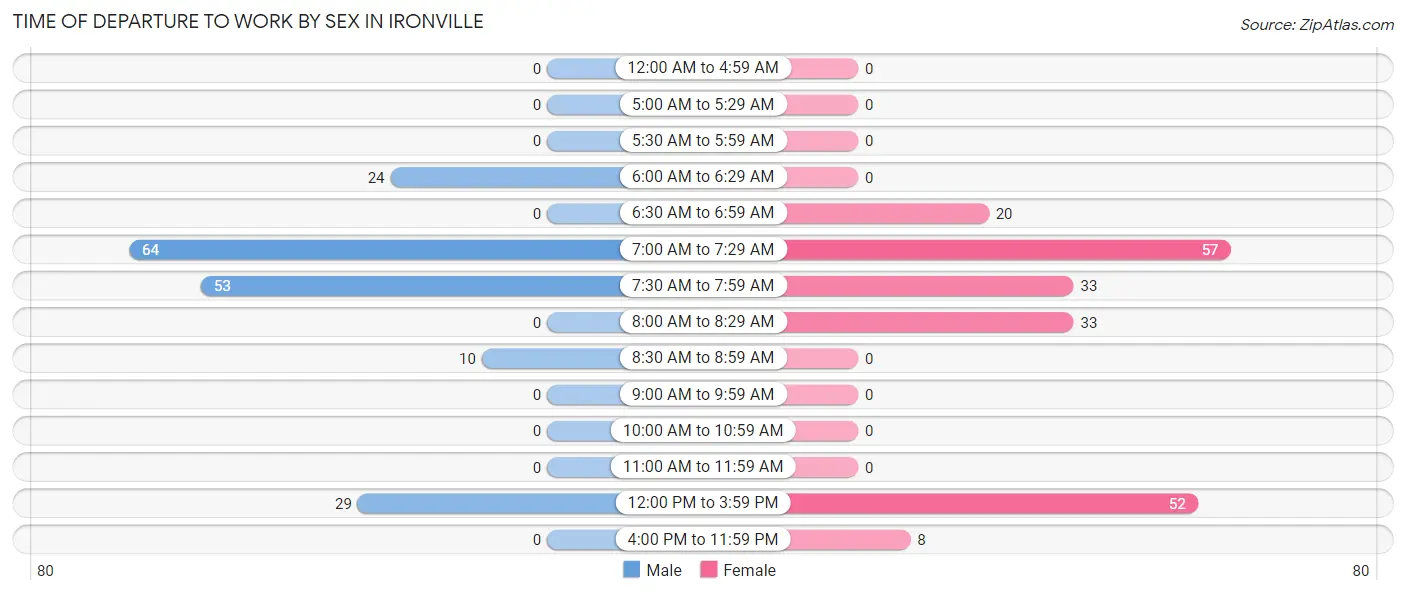
| Time of Departure | Male | Female |
| 12:00 AM to 4:59 AM | 0 (0.0%) | 0 (0.0%) |
| 5:00 AM to 5:29 AM | 0 (0.0%) | 0 (0.0%) |
| 5:30 AM to 5:59 AM | 0 (0.0%) | 0 (0.0%) |
| 6:00 AM to 6:29 AM | 24 (13.3%) | 0 (0.0%) |
| 6:30 AM to 6:59 AM | 0 (0.0%) | 20 (9.9%) |
| 7:00 AM to 7:29 AM | 64 (35.6%) | 57 (28.1%) |
| 7:30 AM to 7:59 AM | 53 (29.4%) | 33 (16.3%) |
| 8:00 AM to 8:29 AM | 0 (0.0%) | 33 (16.3%) |
| 8:30 AM to 8:59 AM | 10 (5.6%) | 0 (0.0%) |
| 9:00 AM to 9:59 AM | 0 (0.0%) | 0 (0.0%) |
| 10:00 AM to 10:59 AM | 0 (0.0%) | 0 (0.0%) |
| 11:00 AM to 11:59 AM | 0 (0.0%) | 0 (0.0%) |
| 12:00 PM to 3:59 PM | 29 (16.1%) | 52 (25.6%) |
| 4:00 PM to 11:59 PM | 0 (0.0%) | 8 (3.9%) |
| Total | 180 (100.0%) | 203 (100.0%) |
Housing Occupancy in Ironville
Occupancy by Ownership in Ironville
Of the total 264 dwellings in Ironville, owner-occupied units account for 153 (58.0%), while renter-occupied units make up 111 (42.0%).
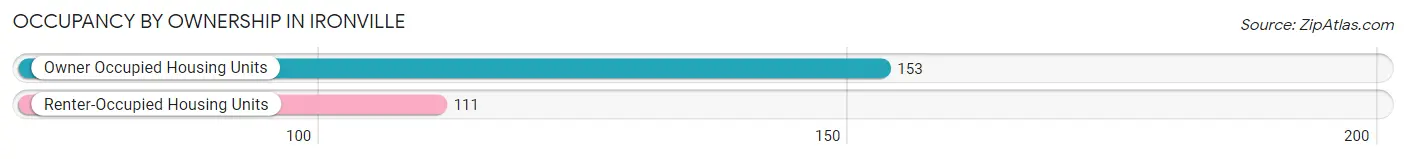
| Occupancy | # Housing Units | % Housing Units |
| Owner Occupied Housing Units | 153 | 58.0% |
| Renter-Occupied Housing Units | 111 | 42.0% |
| Total Occupied Housing Units | 264 | 100.0% |
Occupancy by Household Size in Ironville
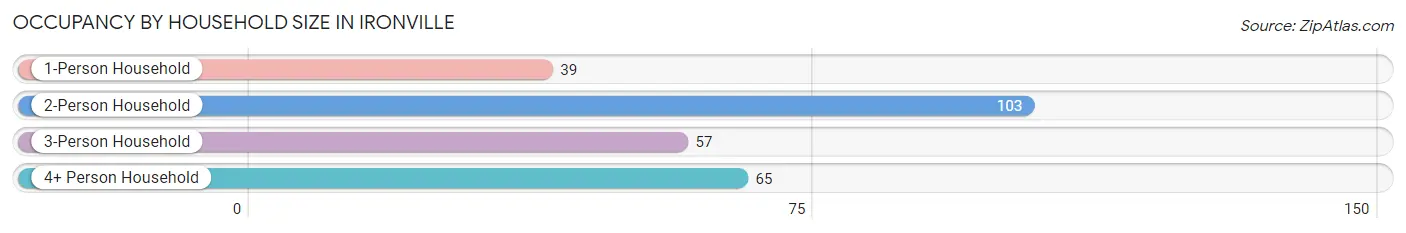
| Household Size | # Housing Units | % Housing Units |
| 1-Person Household | 39 | 14.8% |
| 2-Person Household | 103 | 39.0% |
| 3-Person Household | 57 | 21.6% |
| 4+ Person Household | 65 | 24.6% |
| Total Housing Units | 264 | 100.0% |
Occupancy by Ownership by Household Size in Ironville
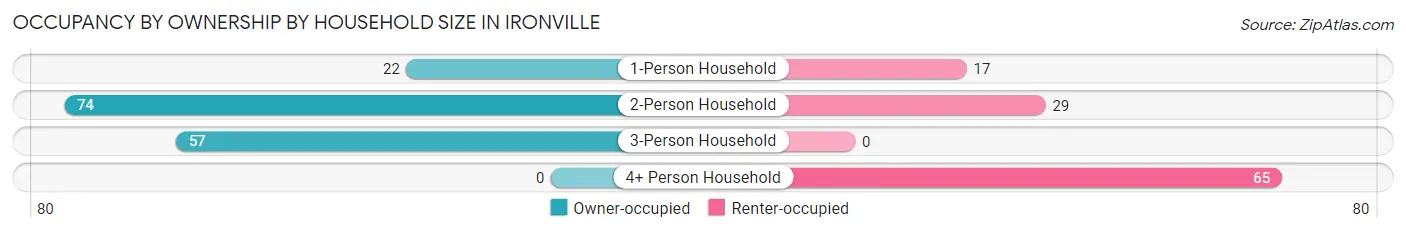
| Household Size | Owner-occupied | Renter-occupied |
| 1-Person Household | 22 (56.4%) | 17 (43.6%) |
| 2-Person Household | 74 (71.8%) | 29 (28.2%) |
| 3-Person Household | 57 (100.0%) | 0 (0.0%) |
| 4+ Person Household | 0 (0.0%) | 65 (100.0%) |
| Total Housing Units | 153 (58.0%) | 111 (42.0%) |
Occupancy by Educational Attainment in Ironville
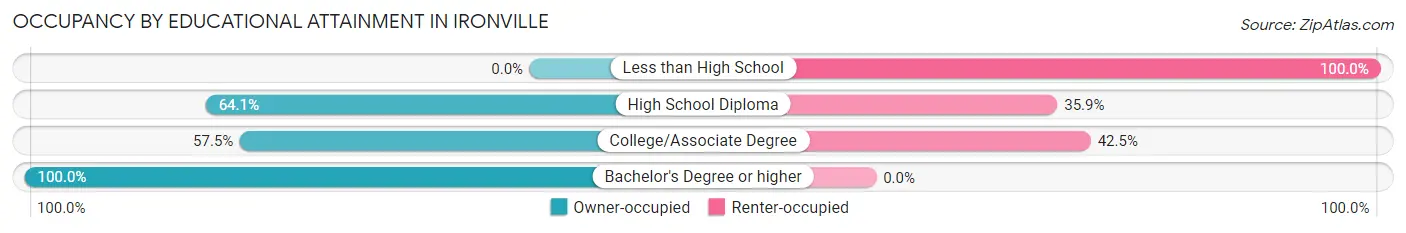
| Household Size | Owner-occupied | Renter-occupied |
| Less than High School | 0 (0.0%) | 17 (100.0%) |
| High School Diploma | 66 (64.1%) | 37 (35.9%) |
| College/Associate Degree | 77 (57.5%) | 57 (42.5%) |
| Bachelor's Degree or higher | 10 (100.0%) | 0 (0.0%) |
Occupancy by Age of Householder in Ironville
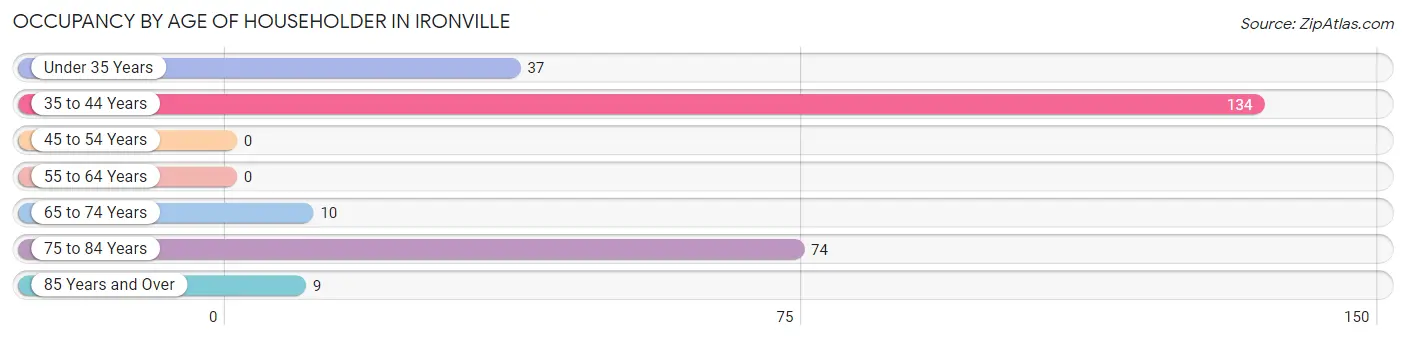
| Age Bracket | # Households | % Households |
| Under 35 Years | 37 | 14.0% |
| 35 to 44 Years | 134 | 50.8% |
| 45 to 54 Years | 0 | 0.0% |
| 55 to 64 Years | 0 | 0.0% |
| 65 to 74 Years | 10 | 3.8% |
| 75 to 84 Years | 74 | 28.0% |
| 85 Years and Over | 9 | 3.4% |
| Total | 264 | 100.0% |
Housing Finances in Ironville
Median Income by Occupancy in Ironville
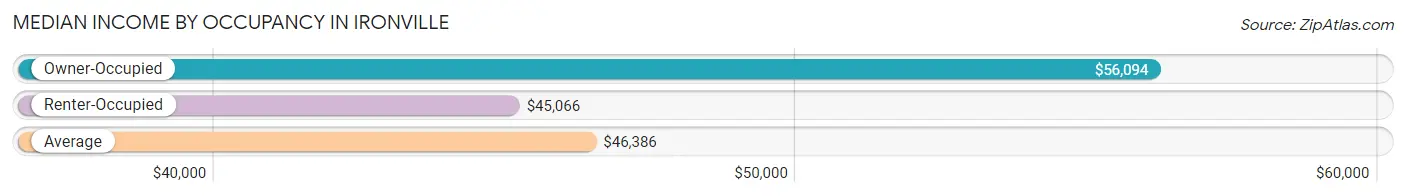
| Occupancy Type | # Households | Median Income |
| Owner-Occupied | 153 (58.0%) | $56,094 |
| Renter-Occupied | 111 (42.0%) | $45,066 |
| Average | 264 (100.0%) | $46,386 |
Occupancy by Householder Income Bracket in Ironville
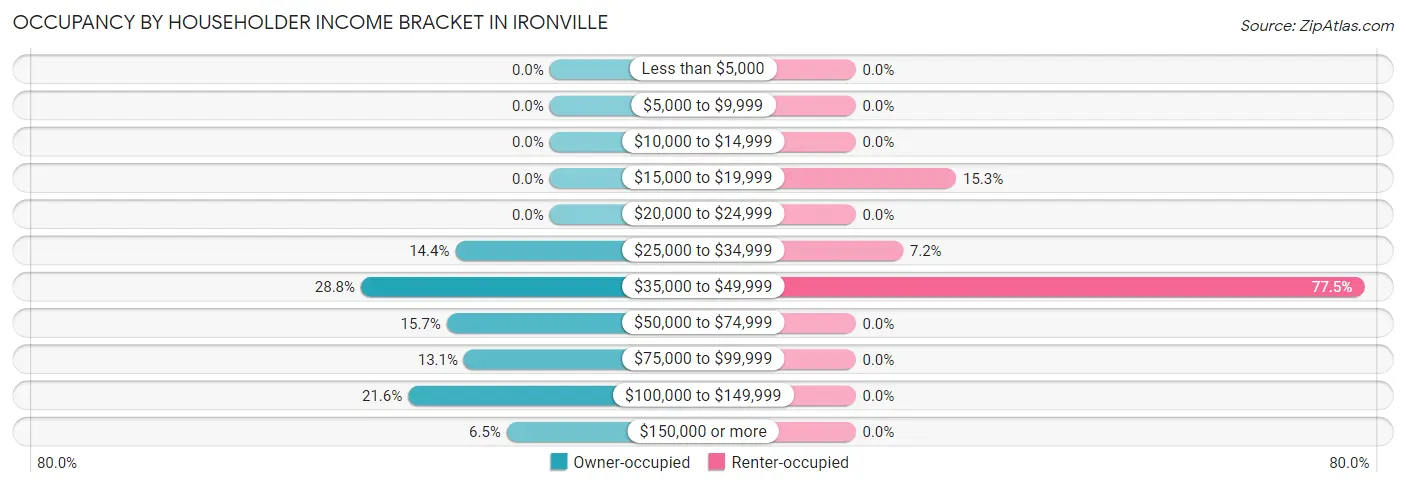
| Income Bracket | Owner-occupied | Renter-occupied |
| Less than $5,000 | 0 (0.0%) | 0 (0.0%) |
| $5,000 to $9,999 | 0 (0.0%) | 0 (0.0%) |
| $10,000 to $14,999 | 0 (0.0%) | 0 (0.0%) |
| $15,000 to $19,999 | 0 (0.0%) | 17 (15.3%) |
| $20,000 to $24,999 | 0 (0.0%) | 0 (0.0%) |
| $25,000 to $34,999 | 22 (14.4%) | 8 (7.2%) |
| $35,000 to $49,999 | 44 (28.8%) | 86 (77.5%) |
| $50,000 to $74,999 | 24 (15.7%) | 0 (0.0%) |
| $75,000 to $99,999 | 20 (13.1%) | 0 (0.0%) |
| $100,000 to $149,999 | 33 (21.6%) | 0 (0.0%) |
| $150,000 or more | 10 (6.5%) | 0 (0.0%) |
| Total | 153 (100.0%) | 111 (100.0%) |
Monthly Housing Cost Tiers in Ironville
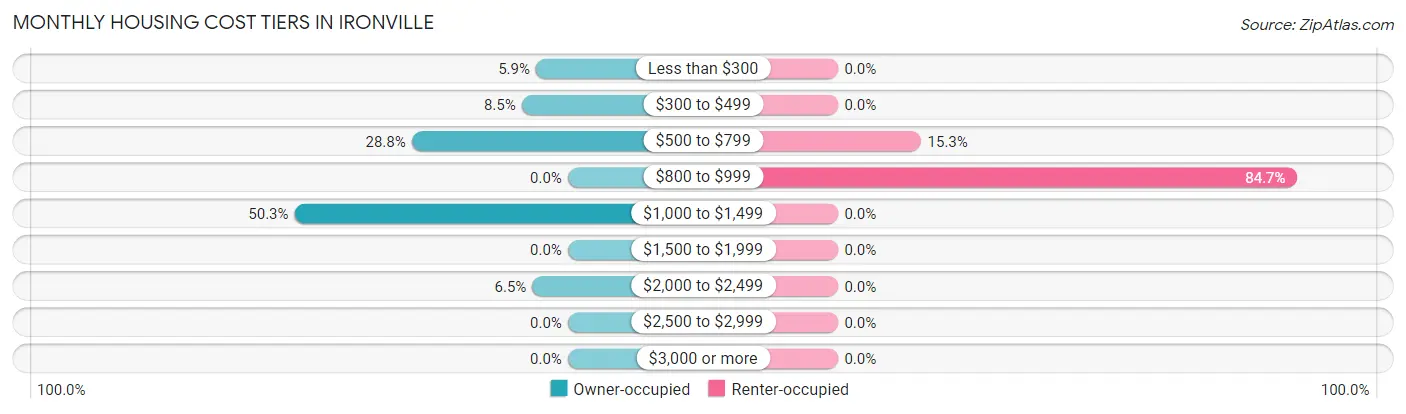
| Monthly Cost | Owner-occupied | Renter-occupied |
| Less than $300 | 9 (5.9%) | 0 (0.0%) |
| $300 to $499 | 13 (8.5%) | 0 (0.0%) |
| $500 to $799 | 44 (28.8%) | 17 (15.3%) |
| $800 to $999 | 0 (0.0%) | 94 (84.7%) |
| $1,000 to $1,499 | 77 (50.3%) | 0 (0.0%) |
| $1,500 to $1,999 | 0 (0.0%) | 0 (0.0%) |
| $2,000 to $2,499 | 10 (6.5%) | 0 (0.0%) |
| $2,500 to $2,999 | 0 (0.0%) | 0 (0.0%) |
| $3,000 or more | 0 (0.0%) | 0 (0.0%) |
| Total | 153 (100.0%) | 111 (100.0%) |
Physical Housing Characteristics in Ironville
Housing Structures in Ironville
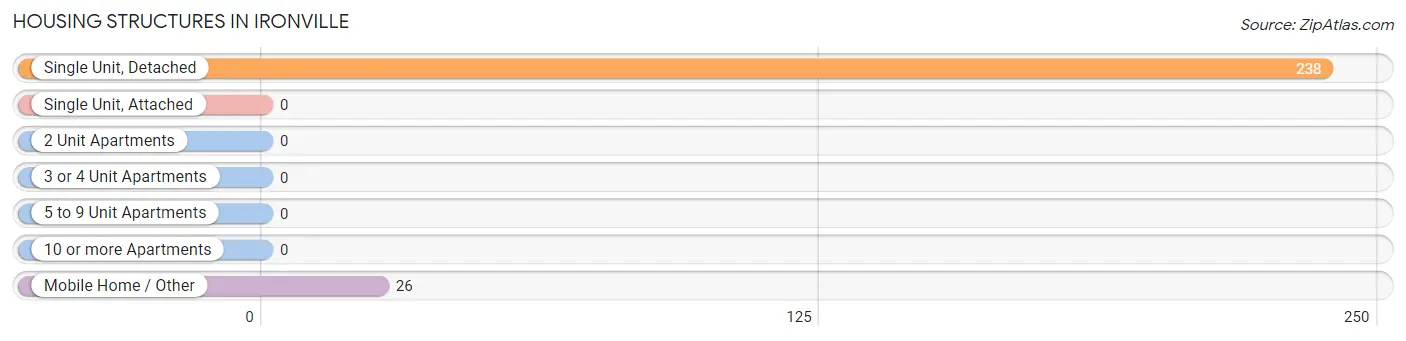
| Structure Type | # Housing Units | % Housing Units |
| Single Unit, Detached | 238 | 90.1% |
| Single Unit, Attached | 0 | 0.0% |
| 2 Unit Apartments | 0 | 0.0% |
| 3 or 4 Unit Apartments | 0 | 0.0% |
| 5 to 9 Unit Apartments | 0 | 0.0% |
| 10 or more Apartments | 0 | 0.0% |
| Mobile Home / Other | 26 | 9.9% |
| Total | 264 | 100.0% |
Housing Structures by Occupancy in Ironville
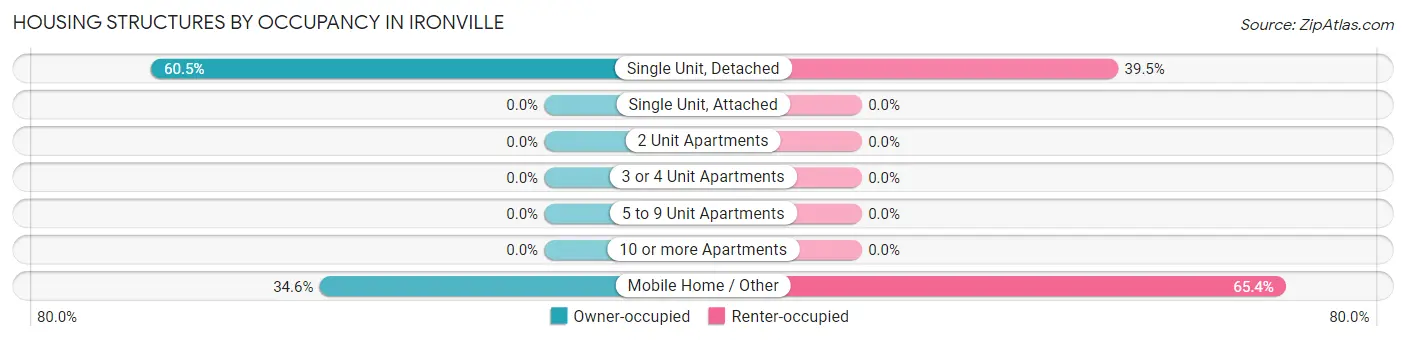
| Structure Type | Owner-occupied | Renter-occupied |
| Single Unit, Detached | 144 (60.5%) | 94 (39.5%) |
| Single Unit, Attached | 0 (0.0%) | 0 (0.0%) |
| 2 Unit Apartments | 0 (0.0%) | 0 (0.0%) |
| 3 or 4 Unit Apartments | 0 (0.0%) | 0 (0.0%) |
| 5 to 9 Unit Apartments | 0 (0.0%) | 0 (0.0%) |
| 10 or more Apartments | 0 (0.0%) | 0 (0.0%) |
| Mobile Home / Other | 9 (34.6%) | 17 (65.4%) |
| Total | 153 (58.0%) | 111 (42.0%) |
Housing Structures by Number of Rooms in Ironville
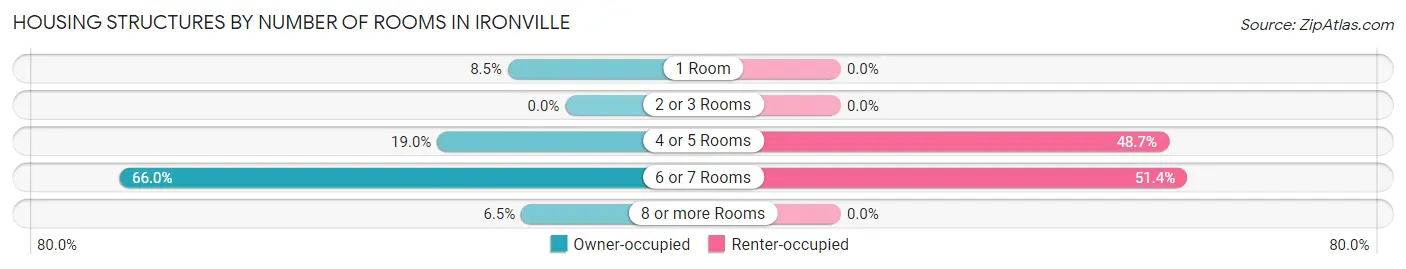
| Number of Rooms | Owner-occupied | Renter-occupied |
| 1 Room | 13 (8.5%) | 0 (0.0%) |
| 2 or 3 Rooms | 0 (0.0%) | 0 (0.0%) |
| 4 or 5 Rooms | 29 (19.0%) | 54 (48.6%) |
| 6 or 7 Rooms | 101 (66.0%) | 57 (51.3%) |
| 8 or more Rooms | 10 (6.5%) | 0 (0.0%) |
| Total | 153 (100.0%) | 111 (100.0%) |
Housing Structure by Heating Type in Ironville
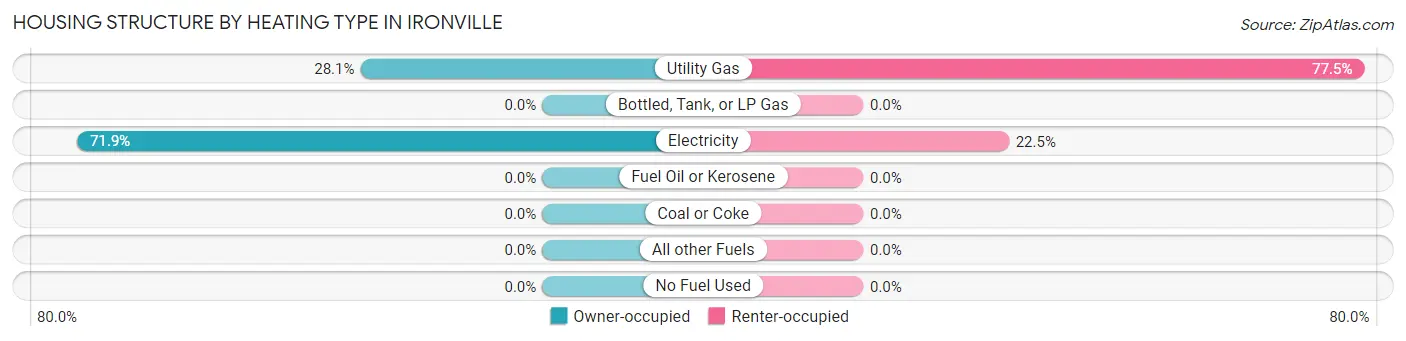
| Heating Type | Owner-occupied | Renter-occupied |
| Utility Gas | 43 (28.1%) | 86 (77.5%) |
| Bottled, Tank, or LP Gas | 0 (0.0%) | 0 (0.0%) |
| Electricity | 110 (71.9%) | 25 (22.5%) |
| Fuel Oil or Kerosene | 0 (0.0%) | 0 (0.0%) |
| Coal or Coke | 0 (0.0%) | 0 (0.0%) |
| All other Fuels | 0 (0.0%) | 0 (0.0%) |
| No Fuel Used | 0 (0.0%) | 0 (0.0%) |
| Total | 153 (100.0%) | 111 (100.0%) |
Household Vehicle Usage in Ironville
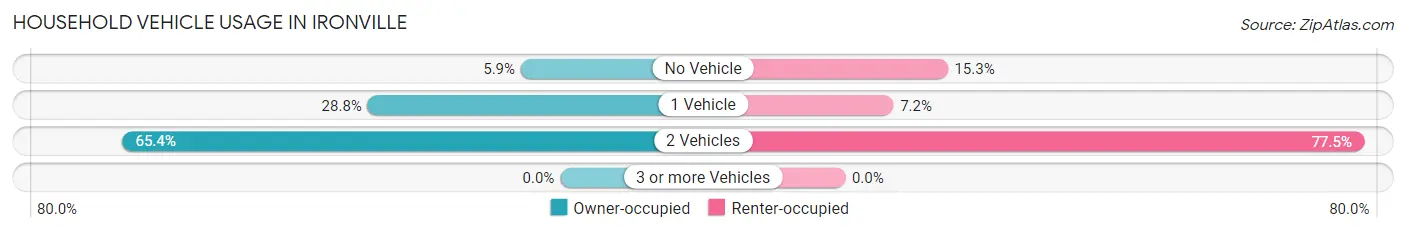
| Vehicles per Household | Owner-occupied | Renter-occupied |
| No Vehicle | 9 (5.9%) | 17 (15.3%) |
| 1 Vehicle | 44 (28.8%) | 8 (7.2%) |
| 2 Vehicles | 100 (65.4%) | 86 (77.5%) |
| 3 or more Vehicles | 0 (0.0%) | 0 (0.0%) |
| Total | 153 (100.0%) | 111 (100.0%) |
Real Estate & Mortgages in Ironville
Real Estate and Mortgage Overview in Ironville
| Characteristic | Without Mortgage | With Mortgage |
| Housing Units | 22 | 131 |
| Median Property Value | - | - |
| Median Household Income | - | - |
| Monthly Housing Costs | - | - |
| Real Estate Taxes | - | - |
Property Value by Mortgage Status in Ironville
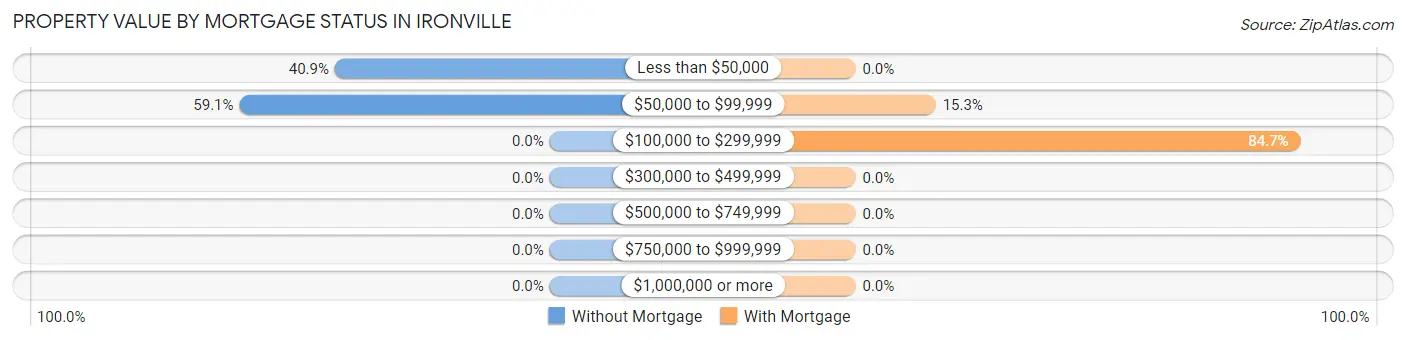
| Property Value | Without Mortgage | With Mortgage |
| Less than $50,000 | 9 (40.9%) | 0 (0.0%) |
| $50,000 to $99,999 | 13 (59.1%) | 20 (15.3%) |
| $100,000 to $299,999 | 0 (0.0%) | 111 (84.7%) |
| $300,000 to $499,999 | 0 (0.0%) | 0 (0.0%) |
| $500,000 to $749,999 | 0 (0.0%) | 0 (0.0%) |
| $750,000 to $999,999 | 0 (0.0%) | 0 (0.0%) |
| $1,000,000 or more | 0 (0.0%) | 0 (0.0%) |
| Total | 22 (100.0%) | 131 (100.0%) |
Household Income by Mortgage Status in Ironville
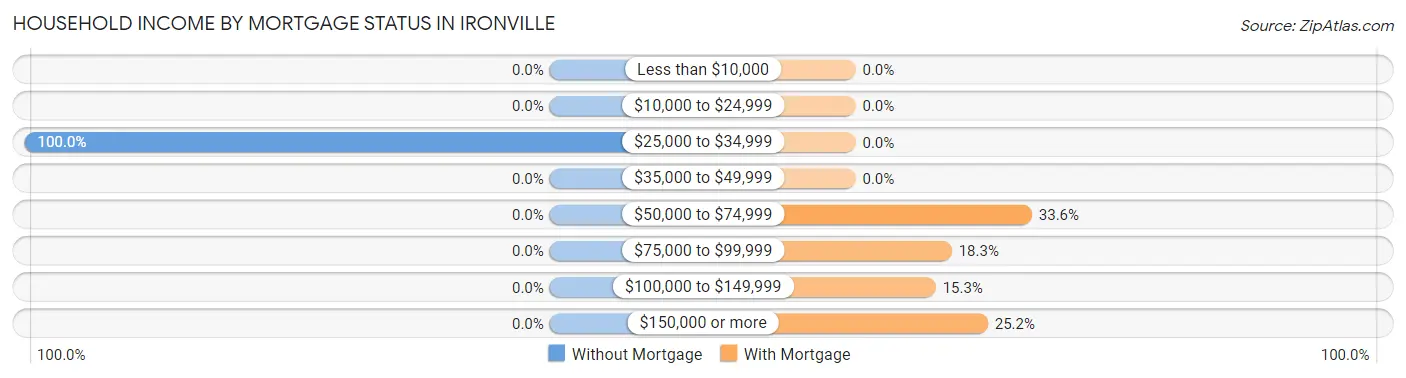
| Household Income | Without Mortgage | With Mortgage |
| Less than $10,000 | 0 (0.0%) | 0 (0.0%) |
| $10,000 to $24,999 | 0 (0.0%) | 0 (0.0%) |
| $25,000 to $34,999 | 22 (100.0%) | 0 (0.0%) |
| $35,000 to $49,999 | 0 (0.0%) | 0 (0.0%) |
| $50,000 to $74,999 | 0 (0.0%) | 44 (33.6%) |
| $75,000 to $99,999 | 0 (0.0%) | 24 (18.3%) |
| $100,000 to $149,999 | 0 (0.0%) | 20 (15.3%) |
| $150,000 or more | 0 (0.0%) | 33 (25.2%) |
| Total | 22 (100.0%) | 131 (100.0%) |
Property Value to Household Income Ratio in Ironville
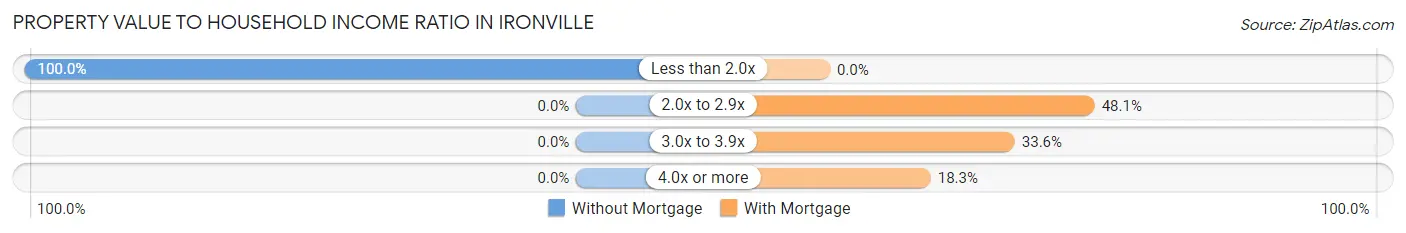
| Value-to-Income Ratio | Without Mortgage | With Mortgage |
| Less than 2.0x | 22 (100.0%) | 0 (0.0%) |
| 2.0x to 2.9x | 0 (0.0%) | 63 (48.1%) |
| 3.0x to 3.9x | 0 (0.0%) | 44 (33.6%) |
| 4.0x or more | 0 (0.0%) | 24 (18.3%) |
| Total | 22 (100.0%) | 131 (100.0%) |
Real Estate Taxes by Mortgage Status in Ironville
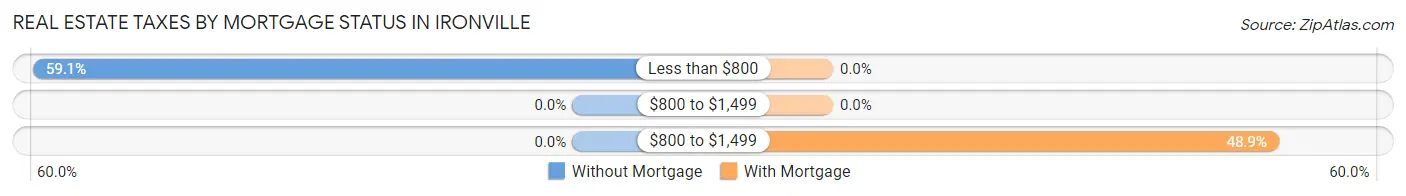
| Property Taxes | Without Mortgage | With Mortgage |
| Less than $800 | 13 (59.1%) | 0 (0.0%) |
| $800 to $1,499 | 0 (0.0%) | 0 (0.0%) |
| $800 to $1,499 | 0 (0.0%) | 64 (48.8%) |
| Total | 22 (100.0%) | 131 (100.0%) |
Health & Disability in Ironville
Health Insurance Coverage by Age in Ironville
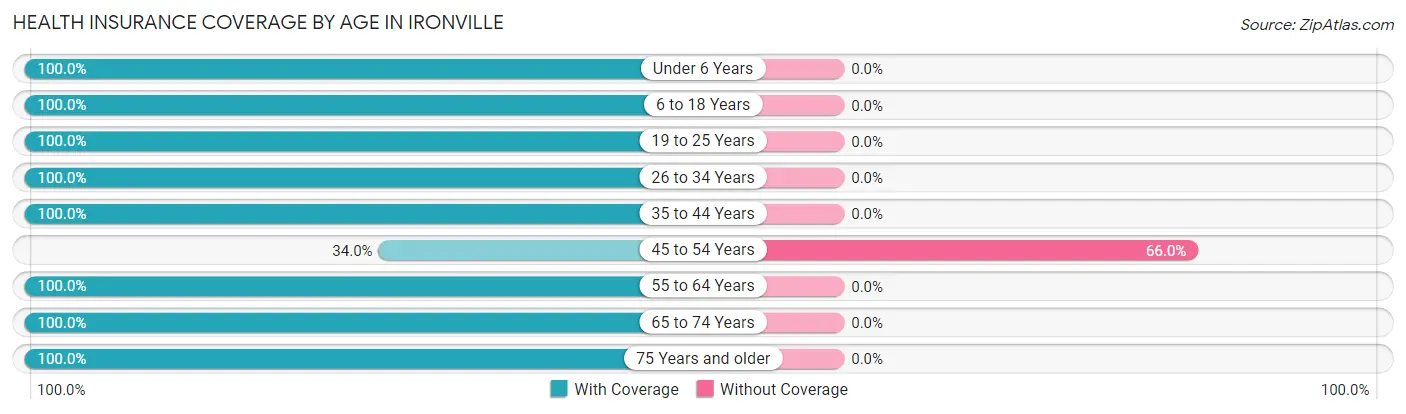
| Age Bracket | With Coverage | Without Coverage |
| Under 6 Years | 14 (100.0%) | 0 (0.0%) |
| 6 to 18 Years | 223 (100.0%) | 0 (0.0%) |
| 19 to 25 Years | 62 (100.0%) | 0 (0.0%) |
| 26 to 34 Years | 8 (100.0%) | 0 (0.0%) |
| 35 to 44 Years | 176 (100.0%) | 0 (0.0%) |
| 45 to 54 Years | 33 (34.0%) | 64 (66.0%) |
| 55 to 64 Years | 11 (100.0%) | 0 (0.0%) |
| 65 to 74 Years | 10 (100.0%) | 0 (0.0%) |
| 75 Years and older | 134 (100.0%) | 0 (0.0%) |
| Total | 671 (91.3%) | 64 (8.7%) |
Health Insurance Coverage by Citizenship Status in Ironville
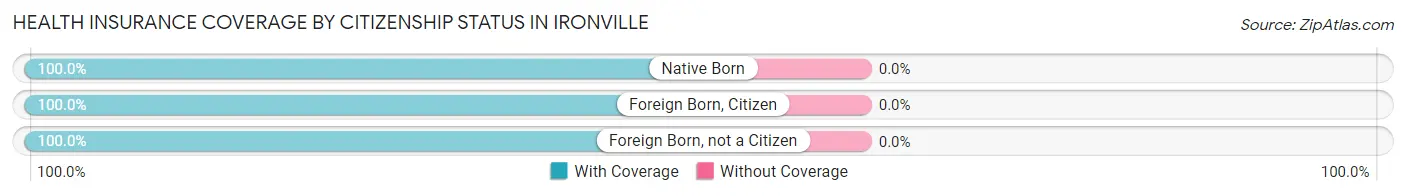
| Citizenship Status | With Coverage | Without Coverage |
| Native Born | 14 (100.0%) | 0 (0.0%) |
| Foreign Born, Citizen | 223 (100.0%) | 0 (0.0%) |
| Foreign Born, not a Citizen | 62 (100.0%) | 0 (0.0%) |
Health Insurance Coverage by Household Income in Ironville
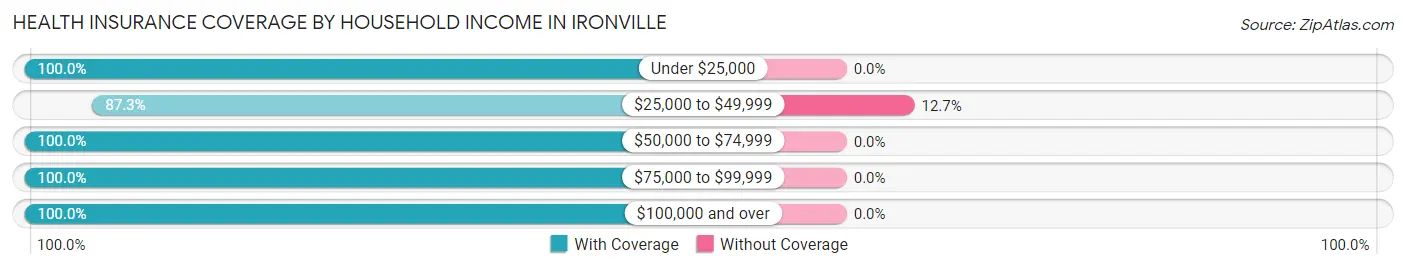
| Household Income | With Coverage | Without Coverage |
| Under $25,000 | 17 (100.0%) | 0 (0.0%) |
| $25,000 to $49,999 | 440 (87.3%) | 64 (12.7%) |
| $50,000 to $74,999 | 63 (100.0%) | 0 (0.0%) |
| $75,000 to $99,999 | 40 (100.0%) | 0 (0.0%) |
| $100,000 and over | 111 (100.0%) | 0 (0.0%) |
Public vs Private Health Insurance Coverage by Age in Ironville
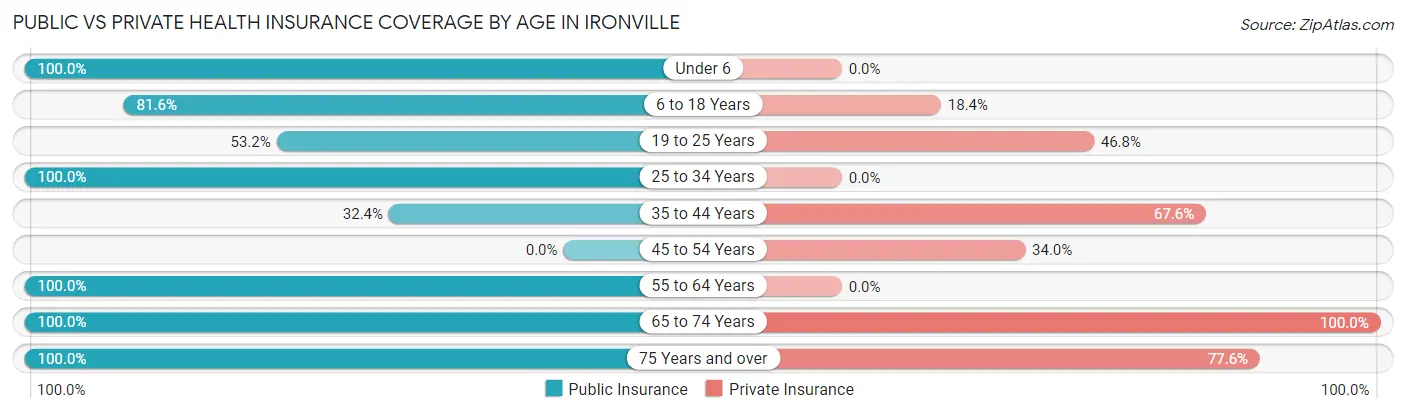
| Age Bracket | Public Insurance | Private Insurance |
| Under 6 | 14 (100.0%) | 0 (0.0%) |
| 6 to 18 Years | 182 (81.6%) | 41 (18.4%) |
| 19 to 25 Years | 33 (53.2%) | 29 (46.8%) |
| 25 to 34 Years | 8 (100.0%) | 0 (0.0%) |
| 35 to 44 Years | 57 (32.4%) | 119 (67.6%) |
| 45 to 54 Years | 0 (0.0%) | 33 (34.0%) |
| 55 to 64 Years | 11 (100.0%) | 0 (0.0%) |
| 65 to 74 Years | 10 (100.0%) | 10 (100.0%) |
| 75 Years and over | 134 (100.0%) | 104 (77.6%) |
| Total | 449 (61.1%) | 336 (45.7%) |
Disability Status by Sex by Age in Ironville
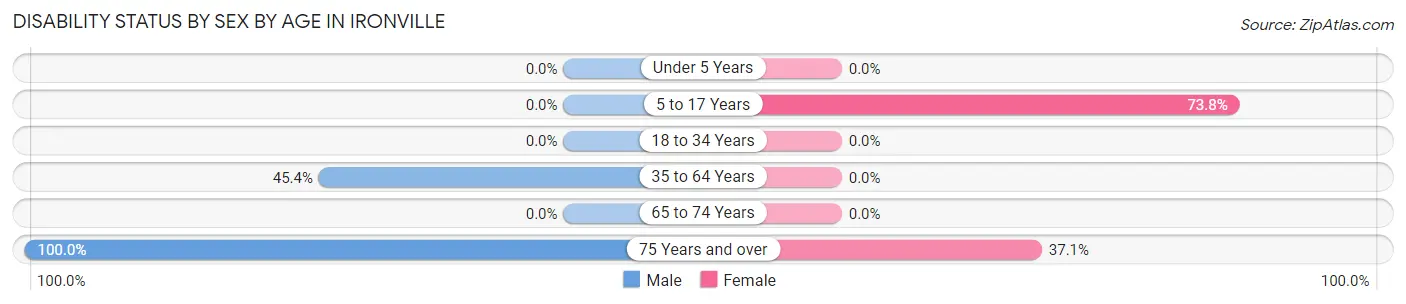
| Age Bracket | Male | Female |
| Under 5 Years | 0 (0.0%) | 0 (0.0%) |
| 5 to 17 Years | 0 (0.0%) | 62 (73.8%) |
| 18 to 34 Years | 0 (0.0%) | 0 (0.0%) |
| 35 to 64 Years | 64 (45.4%) | 0 (0.0%) |
| 65 to 74 Years | 0 (0.0%) | 0 (0.0%) |
| 75 Years and over | 64 (100.0%) | 26 (37.1%) |
Disability Class by Sex by Age in Ironville
Disability Class: Hearing Difficulty
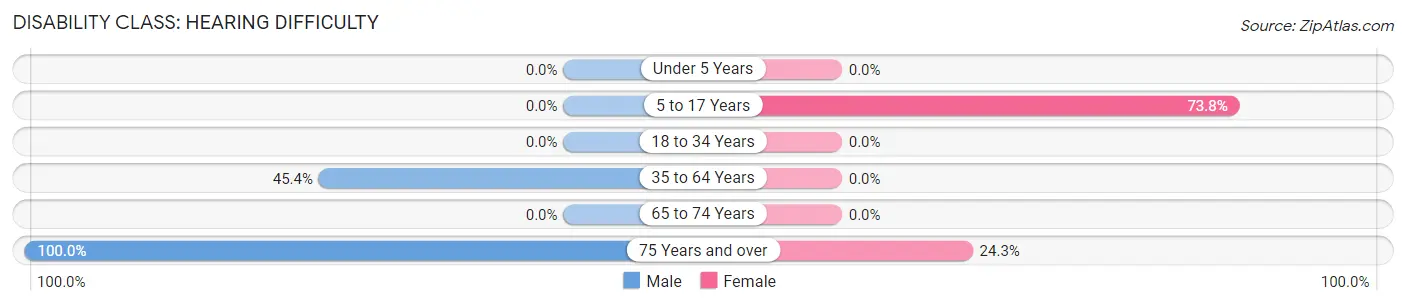
| Age Bracket | Male | Female |
| Under 5 Years | 0 (0.0%) | 0 (0.0%) |
| 5 to 17 Years | 0 (0.0%) | 62 (73.8%) |
| 18 to 34 Years | 0 (0.0%) | 0 (0.0%) |
| 35 to 64 Years | 64 (45.4%) | 0 (0.0%) |
| 65 to 74 Years | 0 (0.0%) | 0 (0.0%) |
| 75 Years and over | 64 (100.0%) | 17 (24.3%) |
Disability Class: Vision Difficulty
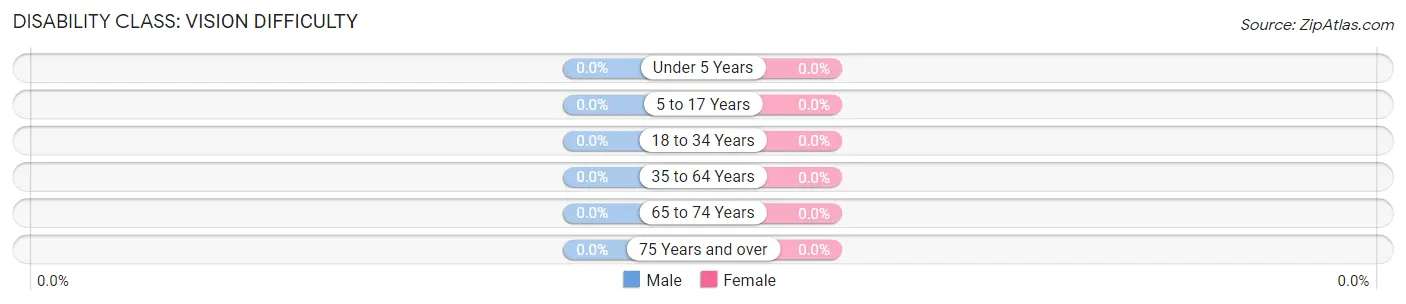
| Age Bracket | Male | Female |
| Under 5 Years | 0 (0.0%) | 0 (0.0%) |
| 5 to 17 Years | 0 (0.0%) | 0 (0.0%) |
| 18 to 34 Years | 0 (0.0%) | 0 (0.0%) |
| 35 to 64 Years | 0 (0.0%) | 0 (0.0%) |
| 65 to 74 Years | 0 (0.0%) | 0 (0.0%) |
| 75 Years and over | 0 (0.0%) | 0 (0.0%) |
Disability Class: Cognitive Difficulty
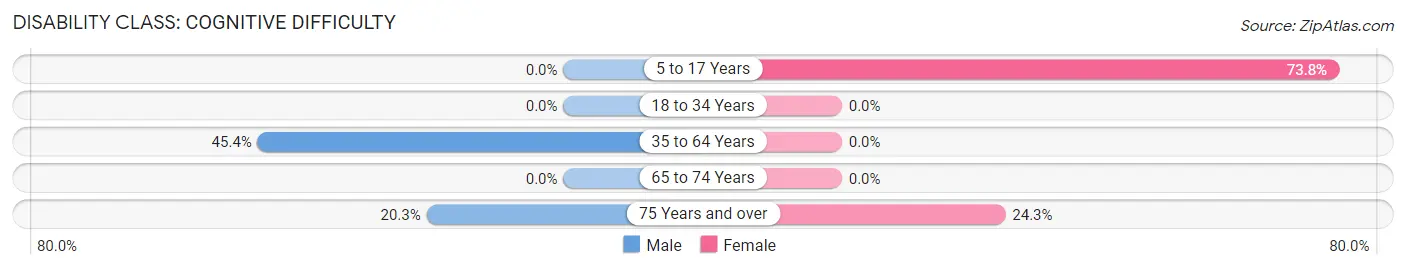
| Age Bracket | Male | Female |
| 5 to 17 Years | 0 (0.0%) | 62 (73.8%) |
| 18 to 34 Years | 0 (0.0%) | 0 (0.0%) |
| 35 to 64 Years | 64 (45.4%) | 0 (0.0%) |
| 65 to 74 Years | 0 (0.0%) | 0 (0.0%) |
| 75 Years and over | 13 (20.3%) | 17 (24.3%) |
Disability Class: Ambulatory Difficulty
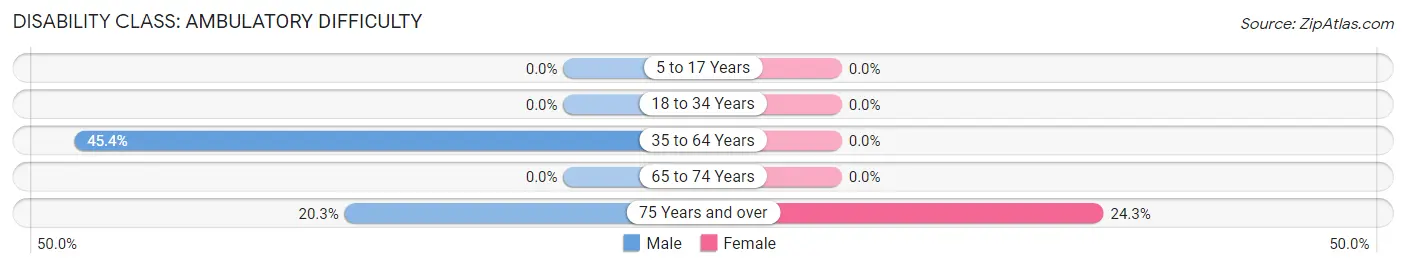
| Age Bracket | Male | Female |
| 5 to 17 Years | 0 (0.0%) | 0 (0.0%) |
| 18 to 34 Years | 0 (0.0%) | 0 (0.0%) |
| 35 to 64 Years | 64 (45.4%) | 0 (0.0%) |
| 65 to 74 Years | 0 (0.0%) | 0 (0.0%) |
| 75 Years and over | 13 (20.3%) | 17 (24.3%) |
Disability Class: Self-Care Difficulty
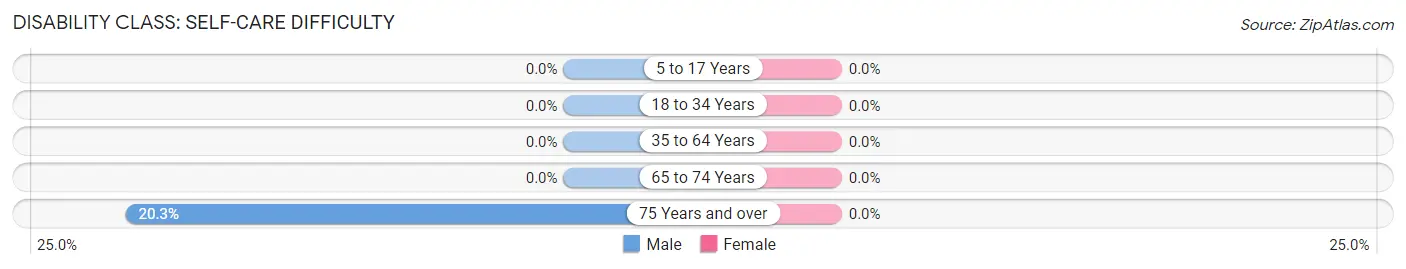
| Age Bracket | Male | Female |
| 5 to 17 Years | 0 (0.0%) | 0 (0.0%) |
| 18 to 34 Years | 0 (0.0%) | 0 (0.0%) |
| 35 to 64 Years | 0 (0.0%) | 0 (0.0%) |
| 65 to 74 Years | 0 (0.0%) | 0 (0.0%) |
| 75 Years and over | 13 (20.3%) | 0 (0.0%) |
Technology Access in Ironville
Computing Device Access in Ironville
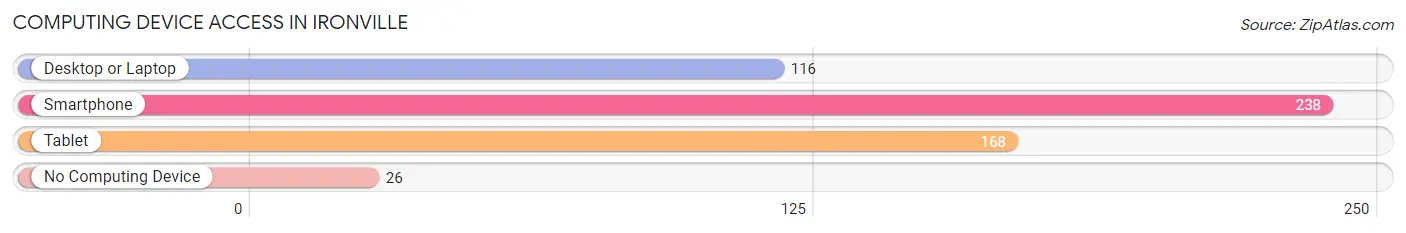
| Device Type | # Households | % Households |
| Desktop or Laptop | 116 | 43.9% |
| Smartphone | 238 | 90.1% |
| Tablet | 168 | 63.6% |
| No Computing Device | 26 | 9.9% |
| Total | 264 | 100.0% |
Internet Access in Ironville
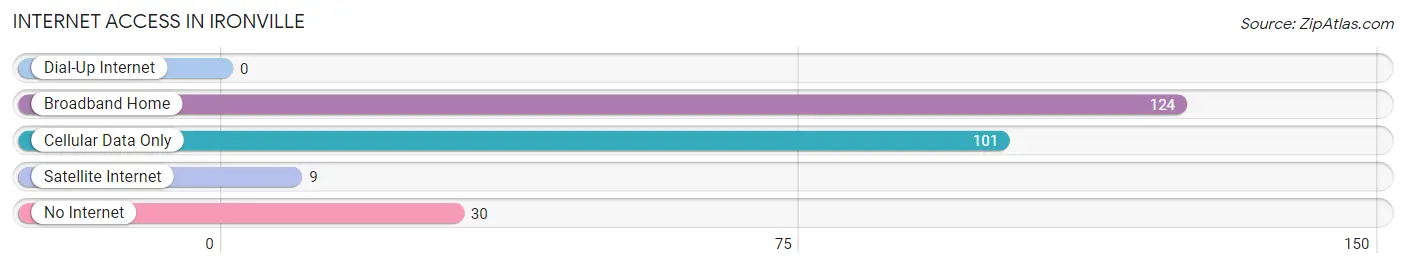
| Internet Type | # Households | % Households |
| Dial-Up Internet | 0 | 0.0% |
| Broadband Home | 124 | 47.0% |
| Cellular Data Only | 101 | 38.3% |
| Satellite Internet | 9 | 3.4% |
| No Internet | 30 | 11.4% |
| Total | 264 | 100.0% |
Ironville Summary
Ironville is a small unincorporated community located in the southeastern corner of Carter County, Kentucky. It is situated on the banks of the Little Sandy River, approximately five miles south of Grayson. The population of Ironville was estimated to be around 200 people in 2020.
History
Ironville was first settled in the early 1800s by a group of settlers from Virginia. The town was originally known as Ironville Station, as it was a stop on the Louisville and Nashville Railroad. The town was officially incorporated in 1883.
Ironville was an important center of industry in the late 19th and early 20th centuries. The town was home to several iron foundries, which produced a variety of products, including stoves, tools, and farm implements. The town also had a number of coal mines, which provided employment for many of the town’s residents.
Geography
Ironville is located in the southeastern corner of Carter County, Kentucky. It is situated on the banks of the Little Sandy River, approximately five miles south of Grayson. The town is surrounded by rolling hills and forests, and is located in a rural area.
The climate in Ironville is humid subtropical, with hot summers and mild winters. The average annual temperature is around 60 degrees Fahrenheit, and the average annual precipitation is around 45 inches.
Economy
Ironville’s economy is largely based on agriculture and tourism. The town is home to several farms, which produce a variety of crops, including corn, soybeans, and hay. The town also has a number of tourist attractions, including the Ironville Museum, which showcases the town’s history and culture.
Demographics
The population of Ironville was estimated to be around 200 people in 2020. The town is predominantly white, with a small African American population. The median household income in Ironville is around $30,000, and the median home value is around $90,000. The town has a high rate of poverty, with around 25% of the population living below the poverty line.
Common Questions
What is Per Capita Income in Ironville?
Per Capita income in Ironville is $22,118.
What is the Median Family Income in Ironville?
Median Family Income in Ironville is $46,875.
What is the Median Household income in Ironville?
Median Household Income in Ironville is $46,386.
What is Inequality or Gini Index in Ironville?
Inequality or Gini Index in Ironville is 0.29.
What is the Total Population of Ironville?
Total Population of Ironville is 735.
What is the Total Male Population of Ironville?
Total Male Population of Ironville is 345.
What is the Total Female Population of Ironville?
Total Female Population of Ironville is 390.
What is the Ratio of Males per 100 Females in Ironville?
There are 88.46 Males per 100 Females in Ironville.
What is the Ratio of Females per 100 Males in Ironville?
There are 113.04 Females per 100 Males in Ironville.
What is the Median Population Age in Ironville?
Median Population Age in Ironville is 37.1 Years.
What is the Average Family Size in Ironville
Average Family Size in Ironville is 2.9 People.
What is the Average Household Size in Ironville
Average Household Size in Ironville is 2.8 People.
How Large is the Labor Force in Ironville?
There are 383 People in the Labor Forcein in Ironville.
What is the Percentage of People in the Labor Force in Ironville?
69.6% of People are in the Labor Force in Ironville.