Zip Codes with the Highest Poverty Level Among Children Under the Age of 5 in Louisville, KY

RELATED REPORTS & OPTIONS

Highest Poverty | Child 0-5
Population
Families and Households
Female Fertility
Female Fertility (Unmarried)
Race (Community Size)
Race (Percentage)
Ancestry (Community Size)
AfghanAfricanAlaska NativeAlbanianAlsatianAmericanApacheArabArgentineanArmenianAssyrian / Chaldean / SyriacAustralianAustrianBahamianBangladeshiBarbadianBelgianBelizeanBhutaneseBlackfeetBolivianBrazilianBritishBritish West IndianBulgarianBurmeseCajunCambodianCanadianCape VerdeanCelticCentral AmericanCentral American IndianCherokeeChickasawChileanChippewaChoctawColombianComancheCosta RicanCreekCroatianCrowCubanCzechCzechoslovakianDanishDominicanDutchEastern EuropeanEcuadorianEgyptianEnglishEstonianEthiopianEuropeanFilipinoFinnishFrenchFrench American IndianFrench CanadianGermanGhanaianGreekGuamanian / ChamorroGuatemalanHaitianHonduranHungarianIcelanderIndian (Asian)IndonesianInupiatIranianIraqiIrishIroquoisIsraeliItalianJamaicanJapaneseJordanianKenyanKoreanLaotianLatvianLebaneseLiberianLithuanianLumbeeLuxembourgerMalaysianMexicanMexican American IndianMongolianMoroccanNative HawaiianNew ZealanderNicaraguanNigerianNorthern EuropeanNorwegianOsagePakistaniPalestinianPanamanianParaguayanPennsylvania GermanPeruvianPolishPortuguesePotawatomiPuebloPuerto RicanRomanianRussianSalvadoranSamoanScandinavianScotch-IrishScottishSeminoleSerbianSiouxSlavicSlovakSloveneSomaliSouth AfricanSouth AmericanSpaniardSpanishSri LankanSubsaharan AfricanSudaneseSwedishSwissSyrianThaiTohono O'OdhamTrinidadian and TobagonianTurkishU.S. Virgin IslanderUgandanUkrainianVenezuelanWelshWest IndianYugoslavian
Ancestry (Percentage)
AfghanAfricanAlaska NativeAlbanianAlsatianAmericanApacheArabArgentineanArmenianAssyrian / Chaldean / SyriacAustralianAustrianBahamianBangladeshiBarbadianBelgianBelizeanBhutaneseBlackfeetBolivianBrazilianBritishBritish West IndianBulgarianBurmeseCajunCambodianCanadianCape VerdeanCelticCentral AmericanCentral American IndianCherokeeChickasawChileanChippewaChoctawColombianComancheCosta RicanCreekCroatianCrowCubanCzechCzechoslovakianDanishDominicanDutchEastern EuropeanEcuadorianEgyptianEnglishEstonianEthiopianEuropeanFilipinoFinnishFrenchFrench American IndianFrench CanadianGermanGhanaianGreekGuamanian / ChamorroGuatemalanHaitianHonduranHungarianIcelanderIndian (Asian)IndonesianInupiatIranianIraqiIrishIroquoisIsraeliItalianJamaicanJapaneseJordanianKenyanKoreanLaotianLatvianLebaneseLiberianLithuanianLumbeeLuxembourgerMalaysianMexicanMexican American IndianMongolianMoroccanNative HawaiianNew ZealanderNicaraguanNigerianNorthern EuropeanNorwegianOsagePakistaniPalestinianPanamanianParaguayanPennsylvania GermanPeruvianPolishPortuguesePotawatomiPuebloPuerto RicanRomanianRussianSalvadoranSamoanScandinavianScotch-IrishScottishSeminoleSerbianSiouxSlavicSlovakSloveneSomaliSouth AfricanSouth AmericanSpaniardSpanishSri LankanSubsaharan AfricanSudaneseSwedishSwissSyrianThaiTohono O'OdhamTrinidadian and TobagonianTurkishU.S. Virgin IslanderUgandanUkrainianVenezuelanWelshWest IndianYugoslavian
Immigrant Origin (Total)
AfghanistanAfricaAlbaniaArgentinaAsiaAustraliaAustriaBangladeshBarbadosBelarusBelgiumBelizeBoliviaBosnia and HerzegovinaBrazilBulgariaBurma / MyanmarCambodiaCameroonCanadaCaribbeanCentral AmericaChileChinaColombiaCongoCosta RicaCroatiaCubaCzechoslovakiaDenmarkDominican RepublicEastern AfricaEastern AsiaEastern EuropeEcuadorEgyptEl SalvadorEnglandEritreaEthiopiaEuropeFranceGermanyGhanaGuatemalaGuyanaHaitiHondurasHong KongHungaryIndiaIndonesiaIranIraqIrelandIsraelItalyJamaicaJapanJordanKazakhstanKenyaKoreaKuwaitLaosLatin AmericaLebanonLiberiaLithuaniaMalaysiaMexicoMicronesiaMiddle AfricaMoldovaMoroccoNepalNetherlandsNicaraguaNigeriaNorthern AfricaNorthern EuropeNorwayOceaniaPakistanPanamaPeruPhilippinesPolandPortugalRomaniaRussiaSaudi ArabiaScotlandSenegalSerbiaSingaporeSomaliaSouth AfricaSouth AmericaSouth Central AsiaSouth Eastern AsiaSouthern EuropeSpainSri LankaSudanSwedenSyriaTaiwanThailandTrinidad and TobagoTurkeyUgandaUkraineUzbekistanVenezuelaVietnamWestern AfricaWestern AsiaWestern EuropeZaire
Immigrant Origin (Percentage)
AfghanistanAfricaAlbaniaArgentinaAsiaAustraliaAustriaBangladeshBarbadosBelarusBelgiumBelizeBoliviaBosnia and HerzegovinaBrazilBulgariaBurma / MyanmarCambodiaCameroonCanadaCaribbeanCentral AmericaChileChinaColombiaCongoCosta RicaCroatiaCubaCzechoslovakiaDenmarkDominican RepublicEastern AfricaEastern AsiaEastern EuropeEcuadorEgyptEl SalvadorEnglandEritreaEthiopiaEuropeFranceGermanyGhanaGuatemalaGuyanaHaitiHondurasHong KongHungaryIndiaIndonesiaIranIraqIrelandIsraelItalyJamaicaJapanJordanKazakhstanKenyaKoreaKuwaitLaosLatin AmericaLebanonLiberiaLithuaniaMalaysiaMexicoMicronesiaMiddle AfricaMoldovaMoroccoNepalNetherlandsNicaraguaNigeriaNorthern AfricaNorthern EuropeNorwayOceaniaPakistanPanamaPeruPhilippinesPolandPortugalRomaniaRussiaSaudi ArabiaScotlandSenegalSerbiaSingaporeSomaliaSouth AfricaSouth AmericaSouth Central AsiaSouth Eastern AsiaSouthern EuropeSpainSri LankaSudanSwedenSyriaTaiwanThailandTrinidad and TobagoTurkeyUgandaUkraineUzbekistanVenezuelaVietnamWestern AfricaWestern AsiaWestern EuropeZaire
Income
Income (Families)
Income (Households)
Poverty
Poverty (Families)
Unemployment
Employment Occupations
Employment Industries
Employer Class
Commute Time
Commute Means
School Enrollment
Education by Degree Field
Occupancy
Finances
Physical Characteristics
Louisville
Compare Zip Codes
Comparison Subject

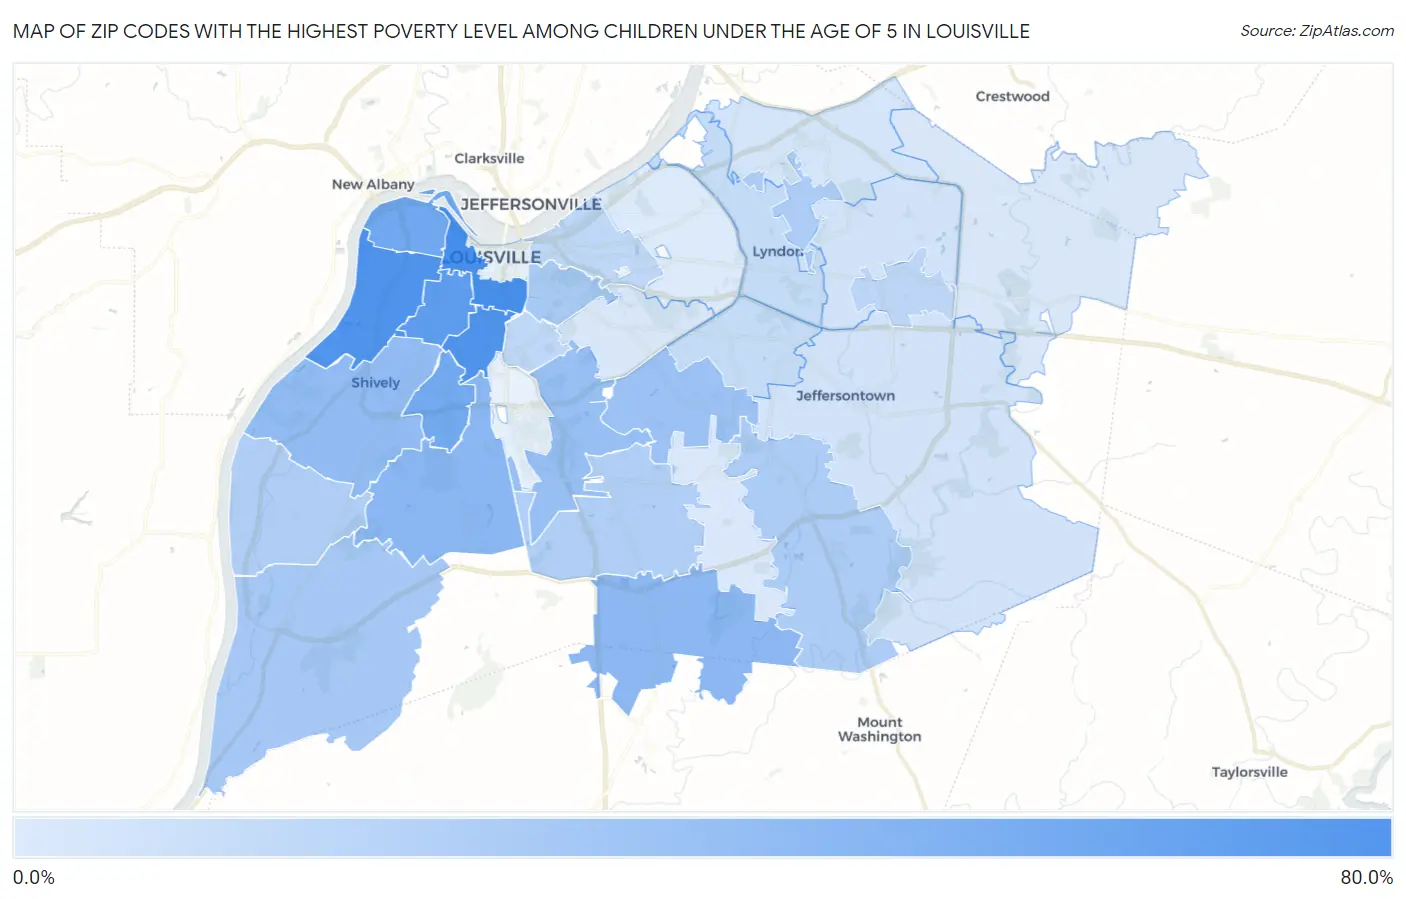
Map of Zip Codes with the Highest Poverty Level Among Children Under the Age of 5 in Louisville

0.0%
80.0%
Zip Codes with the Highest Poverty Level Among Children Under the Age of 5 in Louisville Map

Zip Codes with the Highest Poverty Level Among Children Under the Age of 5 in Louisville, KY

Zip Code Child Poverty vs State vs National
1.4020368.5%23.3%(+45.2)#7418.1%(+50.5)#1,209
2.4021164.3%23.3%(+40.9)#8318.1%(+46.2)#1,435
3.4020864.2%23.3%(+40.9)#8418.1%(+46.2)#1,436
4.4021055.9%23.3%(+32.6)#10418.1%(+37.8)#1,996
5.4021246.4%23.3%(+23.1)#14018.1%(+28.3)#2,994
6.4021545.1%23.3%(+21.8)#14518.1%(+27.0)#3,168
7.4021434.3%23.3%(+11.0)#19418.1%(+16.3)#5,217
8.4022932.7%23.3%(+9.33)#20418.1%(+14.6)#5,680
9.4021630.4%23.3%(+7.07)#22018.1%(+12.3)#6,240
10.4021327.7%23.3%(+4.37)#23818.1%(+9.63)#7,060
11.4021825.5%23.3%(+2.22)#25418.1%(+7.48)#7,807
12.4027222.3%23.3%(-1.04)#28518.1%(+4.22)#9,054
13.4020421.0%23.3%(-2.30)#29318.1%(+2.96)#9,589
14.4029118.8%23.3%(-4.49)#31818.1%(+0.772)#10,575
15.4024218.7%23.3%(-4.60)#31918.1%(+0.657)#10,634
16.4025818.0%23.3%(-5.32)#32418.1%(-0.063)#10,956
17.4021917.5%23.3%(-5.86)#32618.1%(-0.597)#11,206
18.4024312.4%23.3%(-11.0)#37018.1%(-5.70)#13,992
19.4020612.1%23.3%(-11.2)#37418.1%(-5.98)#14,162
20.4021711.5%23.3%(-11.8)#38418.1%(-6.58)#14,535
21.402229.5%23.3%(-13.8)#39918.1%(-8.59)#15,745
22.402209.3%23.3%(-14.0)#40018.1%(-8.72)#15,824
23.402994.9%23.3%(-18.4)#43118.1%(-13.1)#18,813
24.402234.6%23.3%(-18.7)#43618.1%(-13.4)#19,013
25.402414.5%23.3%(-18.8)#43718.1%(-13.6)#19,117
26.402452.4%23.3%(-20.9)#45818.1%(-15.6)#20,536
27.402052.3%23.3%(-21.1)#45918.1%(-15.8)#20,656
28.402281.6%23.3%(-21.7)#46418.1%(-16.4)#21,067
29.402070.86%23.3%(-22.5)#46718.1%(-17.2)#21,460

Common Questions

What are the Top 10 Zip Codes with the Highest Poverty Level Among Children Under the Age of 5 in Louisville, KY?
Top 10 Zip Codes with the Highest Poverty Level Among Children Under the Age of 5 in Louisville, KY are:
#1
68.5%
#2
64.3%
#3
64.2%
#4
55.9%
#5
46.4%
#6
45.1%
#7
34.3%
#8
32.7%
#9
30.4%
#10
27.7%
What zip code has the Highest Poverty Level Among Children Under the Age of 5 in Louisville, KY?
40203 has the Highest Poverty Level Among Children Under the Age of 5 in Louisville, KY with 68.5%.
What is the Poverty Level Among Children Under the Age of 5 in Louisville, KY?
Poverty Level Among Children Under the Age of 5 in Louisville is 24.7%.
What is the Poverty Level Among Children Under the Age of 5 in Kentucky?
Poverty Level Among Children Under the Age of 5 in Kentucky is 23.3%.
What is the Poverty Level Among Children Under the Age of 5 in the United States?
Poverty Level Among Children Under the Age of 5 in the United States is 18.1%.