Aberdeen, IN Map & Demographics
Aberdeen Map
Aberdeen Overview
$61,960
PER CAPITA INCOME
$154,044
AVG FAMILY INCOME
$129,792
AVG HOUSEHOLD INCOME
55.1%
WAGE / INCOME GAP [ % ]
44.9¢/ $1
WAGE / INCOME GAP [ $ ]
0.43
INEQUALITY / GINI INDEX
1,756
TOTAL POPULATION
790
MALE POPULATION
966
FEMALE POPULATION
81.78
MALES / 100 FEMALES
122.28
FEMALES / 100 MALES
52.5
MEDIAN AGE
2.9
AVG FAMILY SIZE
2.1
AVG HOUSEHOLD SIZE
972
LABOR FORCE [ PEOPLE ]
66.7%
PERCENT IN LABOR FORCE
1.6%
UNEMPLOYMENT RATE
Income in Aberdeen
Income Overview in Aberdeen
Per Capita Income in Aberdeen is $61,960, while median incomes of families and households are $154,044 and $129,792 respectively.
| Characteristic | Number | Measure |
| Per Capita Income | 1,756 | $61,960 |
| Median Family Income | 485 | $154,044 |
| Mean Family Income | 485 | $170,537 |
| Median Household Income | 815 | $129,792 |
| Mean Household Income | 815 | $137,041 |
| Income Deficit | 485 | $0 |
| Wage / Income Gap (%) | 1,756 | 55.06% |
| Wage / Income Gap ($) | 1,756 | 44.94¢ per $1 |
| Gini / Inequality Index | 1,756 | 0.43 |
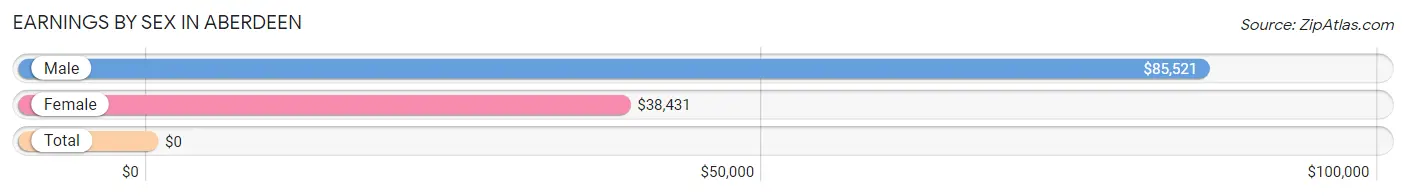
Earnings by Sex in Aberdeen
| Sex | Number | Average Earnings |
| Male | 549 (52.5%) | $85,521 |
| Female | 497 (47.5%) | $38,431 |
| Total | 1,046 (100.0%) | $0 |
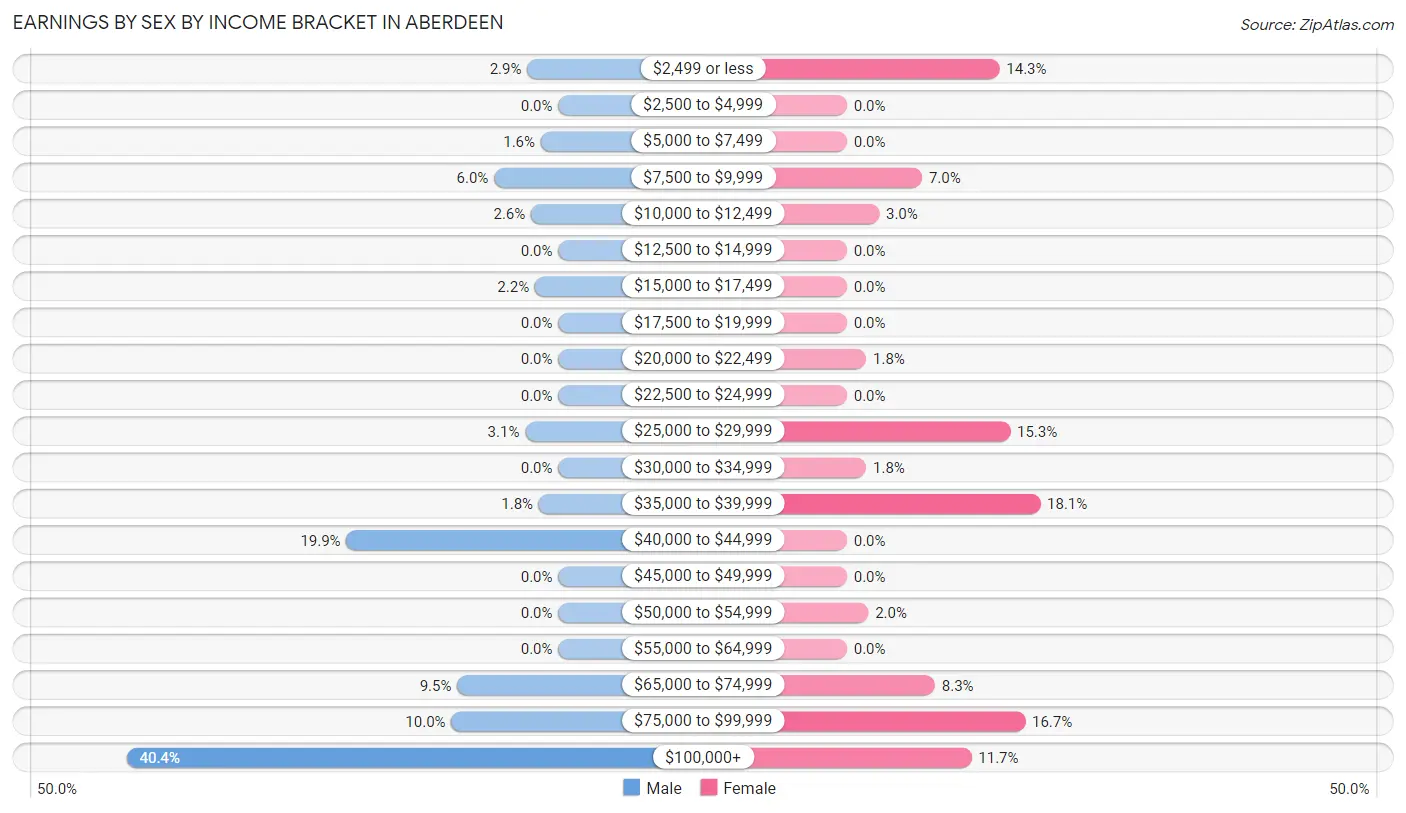
Earnings by Sex by Income Bracket in Aberdeen
The most common earnings brackets in Aberdeen are $100,000+ for men (222 | 40.4%) and $35,000 to $39,999 for women (90 | 18.1%).
| Income | Male | Female |
| $2,499 or less | 16 (2.9%) | 71 (14.3%) |
| $2,500 to $4,999 | 0 (0.0%) | 0 (0.0%) |
| $5,000 to $7,499 | 9 (1.6%) | 0 (0.0%) |
| $7,500 to $9,999 | 33 (6.0%) | 35 (7.0%) |
| $10,000 to $12,499 | 14 (2.5%) | 15 (3.0%) |
| $12,500 to $14,999 | 0 (0.0%) | 0 (0.0%) |
| $15,000 to $17,499 | 12 (2.2%) | 0 (0.0%) |
| $17,500 to $19,999 | 0 (0.0%) | 0 (0.0%) |
| $20,000 to $22,499 | 0 (0.0%) | 9 (1.8%) |
| $22,500 to $24,999 | 0 (0.0%) | 0 (0.0%) |
| $25,000 to $29,999 | 17 (3.1%) | 76 (15.3%) |
| $30,000 to $34,999 | 0 (0.0%) | 9 (1.8%) |
| $35,000 to $39,999 | 10 (1.8%) | 90 (18.1%) |
| $40,000 to $44,999 | 109 (19.9%) | 0 (0.0%) |
| $45,000 to $49,999 | 0 (0.0%) | 0 (0.0%) |
| $50,000 to $54,999 | 0 (0.0%) | 10 (2.0%) |
| $55,000 to $64,999 | 0 (0.0%) | 0 (0.0%) |
| $65,000 to $74,999 | 52 (9.5%) | 41 (8.3%) |
| $75,000 to $99,999 | 55 (10.0%) | 83 (16.7%) |
| $100,000+ | 222 (40.4%) | 58 (11.7%) |
| Total | 549 (100.0%) | 497 (100.0%) |
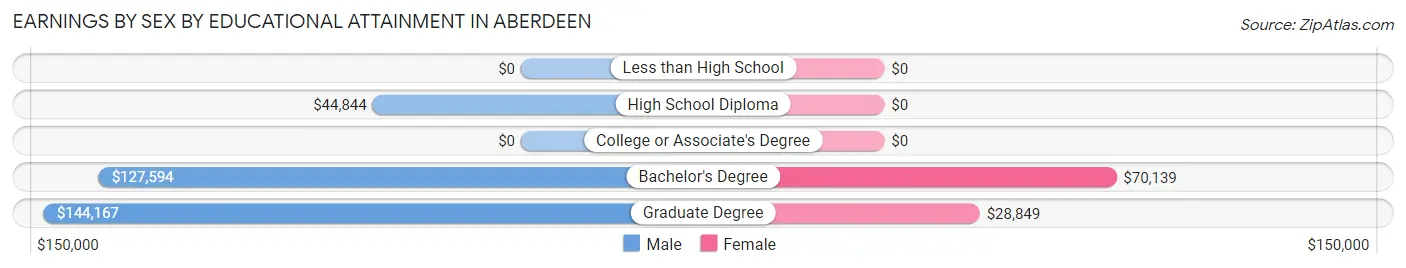
Earnings by Sex by Educational Attainment in Aberdeen
Average earnings in Aberdeen are $93,421 for men and $39,125 for women, a difference of 58.1%. Men with an educational attainment of graduate degree enjoy the highest average annual earnings of $144,167, while those with high school diploma education earn the least with $44,844. Women with an educational attainment of bachelor's degree earn the most with the average annual earnings of $70,139, while those with graduate degree education have the smallest earnings of $28,849.
| Educational Attainment | Male Income | Female Income |
| Less than High School | - | - |
| High School Diploma | $44,844 | $0 |
| College or Associate's Degree | - | - |
| Bachelor's Degree | $127,594 | $70,139 |
| Graduate Degree | $144,167 | $28,849 |
| Total | $93,421 | $39,125 |
Family Income in Aberdeen
Family Income Brackets in Aberdeen
According to the Aberdeen family income data, there are 142 families falling into the $150,000 to $199,999 income range, which is the most common income bracket and makes up 29.3% of all families.
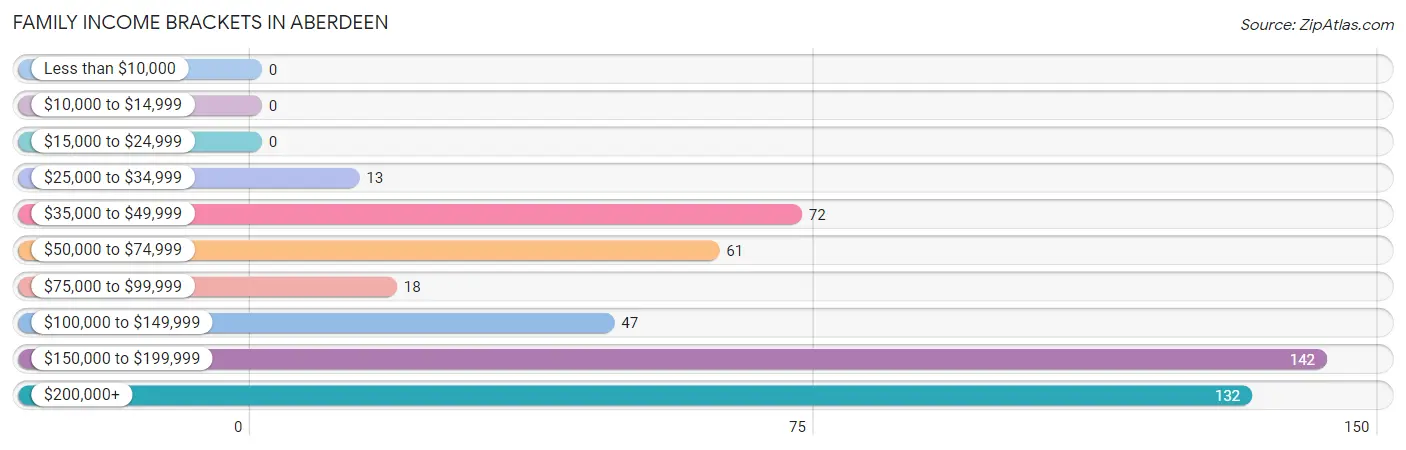
| Income Bracket | # Families | % Families |
| Less than $10,000 | 0 | 0.0% |
| $10,000 to $14,999 | 0 | 0.0% |
| $15,000 to $24,999 | 0 | 0.0% |
| $25,000 to $34,999 | 13 | 2.7% |
| $35,000 to $49,999 | 72 | 14.8% |
| $50,000 to $74,999 | 61 | 12.6% |
| $75,000 to $99,999 | 18 | 3.7% |
| $100,000 to $149,999 | 47 | 9.7% |
| $150,000 to $199,999 | 142 | 29.3% |
| $200,000+ | 132 | 27.2% |
Family Income by Famaliy Size in Aberdeen
3-person families (80 | 16.5%) account for the highest median family income in Aberdeen with $154,461 per family, while 2-person families (263 | 54.2%) have the highest median income of $64,438 per family member.
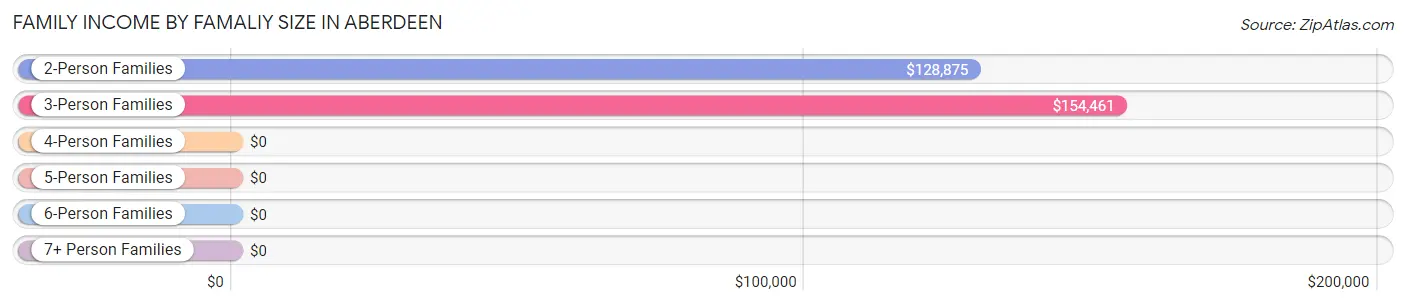
| Income Bracket | # Families | Median Income |
| 2-Person Families | 263 (54.2%) | $128,875 |
| 3-Person Families | 80 (16.5%) | $154,461 |
| 4-Person Families | 98 (20.2%) | $0 |
| 5-Person Families | 44 (9.1%) | $0 |
| 6-Person Families | 0 (0.0%) | $0 |
| 7+ Person Families | 0 (0.0%) | $0 |
| Total | 485 (100.0%) | $154,044 |
Family Income by Number of Earners in Aberdeen
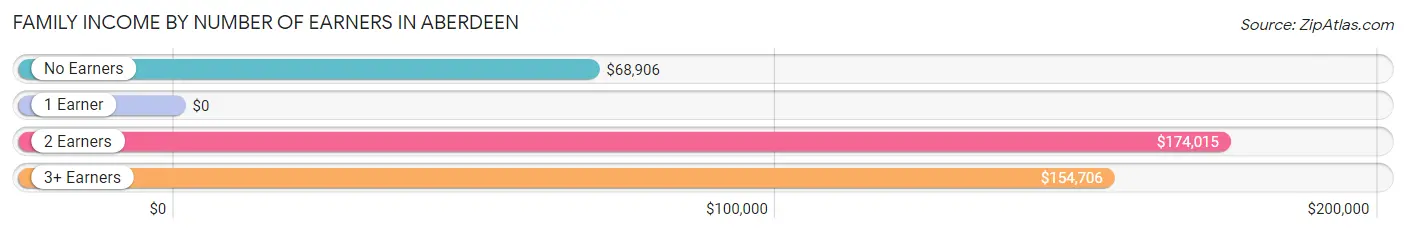
| Number of Earners | # Families | Median Income |
| No Earners | 69 (14.2%) | $68,906 |
| 1 Earner | 68 (14.0%) | $0 |
| 2 Earners | 258 (53.2%) | $174,015 |
| 3+ Earners | 90 (18.6%) | $154,706 |
| Total | 485 (100.0%) | $154,044 |
Household Income in Aberdeen
Household Income Brackets in Aberdeen
With 206 households falling in the category, the $150,000 to $199,999 income range is the most frequent in Aberdeen, accounting for 25.3% of all households.
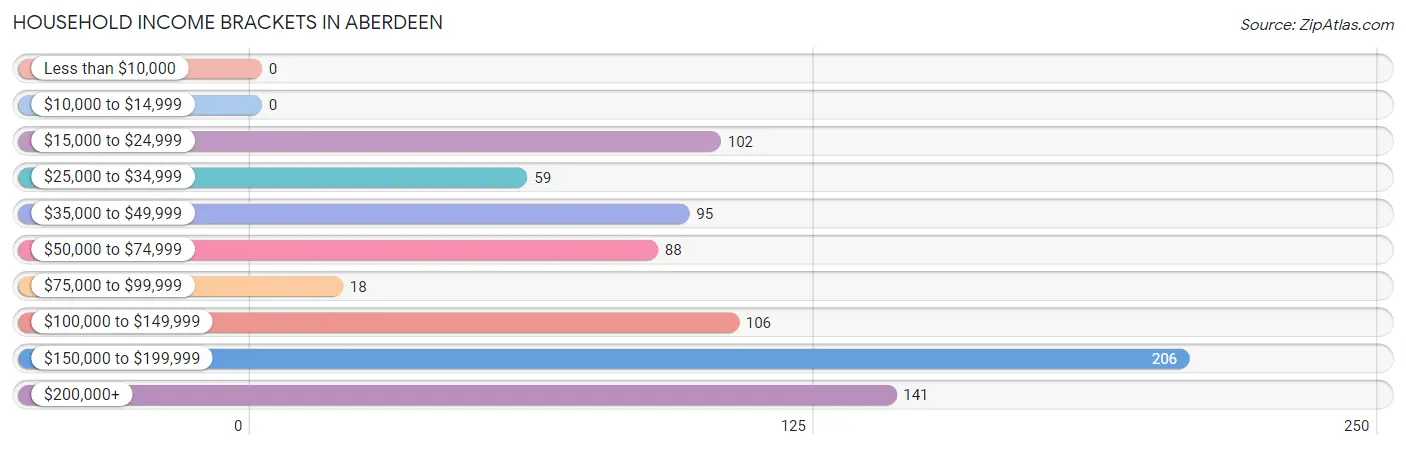
| Income Bracket | # Households | % Households |
| Less than $10,000 | 0 | 0.0% |
| $10,000 to $14,999 | 0 | 0.0% |
| $15,000 to $24,999 | 102 | 12.5% |
| $25,000 to $34,999 | 59 | 7.2% |
| $35,000 to $49,999 | 95 | 11.7% |
| $50,000 to $74,999 | 88 | 10.8% |
| $75,000 to $99,999 | 18 | 2.2% |
| $100,000 to $149,999 | 106 | 13.0% |
| $150,000 to $199,999 | 206 | 25.3% |
| $200,000+ | 141 | 17.3% |
Household Income by Householder Age in Aberdeen
The median household income in Aberdeen is $129,792, with the highest median household income of $160,260 found in the 45 to 64 years age bracket for the primary householder. A total of 293 households (35.9%) fall into this category.
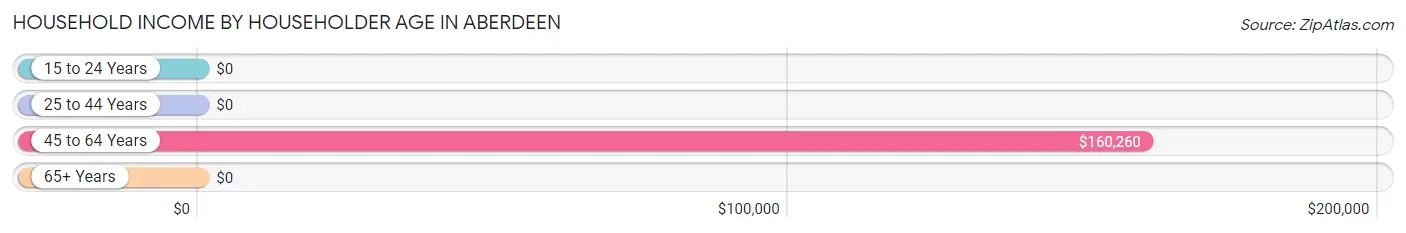
| Income Bracket | # Households | Median Income |
| 15 to 24 Years | 0 (0.0%) | $0 |
| 25 to 44 Years | 154 (18.9%) | $0 |
| 45 to 64 Years | 293 (35.9%) | $160,260 |
| 65+ Years | 368 (45.2%) | $0 |
| Total | 815 (100.0%) | $129,792 |
Poverty in Aberdeen
Income Below Poverty by Sex and Age in Aberdeen
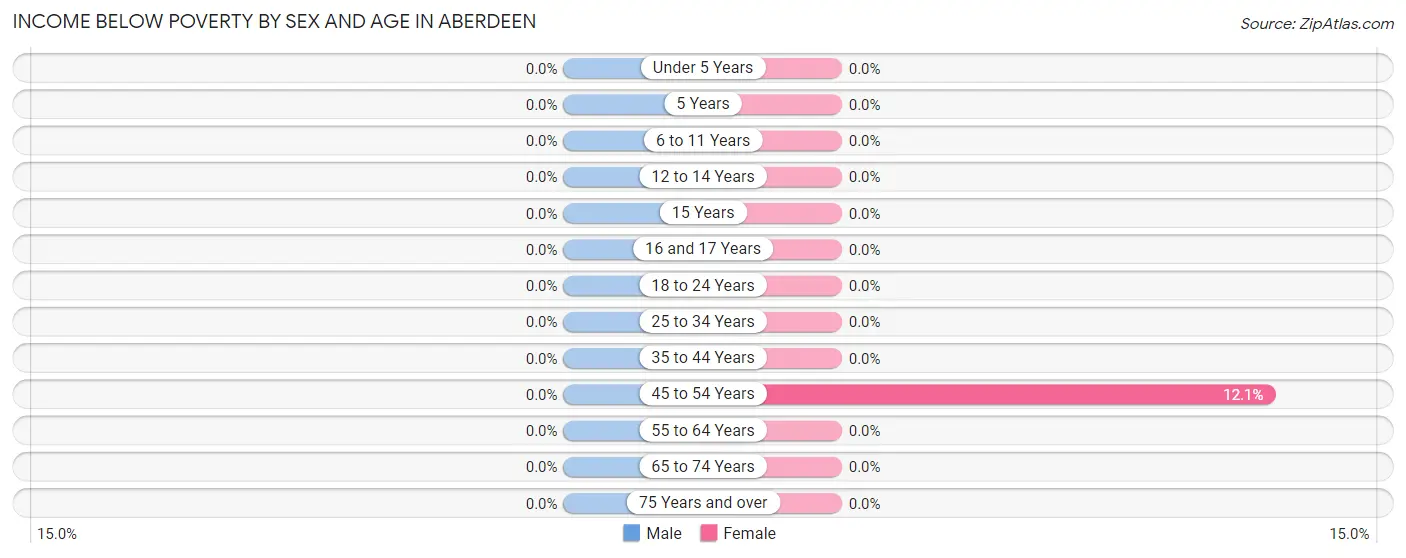
| Age Bracket | Male | Female |
| Under 5 Years | 0 (0.0%) | 0 (0.0%) |
| 5 Years | 0 (0.0%) | 0 (0.0%) |
| 6 to 11 Years | 0 (0.0%) | 0 (0.0%) |
| 12 to 14 Years | 0 (0.0%) | 0 (0.0%) |
| 15 Years | 0 (0.0%) | 0 (0.0%) |
| 16 and 17 Years | 0 (0.0%) | 0 (0.0%) |
| 18 to 24 Years | 0 (0.0%) | 0 (0.0%) |
| 25 to 34 Years | 0 (0.0%) | 0 (0.0%) |
| 35 to 44 Years | 0 (0.0%) | 0 (0.0%) |
| 45 to 54 Years | 0 (0.0%) | 14 (12.1%) |
| 55 to 64 Years | 0 (0.0%) | 0 (0.0%) |
| 65 to 74 Years | 0 (0.0%) | 0 (0.0%) |
| 75 Years and over | 0 (0.0%) | 0 (0.0%) |
| Total | 0 (0.0%) | 14 (1.5%) |
Income Above Poverty by Sex and Age in Aberdeen
According to the poverty statistics in Aberdeen, males aged under 5 years and females aged under 5 years are the age groups that are most secure financially, with 100.0% of males and 100.0% of females in these age groups living above the poverty line.
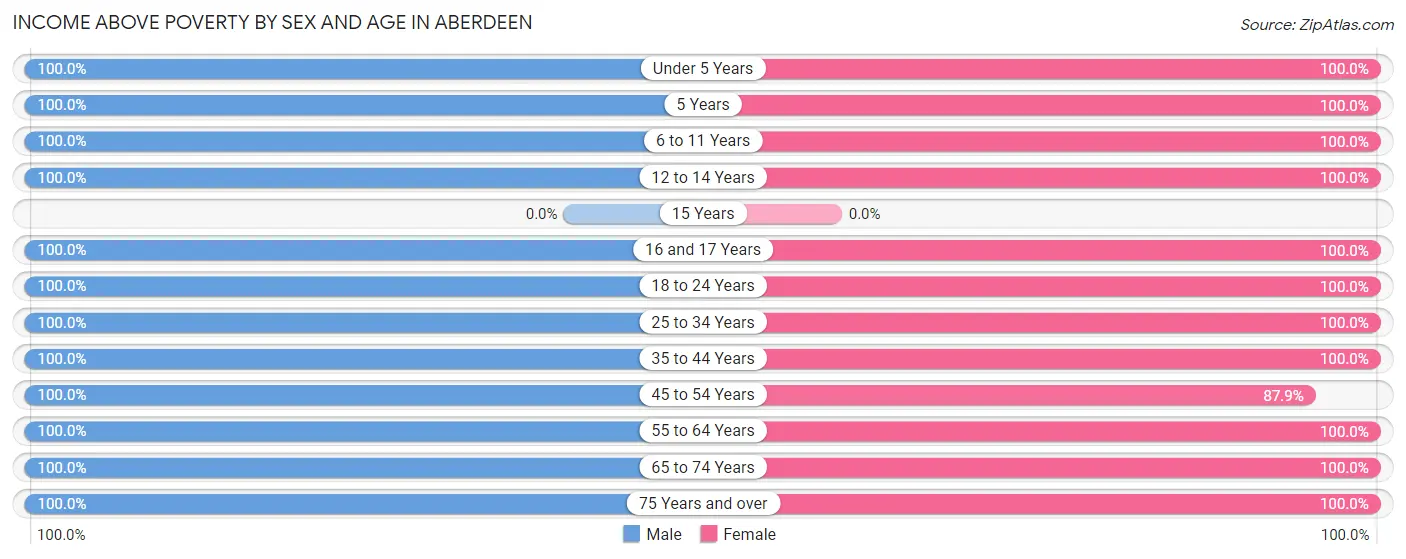
| Age Bracket | Male | Female |
| Under 5 Years | 8 (100.0%) | 9 (100.0%) |
| 5 Years | 9 (100.0%) | 13 (100.0%) |
| 6 to 11 Years | 59 (100.0%) | 98 (100.0%) |
| 12 to 14 Years | 28 (100.0%) | 74 (100.0%) |
| 15 Years | 0 (0.0%) | 0 (0.0%) |
| 16 and 17 Years | 27 (100.0%) | 41 (100.0%) |
| 18 to 24 Years | 17 (100.0%) | 20 (100.0%) |
| 25 to 34 Years | 89 (100.0%) | 39 (100.0%) |
| 35 to 44 Years | 99 (100.0%) | 101 (100.0%) |
| 45 to 54 Years | 75 (100.0%) | 102 (87.9%) |
| 55 to 64 Years | 189 (100.0%) | 182 (100.0%) |
| 65 to 74 Years | 146 (100.0%) | 133 (100.0%) |
| 75 Years and over | 44 (100.0%) | 140 (100.0%) |
| Total | 790 (100.0%) | 952 (98.6%) |
Income Below Poverty Among Married-Couple Families in Aberdeen
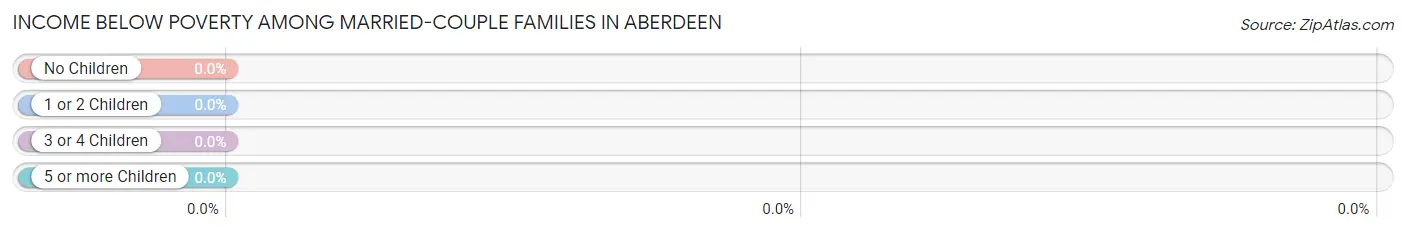
| Children | Above Poverty | Below Poverty |
| No Children | 301 (100.0%) | 0 (0.0%) |
| 1 or 2 Children | 127 (100.0%) | 0 (0.0%) |
| 3 or 4 Children | 44 (100.0%) | 0 (0.0%) |
| 5 or more Children | 0 (0.0%) | 0 (0.0%) |
| Total | 472 (100.0%) | 0 (0.0%) |
Income Below Poverty Among Single-Parent Households in Aberdeen
| Children | Single Father | Single Mother |
| No Children | 0 (0.0%) | 0 (0.0%) |
| 1 or 2 Children | 0 (0.0%) | 0 (0.0%) |
| 3 or 4 Children | 0 (0.0%) | 0 (0.0%) |
| 5 or more Children | 0 (0.0%) | 0 (0.0%) |
| Total | 0 (0.0%) | 0 (0.0%) |
Income Below Poverty Among Married-Couple vs Single-Parent Households in Aberdeen
| Children | Married-Couple Families | Single-Parent Households |
| No Children | 0 (0.0%) | 0 (0.0%) |
| 1 or 2 Children | 0 (0.0%) | 0 (0.0%) |
| 3 or 4 Children | 0 (0.0%) | 0 (0.0%) |
| 5 or more Children | 0 (0.0%) | 0 (0.0%) |
| Total | 0 (0.0%) | 0 (0.0%) |
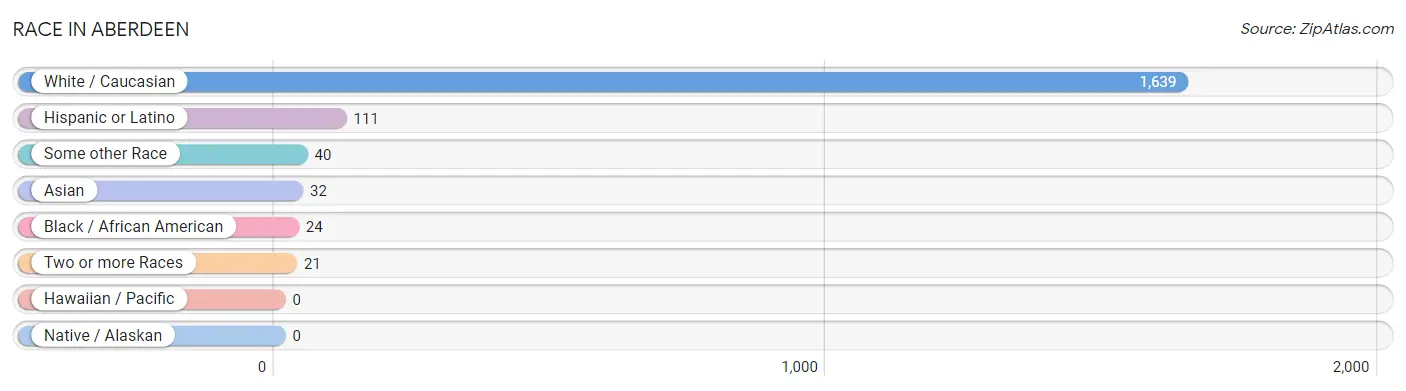
Race in Aberdeen
The most populous races in Aberdeen are White / Caucasian (1,639 | 93.3%), Hispanic or Latino (111 | 6.3%), and Some other Race (40 | 2.3%).
| Race | # Population | % Population |
| Asian | 32 | 1.8% |
| Black / African American | 24 | 1.4% |
| Hawaiian / Pacific | 0 | 0.0% |
| Hispanic or Latino | 111 | 6.3% |
| Native / Alaskan | 0 | 0.0% |
| White / Caucasian | 1,639 | 93.3% |
| Two or more Races | 21 | 1.2% |
| Some other Race | 40 | 2.3% |
| Total | 1,756 | 100.0% |
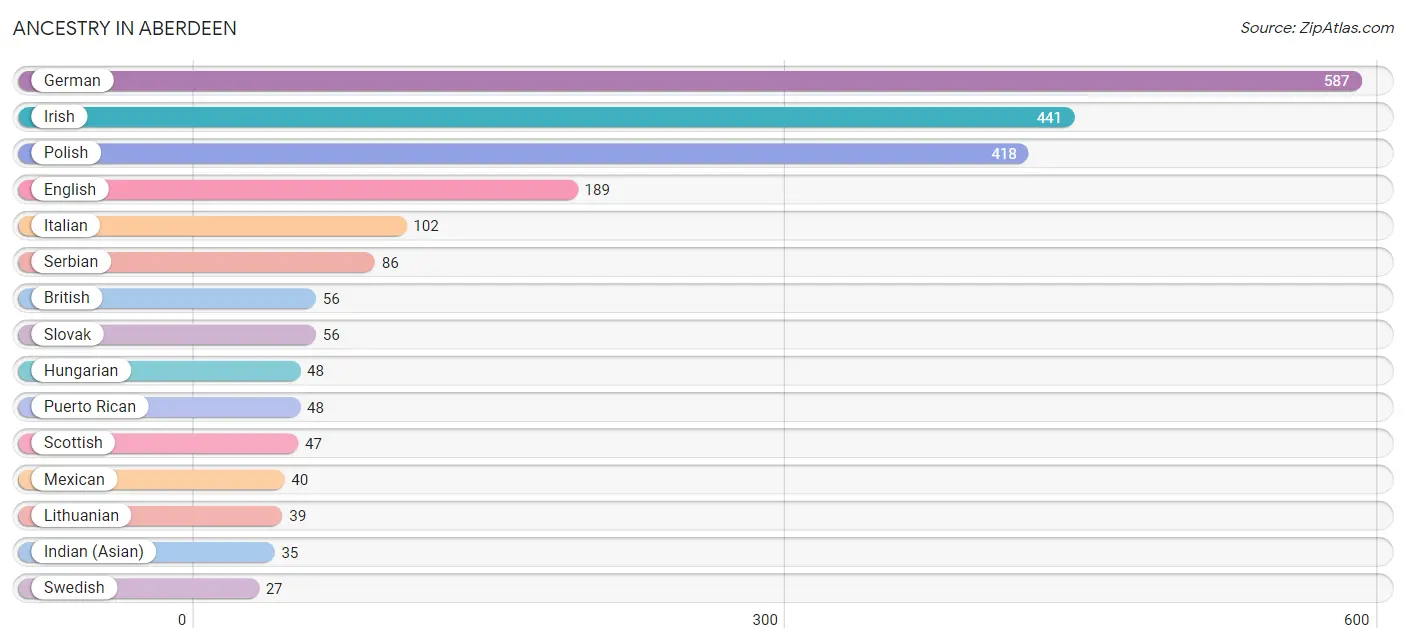
Ancestry in Aberdeen
The most populous ancestries reported in Aberdeen are German (587 | 33.4%), Irish (441 | 25.1%), Polish (418 | 23.8%), English (189 | 10.8%), and Italian (102 | 5.8%), together accounting for 98.9% of all Aberdeen residents.
| Ancestry | # Population | % Population |
| Belgian | 16 | 0.9% |
| British | 56 | 3.2% |
| Czech | 19 | 1.1% |
| Dutch | 19 | 1.1% |
| English | 189 | 10.8% |
| French | 18 | 1.0% |
| German | 587 | 33.4% |
| Greek | 9 | 0.5% |
| Hungarian | 48 | 2.7% |
| Indian (Asian) | 35 | 2.0% |
| Irish | 441 | 25.1% |
| Italian | 102 | 5.8% |
| Lithuanian | 39 | 2.2% |
| Mexican | 40 | 2.3% |
| Norwegian | 15 | 0.9% |
| Polish | 418 | 23.8% |
| Puerto Rican | 48 | 2.7% |
| Scotch-Irish | 9 | 0.5% |
| Scottish | 47 | 2.7% |
| Serbian | 86 | 4.9% |
| Slovak | 56 | 3.2% |
| Slovene | 16 | 0.9% |
| Spanish | 23 | 1.3% |
| Swedish | 27 | 1.5% | View All 24 Rows |
Immigrants in Aberdeen
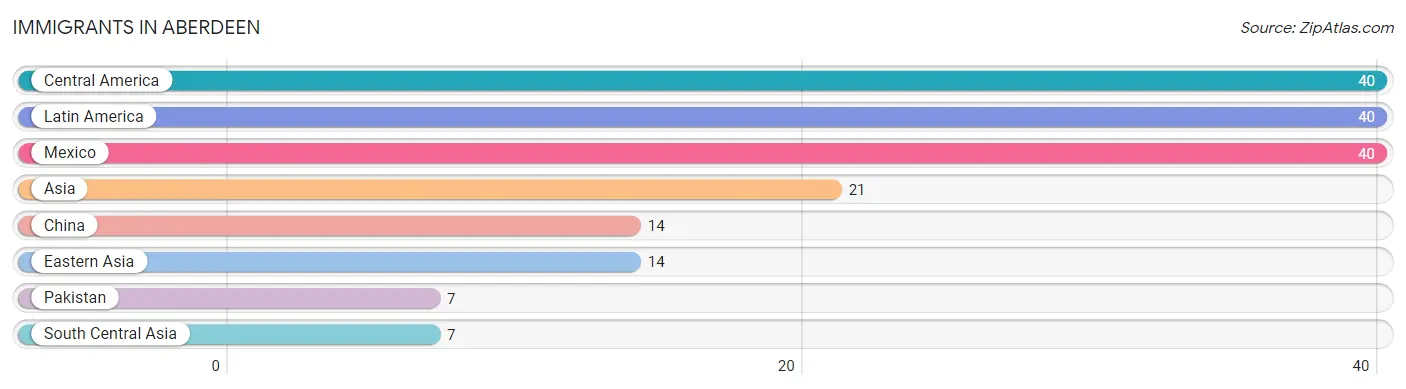
The most numerous immigrant groups reported in Aberdeen came from Central America (40 | 2.3%), Latin America (40 | 2.3%), Mexico (40 | 2.3%), Asia (21 | 1.2%), and China (14 | 0.8%), together accounting for 8.8% of all Aberdeen residents.
| Immigration Origin | # Population | % Population |
| Asia | 21 | 1.2% |
| Central America | 40 | 2.3% |
| China | 14 | 0.8% |
| Eastern Asia | 14 | 0.8% |
| Latin America | 40 | 2.3% |
| Mexico | 40 | 2.3% |
| Pakistan | 7 | 0.4% |
| South Central Asia | 7 | 0.4% | View All 8 Rows |
Sex and Age in Aberdeen
Sex and Age in Aberdeen
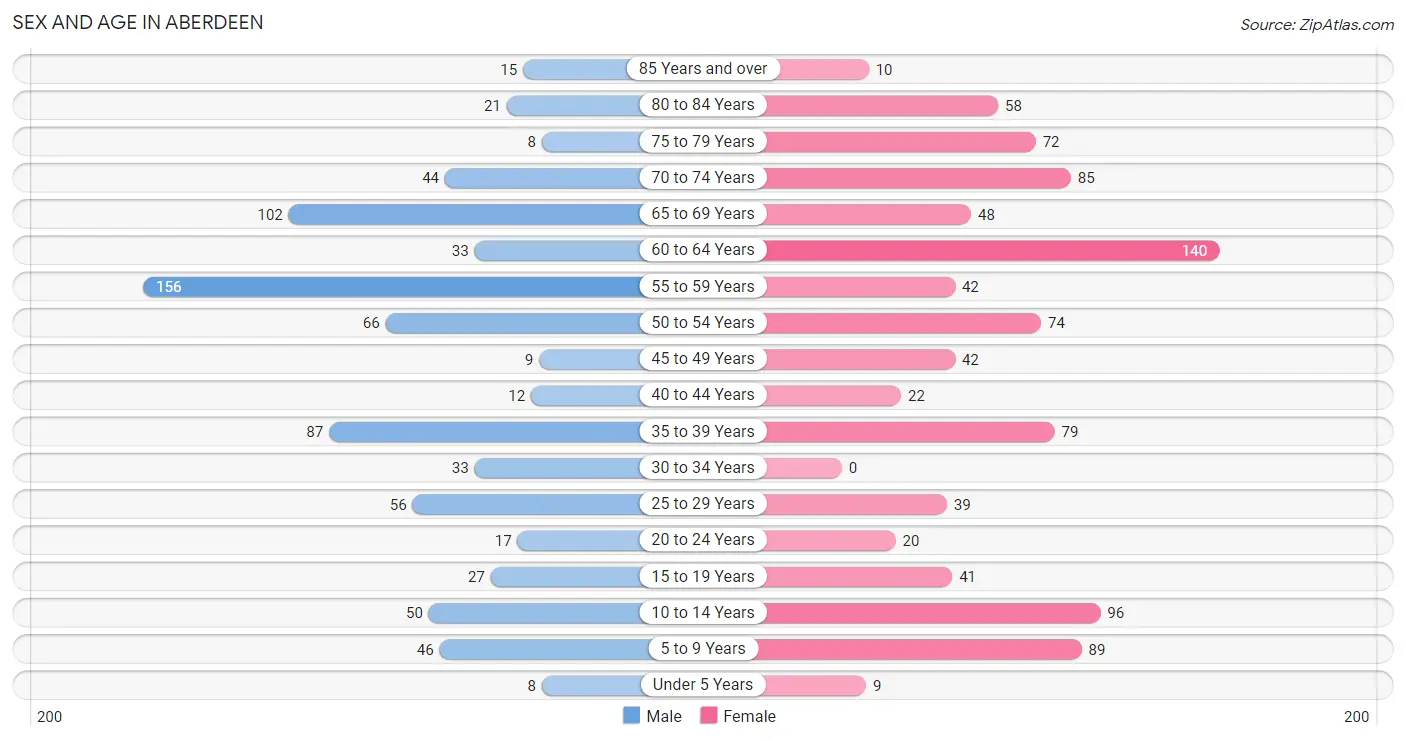
The most populous age groups in Aberdeen are 55 to 59 Years (156 | 19.8%) for men and 60 to 64 Years (140 | 14.5%) for women.
| Age Bracket | Male | Female |
| Under 5 Years | 8 (1.0%) | 9 (0.9%) |
| 5 to 9 Years | 46 (5.8%) | 89 (9.2%) |
| 10 to 14 Years | 50 (6.3%) | 96 (9.9%) |
| 15 to 19 Years | 27 (3.4%) | 41 (4.2%) |
| 20 to 24 Years | 17 (2.1%) | 20 (2.1%) |
| 25 to 29 Years | 56 (7.1%) | 39 (4.0%) |
| 30 to 34 Years | 33 (4.2%) | 0 (0.0%) |
| 35 to 39 Years | 87 (11.0%) | 79 (8.2%) |
| 40 to 44 Years | 12 (1.5%) | 22 (2.3%) |
| 45 to 49 Years | 9 (1.1%) | 42 (4.3%) |
| 50 to 54 Years | 66 (8.4%) | 74 (7.7%) |
| 55 to 59 Years | 156 (19.8%) | 42 (4.3%) |
| 60 to 64 Years | 33 (4.2%) | 140 (14.5%) |
| 65 to 69 Years | 102 (12.9%) | 48 (5.0%) |
| 70 to 74 Years | 44 (5.6%) | 85 (8.8%) |
| 75 to 79 Years | 8 (1.0%) | 72 (7.4%) |
| 80 to 84 Years | 21 (2.7%) | 58 (6.0%) |
| 85 Years and over | 15 (1.9%) | 10 (1.0%) |
| Total | 790 (100.0%) | 966 (100.0%) |
Families and Households in Aberdeen
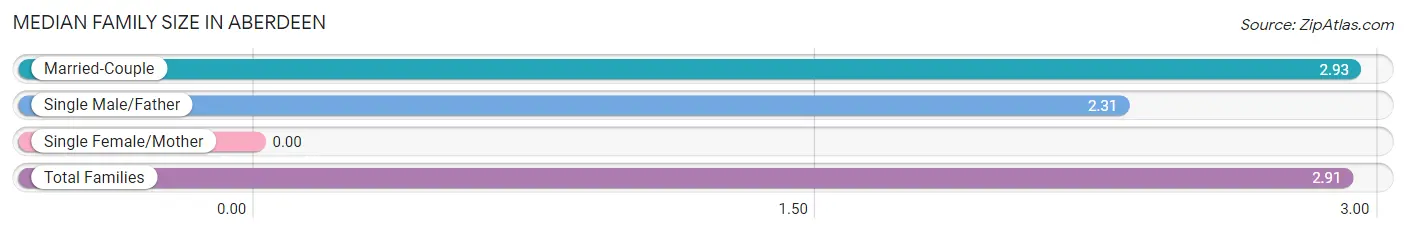
Median Family Size in Aberdeen
| Family Type | # Families | Family Size |
| Married-Couple | 472 (97.3%) | 2.93 |
| Single Male/Father | 13 (2.7%) | 2.31 |
| Single Female/Mother | 0 (0.0%) | - |
| Total Families | 485 (100.0%) | 2.91 |
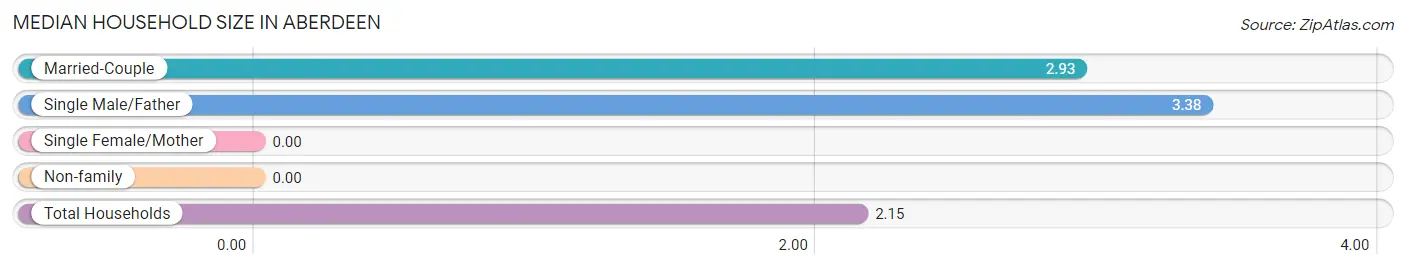
Median Household Size in Aberdeen
| Household Type | # Households | Household Size |
| Married-Couple | 472 (57.9%) | 2.93 |
| Single Male/Father | 13 (1.6%) | 3.38 |
| Single Female/Mother | 0 (0.0%) | - |
| Non-family | 330 (40.5%) | - |
| Total Households | 815 (100.0%) | 2.15 |
Household Size by Marriage Status in Aberdeen
Out of a total of 815 households in Aberdeen, 485 (59.5%) are family households, while 330 (40.5%) are nonfamily households. The most numerous type of family households are 2-person households, comprising 250, and the most common type of nonfamily households are 1-person households, comprising 330.
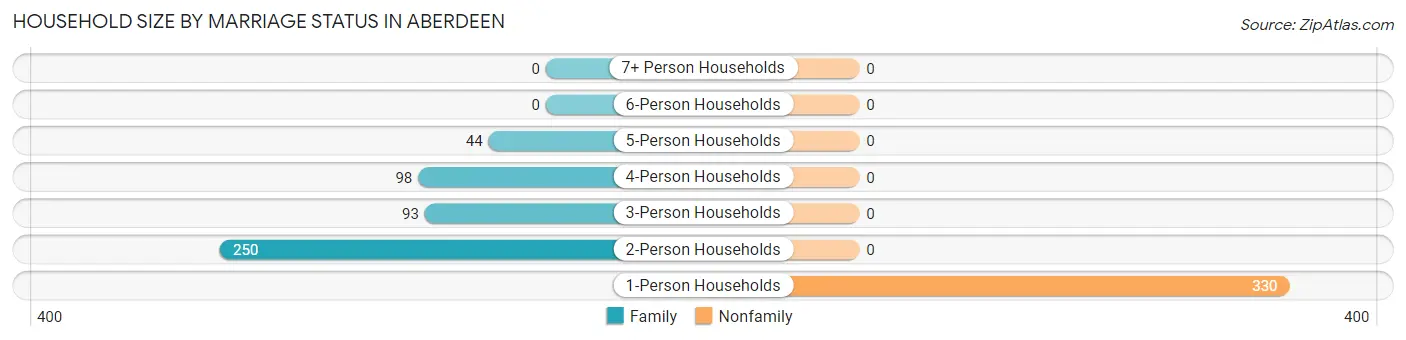
| Household Size | Family Households | Nonfamily Households |
| 1-Person Households | - | 330 (40.5%) |
| 2-Person Households | 250 (30.7%) | 0 (0.0%) |
| 3-Person Households | 93 (11.4%) | 0 (0.0%) |
| 4-Person Households | 98 (12.0%) | 0 (0.0%) |
| 5-Person Households | 44 (5.4%) | 0 (0.0%) |
| 6-Person Households | 0 (0.0%) | 0 (0.0%) |
| 7+ Person Households | 0 (0.0%) | 0 (0.0%) |
| Total | 485 (59.5%) | 330 (40.5%) |
Female Fertility in Aberdeen
Fertility by Age in Aberdeen
Average fertility rate in Aberdeen is 30.0 births per 1,000 women. Women in the age bracket of 35 to 50 years have the highest fertility rate with 49.0 births per 1,000 women. Women in the age bracket of 35 to 50 years acount for 100.0% of all women with births.
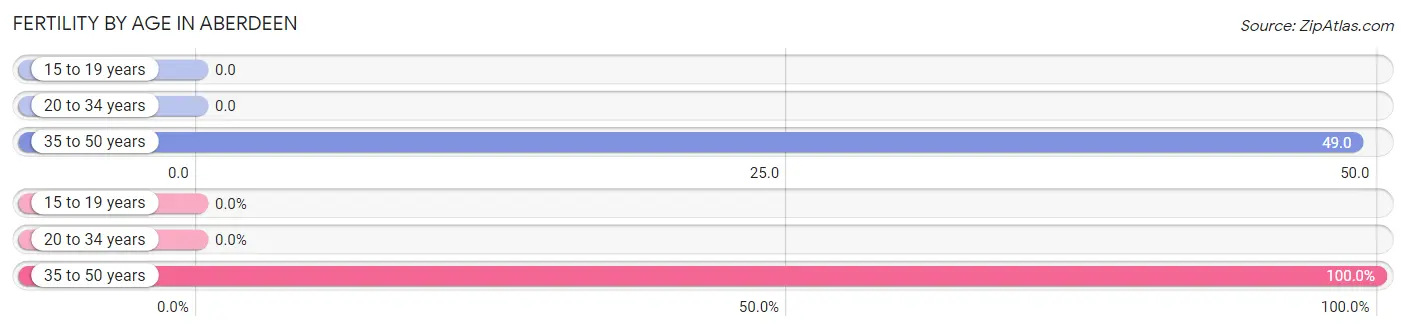
| Age Bracket | Women with Births | Births / 1,000 Women |
| 15 to 19 years | 0 (0.0%) | 0.0 |
| 20 to 34 years | 0 (0.0%) | 0.0 |
| 35 to 50 years | 8 (100.0%) | 49.0 |
| Total | 8 (100.0%) | 30.0 |
Fertility by Age by Marriage Status in Aberdeen
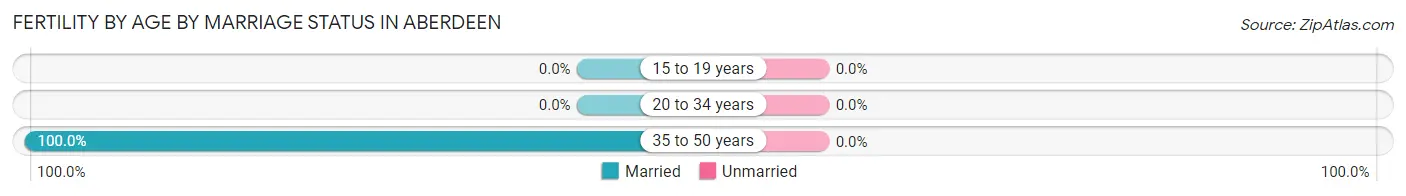
| Age Bracket | Married | Unmarried |
| 15 to 19 years | 0 (0.0%) | 0 (0.0%) |
| 20 to 34 years | 0 (0.0%) | 0 (0.0%) |
| 35 to 50 years | 8 (100.0%) | 0 (0.0%) |
| Total | 8 (100.0%) | 0 (0.0%) |
Fertility by Education in Aberdeen
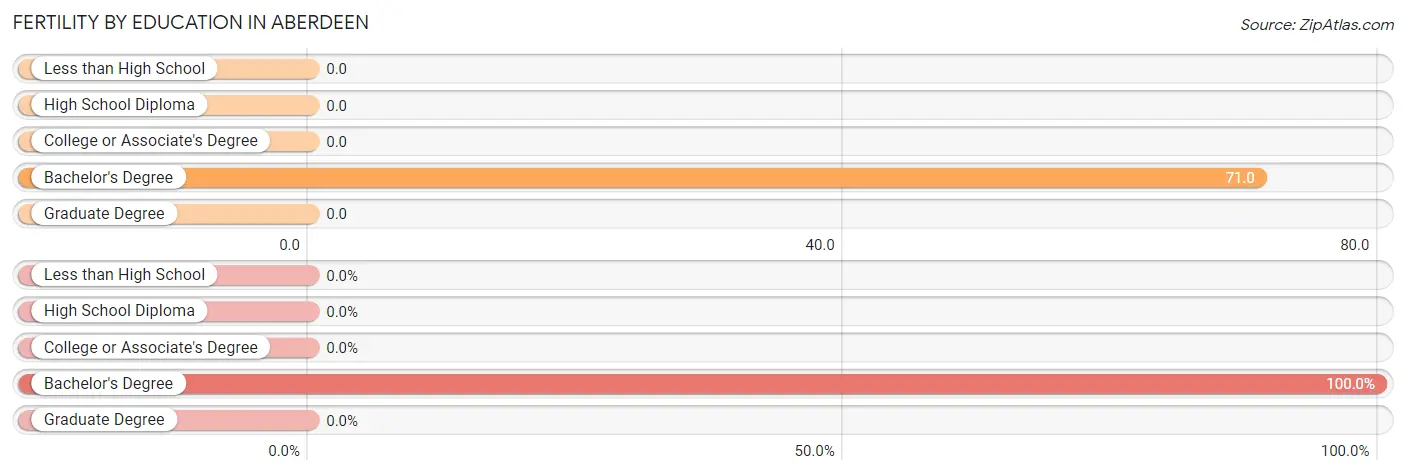
| Educational Attainment | Women with Births | Births / 1,000 Women |
| Less than High School | 0 (0.0%) | 0.0 |
| High School Diploma | 0 (0.0%) | 0.0 |
| College or Associate's Degree | 0 (0.0%) | 0.0 |
| Bachelor's Degree | 8 (100.0%) | 71.0 |
| Graduate Degree | 0 (0.0%) | 0.0 |
| Total | 8 (100.0%) | 30.0 |
Fertility by Education by Marriage Status in Aberdeen
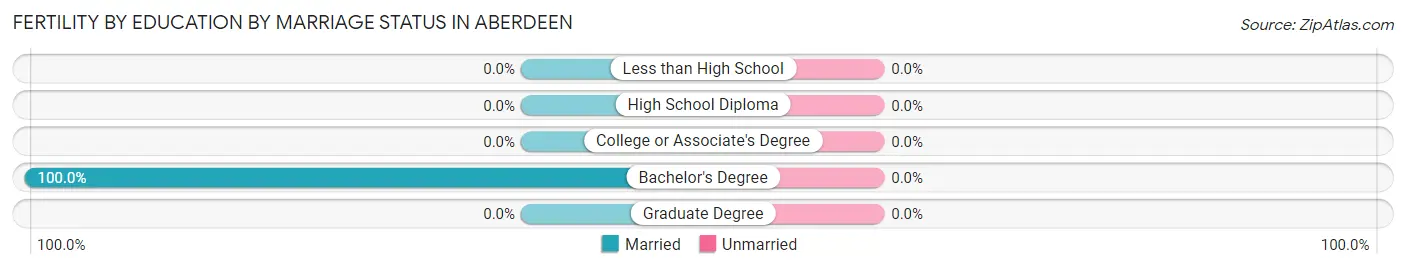
| Educational Attainment | Married | Unmarried |
| Less than High School | 0 (0.0%) | 0 (0.0%) |
| High School Diploma | 0 (0.0%) | 0 (0.0%) |
| College or Associate's Degree | 0 (0.0%) | 0 (0.0%) |
| Bachelor's Degree | 8 (100.0%) | 0 (0.0%) |
| Graduate Degree | 0 (0.0%) | 0 (0.0%) |
| Total | 8 (100.0%) | 0 (0.0%) |
Employment Characteristics in Aberdeen
Employment by Class of Employer in Aberdeen
Among the 956 employed individuals in Aberdeen, private company employees (805 | 84.2%), not-for-profit organizations (92 | 9.6%), and self-employed (incorporated) (30 | 3.1%) make up the most common classes of employment.
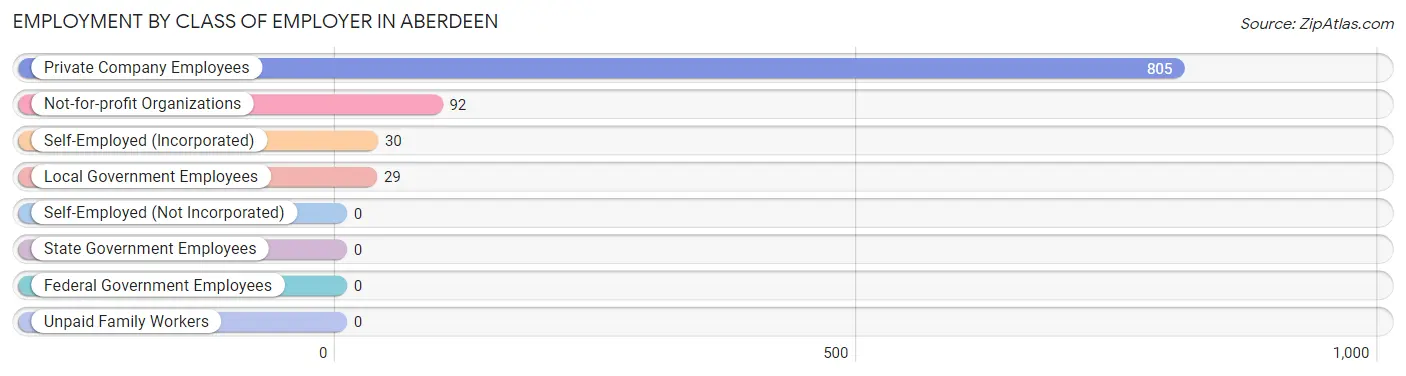
| Employer Class | # Employees | % Employees |
| Private Company Employees | 805 | 84.2% |
| Self-Employed (Incorporated) | 30 | 3.1% |
| Self-Employed (Not Incorporated) | 0 | 0.0% |
| Not-for-profit Organizations | 92 | 9.6% |
| Local Government Employees | 29 | 3.0% |
| State Government Employees | 0 | 0.0% |
| Federal Government Employees | 0 | 0.0% |
| Unpaid Family Workers | 0 | 0.0% |
| Total | 956 | 100.0% |
Employment Status by Age in Aberdeen
According to the labor force statistics for Aberdeen, out of the total population over 16 years of age (1,458), 66.7% or 972 individuals are in the labor force, with 1.6% or 16 of them unemployed. The age group with the highest labor force participation rate is 20 to 24 years, with 100.0% or 37 individuals in the labor force. Within the labor force, the 60 to 64 years age range has the highest percentage of unemployed individuals, with 11.0% or 16 of them being unemployed.
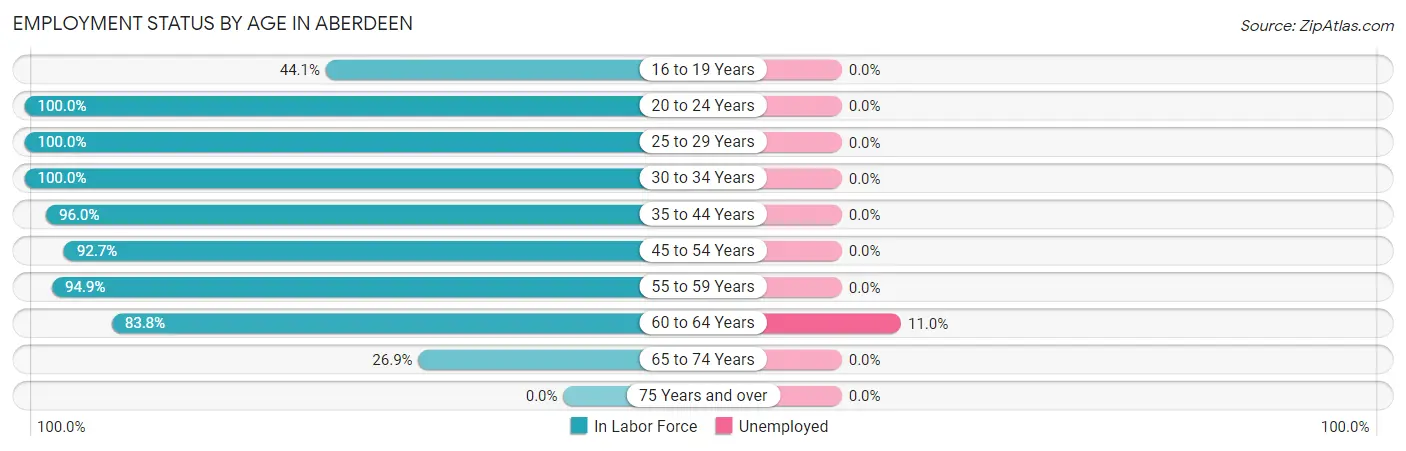
| Age Bracket | In Labor Force | Unemployed |
| 16 to 19 Years | 30 (44.1%) | 0 (0.0%) |
| 20 to 24 Years | 37 (100.0%) | 0 (0.0%) |
| 25 to 29 Years | 95 (100.0%) | 0 (0.0%) |
| 30 to 34 Years | 33 (100.0%) | 0 (0.0%) |
| 35 to 44 Years | 192 (96.0%) | 0 (0.0%) |
| 45 to 54 Years | 177 (92.7%) | 0 (0.0%) |
| 55 to 59 Years | 188 (94.9%) | 0 (0.0%) |
| 60 to 64 Years | 145 (83.8%) | 16 (11.0%) |
| 65 to 74 Years | 75 (26.9%) | 0 (0.0%) |
| 75 Years and over | 0 (0.0%) | 0 (0.0%) |
| Total | 972 (66.7%) | 16 (1.6%) |
Employment Status by Educational Attainment in Aberdeen
According to labor force statistics for Aberdeen, 93.3% of individuals (830) out of the total population between 25 and 64 years of age (890) are in the labor force, with 1.9% or 16 of them being unemployed. The group with the highest labor force participation rate are those with the educational attainment of bachelor's degree or higher, with 98.1% or 567 individuals in the labor force. Within the labor force, individuals with bachelor's degree or higher education have the highest percentage of unemployment, with 2.8% or 16 of them being unemployed.
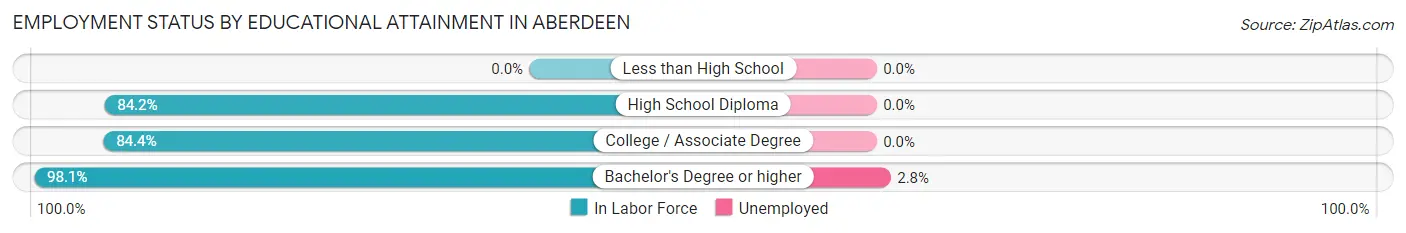
| Educational Attainment | In Labor Force | Unemployed |
| Less than High School | 0 (0.0%) | 0 (0.0%) |
| High School Diploma | 187 (84.2%) | 0 (0.0%) |
| College / Associate Degree | 76 (84.4%) | 0 (0.0%) |
| Bachelor's Degree or higher | 567 (98.1%) | 16 (2.8%) |
| Total | 830 (93.3%) | 17 (1.9%) |
Employment Occupations by Sex in Aberdeen
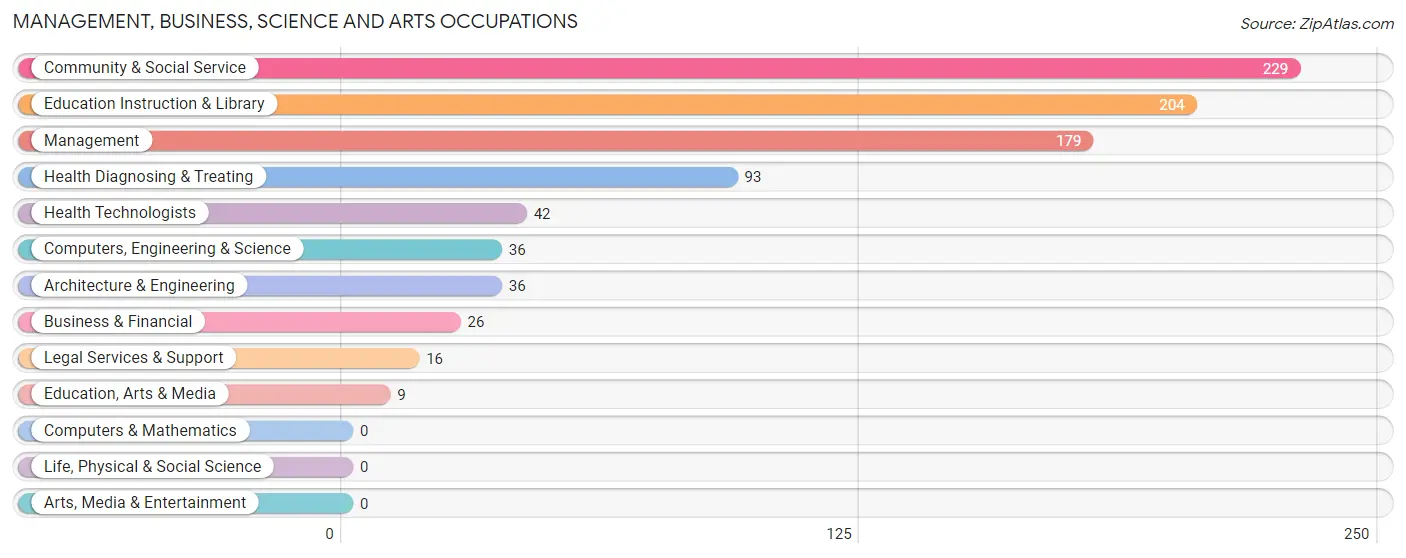
Management, Business, Science and Arts Occupations
The most common Management, Business, Science and Arts occupations in Aberdeen are Community & Social Service (229 | 23.9%), Education Instruction & Library (204 | 21.3%), Management (179 | 18.7%), Health Diagnosing & Treating (93 | 9.7%), and Health Technologists (42 | 4.4%).
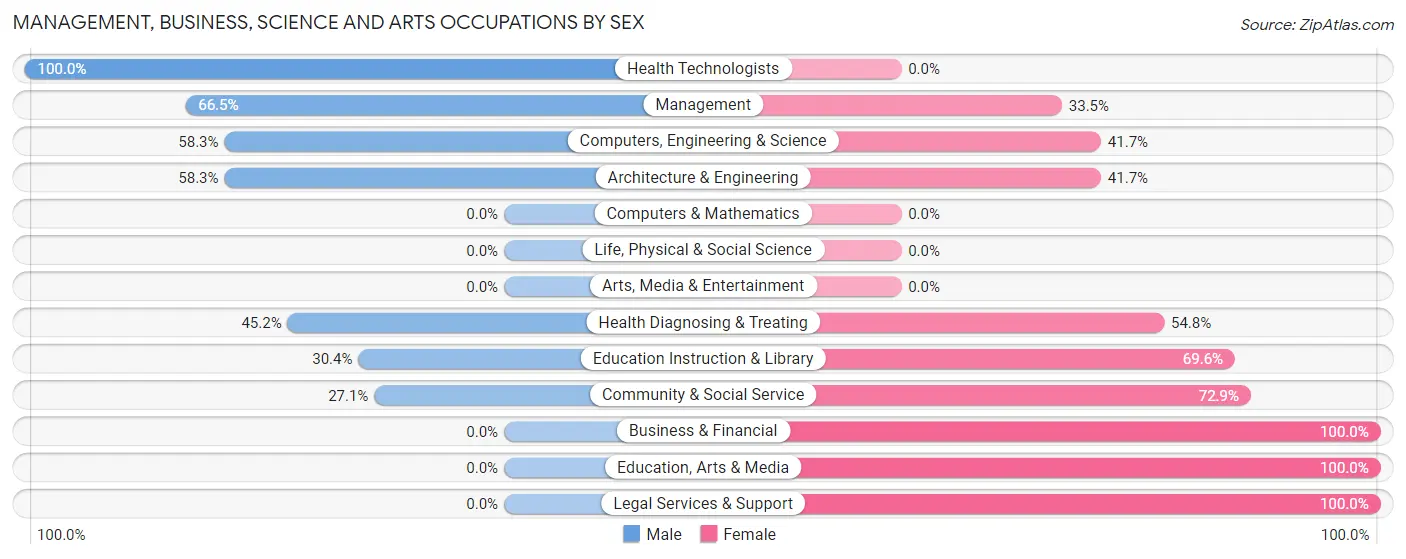
Management, Business, Science and Arts Occupations by Sex
Within the Management, Business, Science and Arts occupations in Aberdeen, the most male-oriented occupations are Health Technologists (100.0%), Management (66.5%), and Computers, Engineering & Science (58.3%), while the most female-oriented occupations are Business & Financial (100.0%), Education, Arts & Media (100.0%), and Legal Services & Support (100.0%).
| Occupation | Male | Female |
| Management | 119 (66.5%) | 60 (33.5%) |
| Business & Financial | 0 (0.0%) | 26 (100.0%) |
| Computers, Engineering & Science | 21 (58.3%) | 15 (41.7%) |
| Computers & Mathematics | 0 (0.0%) | 0 (0.0%) |
| Architecture & Engineering | 21 (58.3%) | 15 (41.7%) |
| Life, Physical & Social Science | 0 (0.0%) | 0 (0.0%) |
| Community & Social Service | 62 (27.1%) | 167 (72.9%) |
| Education, Arts & Media | 0 (0.0%) | 9 (100.0%) |
| Legal Services & Support | 0 (0.0%) | 16 (100.0%) |
| Education Instruction & Library | 62 (30.4%) | 142 (69.6%) |
| Arts, Media & Entertainment | 0 (0.0%) | 0 (0.0%) |
| Health Diagnosing & Treating | 42 (45.2%) | 51 (54.8%) |
| Health Technologists | 42 (100.0%) | 0 (0.0%) |
| Total (Category) | 244 (43.3%) | 319 (56.7%) |
| Total (Overall) | 498 (52.1%) | 458 (47.9%) |
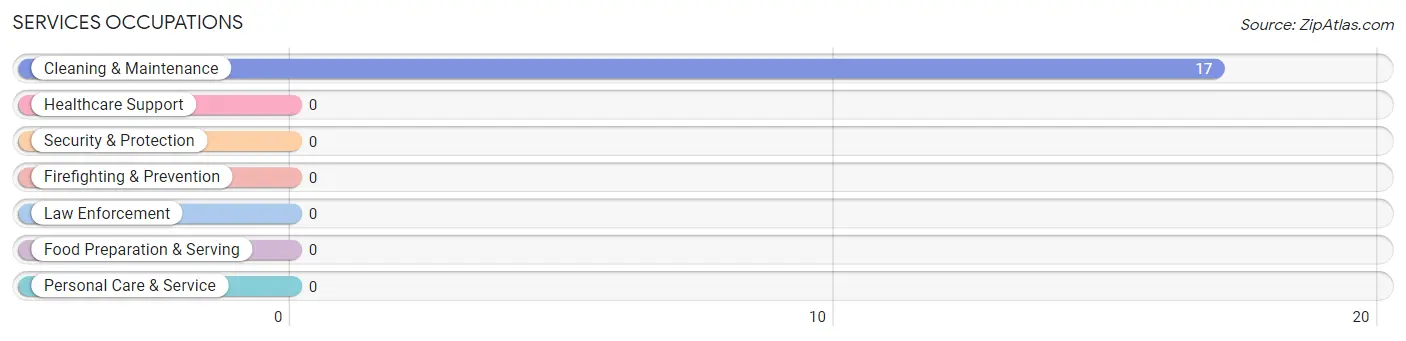
Services Occupations
The most common Services occupations in Aberdeen are , and Cleaning & Maintenance (17 | 1.8%).
Services Occupations by Sex
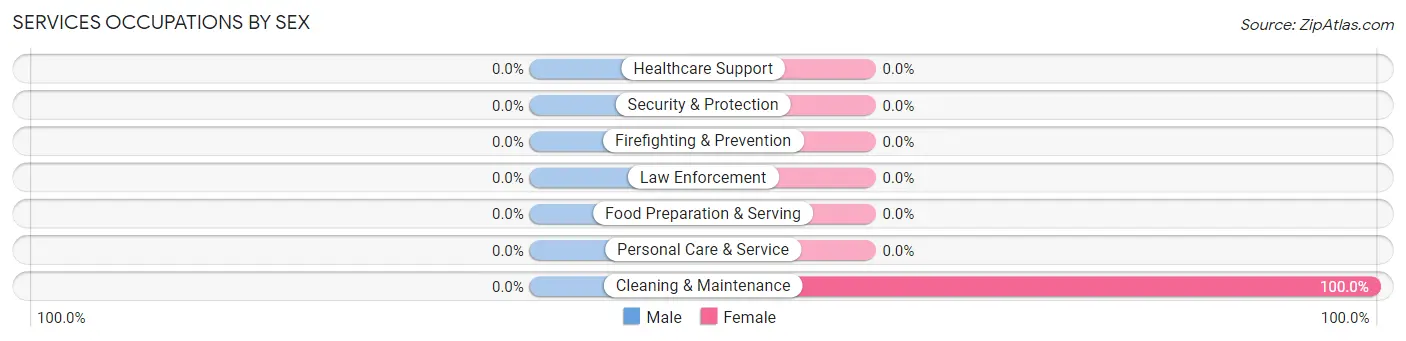
| Occupation | Male | Female |
| Healthcare Support | 0 (0.0%) | 0 (0.0%) |
| Security & Protection | 0 (0.0%) | 0 (0.0%) |
| Firefighting & Prevention | 0 (0.0%) | 0 (0.0%) |
| Law Enforcement | 0 (0.0%) | 0 (0.0%) |
| Food Preparation & Serving | 0 (0.0%) | 0 (0.0%) |
| Cleaning & Maintenance | 0 (0.0%) | 17 (100.0%) |
| Personal Care & Service | 0 (0.0%) | 0 (0.0%) |
| Total (Category) | 0 (0.0%) | 17 (100.0%) |
| Total (Overall) | 498 (52.1%) | 458 (47.9%) |
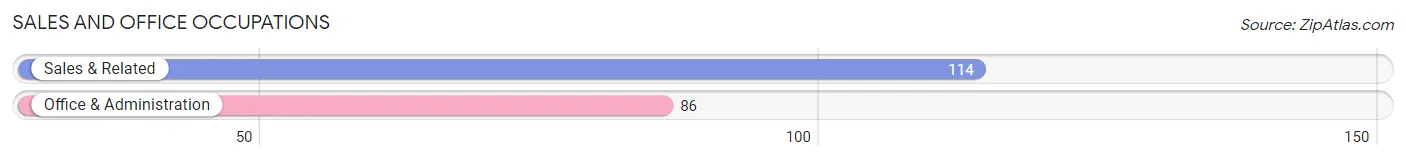
Sales and Office Occupations
The most common Sales and Office occupations in Aberdeen are Sales & Related (114 | 11.9%), and Office & Administration (86 | 9.0%).
Sales and Office Occupations by Sex
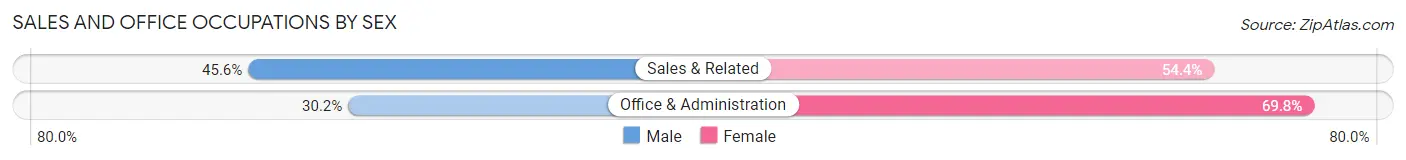
| Occupation | Male | Female |
| Sales & Related | 52 (45.6%) | 62 (54.4%) |
| Office & Administration | 26 (30.2%) | 60 (69.8%) |
| Total (Category) | 78 (39.0%) | 122 (61.0%) |
| Total (Overall) | 498 (52.1%) | 458 (47.9%) |
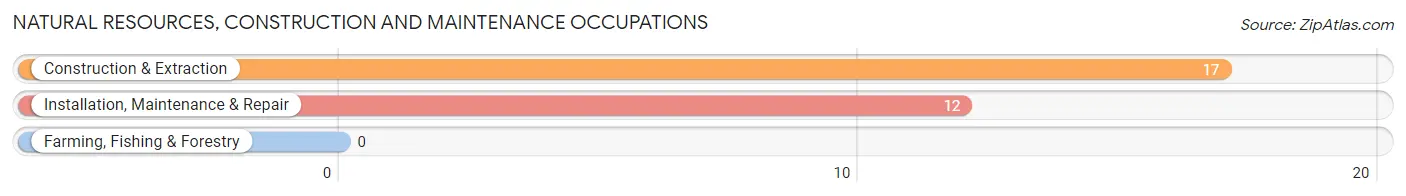
Natural Resources, Construction and Maintenance Occupations
The most common Natural Resources, Construction and Maintenance occupations in Aberdeen are Construction & Extraction (17 | 1.8%), and Installation, Maintenance & Repair (12 | 1.3%).
Natural Resources, Construction and Maintenance Occupations by Sex
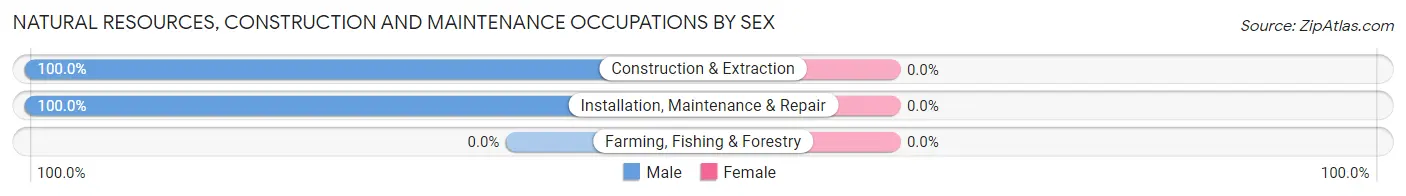
| Occupation | Male | Female |
| Farming, Fishing & Forestry | 0 (0.0%) | 0 (0.0%) |
| Construction & Extraction | 17 (100.0%) | 0 (0.0%) |
| Installation, Maintenance & Repair | 12 (100.0%) | 0 (0.0%) |
| Total (Category) | 29 (100.0%) | 0 (0.0%) |
| Total (Overall) | 498 (52.1%) | 458 (47.9%) |
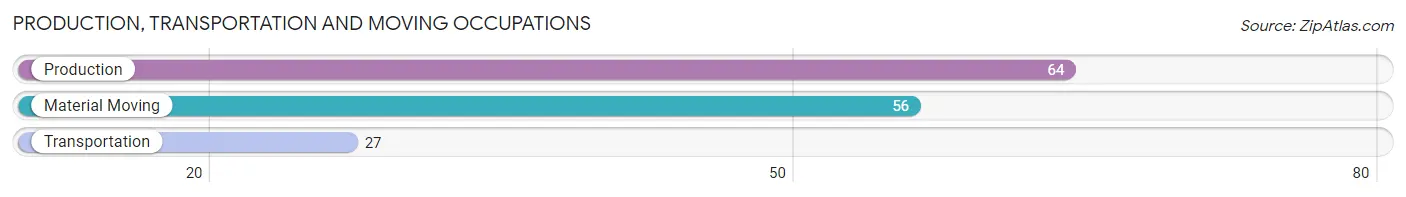
Production, Transportation and Moving Occupations
The most common Production, Transportation and Moving occupations in Aberdeen are Production (64 | 6.7%), Material Moving (56 | 5.9%), and Transportation (27 | 2.8%).
Production, Transportation and Moving Occupations by Sex
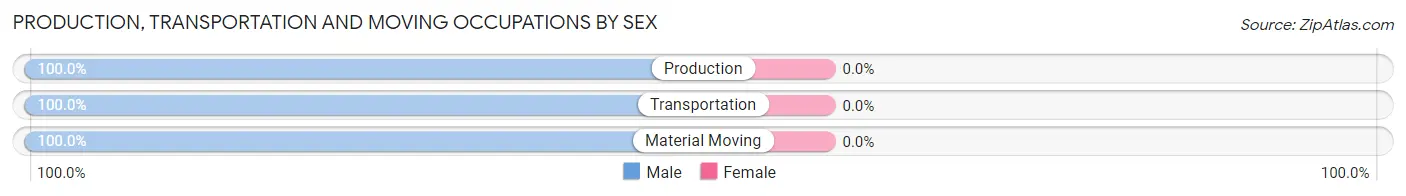
| Occupation | Male | Female |
| Production | 64 (100.0%) | 0 (0.0%) |
| Transportation | 27 (100.0%) | 0 (0.0%) |
| Material Moving | 56 (100.0%) | 0 (0.0%) |
| Total (Category) | 147 (100.0%) | 0 (0.0%) |
| Total (Overall) | 498 (52.1%) | 458 (47.9%) |
Employment Industries by Sex in Aberdeen
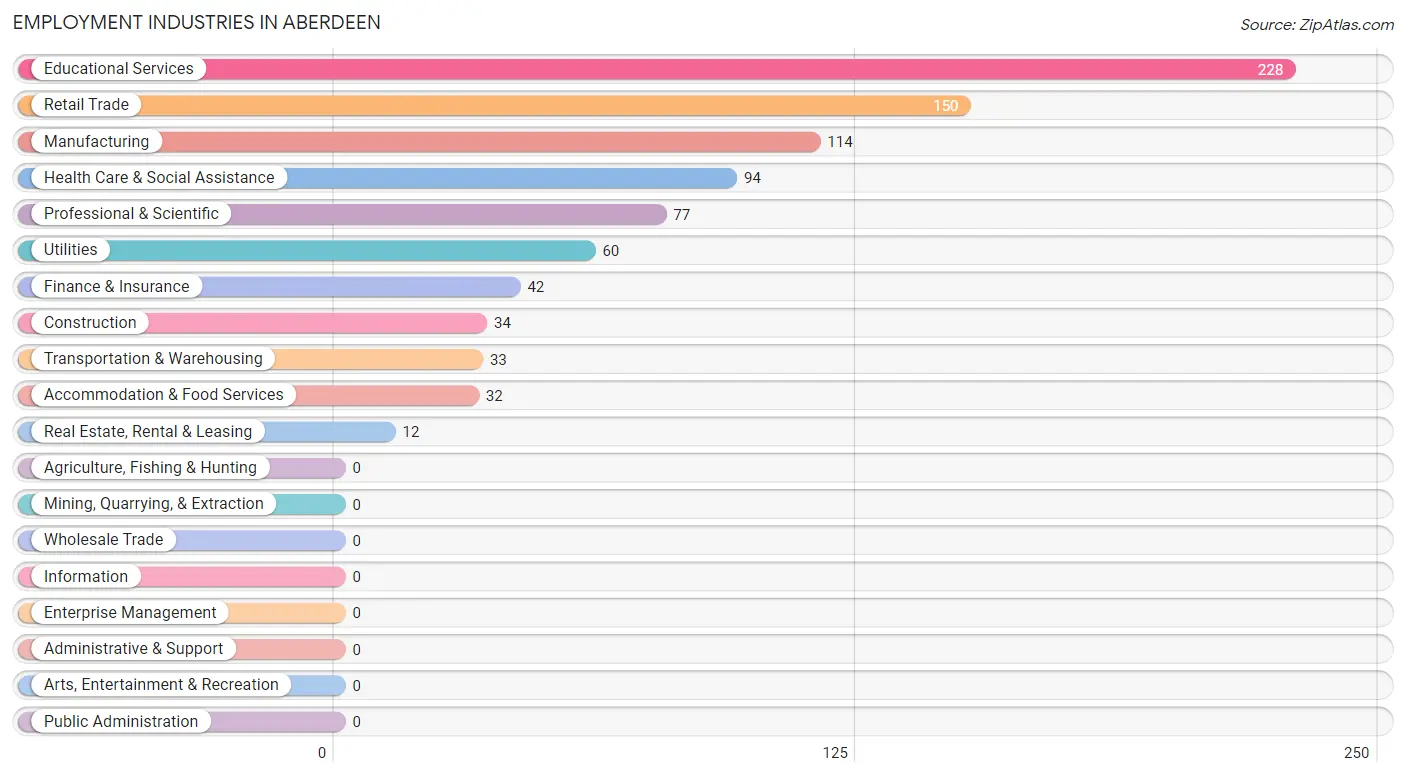
Employment Industries in Aberdeen
The major employment industries in Aberdeen include Educational Services (228 | 23.8%), Retail Trade (150 | 15.7%), Manufacturing (114 | 11.9%), Health Care & Social Assistance (94 | 9.8%), and Professional & Scientific (77 | 8.1%).
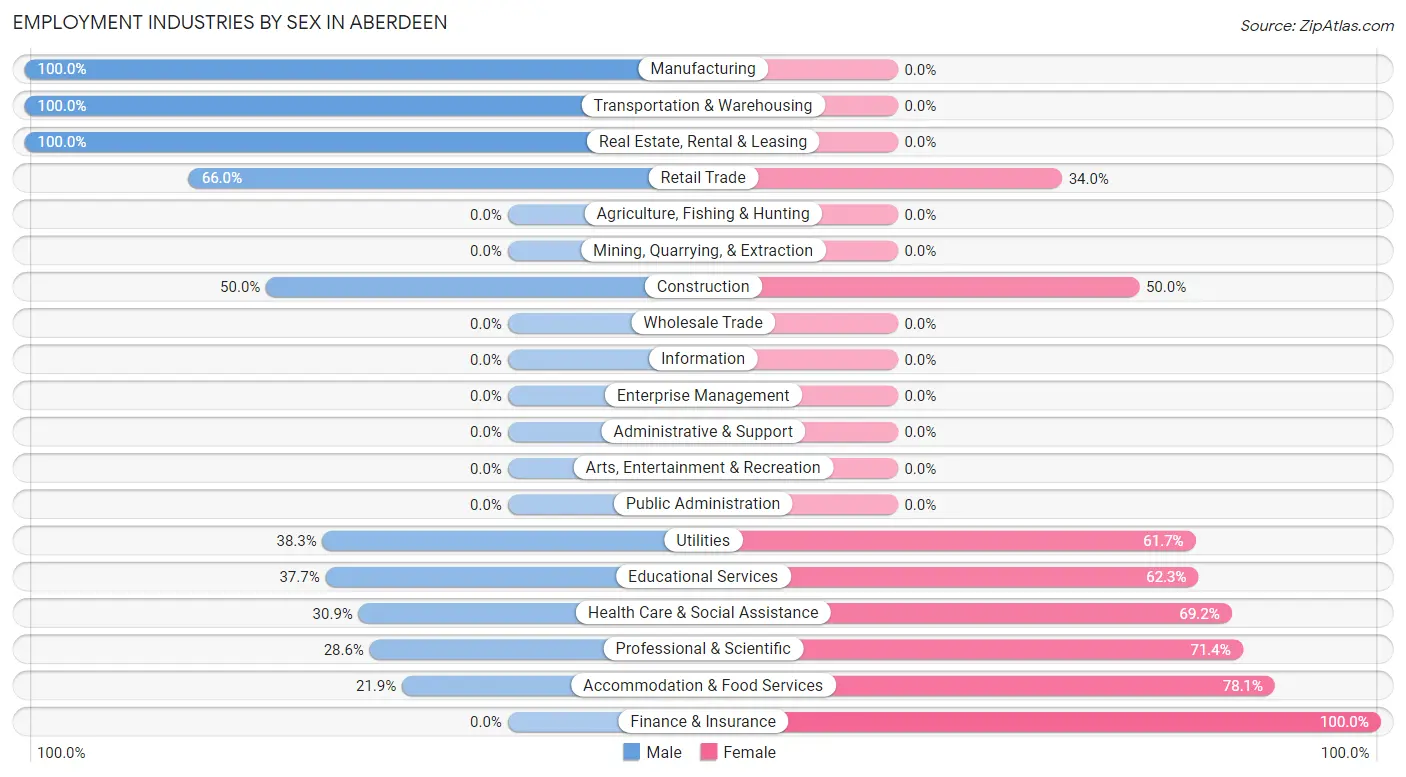
Employment Industries by Sex in Aberdeen
The Aberdeen industries that see more men than women are Manufacturing (100.0%), Transportation & Warehousing (100.0%), and Real Estate, Rental & Leasing (100.0%), whereas the industries that tend to have a higher number of women are Finance & Insurance (100.0%), Accommodation & Food Services (78.1%), and Professional & Scientific (71.4%).
| Industry | Male | Female |
| Agriculture, Fishing & Hunting | 0 (0.0%) | 0 (0.0%) |
| Mining, Quarrying, & Extraction | 0 (0.0%) | 0 (0.0%) |
| Construction | 17 (50.0%) | 17 (50.0%) |
| Manufacturing | 114 (100.0%) | 0 (0.0%) |
| Wholesale Trade | 0 (0.0%) | 0 (0.0%) |
| Retail Trade | 99 (66.0%) | 51 (34.0%) |
| Transportation & Warehousing | 33 (100.0%) | 0 (0.0%) |
| Utilities | 23 (38.3%) | 37 (61.7%) |
| Information | 0 (0.0%) | 0 (0.0%) |
| Finance & Insurance | 0 (0.0%) | 42 (100.0%) |
| Real Estate, Rental & Leasing | 12 (100.0%) | 0 (0.0%) |
| Professional & Scientific | 22 (28.6%) | 55 (71.4%) |
| Enterprise Management | 0 (0.0%) | 0 (0.0%) |
| Administrative & Support | 0 (0.0%) | 0 (0.0%) |
| Educational Services | 86 (37.7%) | 142 (62.3%) |
| Health Care & Social Assistance | 29 (30.8%) | 65 (69.2%) |
| Arts, Entertainment & Recreation | 0 (0.0%) | 0 (0.0%) |
| Accommodation & Food Services | 7 (21.9%) | 25 (78.1%) |
| Public Administration | 0 (0.0%) | 0 (0.0%) |
| Total | 498 (52.1%) | 458 (47.9%) |
Education in Aberdeen
School Enrollment in Aberdeen
The most common levels of schooling among the 383 students in Aberdeen are middle school (110 | 28.7%), elementary school (80 | 20.9%), and kindergarten (68 | 17.7%).
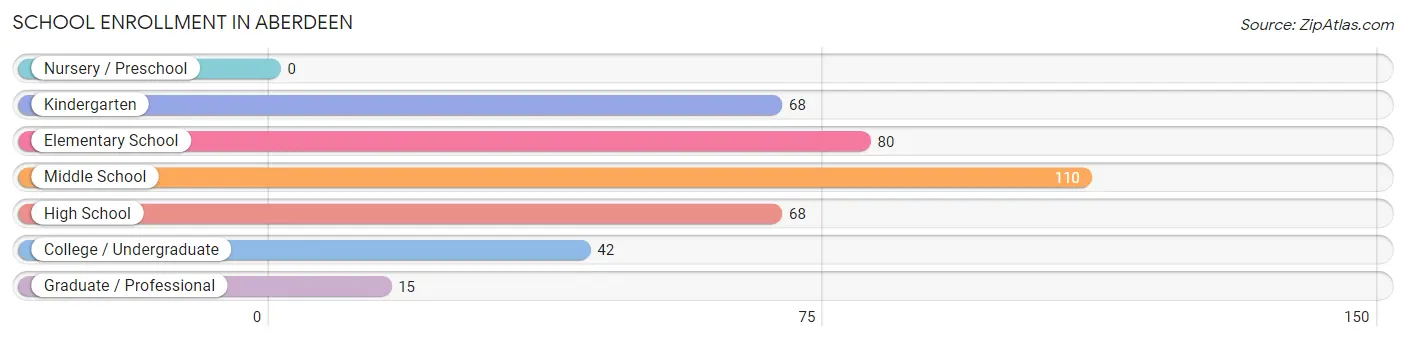
| School Level | # Students | % Students |
| Nursery / Preschool | 0 | 0.0% |
| Kindergarten | 68 | 17.7% |
| Elementary School | 80 | 20.9% |
| Middle School | 110 | 28.7% |
| High School | 68 | 17.7% |
| College / Undergraduate | 42 | 11.0% |
| Graduate / Professional | 15 | 3.9% |
| Total | 383 | 100.0% |
School Enrollment by Age by Funding Source in Aberdeen
Out of a total of 383 students who are enrolled in schools in Aberdeen, 144 (37.6%) attend a private institution, while the remaining 239 (62.4%) are enrolled in public schools. The age group of 20 to 24 year olds has the highest likelihood of being enrolled in private schools, with 20 (100.0% in the age bracket) enrolled. Conversely, the age group of 15 to 17 year olds has the lowest likelihood of being enrolled in a private school, with 68 (100.0% in the age bracket) attending a public institution.
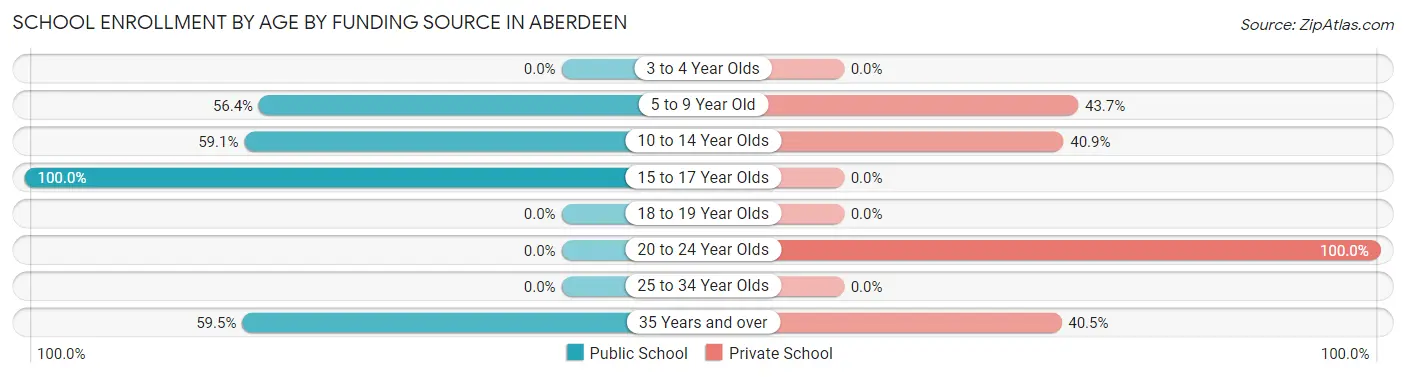
| Age Bracket | Public School | Private School |
| 3 to 4 Year Olds | 0 (0.0%) | 0 (0.0%) |
| 5 to 9 Year Old | 71 (56.4%) | 55 (43.6%) |
| 10 to 14 Year Olds | 78 (59.1%) | 54 (40.9%) |
| 15 to 17 Year Olds | 68 (100.0%) | 0 (0.0%) |
| 18 to 19 Year Olds | 0 (0.0%) | 0 (0.0%) |
| 20 to 24 Year Olds | 0 (0.0%) | 20 (100.0%) |
| 25 to 34 Year Olds | 0 (0.0%) | 0 (0.0%) |
| 35 Years and over | 22 (59.5%) | 15 (40.5%) |
| Total | 239 (62.4%) | 144 (37.6%) |
Educational Attainment by Field of Study in Aberdeen
Business (216 | 27.1%), education (131 | 16.4%), engineering (77 | 9.7%), science & technology (60 | 7.5%), and psychology (56 | 7.0%) are the most common fields of study among 797 individuals in Aberdeen who have obtained a bachelor's degree or higher.
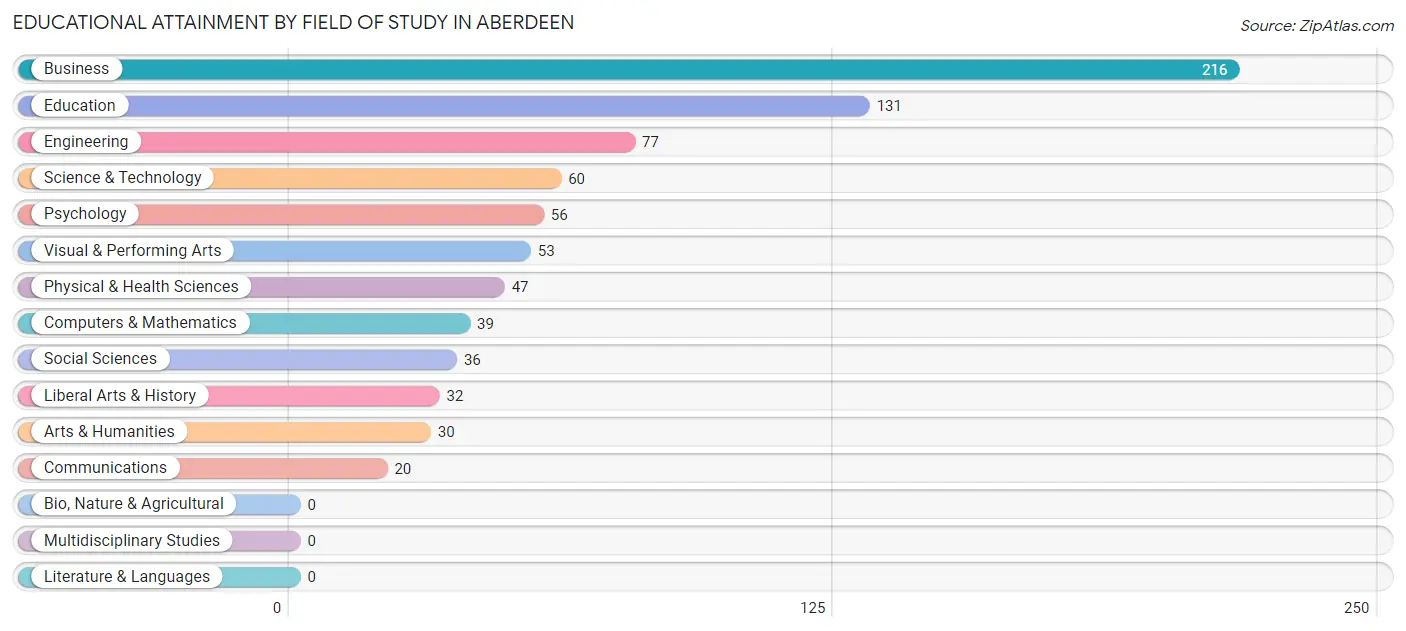
| Field of Study | # Graduates | % Graduates |
| Computers & Mathematics | 39 | 4.9% |
| Bio, Nature & Agricultural | 0 | 0.0% |
| Physical & Health Sciences | 47 | 5.9% |
| Psychology | 56 | 7.0% |
| Social Sciences | 36 | 4.5% |
| Engineering | 77 | 9.7% |
| Multidisciplinary Studies | 0 | 0.0% |
| Science & Technology | 60 | 7.5% |
| Business | 216 | 27.1% |
| Education | 131 | 16.4% |
| Literature & Languages | 0 | 0.0% |
| Liberal Arts & History | 32 | 4.0% |
| Visual & Performing Arts | 53 | 6.7% |
| Communications | 20 | 2.5% |
| Arts & Humanities | 30 | 3.8% |
| Total | 797 | 100.0% |
Transportation & Commute in Aberdeen
Vehicle Availability by Sex in Aberdeen
The most prevalent vehicle ownership categories in Aberdeen are males with 1 vehicle (173, accounting for 34.7%) and females with 1 vehicle (158, making up 37.8%).
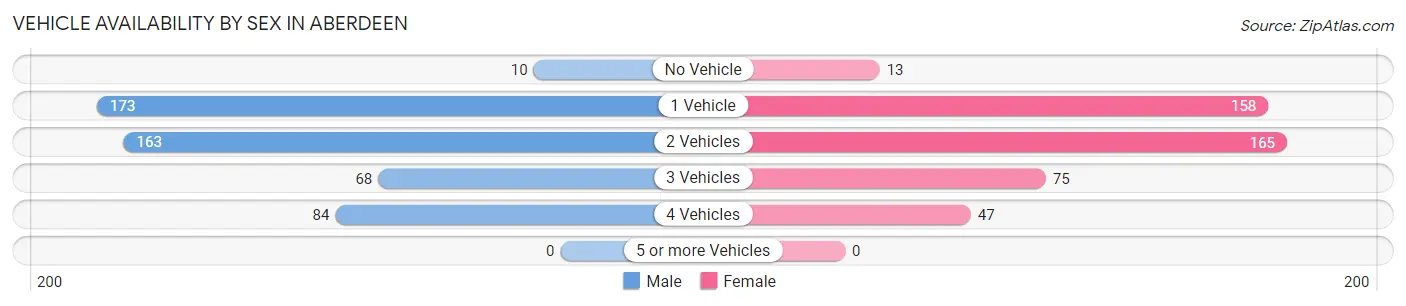
| Vehicles Available | Male | Female |
| No Vehicle | 10 (2.0%) | 13 (2.8%) |
| 1 Vehicle | 173 (34.7%) | 158 (34.5%) |
| 2 Vehicles | 163 (32.7%) | 165 (36.0%) |
| 3 Vehicles | 68 (13.7%) | 75 (16.4%) |
| 4 Vehicles | 84 (16.9%) | 47 (10.3%) |
| 5 or more Vehicles | 0 (0.0%) | 0 (0.0%) |
| Total | 498 (100.0%) | 458 (100.0%) |
Commute Time in Aberdeen
The most frequently occuring commute durations in Aberdeen are 15 to 19 minutes (222 commuters, 24.8%), 20 to 24 minutes (164 commuters, 18.3%), and 45 to 59 minutes (152 commuters, 17.0%).

| Commute Time | # Commuters | % Commuters |
| Less than 5 Minutes | 15 | 1.7% |
| 5 to 9 Minutes | 15 | 1.7% |
| 10 to 14 Minutes | 41 | 4.6% |
| 15 to 19 Minutes | 222 | 24.8% |
| 20 to 24 Minutes | 164 | 18.3% |
| 25 to 29 Minutes | 23 | 2.6% |
| 30 to 34 Minutes | 132 | 14.7% |
| 35 to 39 Minutes | 38 | 4.3% |
| 40 to 44 Minutes | 0 | 0.0% |
| 45 to 59 Minutes | 152 | 17.0% |
| 60 to 89 Minutes | 53 | 5.9% |
| 90 or more Minutes | 40 | 4.5% |
Commute Time by Sex in Aberdeen
The most common commute times in Aberdeen are 45 to 59 minutes (134 commuters, 28.4%) for males and 15 to 19 minutes (134 commuters, 31.7%) for females.
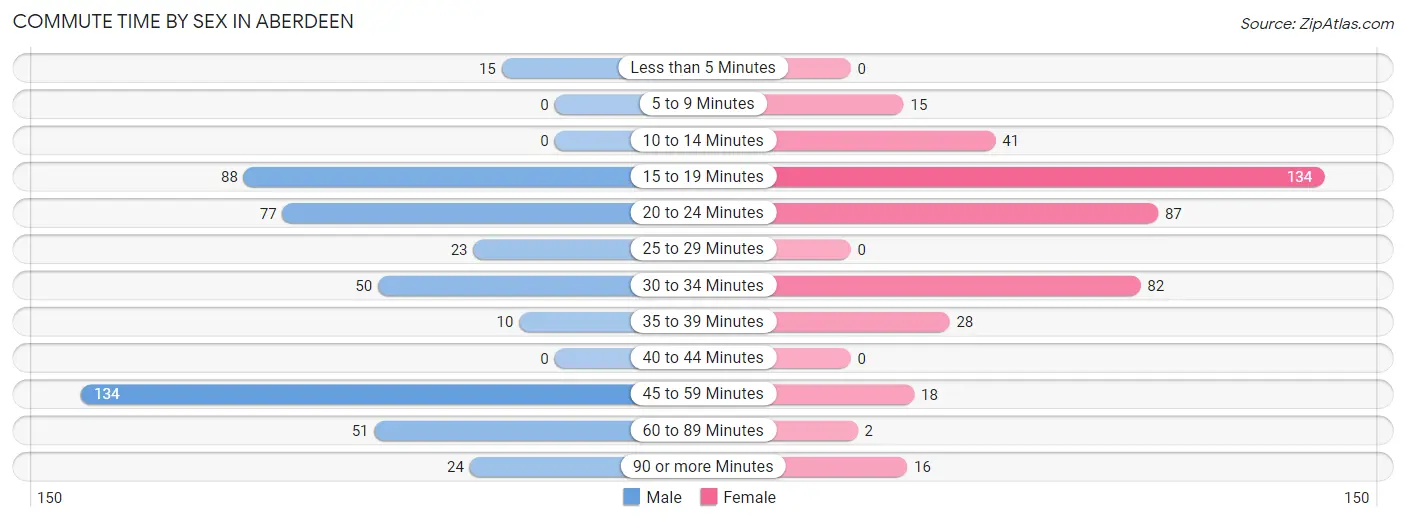
| Commute Time | Male | Female |
| Less than 5 Minutes | 15 (3.2%) | 0 (0.0%) |
| 5 to 9 Minutes | 0 (0.0%) | 15 (3.5%) |
| 10 to 14 Minutes | 0 (0.0%) | 41 (9.7%) |
| 15 to 19 Minutes | 88 (18.6%) | 134 (31.7%) |
| 20 to 24 Minutes | 77 (16.3%) | 87 (20.6%) |
| 25 to 29 Minutes | 23 (4.9%) | 0 (0.0%) |
| 30 to 34 Minutes | 50 (10.6%) | 82 (19.4%) |
| 35 to 39 Minutes | 10 (2.1%) | 28 (6.6%) |
| 40 to 44 Minutes | 0 (0.0%) | 0 (0.0%) |
| 45 to 59 Minutes | 134 (28.4%) | 18 (4.3%) |
| 60 to 89 Minutes | 51 (10.8%) | 2 (0.5%) |
| 90 or more Minutes | 24 (5.1%) | 16 (3.8%) |
Time of Departure to Work by Sex in Aberdeen
The most frequent times of departure to work in Aberdeen are 7:00 AM to 7:29 AM (148, 31.4%) for males and 7:00 AM to 7:29 AM (129, 30.5%) for females.
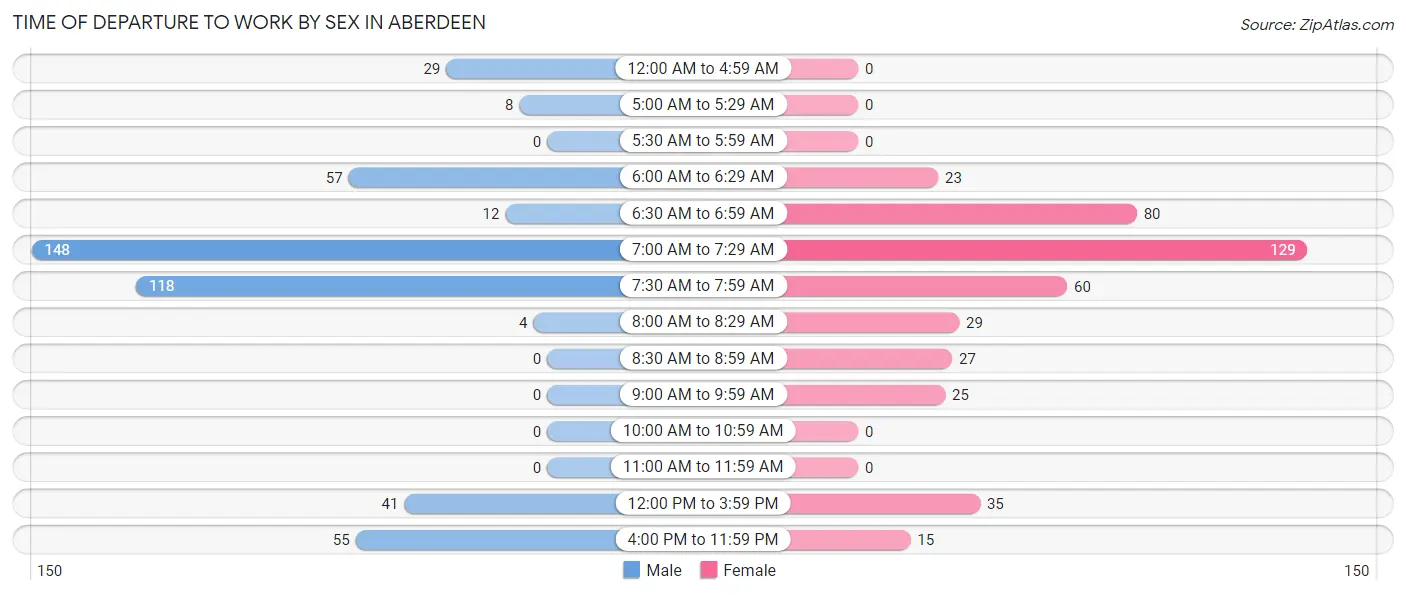
| Time of Departure | Male | Female |
| 12:00 AM to 4:59 AM | 29 (6.1%) | 0 (0.0%) |
| 5:00 AM to 5:29 AM | 8 (1.7%) | 0 (0.0%) |
| 5:30 AM to 5:59 AM | 0 (0.0%) | 0 (0.0%) |
| 6:00 AM to 6:29 AM | 57 (12.1%) | 23 (5.4%) |
| 6:30 AM to 6:59 AM | 12 (2.5%) | 80 (18.9%) |
| 7:00 AM to 7:29 AM | 148 (31.4%) | 129 (30.5%) |
| 7:30 AM to 7:59 AM | 118 (25.0%) | 60 (14.2%) |
| 8:00 AM to 8:29 AM | 4 (0.9%) | 29 (6.9%) |
| 8:30 AM to 8:59 AM | 0 (0.0%) | 27 (6.4%) |
| 9:00 AM to 9:59 AM | 0 (0.0%) | 25 (5.9%) |
| 10:00 AM to 10:59 AM | 0 (0.0%) | 0 (0.0%) |
| 11:00 AM to 11:59 AM | 0 (0.0%) | 0 (0.0%) |
| 12:00 PM to 3:59 PM | 41 (8.7%) | 35 (8.3%) |
| 4:00 PM to 11:59 PM | 55 (11.7%) | 15 (3.5%) |
| Total | 472 (100.0%) | 423 (100.0%) |
Housing Occupancy in Aberdeen
Occupancy by Ownership in Aberdeen
Of the total 815 dwellings in Aberdeen, owner-occupied units account for 702 (86.1%), while renter-occupied units make up 113 (13.9%).
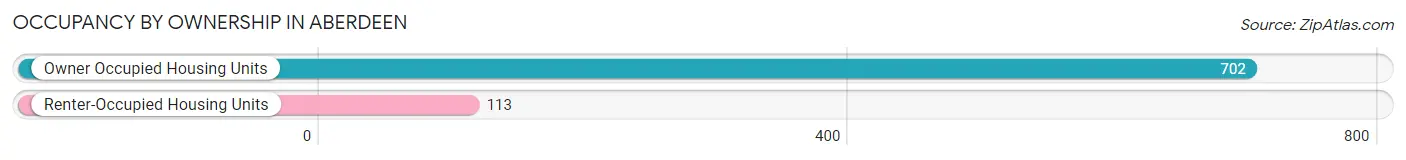
| Occupancy | # Housing Units | % Housing Units |
| Owner Occupied Housing Units | 702 | 86.1% |
| Renter-Occupied Housing Units | 113 | 13.9% |
| Total Occupied Housing Units | 815 | 100.0% |
Occupancy by Household Size in Aberdeen
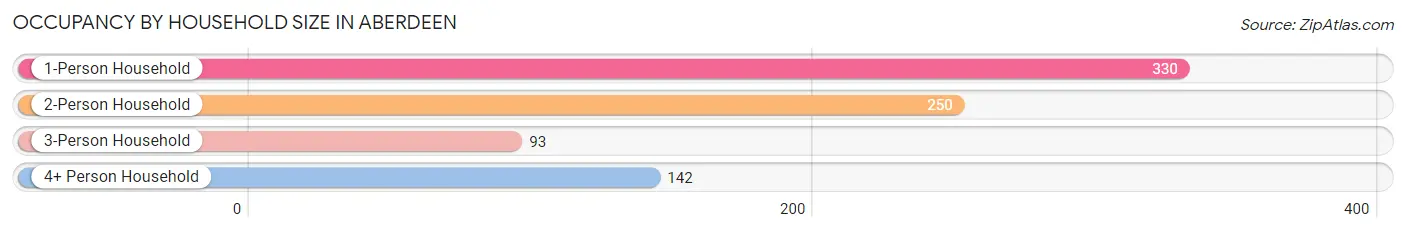
| Household Size | # Housing Units | % Housing Units |
| 1-Person Household | 330 | 40.5% |
| 2-Person Household | 250 | 30.7% |
| 3-Person Household | 93 | 11.4% |
| 4+ Person Household | 142 | 17.4% |
| Total Housing Units | 815 | 100.0% |
Occupancy by Ownership by Household Size in Aberdeen
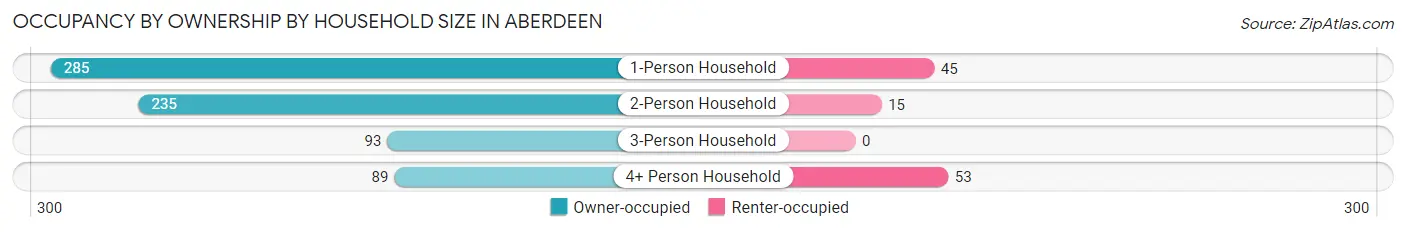
| Household Size | Owner-occupied | Renter-occupied |
| 1-Person Household | 285 (86.4%) | 45 (13.6%) |
| 2-Person Household | 235 (94.0%) | 15 (6.0%) |
| 3-Person Household | 93 (100.0%) | 0 (0.0%) |
| 4+ Person Household | 89 (62.7%) | 53 (37.3%) |
| Total Housing Units | 702 (86.1%) | 113 (13.9%) |
Occupancy by Educational Attainment in Aberdeen
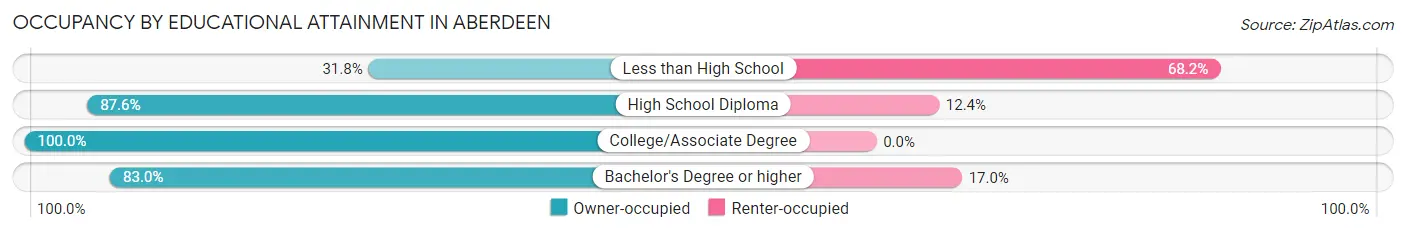
| Household Size | Owner-occupied | Renter-occupied |
| Less than High School | 7 (31.8%) | 15 (68.2%) |
| High School Diploma | 155 (87.6%) | 22 (12.4%) |
| College/Associate Degree | 168 (100.0%) | 0 (0.0%) |
| Bachelor's Degree or higher | 372 (83.0%) | 76 (17.0%) |
Occupancy by Age of Householder in Aberdeen
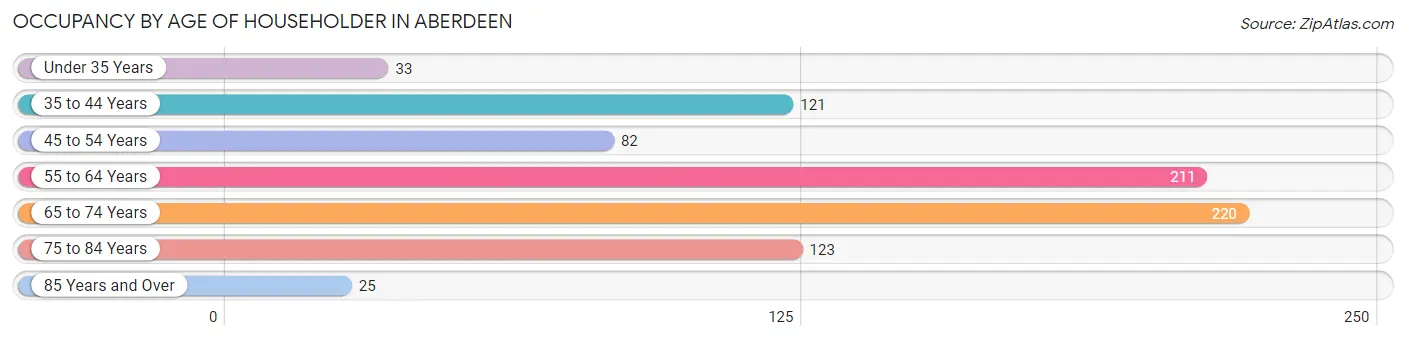
| Age Bracket | # Households | % Households |
| Under 35 Years | 33 | 4.1% |
| 35 to 44 Years | 121 | 14.8% |
| 45 to 54 Years | 82 | 10.1% |
| 55 to 64 Years | 211 | 25.9% |
| 65 to 74 Years | 220 | 27.0% |
| 75 to 84 Years | 123 | 15.1% |
| 85 Years and Over | 25 | 3.1% |
| Total | 815 | 100.0% |
Housing Finances in Aberdeen
Median Income by Occupancy in Aberdeen
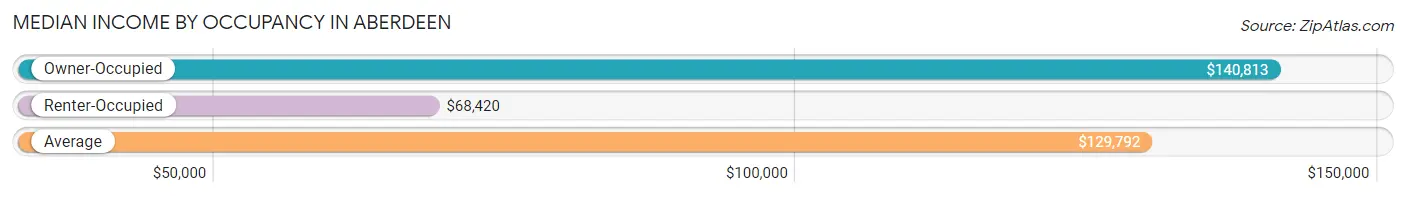
| Occupancy Type | # Households | Median Income |
| Owner-Occupied | 702 (86.1%) | $140,813 |
| Renter-Occupied | 113 (13.9%) | $68,420 |
| Average | 815 (100.0%) | $129,792 |
Occupancy by Householder Income Bracket in Aberdeen
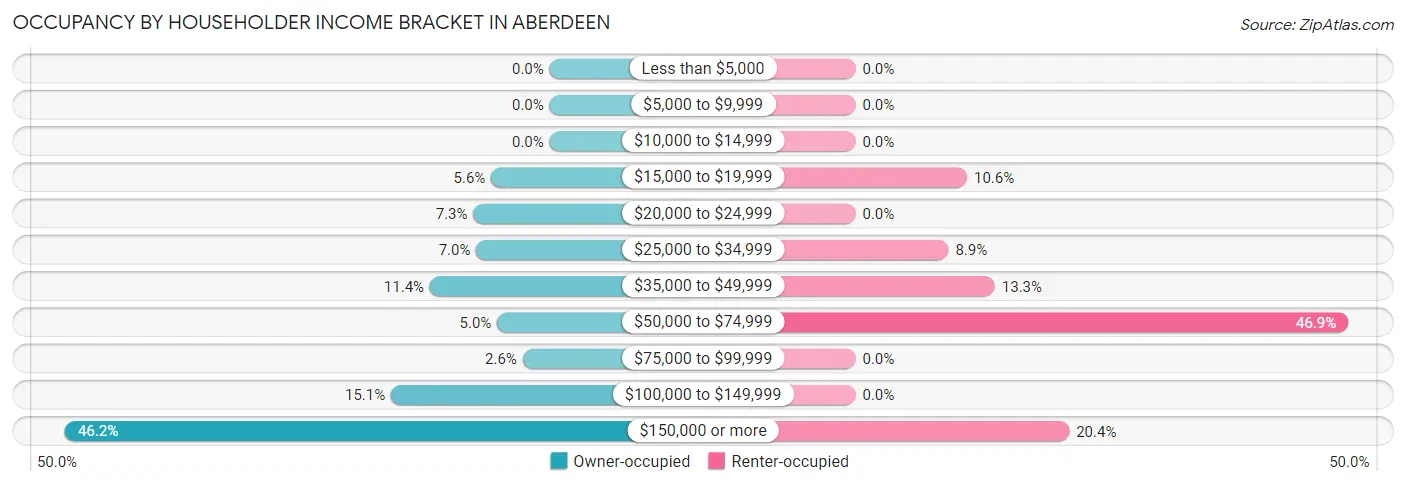
| Income Bracket | Owner-occupied | Renter-occupied |
| Less than $5,000 | 0 (0.0%) | 0 (0.0%) |
| $5,000 to $9,999 | 0 (0.0%) | 0 (0.0%) |
| $10,000 to $14,999 | 0 (0.0%) | 0 (0.0%) |
| $15,000 to $19,999 | 39 (5.6%) | 12 (10.6%) |
| $20,000 to $24,999 | 51 (7.3%) | 0 (0.0%) |
| $25,000 to $34,999 | 49 (7.0%) | 10 (8.8%) |
| $35,000 to $49,999 | 80 (11.4%) | 15 (13.3%) |
| $50,000 to $74,999 | 35 (5.0%) | 53 (46.9%) |
| $75,000 to $99,999 | 18 (2.6%) | 0 (0.0%) |
| $100,000 to $149,999 | 106 (15.1%) | 0 (0.0%) |
| $150,000 or more | 324 (46.2%) | 23 (20.3%) |
| Total | 702 (100.0%) | 113 (100.0%) |
Monthly Housing Cost Tiers in Aberdeen
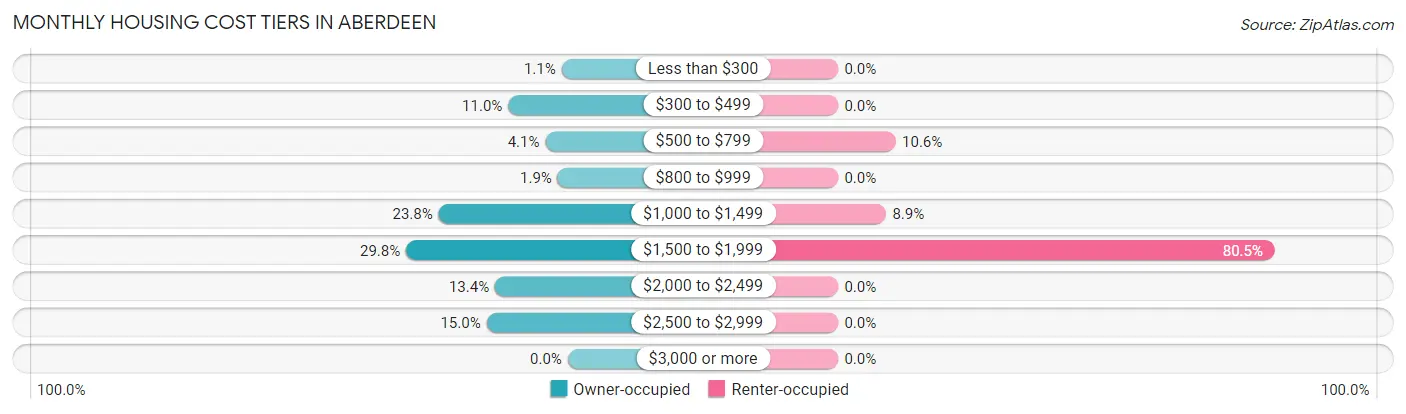
| Monthly Cost | Owner-occupied | Renter-occupied |
| Less than $300 | 8 (1.1%) | 0 (0.0%) |
| $300 to $499 | 77 (11.0%) | 0 (0.0%) |
| $500 to $799 | 29 (4.1%) | 12 (10.6%) |
| $800 to $999 | 13 (1.8%) | 0 (0.0%) |
| $1,000 to $1,499 | 167 (23.8%) | 10 (8.8%) |
| $1,500 to $1,999 | 209 (29.8%) | 91 (80.5%) |
| $2,000 to $2,499 | 94 (13.4%) | 0 (0.0%) |
| $2,500 to $2,999 | 105 (15.0%) | 0 (0.0%) |
| $3,000 or more | 0 (0.0%) | 0 (0.0%) |
| Total | 702 (100.0%) | 113 (100.0%) |
Physical Housing Characteristics in Aberdeen
Housing Structures in Aberdeen
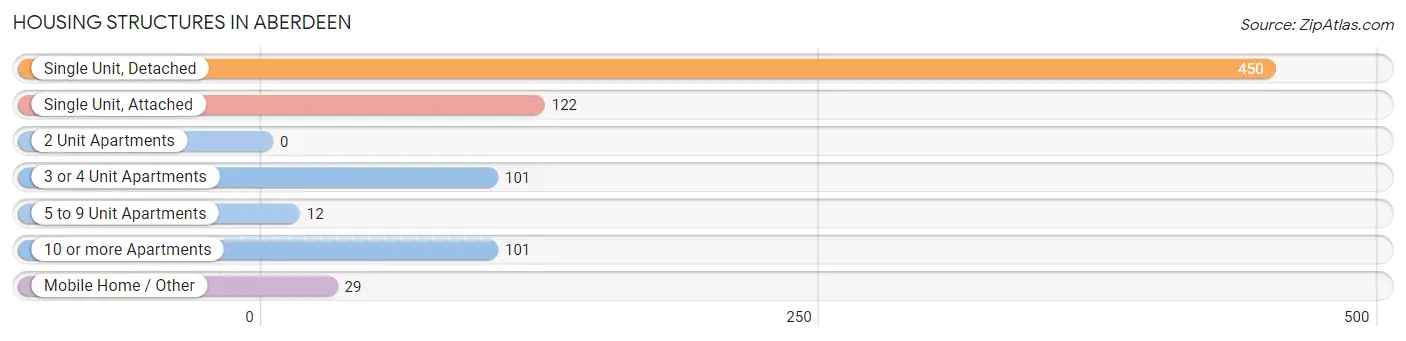
| Structure Type | # Housing Units | % Housing Units |
| Single Unit, Detached | 450 | 55.2% |
| Single Unit, Attached | 122 | 15.0% |
| 2 Unit Apartments | 0 | 0.0% |
| 3 or 4 Unit Apartments | 101 | 12.4% |
| 5 to 9 Unit Apartments | 12 | 1.5% |
| 10 or more Apartments | 101 | 12.4% |
| Mobile Home / Other | 29 | 3.6% |
| Total | 815 | 100.0% |
Housing Structures by Occupancy in Aberdeen
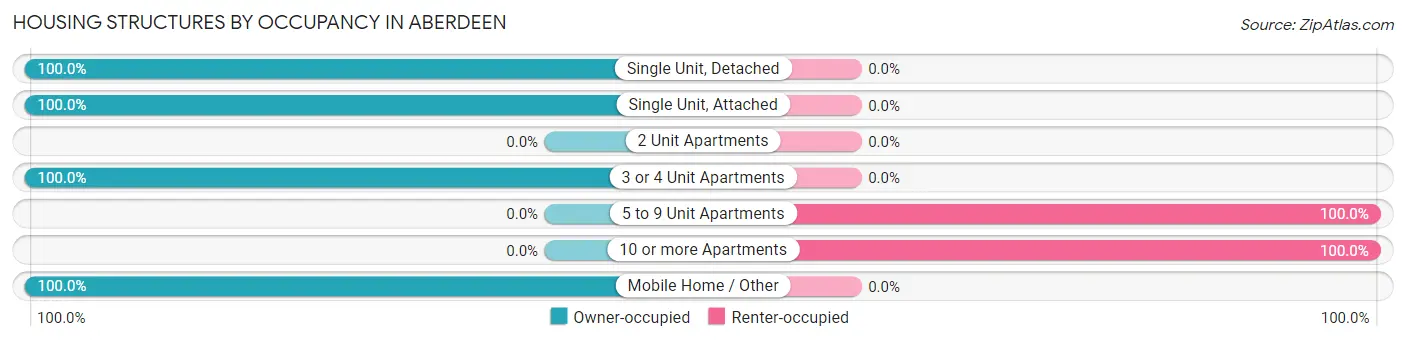
| Structure Type | Owner-occupied | Renter-occupied |
| Single Unit, Detached | 450 (100.0%) | 0 (0.0%) |
| Single Unit, Attached | 122 (100.0%) | 0 (0.0%) |
| 2 Unit Apartments | 0 (0.0%) | 0 (0.0%) |
| 3 or 4 Unit Apartments | 101 (100.0%) | 0 (0.0%) |
| 5 to 9 Unit Apartments | 0 (0.0%) | 12 (100.0%) |
| 10 or more Apartments | 0 (0.0%) | 101 (100.0%) |
| Mobile Home / Other | 29 (100.0%) | 0 (0.0%) |
| Total | 702 (86.1%) | 113 (13.9%) |
Housing Structures by Number of Rooms in Aberdeen
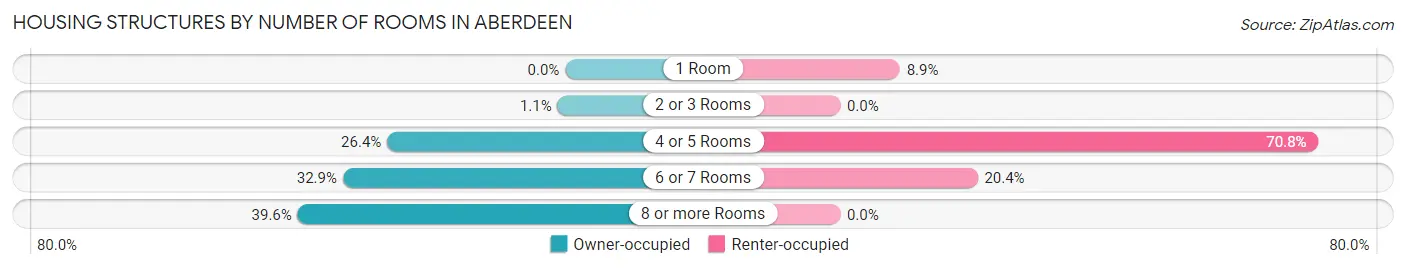
| Number of Rooms | Owner-occupied | Renter-occupied |
| 1 Room | 0 (0.0%) | 10 (8.8%) |
| 2 or 3 Rooms | 8 (1.1%) | 0 (0.0%) |
| 4 or 5 Rooms | 185 (26.4%) | 80 (70.8%) |
| 6 or 7 Rooms | 231 (32.9%) | 23 (20.3%) |
| 8 or more Rooms | 278 (39.6%) | 0 (0.0%) |
| Total | 702 (100.0%) | 113 (100.0%) |
Housing Structure by Heating Type in Aberdeen
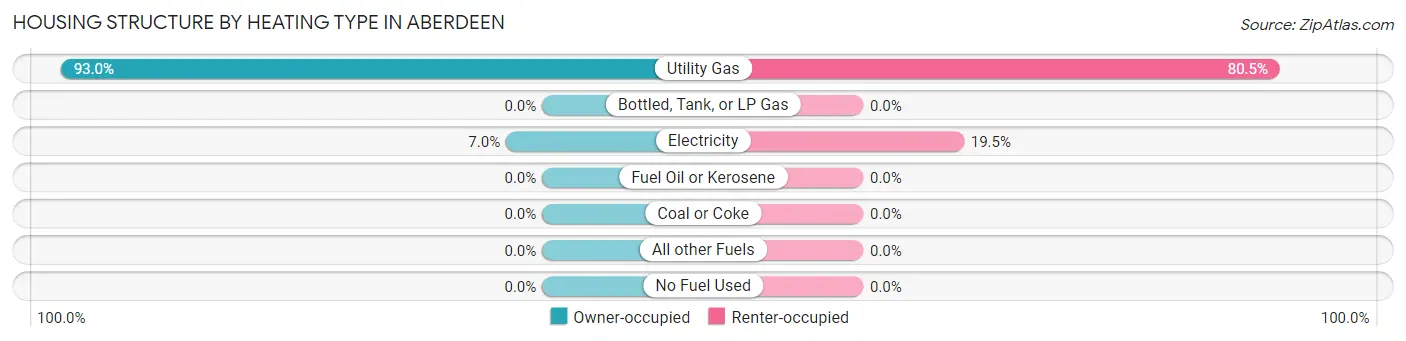
| Heating Type | Owner-occupied | Renter-occupied |
| Utility Gas | 653 (93.0%) | 91 (80.5%) |
| Bottled, Tank, or LP Gas | 0 (0.0%) | 0 (0.0%) |
| Electricity | 49 (7.0%) | 22 (19.5%) |
| Fuel Oil or Kerosene | 0 (0.0%) | 0 (0.0%) |
| Coal or Coke | 0 (0.0%) | 0 (0.0%) |
| All other Fuels | 0 (0.0%) | 0 (0.0%) |
| No Fuel Used | 0 (0.0%) | 0 (0.0%) |
| Total | 702 (100.0%) | 113 (100.0%) |
Household Vehicle Usage in Aberdeen
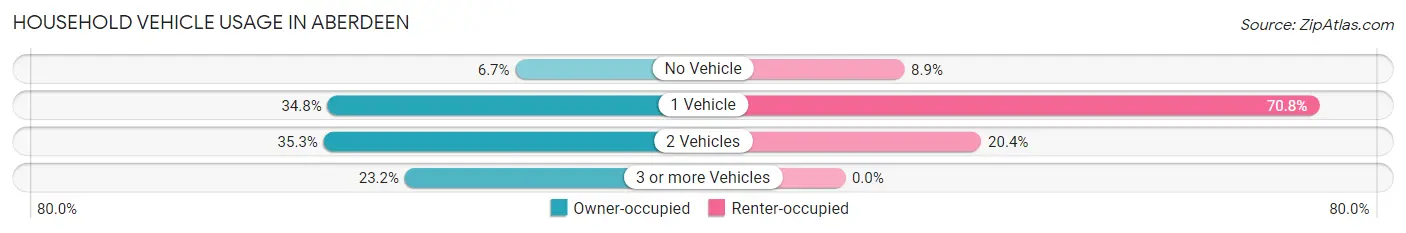
| Vehicles per Household | Owner-occupied | Renter-occupied |
| No Vehicle | 47 (6.7%) | 10 (8.8%) |
| 1 Vehicle | 244 (34.8%) | 80 (70.8%) |
| 2 Vehicles | 248 (35.3%) | 23 (20.3%) |
| 3 or more Vehicles | 163 (23.2%) | 0 (0.0%) |
| Total | 702 (100.0%) | 113 (100.0%) |
Real Estate & Mortgages in Aberdeen
Real Estate and Mortgage Overview in Aberdeen
| Characteristic | Without Mortgage | With Mortgage |
| Housing Units | 166 | 536 |
| Median Property Value | $365,600 | $330,300 |
| Median Household Income | - | - |
| Monthly Housing Costs | - | - |
| Real Estate Taxes | - | - |
Property Value by Mortgage Status in Aberdeen
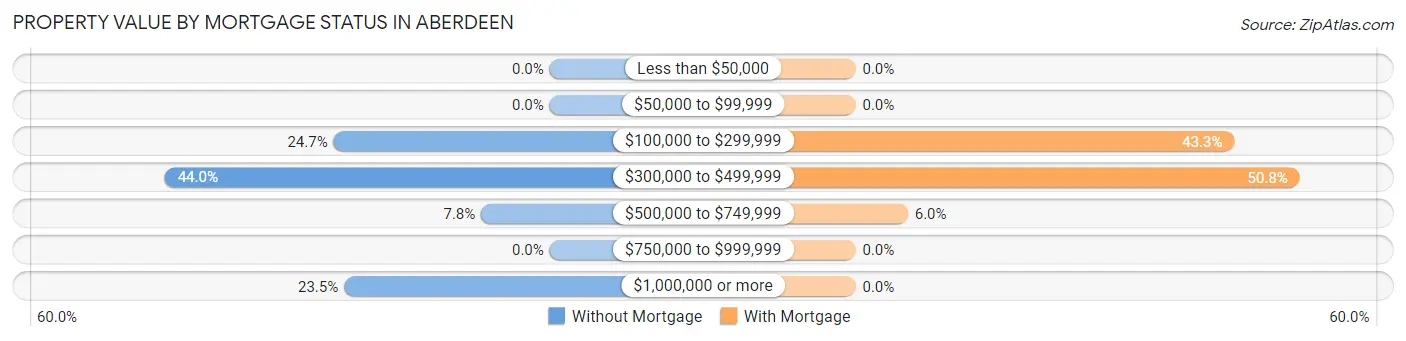
| Property Value | Without Mortgage | With Mortgage |
| Less than $50,000 | 0 (0.0%) | 0 (0.0%) |
| $50,000 to $99,999 | 0 (0.0%) | 0 (0.0%) |
| $100,000 to $299,999 | 41 (24.7%) | 232 (43.3%) |
| $300,000 to $499,999 | 73 (44.0%) | 272 (50.7%) |
| $500,000 to $749,999 | 13 (7.8%) | 32 (6.0%) |
| $750,000 to $999,999 | 0 (0.0%) | 0 (0.0%) |
| $1,000,000 or more | 39 (23.5%) | 0 (0.0%) |
| Total | 166 (100.0%) | 536 (100.0%) |
Household Income by Mortgage Status in Aberdeen
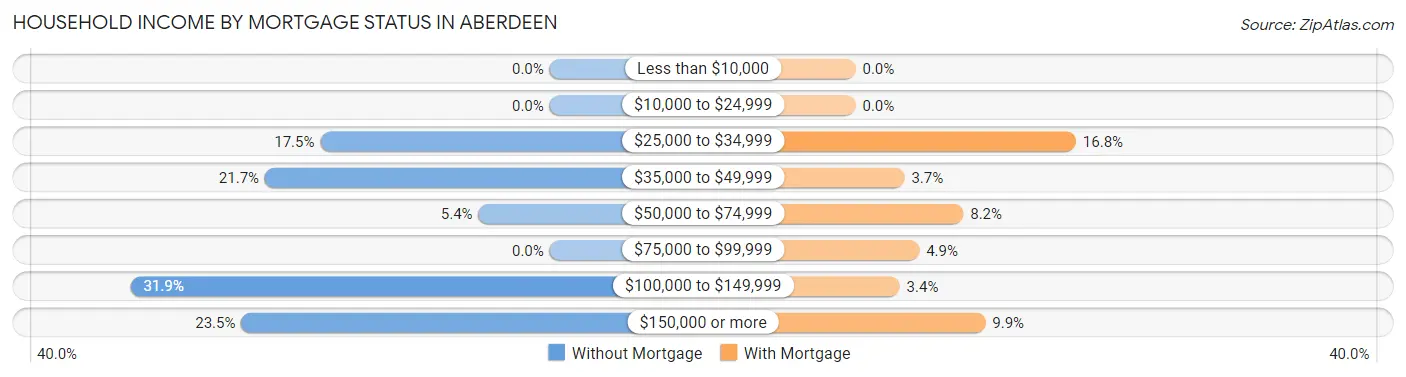
| Household Income | Without Mortgage | With Mortgage |
| Less than $10,000 | 0 (0.0%) | 0 (0.0%) |
| $10,000 to $24,999 | 0 (0.0%) | 0 (0.0%) |
| $25,000 to $34,999 | 29 (17.5%) | 90 (16.8%) |
| $35,000 to $49,999 | 36 (21.7%) | 20 (3.7%) |
| $50,000 to $74,999 | 9 (5.4%) | 44 (8.2%) |
| $75,000 to $99,999 | 0 (0.0%) | 26 (4.9%) |
| $100,000 to $149,999 | 53 (31.9%) | 18 (3.4%) |
| $150,000 or more | 39 (23.5%) | 53 (9.9%) |
| Total | 166 (100.0%) | 536 (100.0%) |
Property Value to Household Income Ratio in Aberdeen
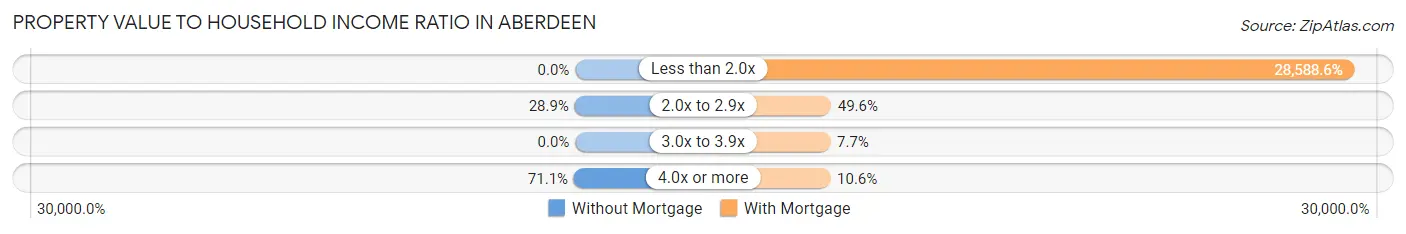
| Value-to-Income Ratio | Without Mortgage | With Mortgage |
| Less than 2.0x | 0 (0.0%) | 153,235 (28,588.6%) |
| 2.0x to 2.9x | 48 (28.9%) | 266 (49.6%) |
| 3.0x to 3.9x | 0 (0.0%) | 41 (7.6%) |
| 4.0x or more | 118 (71.1%) | 57 (10.6%) |
| Total | 166 (100.0%) | 536 (100.0%) |
Real Estate Taxes by Mortgage Status in Aberdeen
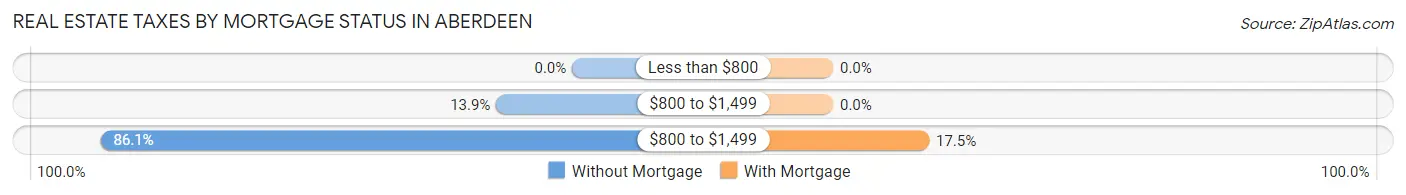
| Property Taxes | Without Mortgage | With Mortgage |
| Less than $800 | 0 (0.0%) | 0 (0.0%) |
| $800 to $1,499 | 23 (13.9%) | 0 (0.0%) |
| $800 to $1,499 | 143 (86.1%) | 94 (17.5%) |
| Total | 166 (100.0%) | 536 (100.0%) |
Health & Disability in Aberdeen
Health Insurance Coverage by Age in Aberdeen
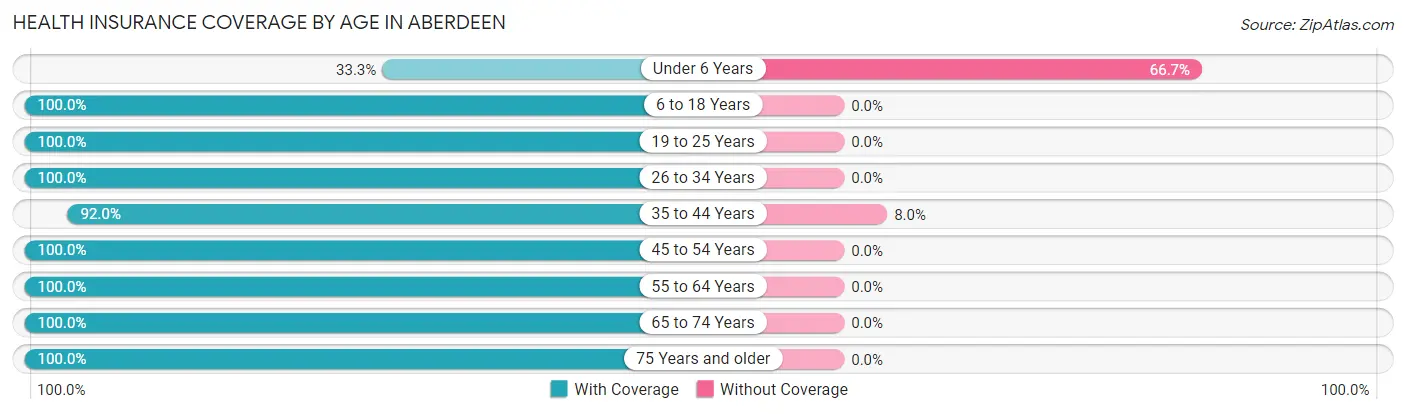
| Age Bracket | With Coverage | Without Coverage |
| Under 6 Years | 13 (33.3%) | 26 (66.7%) |
| 6 to 18 Years | 327 (100.0%) | 0 (0.0%) |
| 19 to 25 Years | 76 (100.0%) | 0 (0.0%) |
| 26 to 34 Years | 89 (100.0%) | 0 (0.0%) |
| 35 to 44 Years | 184 (92.0%) | 16 (8.0%) |
| 45 to 54 Years | 191 (100.0%) | 0 (0.0%) |
| 55 to 64 Years | 371 (100.0%) | 0 (0.0%) |
| 65 to 74 Years | 279 (100.0%) | 0 (0.0%) |
| 75 Years and older | 184 (100.0%) | 0 (0.0%) |
| Total | 1,714 (97.6%) | 42 (2.4%) |
Health Insurance Coverage by Citizenship Status in Aberdeen
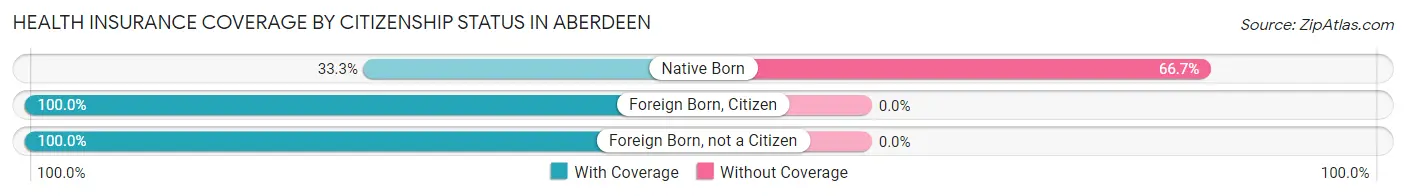
| Citizenship Status | With Coverage | Without Coverage |
| Native Born | 13 (33.3%) | 26 (66.7%) |
| Foreign Born, Citizen | 327 (100.0%) | 0 (0.0%) |
| Foreign Born, not a Citizen | 76 (100.0%) | 0 (0.0%) |
Health Insurance Coverage by Household Income in Aberdeen
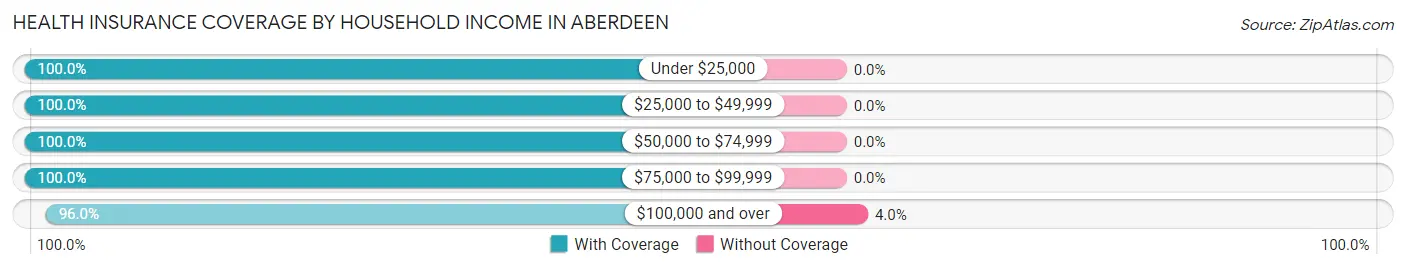
| Household Income | With Coverage | Without Coverage |
| Under $25,000 | 102 (100.0%) | 0 (0.0%) |
| $25,000 to $49,999 | 300 (100.0%) | 0 (0.0%) |
| $50,000 to $74,999 | 262 (100.0%) | 0 (0.0%) |
| $75,000 to $99,999 | 35 (100.0%) | 0 (0.0%) |
| $100,000 and over | 1,015 (96.0%) | 42 (4.0%) |
Public vs Private Health Insurance Coverage by Age in Aberdeen
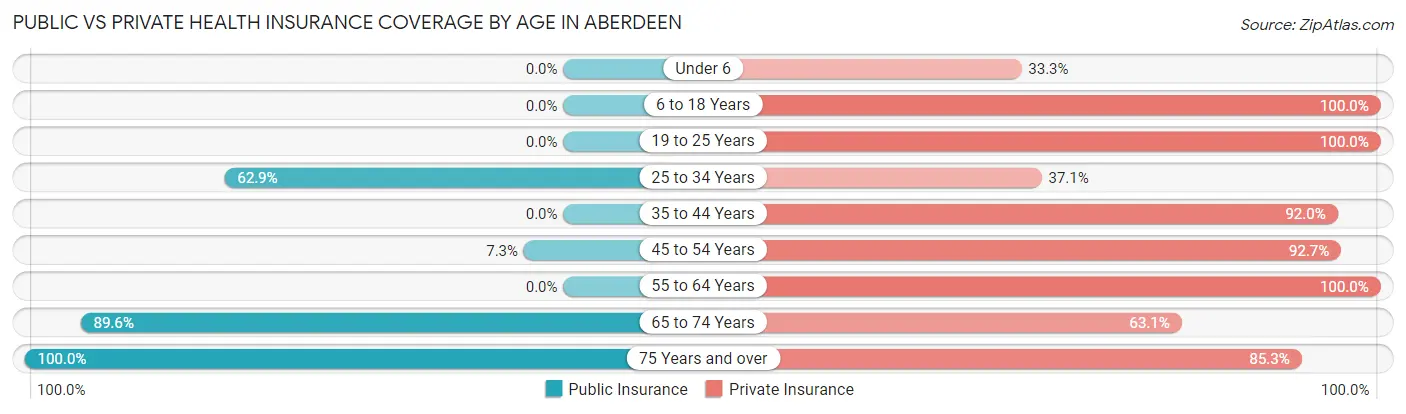
| Age Bracket | Public Insurance | Private Insurance |
| Under 6 | 0 (0.0%) | 13 (33.3%) |
| 6 to 18 Years | 0 (0.0%) | 327 (100.0%) |
| 19 to 25 Years | 0 (0.0%) | 76 (100.0%) |
| 25 to 34 Years | 56 (62.9%) | 33 (37.1%) |
| 35 to 44 Years | 0 (0.0%) | 184 (92.0%) |
| 45 to 54 Years | 14 (7.3%) | 177 (92.7%) |
| 55 to 64 Years | 0 (0.0%) | 371 (100.0%) |
| 65 to 74 Years | 250 (89.6%) | 176 (63.1%) |
| 75 Years and over | 184 (100.0%) | 157 (85.3%) |
| Total | 504 (28.7%) | 1,514 (86.2%) |
Disability Status by Sex by Age in Aberdeen
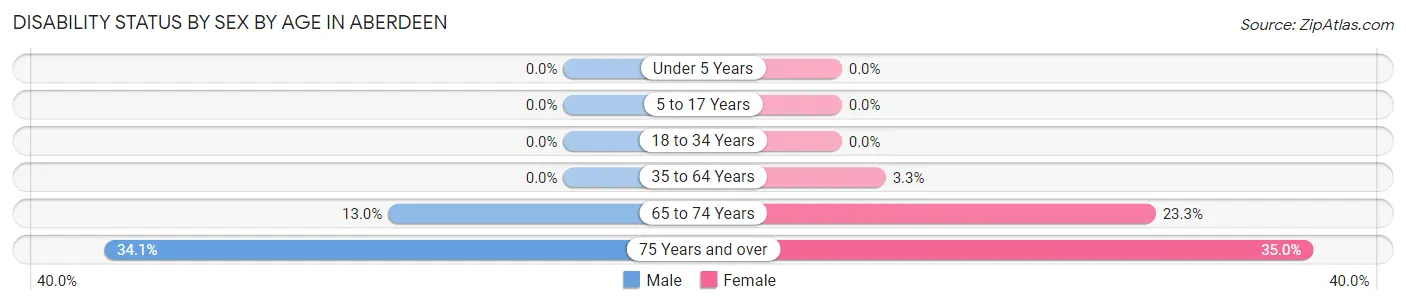
| Age Bracket | Male | Female |
| Under 5 Years | 0 (0.0%) | 0 (0.0%) |
| 5 to 17 Years | 0 (0.0%) | 0 (0.0%) |
| 18 to 34 Years | 0 (0.0%) | 0 (0.0%) |
| 35 to 64 Years | 0 (0.0%) | 13 (3.3%) |
| 65 to 74 Years | 19 (13.0%) | 31 (23.3%) |
| 75 Years and over | 15 (34.1%) | 49 (35.0%) |
Disability Class by Sex by Age in Aberdeen
Disability Class: Hearing Difficulty
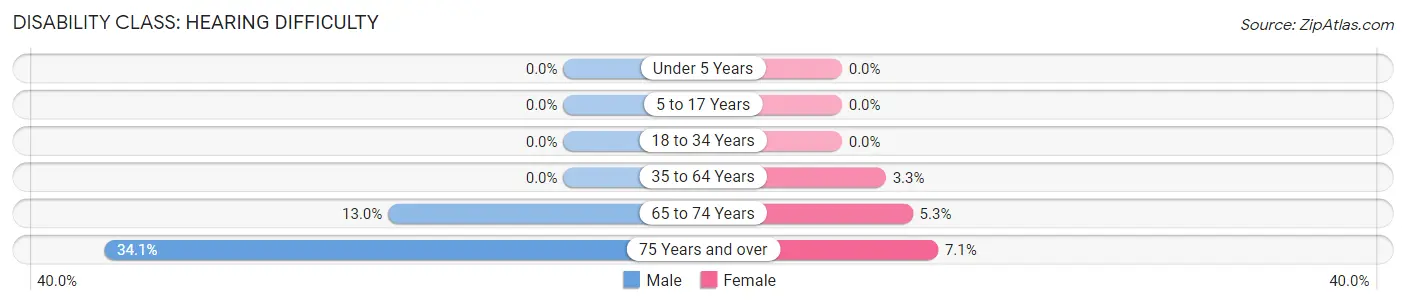
| Age Bracket | Male | Female |
| Under 5 Years | 0 (0.0%) | 0 (0.0%) |
| 5 to 17 Years | 0 (0.0%) | 0 (0.0%) |
| 18 to 34 Years | 0 (0.0%) | 0 (0.0%) |
| 35 to 64 Years | 0 (0.0%) | 13 (3.3%) |
| 65 to 74 Years | 19 (13.0%) | 7 (5.3%) |
| 75 Years and over | 15 (34.1%) | 10 (7.1%) |
Disability Class: Vision Difficulty
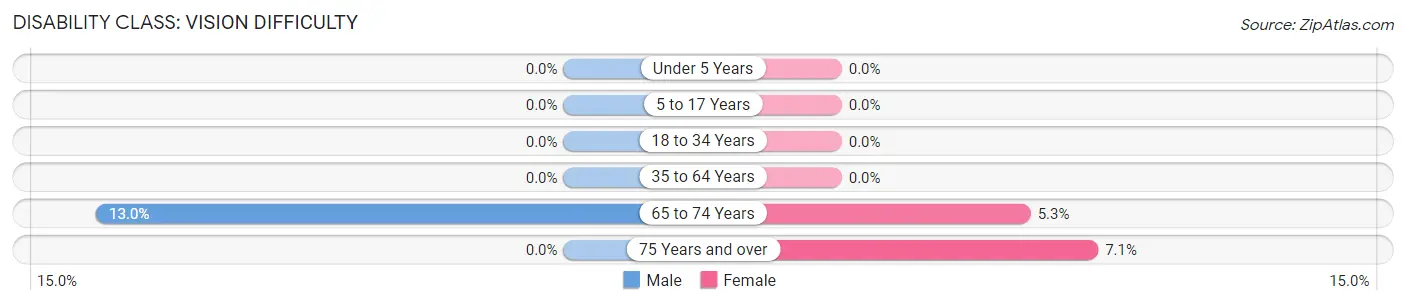
| Age Bracket | Male | Female |
| Under 5 Years | 0 (0.0%) | 0 (0.0%) |
| 5 to 17 Years | 0 (0.0%) | 0 (0.0%) |
| 18 to 34 Years | 0 (0.0%) | 0 (0.0%) |
| 35 to 64 Years | 0 (0.0%) | 0 (0.0%) |
| 65 to 74 Years | 19 (13.0%) | 7 (5.3%) |
| 75 Years and over | 0 (0.0%) | 10 (7.1%) |
Disability Class: Cognitive Difficulty
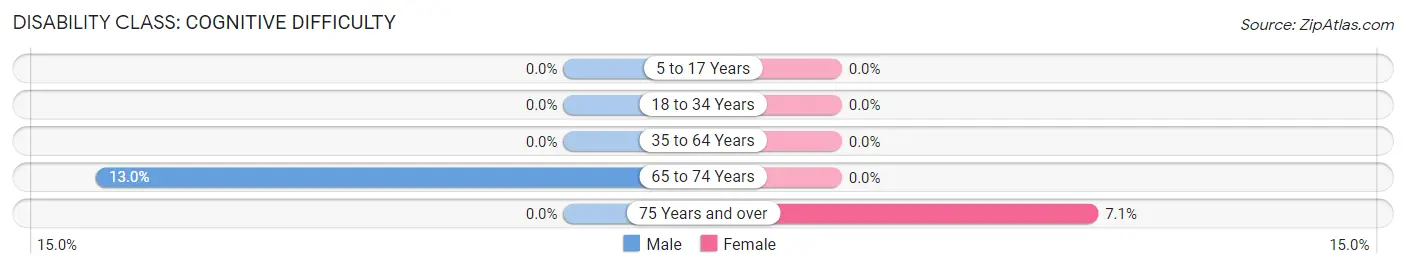
| Age Bracket | Male | Female |
| 5 to 17 Years | 0 (0.0%) | 0 (0.0%) |
| 18 to 34 Years | 0 (0.0%) | 0 (0.0%) |
| 35 to 64 Years | 0 (0.0%) | 0 (0.0%) |
| 65 to 74 Years | 19 (13.0%) | 0 (0.0%) |
| 75 Years and over | 0 (0.0%) | 10 (7.1%) |
Disability Class: Ambulatory Difficulty
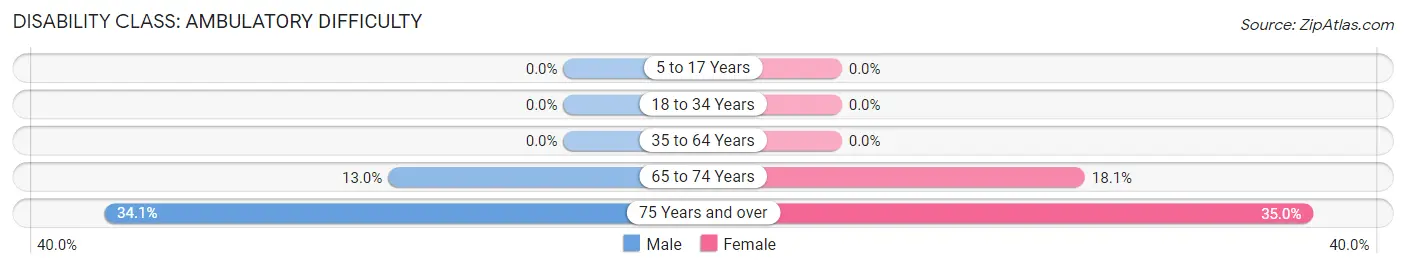
| Age Bracket | Male | Female |
| 5 to 17 Years | 0 (0.0%) | 0 (0.0%) |
| 18 to 34 Years | 0 (0.0%) | 0 (0.0%) |
| 35 to 64 Years | 0 (0.0%) | 0 (0.0%) |
| 65 to 74 Years | 19 (13.0%) | 24 (18.0%) |
| 75 Years and over | 15 (34.1%) | 49 (35.0%) |
Disability Class: Self-Care Difficulty

| Age Bracket | Male | Female |
| 5 to 17 Years | 0 (0.0%) | 0 (0.0%) |
| 18 to 34 Years | 0 (0.0%) | 0 (0.0%) |
| 35 to 64 Years | 0 (0.0%) | 0 (0.0%) |
| 65 to 74 Years | 0 (0.0%) | 0 (0.0%) |
| 75 Years and over | 0 (0.0%) | 10 (7.1%) |
Technology Access in Aberdeen
Computing Device Access in Aberdeen
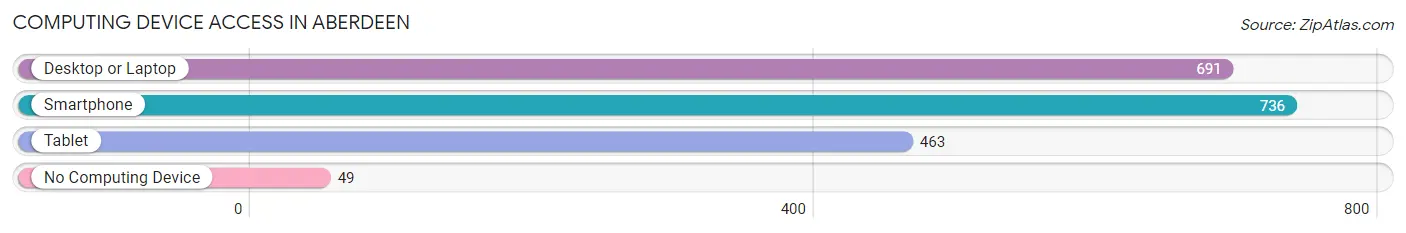
| Device Type | # Households | % Households |
| Desktop or Laptop | 691 | 84.8% |
| Smartphone | 736 | 90.3% |
| Tablet | 463 | 56.8% |
| No Computing Device | 49 | 6.0% |
| Total | 815 | 100.0% |
Internet Access in Aberdeen
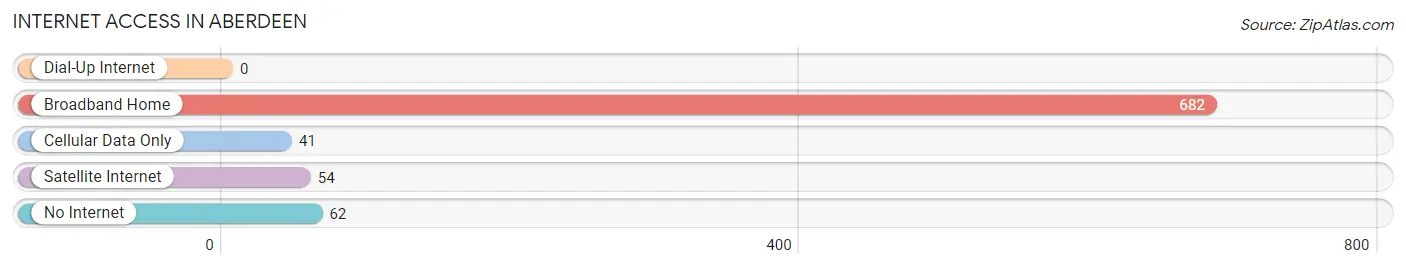
| Internet Type | # Households | % Households |
| Dial-Up Internet | 0 | 0.0% |
| Broadband Home | 682 | 83.7% |
| Cellular Data Only | 41 | 5.0% |
| Satellite Internet | 54 | 6.6% |
| No Internet | 62 | 7.6% |
| Total | 815 | 100.0% |
Aberdeen Summary
Aberdeen, Indiana is a small town located in the northeast corner of the state, in the county of Brown. It is situated on the banks of the Ohio River, and is part of the Cincinnati metropolitan area. The town has a population of approximately 1,500 people, and is known for its rural charm and small-town atmosphere.
History
Aberdeen was founded in 1818 by a group of settlers from North Carolina. The town was named after the Scottish city of Aberdeen, and was originally intended to be a trading post for the local Native American tribes. The town quickly grew, and by the mid-1800s, it had become a thriving river port. The town was also home to a number of industries, including a sawmill, a gristmill, and a brickyard.
In the late 1800s, the town began to decline, as the river trade shifted to larger cities. However, the town was able to remain afloat due to its agricultural industry. The town was also home to a number of small businesses, including a general store, a blacksmith, and a hotel.
Geography
Aberdeen is located in the northeast corner of Indiana, in the county of Brown. It is situated on the banks of the Ohio River, and is part of the Cincinnati metropolitan area. The town is located in a rural area, and is surrounded by rolling hills and farmland. The town is located approximately 30 miles from Cincinnati, and is accessible by car or boat.
Economy
Aberdeen’s economy is largely based on agriculture. The town is home to a number of farms, which produce a variety of crops, including corn, soybeans, and wheat. The town is also home to a number of small businesses, including a general store, a blacksmith, and a hotel.
Demographics
As of the 2010 census, Aberdeen had a population of 1,500 people. The town is predominantly white, with a small African American population. The median household income is $37,000, and the median home value is $90,000. The town has a low unemployment rate, and a high rate of homeownership.
Conclusion
Aberdeen, Indiana is a small town located in the northeast corner of the state, in the county of Brown. It is situated on the banks of the Ohio River, and is part of the Cincinnati metropolitan area. The town has a population of approximately 1,500 people, and is known for its rural charm and small-town atmosphere. The town’s economy is largely based on agriculture, and it is home to a number of small businesses. The town is predominantly white, with a small African American population. The median household income is $37,000, and the median home value is $90,000.
Common Questions
What is Per Capita Income in Aberdeen?
Per Capita income in Aberdeen is $61,960.
What is the Median Family Income in Aberdeen?
Median Family Income in Aberdeen is $154,044.
What is the Median Household income in Aberdeen?
Median Household Income in Aberdeen is $129,792.
What is Income or Wage Gap in Aberdeen?
Income or Wage Gap in Aberdeen is 55.1%.
Women in Aberdeen earn 44.9 cents for every dollar earned by a man.
What is Inequality or Gini Index in Aberdeen?
Inequality or Gini Index in Aberdeen is 0.43.
What is the Total Population of Aberdeen?
Total Population of Aberdeen is 1,756.
What is the Total Male Population of Aberdeen?
Total Male Population of Aberdeen is 790.
What is the Total Female Population of Aberdeen?
Total Female Population of Aberdeen is 966.
What is the Ratio of Males per 100 Females in Aberdeen?
There are 81.78 Males per 100 Females in Aberdeen.
What is the Ratio of Females per 100 Males in Aberdeen?
There are 122.28 Females per 100 Males in Aberdeen.
What is the Median Population Age in Aberdeen?
Median Population Age in Aberdeen is 52.5 Years.
What is the Average Family Size in Aberdeen
Average Family Size in Aberdeen is 2.9 People.
What is the Average Household Size in Aberdeen
Average Household Size in Aberdeen is 2.1 People.
How Large is the Labor Force in Aberdeen?
There are 972 People in the Labor Forcein in Aberdeen.
What is the Percentage of People in the Labor Force in Aberdeen?
66.7% of People are in the Labor Force in Aberdeen.
What is the Unemployment Rate in Aberdeen?
Unemployment Rate in Aberdeen is 1.6%.