Winfield, IN Map & Demographics
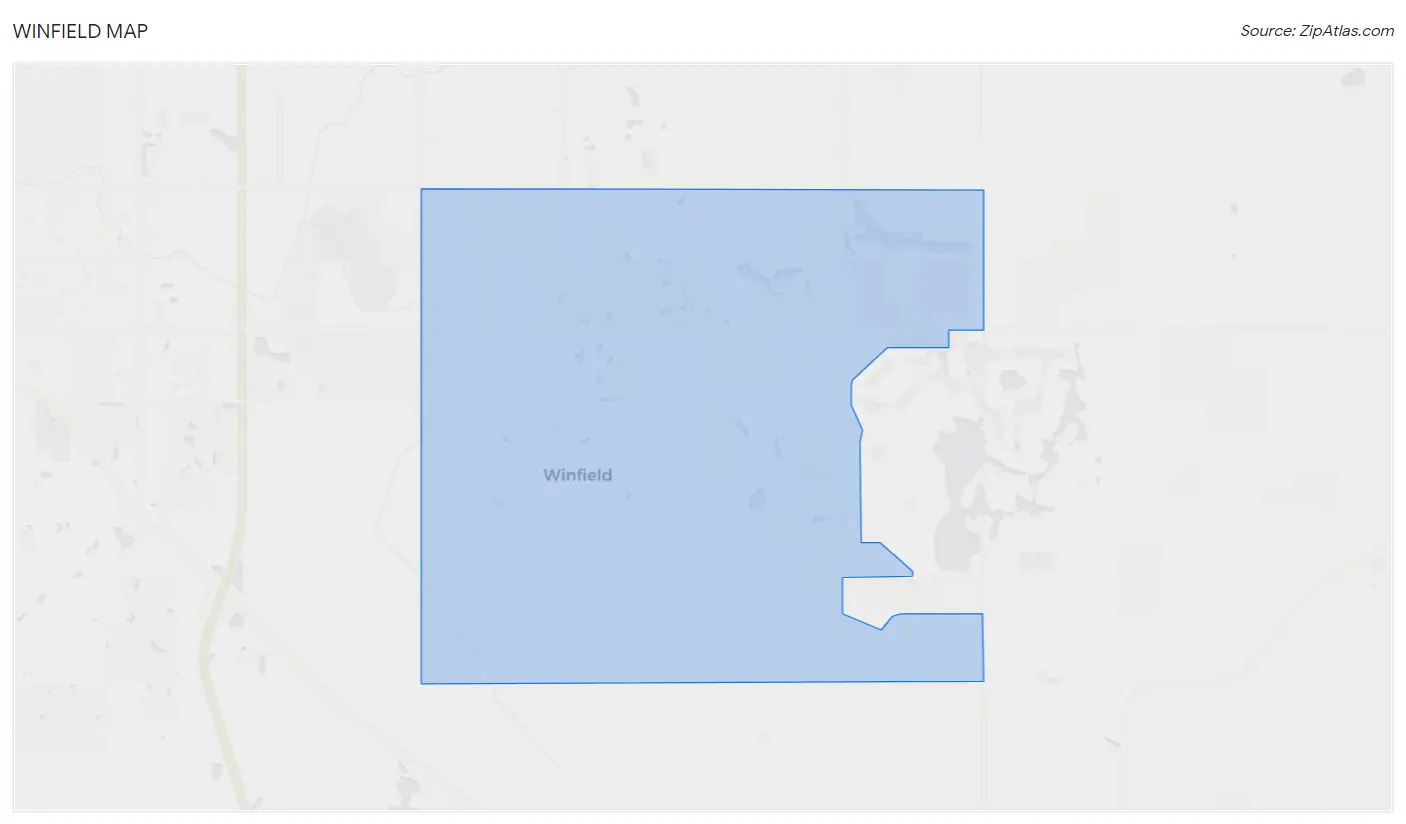
Winfield Map
Winfield Overview
$42,226
PER CAPITA INCOME
$130,741
AVG FAMILY INCOME
$124,091
AVG HOUSEHOLD INCOME
51.5%
WAGE / INCOME GAP [ % ]
48.5¢/ $1
WAGE / INCOME GAP [ $ ]
0.33
INEQUALITY / GINI INDEX
7,219
TOTAL POPULATION
4,115
MALE POPULATION
3,104
FEMALE POPULATION
132.57
MALES / 100 FEMALES
75.43
FEMALES / 100 MALES
38.8
MEDIAN AGE
3.7
AVG FAMILY SIZE
3.2
AVG HOUSEHOLD SIZE
3,702
LABOR FORCE [ PEOPLE ]
67.4%
PERCENT IN LABOR FORCE
5.1%
UNEMPLOYMENT RATE
Winfield Area Codes
Income in Winfield
Income Overview in Winfield
Per Capita Income in Winfield is $42,226, while median incomes of families and households are $130,741 and $124,091 respectively.
| Characteristic | Number | Measure |
| Per Capita Income | 7,219 | $42,226 |
| Median Family Income | 1,720 | $130,741 |
| Mean Family Income | 1,720 | $140,884 |
| Median Household Income | 2,198 | $124,091 |
| Mean Household Income | 2,198 | $135,861 |
| Income Deficit | 1,720 | $0 |
| Wage / Income Gap (%) | 7,219 | 51.52% |
| Wage / Income Gap ($) | 7,219 | 48.48¢ per $1 |
| Gini / Inequality Index | 7,219 | 0.33 |
Earnings by Sex in Winfield
Average Earnings in Winfield are $54,787, $75,582 for men and $36,639 for women, a difference of 51.5%.
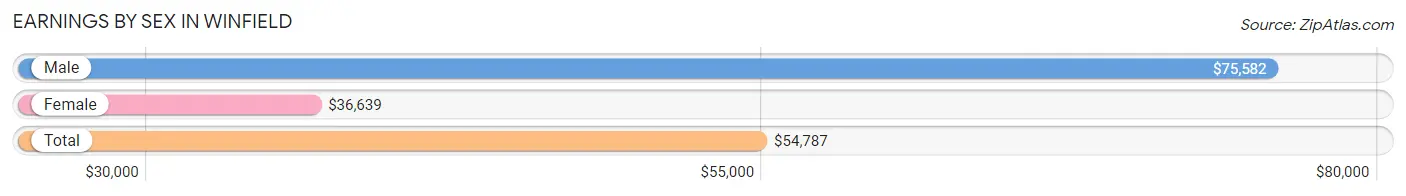
| Sex | Number | Average Earnings |
| Male | 2,037 (52.6%) | $75,582 |
| Female | 1,834 (47.4%) | $36,639 |
| Total | 3,871 (100.0%) | $54,787 |
Earnings by Sex by Income Bracket in Winfield
The most common earnings brackets in Winfield are $100,000+ for men (679 | 33.3%) and $100,000+ for women (212 | 11.6%).
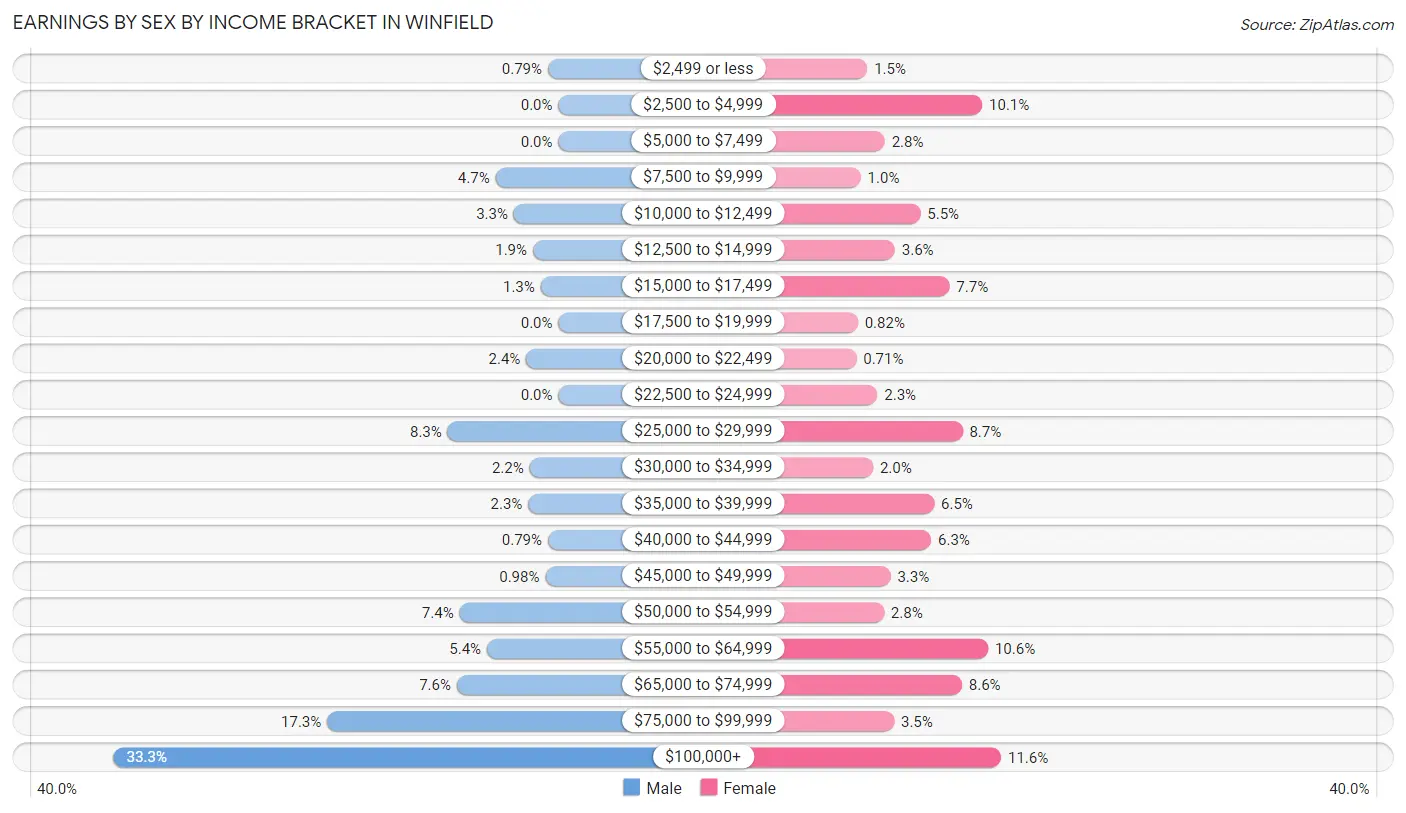
| Income | Male | Female |
| $2,499 or less | 16 (0.8%) | 28 (1.5%) |
| $2,500 to $4,999 | 0 (0.0%) | 186 (10.1%) |
| $5,000 to $7,499 | 0 (0.0%) | 52 (2.8%) |
| $7,500 to $9,999 | 96 (4.7%) | 19 (1.0%) |
| $10,000 to $12,499 | 68 (3.3%) | 101 (5.5%) |
| $12,500 to $14,999 | 39 (1.9%) | 66 (3.6%) |
| $15,000 to $17,499 | 27 (1.3%) | 141 (7.7%) |
| $17,500 to $19,999 | 0 (0.0%) | 15 (0.8%) |
| $20,000 to $22,499 | 49 (2.4%) | 13 (0.7%) |
| $22,500 to $24,999 | 0 (0.0%) | 42 (2.3%) |
| $25,000 to $29,999 | 169 (8.3%) | 159 (8.7%) |
| $30,000 to $34,999 | 44 (2.2%) | 36 (2.0%) |
| $35,000 to $39,999 | 46 (2.3%) | 120 (6.5%) |
| $40,000 to $44,999 | 16 (0.8%) | 116 (6.3%) |
| $45,000 to $49,999 | 20 (1.0%) | 60 (3.3%) |
| $50,000 to $54,999 | 151 (7.4%) | 51 (2.8%) |
| $55,000 to $64,999 | 109 (5.3%) | 194 (10.6%) |
| $65,000 to $74,999 | 155 (7.6%) | 158 (8.6%) |
| $75,000 to $99,999 | 353 (17.3%) | 65 (3.5%) |
| $100,000+ | 679 (33.3%) | 212 (11.6%) |
| Total | 2,037 (100.0%) | 1,834 (100.0%) |
Earnings by Sex by Educational Attainment in Winfield
Average earnings in Winfield are $82,462 for men and $41,130 for women, a difference of 50.1%. Men with an educational attainment of graduate degree enjoy the highest average annual earnings of $112,948, while those with high school diploma education earn the least with $56,609. Women with an educational attainment of bachelor's degree earn the most with the average annual earnings of $61,685, while those with high school diploma education have the smallest earnings of $13,622.
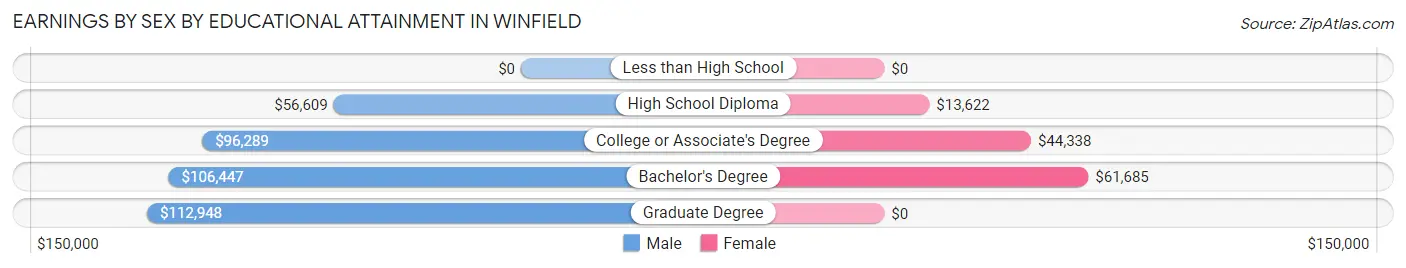
| Educational Attainment | Male Income | Female Income |
| Less than High School | - | - |
| High School Diploma | $56,609 | $13,622 |
| College or Associate's Degree | $96,289 | $44,338 |
| Bachelor's Degree | $106,447 | $61,685 |
| Graduate Degree | $112,948 | $0 |
| Total | $82,462 | $41,130 |
Family Income in Winfield
Family Income Brackets in Winfield
According to the Winfield family income data, there are 710 families falling into the $100,000 to $149,999 income range, which is the most common income bracket and makes up 41.3% of all families.
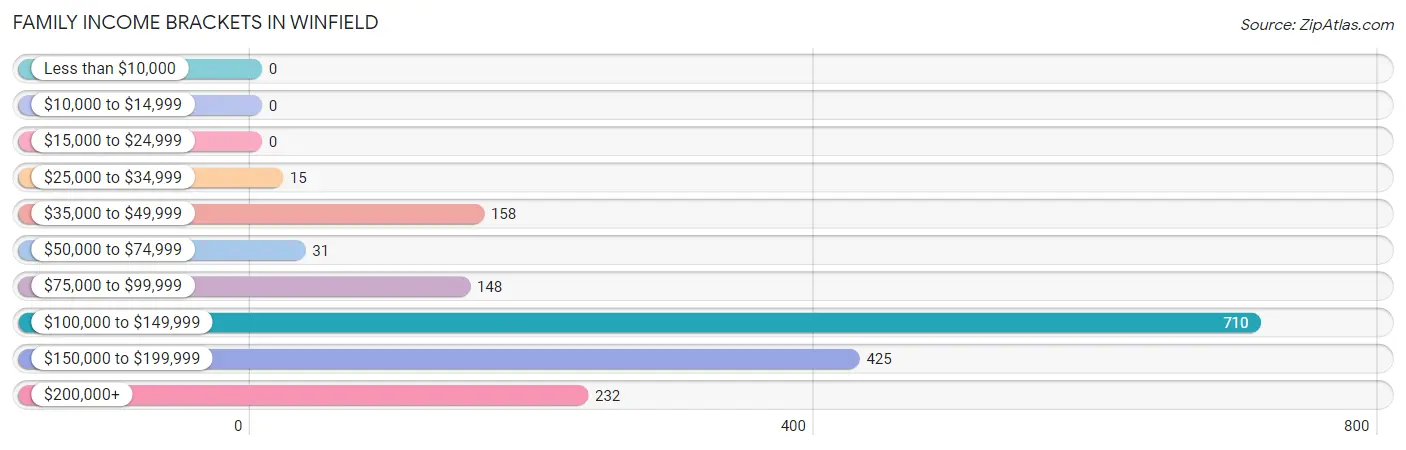
| Income Bracket | # Families | % Families |
| Less than $10,000 | 0 | 0.0% |
| $10,000 to $14,999 | 0 | 0.0% |
| $15,000 to $24,999 | 0 | 0.0% |
| $25,000 to $34,999 | 15 | 0.9% |
| $35,000 to $49,999 | 158 | 9.2% |
| $50,000 to $74,999 | 31 | 1.8% |
| $75,000 to $99,999 | 148 | 8.6% |
| $100,000 to $149,999 | 710 | 41.3% |
| $150,000 to $199,999 | 425 | 24.7% |
| $200,000+ | 232 | 13.5% |
Family Income by Famaliy Size in Winfield
3-person families (461 | 26.8%) account for the highest median family income in Winfield with $162,545 per family, while 3-person families (461 | 26.8%) have the highest median income of $54,182 per family member.
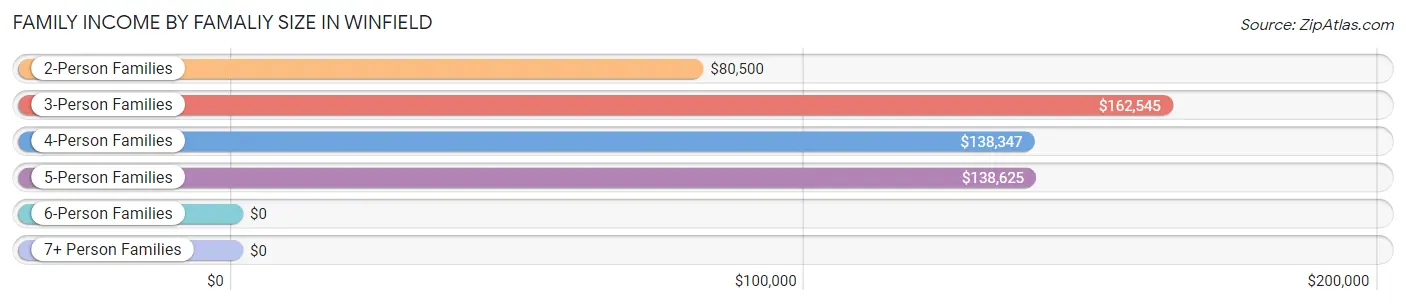
| Income Bracket | # Families | Median Income |
| 2-Person Families | 416 (24.2%) | $80,500 |
| 3-Person Families | 461 (26.8%) | $162,545 |
| 4-Person Families | 527 (30.6%) | $138,347 |
| 5-Person Families | 240 (14.0%) | $138,625 |
| 6-Person Families | 76 (4.4%) | $0 |
| 7+ Person Families | 0 (0.0%) | $0 |
| Total | 1,720 (100.0%) | $130,741 |
Family Income by Number of Earners in Winfield
The median family income in Winfield is $130,741, with families comprising 2 earners (1,036) having the highest median family income of $154,318, while families with no earners (134) have the lowest median family income of $62,895, accounting for 60.2% and 7.8% of families, respectively.
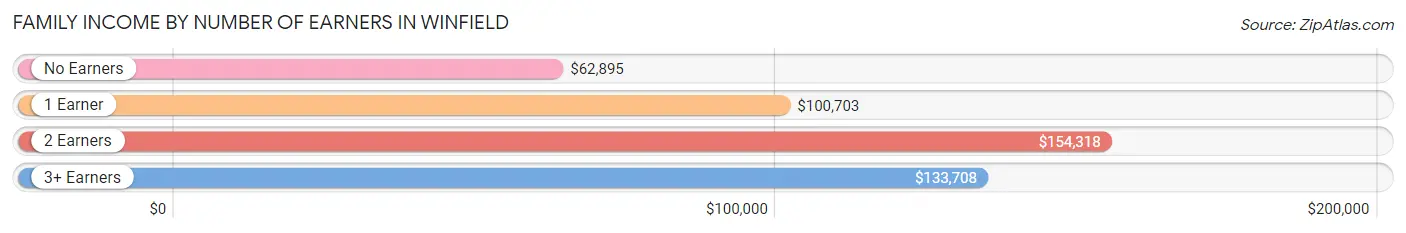
| Number of Earners | # Families | Median Income |
| No Earners | 134 (7.8%) | $62,895 |
| 1 Earner | 275 (16.0%) | $100,703 |
| 2 Earners | 1,036 (60.2%) | $154,318 |
| 3+ Earners | 275 (16.0%) | $133,708 |
| Total | 1,720 (100.0%) | $130,741 |
Household Income in Winfield
Household Income Brackets in Winfield
With 721 households falling in the category, the $100,000 to $149,999 income range is the most frequent in Winfield, accounting for 32.8% of all households. In contrast, only 18 households (0.8%) fall into the $15,000 to $24,999 income bracket, making it the least populous group.
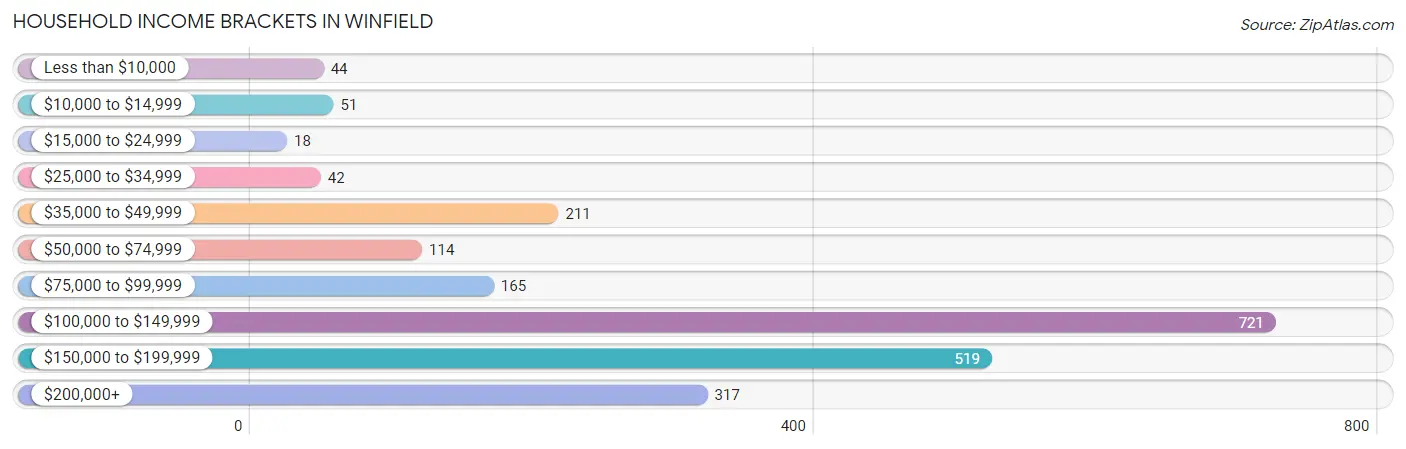
| Income Bracket | # Households | % Households |
| Less than $10,000 | 44 | 2.0% |
| $10,000 to $14,999 | 51 | 2.3% |
| $15,000 to $24,999 | 18 | 0.8% |
| $25,000 to $34,999 | 42 | 1.9% |
| $35,000 to $49,999 | 211 | 9.6% |
| $50,000 to $74,999 | 114 | 5.2% |
| $75,000 to $99,999 | 165 | 7.5% |
| $100,000 to $149,999 | 721 | 32.8% |
| $150,000 to $199,999 | 519 | 23.6% |
| $200,000+ | 317 | 14.4% |
Household Income by Householder Age in Winfield
The median household income in Winfield is $124,091, with the highest median household income of $153,864 found in the 45 to 64 years age bracket for the primary householder. A total of 1,128 households (51.3%) fall into this category.
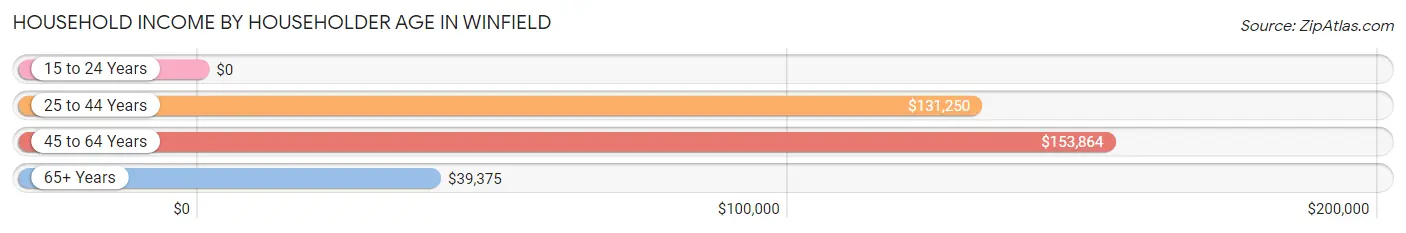
| Income Bracket | # Households | Median Income |
| 15 to 24 Years | 0 (0.0%) | $0 |
| 25 to 44 Years | 572 (26.0%) | $131,250 |
| 45 to 64 Years | 1,128 (51.3%) | $153,864 |
| 65+ Years | 498 (22.7%) | $39,375 |
| Total | 2,198 (100.0%) | $124,091 |
Poverty in Winfield
Income Below Poverty by Sex and Age in Winfield
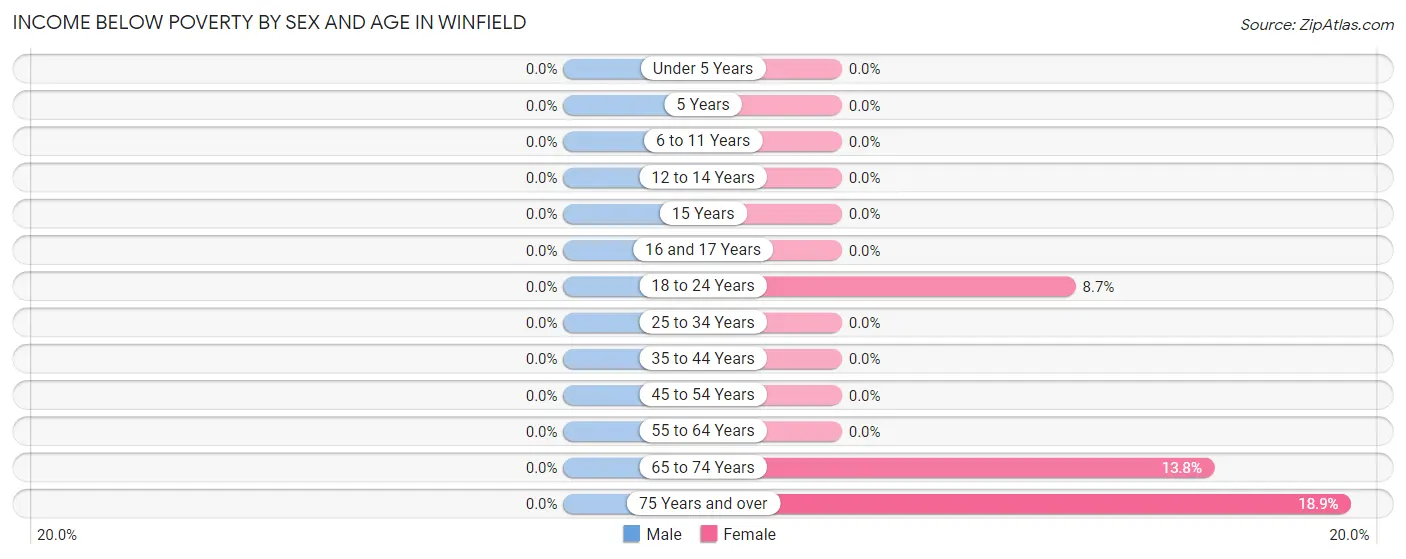
| Age Bracket | Male | Female |
| Under 5 Years | 0 (0.0%) | 0 (0.0%) |
| 5 Years | 0 (0.0%) | 0 (0.0%) |
| 6 to 11 Years | 0 (0.0%) | 0 (0.0%) |
| 12 to 14 Years | 0 (0.0%) | 0 (0.0%) |
| 15 Years | 0 (0.0%) | 0 (0.0%) |
| 16 and 17 Years | 0 (0.0%) | 0 (0.0%) |
| 18 to 24 Years | 0 (0.0%) | 19 (8.7%) |
| 25 to 34 Years | 0 (0.0%) | 0 (0.0%) |
| 35 to 44 Years | 0 (0.0%) | 0 (0.0%) |
| 45 to 54 Years | 0 (0.0%) | 0 (0.0%) |
| 55 to 64 Years | 0 (0.0%) | 0 (0.0%) |
| 65 to 74 Years | 0 (0.0%) | 25 (13.8%) |
| 75 Years and over | 0 (0.0%) | 94 (18.9%) |
| Total | 0 (0.0%) | 138 (4.6%) |
Income Above Poverty by Sex and Age in Winfield
According to the poverty statistics in Winfield, males aged under 5 years and females aged under 5 years are the age groups that are most secure financially, with 100.0% of males and 100.0% of females in these age groups living above the poverty line.
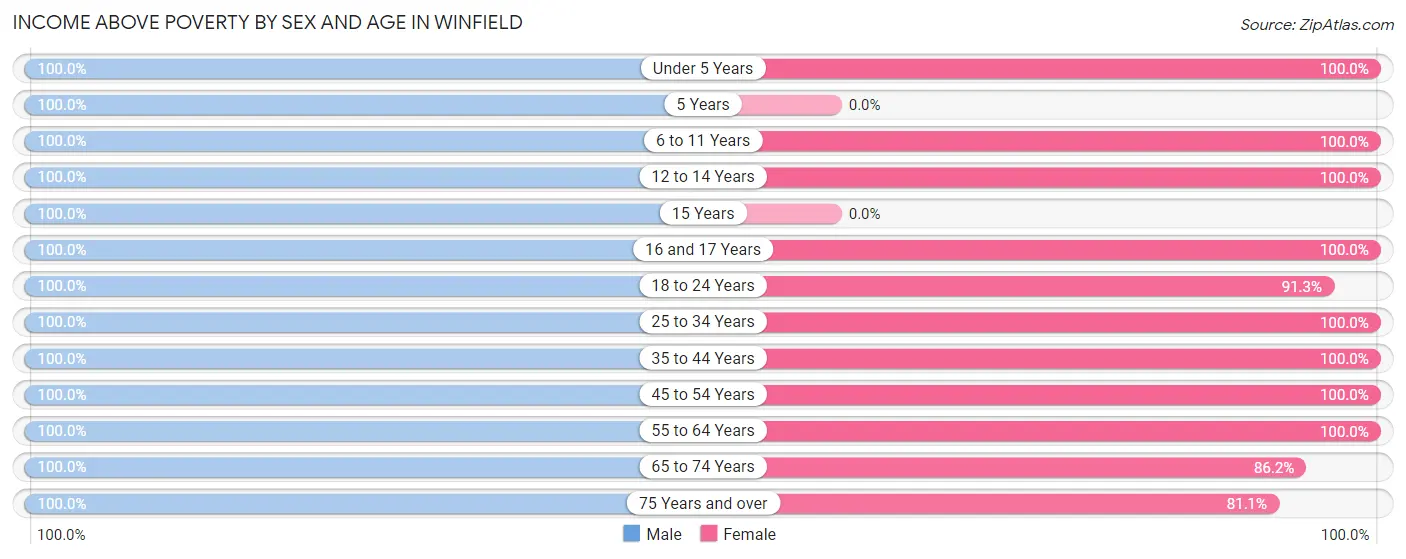
| Age Bracket | Male | Female |
| Under 5 Years | 332 (100.0%) | 50 (100.0%) |
| 5 Years | 43 (100.0%) | 0 (0.0%) |
| 6 to 11 Years | 555 (100.0%) | 118 (100.0%) |
| 12 to 14 Years | 321 (100.0%) | 118 (100.0%) |
| 15 Years | 190 (100.0%) | 0 (0.0%) |
| 16 and 17 Years | 118 (100.0%) | 84 (100.0%) |
| 18 to 24 Years | 396 (100.0%) | 200 (91.3%) |
| 25 to 34 Years | 438 (100.0%) | 314 (100.0%) |
| 35 to 44 Years | 364 (100.0%) | 420 (100.0%) |
| 45 to 54 Years | 639 (100.0%) | 688 (100.0%) |
| 55 to 64 Years | 366 (100.0%) | 338 (100.0%) |
| 65 to 74 Years | 166 (100.0%) | 156 (86.2%) |
| 75 Years and over | 142 (100.0%) | 404 (81.1%) |
| Total | 4,070 (100.0%) | 2,890 (95.4%) |
Income Below Poverty Among Married-Couple Families in Winfield
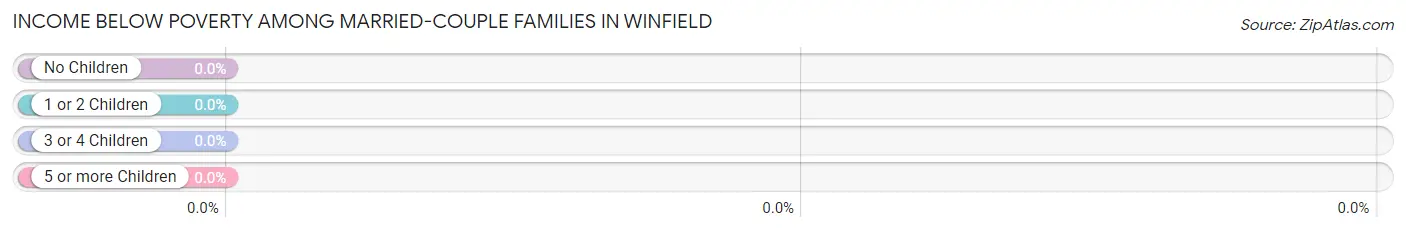
| Children | Above Poverty | Below Poverty |
| No Children | 617 (100.0%) | 0 (0.0%) |
| 1 or 2 Children | 697 (100.0%) | 0 (0.0%) |
| 3 or 4 Children | 204 (100.0%) | 0 (0.0%) |
| 5 or more Children | 0 (0.0%) | 0 (0.0%) |
| Total | 1,518 (100.0%) | 0 (0.0%) |
Income Below Poverty Among Single-Parent Households in Winfield
| Children | Single Father | Single Mother |
| No Children | 0 (0.0%) | 0 (0.0%) |
| 1 or 2 Children | 0 (0.0%) | 0 (0.0%) |
| 3 or 4 Children | 0 (0.0%) | 0 (0.0%) |
| 5 or more Children | 0 (0.0%) | 0 (0.0%) |
| Total | 0 (0.0%) | 0 (0.0%) |
Income Below Poverty Among Married-Couple vs Single-Parent Households in Winfield
| Children | Married-Couple Families | Single-Parent Households |
| No Children | 0 (0.0%) | 0 (0.0%) |
| 1 or 2 Children | 0 (0.0%) | 0 (0.0%) |
| 3 or 4 Children | 0 (0.0%) | 0 (0.0%) |
| 5 or more Children | 0 (0.0%) | 0 (0.0%) |
| Total | 0 (0.0%) | 0 (0.0%) |
Race in Winfield
The most populous races in Winfield are White / Caucasian (6,267 | 86.8%), Two or more Races (656 | 9.1%), and Hispanic or Latino (585 | 8.1%).
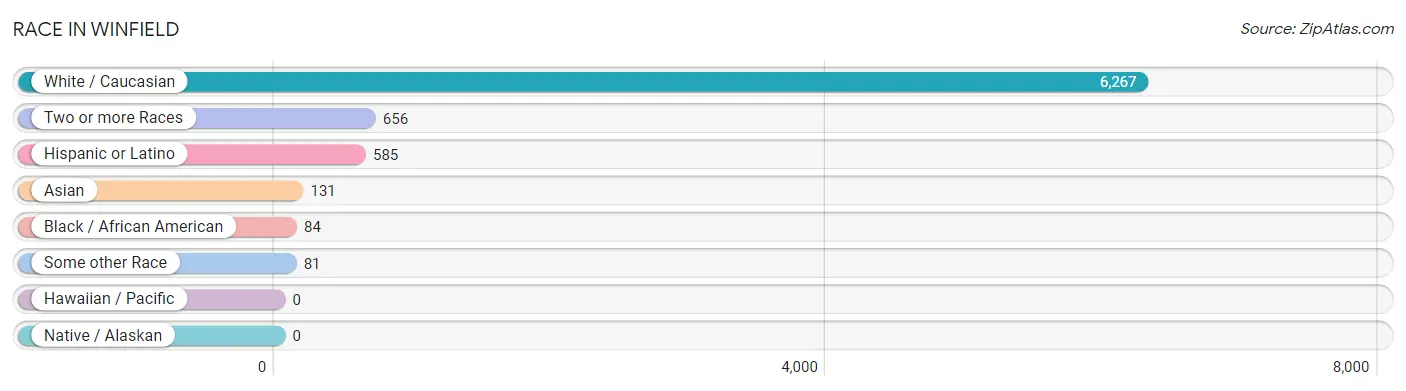
| Race | # Population | % Population |
| Asian | 131 | 1.8% |
| Black / African American | 84 | 1.2% |
| Hawaiian / Pacific | 0 | 0.0% |
| Hispanic or Latino | 585 | 8.1% |
| Native / Alaskan | 0 | 0.0% |
| White / Caucasian | 6,267 | 86.8% |
| Two or more Races | 656 | 9.1% |
| Some other Race | 81 | 1.1% |
| Total | 7,219 | 100.0% |
Ancestry in Winfield
The most populous ancestries reported in Winfield are German (1,549 | 21.5%), Polish (1,335 | 18.5%), Irish (801 | 11.1%), Italian (603 | 8.4%), and Dutch (384 | 5.3%), together accounting for 64.7% of all Winfield residents.
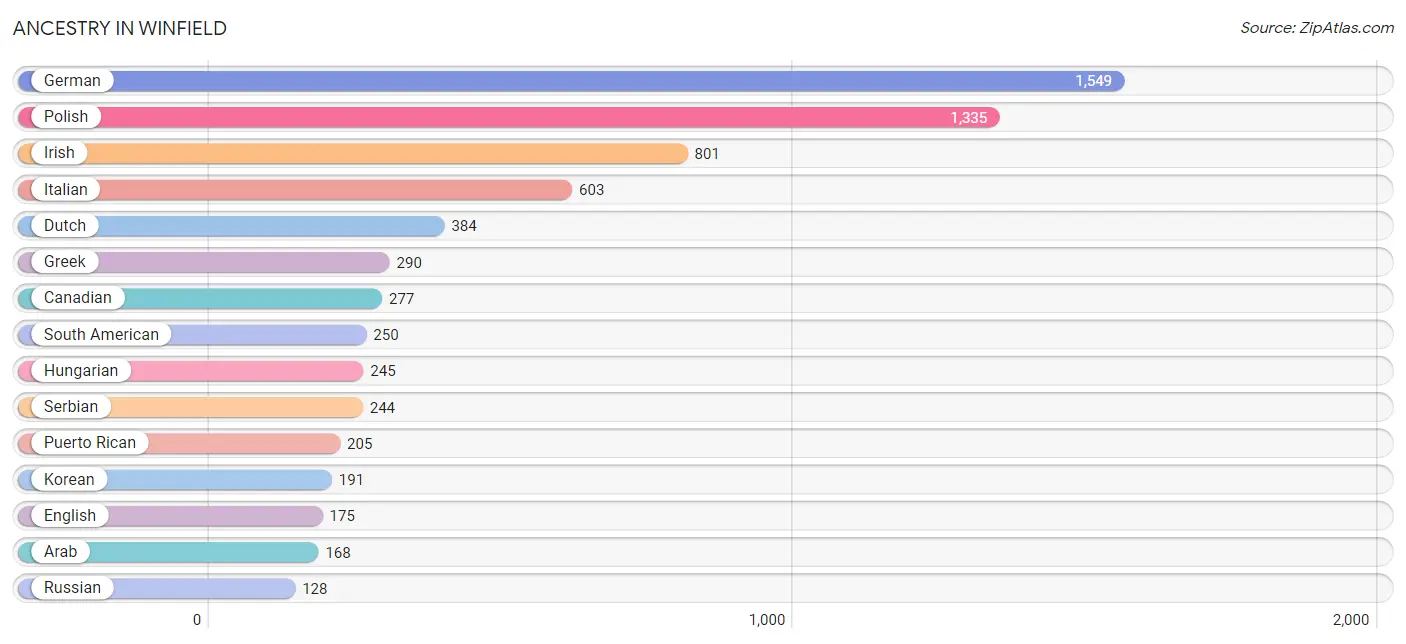
| Ancestry | # Population | % Population |
| American | 100 | 1.4% |
| Arab | 168 | 2.3% |
| Argentinean | 92 | 1.3% |
| British | 124 | 1.7% |
| Burmese | 42 | 0.6% |
| Canadian | 277 | 3.8% |
| Cherokee | 27 | 0.4% |
| Chilean | 80 | 1.1% |
| Croatian | 56 | 0.8% |
| Czech | 50 | 0.7% |
| Dutch | 384 | 5.3% |
| English | 175 | 2.4% |
| French | 47 | 0.6% |
| German | 1,549 | 21.5% |
| Greek | 290 | 4.0% |
| Hungarian | 245 | 3.4% |
| Irish | 801 | 11.1% |
| Italian | 603 | 8.4% |
| Jordanian | 86 | 1.2% |
| Korean | 191 | 2.6% |
| Lebanese | 82 | 1.1% |
| Macedonian | 122 | 1.7% |
| Mexican | 109 | 1.5% |
| Polish | 1,335 | 18.5% |
| Puerto Rican | 205 | 2.8% |
| Romanian | 30 | 0.4% |
| Russian | 128 | 1.8% |
| Scandinavian | 16 | 0.2% |
| Scotch-Irish | 41 | 0.6% |
| Scottish | 20 | 0.3% |
| Serbian | 244 | 3.4% |
| Slovak | 121 | 1.7% |
| South American | 250 | 3.5% |
| Spanish | 21 | 0.3% |
| Swedish | 39 | 0.5% |
| Ukrainian | 20 | 0.3% |
| Uruguayan | 78 | 1.1% |
| Welsh | 114 | 1.6% | View All 38 Rows |
Immigrants in Winfield
The most numerous immigrant groups reported in Winfield came from Europe (184 | 2.5%), Canada (178 | 2.5%), Asia (160 | 2.2%), Eastern Europe (146 | 2.0%), and Argentina (92 | 1.3%), together accounting for 10.5% of all Winfield residents.
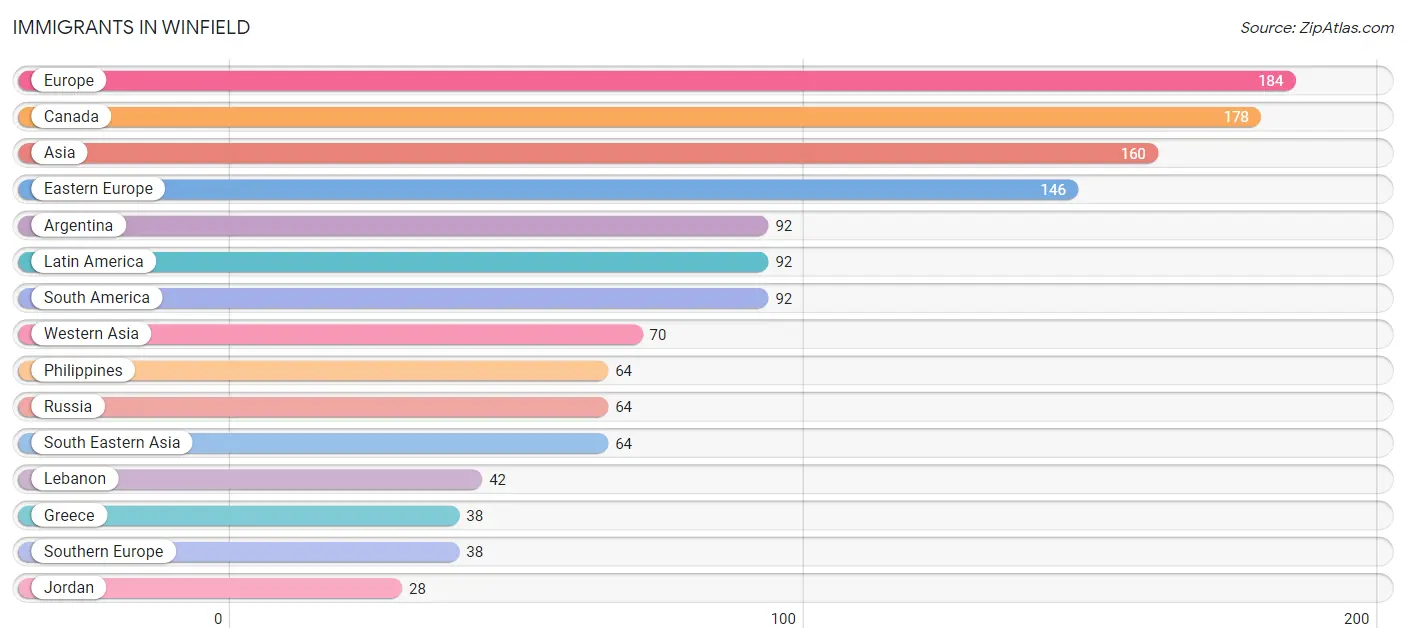
| Immigration Origin | # Population | % Population |
| Argentina | 92 | 1.3% |
| Asia | 160 | 2.2% |
| Canada | 178 | 2.5% |
| Eastern Asia | 26 | 0.4% |
| Eastern Europe | 146 | 2.0% |
| Europe | 184 | 2.5% |
| Greece | 38 | 0.5% |
| Jordan | 28 | 0.4% |
| Korea | 26 | 0.4% |
| Latin America | 92 | 1.3% |
| Lebanon | 42 | 0.6% |
| Philippines | 64 | 0.9% |
| Russia | 64 | 0.9% |
| South America | 92 | 1.3% |
| South Eastern Asia | 64 | 0.9% |
| Southern Europe | 38 | 0.5% |
| Western Asia | 70 | 1.0% | View All 17 Rows |
Sex and Age in Winfield
Sex and Age in Winfield
The most populous age groups in Winfield are 10 to 14 Years (496 | 12.0%) for men and 45 to 49 Years (406 | 13.1%) for women.
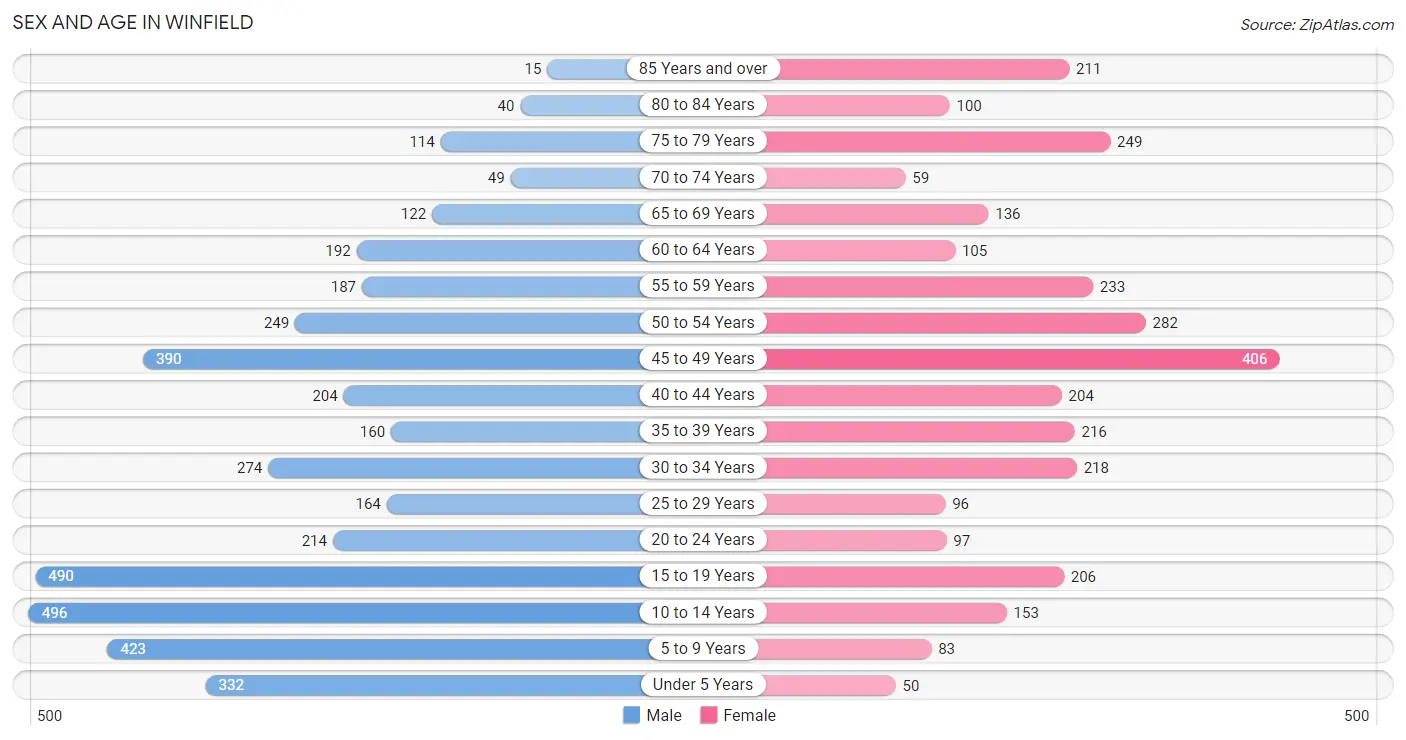
| Age Bracket | Male | Female |
| Under 5 Years | 332 (8.1%) | 50 (1.6%) |
| 5 to 9 Years | 423 (10.3%) | 83 (2.7%) |
| 10 to 14 Years | 496 (12.0%) | 153 (4.9%) |
| 15 to 19 Years | 490 (11.9%) | 206 (6.6%) |
| 20 to 24 Years | 214 (5.2%) | 97 (3.1%) |
| 25 to 29 Years | 164 (4.0%) | 96 (3.1%) |
| 30 to 34 Years | 274 (6.7%) | 218 (7.0%) |
| 35 to 39 Years | 160 (3.9%) | 216 (7.0%) |
| 40 to 44 Years | 204 (5.0%) | 204 (6.6%) |
| 45 to 49 Years | 390 (9.5%) | 406 (13.1%) |
| 50 to 54 Years | 249 (6.0%) | 282 (9.1%) |
| 55 to 59 Years | 187 (4.5%) | 233 (7.5%) |
| 60 to 64 Years | 192 (4.7%) | 105 (3.4%) |
| 65 to 69 Years | 122 (3.0%) | 136 (4.4%) |
| 70 to 74 Years | 49 (1.2%) | 59 (1.9%) |
| 75 to 79 Years | 114 (2.8%) | 249 (8.0%) |
| 80 to 84 Years | 40 (1.0%) | 100 (3.2%) |
| 85 Years and over | 15 (0.4%) | 211 (6.8%) |
| Total | 4,115 (100.0%) | 3,104 (100.0%) |
Families and Households in Winfield
Median Family Size in Winfield
The median family size in Winfield is 3.68 persons per family, with single male/father families (6 | 0.4%) accounting for the largest median family size of 8.67 persons per family. On the other hand, single female/mother families (196 | 11.4%) represent the smallest median family size with 2.61 persons per family.
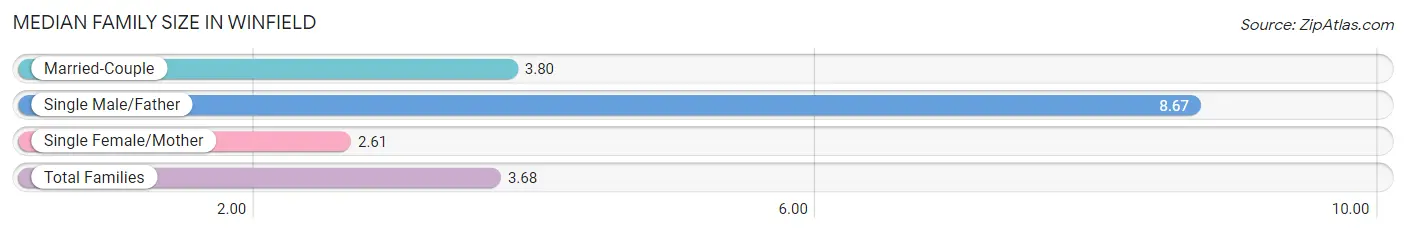
| Family Type | # Families | Family Size |
| Married-Couple | 1,518 (88.3%) | 3.80 |
| Single Male/Father | 6 (0.4%) | 8.67 |
| Single Female/Mother | 196 (11.4%) | 2.61 |
| Total Families | 1,720 (100.0%) | 3.68 |
Median Household Size in Winfield
The median household size in Winfield is 3.23 persons per household, with single male/father households (6 | 0.3%) accounting for the largest median household size of 12.17 persons per household. non-family households (478 | 21.7%) represent the smallest median household size with 1.25 persons per household.
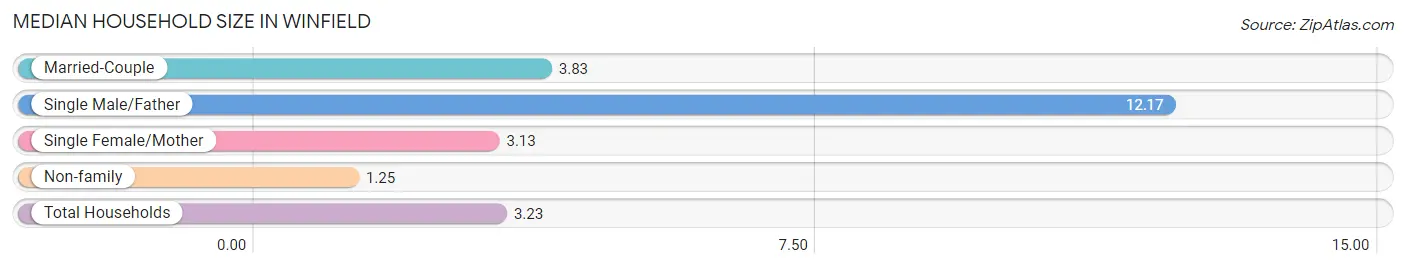
| Household Type | # Households | Household Size |
| Married-Couple | 1,518 (69.1%) | 3.83 |
| Single Male/Father | 6 (0.3%) | 12.17 |
| Single Female/Mother | 196 (8.9%) | 3.13 |
| Non-family | 478 (21.7%) | 1.25 |
| Total Households | 2,198 (100.0%) | 3.23 |
Household Size by Marriage Status in Winfield
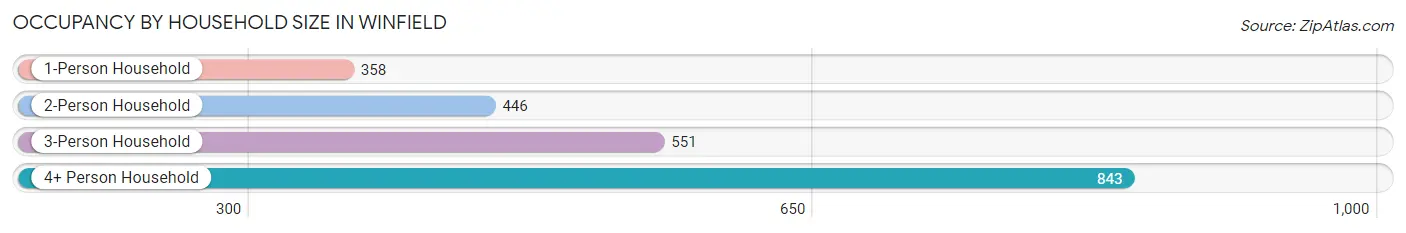
Out of a total of 2,198 households in Winfield, 1,720 (78.2%) are family households, while 478 (21.7%) are nonfamily households. The most numerous type of family households are 3-person households, comprising 551, and the most common type of nonfamily households are 1-person households, comprising 358.
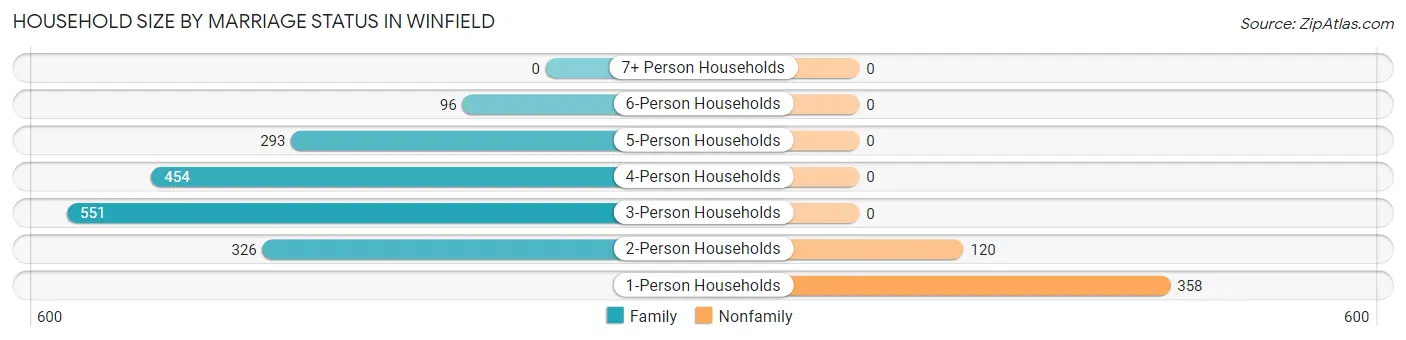
| Household Size | Family Households | Nonfamily Households |
| 1-Person Households | - | 358 (16.3%) |
| 2-Person Households | 326 (14.8%) | 120 (5.5%) |
| 3-Person Households | 551 (25.1%) | 0 (0.0%) |
| 4-Person Households | 454 (20.7%) | 0 (0.0%) |
| 5-Person Households | 293 (13.3%) | 0 (0.0%) |
| 6-Person Households | 96 (4.4%) | 0 (0.0%) |
| 7+ Person Households | 0 (0.0%) | 0 (0.0%) |
| Total | 1,720 (78.2%) | 478 (21.7%) |
Female Fertility in Winfield
Fertility by Age in Winfield
Average fertility rate in Winfield is 95.0 births per 1,000 women. Women in the age bracket of 20 to 34 years have the highest fertility rate with 263.0 births per 1,000 women. Women in the age bracket of 20 to 34 years acount for 74.0% of all women with births.
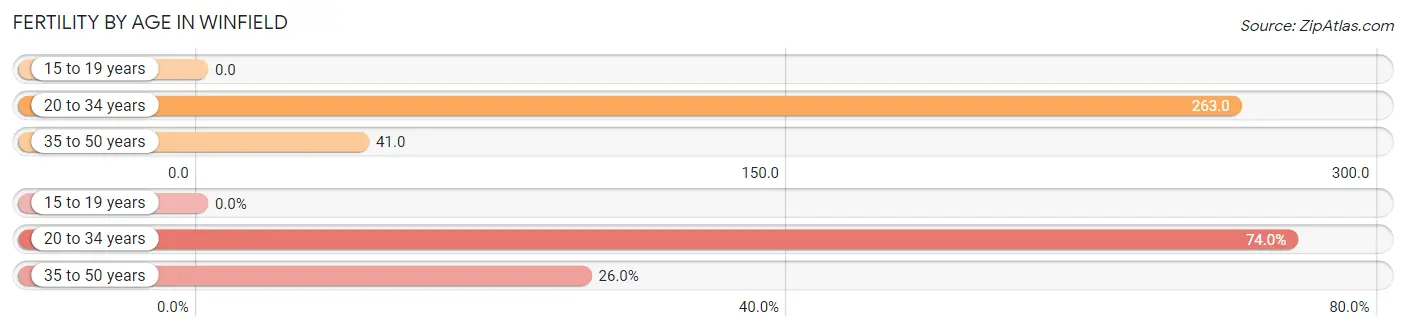
| Age Bracket | Women with Births | Births / 1,000 Women |
| 15 to 19 years | 0 (0.0%) | 0.0 |
| 20 to 34 years | 108 (74.0%) | 263.0 |
| 35 to 50 years | 38 (26.0%) | 41.0 |
| Total | 146 (100.0%) | 95.0 |
Fertility by Age by Marriage Status in Winfield
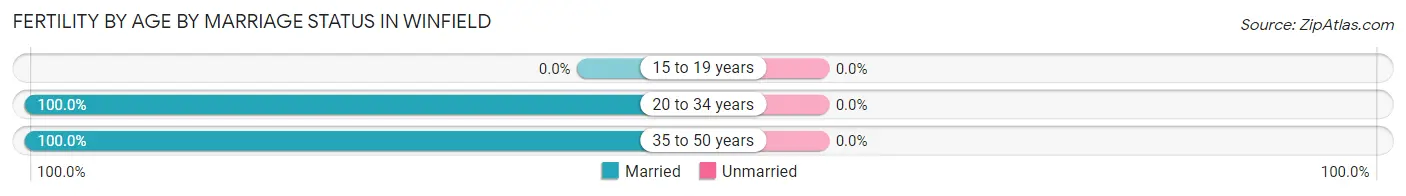
| Age Bracket | Married | Unmarried |
| 15 to 19 years | 0 (0.0%) | 0 (0.0%) |
| 20 to 34 years | 108 (100.0%) | 0 (0.0%) |
| 35 to 50 years | 38 (100.0%) | 0 (0.0%) |
| Total | 146 (100.0%) | 0 (0.0%) |
Fertility by Education in Winfield
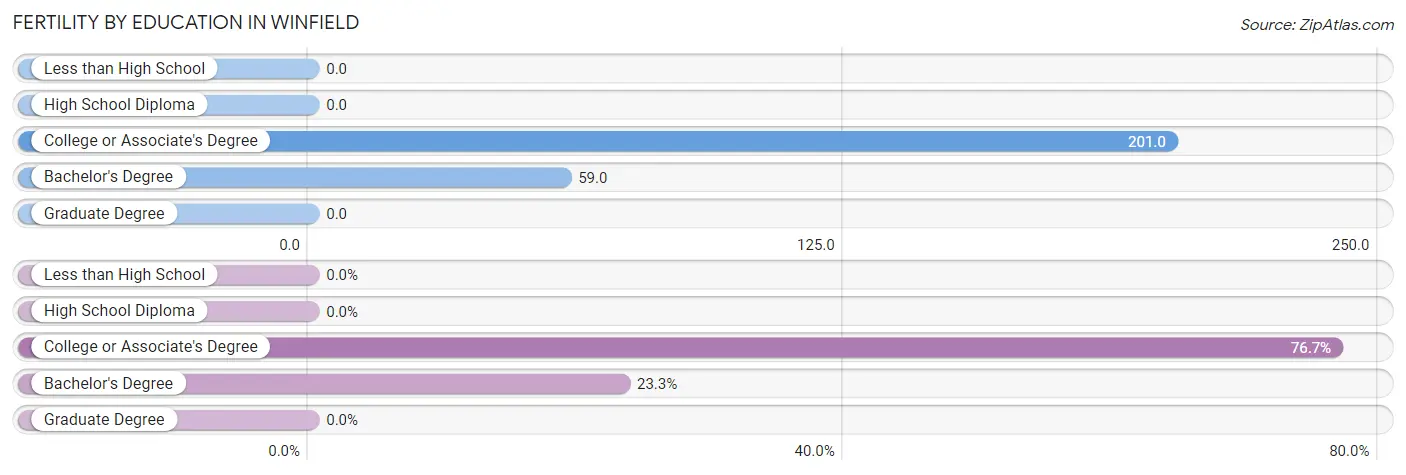
| Educational Attainment | Women with Births | Births / 1,000 Women |
| Less than High School | 0 (0.0%) | 0.0 |
| High School Diploma | 0 (0.0%) | 0.0 |
| College or Associate's Degree | 112 (76.7%) | 201.0 |
| Bachelor's Degree | 34 (23.3%) | 59.0 |
| Graduate Degree | 0 (0.0%) | 0.0 |
| Total | 146 (100.0%) | 95.0 |
Fertility by Education by Marriage Status in Winfield
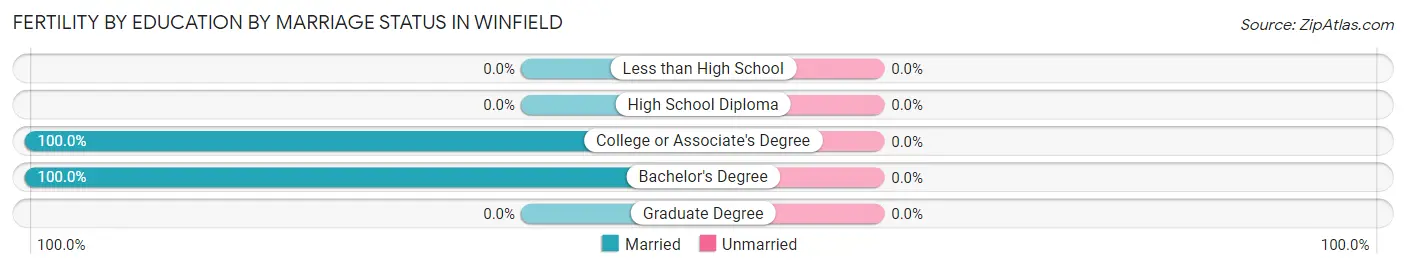
| Educational Attainment | Married | Unmarried |
| Less than High School | 0 (0.0%) | 0 (0.0%) |
| High School Diploma | 0 (0.0%) | 0 (0.0%) |
| College or Associate's Degree | 112 (100.0%) | 0 (0.0%) |
| Bachelor's Degree | 34 (100.0%) | 0 (0.0%) |
| Graduate Degree | 0 (0.0%) | 0 (0.0%) |
| Total | 146 (100.0%) | 0 (0.0%) |
Employment Characteristics in Winfield
Employment by Class of Employer in Winfield
Among the 3,453 employed individuals in Winfield, private company employees (2,266 | 65.6%), not-for-profit organizations (643 | 18.6%), and self-employed (incorporated) (257 | 7.4%) make up the most common classes of employment.
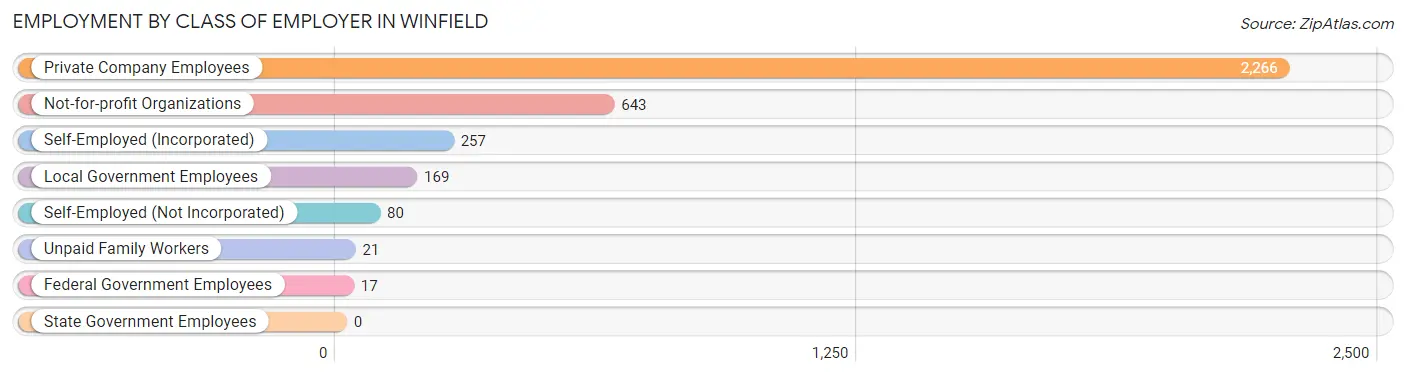
| Employer Class | # Employees | % Employees |
| Private Company Employees | 2,266 | 65.6% |
| Self-Employed (Incorporated) | 257 | 7.4% |
| Self-Employed (Not Incorporated) | 80 | 2.3% |
| Not-for-profit Organizations | 643 | 18.6% |
| Local Government Employees | 169 | 4.9% |
| State Government Employees | 0 | 0.0% |
| Federal Government Employees | 17 | 0.5% |
| Unpaid Family Workers | 21 | 0.6% |
| Total | 3,453 | 100.0% |
Employment Status by Age in Winfield
According to the labor force statistics for Winfield, out of the total population over 16 years of age (5,492), 67.4% or 3,702 individuals are in the labor force, with 5.1% or 189 of them unemployed. The age group with the highest labor force participation rate is 35 to 44 years, with 95.9% or 752 individuals in the labor force. Within the labor force, the 25 to 29 years age range has the highest percentage of unemployed individuals, with 48.0% or 85 of them being unemployed.
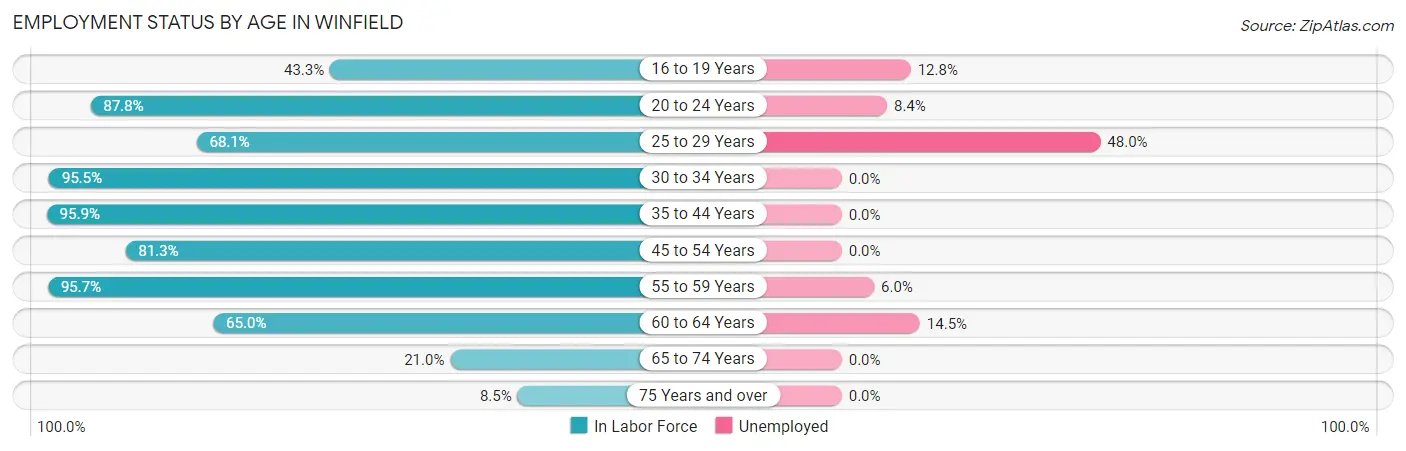
| Age Bracket | In Labor Force | Unemployed |
| 16 to 19 Years | 219 (43.3%) | 28 (12.8%) |
| 20 to 24 Years | 273 (87.8%) | 23 (8.4%) |
| 25 to 29 Years | 177 (68.1%) | 85 (48.0%) |
| 30 to 34 Years | 470 (95.5%) | 0 (0.0%) |
| 35 to 44 Years | 752 (95.9%) | 0 (0.0%) |
| 45 to 54 Years | 1,079 (81.3%) | 0 (0.0%) |
| 55 to 59 Years | 402 (95.7%) | 24 (6.0%) |
| 60 to 64 Years | 193 (65.0%) | 28 (14.5%) |
| 65 to 74 Years | 77 (21.0%) | 0 (0.0%) |
| 75 Years and over | 62 (8.5%) | 0 (0.0%) |
| Total | 3,702 (67.4%) | 189 (5.1%) |
Employment Status by Educational Attainment in Winfield
According to labor force statistics for Winfield, 85.8% of individuals (3,072) out of the total population between 25 and 64 years of age (3,580) are in the labor force, with 4.5% or 138 of them being unemployed. The group with the highest labor force participation rate are those with the educational attainment of less than high school, with 100.0% or 111 individuals in the labor force. Within the labor force, individuals with less than high school education have the highest percentage of unemployment, with 76.6% or 85 of them being unemployed.
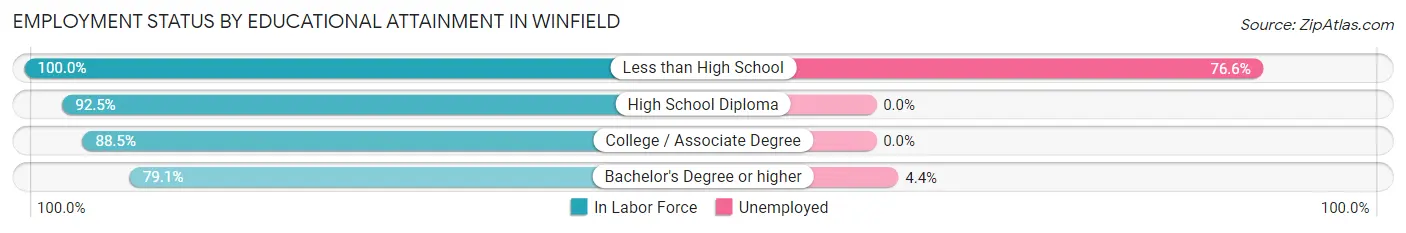
| Educational Attainment | In Labor Force | Unemployed |
| Less than High School | 111 (100.0%) | 85 (76.6%) |
| High School Diploma | 748 (92.5%) | 0 (0.0%) |
| College / Associate Degree | 1,030 (88.5%) | 0 (0.0%) |
| Bachelor's Degree or higher | 1,183 (79.1%) | 66 (4.4%) |
| Total | 3,072 (85.8%) | 161 (4.5%) |
Employment Occupations by Sex in Winfield
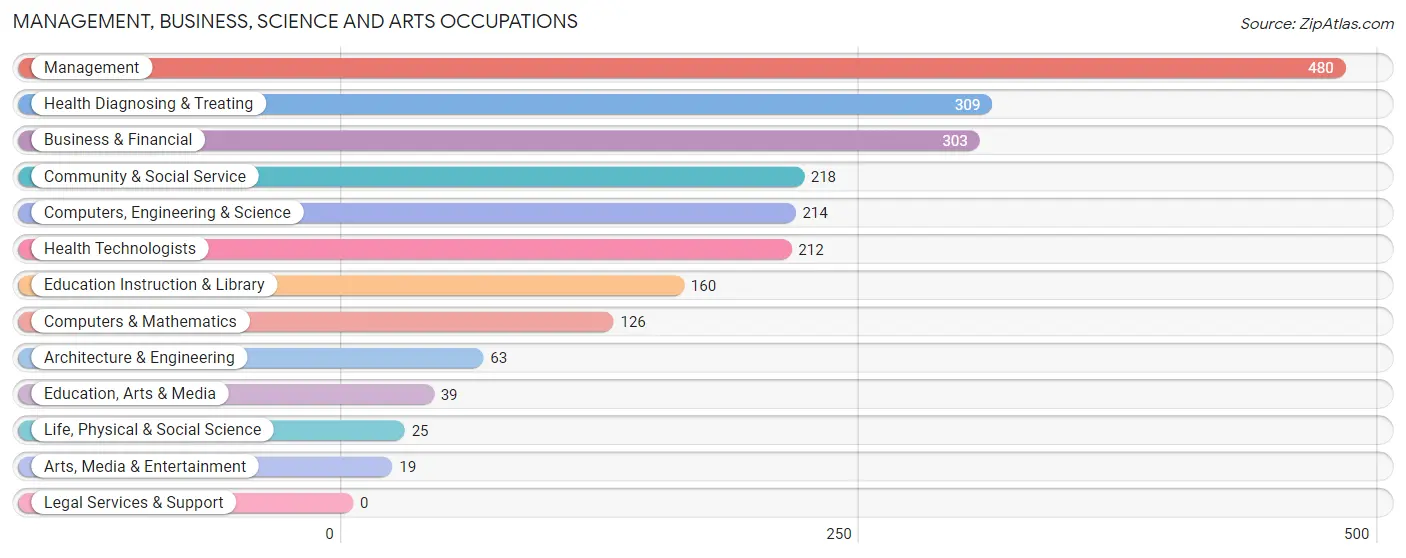
Management, Business, Science and Arts Occupations
The most common Management, Business, Science and Arts occupations in Winfield are Management (480 | 13.7%), Health Diagnosing & Treating (309 | 8.8%), Business & Financial (303 | 8.6%), Community & Social Service (218 | 6.2%), and Computers, Engineering & Science (214 | 6.1%).
Management, Business, Science and Arts Occupations by Sex
Within the Management, Business, Science and Arts occupations in Winfield, the most male-oriented occupations are Architecture & Engineering (100.0%), Education, Arts & Media (100.0%), and Business & Financial (75.2%), while the most female-oriented occupations are Life, Physical & Social Science (100.0%), Education Instruction & Library (100.0%), and Arts, Media & Entertainment (100.0%).
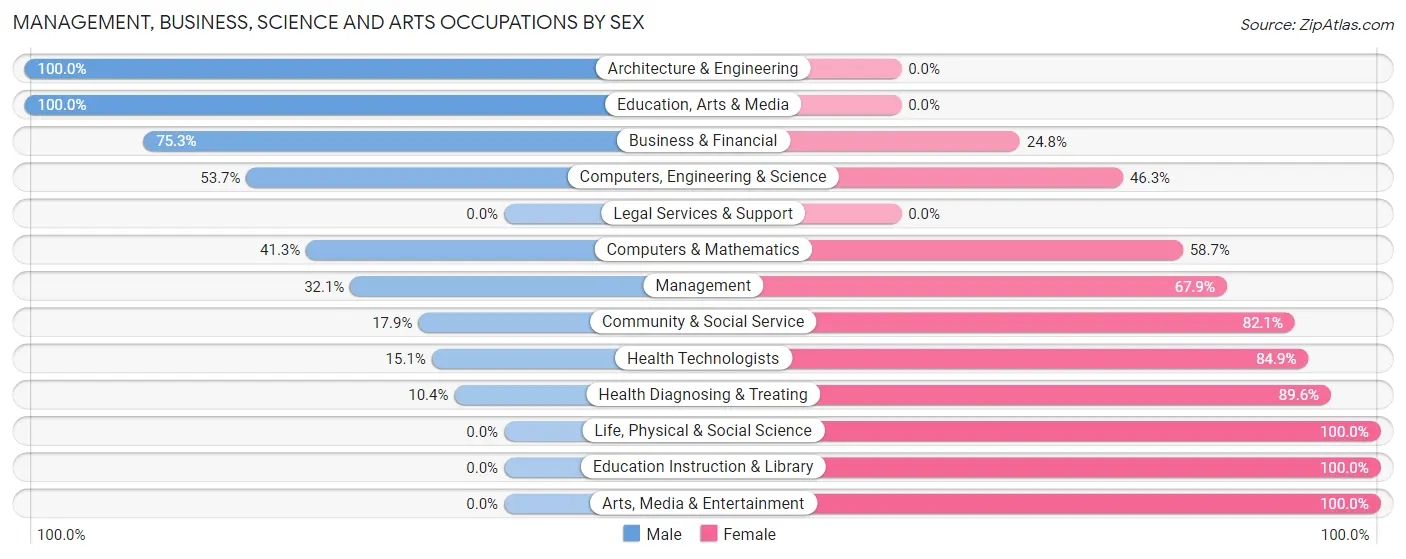
| Occupation | Male | Female |
| Management | 154 (32.1%) | 326 (67.9%) |
| Business & Financial | 228 (75.2%) | 75 (24.7%) |
| Computers, Engineering & Science | 115 (53.7%) | 99 (46.3%) |
| Computers & Mathematics | 52 (41.3%) | 74 (58.7%) |
| Architecture & Engineering | 63 (100.0%) | 0 (0.0%) |
| Life, Physical & Social Science | 0 (0.0%) | 25 (100.0%) |
| Community & Social Service | 39 (17.9%) | 179 (82.1%) |
| Education, Arts & Media | 39 (100.0%) | 0 (0.0%) |
| Legal Services & Support | 0 (0.0%) | 0 (0.0%) |
| Education Instruction & Library | 0 (0.0%) | 160 (100.0%) |
| Arts, Media & Entertainment | 0 (0.0%) | 19 (100.0%) |
| Health Diagnosing & Treating | 32 (10.4%) | 277 (89.6%) |
| Health Technologists | 32 (15.1%) | 180 (84.9%) |
| Total (Category) | 568 (37.3%) | 956 (62.7%) |
| Total (Overall) | 1,850 (52.6%) | 1,666 (47.4%) |
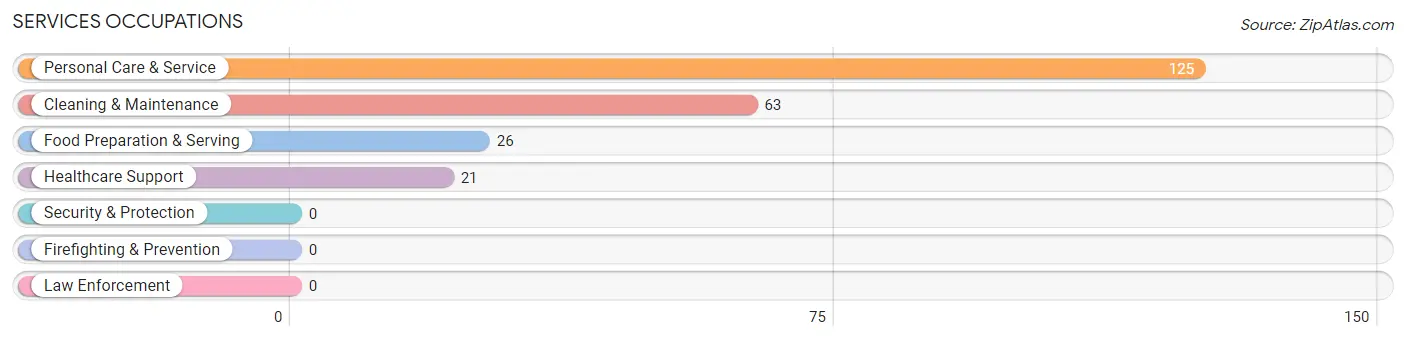
Services Occupations
The most common Services occupations in Winfield are Personal Care & Service (125 | 3.6%), Cleaning & Maintenance (63 | 1.8%), Food Preparation & Serving (26 | 0.7%), and Healthcare Support (21 | 0.6%).
Services Occupations by Sex
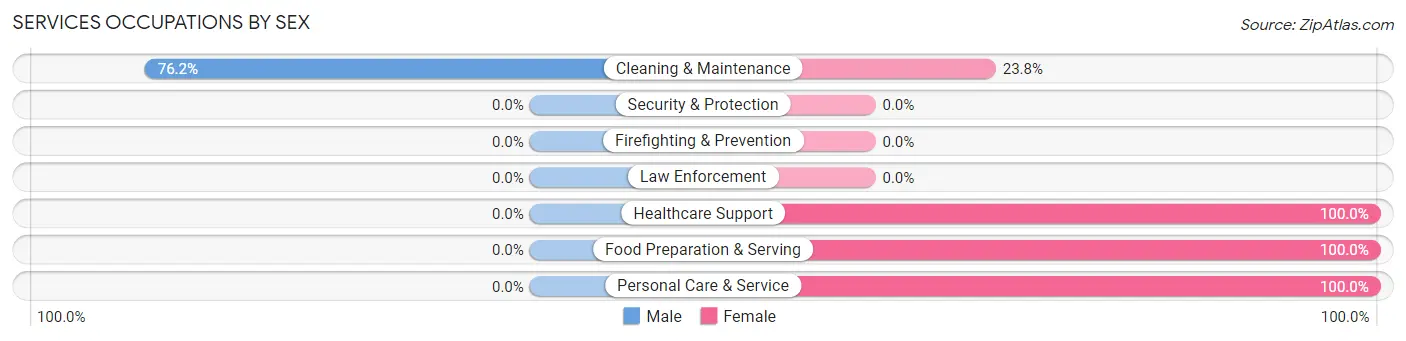
| Occupation | Male | Female |
| Healthcare Support | 0 (0.0%) | 21 (100.0%) |
| Security & Protection | 0 (0.0%) | 0 (0.0%) |
| Firefighting & Prevention | 0 (0.0%) | 0 (0.0%) |
| Law Enforcement | 0 (0.0%) | 0 (0.0%) |
| Food Preparation & Serving | 0 (0.0%) | 26 (100.0%) |
| Cleaning & Maintenance | 48 (76.2%) | 15 (23.8%) |
| Personal Care & Service | 0 (0.0%) | 125 (100.0%) |
| Total (Category) | 48 (20.4%) | 187 (79.6%) |
| Total (Overall) | 1,850 (52.6%) | 1,666 (47.4%) |
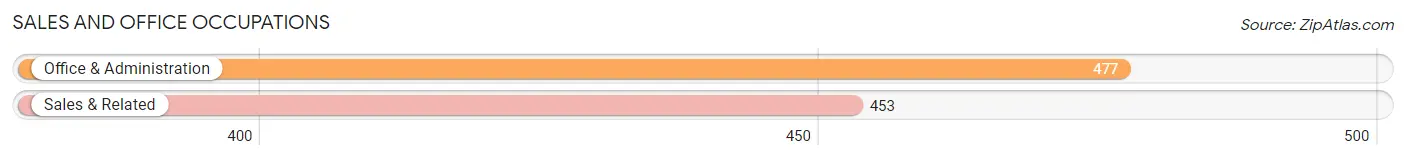
Sales and Office Occupations
The most common Sales and Office occupations in Winfield are Office & Administration (477 | 13.6%), and Sales & Related (453 | 12.9%).
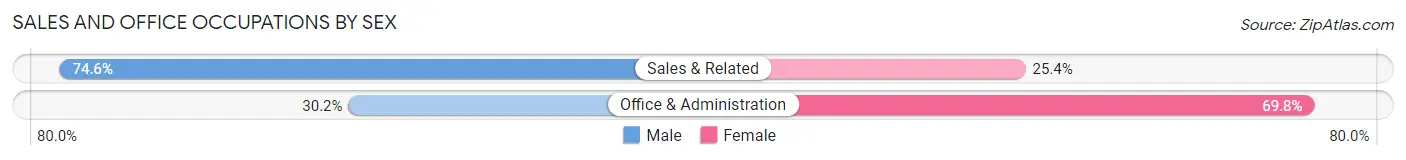
Sales and Office Occupations by Sex
| Occupation | Male | Female |
| Sales & Related | 338 (74.6%) | 115 (25.4%) |
| Office & Administration | 144 (30.2%) | 333 (69.8%) |
| Total (Category) | 482 (51.8%) | 448 (48.2%) |
| Total (Overall) | 1,850 (52.6%) | 1,666 (47.4%) |
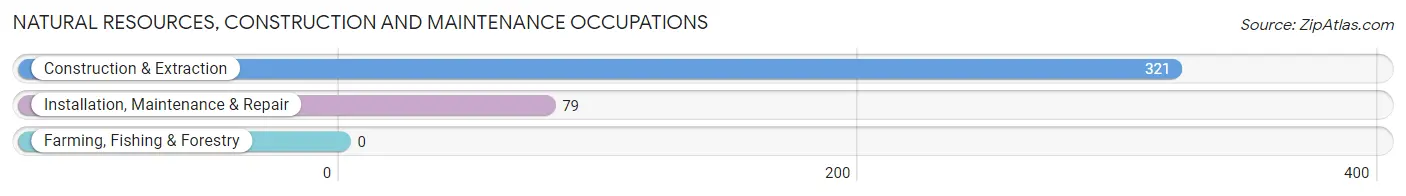
Natural Resources, Construction and Maintenance Occupations
The most common Natural Resources, Construction and Maintenance occupations in Winfield are Construction & Extraction (321 | 9.1%), and Installation, Maintenance & Repair (79 | 2.2%).
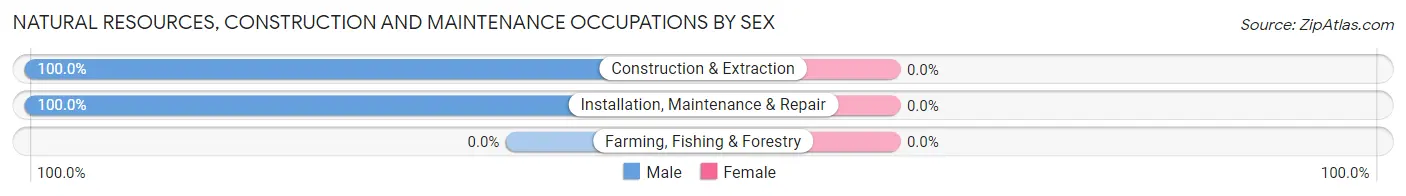
Natural Resources, Construction and Maintenance Occupations by Sex
| Occupation | Male | Female |
| Farming, Fishing & Forestry | 0 (0.0%) | 0 (0.0%) |
| Construction & Extraction | 321 (100.0%) | 0 (0.0%) |
| Installation, Maintenance & Repair | 79 (100.0%) | 0 (0.0%) |
| Total (Category) | 400 (100.0%) | 0 (0.0%) |
| Total (Overall) | 1,850 (52.6%) | 1,666 (47.4%) |
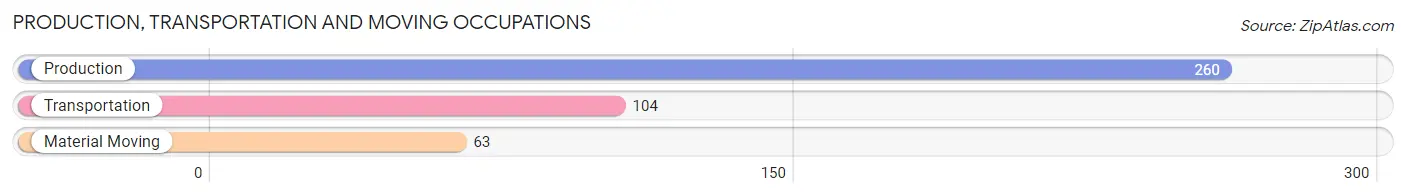
Production, Transportation and Moving Occupations
The most common Production, Transportation and Moving occupations in Winfield are Production (260 | 7.4%), Transportation (104 | 3.0%), and Material Moving (63 | 1.8%).
Production, Transportation and Moving Occupations by Sex
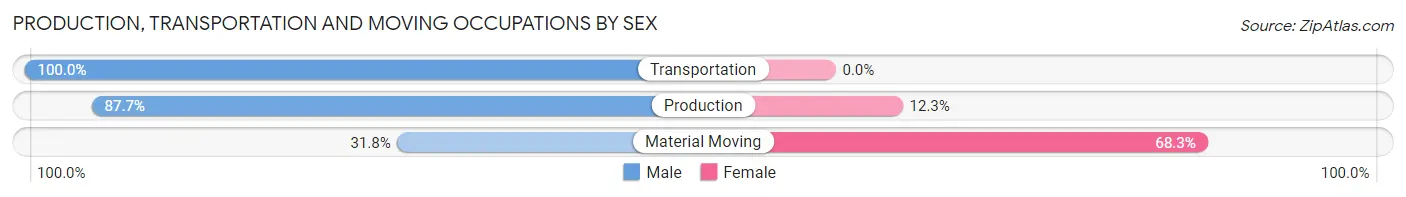
| Occupation | Male | Female |
| Production | 228 (87.7%) | 32 (12.3%) |
| Transportation | 104 (100.0%) | 0 (0.0%) |
| Material Moving | 20 (31.8%) | 43 (68.2%) |
| Total (Category) | 352 (82.4%) | 75 (17.6%) |
| Total (Overall) | 1,850 (52.6%) | 1,666 (47.4%) |
Employment Industries by Sex in Winfield
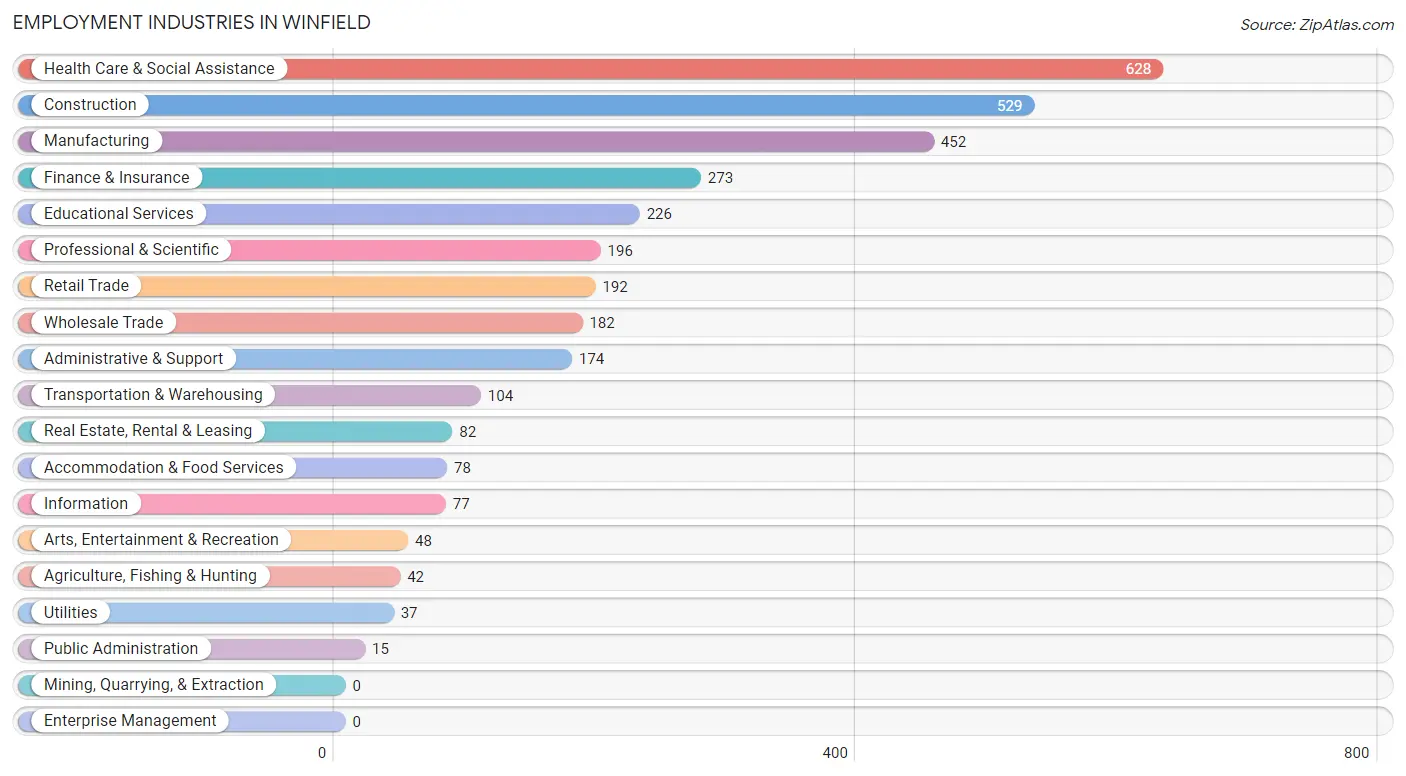
Employment Industries in Winfield
The major employment industries in Winfield include Health Care & Social Assistance (628 | 17.9%), Construction (529 | 15.0%), Manufacturing (452 | 12.9%), Finance & Insurance (273 | 7.8%), and Educational Services (226 | 6.4%).
Employment Industries by Sex in Winfield
The Winfield industries that see more men than women are Transportation & Warehousing (100.0%), Utilities (100.0%), and Public Administration (100.0%), whereas the industries that tend to have a higher number of women are Agriculture, Fishing & Hunting (100.0%), Information (100.0%), and Real Estate, Rental & Leasing (100.0%).
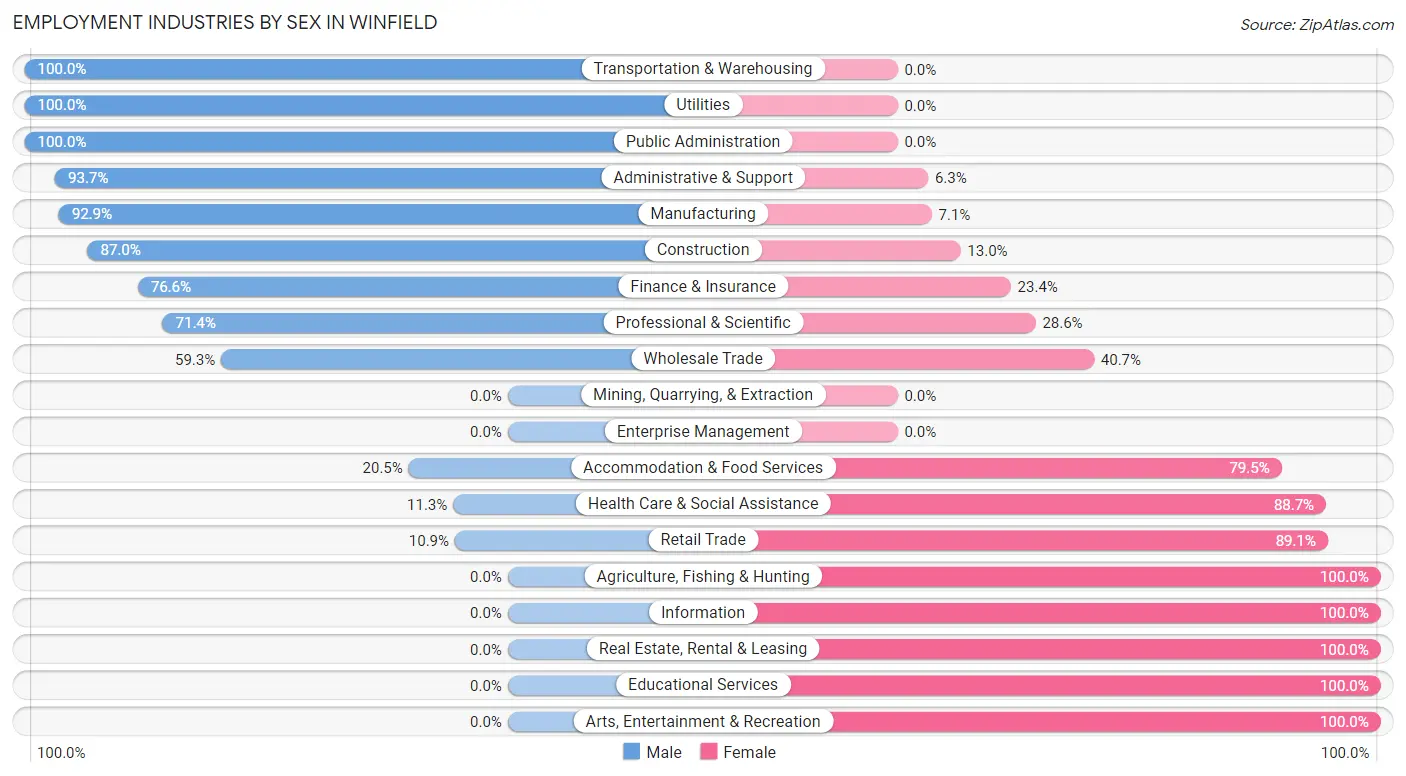
| Industry | Male | Female |
| Agriculture, Fishing & Hunting | 0 (0.0%) | 42 (100.0%) |
| Mining, Quarrying, & Extraction | 0 (0.0%) | 0 (0.0%) |
| Construction | 460 (87.0%) | 69 (13.0%) |
| Manufacturing | 420 (92.9%) | 32 (7.1%) |
| Wholesale Trade | 108 (59.3%) | 74 (40.7%) |
| Retail Trade | 21 (10.9%) | 171 (89.1%) |
| Transportation & Warehousing | 104 (100.0%) | 0 (0.0%) |
| Utilities | 37 (100.0%) | 0 (0.0%) |
| Information | 0 (0.0%) | 77 (100.0%) |
| Finance & Insurance | 209 (76.6%) | 64 (23.4%) |
| Real Estate, Rental & Leasing | 0 (0.0%) | 82 (100.0%) |
| Professional & Scientific | 140 (71.4%) | 56 (28.6%) |
| Enterprise Management | 0 (0.0%) | 0 (0.0%) |
| Administrative & Support | 163 (93.7%) | 11 (6.3%) |
| Educational Services | 0 (0.0%) | 226 (100.0%) |
| Health Care & Social Assistance | 71 (11.3%) | 557 (88.7%) |
| Arts, Entertainment & Recreation | 0 (0.0%) | 48 (100.0%) |
| Accommodation & Food Services | 16 (20.5%) | 62 (79.5%) |
| Public Administration | 15 (100.0%) | 0 (0.0%) |
| Total | 1,850 (52.6%) | 1,666 (47.4%) |
Education in Winfield
School Enrollment in Winfield
The most common levels of schooling among the 1,872 students in Winfield are middle school (661 | 35.3%), high school (459 | 24.5%), and elementary school (370 | 19.8%).
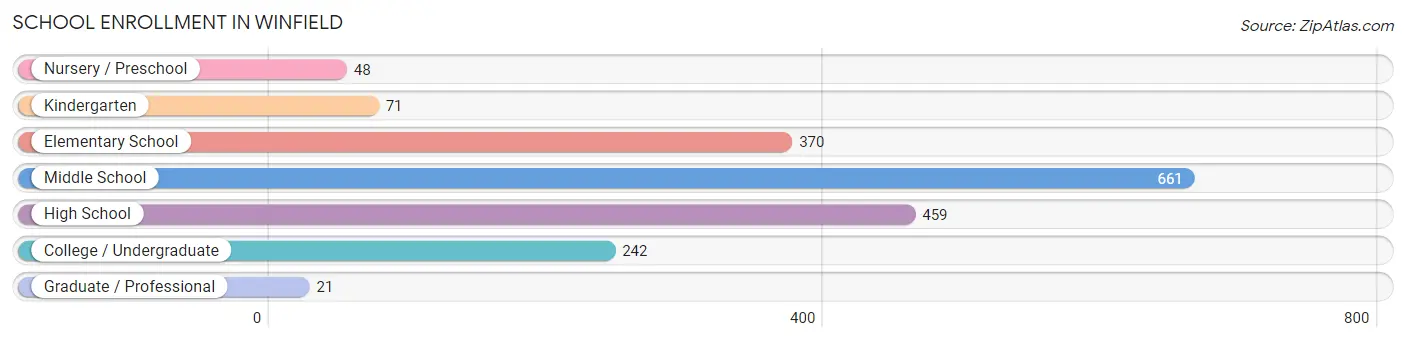
| School Level | # Students | % Students |
| Nursery / Preschool | 48 | 2.6% |
| Kindergarten | 71 | 3.8% |
| Elementary School | 370 | 19.8% |
| Middle School | 661 | 35.3% |
| High School | 459 | 24.5% |
| College / Undergraduate | 242 | 12.9% |
| Graduate / Professional | 21 | 1.1% |
| Total | 1,872 | 100.0% |
School Enrollment by Age by Funding Source in Winfield
Out of a total of 1,872 students who are enrolled in schools in Winfield, 71 (3.8%) attend a private institution, while the remaining 1,801 (96.2%) are enrolled in public schools. The age group of 35 years and over has the highest likelihood of being enrolled in private schools, with 41 (41.8% in the age bracket) enrolled. Conversely, the age group of 3 to 4 year olds has the lowest likelihood of being enrolled in a private school, with 13 (100.0% in the age bracket) attending a public institution.
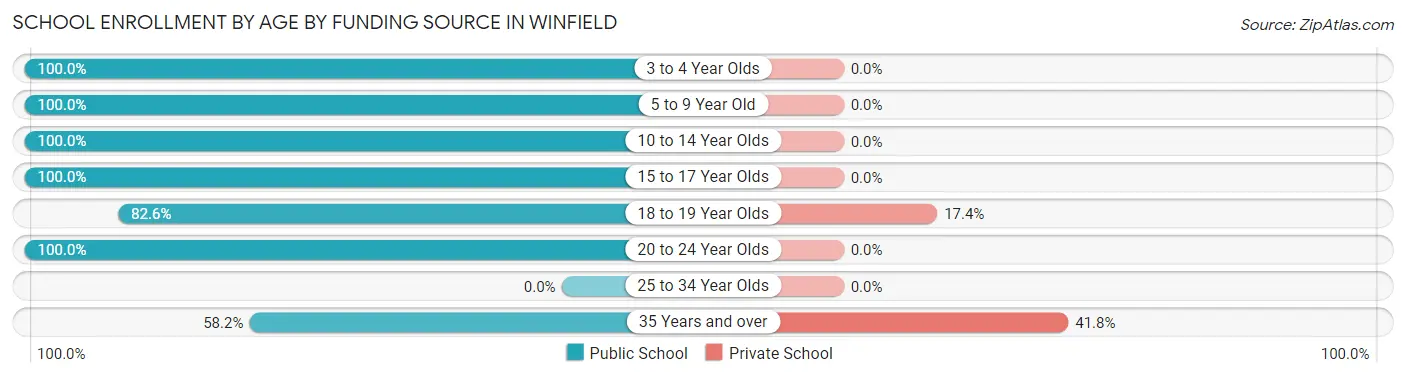
| Age Bracket | Public School | Private School |
| 3 to 4 Year Olds | 13 (100.0%) | 0 (0.0%) |
| 5 to 9 Year Old | 454 (100.0%) | 0 (0.0%) |
| 10 to 14 Year Olds | 649 (100.0%) | 0 (0.0%) |
| 15 to 17 Year Olds | 392 (100.0%) | 0 (0.0%) |
| 18 to 19 Year Olds | 147 (82.6%) | 31 (17.4%) |
| 20 to 24 Year Olds | 88 (100.0%) | 0 (0.0%) |
| 25 to 34 Year Olds | 0 (0.0%) | 0 (0.0%) |
| 35 Years and over | 57 (58.2%) | 41 (41.8%) |
| Total | 1,801 (96.2%) | 71 (3.8%) |
Educational Attainment by Field of Study in Winfield
Business (300 | 17.5%), education (219 | 12.8%), engineering (152 | 8.9%), science & technology (152 | 8.9%), and computers & mathematics (146 | 8.5%) are the most common fields of study among 1,709 individuals in Winfield who have obtained a bachelor's degree or higher.
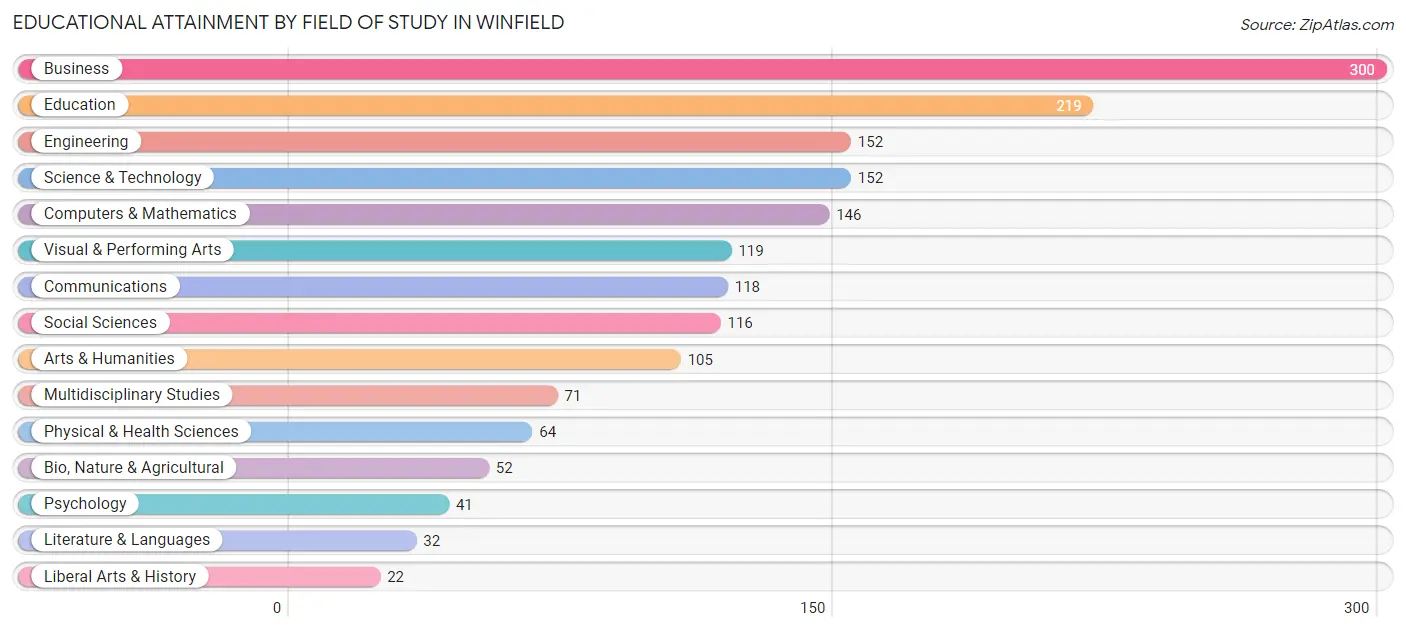
| Field of Study | # Graduates | % Graduates |
| Computers & Mathematics | 146 | 8.5% |
| Bio, Nature & Agricultural | 52 | 3.0% |
| Physical & Health Sciences | 64 | 3.7% |
| Psychology | 41 | 2.4% |
| Social Sciences | 116 | 6.8% |
| Engineering | 152 | 8.9% |
| Multidisciplinary Studies | 71 | 4.2% |
| Science & Technology | 152 | 8.9% |
| Business | 300 | 17.5% |
| Education | 219 | 12.8% |
| Literature & Languages | 32 | 1.9% |
| Liberal Arts & History | 22 | 1.3% |
| Visual & Performing Arts | 119 | 7.0% |
| Communications | 118 | 6.9% |
| Arts & Humanities | 105 | 6.1% |
| Total | 1,709 | 100.0% |
Transportation & Commute in Winfield
Vehicle Availability by Sex in Winfield
The most prevalent vehicle ownership categories in Winfield are males with 2 vehicles (819, accounting for 44.5%) and females with 2 vehicles (774, making up 50.7%).
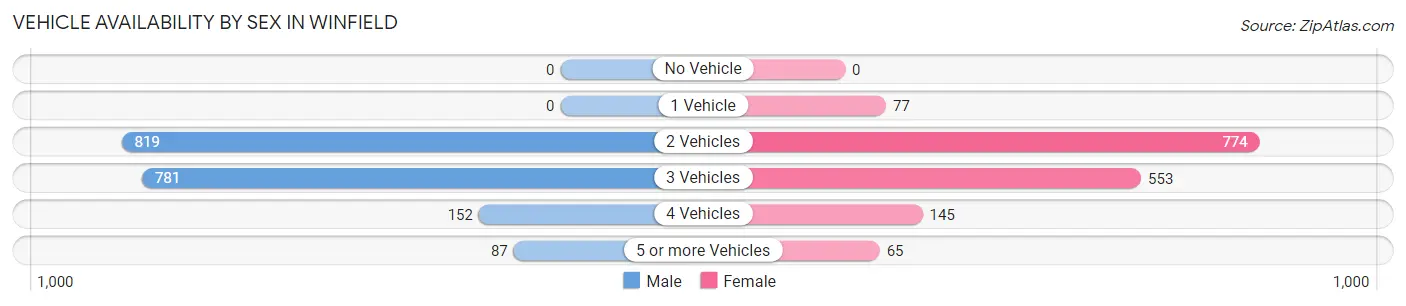
| Vehicles Available | Male | Female |
| No Vehicle | 0 (0.0%) | 0 (0.0%) |
| 1 Vehicle | 0 (0.0%) | 77 (4.8%) |
| 2 Vehicles | 819 (44.5%) | 774 (48.0%) |
| 3 Vehicles | 781 (42.5%) | 553 (34.3%) |
| 4 Vehicles | 152 (8.3%) | 145 (9.0%) |
| 5 or more Vehicles | 87 (4.7%) | 65 (4.0%) |
| Total | 1,839 (100.0%) | 1,614 (100.0%) |
Commute Time in Winfield
The most frequently occuring commute durations in Winfield are 15 to 19 minutes (556 commuters, 19.0%), 60 to 89 minutes (419 commuters, 14.3%), and 40 to 44 minutes (402 commuters, 13.8%).
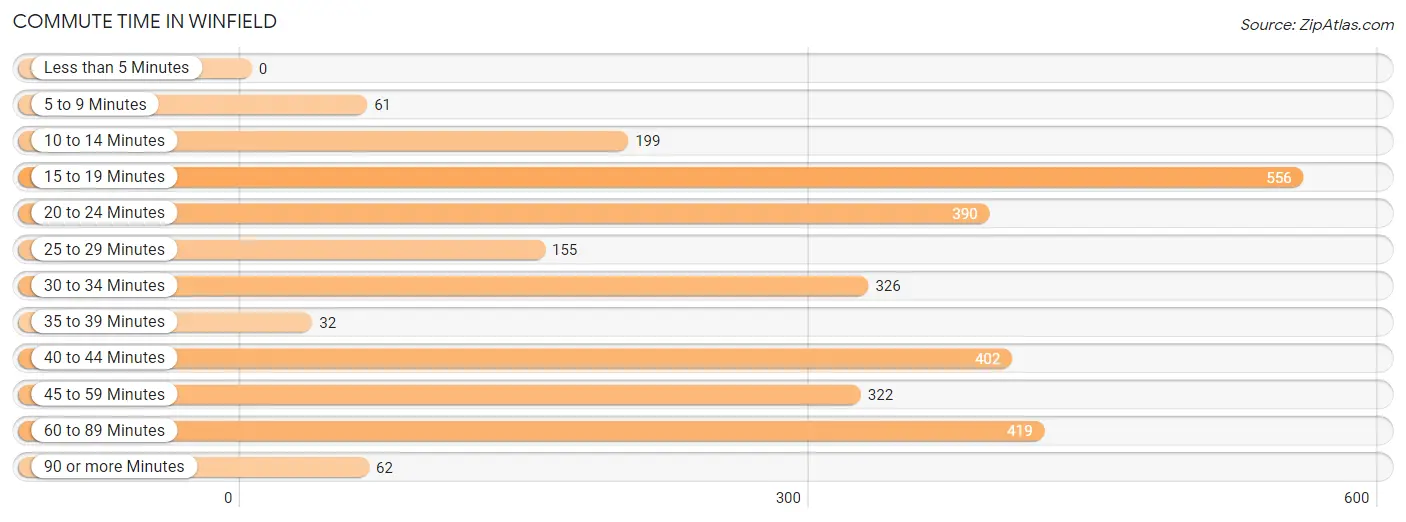
| Commute Time | # Commuters | % Commuters |
| Less than 5 Minutes | 0 | 0.0% |
| 5 to 9 Minutes | 61 | 2.1% |
| 10 to 14 Minutes | 199 | 6.8% |
| 15 to 19 Minutes | 556 | 19.0% |
| 20 to 24 Minutes | 390 | 13.3% |
| 25 to 29 Minutes | 155 | 5.3% |
| 30 to 34 Minutes | 326 | 11.2% |
| 35 to 39 Minutes | 32 | 1.1% |
| 40 to 44 Minutes | 402 | 13.8% |
| 45 to 59 Minutes | 322 | 11.0% |
| 60 to 89 Minutes | 419 | 14.3% |
| 90 or more Minutes | 62 | 2.1% |
Commute Time by Sex in Winfield
The most common commute times in Winfield are 15 to 19 minutes (325 commuters, 19.7%) for males and 20 to 24 minutes (279 commuters, 21.9%) for females.
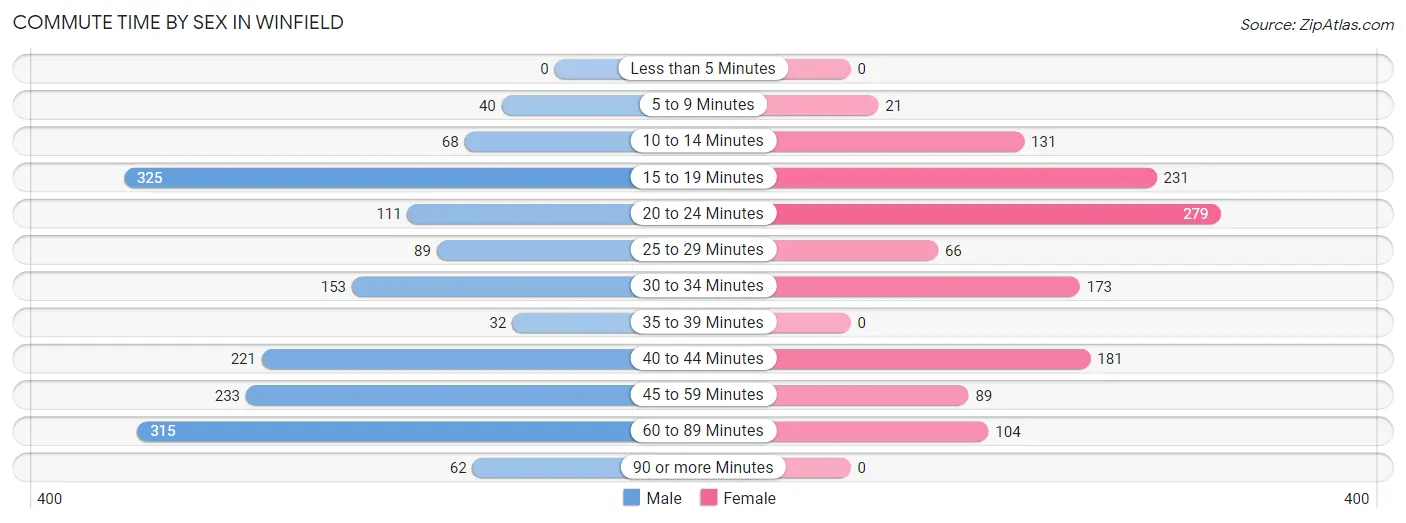
| Commute Time | Male | Female |
| Less than 5 Minutes | 0 (0.0%) | 0 (0.0%) |
| 5 to 9 Minutes | 40 (2.4%) | 21 (1.7%) |
| 10 to 14 Minutes | 68 (4.1%) | 131 (10.3%) |
| 15 to 19 Minutes | 325 (19.7%) | 231 (18.1%) |
| 20 to 24 Minutes | 111 (6.7%) | 279 (21.9%) |
| 25 to 29 Minutes | 89 (5.4%) | 66 (5.2%) |
| 30 to 34 Minutes | 153 (9.3%) | 173 (13.6%) |
| 35 to 39 Minutes | 32 (1.9%) | 0 (0.0%) |
| 40 to 44 Minutes | 221 (13.4%) | 181 (14.2%) |
| 45 to 59 Minutes | 233 (14.1%) | 89 (7.0%) |
| 60 to 89 Minutes | 315 (19.1%) | 104 (8.2%) |
| 90 or more Minutes | 62 (3.8%) | 0 (0.0%) |
Time of Departure to Work by Sex in Winfield
The most frequent times of departure to work in Winfield are 6:00 AM to 6:29 AM (279, 16.9%) for males and 6:00 AM to 6:29 AM (252, 19.8%) for females.
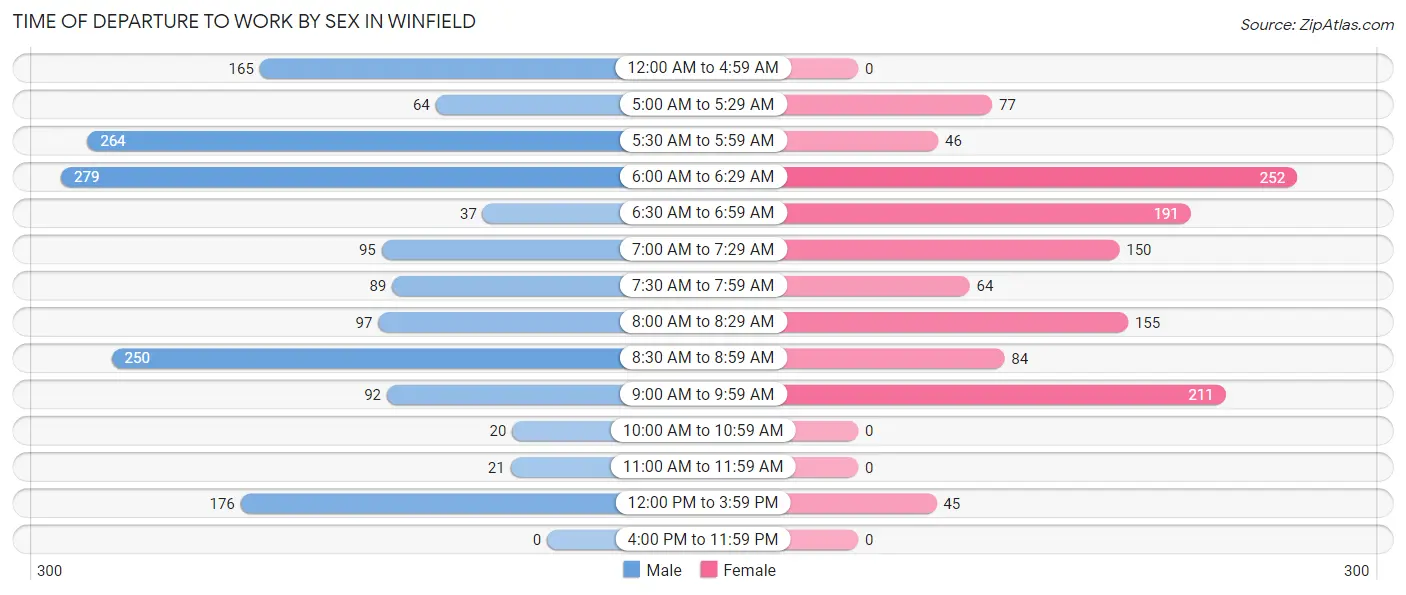
| Time of Departure | Male | Female |
| 12:00 AM to 4:59 AM | 165 (10.0%) | 0 (0.0%) |
| 5:00 AM to 5:29 AM | 64 (3.9%) | 77 (6.0%) |
| 5:30 AM to 5:59 AM | 264 (16.0%) | 46 (3.6%) |
| 6:00 AM to 6:29 AM | 279 (16.9%) | 252 (19.8%) |
| 6:30 AM to 6:59 AM | 37 (2.2%) | 191 (15.0%) |
| 7:00 AM to 7:29 AM | 95 (5.8%) | 150 (11.8%) |
| 7:30 AM to 7:59 AM | 89 (5.4%) | 64 (5.0%) |
| 8:00 AM to 8:29 AM | 97 (5.9%) | 155 (12.2%) |
| 8:30 AM to 8:59 AM | 250 (15.2%) | 84 (6.6%) |
| 9:00 AM to 9:59 AM | 92 (5.6%) | 211 (16.6%) |
| 10:00 AM to 10:59 AM | 20 (1.2%) | 0 (0.0%) |
| 11:00 AM to 11:59 AM | 21 (1.3%) | 0 (0.0%) |
| 12:00 PM to 3:59 PM | 176 (10.7%) | 45 (3.5%) |
| 4:00 PM to 11:59 PM | 0 (0.0%) | 0 (0.0%) |
| Total | 1,649 (100.0%) | 1,275 (100.0%) |
Housing Occupancy in Winfield
Occupancy by Ownership in Winfield
Of the total 2,198 dwellings in Winfield, owner-occupied units account for 2,024 (92.1%), while renter-occupied units make up 174 (7.9%).
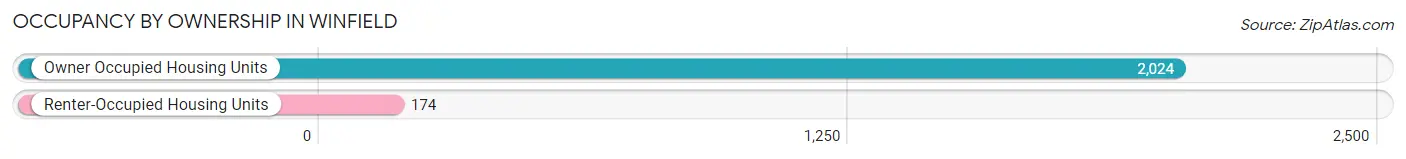
| Occupancy | # Housing Units | % Housing Units |
| Owner Occupied Housing Units | 2,024 | 92.1% |
| Renter-Occupied Housing Units | 174 | 7.9% |
| Total Occupied Housing Units | 2,198 | 100.0% |
Occupancy by Household Size in Winfield
| Household Size | # Housing Units | % Housing Units |
| 1-Person Household | 358 | 16.3% |
| 2-Person Household | 446 | 20.3% |
| 3-Person Household | 551 | 25.1% |
| 4+ Person Household | 843 | 38.4% |
| Total Housing Units | 2,198 | 100.0% |
Occupancy by Ownership by Household Size in Winfield
| Household Size | Owner-occupied | Renter-occupied |
| 1-Person Household | 263 (73.5%) | 95 (26.5%) |
| 2-Person Household | 435 (97.5%) | 11 (2.5%) |
| 3-Person Household | 531 (96.4%) | 20 (3.6%) |
| 4+ Person Household | 795 (94.3%) | 48 (5.7%) |
| Total Housing Units | 2,024 (92.1%) | 174 (7.9%) |
Occupancy by Educational Attainment in Winfield
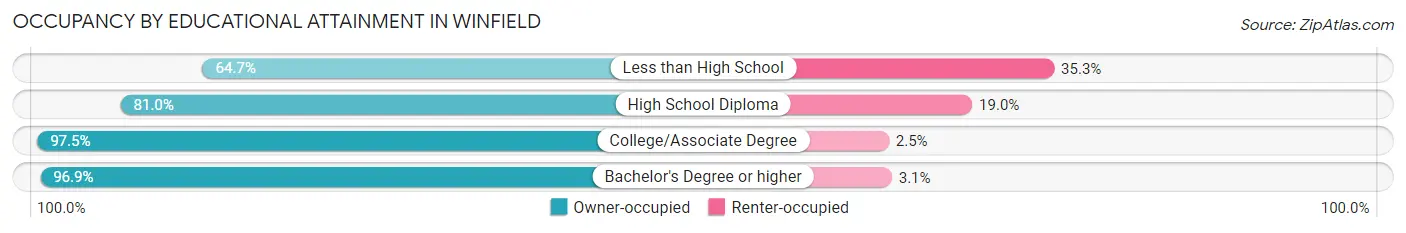
| Household Size | Owner-occupied | Renter-occupied |
| Less than High School | 55 (64.7%) | 30 (35.3%) |
| High School Diploma | 417 (81.0%) | 98 (19.0%) |
| College/Associate Degree | 582 (97.5%) | 15 (2.5%) |
| Bachelor's Degree or higher | 970 (96.9%) | 31 (3.1%) |
Occupancy by Age of Householder in Winfield
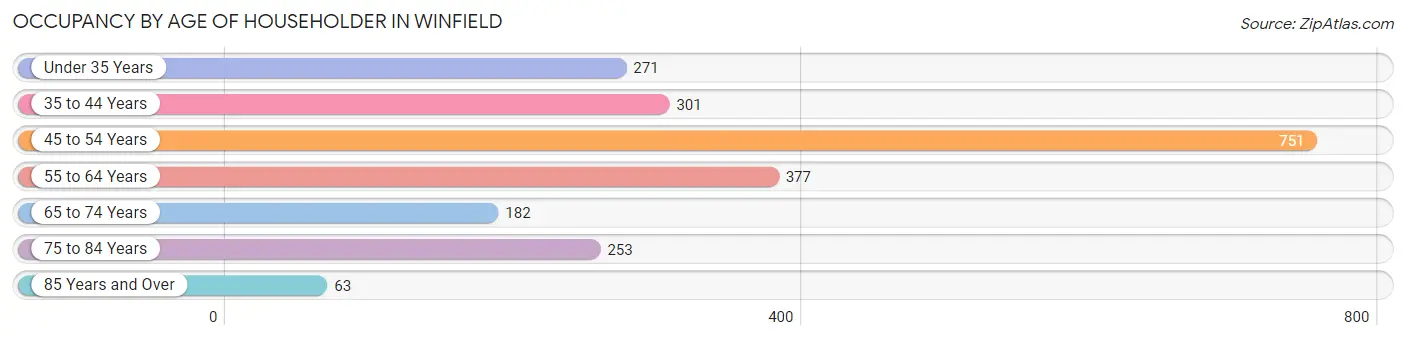
| Age Bracket | # Households | % Households |
| Under 35 Years | 271 | 12.3% |
| 35 to 44 Years | 301 | 13.7% |
| 45 to 54 Years | 751 | 34.2% |
| 55 to 64 Years | 377 | 17.2% |
| 65 to 74 Years | 182 | 8.3% |
| 75 to 84 Years | 253 | 11.5% |
| 85 Years and Over | 63 | 2.9% |
| Total | 2,198 | 100.0% |
Housing Finances in Winfield
Median Income by Occupancy in Winfield
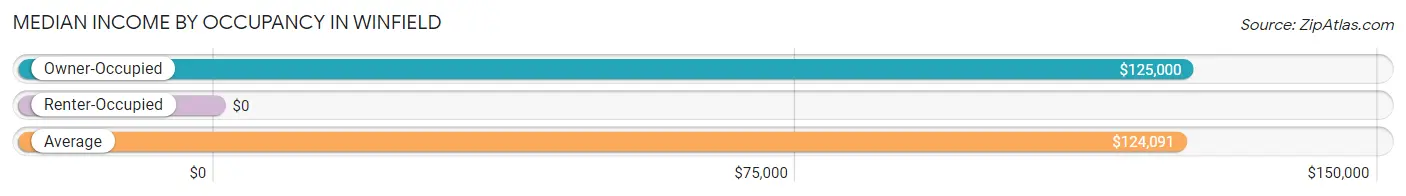
| Occupancy Type | # Households | Median Income |
| Owner-Occupied | 2,024 (92.1%) | $125,000 |
| Renter-Occupied | 174 (7.9%) | $0 |
| Average | 2,198 (100.0%) | $124,091 |
Occupancy by Householder Income Bracket in Winfield
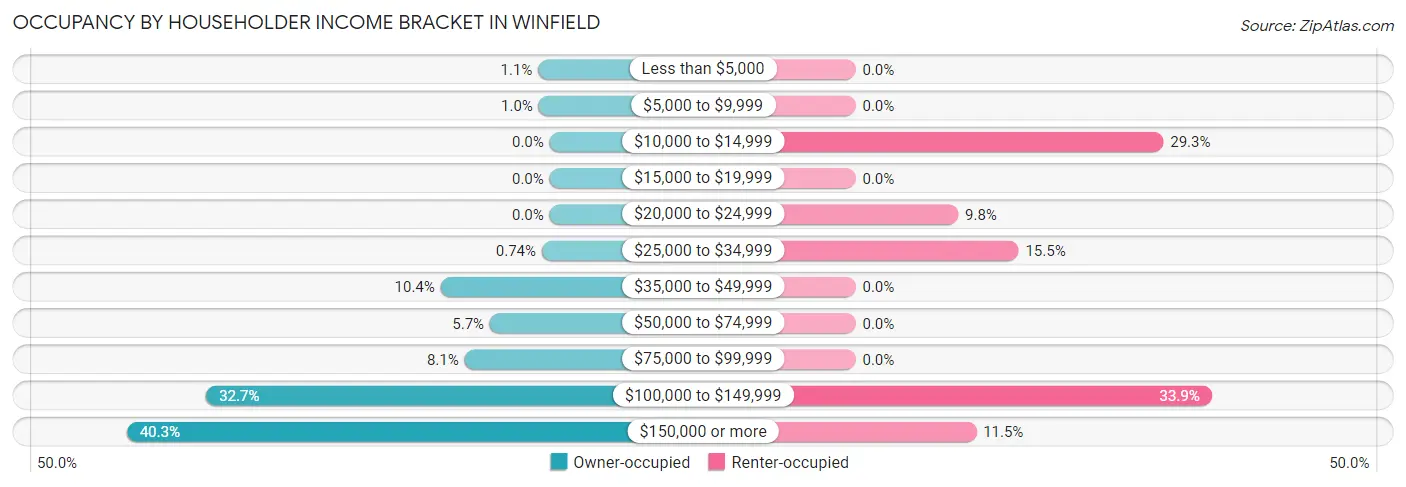
| Income Bracket | Owner-occupied | Renter-occupied |
| Less than $5,000 | 22 (1.1%) | 0 (0.0%) |
| $5,000 to $9,999 | 21 (1.0%) | 0 (0.0%) |
| $10,000 to $14,999 | 0 (0.0%) | 51 (29.3%) |
| $15,000 to $19,999 | 0 (0.0%) | 0 (0.0%) |
| $20,000 to $24,999 | 0 (0.0%) | 17 (9.8%) |
| $25,000 to $34,999 | 15 (0.7%) | 27 (15.5%) |
| $35,000 to $49,999 | 210 (10.4%) | 0 (0.0%) |
| $50,000 to $74,999 | 115 (5.7%) | 0 (0.0%) |
| $75,000 to $99,999 | 164 (8.1%) | 0 (0.0%) |
| $100,000 to $149,999 | 662 (32.7%) | 59 (33.9%) |
| $150,000 or more | 815 (40.3%) | 20 (11.5%) |
| Total | 2,024 (100.0%) | 174 (100.0%) |
Monthly Housing Cost Tiers in Winfield
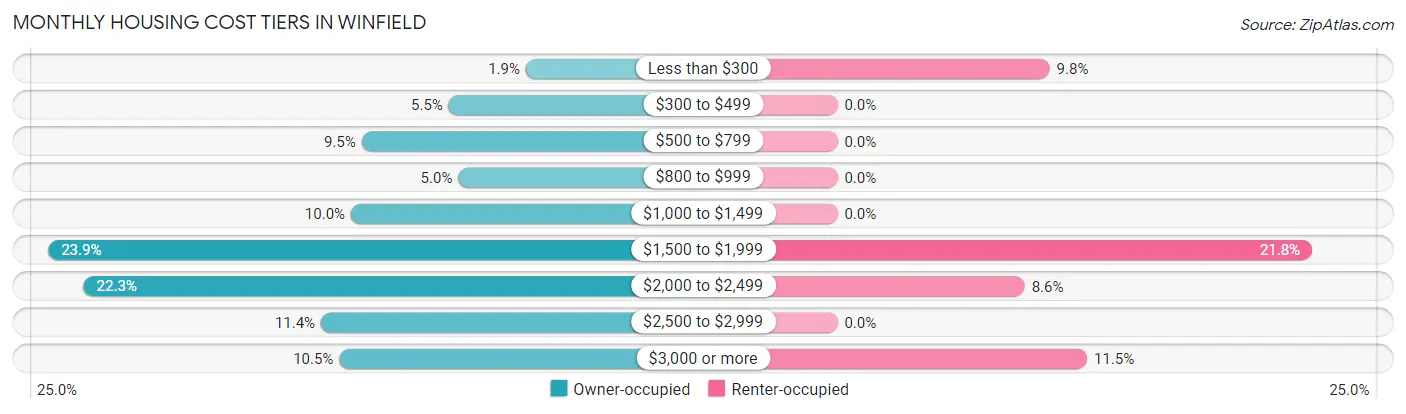
| Monthly Cost | Owner-occupied | Renter-occupied |
| Less than $300 | 39 (1.9%) | 17 (9.8%) |
| $300 to $499 | 111 (5.5%) | 0 (0.0%) |
| $500 to $799 | 192 (9.5%) | 0 (0.0%) |
| $800 to $999 | 102 (5.0%) | 0 (0.0%) |
| $1,000 to $1,499 | 202 (10.0%) | 0 (0.0%) |
| $1,500 to $1,999 | 484 (23.9%) | 38 (21.8%) |
| $2,000 to $2,499 | 451 (22.3%) | 15 (8.6%) |
| $2,500 to $2,999 | 230 (11.4%) | 0 (0.0%) |
| $3,000 or more | 213 (10.5%) | 20 (11.5%) |
| Total | 2,024 (100.0%) | 174 (100.0%) |
Physical Housing Characteristics in Winfield
Housing Structures in Winfield
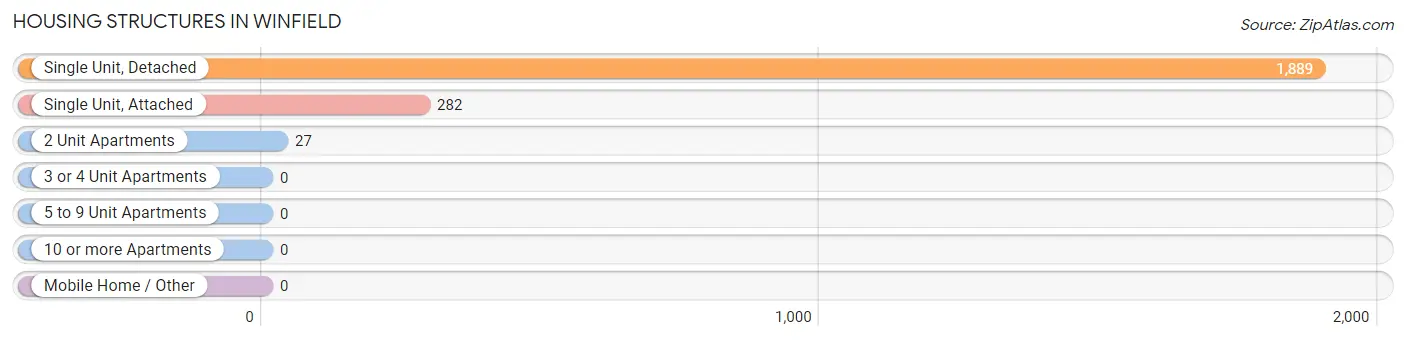
| Structure Type | # Housing Units | % Housing Units |
| Single Unit, Detached | 1,889 | 85.9% |
| Single Unit, Attached | 282 | 12.8% |
| 2 Unit Apartments | 27 | 1.2% |
| 3 or 4 Unit Apartments | 0 | 0.0% |
| 5 to 9 Unit Apartments | 0 | 0.0% |
| 10 or more Apartments | 0 | 0.0% |
| Mobile Home / Other | 0 | 0.0% |
| Total | 2,198 | 100.0% |
Housing Structures by Occupancy in Winfield
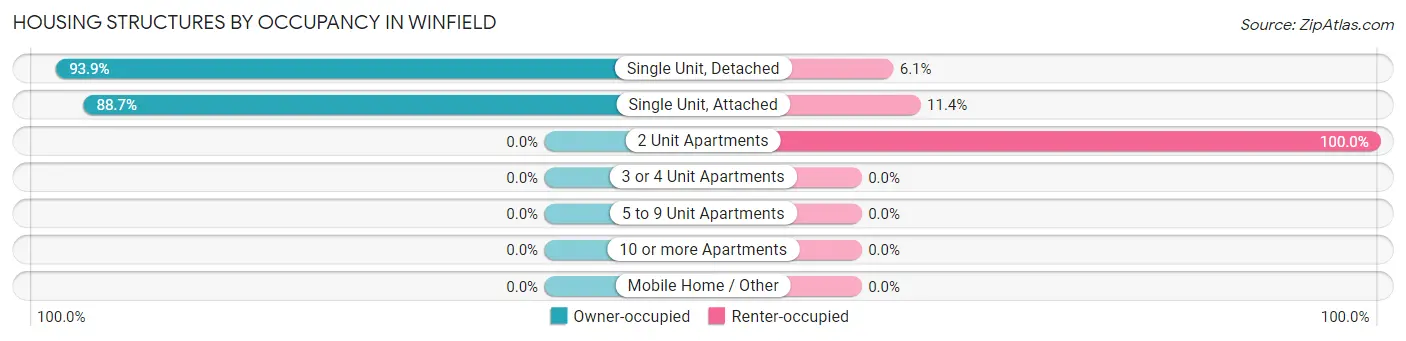
| Structure Type | Owner-occupied | Renter-occupied |
| Single Unit, Detached | 1,774 (93.9%) | 115 (6.1%) |
| Single Unit, Attached | 250 (88.6%) | 32 (11.4%) |
| 2 Unit Apartments | 0 (0.0%) | 27 (100.0%) |
| 3 or 4 Unit Apartments | 0 (0.0%) | 0 (0.0%) |
| 5 to 9 Unit Apartments | 0 (0.0%) | 0 (0.0%) |
| 10 or more Apartments | 0 (0.0%) | 0 (0.0%) |
| Mobile Home / Other | 0 (0.0%) | 0 (0.0%) |
| Total | 2,024 (92.1%) | 174 (7.9%) |
Housing Structures by Number of Rooms in Winfield
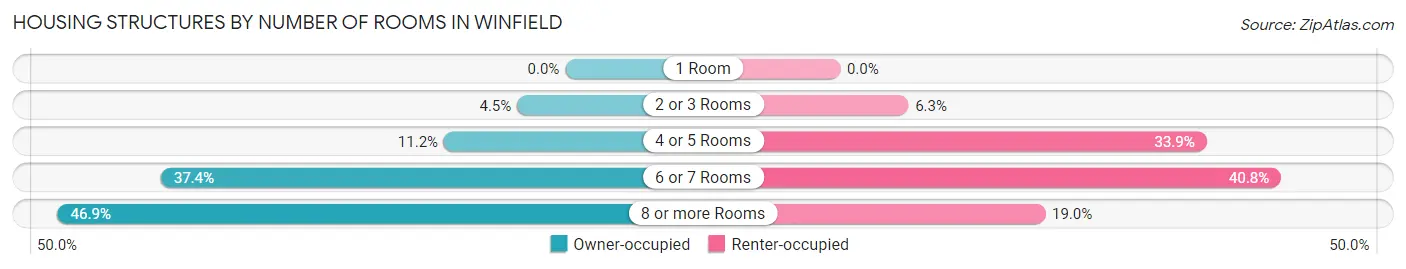
| Number of Rooms | Owner-occupied | Renter-occupied |
| 1 Room | 0 (0.0%) | 0 (0.0%) |
| 2 or 3 Rooms | 90 (4.4%) | 11 (6.3%) |
| 4 or 5 Rooms | 227 (11.2%) | 59 (33.9%) |
| 6 or 7 Rooms | 757 (37.4%) | 71 (40.8%) |
| 8 or more Rooms | 950 (46.9%) | 33 (19.0%) |
| Total | 2,024 (100.0%) | 174 (100.0%) |
Housing Structure by Heating Type in Winfield
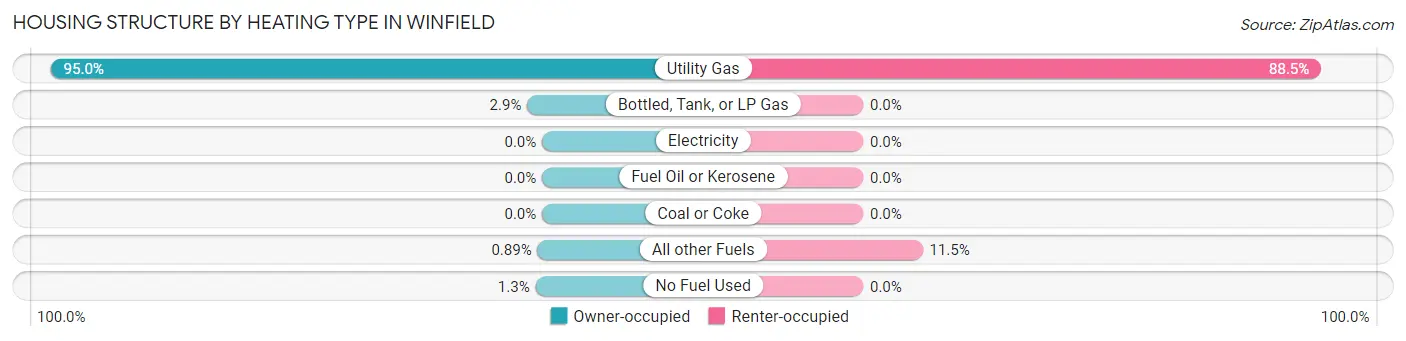
| Heating Type | Owner-occupied | Renter-occupied |
| Utility Gas | 1,922 (95.0%) | 154 (88.5%) |
| Bottled, Tank, or LP Gas | 58 (2.9%) | 0 (0.0%) |
| Electricity | 0 (0.0%) | 0 (0.0%) |
| Fuel Oil or Kerosene | 0 (0.0%) | 0 (0.0%) |
| Coal or Coke | 0 (0.0%) | 0 (0.0%) |
| All other Fuels | 18 (0.9%) | 20 (11.5%) |
| No Fuel Used | 26 (1.3%) | 0 (0.0%) |
| Total | 2,024 (100.0%) | 174 (100.0%) |
Household Vehicle Usage in Winfield
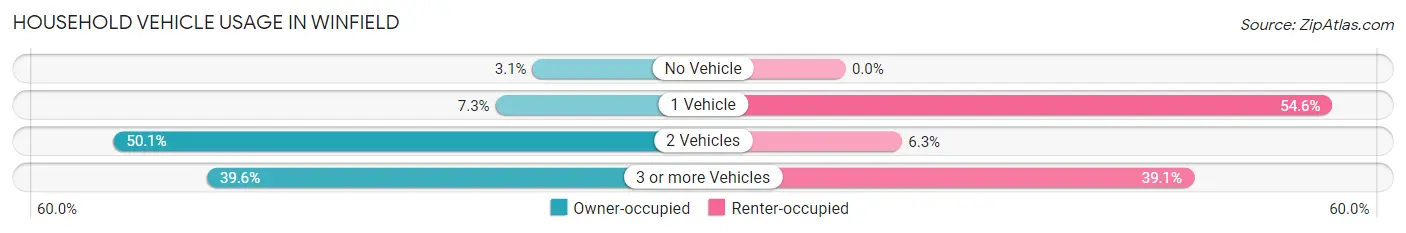
| Vehicles per Household | Owner-occupied | Renter-occupied |
| No Vehicle | 63 (3.1%) | 0 (0.0%) |
| 1 Vehicle | 147 (7.3%) | 95 (54.6%) |
| 2 Vehicles | 1,013 (50.0%) | 11 (6.3%) |
| 3 or more Vehicles | 801 (39.6%) | 68 (39.1%) |
| Total | 2,024 (100.0%) | 174 (100.0%) |
Real Estate & Mortgages in Winfield
Real Estate and Mortgage Overview in Winfield
| Characteristic | Without Mortgage | With Mortgage |
| Housing Units | 409 | 1,615 |
| Median Property Value | $275,200 | $395,500 |
| Median Household Income | - | - |
| Monthly Housing Costs | $604 | $213 |
| Real Estate Taxes | $2,801 | $0 |
Property Value by Mortgage Status in Winfield
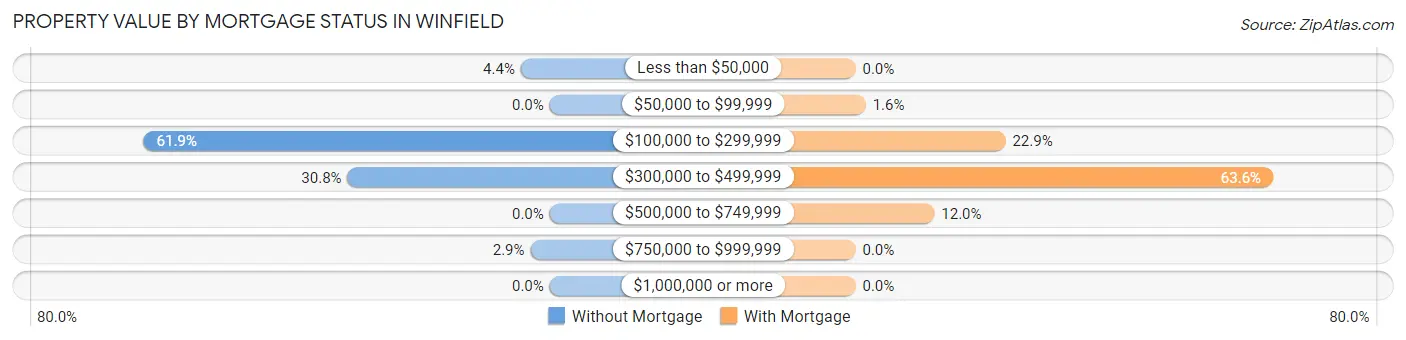
| Property Value | Without Mortgage | With Mortgage |
| Less than $50,000 | 18 (4.4%) | 0 (0.0%) |
| $50,000 to $99,999 | 0 (0.0%) | 25 (1.5%) |
| $100,000 to $299,999 | 253 (61.9%) | 369 (22.9%) |
| $300,000 to $499,999 | 126 (30.8%) | 1,027 (63.6%) |
| $500,000 to $749,999 | 0 (0.0%) | 194 (12.0%) |
| $750,000 to $999,999 | 12 (2.9%) | 0 (0.0%) |
| $1,000,000 or more | 0 (0.0%) | 0 (0.0%) |
| Total | 409 (100.0%) | 1,615 (100.0%) |
Household Income by Mortgage Status in Winfield
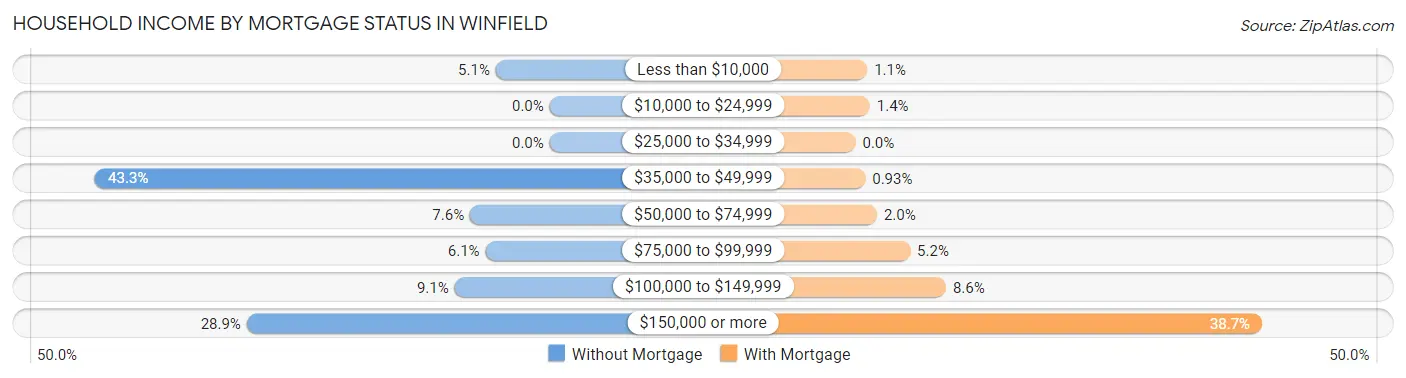
| Household Income | Without Mortgage | With Mortgage |
| Less than $10,000 | 21 (5.1%) | 18 (1.1%) |
| $10,000 to $24,999 | 0 (0.0%) | 22 (1.4%) |
| $25,000 to $34,999 | 0 (0.0%) | 0 (0.0%) |
| $35,000 to $49,999 | 177 (43.3%) | 15 (0.9%) |
| $50,000 to $74,999 | 31 (7.6%) | 33 (2.0%) |
| $75,000 to $99,999 | 25 (6.1%) | 84 (5.2%) |
| $100,000 to $149,999 | 37 (9.0%) | 139 (8.6%) |
| $150,000 or more | 118 (28.8%) | 625 (38.7%) |
| Total | 409 (100.0%) | 1,615 (100.0%) |
Property Value to Household Income Ratio in Winfield
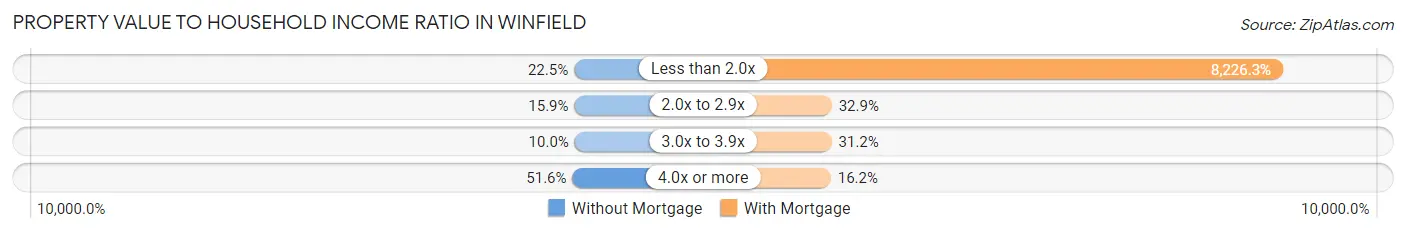
| Value-to-Income Ratio | Without Mortgage | With Mortgage |
| Less than 2.0x | 92 (22.5%) | 132,854 (8,226.3%) |
| 2.0x to 2.9x | 65 (15.9%) | 531 (32.9%) |
| 3.0x to 3.9x | 41 (10.0%) | 504 (31.2%) |
| 4.0x or more | 211 (51.6%) | 262 (16.2%) |
| Total | 409 (100.0%) | 1,615 (100.0%) |
Real Estate Taxes by Mortgage Status in Winfield
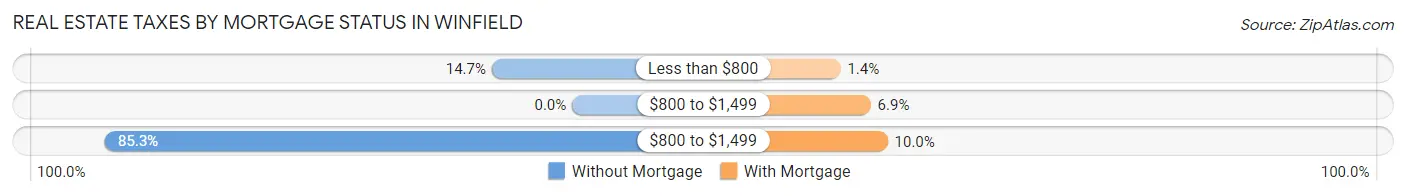
| Property Taxes | Without Mortgage | With Mortgage |
| Less than $800 | 60 (14.7%) | 22 (1.4%) |
| $800 to $1,499 | 0 (0.0%) | 111 (6.9%) |
| $800 to $1,499 | 349 (85.3%) | 161 (10.0%) |
| Total | 409 (100.0%) | 1,615 (100.0%) |
Health & Disability in Winfield
Health Insurance Coverage by Age in Winfield
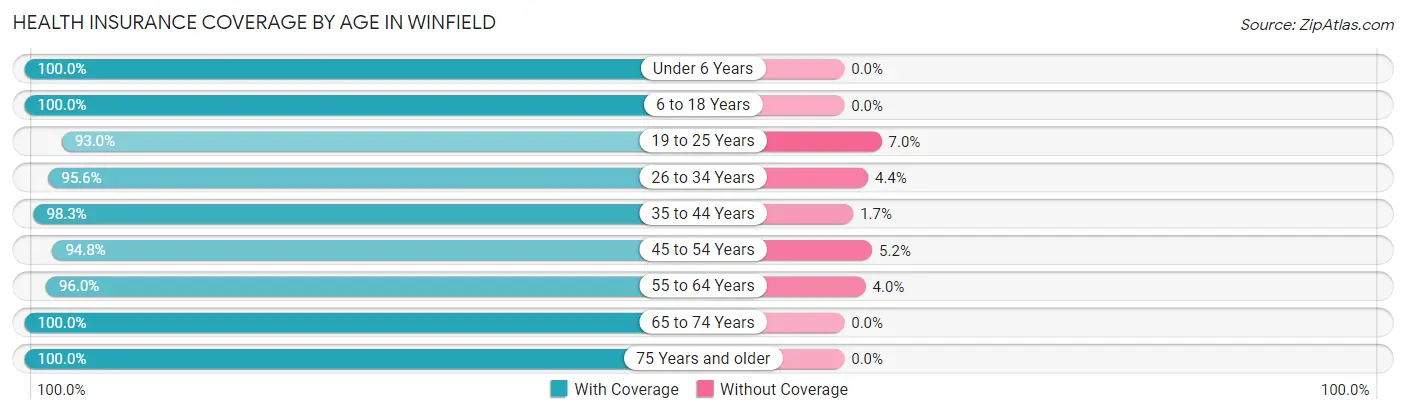
| Age Bracket | With Coverage | Without Coverage |
| Under 6 Years | 425 (100.0%) | 0 (0.0%) |
| 6 to 18 Years | 1,697 (100.0%) | 0 (0.0%) |
| 19 to 25 Years | 441 (93.0%) | 33 (7.0%) |
| 26 to 34 Years | 669 (95.6%) | 31 (4.4%) |
| 35 to 44 Years | 771 (98.3%) | 13 (1.7%) |
| 45 to 54 Years | 1,258 (94.8%) | 69 (5.2%) |
| 55 to 64 Years | 676 (96.0%) | 28 (4.0%) |
| 65 to 74 Years | 347 (100.0%) | 0 (0.0%) |
| 75 Years and older | 640 (100.0%) | 0 (0.0%) |
| Total | 6,924 (97.6%) | 174 (2.5%) |
Health Insurance Coverage by Citizenship Status in Winfield
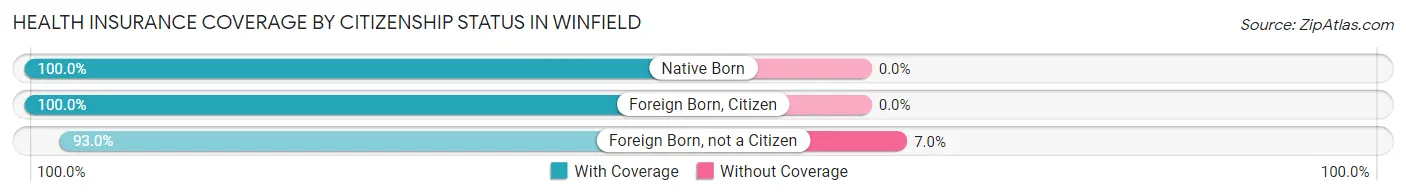
| Citizenship Status | With Coverage | Without Coverage |
| Native Born | 425 (100.0%) | 0 (0.0%) |
| Foreign Born, Citizen | 1,697 (100.0%) | 0 (0.0%) |
| Foreign Born, not a Citizen | 441 (93.0%) | 33 (7.0%) |
Health Insurance Coverage by Household Income in Winfield
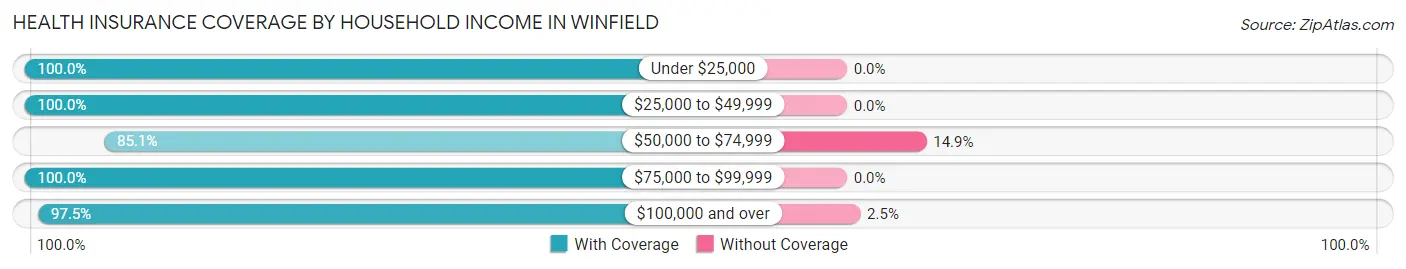
| Household Income | With Coverage | Without Coverage |
| Under $25,000 | 111 (100.0%) | 0 (0.0%) |
| $25,000 to $49,999 | 348 (100.0%) | 0 (0.0%) |
| $50,000 to $74,999 | 160 (85.1%) | 28 (14.9%) |
| $75,000 to $99,999 | 622 (100.0%) | 0 (0.0%) |
| $100,000 and over | 5,683 (97.5%) | 146 (2.5%) |
Public vs Private Health Insurance Coverage by Age in Winfield
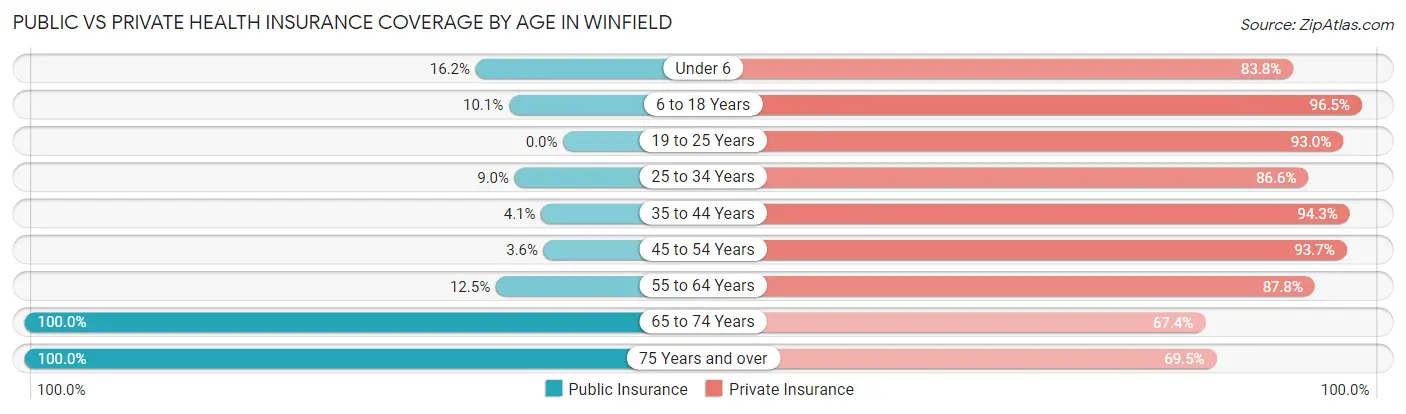
| Age Bracket | Public Insurance | Private Insurance |
| Under 6 | 69 (16.2%) | 356 (83.8%) |
| 6 to 18 Years | 171 (10.1%) | 1,638 (96.5%) |
| 19 to 25 Years | 0 (0.0%) | 441 (93.0%) |
| 25 to 34 Years | 63 (9.0%) | 606 (86.6%) |
| 35 to 44 Years | 32 (4.1%) | 739 (94.3%) |
| 45 to 54 Years | 48 (3.6%) | 1,243 (93.7%) |
| 55 to 64 Years | 88 (12.5%) | 618 (87.8%) |
| 65 to 74 Years | 347 (100.0%) | 234 (67.4%) |
| 75 Years and over | 640 (100.0%) | 445 (69.5%) |
| Total | 1,458 (20.5%) | 6,320 (89.0%) |
Disability Status by Sex by Age in Winfield
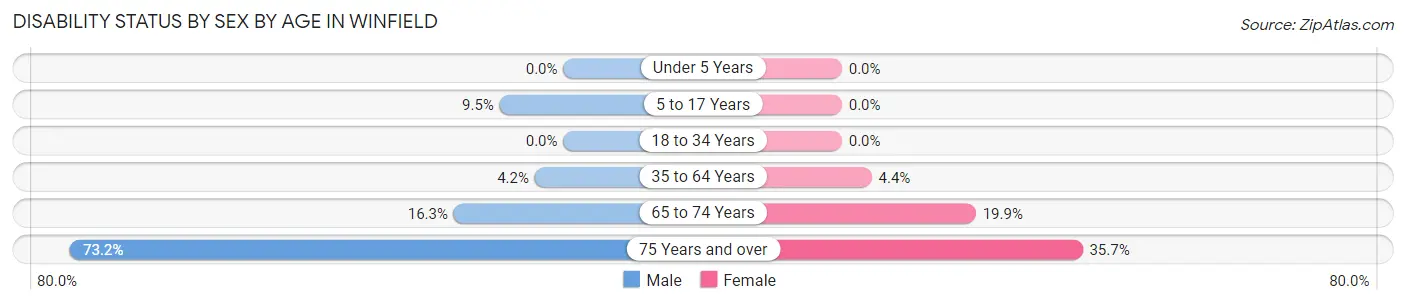
| Age Bracket | Male | Female |
| Under 5 Years | 0 (0.0%) | 0 (0.0%) |
| 5 to 17 Years | 116 (9.5%) | 0 (0.0%) |
| 18 to 34 Years | 0 (0.0%) | 0 (0.0%) |
| 35 to 64 Years | 58 (4.2%) | 64 (4.4%) |
| 65 to 74 Years | 27 (16.3%) | 36 (19.9%) |
| 75 Years and over | 104 (73.2%) | 178 (35.7%) |
Disability Class by Sex by Age in Winfield
Disability Class: Hearing Difficulty
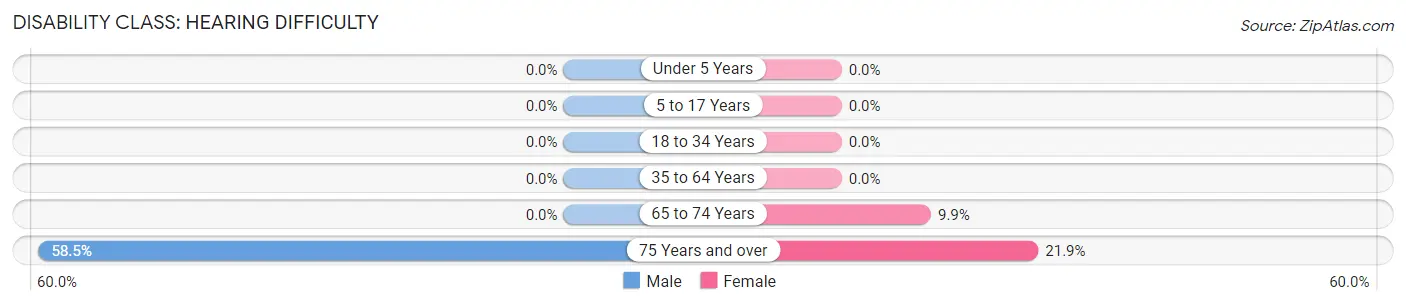
| Age Bracket | Male | Female |
| Under 5 Years | 0 (0.0%) | 0 (0.0%) |
| 5 to 17 Years | 0 (0.0%) | 0 (0.0%) |
| 18 to 34 Years | 0 (0.0%) | 0 (0.0%) |
| 35 to 64 Years | 0 (0.0%) | 0 (0.0%) |
| 65 to 74 Years | 0 (0.0%) | 18 (9.9%) |
| 75 Years and over | 83 (58.5%) | 109 (21.9%) |
Disability Class: Vision Difficulty
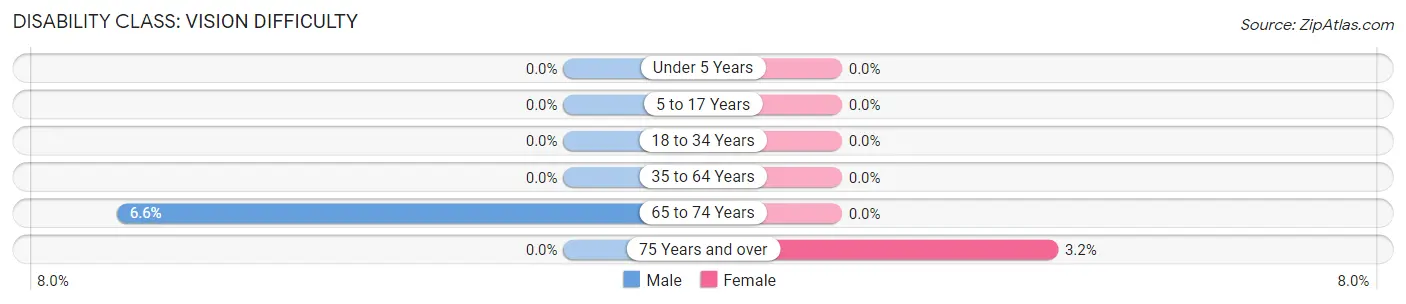
| Age Bracket | Male | Female |
| Under 5 Years | 0 (0.0%) | 0 (0.0%) |
| 5 to 17 Years | 0 (0.0%) | 0 (0.0%) |
| 18 to 34 Years | 0 (0.0%) | 0 (0.0%) |
| 35 to 64 Years | 0 (0.0%) | 0 (0.0%) |
| 65 to 74 Years | 11 (6.6%) | 0 (0.0%) |
| 75 Years and over | 0 (0.0%) | 16 (3.2%) |
Disability Class: Cognitive Difficulty
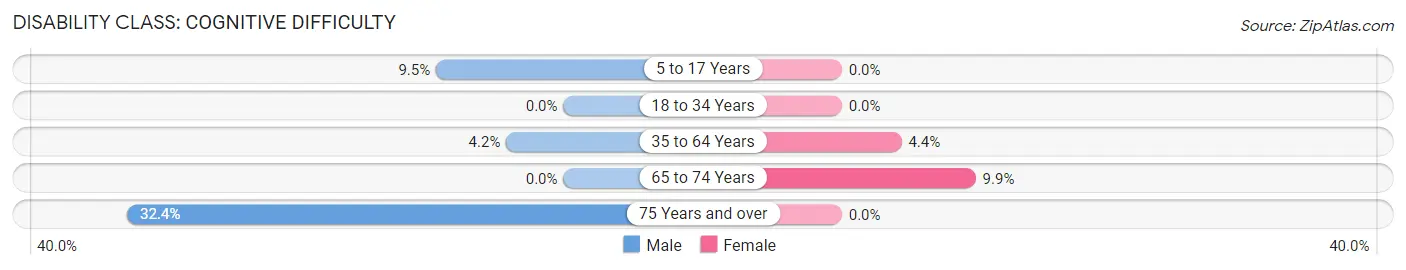
| Age Bracket | Male | Female |
| 5 to 17 Years | 116 (9.5%) | 0 (0.0%) |
| 18 to 34 Years | 0 (0.0%) | 0 (0.0%) |
| 35 to 64 Years | 58 (4.2%) | 64 (4.4%) |
| 65 to 74 Years | 0 (0.0%) | 18 (9.9%) |
| 75 Years and over | 46 (32.4%) | 0 (0.0%) |
Disability Class: Ambulatory Difficulty
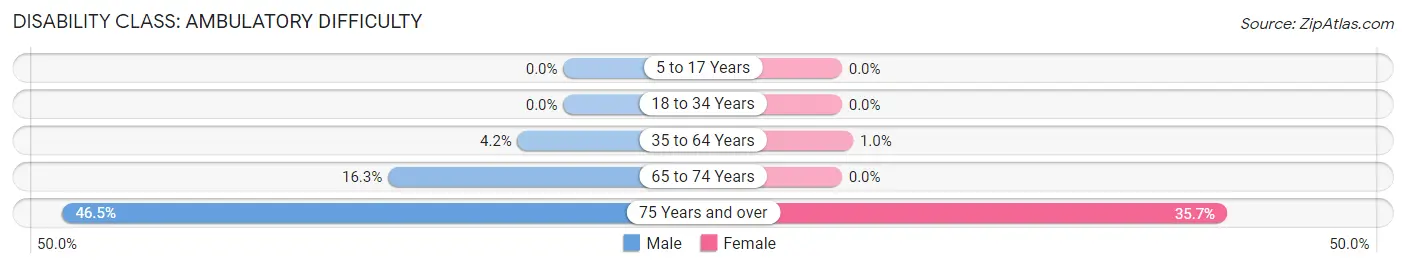
| Age Bracket | Male | Female |
| 5 to 17 Years | 0 (0.0%) | 0 (0.0%) |
| 18 to 34 Years | 0 (0.0%) | 0 (0.0%) |
| 35 to 64 Years | 58 (4.2%) | 15 (1.0%) |
| 65 to 74 Years | 27 (16.3%) | 0 (0.0%) |
| 75 Years and over | 66 (46.5%) | 178 (35.7%) |
Disability Class: Self-Care Difficulty
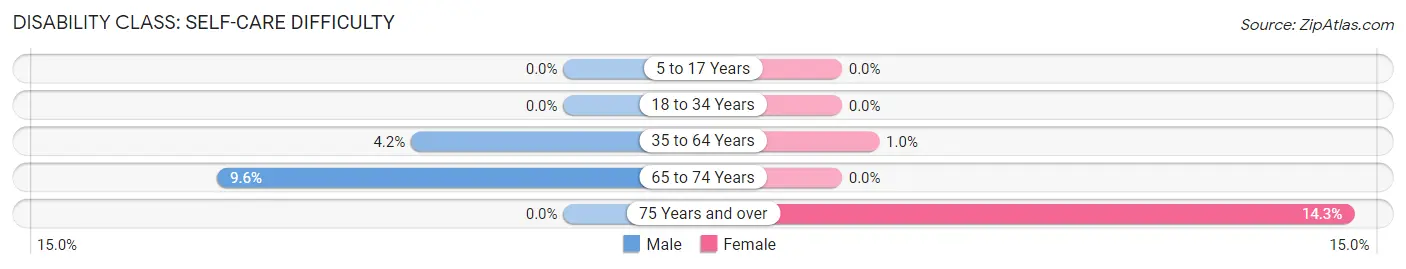
| Age Bracket | Male | Female |
| 5 to 17 Years | 0 (0.0%) | 0 (0.0%) |
| 18 to 34 Years | 0 (0.0%) | 0 (0.0%) |
| 35 to 64 Years | 58 (4.2%) | 15 (1.0%) |
| 65 to 74 Years | 16 (9.6%) | 0 (0.0%) |
| 75 Years and over | 0 (0.0%) | 71 (14.3%) |
Technology Access in Winfield
Computing Device Access in Winfield
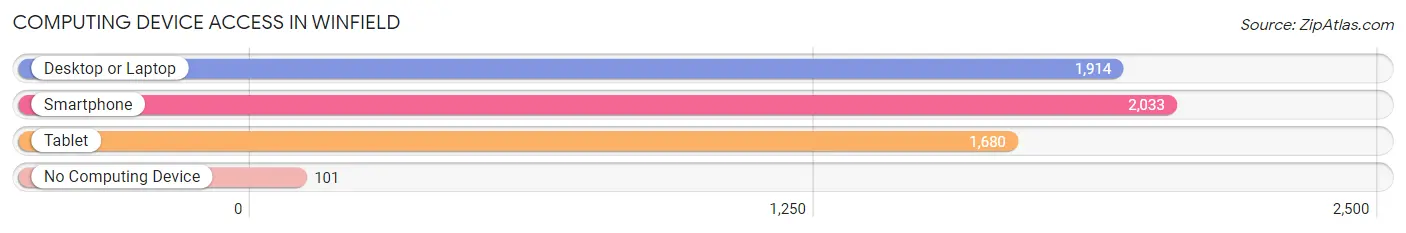
| Device Type | # Households | % Households |
| Desktop or Laptop | 1,914 | 87.1% |
| Smartphone | 2,033 | 92.5% |
| Tablet | 1,680 | 76.4% |
| No Computing Device | 101 | 4.6% |
| Total | 2,198 | 100.0% |
Internet Access in Winfield
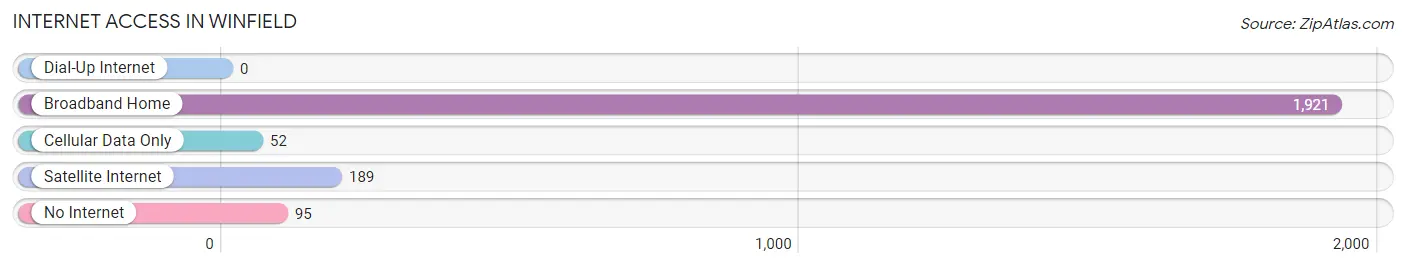
| Internet Type | # Households | % Households |
| Dial-Up Internet | 0 | 0.0% |
| Broadband Home | 1,921 | 87.4% |
| Cellular Data Only | 52 | 2.4% |
| Satellite Internet | 189 | 8.6% |
| No Internet | 95 | 4.3% |
| Total | 2,198 | 100.0% |
Winfield Summary
Winfield, Indiana is a small town located in the northwest corner of the state, just south of the Illinois border. It is part of the Chicago metropolitan area and is located in Lake County. The population of Winfield was 4,845 at the 2010 census.
History
The area that is now Winfield was first settled in the early 1800s by a group of German immigrants. The town was originally known as Germanville, but was later renamed Winfield in 1837 after a local landowner, William Winfield. The town was officially incorporated in 1867.
In the late 1800s, Winfield was a thriving agricultural community. The town was home to several grain mills, a sawmill, and a brickyard. The town also had a railroad station, which connected it to the larger cities of Chicago and Milwaukee.
In the early 1900s, Winfield began to experience a decline in population as many of its residents moved away to larger cities. The town was also hit hard by the Great Depression, and many of its businesses closed.
Geography
Winfield is located in the northwest corner of Indiana, just south of the Illinois border. It is part of the Chicago metropolitan area and is located in Lake County. The town is situated on the banks of the Kankakee River, which flows through the town.
The town has a total area of 2.2 square miles, all of which is land. Winfield is located about 40 miles south of Chicago and about 25 miles west of Gary.
Economy
The economy of Winfield is largely based on agriculture. The town is home to several farms, which produce a variety of crops, including corn, soybeans, and wheat. The town also has several small businesses, including a grocery store, a hardware store, and a few restaurants.
The town is also home to a few manufacturing companies, including a plastics factory and a metal fabrication plant. The town is also home to a few small technology companies, which provide software and web development services.
Demographics
As of the 2010 census, the population of Winfield was 4,845. The town has a median age of 39.7 years, and the median household income is $50,945. The town is predominantly white, with 87.3% of the population identifying as such. The town also has a small Hispanic population, with 5.3% of the population identifying as Hispanic or Latino.
Conclusion
Winfield, Indiana is a small town located in the northwest corner of the state, just south of the Illinois border. It is part of the Chicago metropolitan area and is located in Lake County. The town has a population of 4,845 and is predominantly white. The economy of Winfield is largely based on agriculture, with several farms producing a variety of crops. The town also has several small businesses, including a grocery store, a hardware store, and a few restaurants. The town is also home to a few manufacturing companies and technology companies.
Common Questions
What is Per Capita Income in Winfield?
Per Capita income in Winfield is $42,226.
What is the Median Family Income in Winfield?
Median Family Income in Winfield is $130,741.
What is the Median Household income in Winfield?
Median Household Income in Winfield is $124,091.
What is Income or Wage Gap in Winfield?
Income or Wage Gap in Winfield is 51.5%.
Women in Winfield earn 48.5 cents for every dollar earned by a man.
What is Inequality or Gini Index in Winfield?
Inequality or Gini Index in Winfield is 0.33.
What is the Total Population of Winfield?
Total Population of Winfield is 7,219.
What is the Total Male Population of Winfield?
Total Male Population of Winfield is 4,115.
What is the Total Female Population of Winfield?
Total Female Population of Winfield is 3,104.
What is the Ratio of Males per 100 Females in Winfield?
There are 132.57 Males per 100 Females in Winfield.
What is the Ratio of Females per 100 Males in Winfield?
There are 75.43 Females per 100 Males in Winfield.
What is the Median Population Age in Winfield?
Median Population Age in Winfield is 38.8 Years.
What is the Average Family Size in Winfield
Average Family Size in Winfield is 3.7 People.
What is the Average Household Size in Winfield
Average Household Size in Winfield is 3.2 People.
How Large is the Labor Force in Winfield?
There are 3,702 People in the Labor Forcein in Winfield.
What is the Percentage of People in the Labor Force in Winfield?
67.4% of People are in the Labor Force in Winfield.
What is the Unemployment Rate in Winfield?
Unemployment Rate in Winfield is 5.1%.