Stockett, MT Map & Demographics
Stockett Map
Stockett Overview
$21,313
PER CAPITA INCOME
$38,472
AVG HOUSEHOLD INCOME
0.39
INEQUALITY / GINI INDEX
150
TOTAL POPULATION
73
MALE POPULATION
77
FEMALE POPULATION
94.81
MALES / 100 FEMALES
105.48
FEMALES / 100 MALES
61.3
MEDIAN AGE
3.8
AVG FAMILY SIZE
2.8
AVG HOUSEHOLD SIZE
72
LABOR FORCE [ PEOPLE ]
56.3%
PERCENT IN LABOR FORCE
6.0%
UNEMPLOYMENT RATE
Stockett Zip Codes
Stockett Area Codes
Income in Stockett
Income Overview in Stockett
| Characteristic | Number | Measure |
| Per Capita Income | 150 | $21,313 |
| Median Family Income | 33 | $0 |
| Mean Family Income | 33 | $66,345 |
| Median Household Income | 53 | $38,472 |
| Mean Household Income | 53 | $49,508 |
| Income Deficit | 33 | $0 |
| Wage / Income Gap (%) | 150 | 0.00% |
| Wage / Income Gap ($) | 150 | 100.00¢ per $1 |
| Gini / Inequality Index | 150 | 0.39 |
Earnings by Sex in Stockett
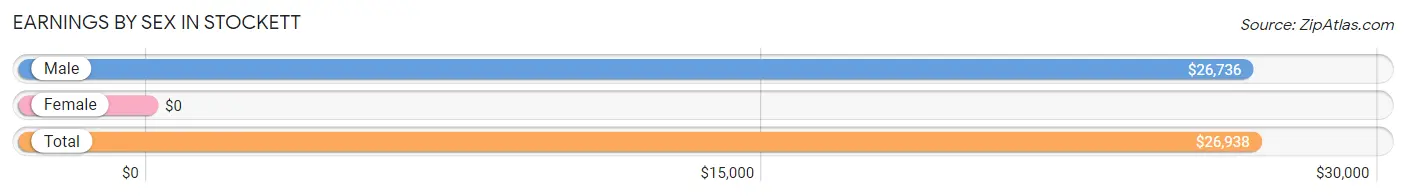
| Sex | Number | Average Earnings |
| Male | 49 (63.6%) | $26,736 |
| Female | 28 (36.4%) | $0 |
| Total | 77 (100.0%) | $26,938 |
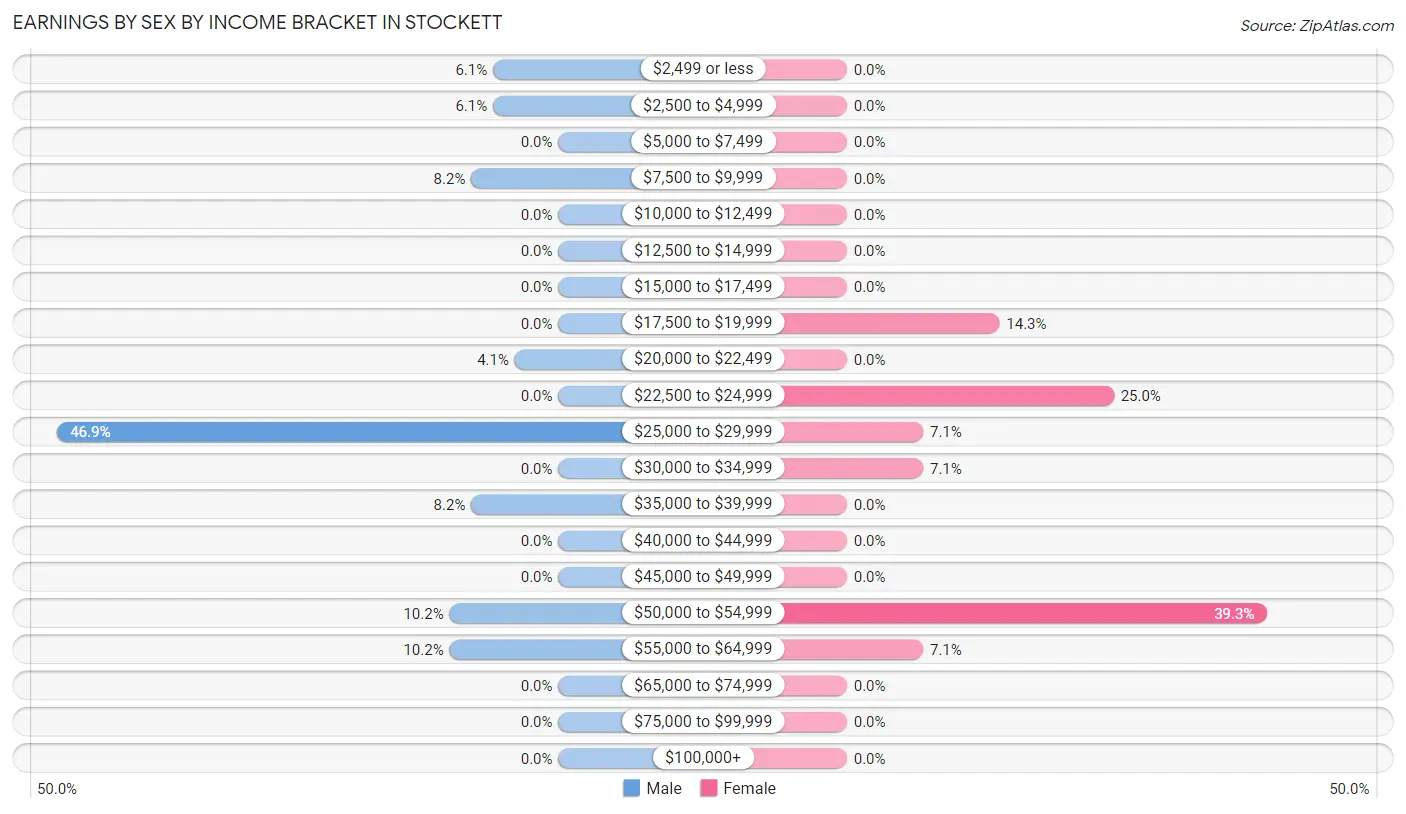
Earnings by Sex by Income Bracket in Stockett
The most common earnings brackets in Stockett are $25,000 to $29,999 for men (23 | 46.9%) and $50,000 to $54,999 for women (11 | 39.3%).
| Income | Male | Female |
| $2,499 or less | 3 (6.1%) | 0 (0.0%) |
| $2,500 to $4,999 | 3 (6.1%) | 0 (0.0%) |
| $5,000 to $7,499 | 0 (0.0%) | 0 (0.0%) |
| $7,500 to $9,999 | 4 (8.2%) | 0 (0.0%) |
| $10,000 to $12,499 | 0 (0.0%) | 0 (0.0%) |
| $12,500 to $14,999 | 0 (0.0%) | 0 (0.0%) |
| $15,000 to $17,499 | 0 (0.0%) | 0 (0.0%) |
| $17,500 to $19,999 | 0 (0.0%) | 4 (14.3%) |
| $20,000 to $22,499 | 2 (4.1%) | 0 (0.0%) |
| $22,500 to $24,999 | 0 (0.0%) | 7 (25.0%) |
| $25,000 to $29,999 | 23 (46.9%) | 2 (7.1%) |
| $30,000 to $34,999 | 0 (0.0%) | 2 (7.1%) |
| $35,000 to $39,999 | 4 (8.2%) | 0 (0.0%) |
| $40,000 to $44,999 | 0 (0.0%) | 0 (0.0%) |
| $45,000 to $49,999 | 0 (0.0%) | 0 (0.0%) |
| $50,000 to $54,999 | 5 (10.2%) | 11 (39.3%) |
| $55,000 to $64,999 | 5 (10.2%) | 2 (7.1%) |
| $65,000 to $74,999 | 0 (0.0%) | 0 (0.0%) |
| $75,000 to $99,999 | 0 (0.0%) | 0 (0.0%) |
| $100,000+ | 0 (0.0%) | 0 (0.0%) |
| Total | 49 (100.0%) | 28 (100.0%) |
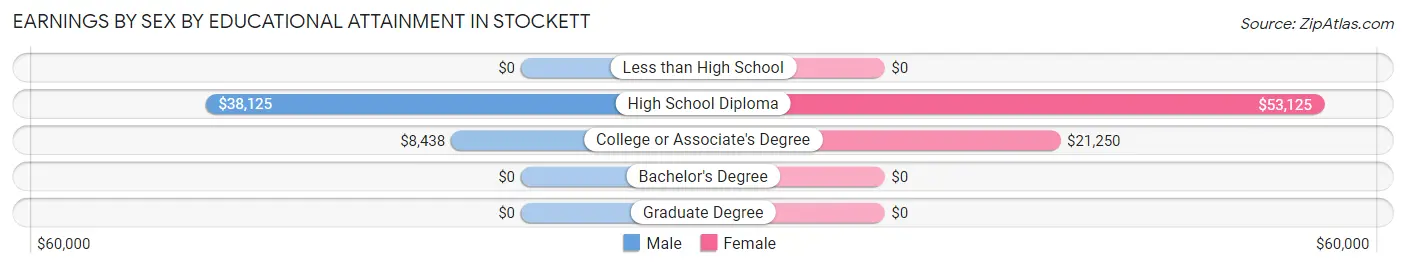
Earnings by Sex by Educational Attainment in Stockett
Average earnings in Stockett are $27,292 for men and $52,841 for women, a difference of 48.3%. Men with an educational attainment of high school diploma enjoy the highest average annual earnings of $38,125, while those with college or associate's degree education earn the least with $8,438. Women with an educational attainment of high school diploma earn the most with the average annual earnings of $53,125, while those with college or associate's degree education have the smallest earnings of $21,250.
| Educational Attainment | Male Income | Female Income |
| Less than High School | - | - |
| High School Diploma | $38,125 | $53,125 |
| College or Associate's Degree | $8,438 | $21,250 |
| Bachelor's Degree | - | - |
| Graduate Degree | - | - |
| Total | $27,292 | $52,841 |
Family Income in Stockett
Family Income Brackets in Stockett
According to the Stockett family income data, there are 16 families falling into the $35,000 to $49,999 income range, which is the most common income bracket and makes up 48.5% of all families.
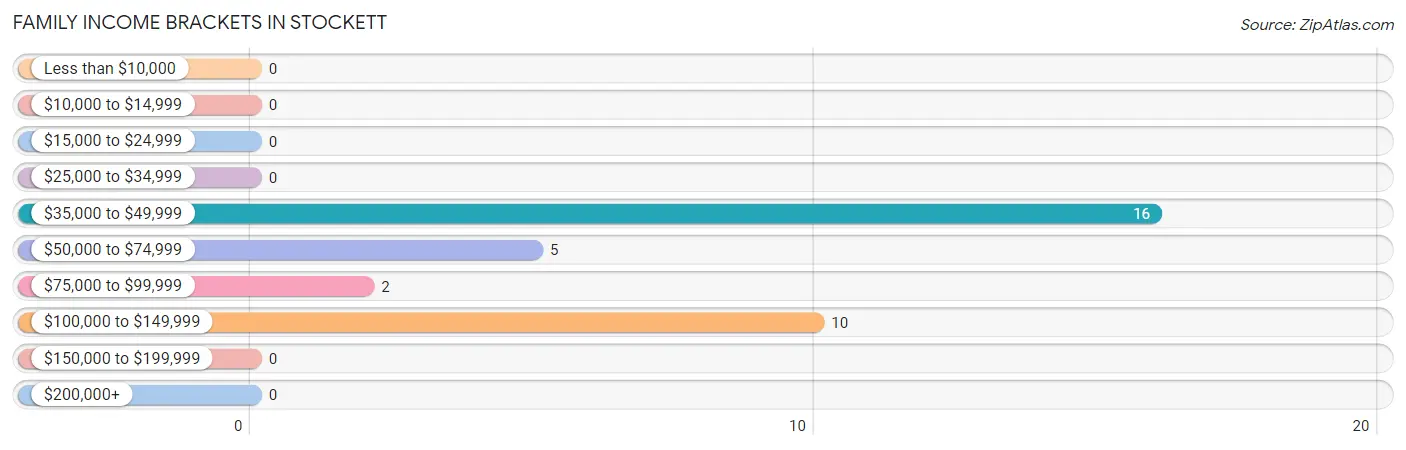
| Income Bracket | # Families | % Families |
| Less than $10,000 | 0 | 0.0% |
| $10,000 to $14,999 | 0 | 0.0% |
| $15,000 to $24,999 | 0 | 0.0% |
| $25,000 to $34,999 | 0 | 0.0% |
| $35,000 to $49,999 | 16 | 48.5% |
| $50,000 to $74,999 | 5 | 15.2% |
| $75,000 to $99,999 | 2 | 6.1% |
| $100,000 to $149,999 | 10 | 30.3% |
| $150,000 to $199,999 | 0 | 0.0% |
| $200,000+ | 0 | 0.0% |
Family Income by Famaliy Size in Stockett
3-person families (10 | 30.3%) account for the highest median family income in Stockett with $72,500 per family, while 3-person families (10 | 30.3%) have the highest median income of $24,167 per family member.
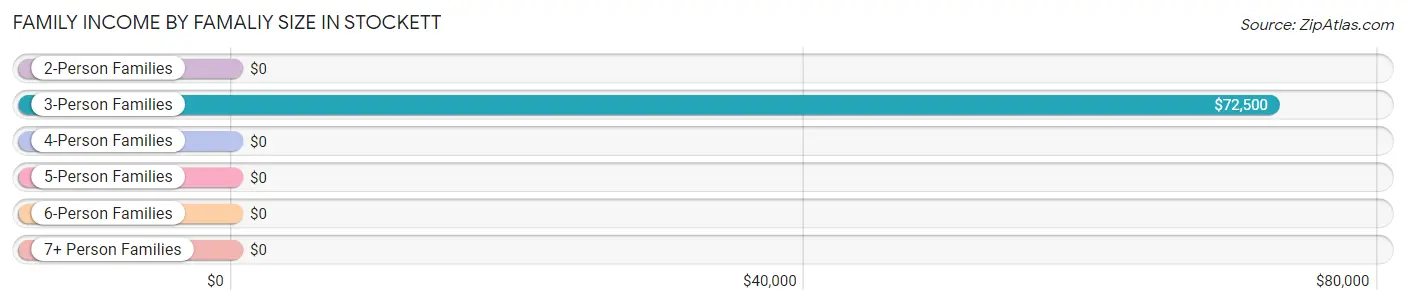
| Income Bracket | # Families | Median Income |
| 2-Person Families | 19 (57.6%) | $0 |
| 3-Person Families | 10 (30.3%) | $72,500 |
| 4-Person Families | 0 (0.0%) | $0 |
| 5-Person Families | 0 (0.0%) | $0 |
| 6-Person Families | 0 (0.0%) | $0 |
| 7+ Person Families | 4 (12.1%) | $0 |
| Total | 33 (100.0%) | $0 |
Family Income by Number of Earners in Stockett
| Number of Earners | # Families | Median Income |
| No Earners | 0 (0.0%) | $0 |
| 1 Earner | 12 (36.4%) | $0 |
| 2 Earners | 16 (48.5%) | $0 |
| 3+ Earners | 5 (15.1%) | $0 |
| Total | 33 (100.0%) | $0 |
Household Income in Stockett
Household Income Brackets in Stockett
With 25 households falling in the category, the $35,000 to $49,999 income range is the most frequent in Stockett, accounting for 47.2% of all households.
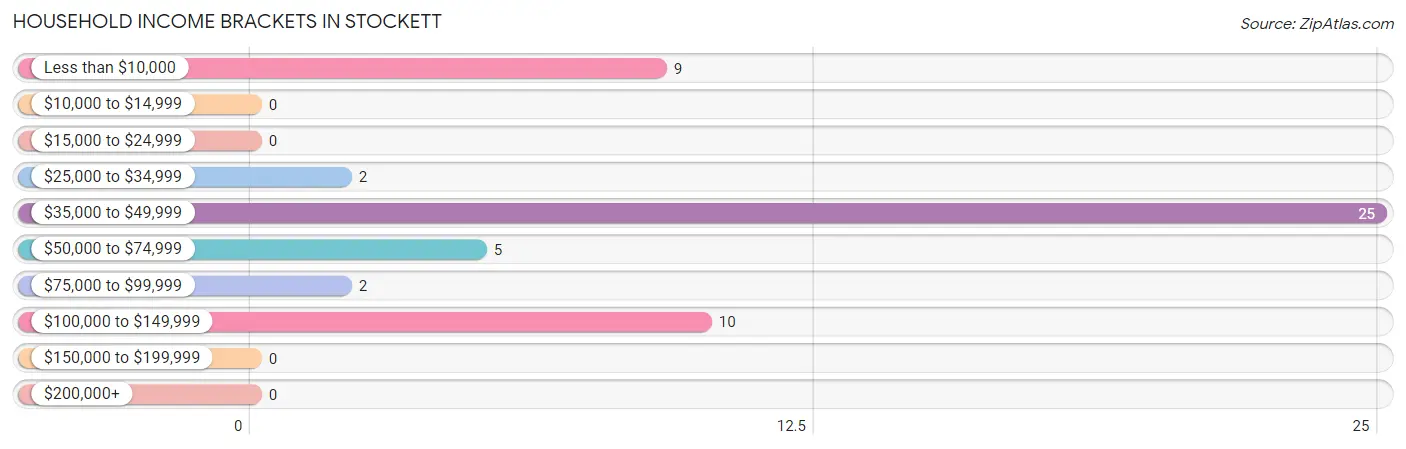
| Income Bracket | # Households | % Households |
| Less than $10,000 | 9 | 17.0% |
| $10,000 to $14,999 | 0 | 0.0% |
| $15,000 to $24,999 | 0 | 0.0% |
| $25,000 to $34,999 | 2 | 3.8% |
| $35,000 to $49,999 | 25 | 47.2% |
| $50,000 to $74,999 | 5 | 9.4% |
| $75,000 to $99,999 | 2 | 3.8% |
| $100,000 to $149,999 | 10 | 18.9% |
| $150,000 to $199,999 | 0 | 0.0% |
| $200,000+ | 0 | 0.0% |
Household Income by Householder Age in Stockett
The median household income in Stockett is $38,472, with the highest median household income of $37,396 found in the 45 to 64 years age bracket for the primary householder. A total of 27 households (50.9%) fall into this category. Meanwhile, the 15 to 24 years age bracket for the primary householder has the lowest median household income of $0, with 5 households (9.4%) in this group.
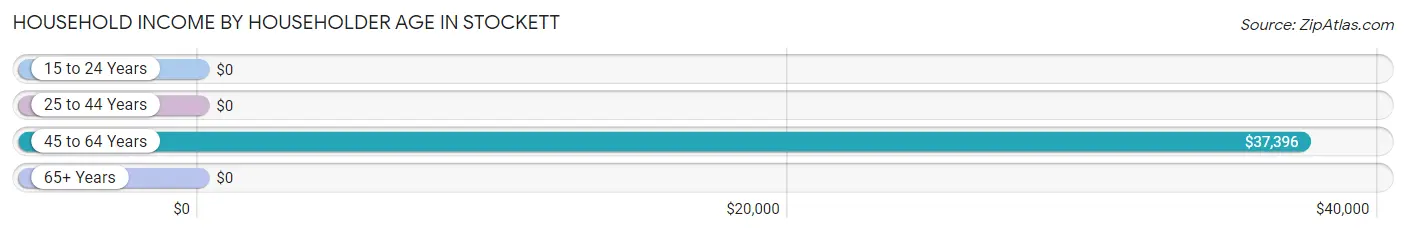
| Income Bracket | # Households | Median Income |
| 15 to 24 Years | 5 (9.4%) | $0 |
| 25 to 44 Years | 4 (7.5%) | $0 |
| 45 to 64 Years | 27 (50.9%) | $37,396 |
| 65+ Years | 17 (32.1%) | $0 |
| Total | 53 (100.0%) | $38,472 |
Poverty in Stockett
Income Below Poverty by Sex and Age in Stockett
With 13.7% poverty level for males and 3.9% for females among the residents of Stockett, 75 year old and over males and 75 year old and over females are the most vulnerable to poverty, with 6 males (100.0%) and 3 females (100.0%) in their respective age groups living below the poverty level.
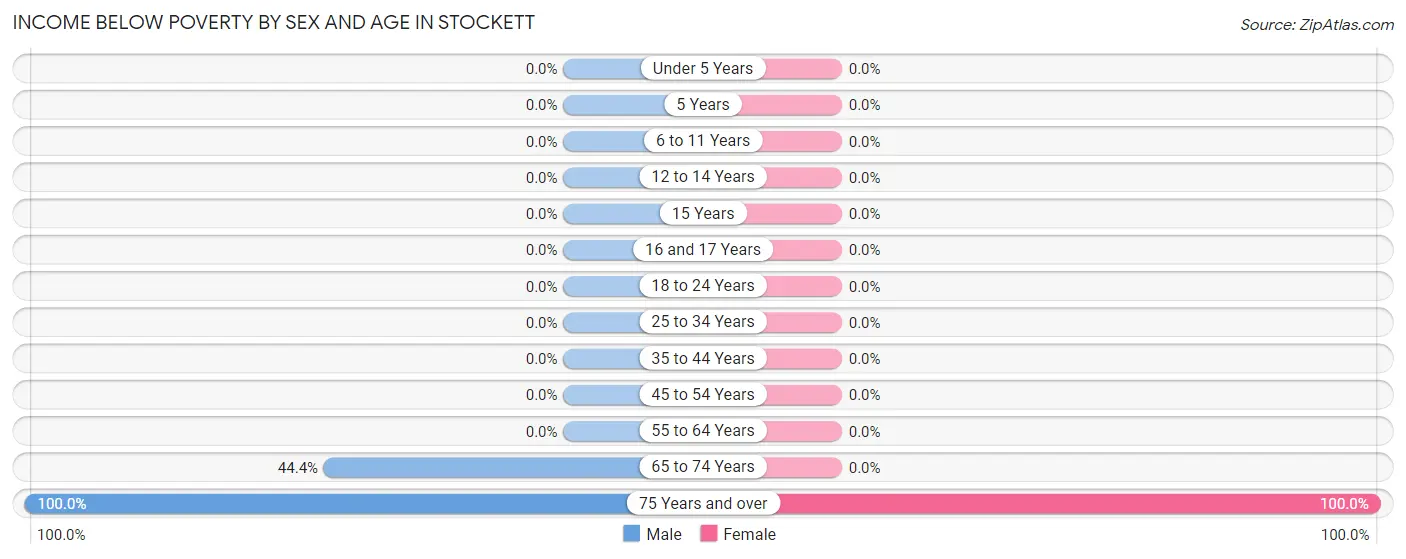
| Age Bracket | Male | Female |
| Under 5 Years | 0 (0.0%) | 0 (0.0%) |
| 5 Years | 0 (0.0%) | 0 (0.0%) |
| 6 to 11 Years | 0 (0.0%) | 0 (0.0%) |
| 12 to 14 Years | 0 (0.0%) | 0 (0.0%) |
| 15 Years | 0 (0.0%) | 0 (0.0%) |
| 16 and 17 Years | 0 (0.0%) | 0 (0.0%) |
| 18 to 24 Years | 0 (0.0%) | 0 (0.0%) |
| 25 to 34 Years | 0 (0.0%) | 0 (0.0%) |
| 35 to 44 Years | 0 (0.0%) | 0 (0.0%) |
| 45 to 54 Years | 0 (0.0%) | 0 (0.0%) |
| 55 to 64 Years | 0 (0.0%) | 0 (0.0%) |
| 65 to 74 Years | 4 (44.4%) | 0 (0.0%) |
| 75 Years and over | 6 (100.0%) | 3 (100.0%) |
| Total | 10 (13.7%) | 3 (3.9%) |
Income Above Poverty by Sex and Age in Stockett
According to the poverty statistics in Stockett, males aged 6 to 11 years and females aged under 5 years are the age groups that are most secure financially, with 100.0% of males and 100.0% of females in these age groups living above the poverty line.
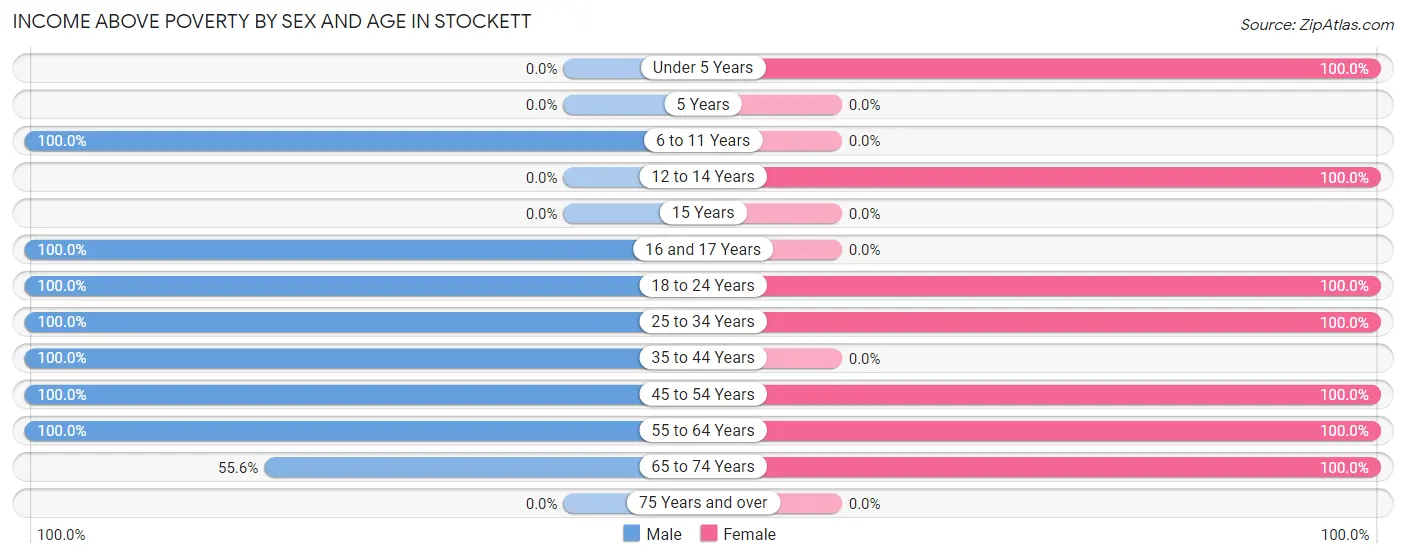
| Age Bracket | Male | Female |
| Under 5 Years | 0 (0.0%) | 8 (100.0%) |
| 5 Years | 0 (0.0%) | 0 (0.0%) |
| 6 to 11 Years | 9 (100.0%) | 0 (0.0%) |
| 12 to 14 Years | 0 (0.0%) | 5 (100.0%) |
| 15 Years | 0 (0.0%) | 0 (0.0%) |
| 16 and 17 Years | 8 (100.0%) | 0 (0.0%) |
| 18 to 24 Years | 6 (100.0%) | 5 (100.0%) |
| 25 to 34 Years | 5 (100.0%) | 4 (100.0%) |
| 35 to 44 Years | 4 (100.0%) | 0 (0.0%) |
| 45 to 54 Years | 8 (100.0%) | 3 (100.0%) |
| 55 to 64 Years | 18 (100.0%) | 14 (100.0%) |
| 65 to 74 Years | 5 (55.6%) | 35 (100.0%) |
| 75 Years and over | 0 (0.0%) | 0 (0.0%) |
| Total | 63 (86.3%) | 74 (96.1%) |
Income Below Poverty Among Married-Couple Families in Stockett
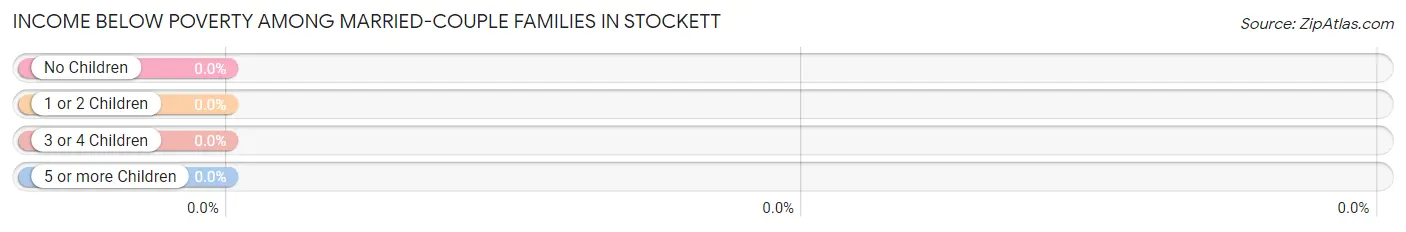
| Children | Above Poverty | Below Poverty |
| No Children | 21 (100.0%) | 0 (0.0%) |
| 1 or 2 Children | 8 (100.0%) | 0 (0.0%) |
| 3 or 4 Children | 0 (0.0%) | 0 (0.0%) |
| 5 or more Children | 4 (100.0%) | 0 (0.0%) |
| Total | 33 (100.0%) | 0 (0.0%) |
Income Below Poverty Among Single-Parent Households in Stockett
| Children | Single Father | Single Mother |
| No Children | 0 (0.0%) | 0 (0.0%) |
| 1 or 2 Children | 0 (0.0%) | 0 (0.0%) |
| 3 or 4 Children | 0 (0.0%) | 0 (0.0%) |
| 5 or more Children | 0 (0.0%) | 0 (0.0%) |
| Total | 0 (0.0%) | 0 (0.0%) |
Income Below Poverty Among Married-Couple vs Single-Parent Households in Stockett
| Children | Married-Couple Families | Single-Parent Households |
| No Children | 0 (0.0%) | 0 (0.0%) |
| 1 or 2 Children | 0 (0.0%) | 0 (0.0%) |
| 3 or 4 Children | 0 (0.0%) | 0 (0.0%) |
| 5 or more Children | 0 (0.0%) | 0 (0.0%) |
| Total | 0 (0.0%) | 0 (0.0%) |
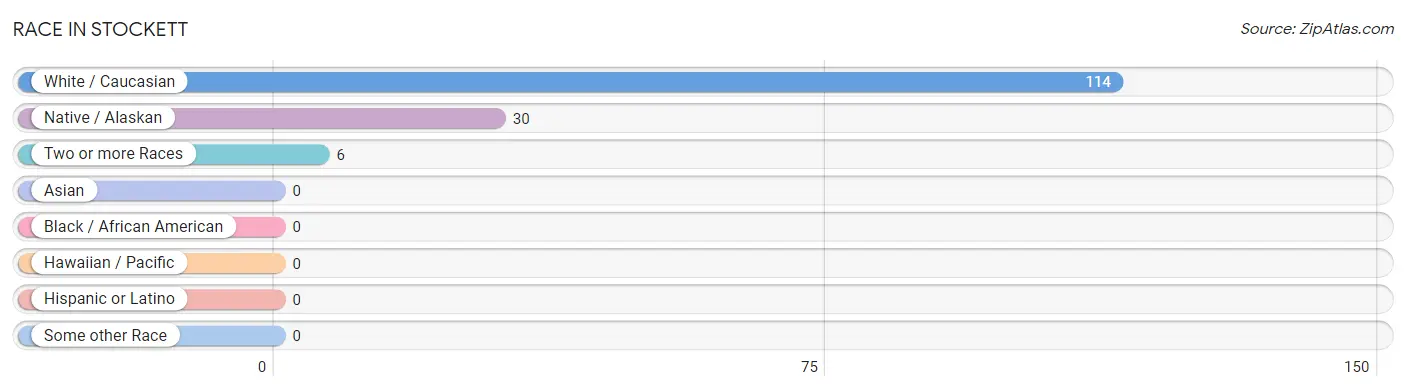
Race in Stockett
The most populous races in Stockett are White / Caucasian (114 | 76.0%), Native / Alaskan (30 | 20.0%), and Two or more Races (6 | 4.0%).
| Race | # Population | % Population |
| Asian | 0 | 0.0% |
| Black / African American | 0 | 0.0% |
| Hawaiian / Pacific | 0 | 0.0% |
| Hispanic or Latino | 0 | 0.0% |
| Native / Alaskan | 30 | 20.0% |
| White / Caucasian | 114 | 76.0% |
| Two or more Races | 6 | 4.0% |
| Some other Race | 0 | 0.0% |
| Total | 150 | 100.0% |
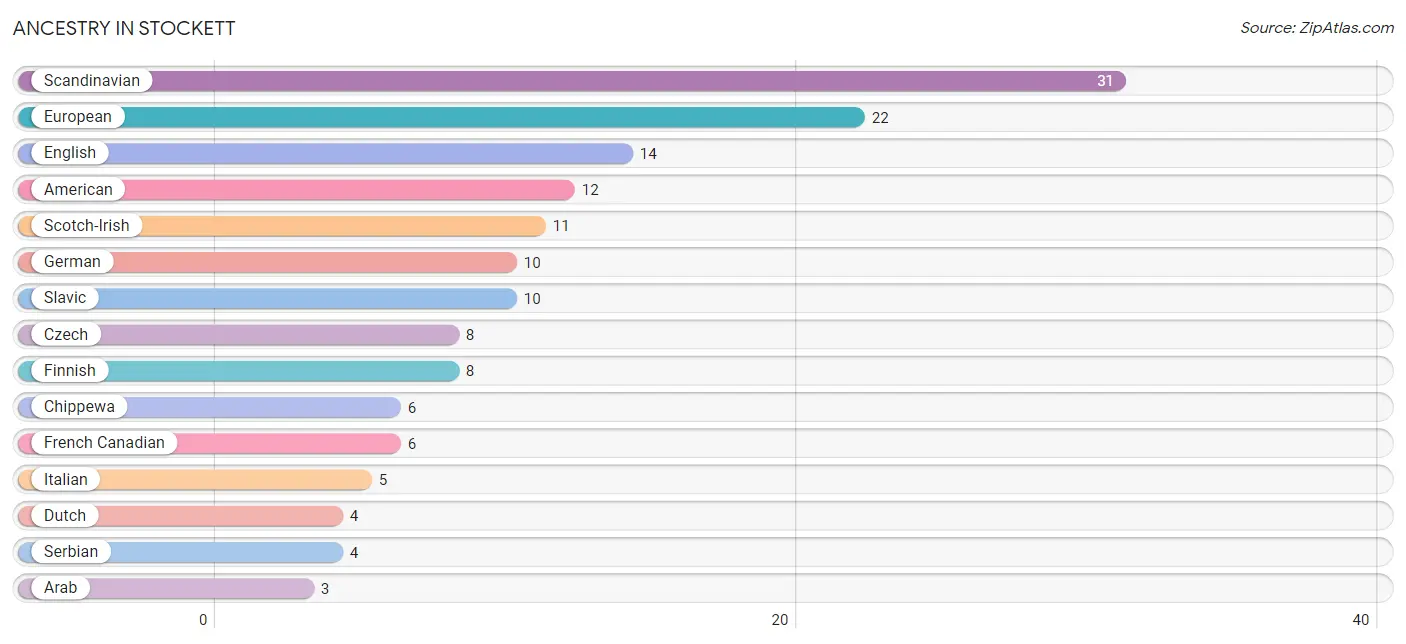
Ancestry in Stockett
The most populous ancestries reported in Stockett are Scandinavian (31 | 20.7%), European (22 | 14.7%), English (14 | 9.3%), American (12 | 8.0%), and Scotch-Irish (11 | 7.3%), together accounting for 60.0% of all Stockett residents.
| Ancestry | # Population | % Population |
| American | 12 | 8.0% |
| Arab | 3 | 2.0% |
| Chippewa | 6 | 4.0% |
| Czech | 8 | 5.3% |
| Dutch | 4 | 2.7% |
| English | 14 | 9.3% |
| European | 22 | 14.7% |
| Finnish | 8 | 5.3% |
| French Canadian | 6 | 4.0% |
| German | 10 | 6.7% |
| Greek | 3 | 2.0% |
| Italian | 5 | 3.3% |
| Lebanese | 3 | 2.0% |
| Norwegian | 2 | 1.3% |
| Scandinavian | 31 | 20.7% |
| Scotch-Irish | 11 | 7.3% |
| Scottish | 3 | 2.0% |
| Serbian | 4 | 2.7% |
| Slavic | 10 | 6.7% | View All 19 Rows |
Immigrants in Stockett
The most numerous immigrant groups reported in Stockett came from Europe (4 | 2.7%), Netherlands (4 | 2.7%), Western Europe (4 | 2.7%), Asia (3 | 2.0%), and Eastern Asia (3 | 2.0%), together accounting for 12.0% of all Stockett residents.
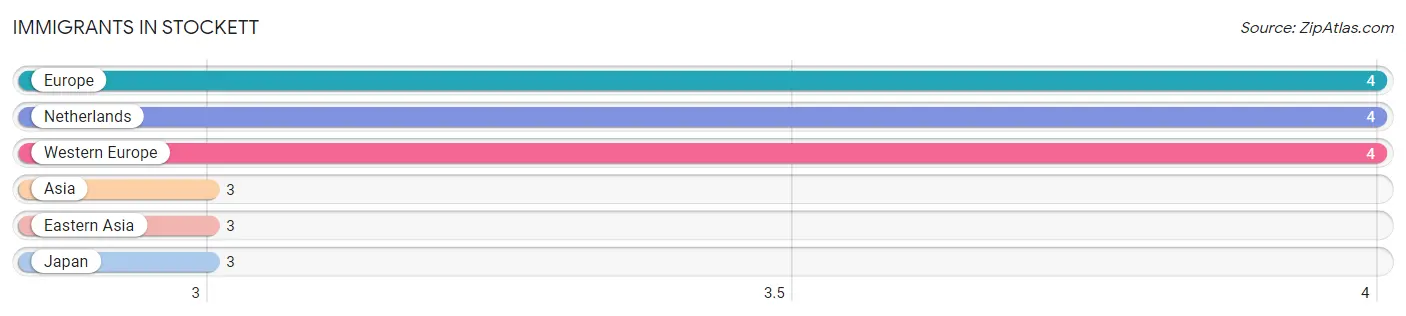
| Immigration Origin | # Population | % Population |
| Asia | 3 | 2.0% |
| Eastern Asia | 3 | 2.0% |
| Europe | 4 | 2.7% |
| Japan | 3 | 2.0% |
| Netherlands | 4 | 2.7% |
| Western Europe | 4 | 2.7% | View All 6 Rows |
Sex and Age in Stockett
Sex and Age in Stockett
The most populous age groups in Stockett are 60 to 64 Years (14 | 19.2%) for men and 65 to 69 Years (32 | 41.6%) for women.
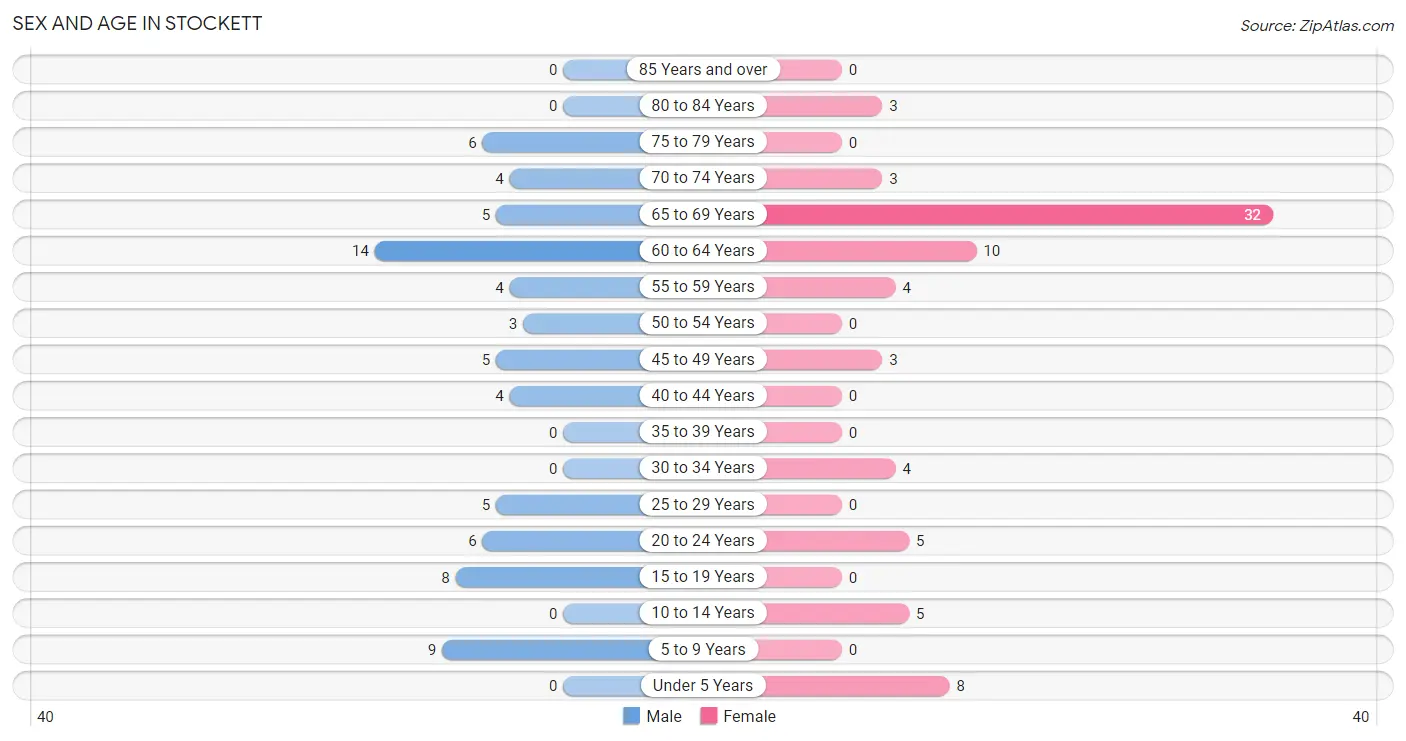
| Age Bracket | Male | Female |
| Under 5 Years | 0 (0.0%) | 8 (10.4%) |
| 5 to 9 Years | 9 (12.3%) | 0 (0.0%) |
| 10 to 14 Years | 0 (0.0%) | 5 (6.5%) |
| 15 to 19 Years | 8 (11.0%) | 0 (0.0%) |
| 20 to 24 Years | 6 (8.2%) | 5 (6.5%) |
| 25 to 29 Years | 5 (6.9%) | 0 (0.0%) |
| 30 to 34 Years | 0 (0.0%) | 4 (5.2%) |
| 35 to 39 Years | 0 (0.0%) | 0 (0.0%) |
| 40 to 44 Years | 4 (5.5%) | 0 (0.0%) |
| 45 to 49 Years | 5 (6.9%) | 3 (3.9%) |
| 50 to 54 Years | 3 (4.1%) | 0 (0.0%) |
| 55 to 59 Years | 4 (5.5%) | 4 (5.2%) |
| 60 to 64 Years | 14 (19.2%) | 10 (13.0%) |
| 65 to 69 Years | 5 (6.9%) | 32 (41.6%) |
| 70 to 74 Years | 4 (5.5%) | 3 (3.9%) |
| 75 to 79 Years | 6 (8.2%) | 0 (0.0%) |
| 80 to 84 Years | 0 (0.0%) | 3 (3.9%) |
| 85 Years and over | 0 (0.0%) | 0 (0.0%) |
| Total | 73 (100.0%) | 77 (100.0%) |
Families and Households in Stockett
Median Family Size in Stockett
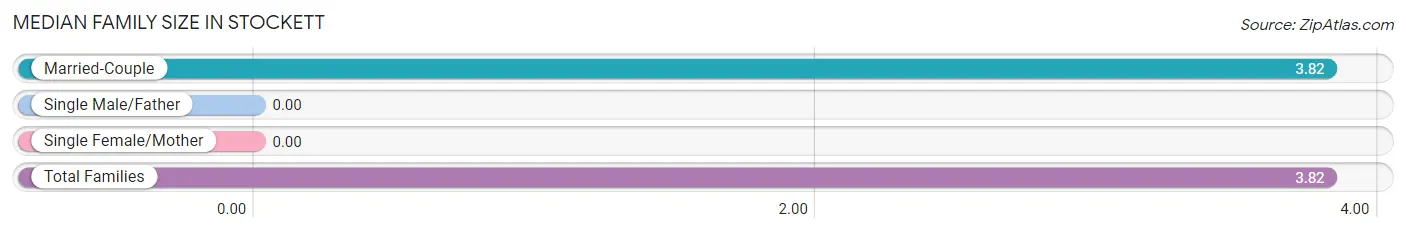
| Family Type | # Families | Family Size |
| Married-Couple | 33 (100.0%) | 3.82 |
| Single Male/Father | 0 (0.0%) | - |
| Single Female/Mother | 0 (0.0%) | - |
| Total Families | 33 (100.0%) | 3.82 |
Median Household Size in Stockett
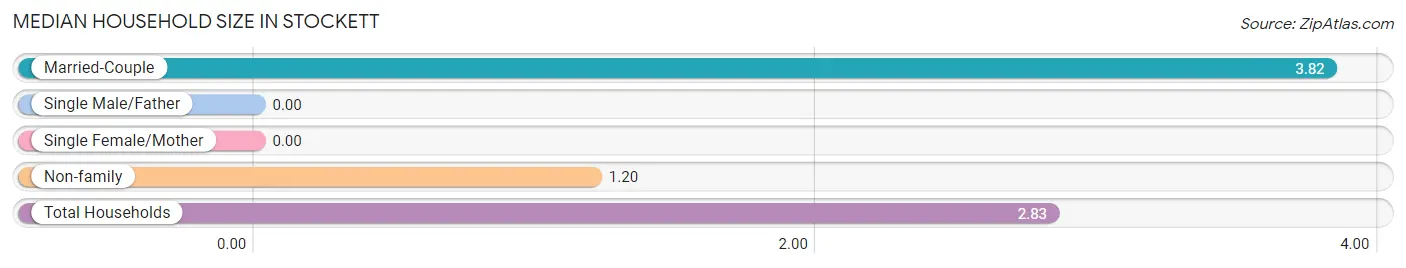
| Household Type | # Households | Household Size |
| Married-Couple | 33 (62.3%) | 3.82 |
| Single Male/Father | 0 (0.0%) | - |
| Single Female/Mother | 0 (0.0%) | - |
| Non-family | 20 (37.7%) | 1.20 |
| Total Households | 53 (100.0%) | 2.83 |
Household Size by Marriage Status in Stockett
Out of a total of 53 households in Stockett, 33 (62.3%) are family households, while 20 (37.7%) are nonfamily households. The most numerous type of family households are 2-person households, comprising 19, and the most common type of nonfamily households are 1-person households, comprising 17.
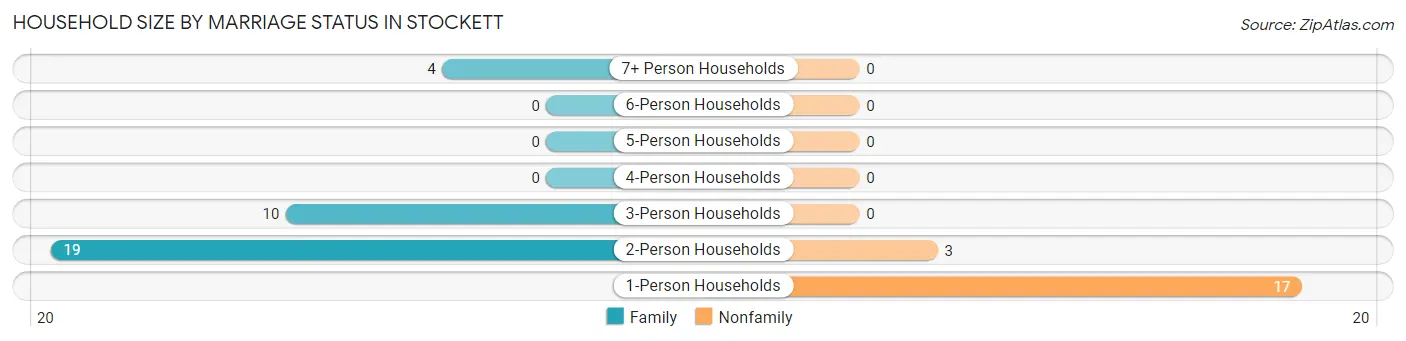
| Household Size | Family Households | Nonfamily Households |
| 1-Person Households | - | 17 (32.1%) |
| 2-Person Households | 19 (35.8%) | 3 (5.7%) |
| 3-Person Households | 10 (18.9%) | 0 (0.0%) |
| 4-Person Households | 0 (0.0%) | 0 (0.0%) |
| 5-Person Households | 0 (0.0%) | 0 (0.0%) |
| 6-Person Households | 0 (0.0%) | 0 (0.0%) |
| 7+ Person Households | 4 (7.5%) | 0 (0.0%) |
| Total | 33 (62.3%) | 20 (37.7%) |
Female Fertility in Stockett
Fertility by Age in Stockett
Average fertility rate in Stockett is 417.0 births per 1,000 women. Women in the age bracket of 20 to 34 years have the highest fertility rate with 556.0 births per 1,000 women. Women in the age bracket of 20 to 34 years acount for 100.0% of all women with births.
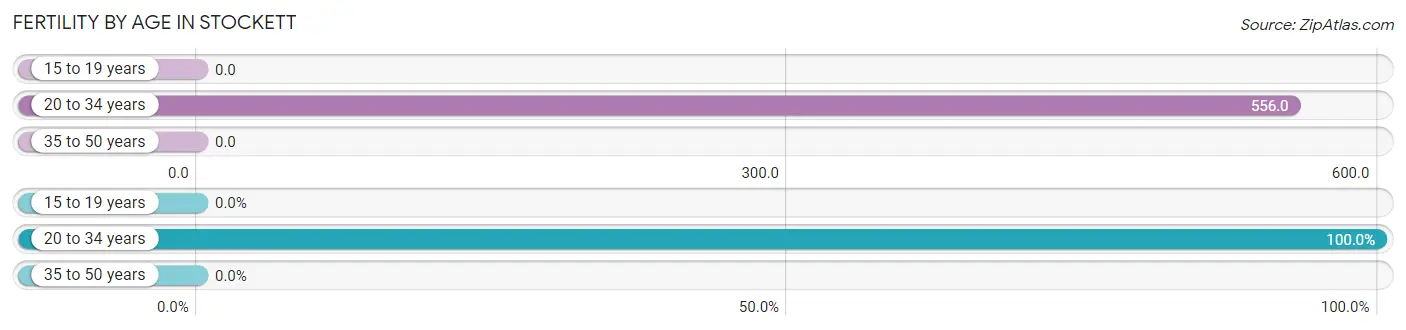
| Age Bracket | Women with Births | Births / 1,000 Women |
| 15 to 19 years | 0 (0.0%) | 0.0 |
| 20 to 34 years | 5 (100.0%) | 556.0 |
| 35 to 50 years | 0 (0.0%) | 0.0 |
| Total | 5 (100.0%) | 417.0 |
Fertility by Age by Marriage Status in Stockett
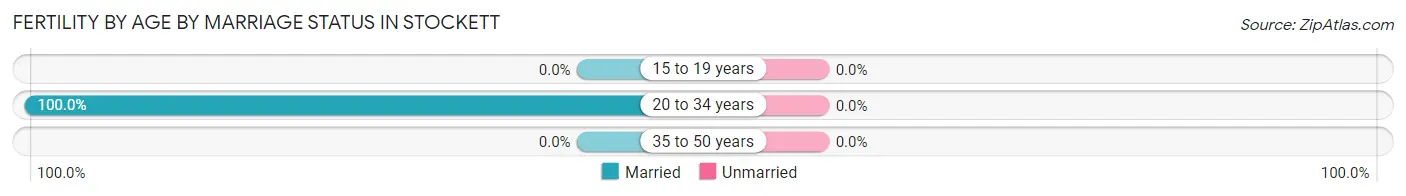
| Age Bracket | Married | Unmarried |
| 15 to 19 years | 0 (0.0%) | 0 (0.0%) |
| 20 to 34 years | 5 (100.0%) | 0 (0.0%) |
| 35 to 50 years | 0 (0.0%) | 0 (0.0%) |
| Total | 5 (100.0%) | 0 (0.0%) |
Fertility by Education in Stockett
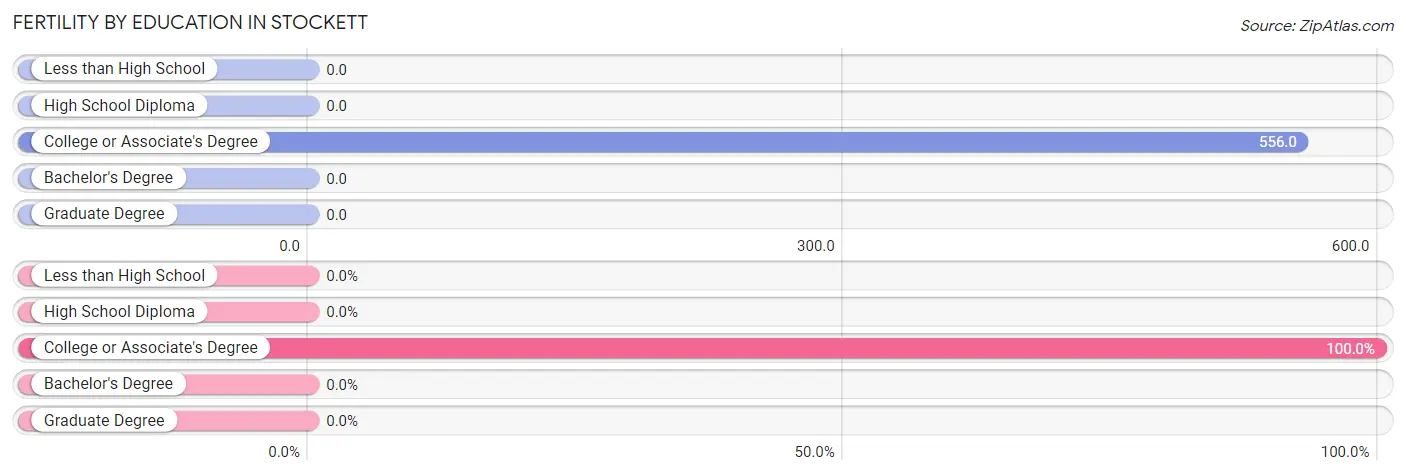
| Educational Attainment | Women with Births | Births / 1,000 Women |
| Less than High School | 0 (0.0%) | 0.0 |
| High School Diploma | 0 (0.0%) | 0.0 |
| College or Associate's Degree | 5 (100.0%) | 556.0 |
| Bachelor's Degree | 0 (0.0%) | 0.0 |
| Graduate Degree | 0 (0.0%) | 0.0 |
| Total | 5 (100.0%) | 417.0 |
Fertility by Education by Marriage Status in Stockett
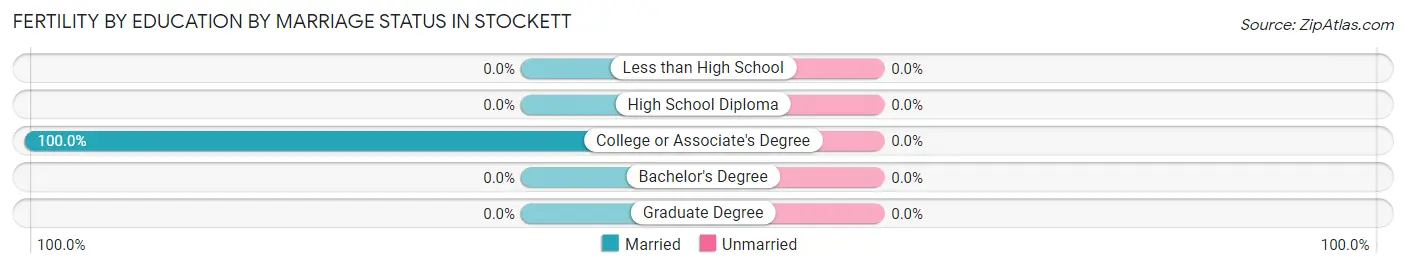
| Educational Attainment | Married | Unmarried |
| Less than High School | 0 (0.0%) | 0 (0.0%) |
| High School Diploma | 0 (0.0%) | 0 (0.0%) |
| College or Associate's Degree | 5 (100.0%) | 0 (0.0%) |
| Bachelor's Degree | 0 (0.0%) | 0 (0.0%) |
| Graduate Degree | 0 (0.0%) | 0 (0.0%) |
| Total | 5 (100.0%) | 0 (0.0%) |
Employment Characteristics in Stockett
Employment by Class of Employer in Stockett
Among the 68 employed individuals in Stockett, private company employees (22 | 32.4%), self-employed (not incorporated) (22 | 32.4%), and local government employees (11 | 16.2%) make up the most common classes of employment.
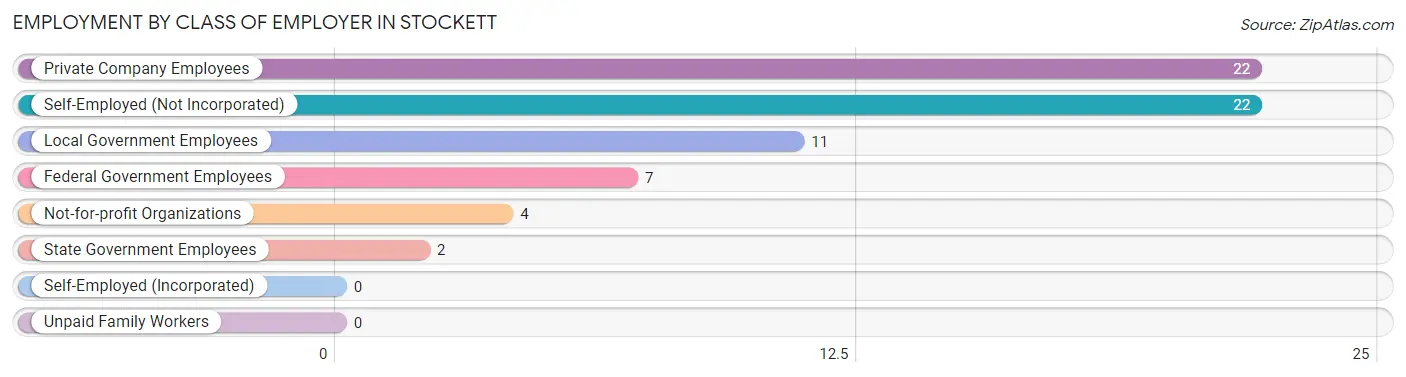
| Employer Class | # Employees | % Employees |
| Private Company Employees | 22 | 32.4% |
| Self-Employed (Incorporated) | 0 | 0.0% |
| Self-Employed (Not Incorporated) | 22 | 32.4% |
| Not-for-profit Organizations | 4 | 5.9% |
| Local Government Employees | 11 | 16.2% |
| State Government Employees | 2 | 2.9% |
| Federal Government Employees | 7 | 10.3% |
| Unpaid Family Workers | 0 | 0.0% |
| Total | 68 | 100.0% |
Employment Status by Age in Stockett
According to the labor force statistics for Stockett, out of the total population over 16 years of age (128), 56.3% or 72 individuals are in the labor force, with 6.0% or 4 of them unemployed. The age group with the highest labor force participation rate is 20 to 24 years, with 100.0% or 11 individuals in the labor force. Within the labor force, the 35 to 44 years age range has the highest percentage of unemployed individuals, with 100.0% or 4 of them being unemployed.
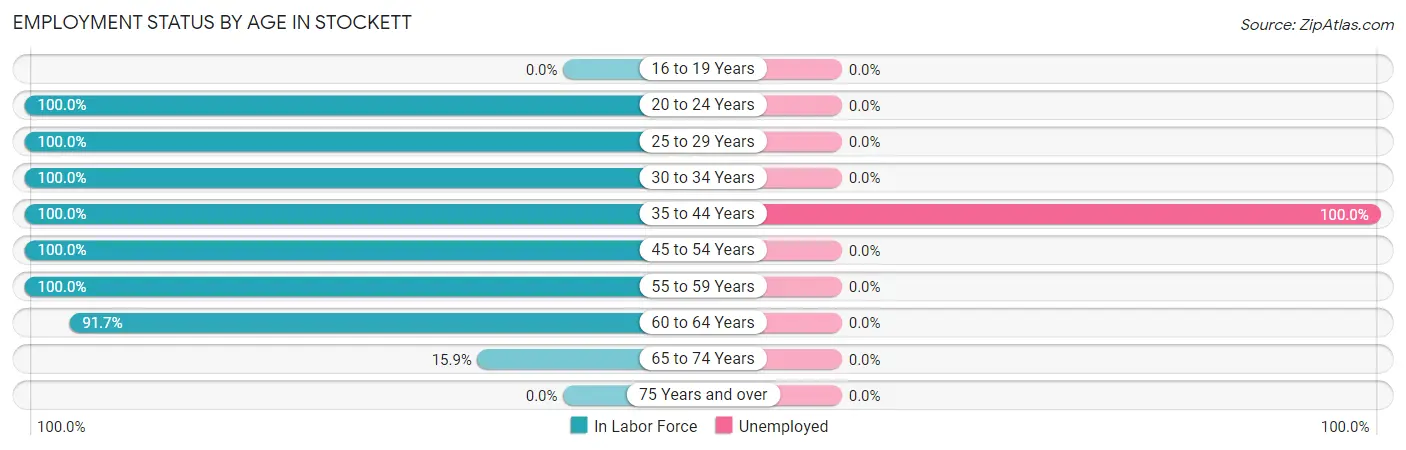
| Age Bracket | In Labor Force | Unemployed |
| 16 to 19 Years | 0 (0.0%) | 0 (0.0%) |
| 20 to 24 Years | 11 (100.0%) | 0 (0.0%) |
| 25 to 29 Years | 5 (100.0%) | 0 (0.0%) |
| 30 to 34 Years | 4 (100.0%) | 0 (0.0%) |
| 35 to 44 Years | 4 (100.0%) | 4 (100.0%) |
| 45 to 54 Years | 11 (100.0%) | 0 (0.0%) |
| 55 to 59 Years | 8 (100.0%) | 0 (0.0%) |
| 60 to 64 Years | 22 (91.7%) | 0 (0.0%) |
| 65 to 74 Years | 7 (15.9%) | 0 (0.0%) |
| 75 Years and over | 0 (0.0%) | 0 (0.0%) |
| Total | 72 (56.3%) | 4 (6.0%) |
Employment Status by Educational Attainment in Stockett
According to labor force statistics for Stockett, 96.4% of individuals (54) out of the total population between 25 and 64 years of age (56) are in the labor force, with 7.4% or 4 of them being unemployed. The group with the highest labor force participation rate are those with the educational attainment of less than high school, with 100.0% or 5 individuals in the labor force. Within the labor force, individuals with college / associate degree education have the highest percentage of unemployment, with 30.8% or 4 of them being unemployed.
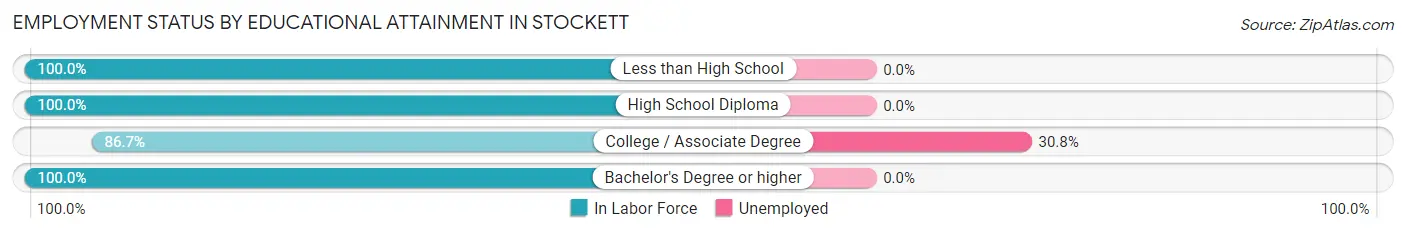
| Educational Attainment | In Labor Force | Unemployed |
| Less than High School | 5 (100.0%) | 0 (0.0%) |
| High School Diploma | 33 (100.0%) | 0 (0.0%) |
| College / Associate Degree | 13 (86.7%) | 5 (30.8%) |
| Bachelor's Degree or higher | 3 (100.0%) | 0 (0.0%) |
| Total | 54 (96.4%) | 4 (7.4%) |
Employment Occupations by Sex in Stockett
Management, Business, Science and Arts Occupations
The most common Management, Business, Science and Arts occupations in Stockett are Management (14 | 22.2%), Community & Social Service (11 | 17.5%), Education Instruction & Library (8 | 12.7%), Arts, Media & Entertainment (3 | 4.8%), and Computers, Engineering & Science (2 | 3.2%).
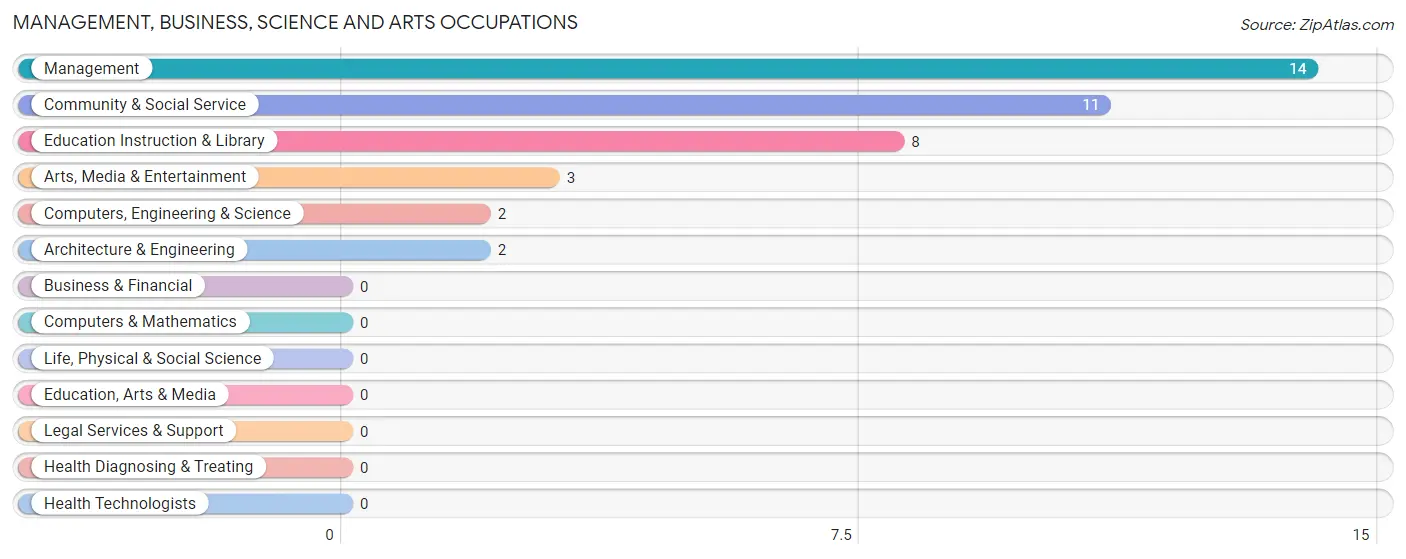
Management, Business, Science and Arts Occupations by Sex
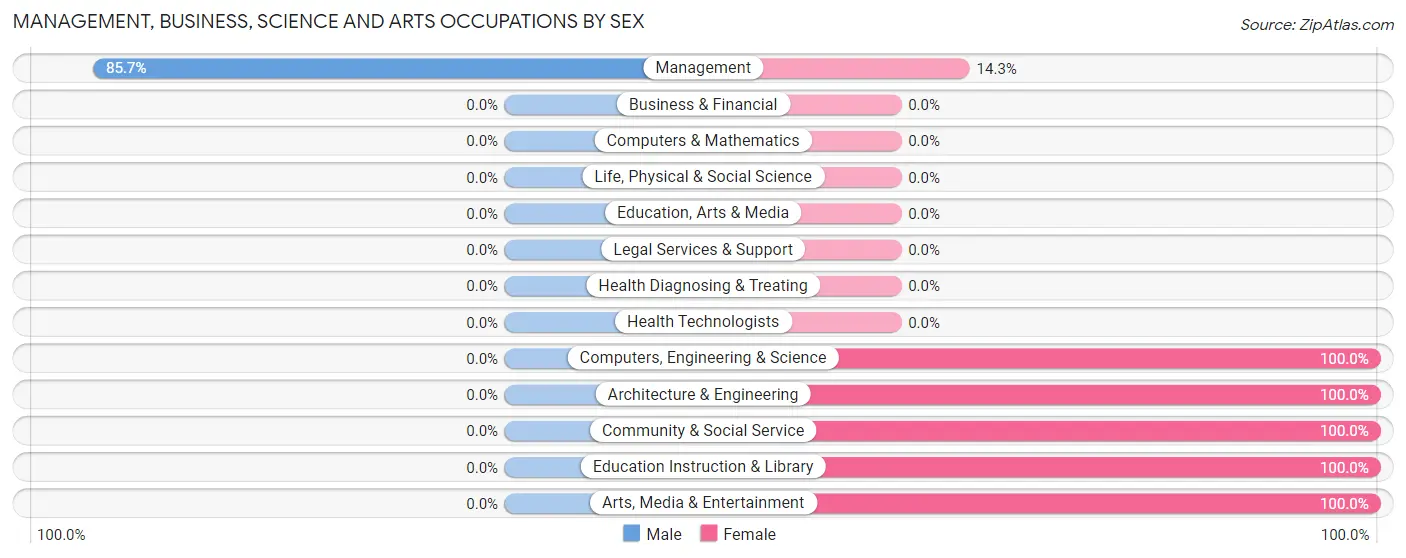
| Occupation | Male | Female |
| Management | 12 (85.7%) | 2 (14.3%) |
| Business & Financial | 0 (0.0%) | 0 (0.0%) |
| Computers, Engineering & Science | 0 (0.0%) | 2 (100.0%) |
| Computers & Mathematics | 0 (0.0%) | 0 (0.0%) |
| Architecture & Engineering | 0 (0.0%) | 2 (100.0%) |
| Life, Physical & Social Science | 0 (0.0%) | 0 (0.0%) |
| Community & Social Service | 0 (0.0%) | 11 (100.0%) |
| Education, Arts & Media | 0 (0.0%) | 0 (0.0%) |
| Legal Services & Support | 0 (0.0%) | 0 (0.0%) |
| Education Instruction & Library | 0 (0.0%) | 8 (100.0%) |
| Arts, Media & Entertainment | 0 (0.0%) | 3 (100.0%) |
| Health Diagnosing & Treating | 0 (0.0%) | 0 (0.0%) |
| Health Technologists | 0 (0.0%) | 0 (0.0%) |
| Total (Category) | 12 (44.4%) | 15 (55.6%) |
| Total (Overall) | 40 (63.5%) | 23 (36.5%) |
Services Occupations
The most common Services occupations in Stockett are Cleaning & Maintenance (7 | 11.1%), Personal Care & Service (4 | 6.4%), and Healthcare Support (2 | 3.2%).
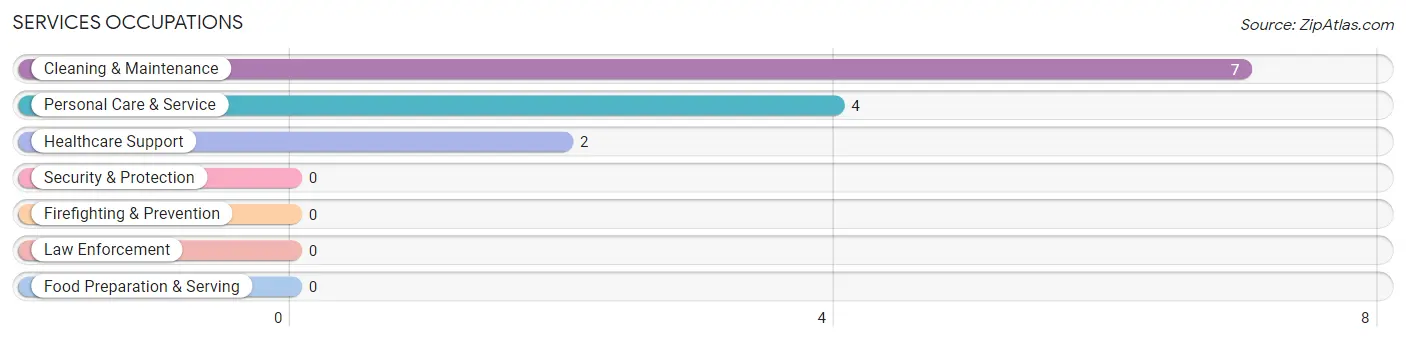
Services Occupations by Sex
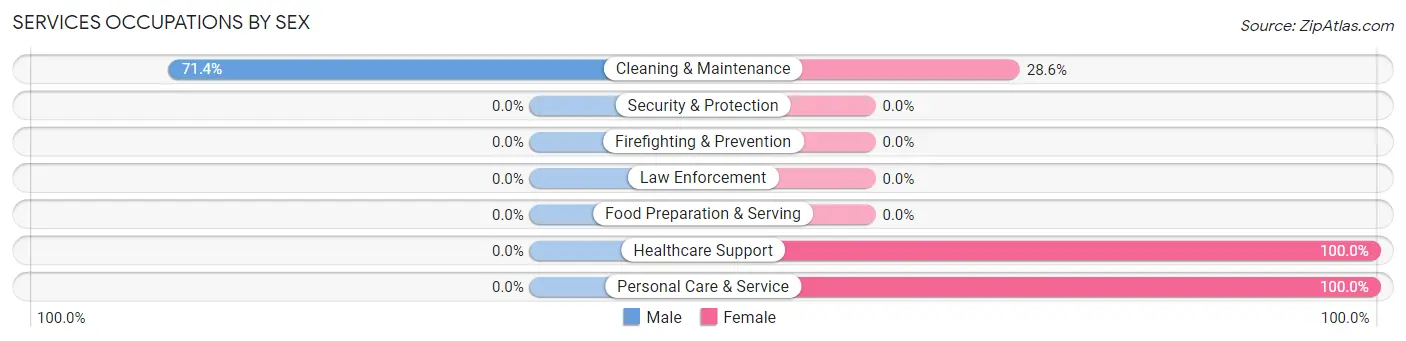
| Occupation | Male | Female |
| Healthcare Support | 0 (0.0%) | 2 (100.0%) |
| Security & Protection | 0 (0.0%) | 0 (0.0%) |
| Firefighting & Prevention | 0 (0.0%) | 0 (0.0%) |
| Law Enforcement | 0 (0.0%) | 0 (0.0%) |
| Food Preparation & Serving | 0 (0.0%) | 0 (0.0%) |
| Cleaning & Maintenance | 5 (71.4%) | 2 (28.6%) |
| Personal Care & Service | 0 (0.0%) | 4 (100.0%) |
| Total (Category) | 5 (38.5%) | 8 (61.5%) |
| Total (Overall) | 40 (63.5%) | 23 (36.5%) |
Sales and Office Occupations
The most common Sales and Office occupations in Stockett are Office & Administration (9 | 14.3%), and Sales & Related (5 | 7.9%).
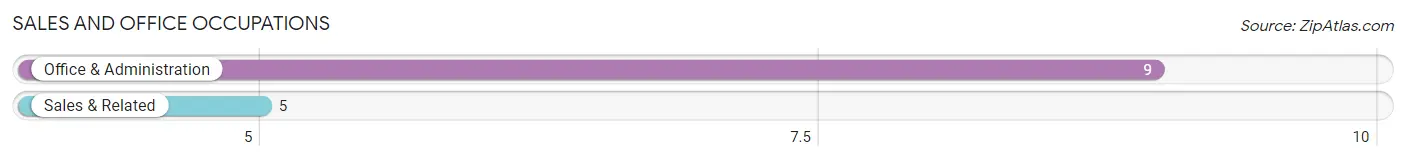
Sales and Office Occupations by Sex
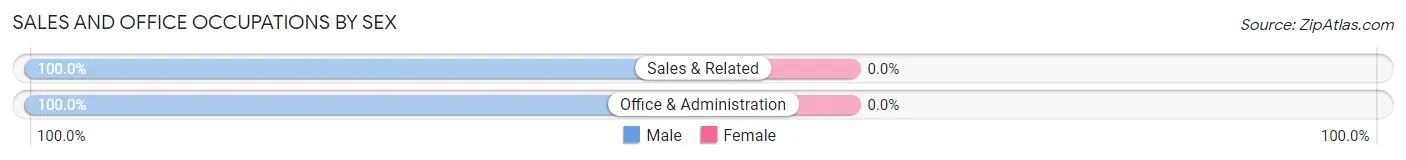
| Occupation | Male | Female |
| Sales & Related | 5 (100.0%) | 0 (0.0%) |
| Office & Administration | 9 (100.0%) | 0 (0.0%) |
| Total (Category) | 14 (100.0%) | 0 (0.0%) |
| Total (Overall) | 40 (63.5%) | 23 (36.5%) |
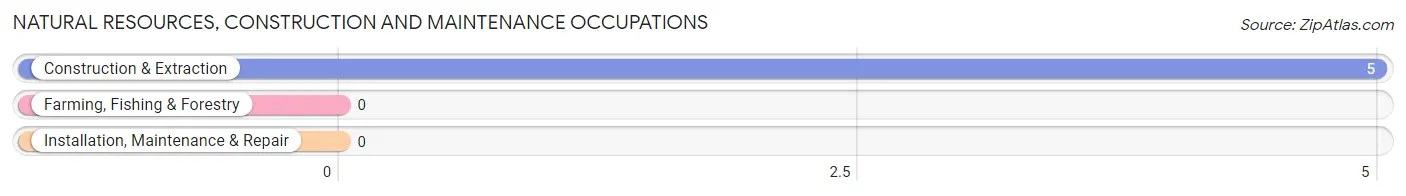
Natural Resources, Construction and Maintenance Occupations
The most common Natural Resources, Construction and Maintenance occupations in Stockett are , and Construction & Extraction (5 | 7.9%).
Natural Resources, Construction and Maintenance Occupations by Sex
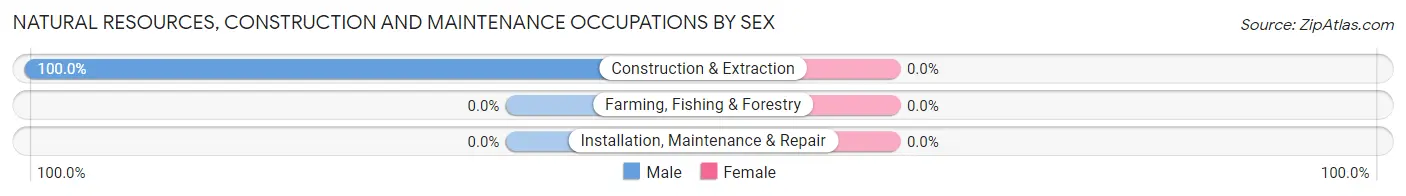
| Occupation | Male | Female |
| Farming, Fishing & Forestry | 0 (0.0%) | 0 (0.0%) |
| Construction & Extraction | 5 (100.0%) | 0 (0.0%) |
| Installation, Maintenance & Repair | 0 (0.0%) | 0 (0.0%) |
| Total (Category) | 5 (100.0%) | 0 (0.0%) |
| Total (Overall) | 40 (63.5%) | 23 (36.5%) |
Production, Transportation and Moving Occupations
The most common Production, Transportation and Moving occupations in Stockett are , and Material Moving (4 | 6.4%).
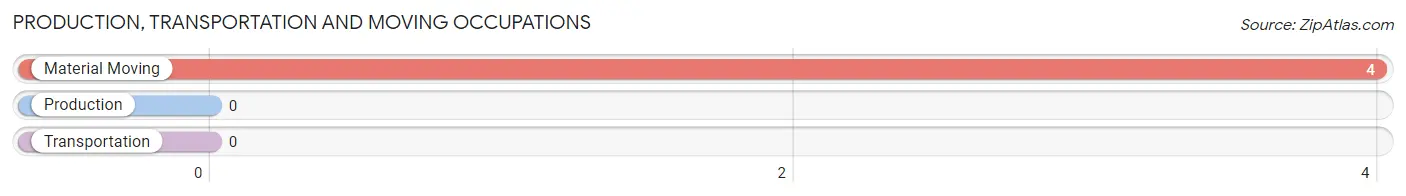
Production, Transportation and Moving Occupations by Sex
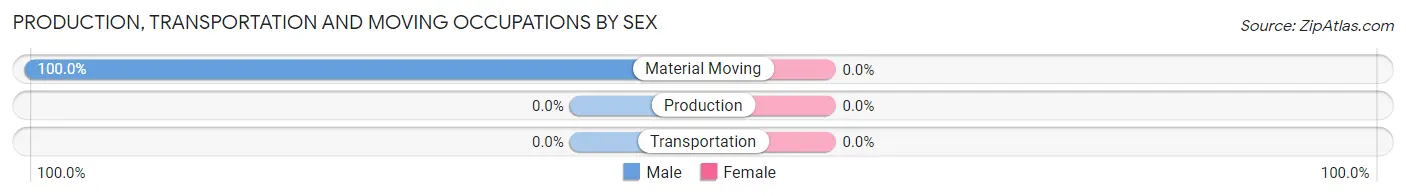
| Occupation | Male | Female |
| Production | 0 (0.0%) | 0 (0.0%) |
| Transportation | 0 (0.0%) | 0 (0.0%) |
| Material Moving | 4 (100.0%) | 0 (0.0%) |
| Total (Category) | 4 (100.0%) | 0 (0.0%) |
| Total (Overall) | 40 (63.5%) | 23 (36.5%) |
Employment Industries by Sex in Stockett
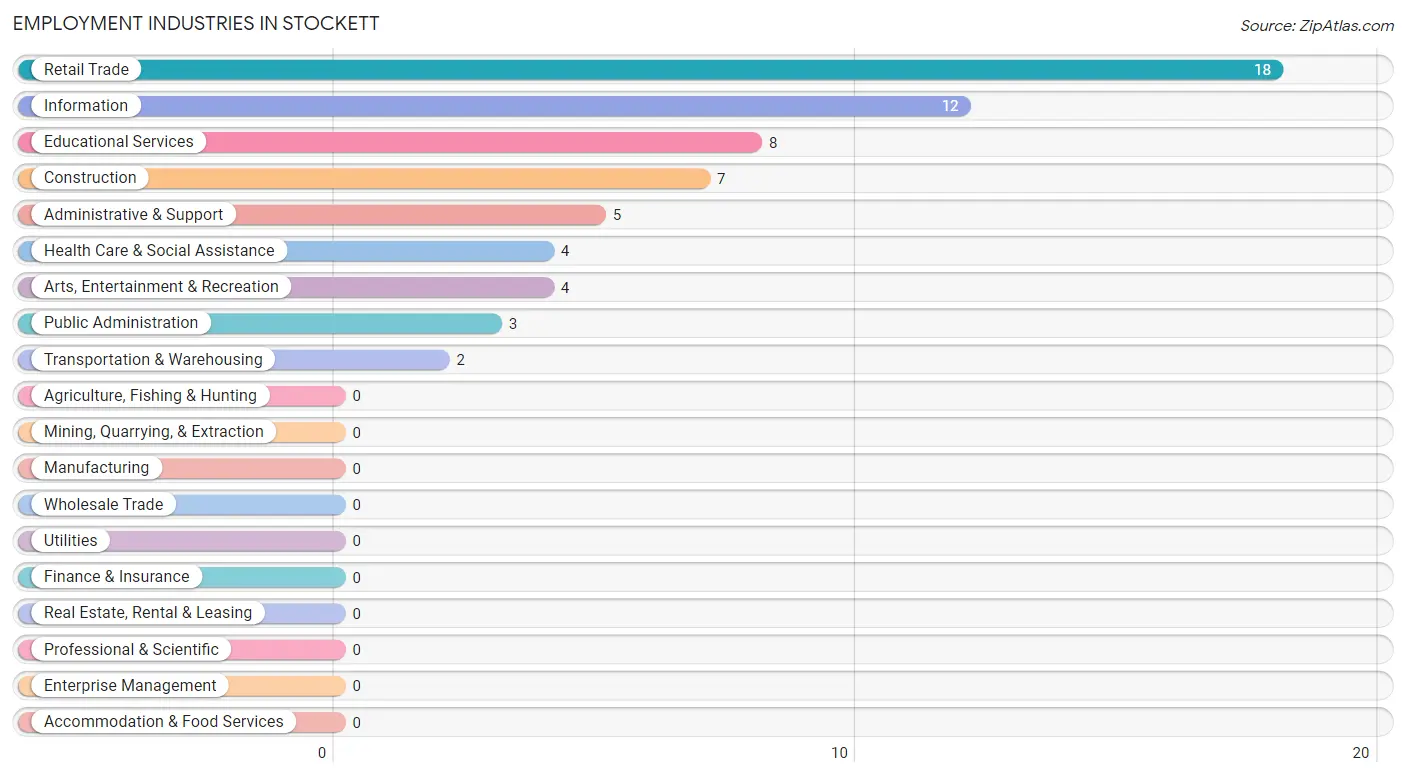
Employment Industries in Stockett
The major employment industries in Stockett include Retail Trade (18 | 28.6%), Information (12 | 19.1%), Educational Services (8 | 12.7%), Construction (7 | 11.1%), and Administrative & Support (5 | 7.9%).
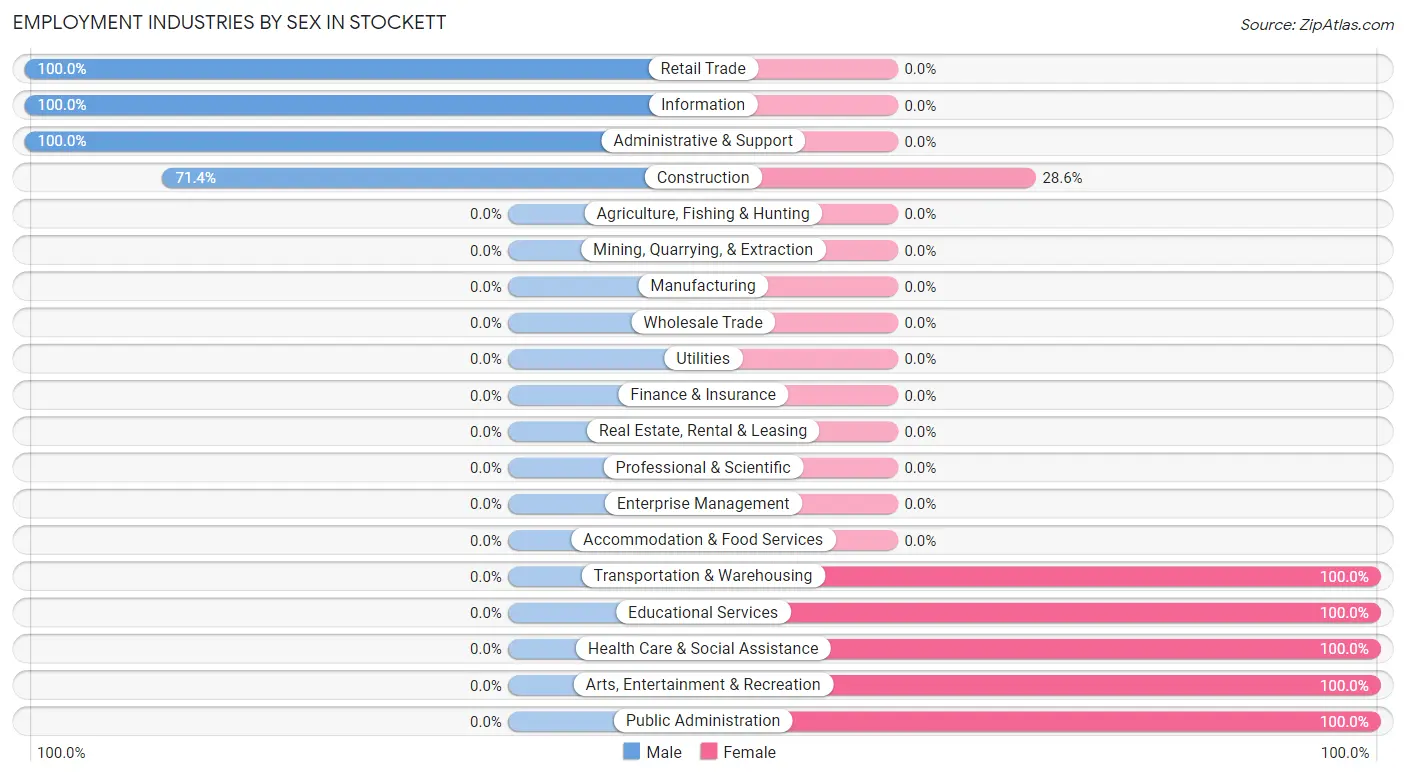
Employment Industries by Sex in Stockett
The Stockett industries that see more men than women are Retail Trade (100.0%), Information (100.0%), and Administrative & Support (100.0%), whereas the industries that tend to have a higher number of women are Transportation & Warehousing (100.0%), Educational Services (100.0%), and Health Care & Social Assistance (100.0%).
| Industry | Male | Female |
| Agriculture, Fishing & Hunting | 0 (0.0%) | 0 (0.0%) |
| Mining, Quarrying, & Extraction | 0 (0.0%) | 0 (0.0%) |
| Construction | 5 (71.4%) | 2 (28.6%) |
| Manufacturing | 0 (0.0%) | 0 (0.0%) |
| Wholesale Trade | 0 (0.0%) | 0 (0.0%) |
| Retail Trade | 18 (100.0%) | 0 (0.0%) |
| Transportation & Warehousing | 0 (0.0%) | 2 (100.0%) |
| Utilities | 0 (0.0%) | 0 (0.0%) |
| Information | 12 (100.0%) | 0 (0.0%) |
| Finance & Insurance | 0 (0.0%) | 0 (0.0%) |
| Real Estate, Rental & Leasing | 0 (0.0%) | 0 (0.0%) |
| Professional & Scientific | 0 (0.0%) | 0 (0.0%) |
| Enterprise Management | 0 (0.0%) | 0 (0.0%) |
| Administrative & Support | 5 (100.0%) | 0 (0.0%) |
| Educational Services | 0 (0.0%) | 8 (100.0%) |
| Health Care & Social Assistance | 0 (0.0%) | 4 (100.0%) |
| Arts, Entertainment & Recreation | 0 (0.0%) | 4 (100.0%) |
| Accommodation & Food Services | 0 (0.0%) | 0 (0.0%) |
| Public Administration | 0 (0.0%) | 3 (100.0%) |
| Total | 40 (63.5%) | 23 (36.5%) |
Education in Stockett
School Enrollment in Stockett
The most common levels of schooling among the 22 students in Stockett are high school (13 | 59.1%), and elementary school (9 | 40.9%).
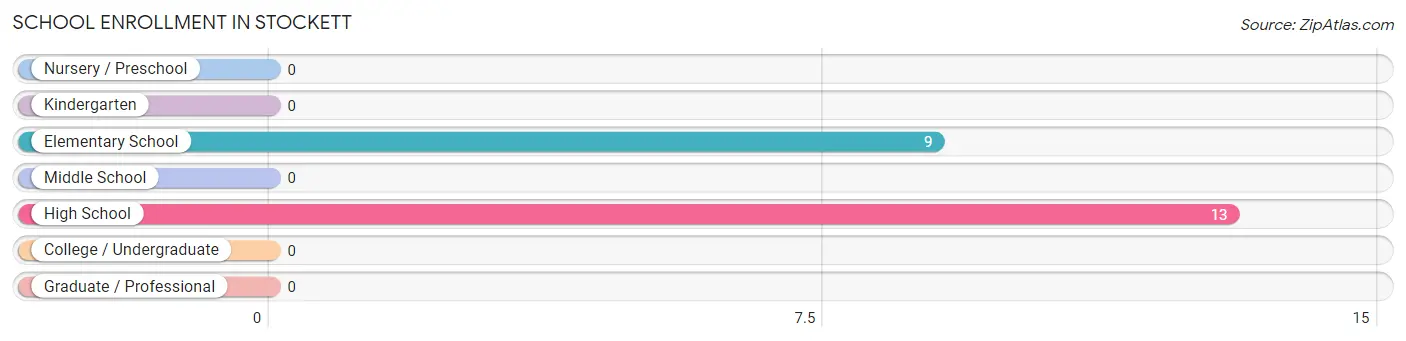
| School Level | # Students | % Students |
| Nursery / Preschool | 0 | 0.0% |
| Kindergarten | 0 | 0.0% |
| Elementary School | 9 | 40.9% |
| Middle School | 0 | 0.0% |
| High School | 13 | 59.1% |
| College / Undergraduate | 0 | 0.0% |
| Graduate / Professional | 0 | 0.0% |
| Total | 22 | 100.0% |
School Enrollment by Age by Funding Source in Stockett
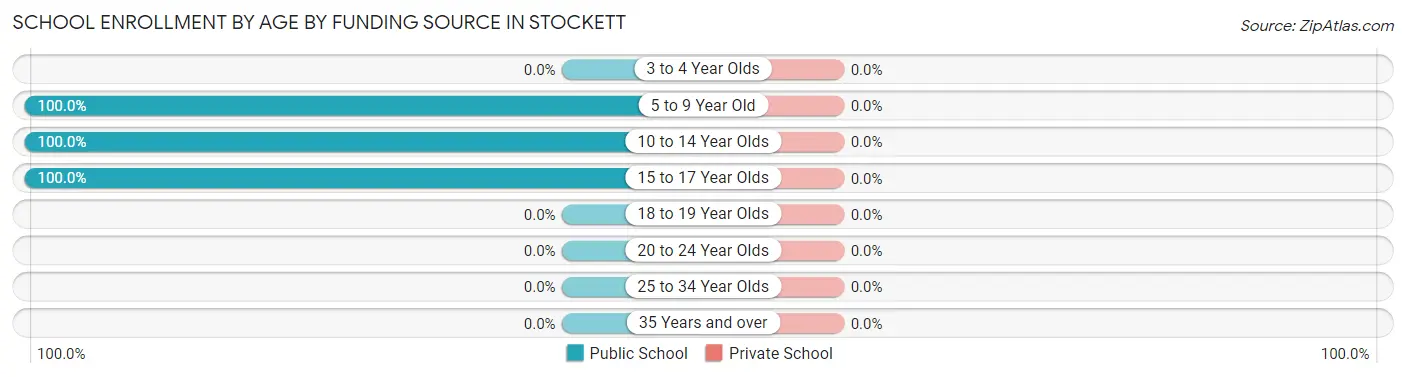
| Age Bracket | Public School | Private School |
| 3 to 4 Year Olds | 0 (0.0%) | 0 (0.0%) |
| 5 to 9 Year Old | 9 (100.0%) | 0 (0.0%) |
| 10 to 14 Year Olds | 5 (100.0%) | 0 (0.0%) |
| 15 to 17 Year Olds | 8 (100.0%) | 0 (0.0%) |
| 18 to 19 Year Olds | 0 (0.0%) | 0 (0.0%) |
| 20 to 24 Year Olds | 0 (0.0%) | 0 (0.0%) |
| 25 to 34 Year Olds | 0 (0.0%) | 0 (0.0%) |
| 35 Years and over | 0 (0.0%) | 0 (0.0%) |
| Total | 22 (100.0%) | 0 (0.0%) |
Educational Attainment by Field of Study in Stockett
Computers & mathematics (4 | 36.4%), education (4 | 36.4%), and communications (3 | 27.3%) are the most common fields of study among 11 individuals in Stockett who have obtained a bachelor's degree or higher.
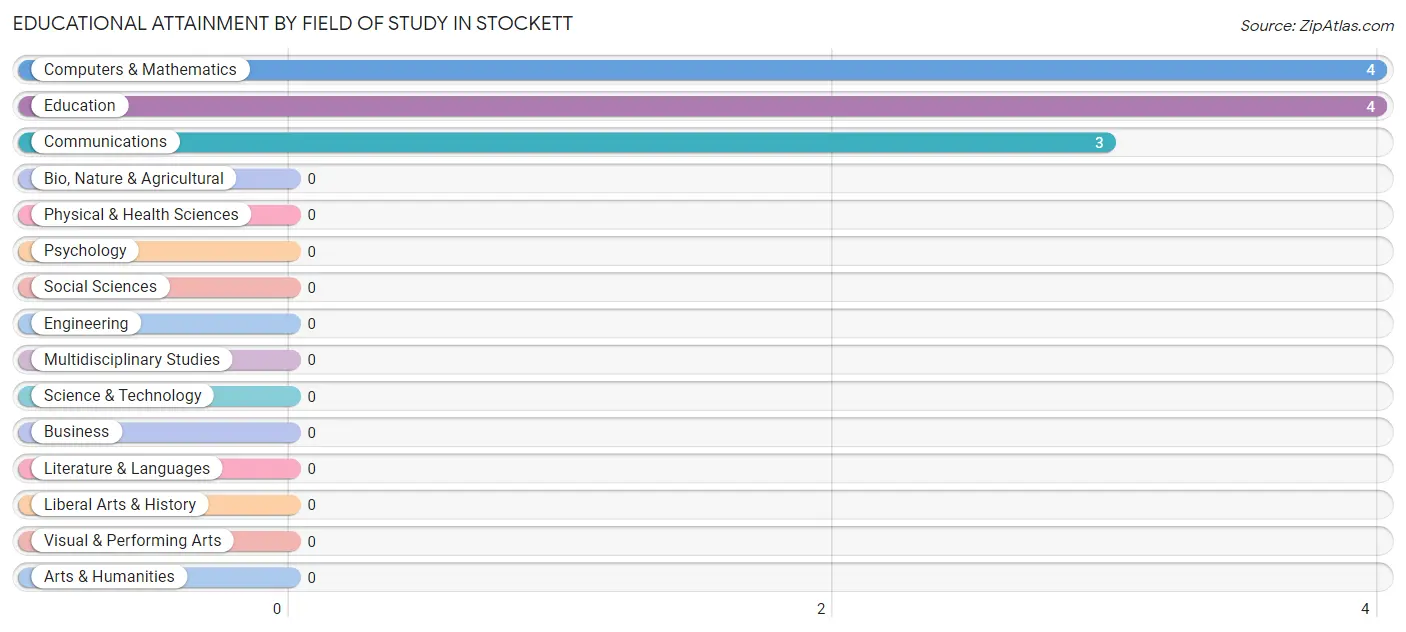
| Field of Study | # Graduates | % Graduates |
| Computers & Mathematics | 4 | 36.4% |
| Bio, Nature & Agricultural | 0 | 0.0% |
| Physical & Health Sciences | 0 | 0.0% |
| Psychology | 0 | 0.0% |
| Social Sciences | 0 | 0.0% |
| Engineering | 0 | 0.0% |
| Multidisciplinary Studies | 0 | 0.0% |
| Science & Technology | 0 | 0.0% |
| Business | 0 | 0.0% |
| Education | 4 | 36.4% |
| Literature & Languages | 0 | 0.0% |
| Liberal Arts & History | 0 | 0.0% |
| Visual & Performing Arts | 0 | 0.0% |
| Communications | 3 | 27.3% |
| Arts & Humanities | 0 | 0.0% |
| Total | 11 | 100.0% |
Transportation & Commute in Stockett
Vehicle Availability by Sex in Stockett
The most prevalent vehicle ownership categories in Stockett are males with 3 vehicles (23, accounting for 57.5%) and females with 3 vehicles (12, making up 82.1%).
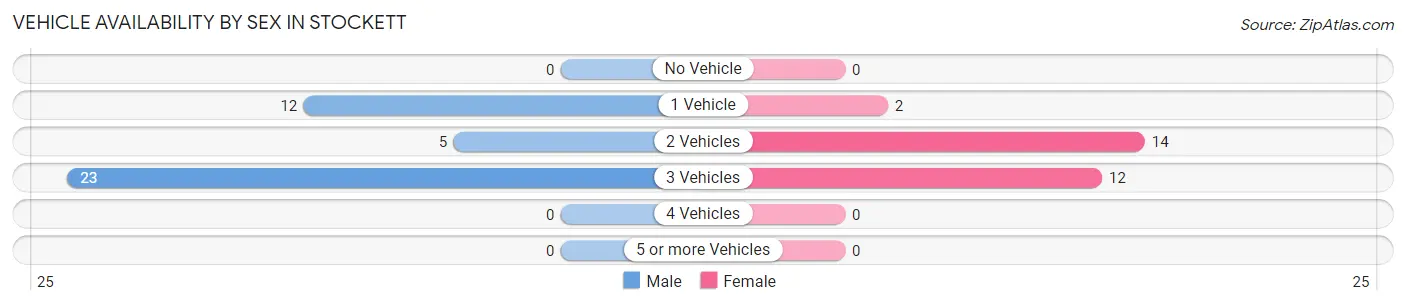
| Vehicles Available | Male | Female |
| No Vehicle | 0 (0.0%) | 0 (0.0%) |
| 1 Vehicle | 12 (30.0%) | 2 (7.1%) |
| 2 Vehicles | 5 (12.5%) | 14 (50.0%) |
| 3 Vehicles | 23 (57.5%) | 12 (42.9%) |
| 4 Vehicles | 0 (0.0%) | 0 (0.0%) |
| 5 or more Vehicles | 0 (0.0%) | 0 (0.0%) |
| Total | 40 (100.0%) | 28 (100.0%) |
Commute Time in Stockett
The most frequently occuring commute durations in Stockett are 30 to 34 minutes (20 commuters, 29.4%), 25 to 29 minutes (14 commuters, 20.6%), and 20 to 24 minutes (10 commuters, 14.7%).
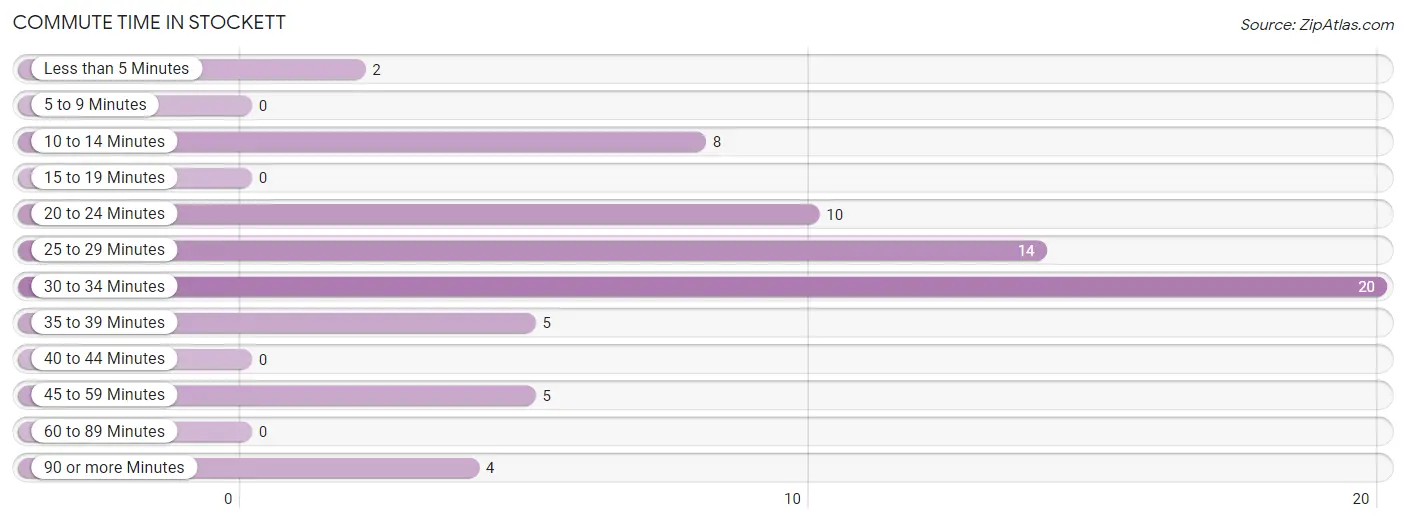
| Commute Time | # Commuters | % Commuters |
| Less than 5 Minutes | 2 | 2.9% |
| 5 to 9 Minutes | 0 | 0.0% |
| 10 to 14 Minutes | 8 | 11.8% |
| 15 to 19 Minutes | 0 | 0.0% |
| 20 to 24 Minutes | 10 | 14.7% |
| 25 to 29 Minutes | 14 | 20.6% |
| 30 to 34 Minutes | 20 | 29.4% |
| 35 to 39 Minutes | 5 | 7.3% |
| 40 to 44 Minutes | 0 | 0.0% |
| 45 to 59 Minutes | 5 | 7.3% |
| 60 to 89 Minutes | 0 | 0.0% |
| 90 or more Minutes | 4 | 5.9% |
Commute Time by Sex in Stockett
The most common commute times in Stockett are 30 to 34 minutes (17 commuters, 42.5%) for males and 10 to 14 minutes (8 commuters, 28.6%) for females.
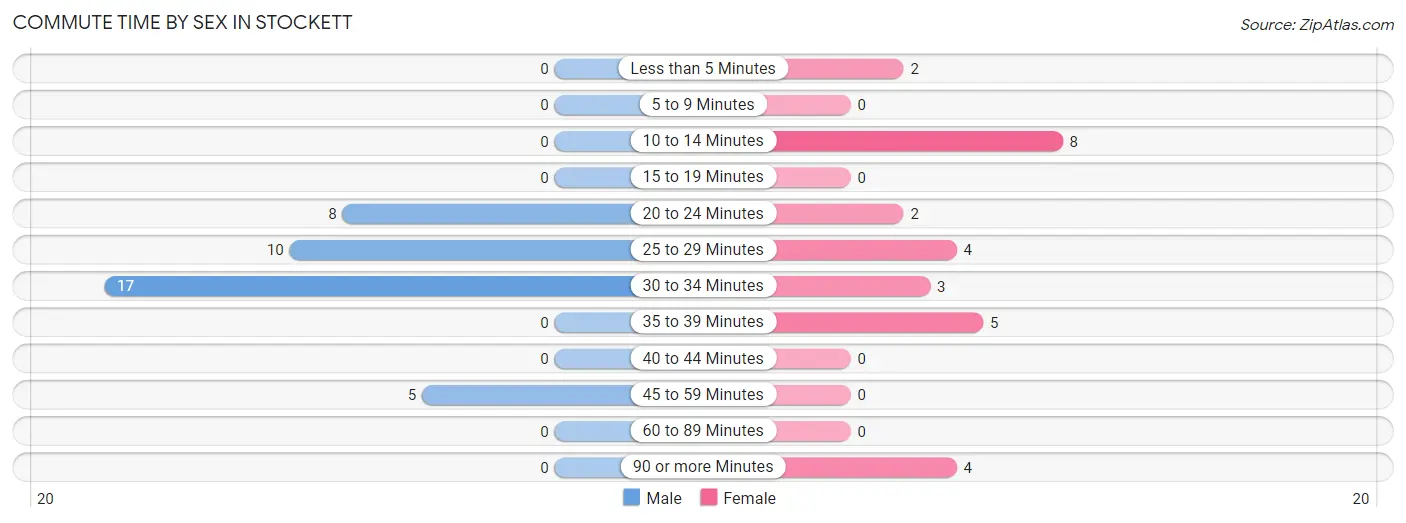
| Commute Time | Male | Female |
| Less than 5 Minutes | 0 (0.0%) | 2 (7.1%) |
| 5 to 9 Minutes | 0 (0.0%) | 0 (0.0%) |
| 10 to 14 Minutes | 0 (0.0%) | 8 (28.6%) |
| 15 to 19 Minutes | 0 (0.0%) | 0 (0.0%) |
| 20 to 24 Minutes | 8 (20.0%) | 2 (7.1%) |
| 25 to 29 Minutes | 10 (25.0%) | 4 (14.3%) |
| 30 to 34 Minutes | 17 (42.5%) | 3 (10.7%) |
| 35 to 39 Minutes | 0 (0.0%) | 5 (17.9%) |
| 40 to 44 Minutes | 0 (0.0%) | 0 (0.0%) |
| 45 to 59 Minutes | 5 (12.5%) | 0 (0.0%) |
| 60 to 89 Minutes | 0 (0.0%) | 0 (0.0%) |
| 90 or more Minutes | 0 (0.0%) | 4 (14.3%) |
Time of Departure to Work by Sex in Stockett
The most frequent times of departure to work in Stockett are 8:00 AM to 8:29 AM (12, 30.0%) for males and 7:30 AM to 7:59 AM (13, 46.4%) for females.
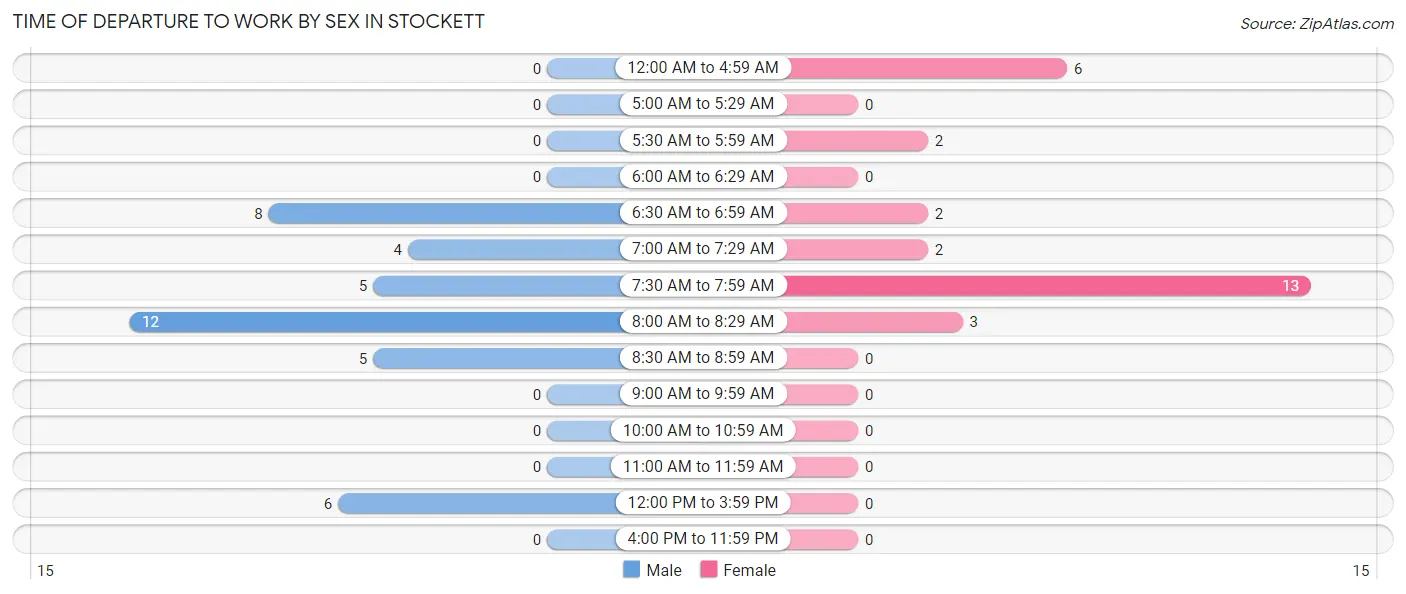
| Time of Departure | Male | Female |
| 12:00 AM to 4:59 AM | 0 (0.0%) | 6 (21.4%) |
| 5:00 AM to 5:29 AM | 0 (0.0%) | 0 (0.0%) |
| 5:30 AM to 5:59 AM | 0 (0.0%) | 2 (7.1%) |
| 6:00 AM to 6:29 AM | 0 (0.0%) | 0 (0.0%) |
| 6:30 AM to 6:59 AM | 8 (20.0%) | 2 (7.1%) |
| 7:00 AM to 7:29 AM | 4 (10.0%) | 2 (7.1%) |
| 7:30 AM to 7:59 AM | 5 (12.5%) | 13 (46.4%) |
| 8:00 AM to 8:29 AM | 12 (30.0%) | 3 (10.7%) |
| 8:30 AM to 8:59 AM | 5 (12.5%) | 0 (0.0%) |
| 9:00 AM to 9:59 AM | 0 (0.0%) | 0 (0.0%) |
| 10:00 AM to 10:59 AM | 0 (0.0%) | 0 (0.0%) |
| 11:00 AM to 11:59 AM | 0 (0.0%) | 0 (0.0%) |
| 12:00 PM to 3:59 PM | 6 (15.0%) | 0 (0.0%) |
| 4:00 PM to 11:59 PM | 0 (0.0%) | 0 (0.0%) |
| Total | 40 (100.0%) | 28 (100.0%) |
Housing Occupancy in Stockett
Occupancy by Ownership in Stockett
Of the total 53 dwellings in Stockett, owner-occupied units account for 44 (83.0%), while renter-occupied units make up 9 (17.0%).
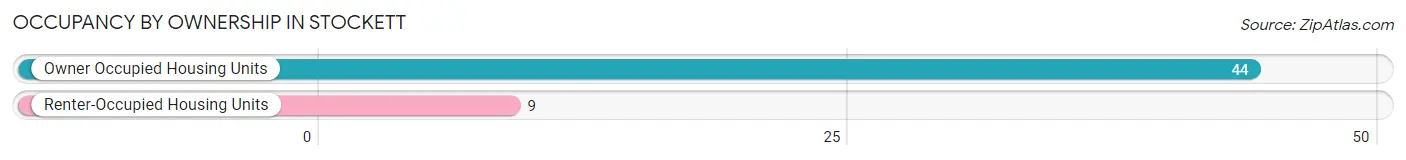
| Occupancy | # Housing Units | % Housing Units |
| Owner Occupied Housing Units | 44 | 83.0% |
| Renter-Occupied Housing Units | 9 | 17.0% |
| Total Occupied Housing Units | 53 | 100.0% |
Occupancy by Household Size in Stockett
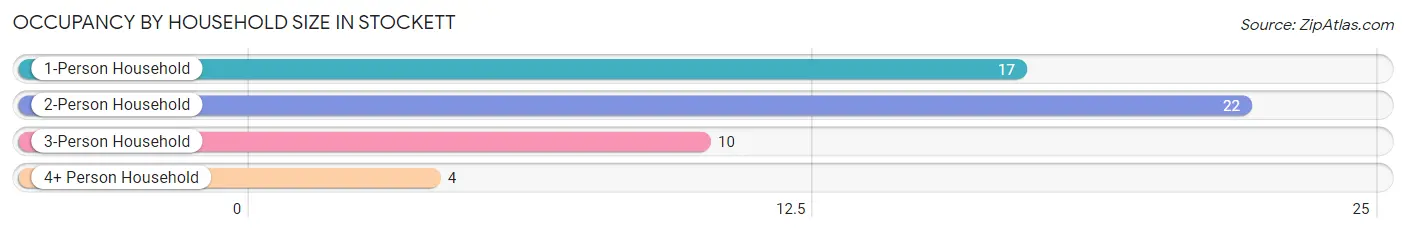
| Household Size | # Housing Units | % Housing Units |
| 1-Person Household | 17 | 32.1% |
| 2-Person Household | 22 | 41.5% |
| 3-Person Household | 10 | 18.9% |
| 4+ Person Household | 4 | 7.5% |
| Total Housing Units | 53 | 100.0% |
Occupancy by Ownership by Household Size in Stockett
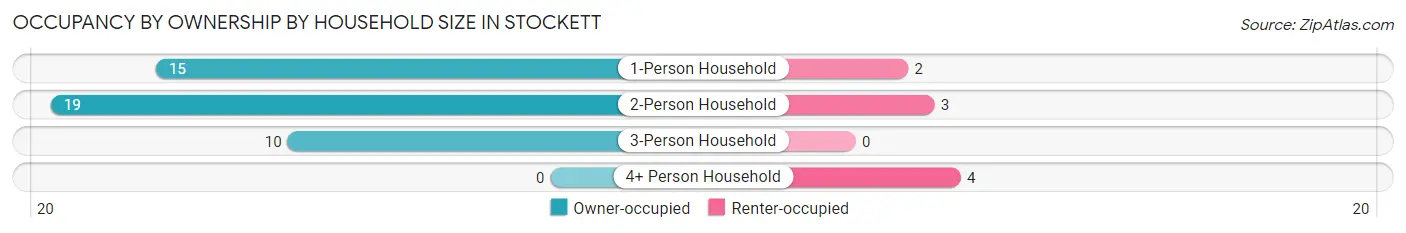
| Household Size | Owner-occupied | Renter-occupied |
| 1-Person Household | 15 (88.2%) | 2 (11.8%) |
| 2-Person Household | 19 (86.4%) | 3 (13.6%) |
| 3-Person Household | 10 (100.0%) | 0 (0.0%) |
| 4+ Person Household | 0 (0.0%) | 4 (100.0%) |
| Total Housing Units | 44 (83.0%) | 9 (17.0%) |
Occupancy by Educational Attainment in Stockett
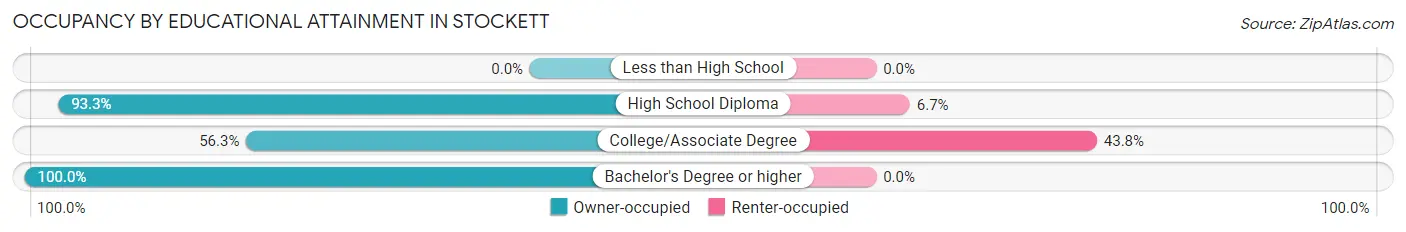
| Household Size | Owner-occupied | Renter-occupied |
| Less than High School | 0 (0.0%) | 0 (0.0%) |
| High School Diploma | 28 (93.3%) | 2 (6.7%) |
| College/Associate Degree | 9 (56.2%) | 7 (43.8%) |
| Bachelor's Degree or higher | 7 (100.0%) | 0 (0.0%) |
Occupancy by Age of Householder in Stockett
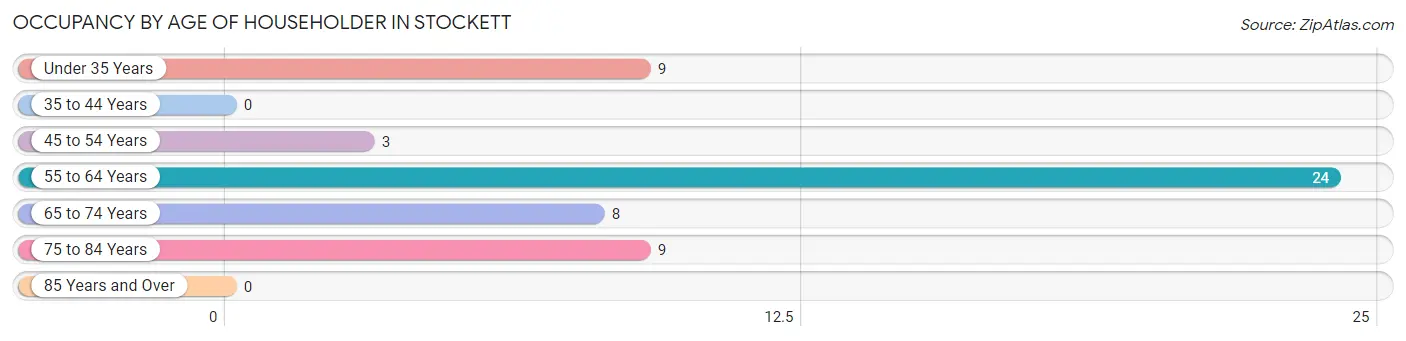
| Age Bracket | # Households | % Households |
| Under 35 Years | 9 | 17.0% |
| 35 to 44 Years | 0 | 0.0% |
| 45 to 54 Years | 3 | 5.7% |
| 55 to 64 Years | 24 | 45.3% |
| 65 to 74 Years | 8 | 15.1% |
| 75 to 84 Years | 9 | 17.0% |
| 85 Years and Over | 0 | 0.0% |
| Total | 53 | 100.0% |
Housing Finances in Stockett
Median Income by Occupancy in Stockett
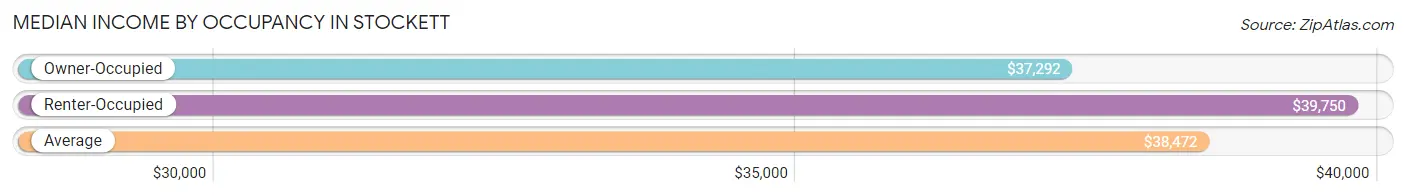
| Occupancy Type | # Households | Median Income |
| Owner-Occupied | 44 (83.0%) | $37,292 |
| Renter-Occupied | 9 (17.0%) | $39,750 |
| Average | 53 (100.0%) | $38,472 |
Occupancy by Householder Income Bracket in Stockett
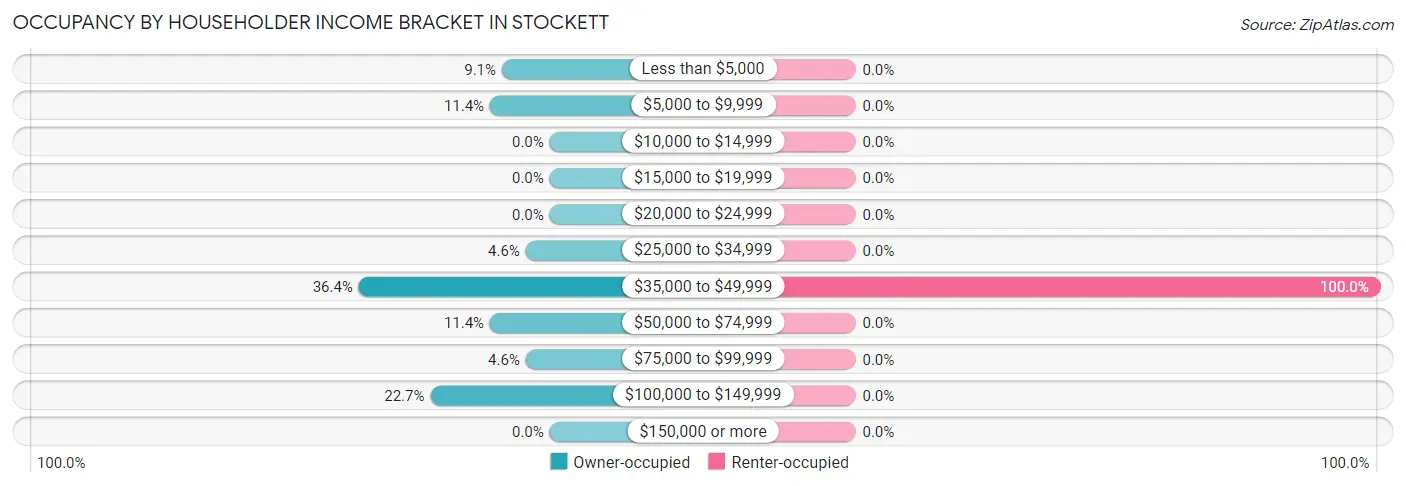
| Income Bracket | Owner-occupied | Renter-occupied |
| Less than $5,000 | 4 (9.1%) | 0 (0.0%) |
| $5,000 to $9,999 | 5 (11.4%) | 0 (0.0%) |
| $10,000 to $14,999 | 0 (0.0%) | 0 (0.0%) |
| $15,000 to $19,999 | 0 (0.0%) | 0 (0.0%) |
| $20,000 to $24,999 | 0 (0.0%) | 0 (0.0%) |
| $25,000 to $34,999 | 2 (4.5%) | 0 (0.0%) |
| $35,000 to $49,999 | 16 (36.4%) | 9 (100.0%) |
| $50,000 to $74,999 | 5 (11.4%) | 0 (0.0%) |
| $75,000 to $99,999 | 2 (4.5%) | 0 (0.0%) |
| $100,000 to $149,999 | 10 (22.7%) | 0 (0.0%) |
| $150,000 or more | 0 (0.0%) | 0 (0.0%) |
| Total | 44 (100.0%) | 9 (100.0%) |
Monthly Housing Cost Tiers in Stockett
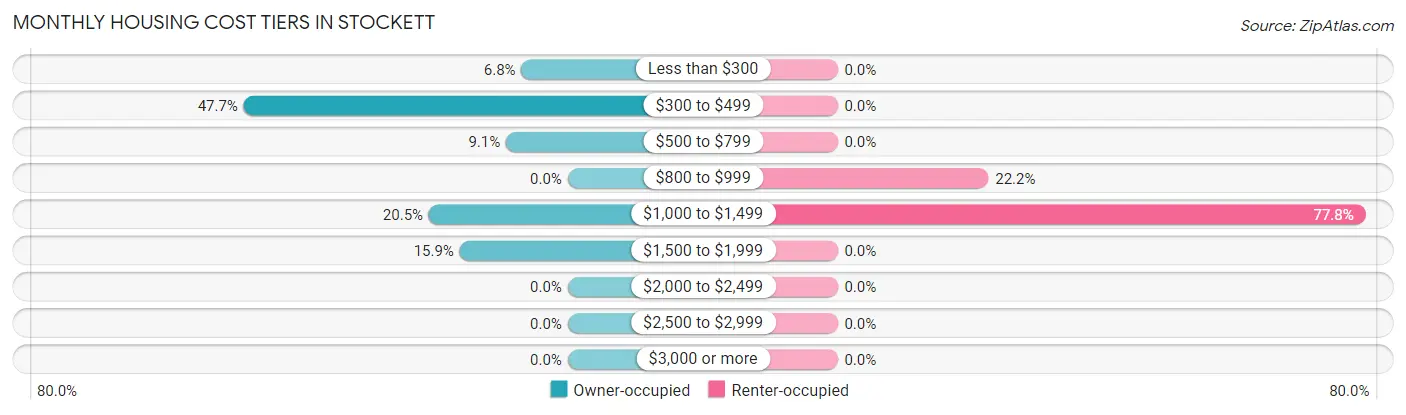
| Monthly Cost | Owner-occupied | Renter-occupied |
| Less than $300 | 3 (6.8%) | 0 (0.0%) |
| $300 to $499 | 21 (47.7%) | 0 (0.0%) |
| $500 to $799 | 4 (9.1%) | 0 (0.0%) |
| $800 to $999 | 0 (0.0%) | 2 (22.2%) |
| $1,000 to $1,499 | 9 (20.4%) | 7 (77.8%) |
| $1,500 to $1,999 | 7 (15.9%) | 0 (0.0%) |
| $2,000 to $2,499 | 0 (0.0%) | 0 (0.0%) |
| $2,500 to $2,999 | 0 (0.0%) | 0 (0.0%) |
| $3,000 or more | 0 (0.0%) | 0 (0.0%) |
| Total | 44 (100.0%) | 9 (100.0%) |
Physical Housing Characteristics in Stockett
Housing Structures in Stockett
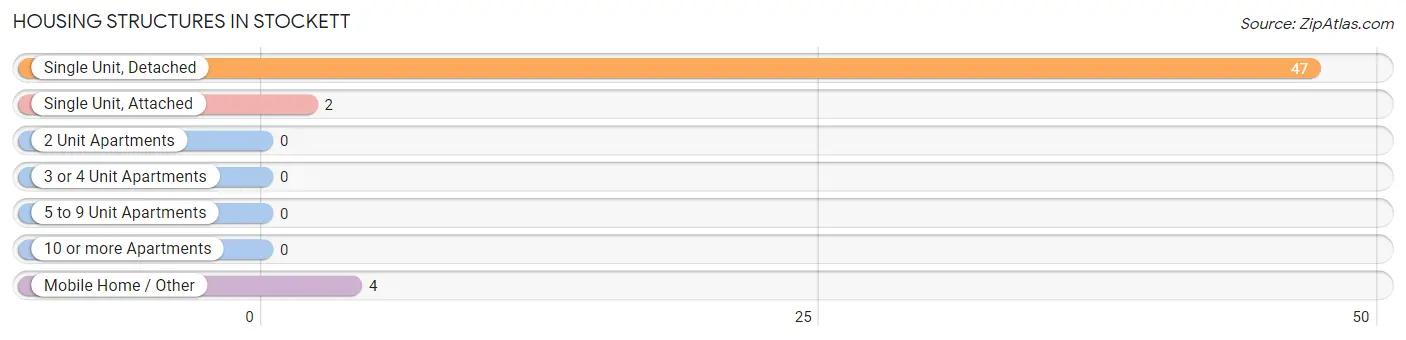
| Structure Type | # Housing Units | % Housing Units |
| Single Unit, Detached | 47 | 88.7% |
| Single Unit, Attached | 2 | 3.8% |
| 2 Unit Apartments | 0 | 0.0% |
| 3 or 4 Unit Apartments | 0 | 0.0% |
| 5 to 9 Unit Apartments | 0 | 0.0% |
| 10 or more Apartments | 0 | 0.0% |
| Mobile Home / Other | 4 | 7.5% |
| Total | 53 | 100.0% |
Housing Structures by Occupancy in Stockett
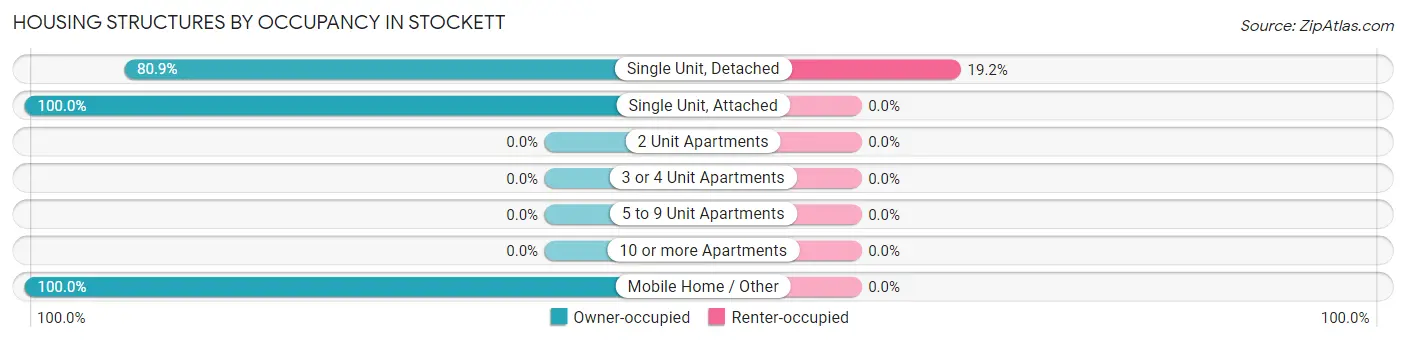
| Structure Type | Owner-occupied | Renter-occupied |
| Single Unit, Detached | 38 (80.8%) | 9 (19.2%) |
| Single Unit, Attached | 2 (100.0%) | 0 (0.0%) |
| 2 Unit Apartments | 0 (0.0%) | 0 (0.0%) |
| 3 or 4 Unit Apartments | 0 (0.0%) | 0 (0.0%) |
| 5 to 9 Unit Apartments | 0 (0.0%) | 0 (0.0%) |
| 10 or more Apartments | 0 (0.0%) | 0 (0.0%) |
| Mobile Home / Other | 4 (100.0%) | 0 (0.0%) |
| Total | 44 (83.0%) | 9 (17.0%) |
Housing Structures by Number of Rooms in Stockett
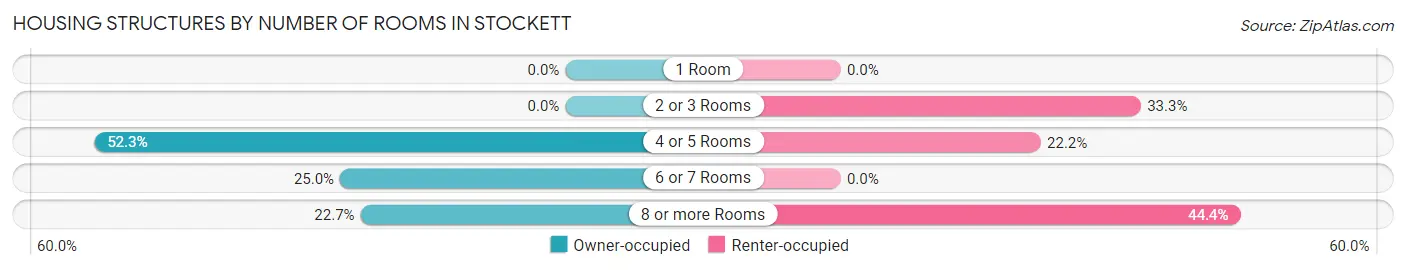
| Number of Rooms | Owner-occupied | Renter-occupied |
| 1 Room | 0 (0.0%) | 0 (0.0%) |
| 2 or 3 Rooms | 0 (0.0%) | 3 (33.3%) |
| 4 or 5 Rooms | 23 (52.3%) | 2 (22.2%) |
| 6 or 7 Rooms | 11 (25.0%) | 0 (0.0%) |
| 8 or more Rooms | 10 (22.7%) | 4 (44.4%) |
| Total | 44 (100.0%) | 9 (100.0%) |
Housing Structure by Heating Type in Stockett
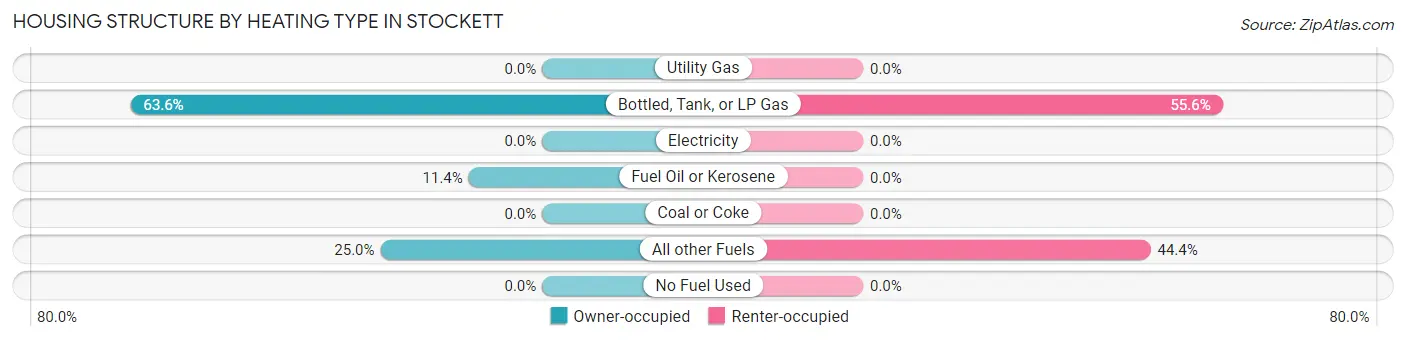
| Heating Type | Owner-occupied | Renter-occupied |
| Utility Gas | 0 (0.0%) | 0 (0.0%) |
| Bottled, Tank, or LP Gas | 28 (63.6%) | 5 (55.6%) |
| Electricity | 0 (0.0%) | 0 (0.0%) |
| Fuel Oil or Kerosene | 5 (11.4%) | 0 (0.0%) |
| Coal or Coke | 0 (0.0%) | 0 (0.0%) |
| All other Fuels | 11 (25.0%) | 4 (44.4%) |
| No Fuel Used | 0 (0.0%) | 0 (0.0%) |
| Total | 44 (100.0%) | 9 (100.0%) |
Household Vehicle Usage in Stockett
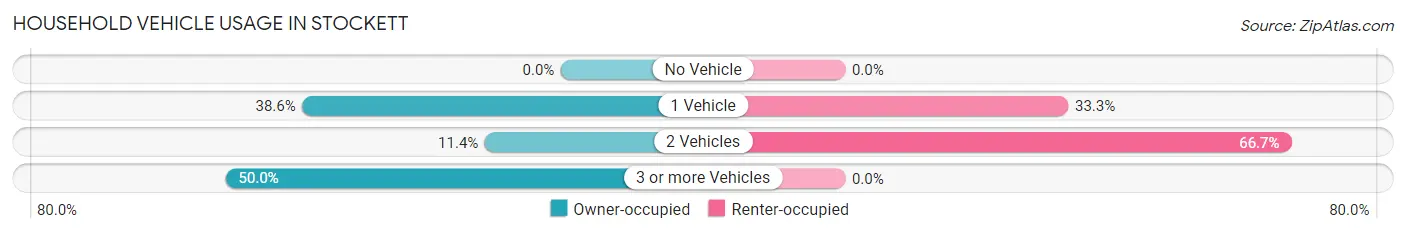
| Vehicles per Household | Owner-occupied | Renter-occupied |
| No Vehicle | 0 (0.0%) | 0 (0.0%) |
| 1 Vehicle | 17 (38.6%) | 3 (33.3%) |
| 2 Vehicles | 5 (11.4%) | 6 (66.7%) |
| 3 or more Vehicles | 22 (50.0%) | 0 (0.0%) |
| Total | 44 (100.0%) | 9 (100.0%) |
Real Estate & Mortgages in Stockett
Real Estate and Mortgage Overview in Stockett
| Characteristic | Without Mortgage | With Mortgage |
| Housing Units | 28 | 16 |
| Median Property Value | - | - |
| Median Household Income | $36,875 | $0 |
| Monthly Housing Costs | $346 | $0 |
| Real Estate Taxes | $1,125 | $0 |
Property Value by Mortgage Status in Stockett
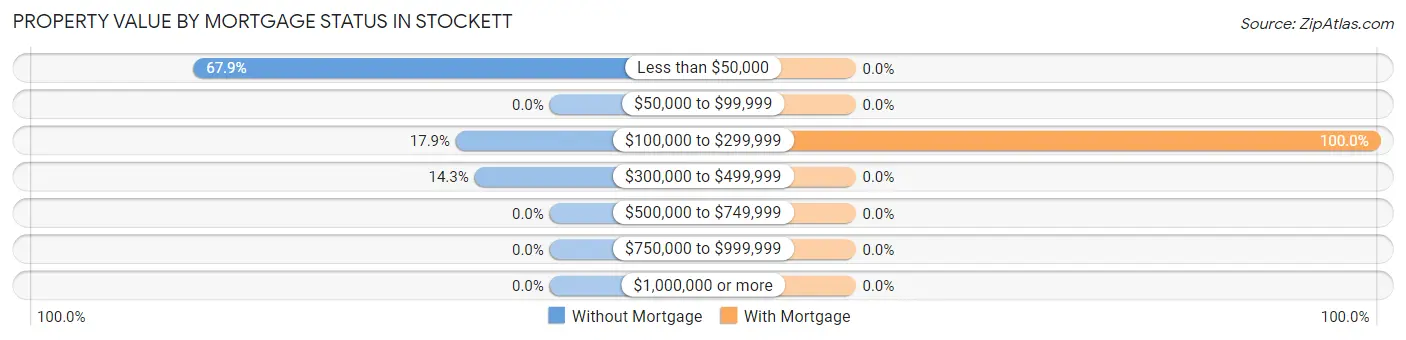
| Property Value | Without Mortgage | With Mortgage |
| Less than $50,000 | 19 (67.9%) | 0 (0.0%) |
| $50,000 to $99,999 | 0 (0.0%) | 0 (0.0%) |
| $100,000 to $299,999 | 5 (17.9%) | 16 (100.0%) |
| $300,000 to $499,999 | 4 (14.3%) | 0 (0.0%) |
| $500,000 to $749,999 | 0 (0.0%) | 0 (0.0%) |
| $750,000 to $999,999 | 0 (0.0%) | 0 (0.0%) |
| $1,000,000 or more | 0 (0.0%) | 0 (0.0%) |
| Total | 28 (100.0%) | 16 (100.0%) |
Household Income by Mortgage Status in Stockett
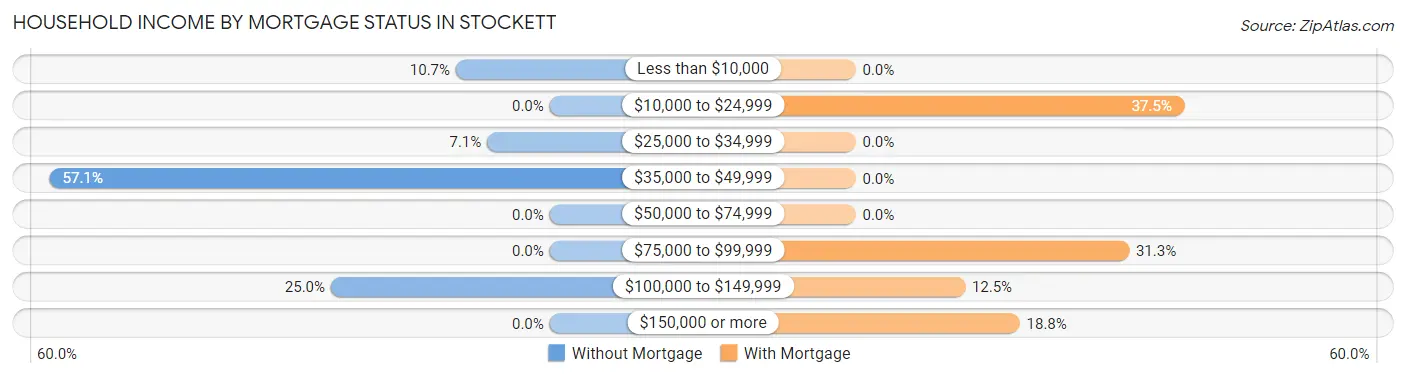
| Household Income | Without Mortgage | With Mortgage |
| Less than $10,000 | 3 (10.7%) | 0 (0.0%) |
| $10,000 to $24,999 | 0 (0.0%) | 6 (37.5%) |
| $25,000 to $34,999 | 2 (7.1%) | 0 (0.0%) |
| $35,000 to $49,999 | 16 (57.1%) | 0 (0.0%) |
| $50,000 to $74,999 | 0 (0.0%) | 0 (0.0%) |
| $75,000 to $99,999 | 0 (0.0%) | 5 (31.2%) |
| $100,000 to $149,999 | 7 (25.0%) | 2 (12.5%) |
| $150,000 or more | 0 (0.0%) | 3 (18.8%) |
| Total | 28 (100.0%) | 16 (100.0%) |
Property Value to Household Income Ratio in Stockett
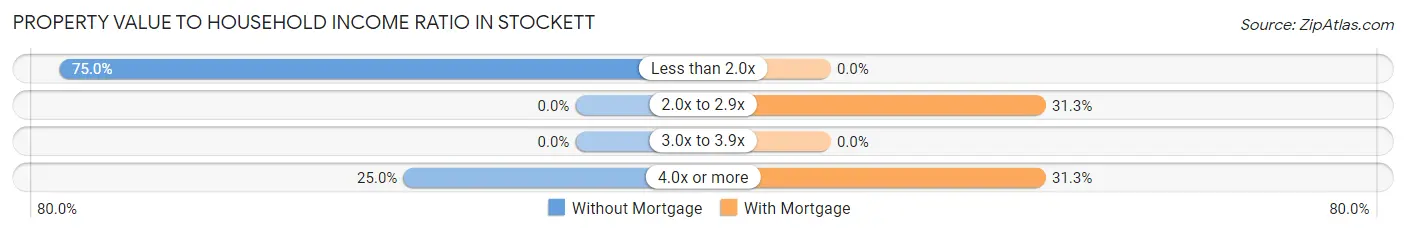
| Value-to-Income Ratio | Without Mortgage | With Mortgage |
| Less than 2.0x | 21 (75.0%) | 0 (0.0%) |
| 2.0x to 2.9x | 0 (0.0%) | 5 (31.2%) |
| 3.0x to 3.9x | 0 (0.0%) | 0 (0.0%) |
| 4.0x or more | 7 (25.0%) | 5 (31.2%) |
| Total | 28 (100.0%) | 16 (100.0%) |
Real Estate Taxes by Mortgage Status in Stockett
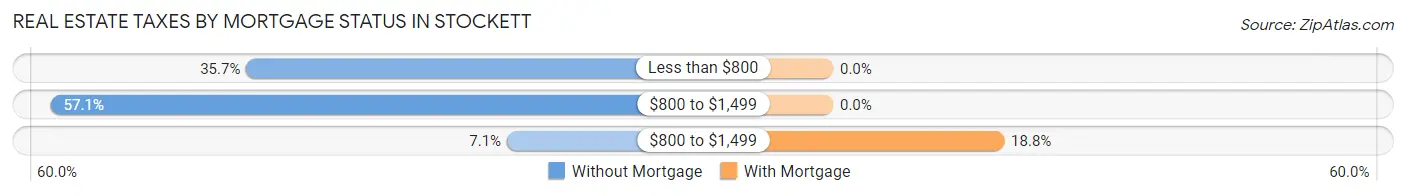
| Property Taxes | Without Mortgage | With Mortgage |
| Less than $800 | 10 (35.7%) | 0 (0.0%) |
| $800 to $1,499 | 16 (57.1%) | 0 (0.0%) |
| $800 to $1,499 | 2 (7.1%) | 3 (18.8%) |
| Total | 28 (100.0%) | 16 (100.0%) |
Health & Disability in Stockett
Health Insurance Coverage by Age in Stockett
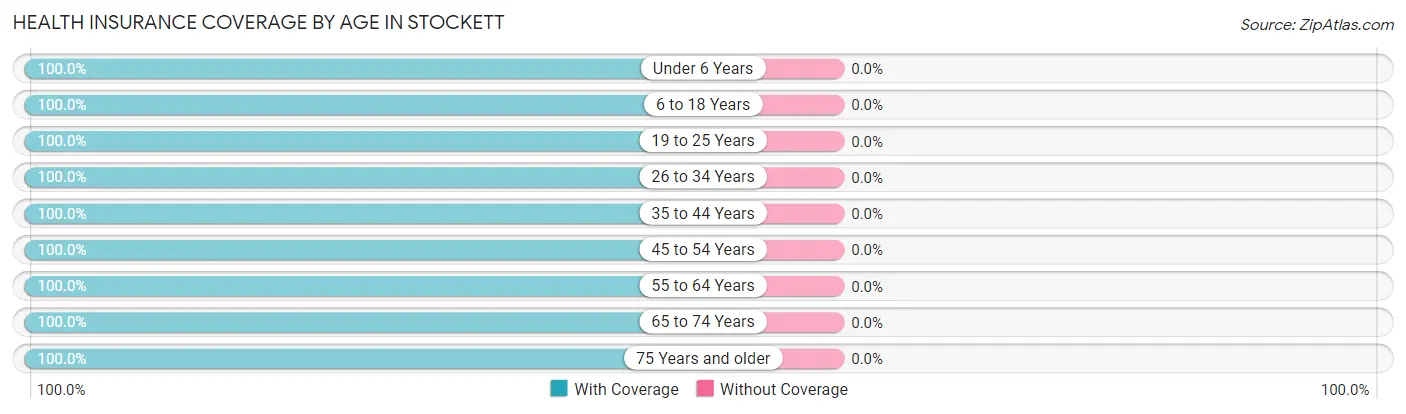
| Age Bracket | With Coverage | Without Coverage |
| Under 6 Years | 8 (100.0%) | 0 (0.0%) |
| 6 to 18 Years | 22 (100.0%) | 0 (0.0%) |
| 19 to 25 Years | 6 (100.0%) | 0 (0.0%) |
| 26 to 34 Years | 9 (100.0%) | 0 (0.0%) |
| 35 to 44 Years | 4 (100.0%) | 0 (0.0%) |
| 45 to 54 Years | 11 (100.0%) | 0 (0.0%) |
| 55 to 64 Years | 32 (100.0%) | 0 (0.0%) |
| 65 to 74 Years | 44 (100.0%) | 0 (0.0%) |
| 75 Years and older | 9 (100.0%) | 0 (0.0%) |
| Total | 145 (100.0%) | 0 (0.0%) |
Health Insurance Coverage by Citizenship Status in Stockett
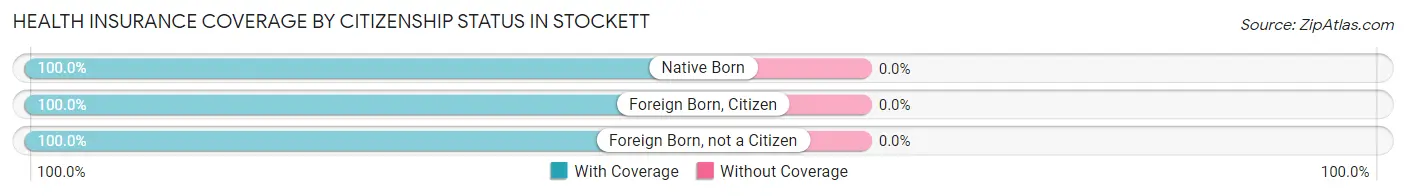
| Citizenship Status | With Coverage | Without Coverage |
| Native Born | 8 (100.0%) | 0 (0.0%) |
| Foreign Born, Citizen | 22 (100.0%) | 0 (0.0%) |
| Foreign Born, not a Citizen | 6 (100.0%) | 0 (0.0%) |
Health Insurance Coverage by Household Income in Stockett
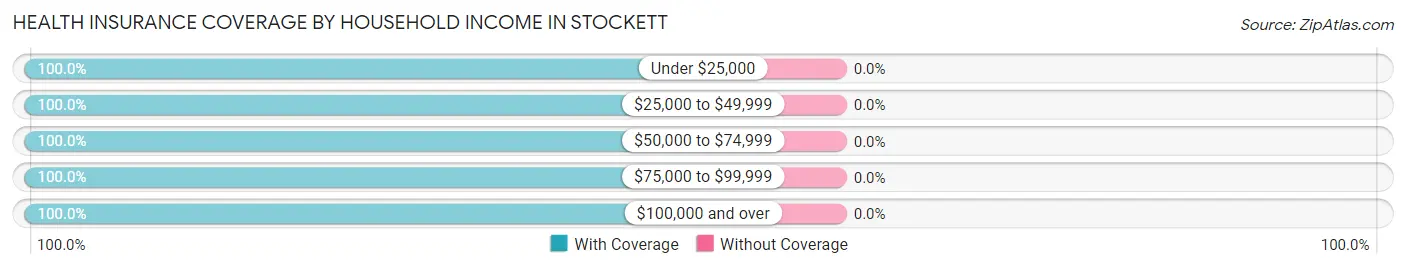
| Household Income | With Coverage | Without Coverage |
| Under $25,000 | 9 (100.0%) | 0 (0.0%) |
| $25,000 to $49,999 | 88 (100.0%) | 0 (0.0%) |
| $50,000 to $74,999 | 9 (100.0%) | 0 (0.0%) |
| $75,000 to $99,999 | 11 (100.0%) | 0 (0.0%) |
| $100,000 and over | 28 (100.0%) | 0 (0.0%) |
Public vs Private Health Insurance Coverage by Age in Stockett
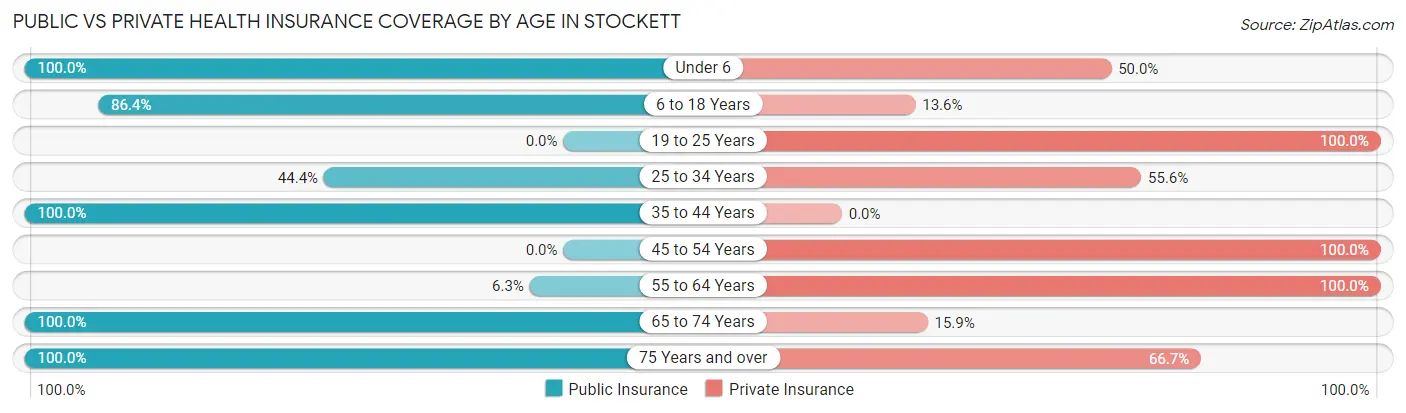
| Age Bracket | Public Insurance | Private Insurance |
| Under 6 | 8 (100.0%) | 4 (50.0%) |
| 6 to 18 Years | 19 (86.4%) | 3 (13.6%) |
| 19 to 25 Years | 0 (0.0%) | 6 (100.0%) |
| 25 to 34 Years | 4 (44.4%) | 5 (55.6%) |
| 35 to 44 Years | 4 (100.0%) | 0 (0.0%) |
| 45 to 54 Years | 0 (0.0%) | 11 (100.0%) |
| 55 to 64 Years | 2 (6.2%) | 32 (100.0%) |
| 65 to 74 Years | 44 (100.0%) | 7 (15.9%) |
| 75 Years and over | 9 (100.0%) | 6 (66.7%) |
| Total | 90 (62.1%) | 74 (51.0%) |
Disability Status by Sex by Age in Stockett
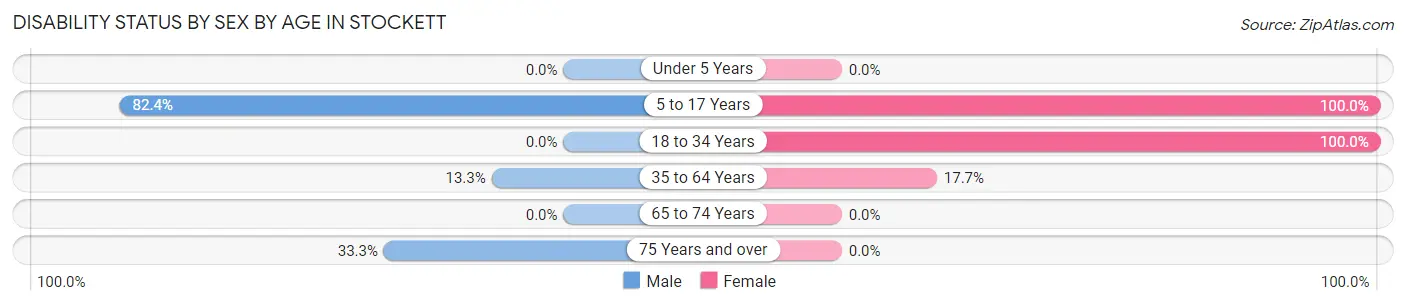
| Age Bracket | Male | Female |
| Under 5 Years | 0 (0.0%) | 0 (0.0%) |
| 5 to 17 Years | 14 (82.4%) | 5 (100.0%) |
| 18 to 34 Years | 0 (0.0%) | 4 (100.0%) |
| 35 to 64 Years | 4 (13.3%) | 3 (17.6%) |
| 65 to 74 Years | 0 (0.0%) | 0 (0.0%) |
| 75 Years and over | 2 (33.3%) | 0 (0.0%) |
Disability Class by Sex by Age in Stockett
Disability Class: Hearing Difficulty
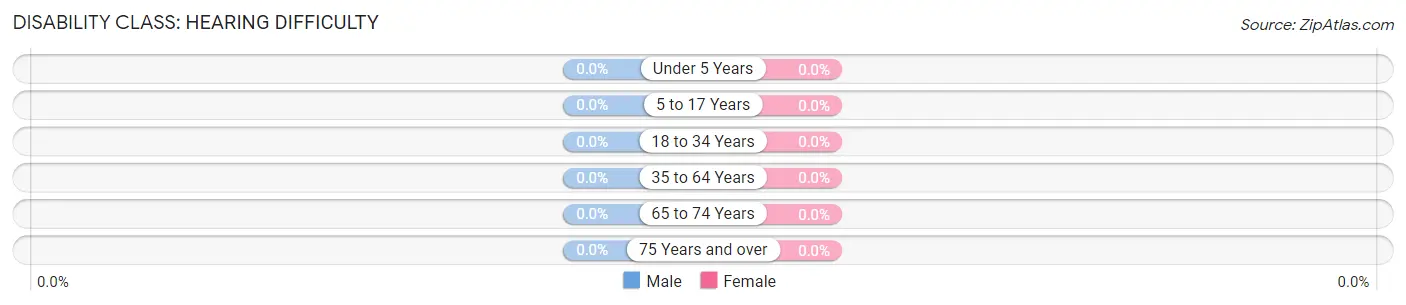
| Age Bracket | Male | Female |
| Under 5 Years | 0 (0.0%) | 0 (0.0%) |
| 5 to 17 Years | 0 (0.0%) | 0 (0.0%) |
| 18 to 34 Years | 0 (0.0%) | 0 (0.0%) |
| 35 to 64 Years | 0 (0.0%) | 0 (0.0%) |
| 65 to 74 Years | 0 (0.0%) | 0 (0.0%) |
| 75 Years and over | 0 (0.0%) | 0 (0.0%) |
Disability Class: Vision Difficulty
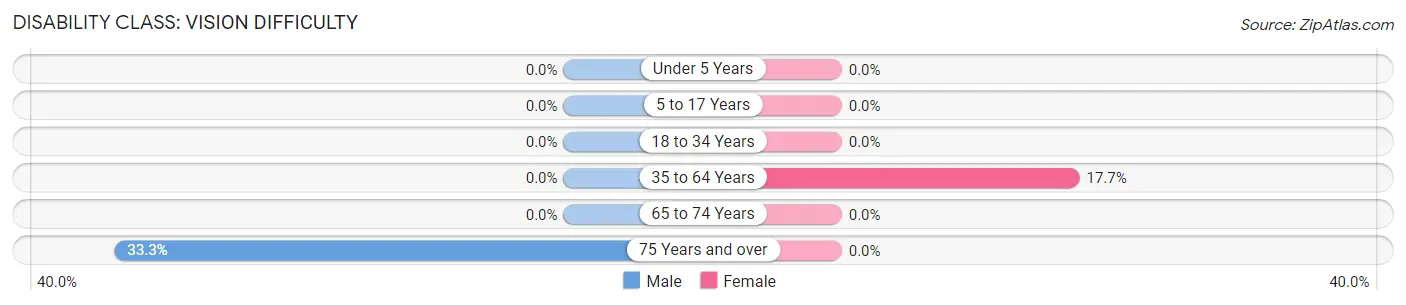
| Age Bracket | Male | Female |
| Under 5 Years | 0 (0.0%) | 0 (0.0%) |
| 5 to 17 Years | 0 (0.0%) | 0 (0.0%) |
| 18 to 34 Years | 0 (0.0%) | 0 (0.0%) |
| 35 to 64 Years | 0 (0.0%) | 3 (17.6%) |
| 65 to 74 Years | 0 (0.0%) | 0 (0.0%) |
| 75 Years and over | 2 (33.3%) | 0 (0.0%) |
Disability Class: Cognitive Difficulty
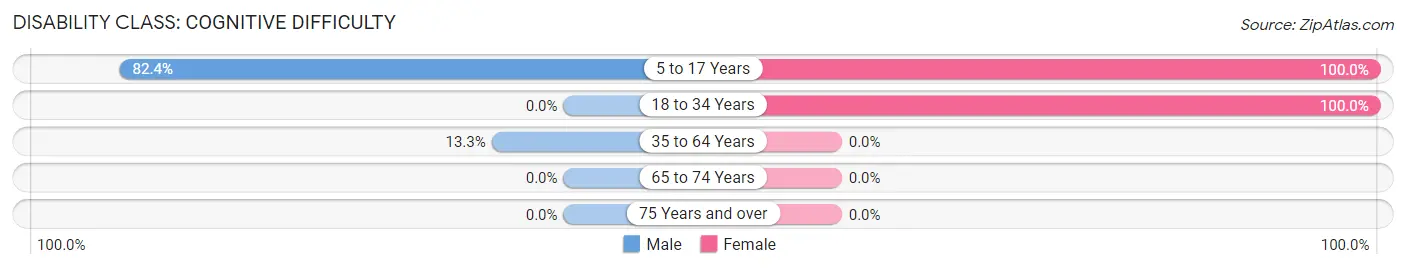
| Age Bracket | Male | Female |
| 5 to 17 Years | 14 (82.4%) | 5 (100.0%) |
| 18 to 34 Years | 0 (0.0%) | 4 (100.0%) |
| 35 to 64 Years | 4 (13.3%) | 0 (0.0%) |
| 65 to 74 Years | 0 (0.0%) | 0 (0.0%) |
| 75 Years and over | 0 (0.0%) | 0 (0.0%) |
Disability Class: Ambulatory Difficulty
| Age Bracket | Male | Female |
| 5 to 17 Years | 0 (0.0%) | 0 (0.0%) |
| 18 to 34 Years | 0 (0.0%) | 0 (0.0%) |
| 35 to 64 Years | 0 (0.0%) | 0 (0.0%) |
| 65 to 74 Years | 0 (0.0%) | 0 (0.0%) |
| 75 Years and over | 0 (0.0%) | 0 (0.0%) |
Disability Class: Self-Care Difficulty
| Age Bracket | Male | Female |
| 5 to 17 Years | 0 (0.0%) | 0 (0.0%) |
| 18 to 34 Years | 0 (0.0%) | 0 (0.0%) |
| 35 to 64 Years | 0 (0.0%) | 0 (0.0%) |
| 65 to 74 Years | 0 (0.0%) | 0 (0.0%) |
| 75 Years and over | 0 (0.0%) | 0 (0.0%) |
Technology Access in Stockett
Computing Device Access in Stockett
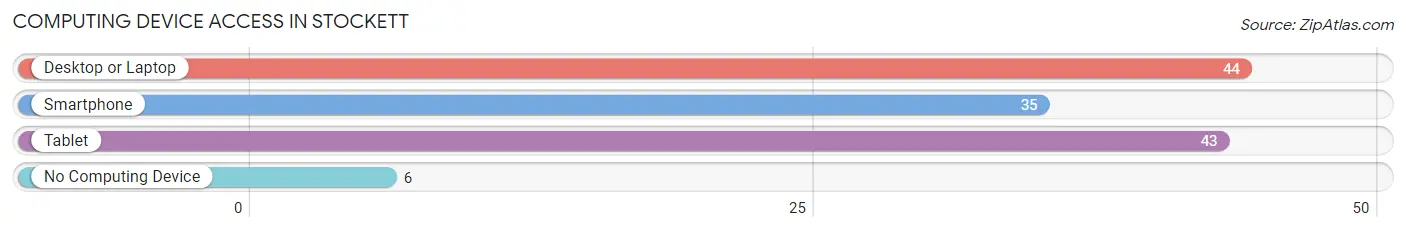
| Device Type | # Households | % Households |
| Desktop or Laptop | 44 | 83.0% |
| Smartphone | 35 | 66.0% |
| Tablet | 43 | 81.1% |
| No Computing Device | 6 | 11.3% |
| Total | 53 | 100.0% |
Internet Access in Stockett
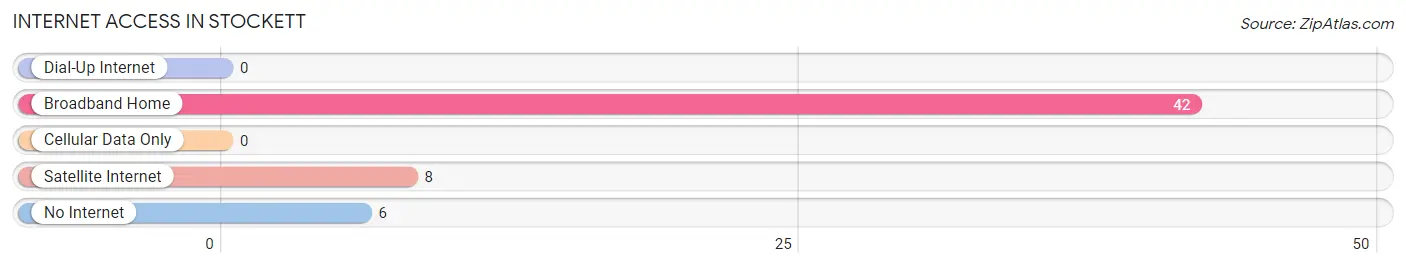
| Internet Type | # Households | % Households |
| Dial-Up Internet | 0 | 0.0% |
| Broadband Home | 42 | 79.2% |
| Cellular Data Only | 0 | 0.0% |
| Satellite Internet | 8 | 15.1% |
| No Internet | 6 | 11.3% |
| Total | 53 | 100.0% |
Stockett Summary
Stockett, Montana is a small unincorporated community located in Cascade County, Montana. It is situated along the Missouri River, approximately 20 miles north of Great Falls. The population of Stockett was estimated to be around 200 people in 2020.
History
Stockett was founded in 1883 by a group of homesteaders who were looking for a place to settle and start a new life. The town was named after the Stockett family, who were among the first settlers. The Stocketts were originally from Iowa and had moved to Montana in search of a better life.
The town grew quickly and soon had a post office, a general store, a school, and a church. The Stockett family was very involved in the community and helped to build the town.
In the early 1900s, Stockett was a thriving community with a population of over 500 people. The town had a variety of businesses, including a blacksmith, a livery stable, a hotel, and a saloon.
The town began to decline in the 1920s, as the Great Depression hit the area. Many of the businesses closed and the population began to dwindle. By the 1950s, the population had dropped to around 200 people.
Geography
Stockett is located in Cascade County, Montana, along the Missouri River. The town is situated at an elevation of 3,000 feet and is surrounded by rolling hills and grasslands. The area is known for its beautiful scenery and is a popular destination for outdoor activities such as fishing, hunting, and camping.
The climate in Stockett is semi-arid, with hot summers and cold winters. The average temperature in the summer is around 80 degrees Fahrenheit, while the average temperature in the winter is around 20 degrees Fahrenheit.
Economy
The economy of Stockett is largely based on agriculture and ranching. The town is home to several farms and ranches, which produce a variety of crops and livestock. The town also has a few small businesses, including a general store and a gas station.
Demographics
The population of Stockett was estimated to be around 200 people in 2020. The town is predominantly white, with a small Hispanic population. The median household income in Stockett is around $45,000, which is slightly lower than the national average. The town has a high rate of poverty, with around 25% of the population living below the poverty line.
Common Questions
What is Per Capita Income in Stockett?
Per Capita income in Stockett is $21,313.
What is the Median Household income in Stockett?
Median Household Income in Stockett is $38,472.
What is Inequality or Gini Index in Stockett?
Inequality or Gini Index in Stockett is 0.39.
What is the Total Population of Stockett?
Total Population of Stockett is 150.
What is the Total Male Population of Stockett?
Total Male Population of Stockett is 73.
What is the Total Female Population of Stockett?
Total Female Population of Stockett is 77.
What is the Ratio of Males per 100 Females in Stockett?
There are 94.81 Males per 100 Females in Stockett.
What is the Ratio of Females per 100 Males in Stockett?
There are 105.48 Females per 100 Males in Stockett.
What is the Median Population Age in Stockett?
Median Population Age in Stockett is 61.3 Years.
What is the Average Family Size in Stockett
Average Family Size in Stockett is 3.8 People.
What is the Average Household Size in Stockett
Average Household Size in Stockett is 2.8 People.
How Large is the Labor Force in Stockett?
There are 72 People in the Labor Forcein in Stockett.
What is the Percentage of People in the Labor Force in Stockett?
56.3% of People are in the Labor Force in Stockett.
What is the Unemployment Rate in Stockett?
Unemployment Rate in Stockett is 6.0%.