Spring Hill, IN Map & Demographics
Spring Hill Map
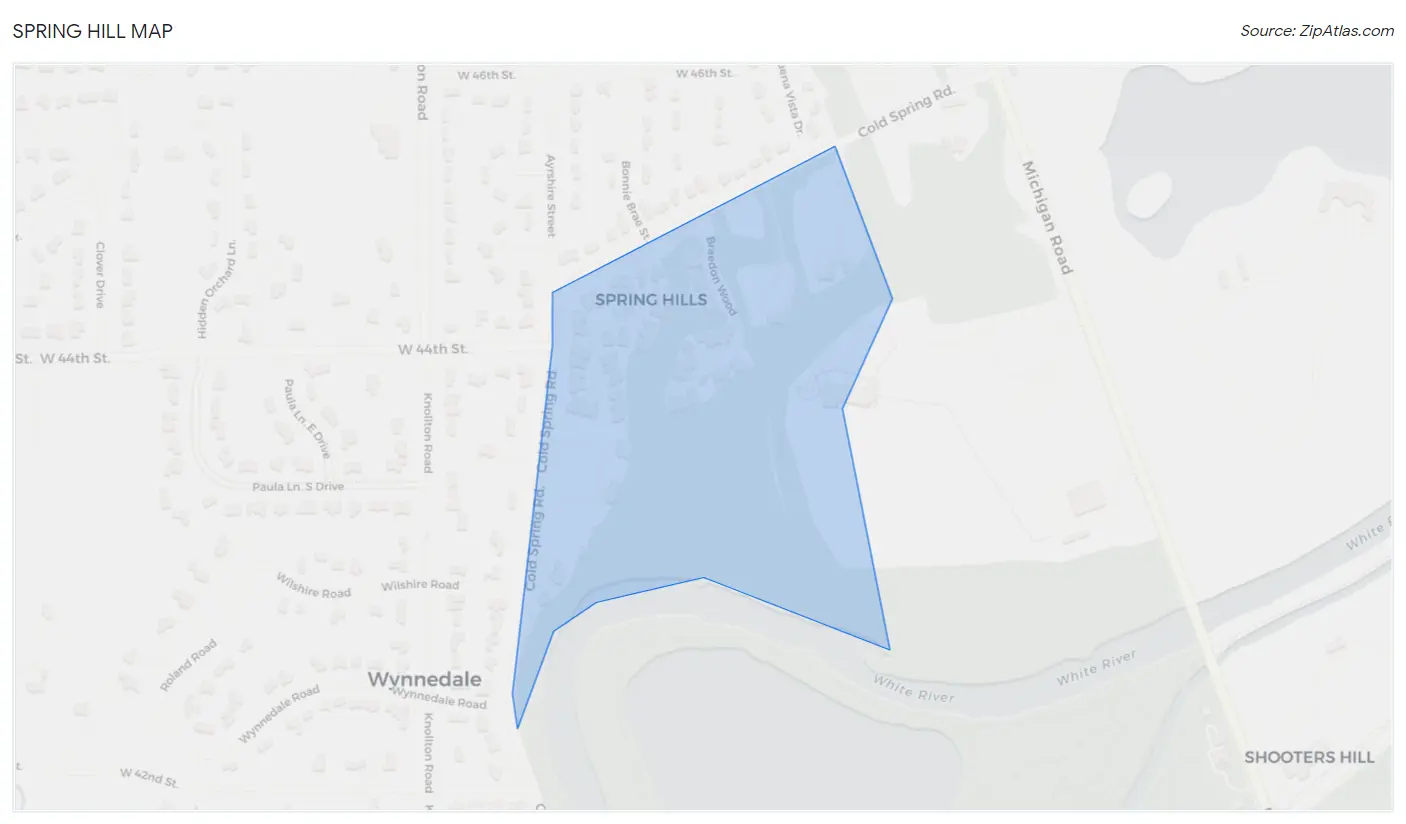
Spring Hill Overview
$89,876
PER CAPITA INCOME
$168,750
AVG FAMILY INCOME
$130,000
AVG HOUSEHOLD INCOME
25.3%
WAGE / INCOME GAP [ % ]
74.7¢/ $1
WAGE / INCOME GAP [ $ ]
0.28
INEQUALITY / GINI INDEX
72
TOTAL POPULATION
33
MALE POPULATION
39
FEMALE POPULATION
84.62
MALES / 100 FEMALES
118.18
FEMALES / 100 MALES
72.0
MEDIAN AGE
2.0
AVG FAMILY SIZE
1.5
AVG HOUSEHOLD SIZE
30
LABOR FORCE [ PEOPLE ]
41.7%
PERCENT IN LABOR FORCE
Income in Spring Hill
Income Overview in Spring Hill
Per Capita Income in Spring Hill is $89,876, while median incomes of families and households are $168,750 and $130,000 respectively.
| Characteristic | Number | Measure |
| Per Capita Income | 72 | $89,876 |
| Median Family Income | 19 | $168,750 |
| Mean Family Income | 19 | $154,026 |
| Median Household Income | 48 | $130,000 |
| Mean Household Income | 48 | $134,260 |
| Income Deficit | 19 | $0 |
| Wage / Income Gap (%) | 72 | 25.33% |
| Wage / Income Gap ($) | 72 | 74.67¢ per $1 |
| Gini / Inequality Index | 72 | 0.28 |
Earnings by Sex in Spring Hill
Average Earnings in Spring Hill are $91,250, $84,000 for men and $112,500 for women, a difference of 25.3%.
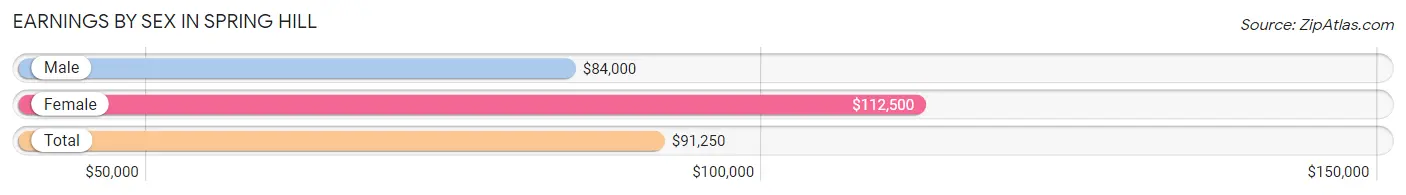
| Sex | Number | Average Earnings |
| Male | 20 (62.5%) | $84,000 |
| Female | 12 (37.5%) | $112,500 |
| Total | 32 (100.0%) | $91,250 |
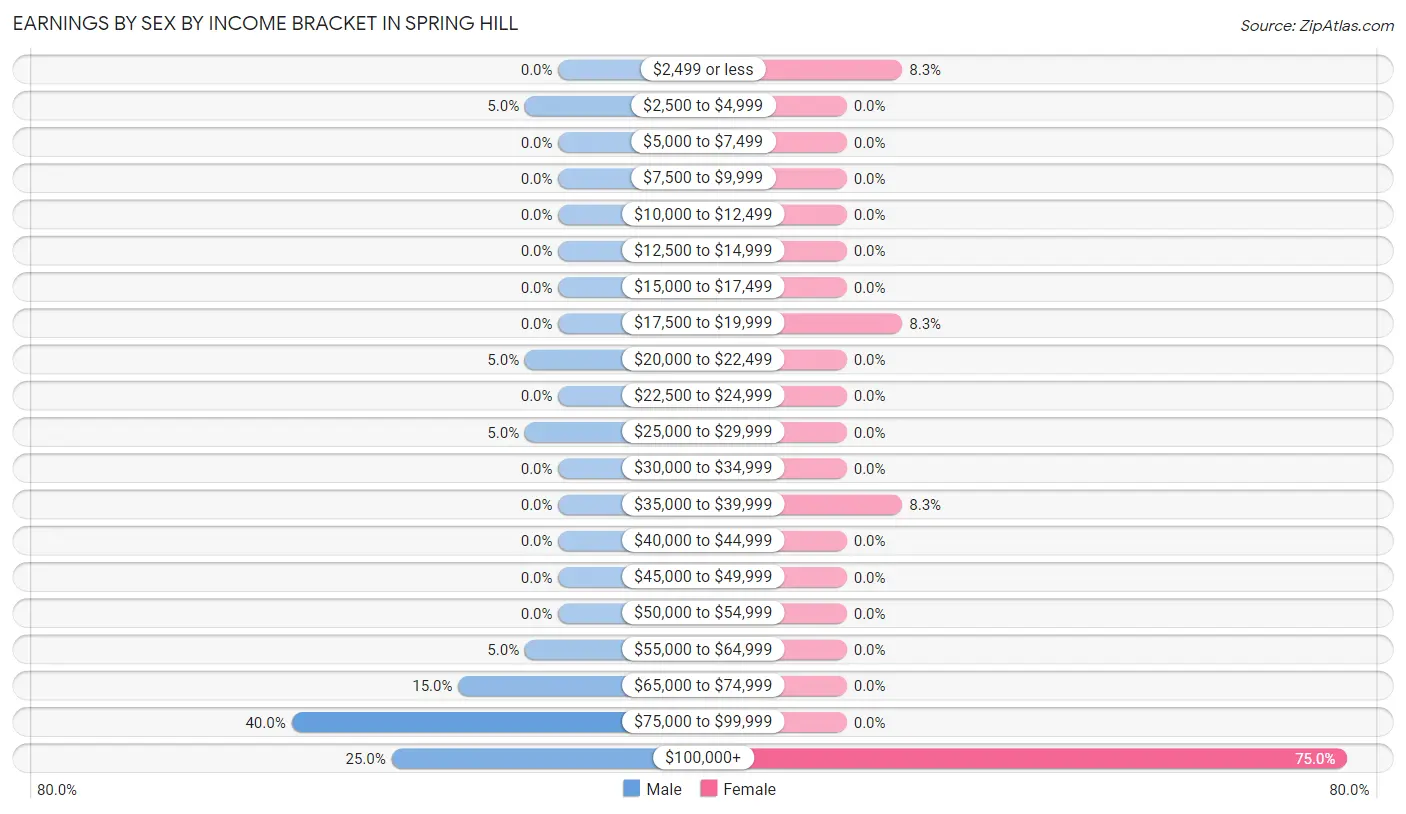
Earnings by Sex by Income Bracket in Spring Hill
The most common earnings brackets in Spring Hill are $75,000 to $99,999 for men (8 | 40.0%) and $100,000+ for women (9 | 75.0%).
| Income | Male | Female |
| $2,499 or less | 0 (0.0%) | 1 (8.3%) |
| $2,500 to $4,999 | 1 (5.0%) | 0 (0.0%) |
| $5,000 to $7,499 | 0 (0.0%) | 0 (0.0%) |
| $7,500 to $9,999 | 0 (0.0%) | 0 (0.0%) |
| $10,000 to $12,499 | 0 (0.0%) | 0 (0.0%) |
| $12,500 to $14,999 | 0 (0.0%) | 0 (0.0%) |
| $15,000 to $17,499 | 0 (0.0%) | 0 (0.0%) |
| $17,500 to $19,999 | 0 (0.0%) | 1 (8.3%) |
| $20,000 to $22,499 | 1 (5.0%) | 0 (0.0%) |
| $22,500 to $24,999 | 0 (0.0%) | 0 (0.0%) |
| $25,000 to $29,999 | 1 (5.0%) | 0 (0.0%) |
| $30,000 to $34,999 | 0 (0.0%) | 0 (0.0%) |
| $35,000 to $39,999 | 0 (0.0%) | 1 (8.3%) |
| $40,000 to $44,999 | 0 (0.0%) | 0 (0.0%) |
| $45,000 to $49,999 | 0 (0.0%) | 0 (0.0%) |
| $50,000 to $54,999 | 0 (0.0%) | 0 (0.0%) |
| $55,000 to $64,999 | 1 (5.0%) | 0 (0.0%) |
| $65,000 to $74,999 | 3 (15.0%) | 0 (0.0%) |
| $75,000 to $99,999 | 8 (40.0%) | 0 (0.0%) |
| $100,000+ | 5 (25.0%) | 9 (75.0%) |
| Total | 20 (100.0%) | 12 (100.0%) |
Earnings by Sex by Educational Attainment in Spring Hill
Average earnings in Spring Hill are $84,000 for men and $112,500 for women, a difference of 25.3%. Men with an educational attainment of college or associate's degree enjoy the highest average annual earnings of $93,750, while those with bachelor's degree education earn the least with $66,250. Women with an educational attainment of bachelor's degree earn the most with the average annual earnings of $112,500, while those with bachelor's degree education have the smallest earnings of $112,500.
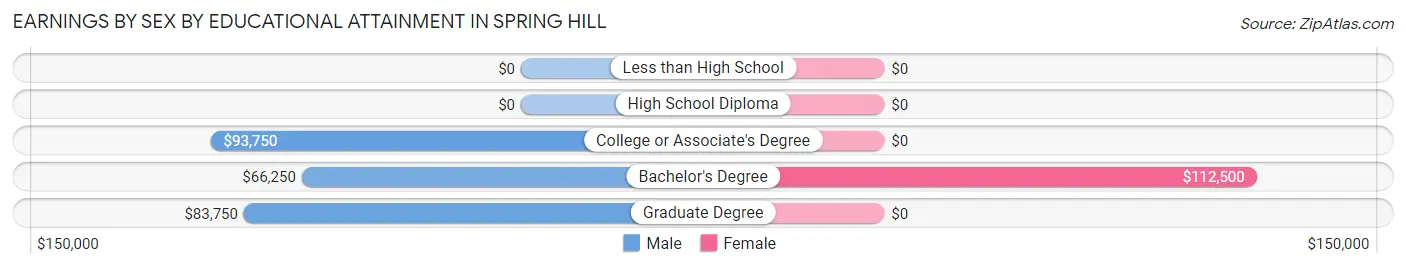
| Educational Attainment | Male Income | Female Income |
| Less than High School | - | - |
| High School Diploma | - | - |
| College or Associate's Degree | $93,750 | $0 |
| Bachelor's Degree | $66,250 | $112,500 |
| Graduate Degree | $83,750 | $0 |
| Total | $84,000 | $112,500 |
Family Income in Spring Hill
Family Income Brackets in Spring Hill
According to the Spring Hill family income data, there are 12 families falling into the $150,000 to $199,999 income range, which is the most common income bracket and makes up 63.2% of all families.
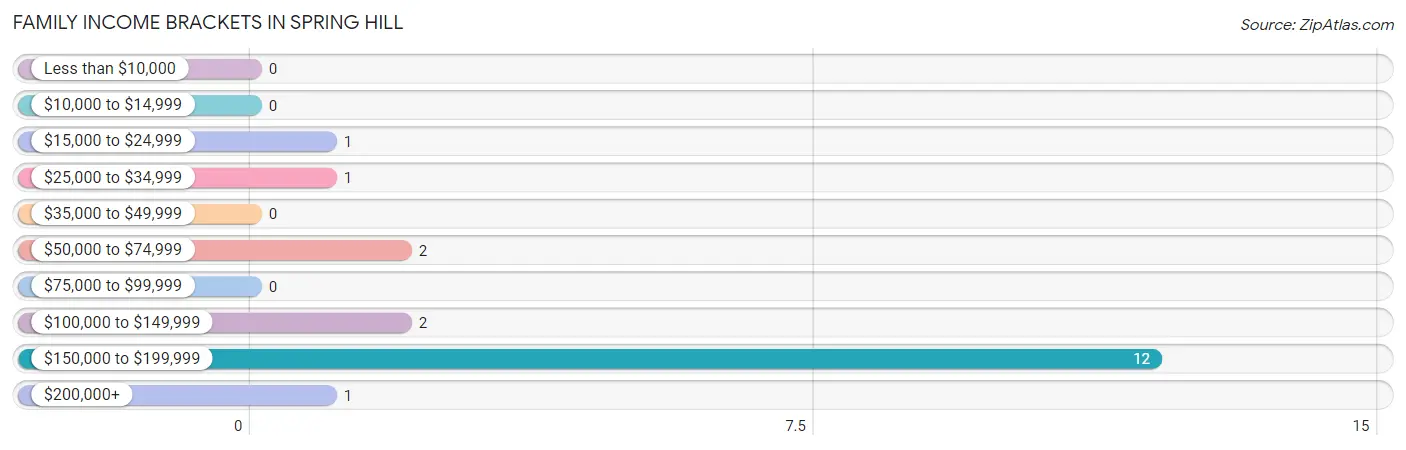
| Income Bracket | # Families | % Families |
| Less than $10,000 | 0 | 0.0% |
| $10,000 to $14,999 | 0 | 0.0% |
| $15,000 to $24,999 | 1 | 5.3% |
| $25,000 to $34,999 | 1 | 5.3% |
| $35,000 to $49,999 | 0 | 0.0% |
| $50,000 to $74,999 | 2 | 10.5% |
| $75,000 to $99,999 | 0 | 0.0% |
| $100,000 to $149,999 | 2 | 10.5% |
| $150,000 to $199,999 | 12 | 63.2% |
| $200,000+ | 1 | 5.3% |
Family Income by Famaliy Size in Spring Hill
2-person families (19 | 100.0%) account for the highest median family income in Spring Hill with $168,750 per family, while 2-person families (19 | 100.0%) have the highest median income of $84,375 per family member.
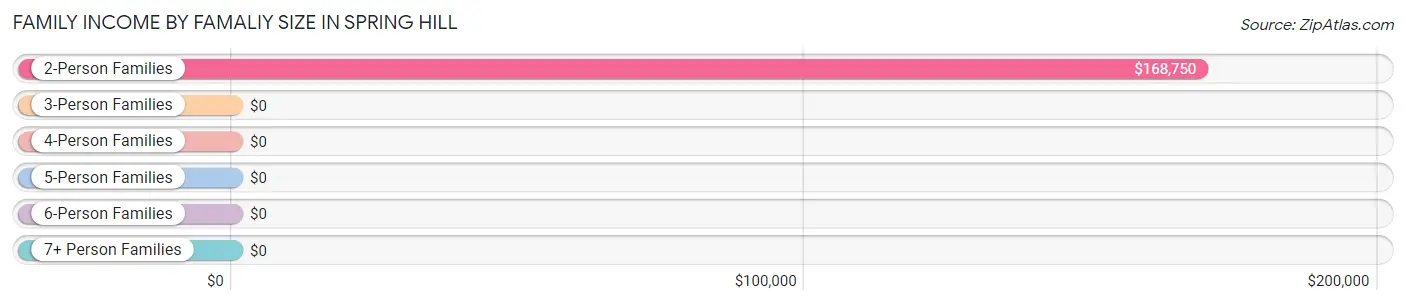
| Income Bracket | # Families | Median Income |
| 2-Person Families | 19 (100.0%) | $168,750 |
| 3-Person Families | 0 (0.0%) | $0 |
| 4-Person Families | 0 (0.0%) | $0 |
| 5-Person Families | 0 (0.0%) | $0 |
| 6-Person Families | 0 (0.0%) | $0 |
| 7+ Person Families | 0 (0.0%) | $0 |
| Total | 19 (100.0%) | $168,750 |
Family Income by Number of Earners in Spring Hill
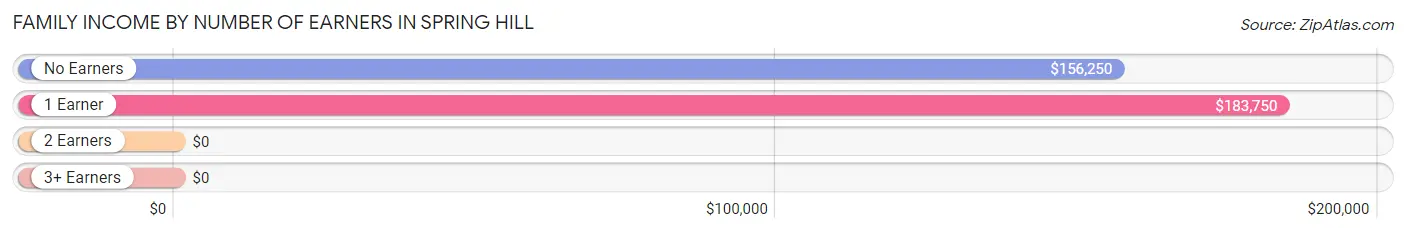
| Number of Earners | # Families | Median Income |
| No Earners | 10 (52.6%) | $156,250 |
| 1 Earner | 5 (26.3%) | $183,750 |
| 2 Earners | 4 (21.0%) | $0 |
| 3+ Earners | 0 (0.0%) | $0 |
| Total | 19 (100.0%) | $168,750 |
Household Income in Spring Hill
Household Income Brackets in Spring Hill
With 17 households falling in the category, the $150,000 to $199,999 income range is the most frequent in Spring Hill, accounting for 35.4% of all households.
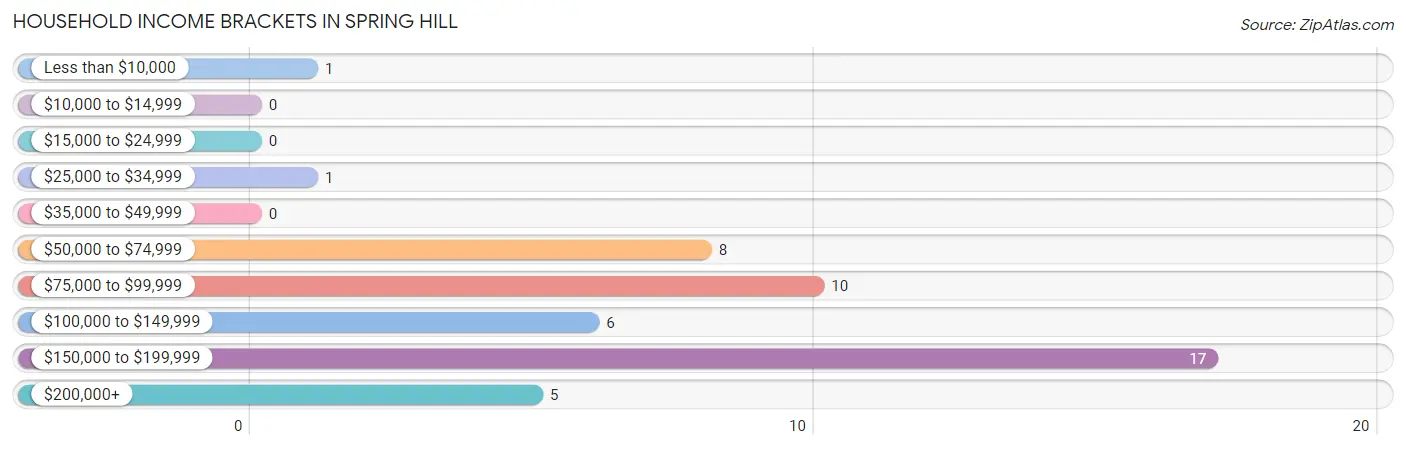
| Income Bracket | # Households | % Households |
| Less than $10,000 | 1 | 2.1% |
| $10,000 to $14,999 | 0 | 0.0% |
| $15,000 to $24,999 | 0 | 0.0% |
| $25,000 to $34,999 | 1 | 2.1% |
| $35,000 to $49,999 | 0 | 0.0% |
| $50,000 to $74,999 | 8 | 16.7% |
| $75,000 to $99,999 | 10 | 20.8% |
| $100,000 to $149,999 | 6 | 12.5% |
| $150,000 to $199,999 | 17 | 35.4% |
| $200,000+ | 5 | 10.4% |
Household Income by Householder Age in Spring Hill
The median household income in Spring Hill is $130,000, with the highest median household income of $153,125 found in the 65+ years age bracket for the primary householder. A total of 37 households (77.1%) fall into this category.
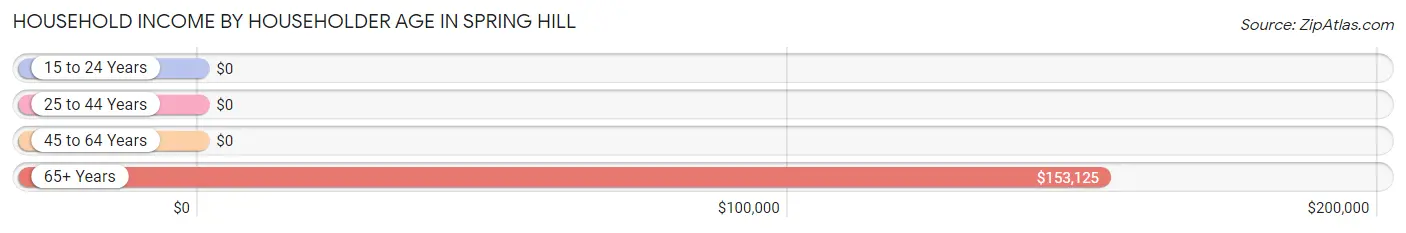
| Income Bracket | # Households | Median Income |
| 15 to 24 Years | 0 (0.0%) | $0 |
| 25 to 44 Years | 1 (2.1%) | $0 |
| 45 to 64 Years | 10 (20.8%) | $0 |
| 65+ Years | 37 (77.1%) | $153,125 |
| Total | 48 (100.0%) | $130,000 |
Poverty in Spring Hill
Income Below Poverty by Sex and Age in Spring Hill
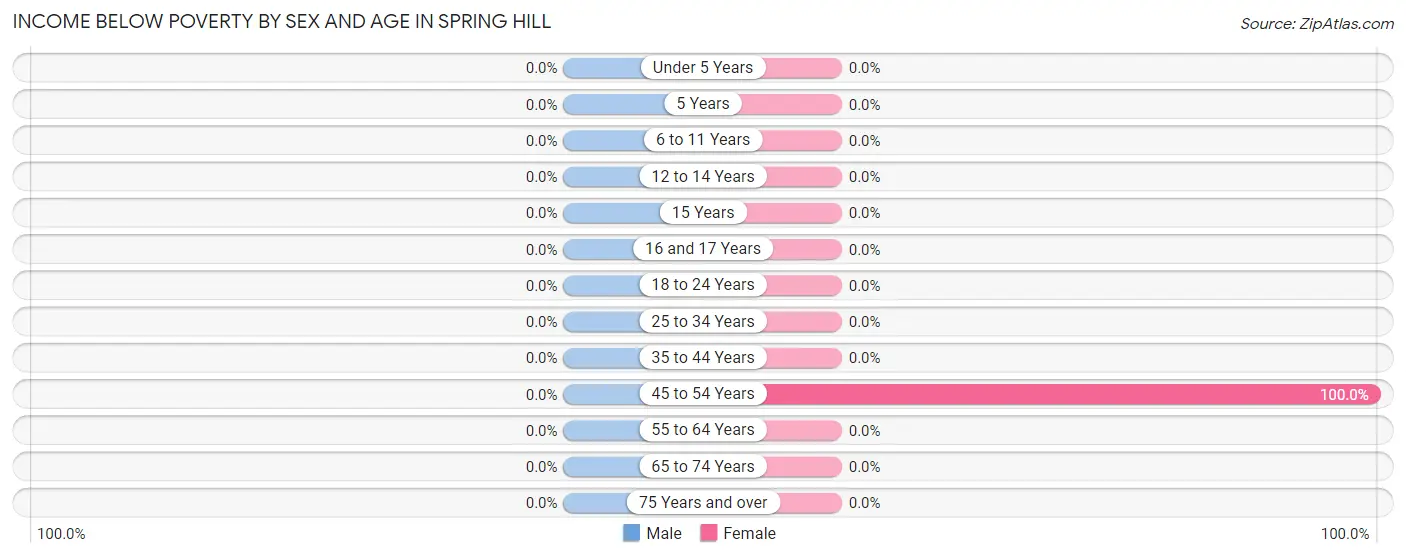
| Age Bracket | Male | Female |
| Under 5 Years | 0 (0.0%) | 0 (0.0%) |
| 5 Years | 0 (0.0%) | 0 (0.0%) |
| 6 to 11 Years | 0 (0.0%) | 0 (0.0%) |
| 12 to 14 Years | 0 (0.0%) | 0 (0.0%) |
| 15 Years | 0 (0.0%) | 0 (0.0%) |
| 16 and 17 Years | 0 (0.0%) | 0 (0.0%) |
| 18 to 24 Years | 0 (0.0%) | 0 (0.0%) |
| 25 to 34 Years | 0 (0.0%) | 0 (0.0%) |
| 35 to 44 Years | 0 (0.0%) | 0 (0.0%) |
| 45 to 54 Years | 0 (0.0%) | 1 (100.0%) |
| 55 to 64 Years | 0 (0.0%) | 0 (0.0%) |
| 65 to 74 Years | 0 (0.0%) | 0 (0.0%) |
| 75 Years and over | 0 (0.0%) | 0 (0.0%) |
| Total | 0 (0.0%) | 1 (2.6%) |
Income Above Poverty by Sex and Age in Spring Hill
According to the poverty statistics in Spring Hill, males aged 35 to 44 years and females aged 35 to 44 years are the age groups that are most secure financially, with 100.0% of males and 100.0% of females in these age groups living above the poverty line.
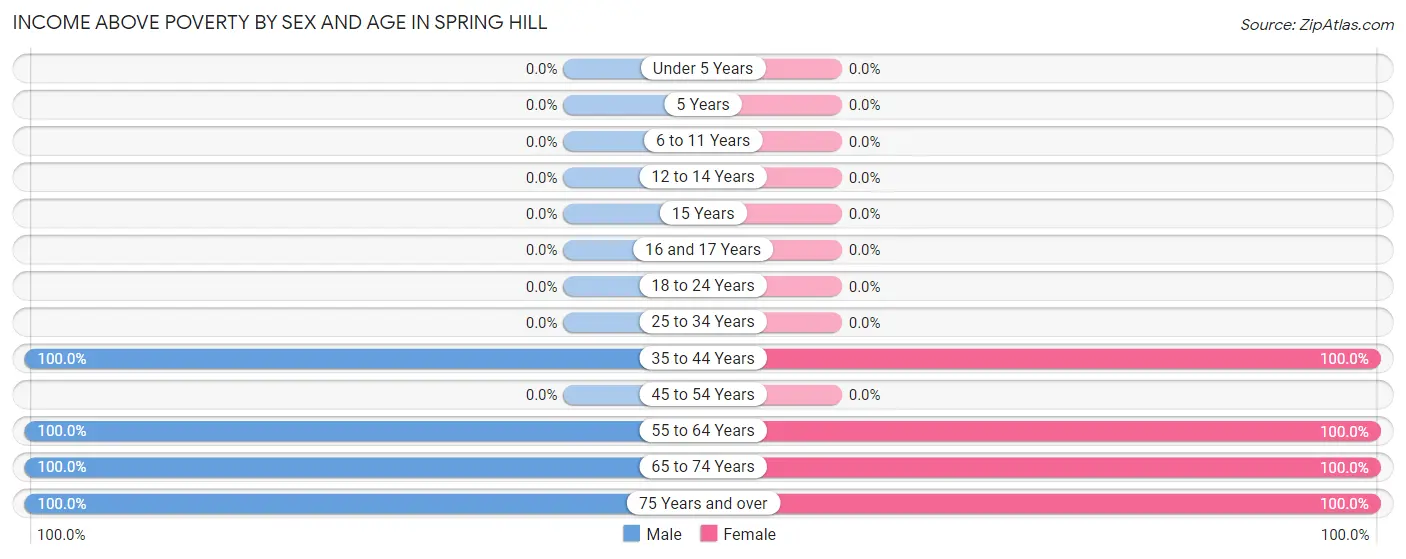
| Age Bracket | Male | Female |
| Under 5 Years | 0 (0.0%) | 0 (0.0%) |
| 5 Years | 0 (0.0%) | 0 (0.0%) |
| 6 to 11 Years | 0 (0.0%) | 0 (0.0%) |
| 12 to 14 Years | 0 (0.0%) | 0 (0.0%) |
| 15 Years | 0 (0.0%) | 0 (0.0%) |
| 16 and 17 Years | 0 (0.0%) | 0 (0.0%) |
| 18 to 24 Years | 0 (0.0%) | 0 (0.0%) |
| 25 to 34 Years | 0 (0.0%) | 0 (0.0%) |
| 35 to 44 Years | 1 (100.0%) | 2 (100.0%) |
| 45 to 54 Years | 0 (0.0%) | 0 (0.0%) |
| 55 to 64 Years | 12 (100.0%) | 6 (100.0%) |
| 65 to 74 Years | 8 (100.0%) | 18 (100.0%) |
| 75 Years and over | 12 (100.0%) | 12 (100.0%) |
| Total | 33 (100.0%) | 38 (97.4%) |
Income Below Poverty Among Married-Couple Families in Spring Hill
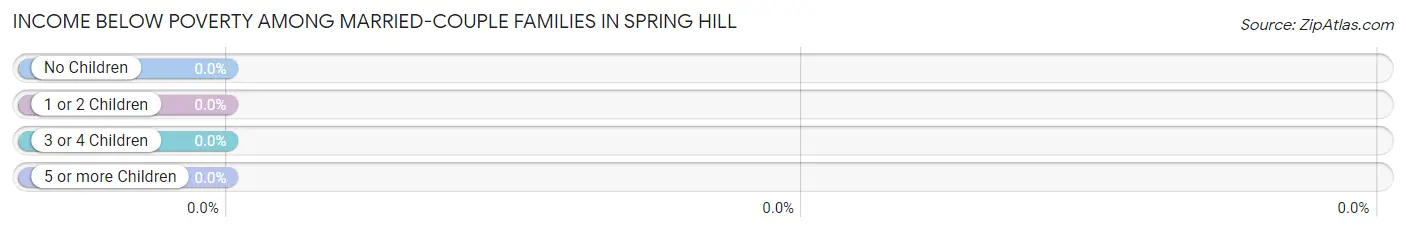
| Children | Above Poverty | Below Poverty |
| No Children | 18 (100.0%) | 0 (0.0%) |
| 1 or 2 Children | 0 (0.0%) | 0 (0.0%) |
| 3 or 4 Children | 0 (0.0%) | 0 (0.0%) |
| 5 or more Children | 0 (0.0%) | 0 (0.0%) |
| Total | 18 (100.0%) | 0 (0.0%) |
Income Below Poverty Among Single-Parent Households in Spring Hill
| Children | Single Father | Single Mother |
| No Children | 0 (0.0%) | 0 (0.0%) |
| 1 or 2 Children | 0 (0.0%) | 0 (0.0%) |
| 3 or 4 Children | 0 (0.0%) | 0 (0.0%) |
| 5 or more Children | 0 (0.0%) | 0 (0.0%) |
| Total | 0 (0.0%) | 0 (0.0%) |
Income Below Poverty Among Married-Couple vs Single-Parent Households in Spring Hill
| Children | Married-Couple Families | Single-Parent Households |
| No Children | 0 (0.0%) | 0 (0.0%) |
| 1 or 2 Children | 0 (0.0%) | 0 (0.0%) |
| 3 or 4 Children | 0 (0.0%) | 0 (0.0%) |
| 5 or more Children | 0 (0.0%) | 0 (0.0%) |
| Total | 0 (0.0%) | 0 (0.0%) |
Race in Spring Hill
The most populous races in Spring Hill are White / Caucasian (68 | 94.4%), Black / African American (3 | 4.2%), and Asian (1 | 1.4%).
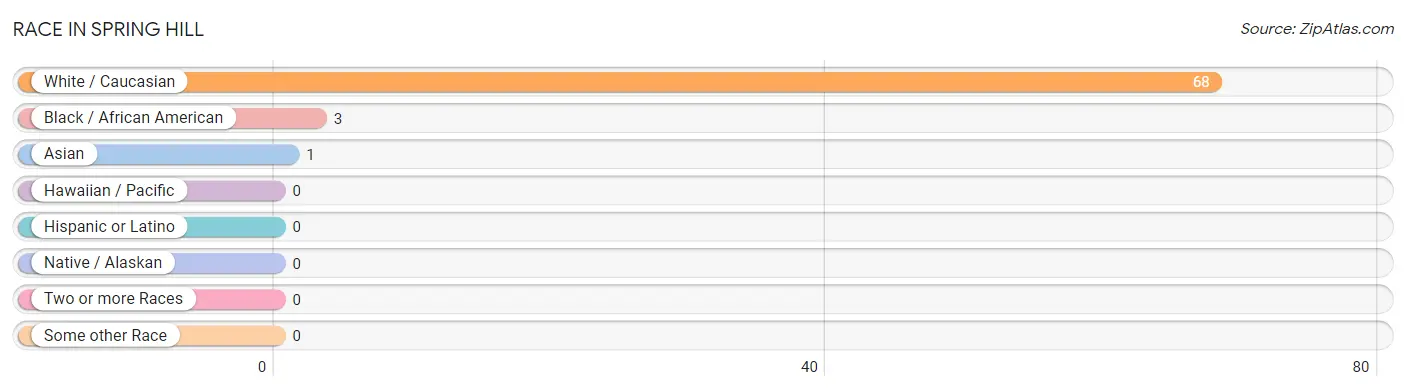
| Race | # Population | % Population |
| Asian | 1 | 1.4% |
| Black / African American | 3 | 4.2% |
| Hawaiian / Pacific | 0 | 0.0% |
| Hispanic or Latino | 0 | 0.0% |
| Native / Alaskan | 0 | 0.0% |
| White / Caucasian | 68 | 94.4% |
| Two or more Races | 0 | 0.0% |
| Some other Race | 0 | 0.0% |
| Total | 72 | 100.0% |
Ancestry in Spring Hill
The most populous ancestries reported in Spring Hill are German (20 | 27.8%), English (19 | 26.4%), Irish (13 | 18.1%), Swiss (8 | 11.1%), and Welsh (5 | 6.9%), together accounting for 90.3% of all Spring Hill residents.
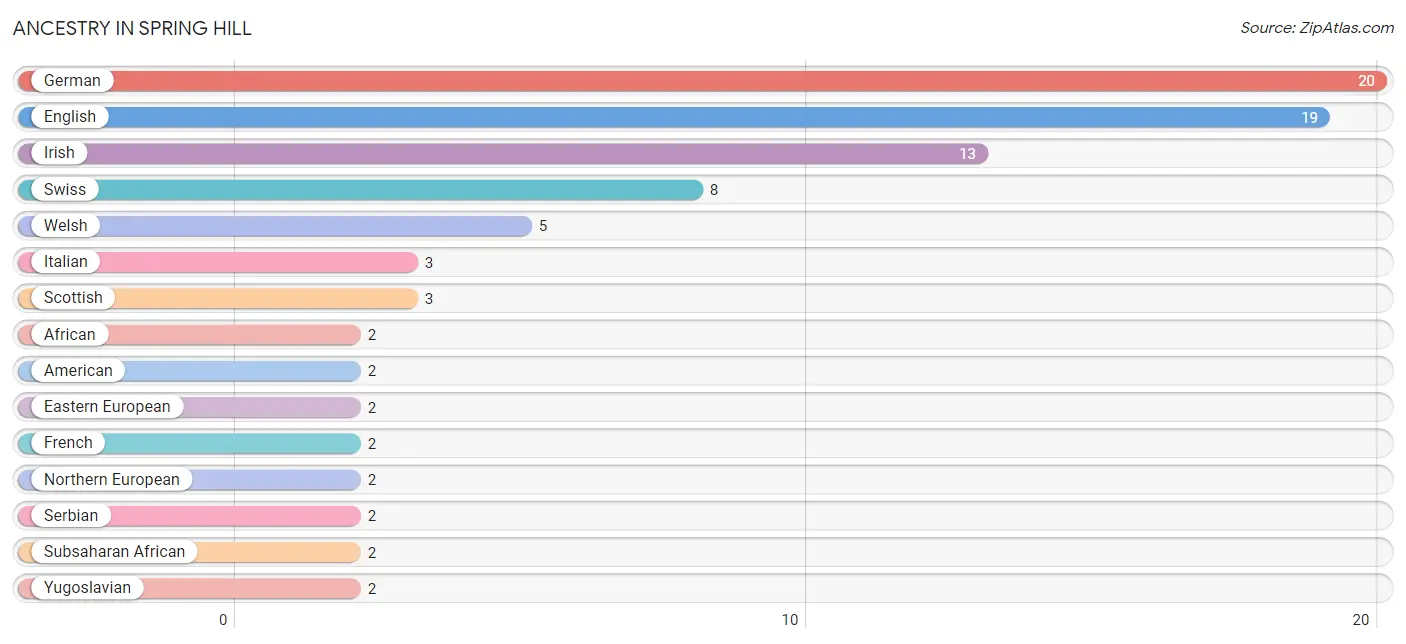
| Ancestry | # Population | % Population |
| African | 2 | 2.8% |
| American | 2 | 2.8% |
| British | 1 | 1.4% |
| Dutch | 1 | 1.4% |
| Eastern European | 2 | 2.8% |
| English | 19 | 26.4% |
| French | 2 | 2.8% |
| German | 20 | 27.8% |
| Iranian | 1 | 1.4% |
| Irish | 13 | 18.1% |
| Italian | 3 | 4.2% |
| Korean | 1 | 1.4% |
| Northern European | 2 | 2.8% |
| Polish | 1 | 1.4% |
| Scottish | 3 | 4.2% |
| Serbian | 2 | 2.8% |
| Subsaharan African | 2 | 2.8% |
| Swiss | 8 | 11.1% |
| Ukrainian | 1 | 1.4% |
| Welsh | 5 | 6.9% |
| Yugoslavian | 2 | 2.8% | View All 21 Rows |
Immigrants in Spring Hill
The most numerous immigrant groups reported in Spring Hill came from Europe (8 | 11.1%), Germany (7 | 9.7%), Western Europe (7 | 9.7%), Asia (2 | 2.8%), and Canada (1 | 1.4%), together accounting for 34.7% of all Spring Hill residents.
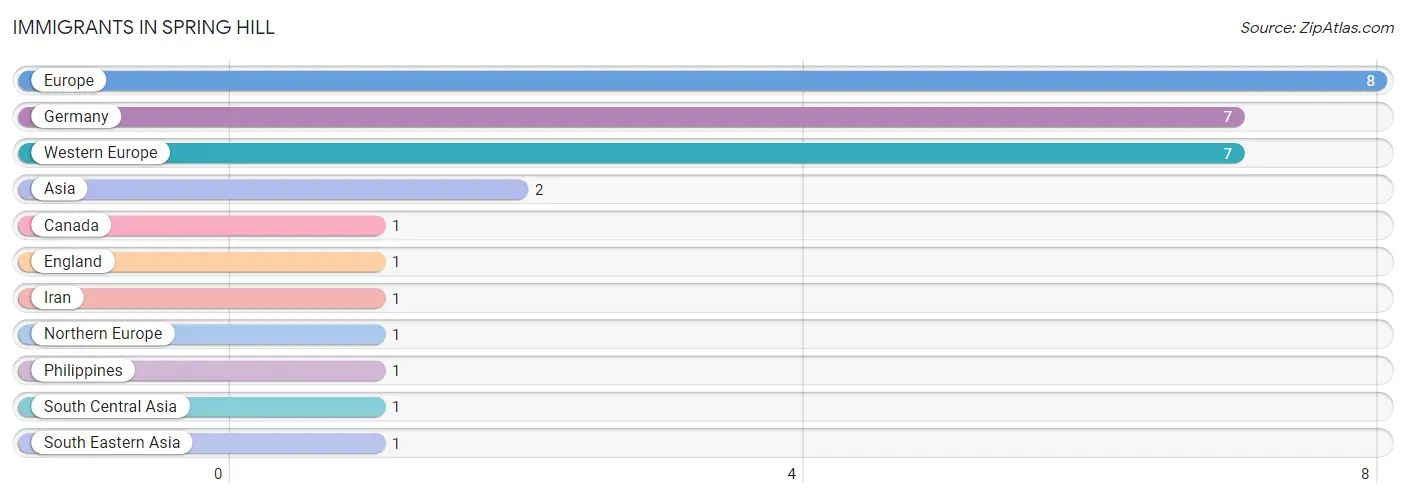
| Immigration Origin | # Population | % Population |
| Asia | 2 | 2.8% |
| Canada | 1 | 1.4% |
| England | 1 | 1.4% |
| Europe | 8 | 11.1% |
| Germany | 7 | 9.7% |
| Iran | 1 | 1.4% |
| Northern Europe | 1 | 1.4% |
| Philippines | 1 | 1.4% |
| South Central Asia | 1 | 1.4% |
| South Eastern Asia | 1 | 1.4% |
| Western Europe | 7 | 9.7% | View All 11 Rows |
Sex and Age in Spring Hill
Sex and Age in Spring Hill
The most populous age groups in Spring Hill are 60 to 64 Years (12 | 36.4%) for men and 70 to 74 Years (12 | 30.8%) for women.
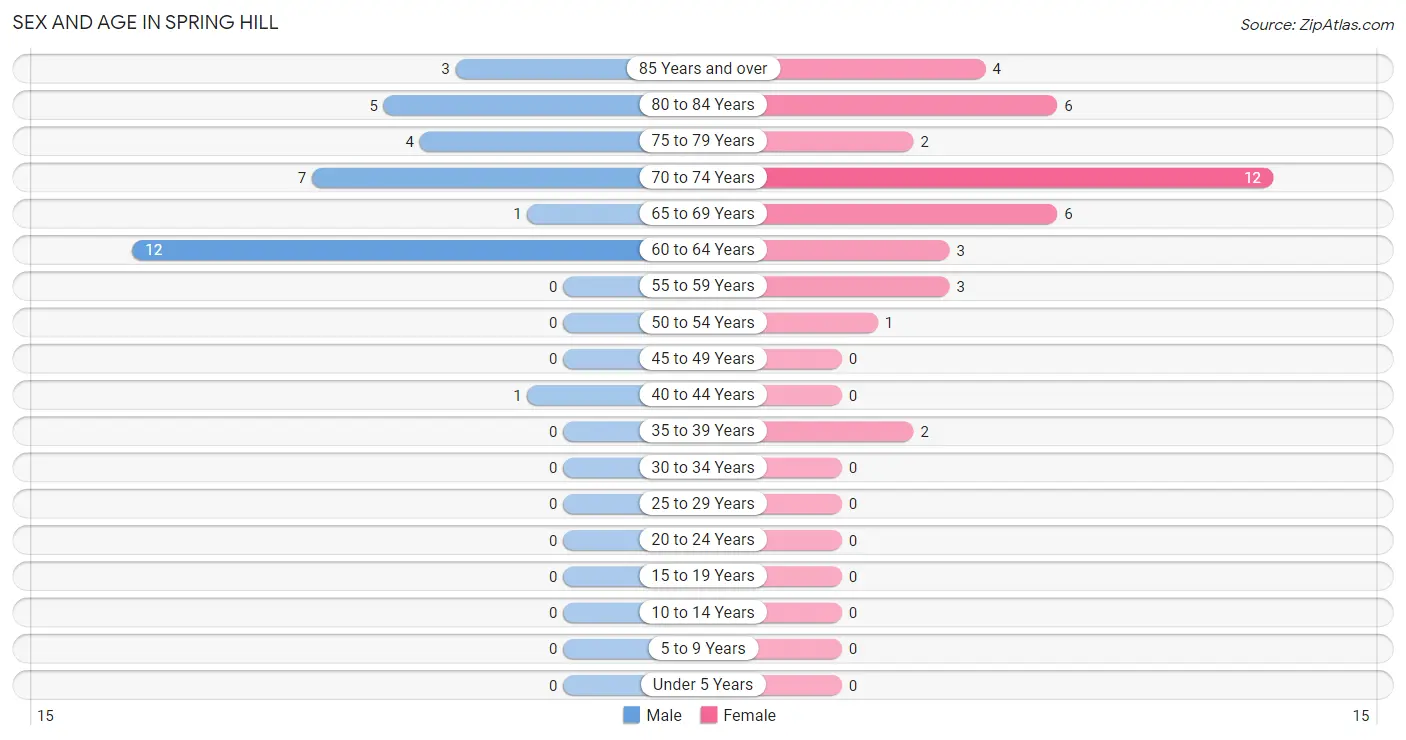
| Age Bracket | Male | Female |
| Under 5 Years | 0 (0.0%) | 0 (0.0%) |
| 5 to 9 Years | 0 (0.0%) | 0 (0.0%) |
| 10 to 14 Years | 0 (0.0%) | 0 (0.0%) |
| 15 to 19 Years | 0 (0.0%) | 0 (0.0%) |
| 20 to 24 Years | 0 (0.0%) | 0 (0.0%) |
| 25 to 29 Years | 0 (0.0%) | 0 (0.0%) |
| 30 to 34 Years | 0 (0.0%) | 0 (0.0%) |
| 35 to 39 Years | 0 (0.0%) | 2 (5.1%) |
| 40 to 44 Years | 1 (3.0%) | 0 (0.0%) |
| 45 to 49 Years | 0 (0.0%) | 0 (0.0%) |
| 50 to 54 Years | 0 (0.0%) | 1 (2.6%) |
| 55 to 59 Years | 0 (0.0%) | 3 (7.7%) |
| 60 to 64 Years | 12 (36.4%) | 3 (7.7%) |
| 65 to 69 Years | 1 (3.0%) | 6 (15.4%) |
| 70 to 74 Years | 7 (21.2%) | 12 (30.8%) |
| 75 to 79 Years | 4 (12.1%) | 2 (5.1%) |
| 80 to 84 Years | 5 (15.1%) | 6 (15.4%) |
| 85 Years and over | 3 (9.1%) | 4 (10.3%) |
| Total | 33 (100.0%) | 39 (100.0%) |
Families and Households in Spring Hill
Median Family Size in Spring Hill
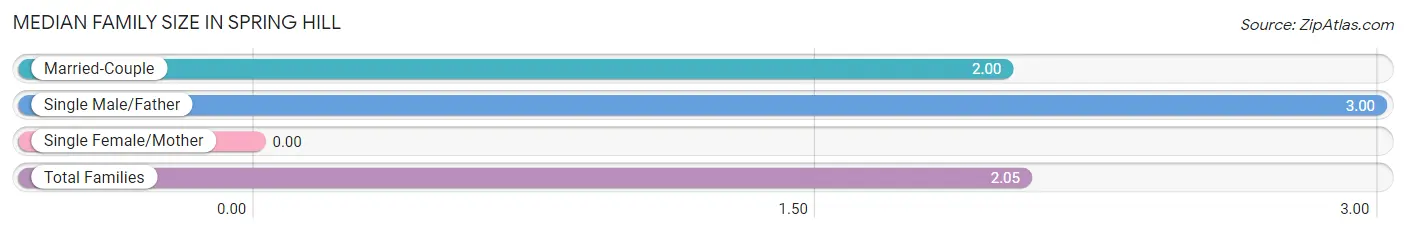
| Family Type | # Families | Family Size |
| Married-Couple | 18 (94.7%) | 2.00 |
| Single Male/Father | 1 (5.3%) | 3.00 |
| Single Female/Mother | 0 (0.0%) | - |
| Total Families | 19 (100.0%) | 2.05 |
Median Household Size in Spring Hill
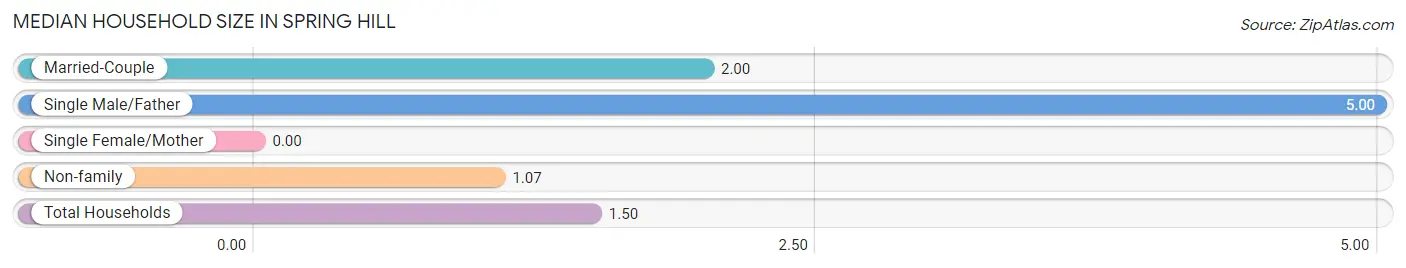
| Household Type | # Households | Household Size |
| Married-Couple | 18 (37.5%) | 2.00 |
| Single Male/Father | 1 (2.1%) | 5.00 |
| Single Female/Mother | 0 (0.0%) | - |
| Non-family | 29 (60.4%) | 1.07 |
| Total Households | 48 (100.0%) | 1.50 |
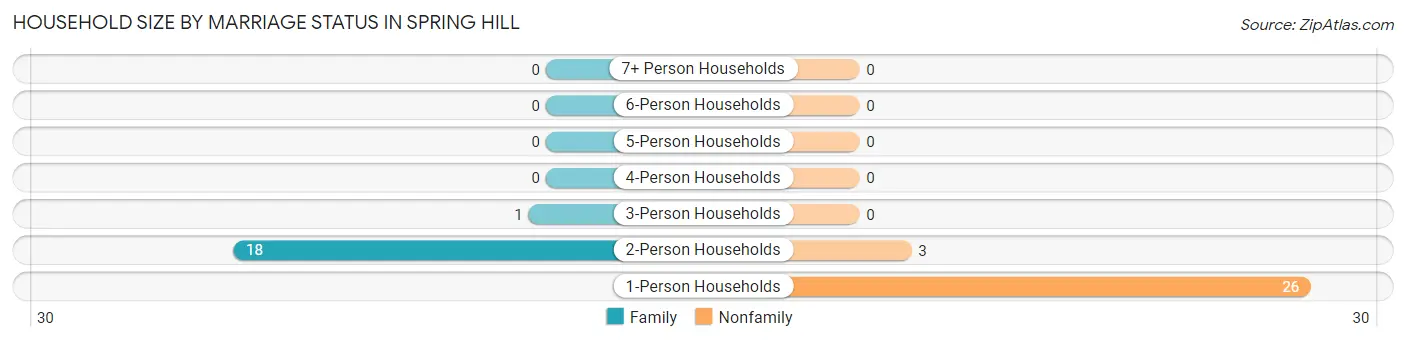
Household Size by Marriage Status in Spring Hill
Out of a total of 48 households in Spring Hill, 19 (39.6%) are family households, while 29 (60.4%) are nonfamily households. The most numerous type of family households are 2-person households, comprising 18, and the most common type of nonfamily households are 1-person households, comprising 26.
| Household Size | Family Households | Nonfamily Households |
| 1-Person Households | - | 26 (54.2%) |
| 2-Person Households | 18 (37.5%) | 3 (6.2%) |
| 3-Person Households | 1 (2.1%) | 0 (0.0%) |
| 4-Person Households | 0 (0.0%) | 0 (0.0%) |
| 5-Person Households | 0 (0.0%) | 0 (0.0%) |
| 6-Person Households | 0 (0.0%) | 0 (0.0%) |
| 7+ Person Households | 0 (0.0%) | 0 (0.0%) |
| Total | 19 (39.6%) | 29 (60.4%) |
Female Fertility in Spring Hill
Fertility by Age in Spring Hill
| Age Bracket | Women with Births | Births / 1,000 Women |
| 15 to 19 years | 0 (0.0%) | 0.0 |
| 20 to 34 years | 0 (0.0%) | 0.0 |
| 35 to 50 years | 0 (0.0%) | 0.0 |
| Total | 0 (0.0%) | 0.0 |
Fertility by Age by Marriage Status in Spring Hill
| Age Bracket | Married | Unmarried |
| 15 to 19 years | 0 (0.0%) | 0 (0.0%) |
| 20 to 34 years | 0 (0.0%) | 0 (0.0%) |
| 35 to 50 years | 0 (0.0%) | 0 (0.0%) |
| Total | 0 (0.0%) | 0 (0.0%) |
Fertility by Education in Spring Hill
| Educational Attainment | Women with Births | Births / 1,000 Women |
| Less than High School | 0 (0.0%) | 0.0 |
| High School Diploma | 0 (0.0%) | 0.0 |
| College or Associate's Degree | 0 (0.0%) | 0.0 |
| Bachelor's Degree | 0 (0.0%) | 0.0 |
| Graduate Degree | 0 (0.0%) | 0.0 |
| Total | 0 (0.0%) | 0.0 |
Fertility by Education by Marriage Status in Spring Hill
| Educational Attainment | Married | Unmarried |
| Less than High School | 0 (0.0%) | 0 (0.0%) |
| High School Diploma | 0 (0.0%) | 0 (0.0%) |
| College or Associate's Degree | 0 (0.0%) | 0 (0.0%) |
| Bachelor's Degree | 0 (0.0%) | 0 (0.0%) |
| Graduate Degree | 0 (0.0%) | 0 (0.0%) |
| Total | 0 (0.0%) | 0 (0.0%) |
Employment Characteristics in Spring Hill
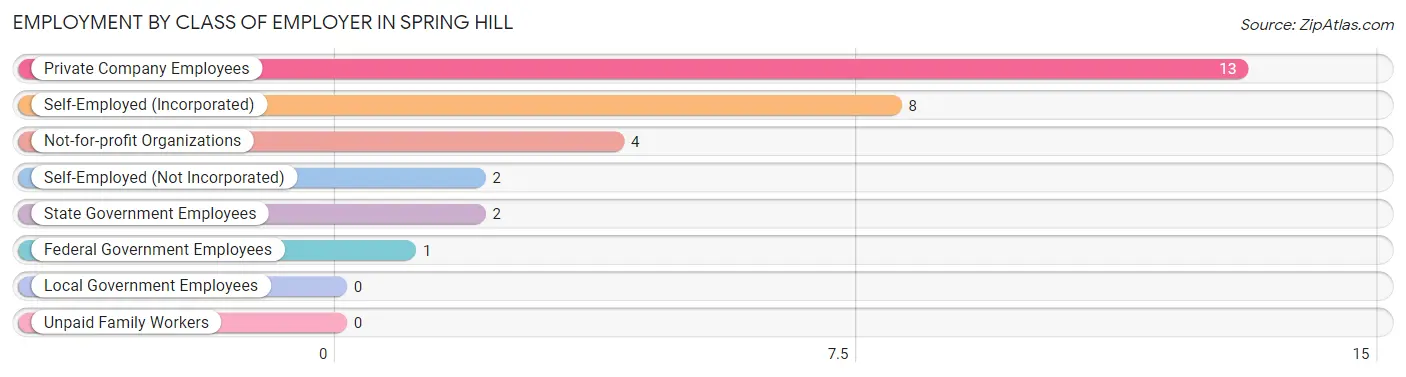
Employment by Class of Employer in Spring Hill
Among the 30 employed individuals in Spring Hill, private company employees (13 | 43.3%), self-employed (incorporated) (8 | 26.7%), and not-for-profit organizations (4 | 13.3%) make up the most common classes of employment.
| Employer Class | # Employees | % Employees |
| Private Company Employees | 13 | 43.3% |
| Self-Employed (Incorporated) | 8 | 26.7% |
| Self-Employed (Not Incorporated) | 2 | 6.7% |
| Not-for-profit Organizations | 4 | 13.3% |
| Local Government Employees | 0 | 0.0% |
| State Government Employees | 2 | 6.7% |
| Federal Government Employees | 1 | 3.3% |
| Unpaid Family Workers | 0 | 0.0% |
| Total | 30 | 100.0% |
Employment Status by Age in Spring Hill
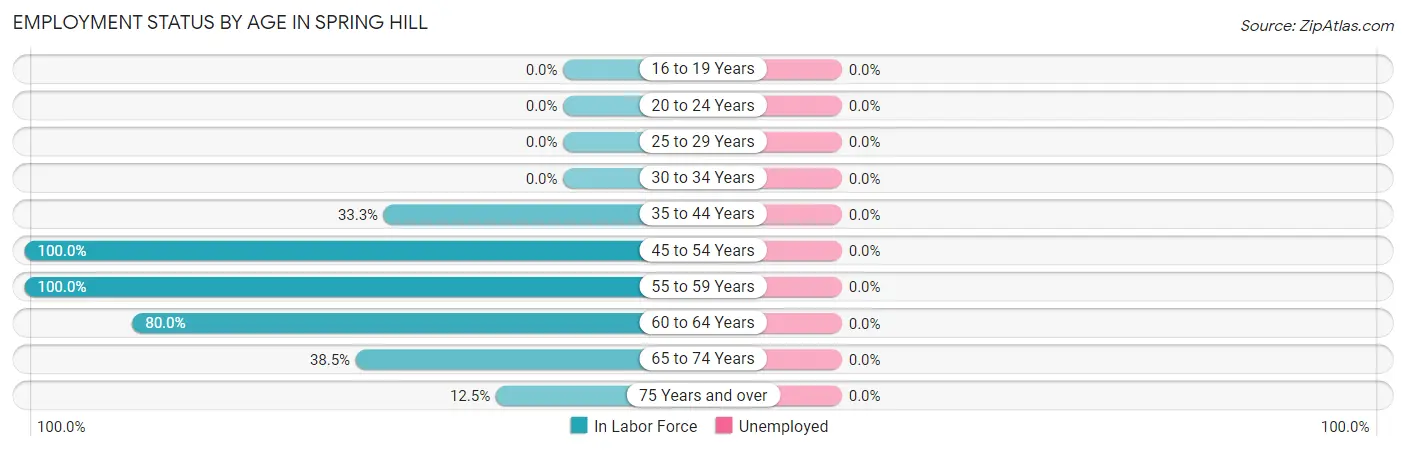
| Age Bracket | In Labor Force | Unemployed |
| 16 to 19 Years | 0 (0.0%) | 0 (0.0%) |
| 20 to 24 Years | 0 (0.0%) | 0 (0.0%) |
| 25 to 29 Years | 0 (0.0%) | 0 (0.0%) |
| 30 to 34 Years | 0 (0.0%) | 0 (0.0%) |
| 35 to 44 Years | 1 (33.3%) | 0 (0.0%) |
| 45 to 54 Years | 1 (100.0%) | 0 (0.0%) |
| 55 to 59 Years | 3 (100.0%) | 0 (0.0%) |
| 60 to 64 Years | 12 (80.0%) | 0 (0.0%) |
| 65 to 74 Years | 10 (38.5%) | 0 (0.0%) |
| 75 Years and over | 3 (12.5%) | 0 (0.0%) |
| Total | 30 (41.7%) | 0 (0.0%) |
Employment Status by Educational Attainment in Spring Hill
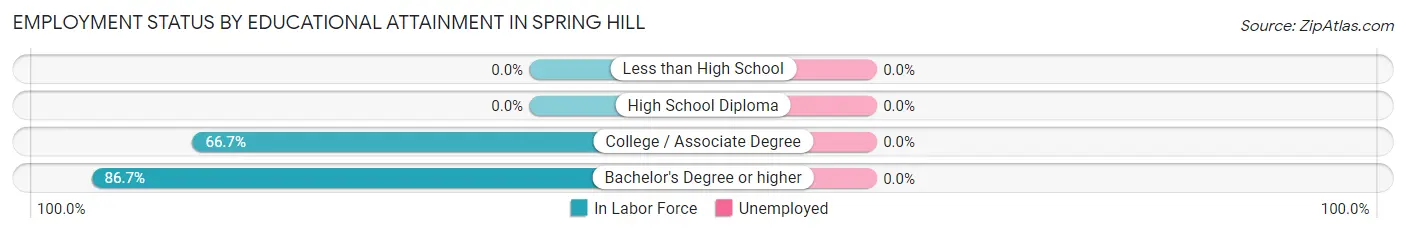
| Educational Attainment | In Labor Force | Unemployed |
| Less than High School | 0 (0.0%) | 0 (0.0%) |
| High School Diploma | 0 (0.0%) | 0 (0.0%) |
| College / Associate Degree | 4 (66.7%) | 0 (0.0%) |
| Bachelor's Degree or higher | 13 (86.7%) | 0 (0.0%) |
| Total | 17 (77.3%) | 0 (0.0%) |
Employment Occupations by Sex in Spring Hill
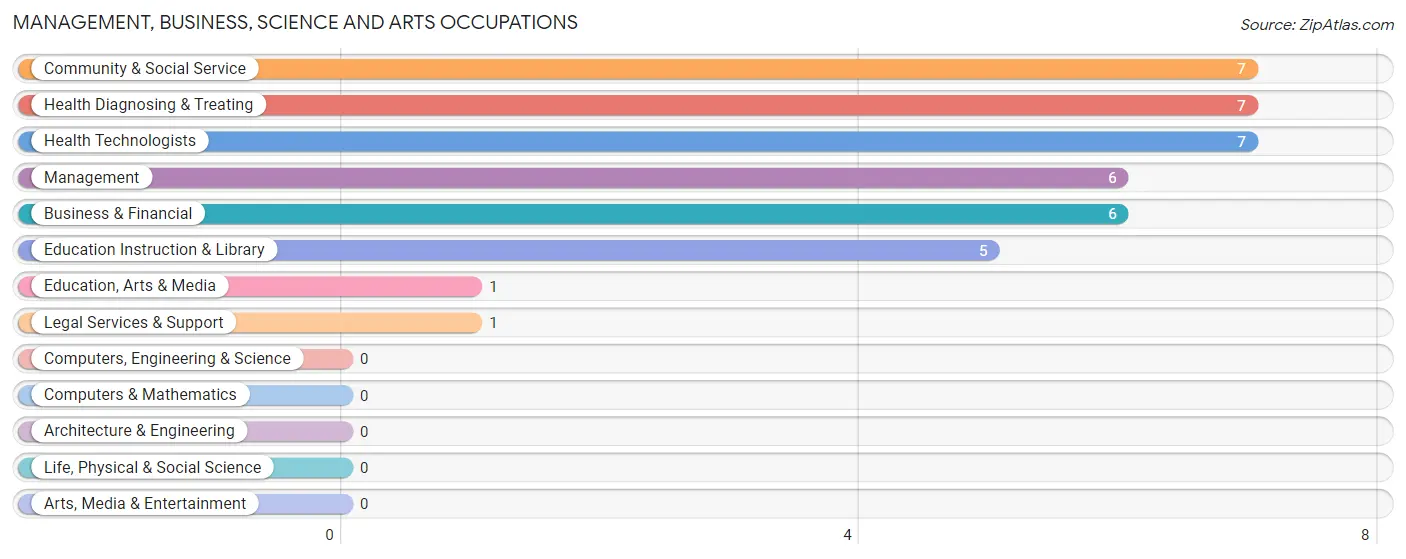
Management, Business, Science and Arts Occupations
The most common Management, Business, Science and Arts occupations in Spring Hill are Community & Social Service (7 | 23.3%), Health Diagnosing & Treating (7 | 23.3%), Health Technologists (7 | 23.3%), Management (6 | 20.0%), and Business & Financial (6 | 20.0%).
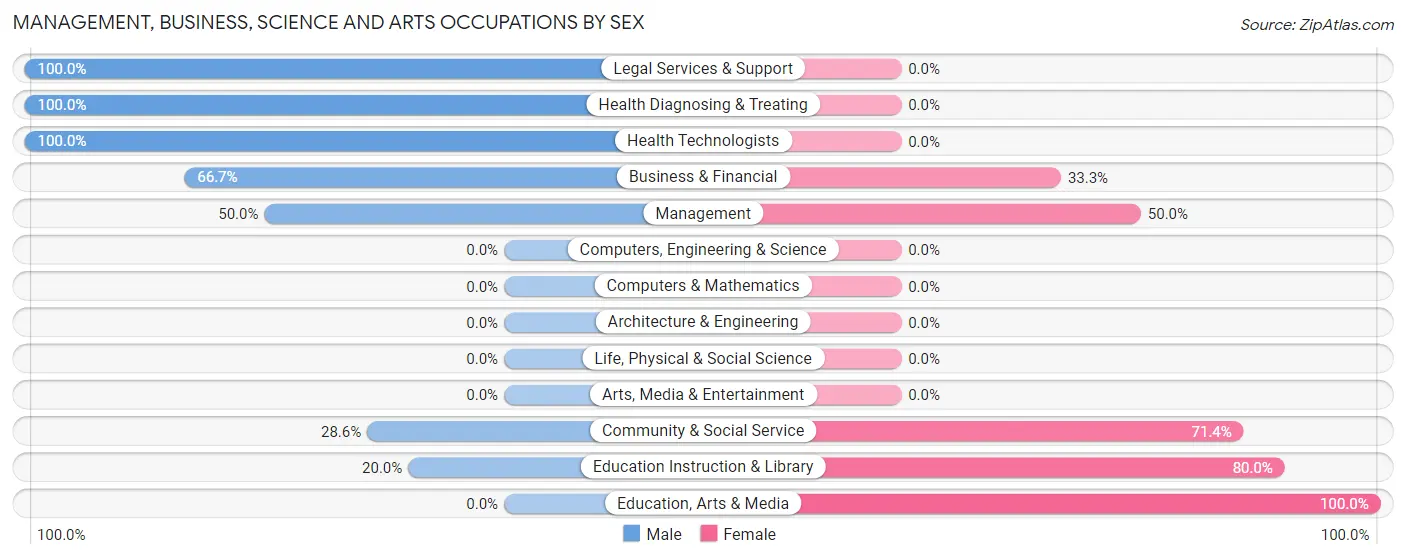
Management, Business, Science and Arts Occupations by Sex
Within the Management, Business, Science and Arts occupations in Spring Hill, the most male-oriented occupations are Legal Services & Support (100.0%), Health Diagnosing & Treating (100.0%), and Health Technologists (100.0%), while the most female-oriented occupations are Education, Arts & Media (100.0%), Education Instruction & Library (80.0%), and Community & Social Service (71.4%).
| Occupation | Male | Female |
| Management | 3 (50.0%) | 3 (50.0%) |
| Business & Financial | 4 (66.7%) | 2 (33.3%) |
| Computers, Engineering & Science | 0 (0.0%) | 0 (0.0%) |
| Computers & Mathematics | 0 (0.0%) | 0 (0.0%) |
| Architecture & Engineering | 0 (0.0%) | 0 (0.0%) |
| Life, Physical & Social Science | 0 (0.0%) | 0 (0.0%) |
| Community & Social Service | 2 (28.6%) | 5 (71.4%) |
| Education, Arts & Media | 0 (0.0%) | 1 (100.0%) |
| Legal Services & Support | 1 (100.0%) | 0 (0.0%) |
| Education Instruction & Library | 1 (20.0%) | 4 (80.0%) |
| Arts, Media & Entertainment | 0 (0.0%) | 0 (0.0%) |
| Health Diagnosing & Treating | 7 (100.0%) | 0 (0.0%) |
| Health Technologists | 7 (100.0%) | 0 (0.0%) |
| Total (Category) | 16 (61.5%) | 10 (38.5%) |
| Total (Overall) | 18 (60.0%) | 12 (40.0%) |
Services Occupations
Services Occupations by Sex
| Occupation | Male | Female |
| Healthcare Support | 0 (0.0%) | 0 (0.0%) |
| Security & Protection | 0 (0.0%) | 0 (0.0%) |
| Firefighting & Prevention | 0 (0.0%) | 0 (0.0%) |
| Law Enforcement | 0 (0.0%) | 0 (0.0%) |
| Food Preparation & Serving | 0 (0.0%) | 0 (0.0%) |
| Cleaning & Maintenance | 0 (0.0%) | 0 (0.0%) |
| Personal Care & Service | 0 (0.0%) | 0 (0.0%) |
| Total (Category) | 0 (0.0%) | 0 (0.0%) |
| Total (Overall) | 18 (60.0%) | 12 (40.0%) |
Sales and Office Occupations
The most common Sales and Office occupations in Spring Hill are Office & Administration (2 | 6.7%), and Sales & Related (1 | 3.3%).
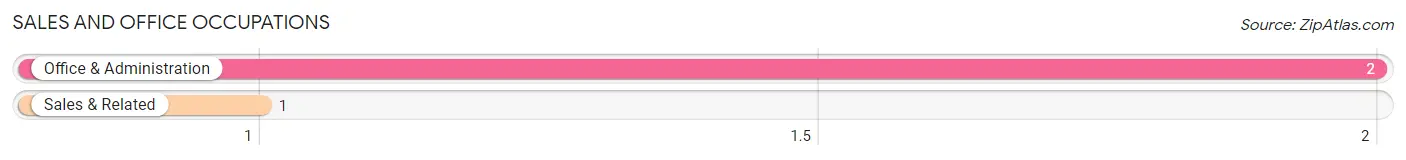
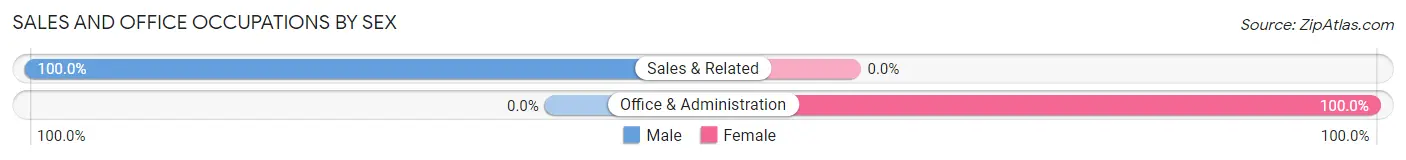
Sales and Office Occupations by Sex
| Occupation | Male | Female |
| Sales & Related | 1 (100.0%) | 0 (0.0%) |
| Office & Administration | 0 (0.0%) | 2 (100.0%) |
| Total (Category) | 1 (33.3%) | 2 (66.7%) |
| Total (Overall) | 18 (60.0%) | 12 (40.0%) |
Natural Resources, Construction and Maintenance Occupations
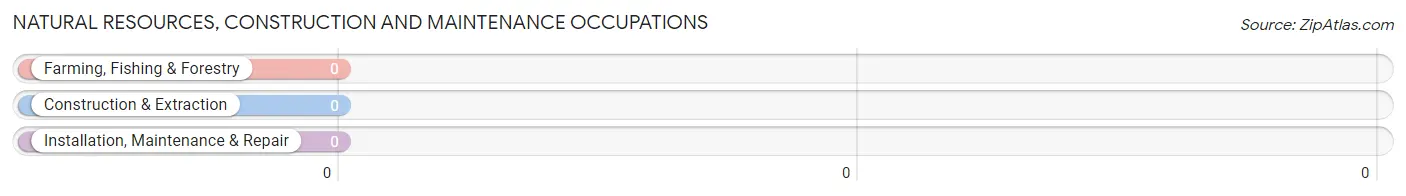
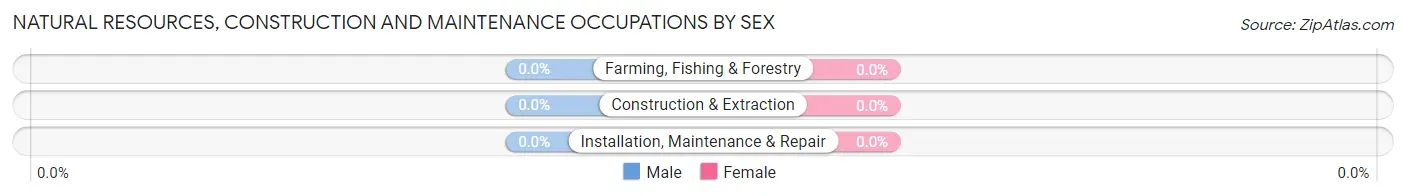
Natural Resources, Construction and Maintenance Occupations by Sex
| Occupation | Male | Female |
| Farming, Fishing & Forestry | 0 (0.0%) | 0 (0.0%) |
| Construction & Extraction | 0 (0.0%) | 0 (0.0%) |
| Installation, Maintenance & Repair | 0 (0.0%) | 0 (0.0%) |
| Total (Category) | 0 (0.0%) | 0 (0.0%) |
| Total (Overall) | 18 (60.0%) | 12 (40.0%) |
Production, Transportation and Moving Occupations
The most common Production, Transportation and Moving occupations in Spring Hill are , and Production (1 | 3.3%).
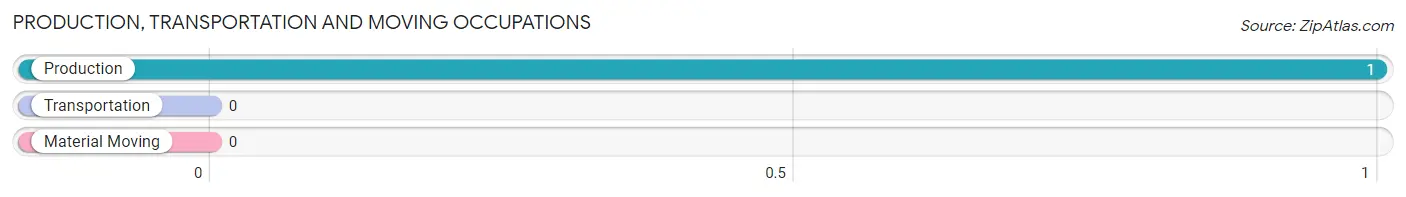
Production, Transportation and Moving Occupations by Sex
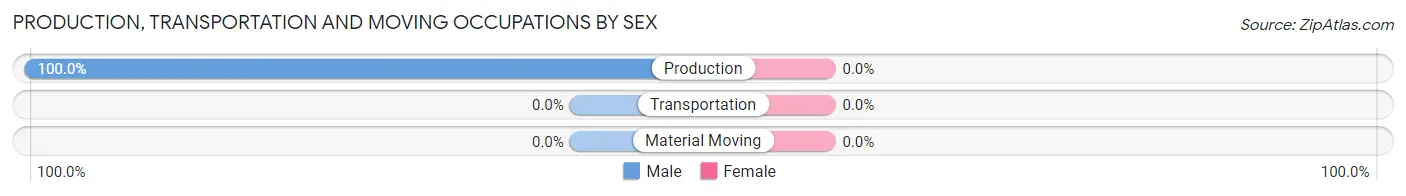
| Occupation | Male | Female |
| Production | 1 (100.0%) | 0 (0.0%) |
| Transportation | 0 (0.0%) | 0 (0.0%) |
| Material Moving | 0 (0.0%) | 0 (0.0%) |
| Total (Category) | 1 (100.0%) | 0 (0.0%) |
| Total (Overall) | 18 (60.0%) | 12 (40.0%) |
Employment Industries by Sex in Spring Hill
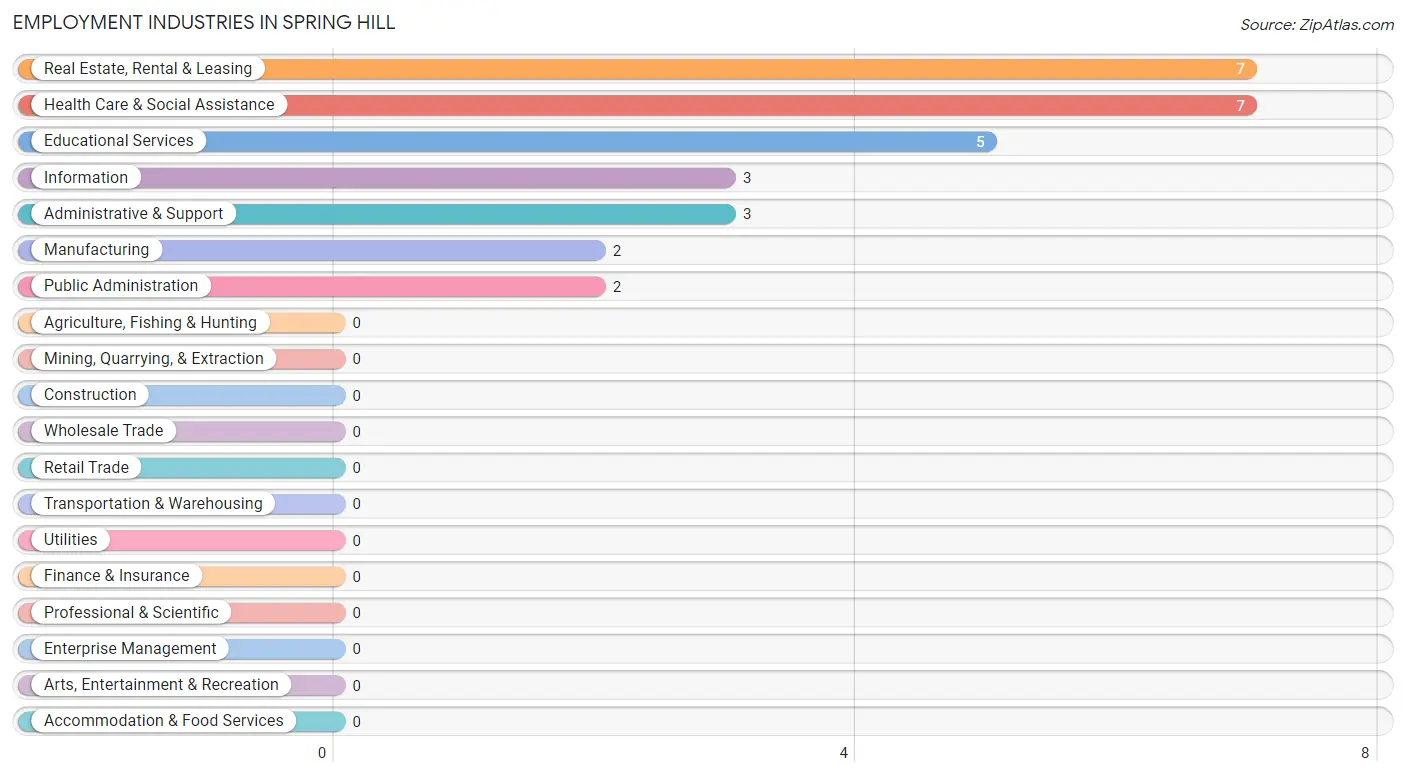
Employment Industries in Spring Hill
The major employment industries in Spring Hill include Real Estate, Rental & Leasing (7 | 23.3%), Health Care & Social Assistance (7 | 23.3%), Educational Services (5 | 16.7%), Information (3 | 10.0%), and Administrative & Support (3 | 10.0%).
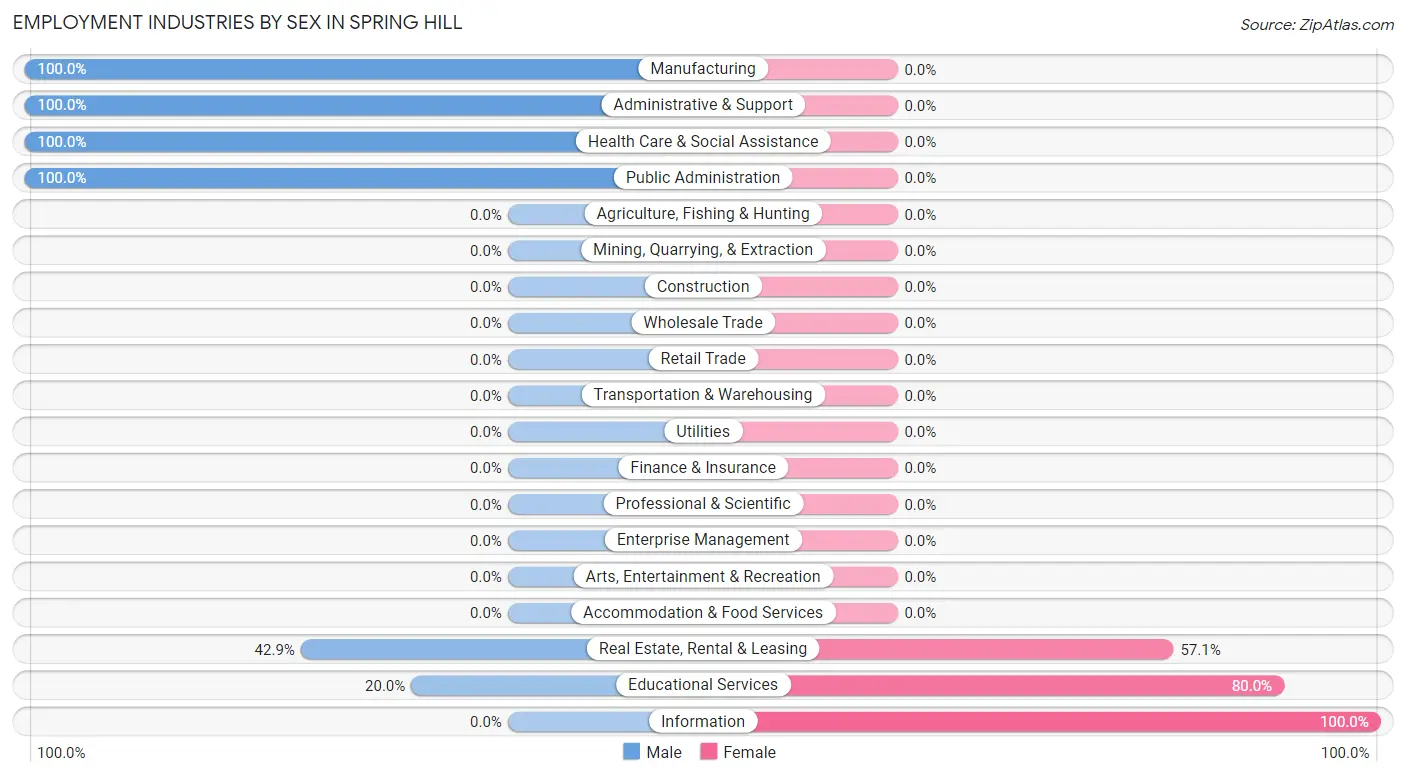
Employment Industries by Sex in Spring Hill
The Spring Hill industries that see more men than women are Manufacturing (100.0%), Administrative & Support (100.0%), and Health Care & Social Assistance (100.0%), whereas the industries that tend to have a higher number of women are Information (100.0%), Educational Services (80.0%), and Real Estate, Rental & Leasing (57.1%).
| Industry | Male | Female |
| Agriculture, Fishing & Hunting | 0 (0.0%) | 0 (0.0%) |
| Mining, Quarrying, & Extraction | 0 (0.0%) | 0 (0.0%) |
| Construction | 0 (0.0%) | 0 (0.0%) |
| Manufacturing | 2 (100.0%) | 0 (0.0%) |
| Wholesale Trade | 0 (0.0%) | 0 (0.0%) |
| Retail Trade | 0 (0.0%) | 0 (0.0%) |
| Transportation & Warehousing | 0 (0.0%) | 0 (0.0%) |
| Utilities | 0 (0.0%) | 0 (0.0%) |
| Information | 0 (0.0%) | 3 (100.0%) |
| Finance & Insurance | 0 (0.0%) | 0 (0.0%) |
| Real Estate, Rental & Leasing | 3 (42.9%) | 4 (57.1%) |
| Professional & Scientific | 0 (0.0%) | 0 (0.0%) |
| Enterprise Management | 0 (0.0%) | 0 (0.0%) |
| Administrative & Support | 3 (100.0%) | 0 (0.0%) |
| Educational Services | 1 (20.0%) | 4 (80.0%) |
| Health Care & Social Assistance | 7 (100.0%) | 0 (0.0%) |
| Arts, Entertainment & Recreation | 0 (0.0%) | 0 (0.0%) |
| Accommodation & Food Services | 0 (0.0%) | 0 (0.0%) |
| Public Administration | 2 (100.0%) | 0 (0.0%) |
| Total | 18 (60.0%) | 12 (40.0%) |
Education in Spring Hill
School Enrollment in Spring Hill
The most common levels of schooling among the 3 students in Spring Hill are graduate / professional (2 | 66.7%), and college / undergraduate (1 | 33.3%).
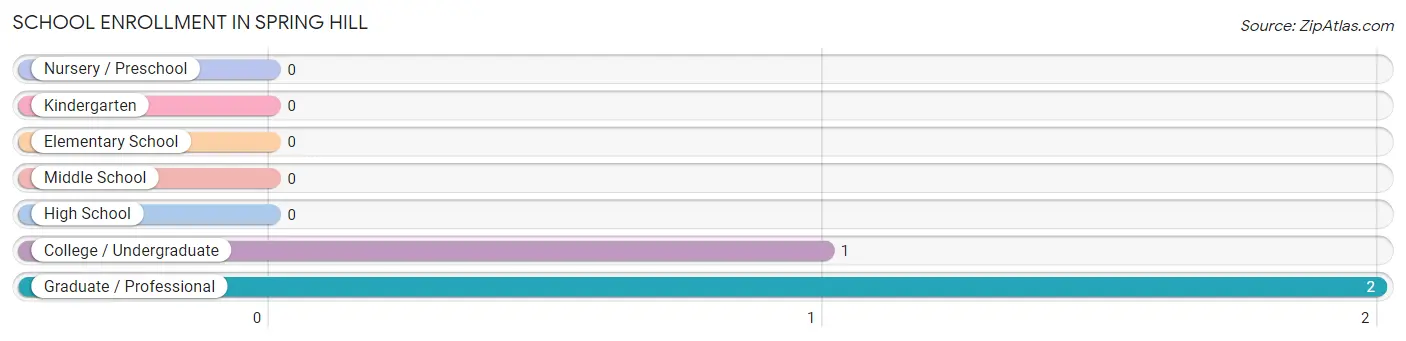
| School Level | # Students | % Students |
| Nursery / Preschool | 0 | 0.0% |
| Kindergarten | 0 | 0.0% |
| Elementary School | 0 | 0.0% |
| Middle School | 0 | 0.0% |
| High School | 0 | 0.0% |
| College / Undergraduate | 1 | 33.3% |
| Graduate / Professional | 2 | 66.7% |
| Total | 3 | 100.0% |
School Enrollment by Age by Funding Source in Spring Hill
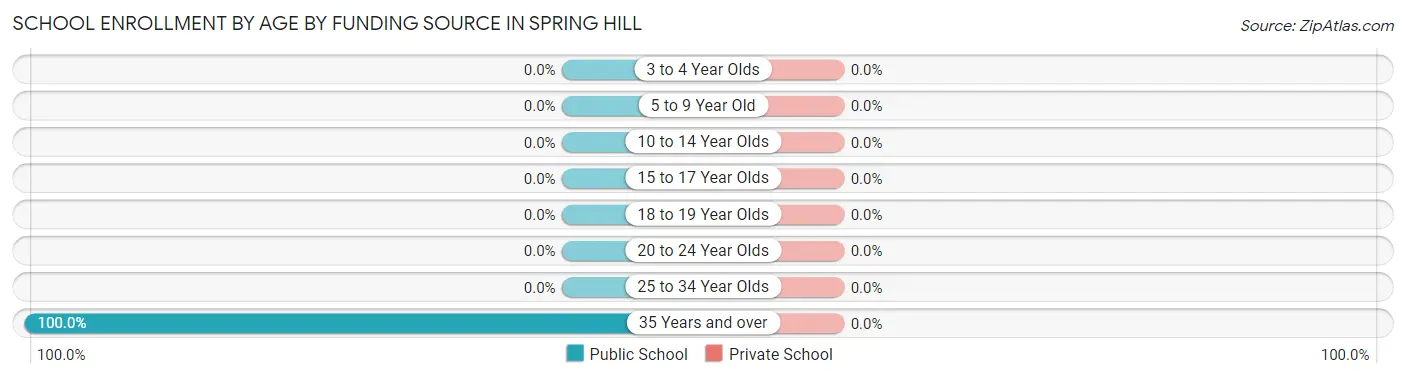
| Age Bracket | Public School | Private School |
| 3 to 4 Year Olds | 0 (0.0%) | 0 (0.0%) |
| 5 to 9 Year Old | 0 (0.0%) | 0 (0.0%) |
| 10 to 14 Year Olds | 0 (0.0%) | 0 (0.0%) |
| 15 to 17 Year Olds | 0 (0.0%) | 0 (0.0%) |
| 18 to 19 Year Olds | 0 (0.0%) | 0 (0.0%) |
| 20 to 24 Year Olds | 0 (0.0%) | 0 (0.0%) |
| 25 to 34 Year Olds | 0 (0.0%) | 0 (0.0%) |
| 35 Years and over | 3 (100.0%) | 0 (0.0%) |
| Total | 3 (100.0%) | 0 (0.0%) |
Educational Attainment by Field of Study in Spring Hill
Education (14 | 24.6%), bio, nature & agricultural (8 | 14.0%), science & technology (7 | 12.3%), social sciences (6 | 10.5%), and business (6 | 10.5%) are the most common fields of study among 57 individuals in Spring Hill who have obtained a bachelor's degree or higher.
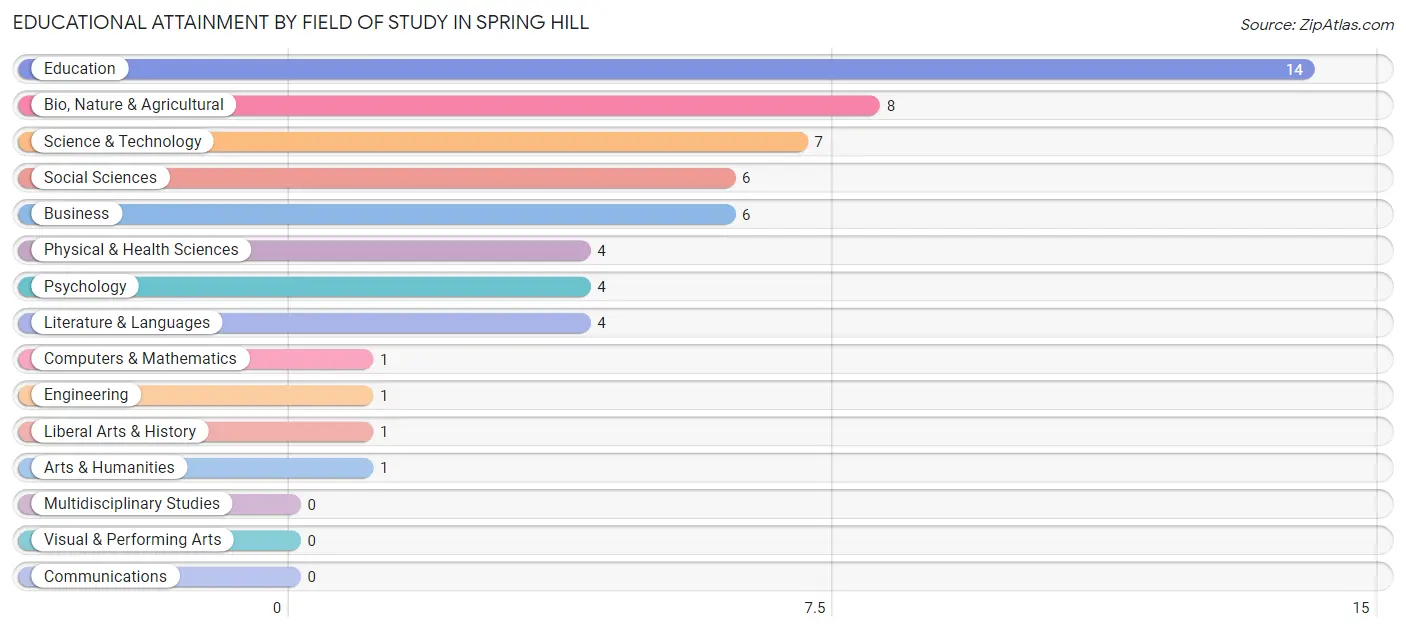
| Field of Study | # Graduates | % Graduates |
| Computers & Mathematics | 1 | 1.8% |
| Bio, Nature & Agricultural | 8 | 14.0% |
| Physical & Health Sciences | 4 | 7.0% |
| Psychology | 4 | 7.0% |
| Social Sciences | 6 | 10.5% |
| Engineering | 1 | 1.8% |
| Multidisciplinary Studies | 0 | 0.0% |
| Science & Technology | 7 | 12.3% |
| Business | 6 | 10.5% |
| Education | 14 | 24.6% |
| Literature & Languages | 4 | 7.0% |
| Liberal Arts & History | 1 | 1.8% |
| Visual & Performing Arts | 0 | 0.0% |
| Communications | 0 | 0.0% |
| Arts & Humanities | 1 | 1.8% |
| Total | 57 | 100.0% |
Transportation & Commute in Spring Hill
Vehicle Availability by Sex in Spring Hill
The most prevalent vehicle ownership categories in Spring Hill are males with 2 vehicles (16, accounting for 88.9%) and females with 2 vehicles (5, making up 133.3%).
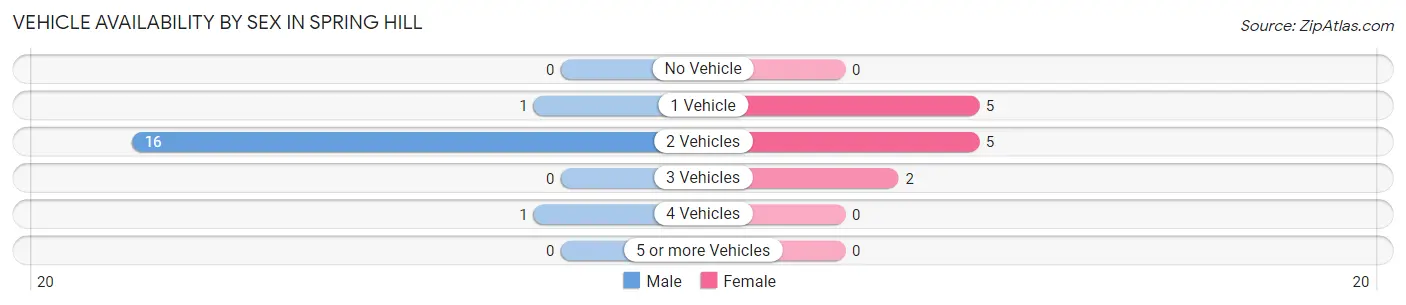
| Vehicles Available | Male | Female |
| No Vehicle | 0 (0.0%) | 0 (0.0%) |
| 1 Vehicle | 1 (5.6%) | 5 (41.7%) |
| 2 Vehicles | 16 (88.9%) | 5 (41.7%) |
| 3 Vehicles | 0 (0.0%) | 2 (16.7%) |
| 4 Vehicles | 1 (5.6%) | 0 (0.0%) |
| 5 or more Vehicles | 0 (0.0%) | 0 (0.0%) |
| Total | 18 (100.0%) | 12 (100.0%) |
Commute Time in Spring Hill
The most frequently occuring commute durations in Spring Hill are 10 to 14 minutes (11 commuters, 42.3%), 5 to 9 minutes (5 commuters, 19.2%), and 20 to 24 minutes (3 commuters, 11.5%).
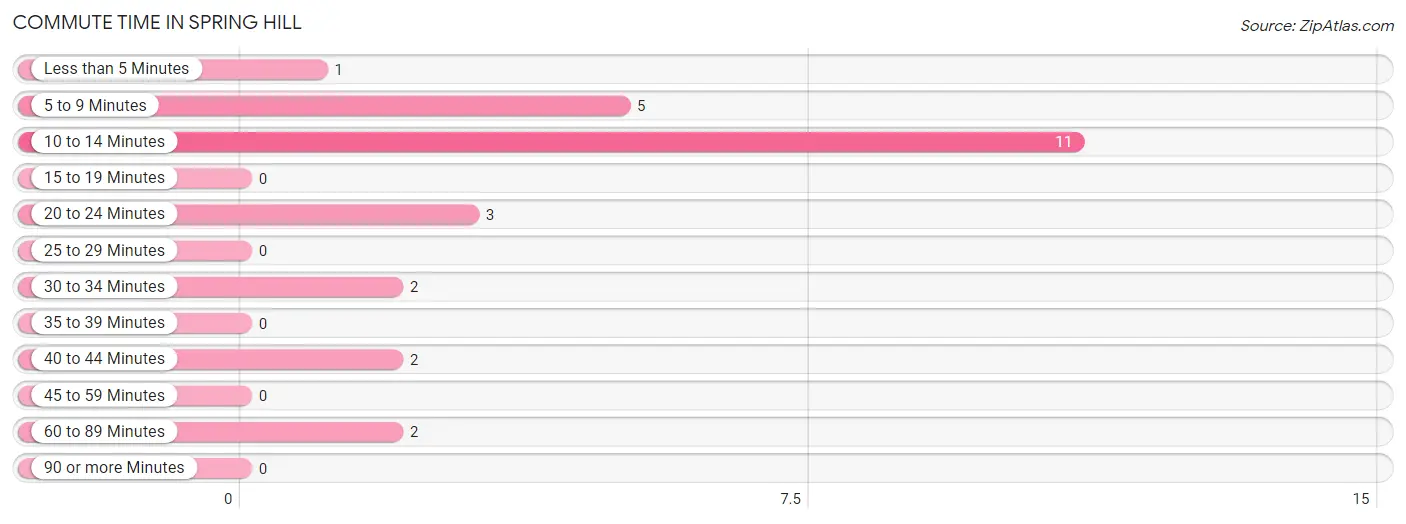
| Commute Time | # Commuters | % Commuters |
| Less than 5 Minutes | 1 | 3.8% |
| 5 to 9 Minutes | 5 | 19.2% |
| 10 to 14 Minutes | 11 | 42.3% |
| 15 to 19 Minutes | 0 | 0.0% |
| 20 to 24 Minutes | 3 | 11.5% |
| 25 to 29 Minutes | 0 | 0.0% |
| 30 to 34 Minutes | 2 | 7.7% |
| 35 to 39 Minutes | 0 | 0.0% |
| 40 to 44 Minutes | 2 | 7.7% |
| 45 to 59 Minutes | 0 | 0.0% |
| 60 to 89 Minutes | 2 | 7.7% |
| 90 or more Minutes | 0 | 0.0% |
Commute Time by Sex in Spring Hill
The most common commute times in Spring Hill are 10 to 14 minutes (7 commuters, 50.0%) for males and 5 to 9 minutes (5 commuters, 41.7%) for females.
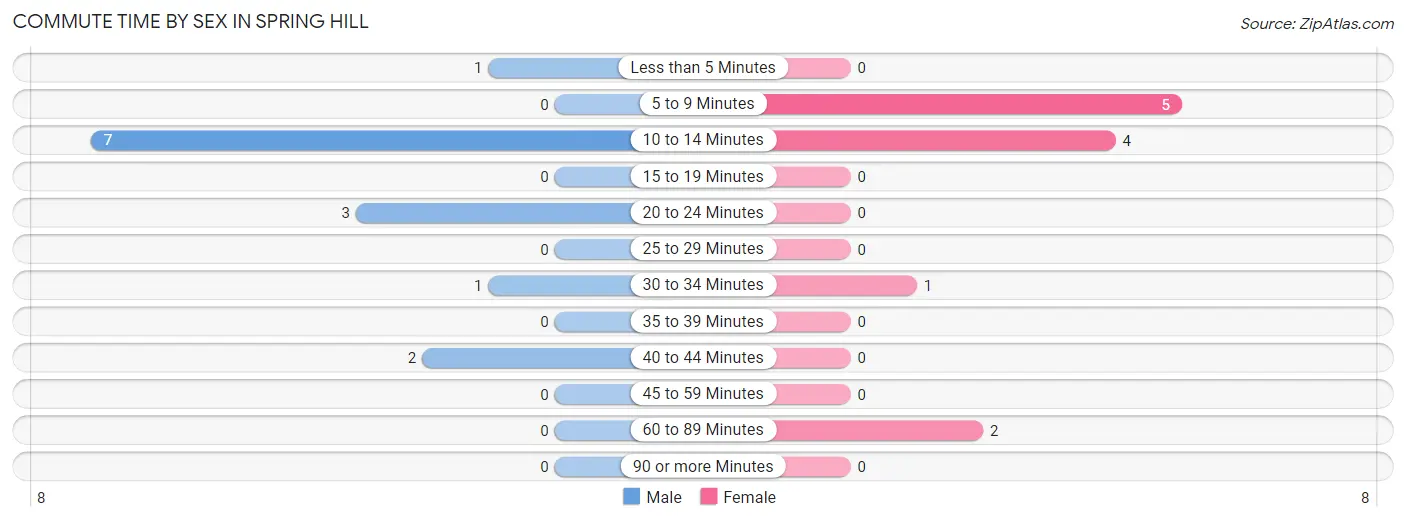
| Commute Time | Male | Female |
| Less than 5 Minutes | 1 (7.1%) | 0 (0.0%) |
| 5 to 9 Minutes | 0 (0.0%) | 5 (41.7%) |
| 10 to 14 Minutes | 7 (50.0%) | 4 (33.3%) |
| 15 to 19 Minutes | 0 (0.0%) | 0 (0.0%) |
| 20 to 24 Minutes | 3 (21.4%) | 0 (0.0%) |
| 25 to 29 Minutes | 0 (0.0%) | 0 (0.0%) |
| 30 to 34 Minutes | 1 (7.1%) | 1 (8.3%) |
| 35 to 39 Minutes | 0 (0.0%) | 0 (0.0%) |
| 40 to 44 Minutes | 2 (14.3%) | 0 (0.0%) |
| 45 to 59 Minutes | 0 (0.0%) | 0 (0.0%) |
| 60 to 89 Minutes | 0 (0.0%) | 2 (16.7%) |
| 90 or more Minutes | 0 (0.0%) | 0 (0.0%) |
Time of Departure to Work by Sex in Spring Hill
The most frequent times of departure to work in Spring Hill are 7:00 AM to 7:29 AM (6, 42.9%) for males and 8:00 AM to 8:29 AM (4, 33.3%) for females.
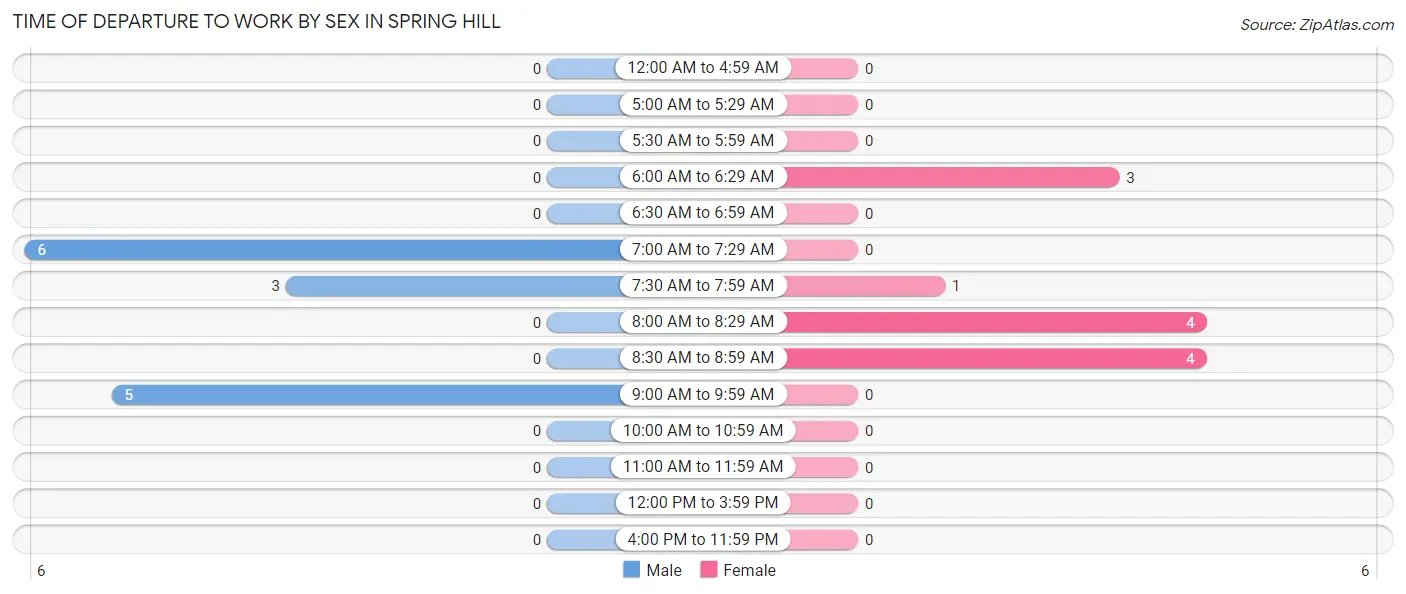
| Time of Departure | Male | Female |
| 12:00 AM to 4:59 AM | 0 (0.0%) | 0 (0.0%) |
| 5:00 AM to 5:29 AM | 0 (0.0%) | 0 (0.0%) |
| 5:30 AM to 5:59 AM | 0 (0.0%) | 0 (0.0%) |
| 6:00 AM to 6:29 AM | 0 (0.0%) | 3 (25.0%) |
| 6:30 AM to 6:59 AM | 0 (0.0%) | 0 (0.0%) |
| 7:00 AM to 7:29 AM | 6 (42.9%) | 0 (0.0%) |
| 7:30 AM to 7:59 AM | 3 (21.4%) | 1 (8.3%) |
| 8:00 AM to 8:29 AM | 0 (0.0%) | 4 (33.3%) |
| 8:30 AM to 8:59 AM | 0 (0.0%) | 4 (33.3%) |
| 9:00 AM to 9:59 AM | 5 (35.7%) | 0 (0.0%) |
| 10:00 AM to 10:59 AM | 0 (0.0%) | 0 (0.0%) |
| 11:00 AM to 11:59 AM | 0 (0.0%) | 0 (0.0%) |
| 12:00 PM to 3:59 PM | 0 (0.0%) | 0 (0.0%) |
| 4:00 PM to 11:59 PM | 0 (0.0%) | 0 (0.0%) |
| Total | 14 (100.0%) | 12 (100.0%) |
Housing Occupancy in Spring Hill
Occupancy by Ownership in Spring Hill
Of the total 48 dwellings in Spring Hill, owner-occupied units account for 44 (91.7%), while renter-occupied units make up 4 (8.3%).
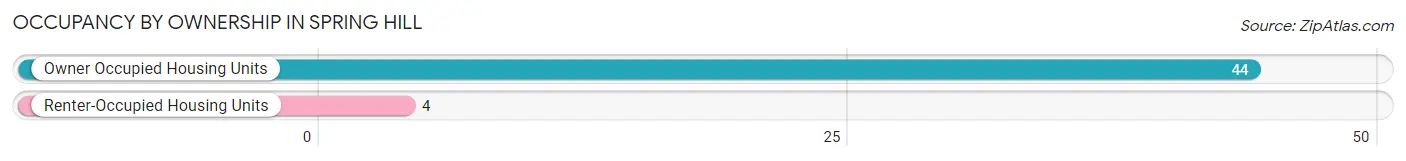
| Occupancy | # Housing Units | % Housing Units |
| Owner Occupied Housing Units | 44 | 91.7% |
| Renter-Occupied Housing Units | 4 | 8.3% |
| Total Occupied Housing Units | 48 | 100.0% |
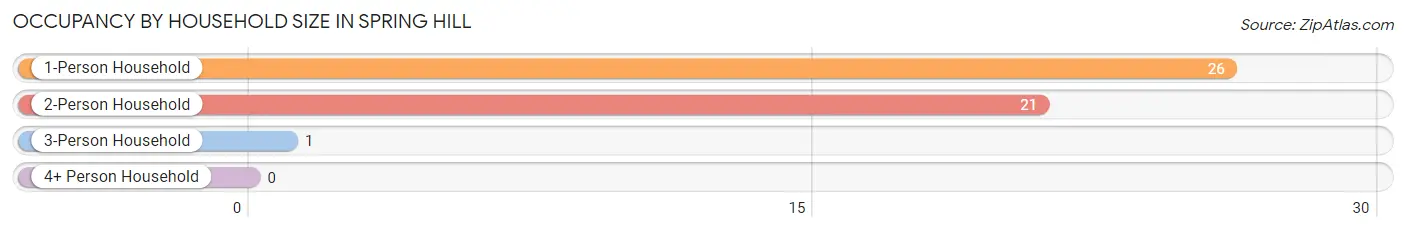
Occupancy by Household Size in Spring Hill
| Household Size | # Housing Units | % Housing Units |
| 1-Person Household | 26 | 54.2% |
| 2-Person Household | 21 | 43.8% |
| 3-Person Household | 1 | 2.1% |
| 4+ Person Household | 0 | 0.0% |
| Total Housing Units | 48 | 100.0% |
Occupancy by Ownership by Household Size in Spring Hill
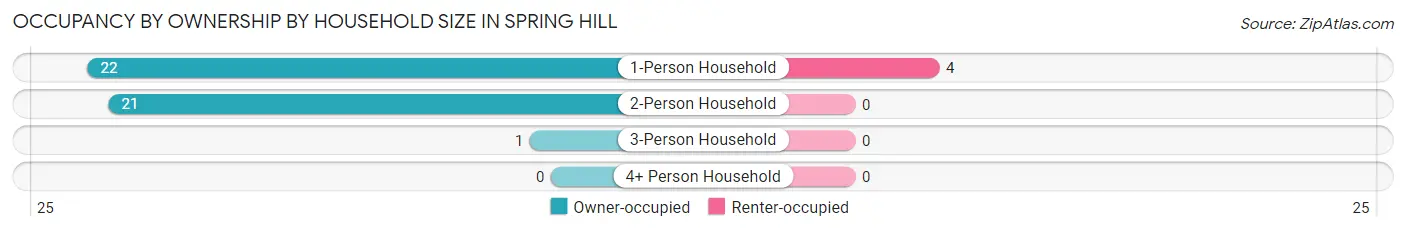
| Household Size | Owner-occupied | Renter-occupied |
| 1-Person Household | 22 (84.6%) | 4 (15.4%) |
| 2-Person Household | 21 (100.0%) | 0 (0.0%) |
| 3-Person Household | 1 (100.0%) | 0 (0.0%) |
| 4+ Person Household | 0 (0.0%) | 0 (0.0%) |
| Total Housing Units | 44 (91.7%) | 4 (8.3%) |
Occupancy by Educational Attainment in Spring Hill
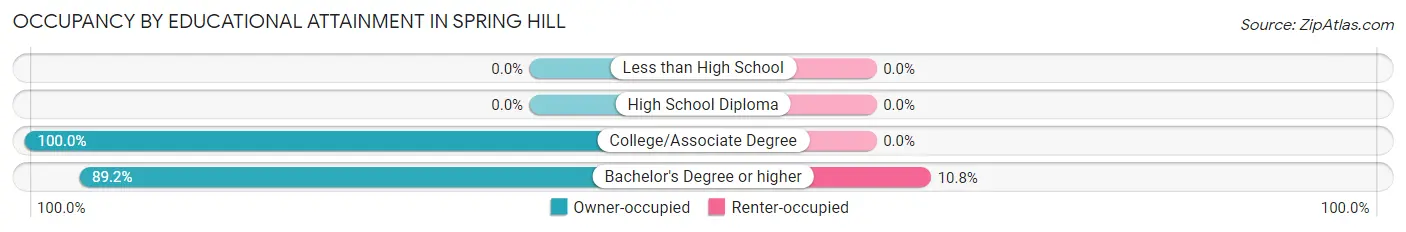
| Household Size | Owner-occupied | Renter-occupied |
| Less than High School | 0 (0.0%) | 0 (0.0%) |
| High School Diploma | 0 (0.0%) | 0 (0.0%) |
| College/Associate Degree | 11 (100.0%) | 0 (0.0%) |
| Bachelor's Degree or higher | 33 (89.2%) | 4 (10.8%) |
Occupancy by Age of Householder in Spring Hill
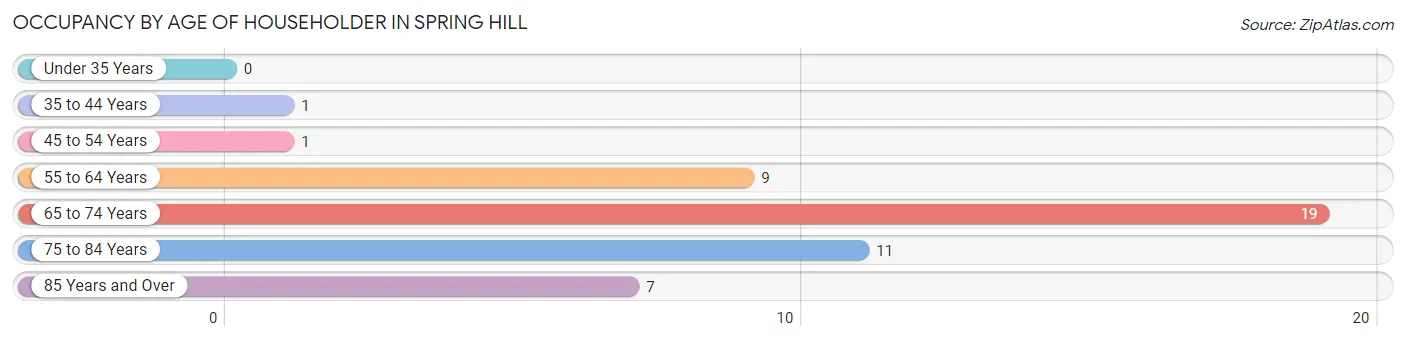
| Age Bracket | # Households | % Households |
| Under 35 Years | 0 | 0.0% |
| 35 to 44 Years | 1 | 2.1% |
| 45 to 54 Years | 1 | 2.1% |
| 55 to 64 Years | 9 | 18.8% |
| 65 to 74 Years | 19 | 39.6% |
| 75 to 84 Years | 11 | 22.9% |
| 85 Years and Over | 7 | 14.6% |
| Total | 48 | 100.0% |
Housing Finances in Spring Hill
Median Income by Occupancy in Spring Hill
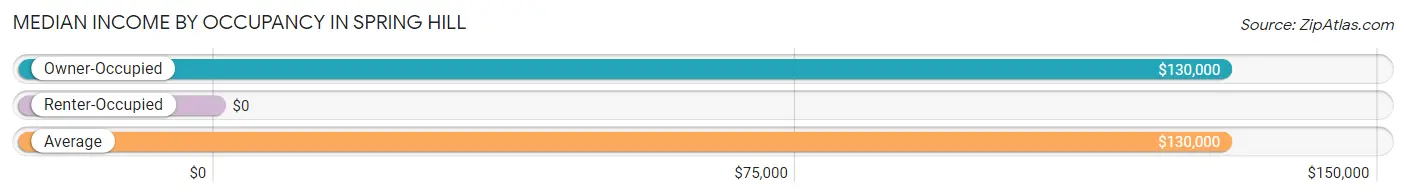
| Occupancy Type | # Households | Median Income |
| Owner-Occupied | 44 (91.7%) | $130,000 |
| Renter-Occupied | 4 (8.3%) | $0 |
| Average | 48 (100.0%) | $130,000 |
Occupancy by Householder Income Bracket in Spring Hill
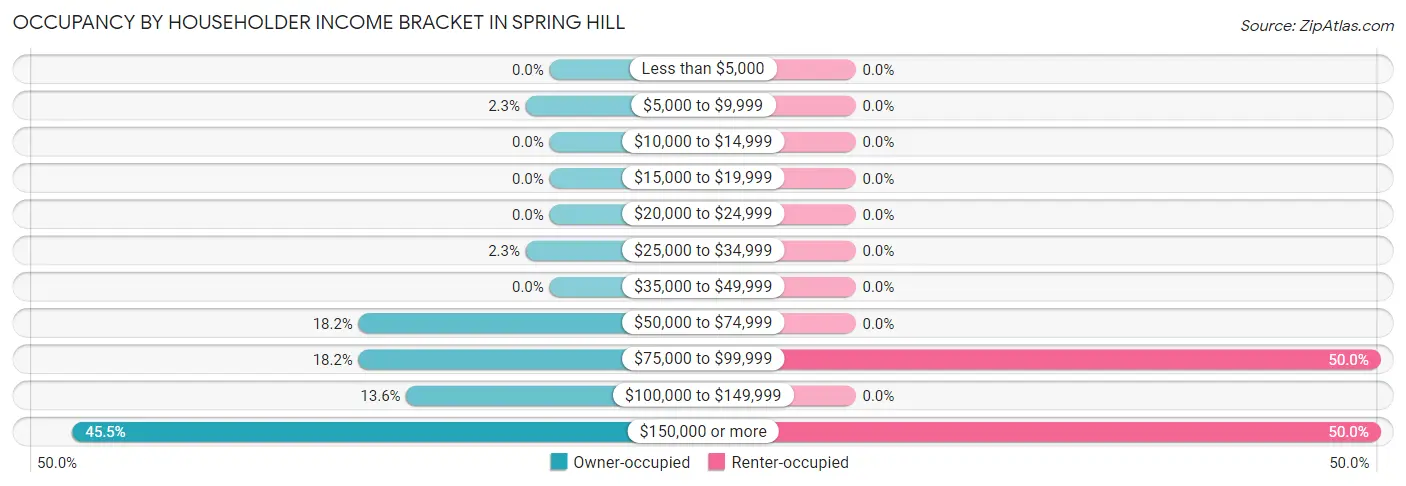
| Income Bracket | Owner-occupied | Renter-occupied |
| Less than $5,000 | 0 (0.0%) | 0 (0.0%) |
| $5,000 to $9,999 | 1 (2.3%) | 0 (0.0%) |
| $10,000 to $14,999 | 0 (0.0%) | 0 (0.0%) |
| $15,000 to $19,999 | 0 (0.0%) | 0 (0.0%) |
| $20,000 to $24,999 | 0 (0.0%) | 0 (0.0%) |
| $25,000 to $34,999 | 1 (2.3%) | 0 (0.0%) |
| $35,000 to $49,999 | 0 (0.0%) | 0 (0.0%) |
| $50,000 to $74,999 | 8 (18.2%) | 0 (0.0%) |
| $75,000 to $99,999 | 8 (18.2%) | 2 (50.0%) |
| $100,000 to $149,999 | 6 (13.6%) | 0 (0.0%) |
| $150,000 or more | 20 (45.5%) | 2 (50.0%) |
| Total | 44 (100.0%) | 4 (100.0%) |
Monthly Housing Cost Tiers in Spring Hill
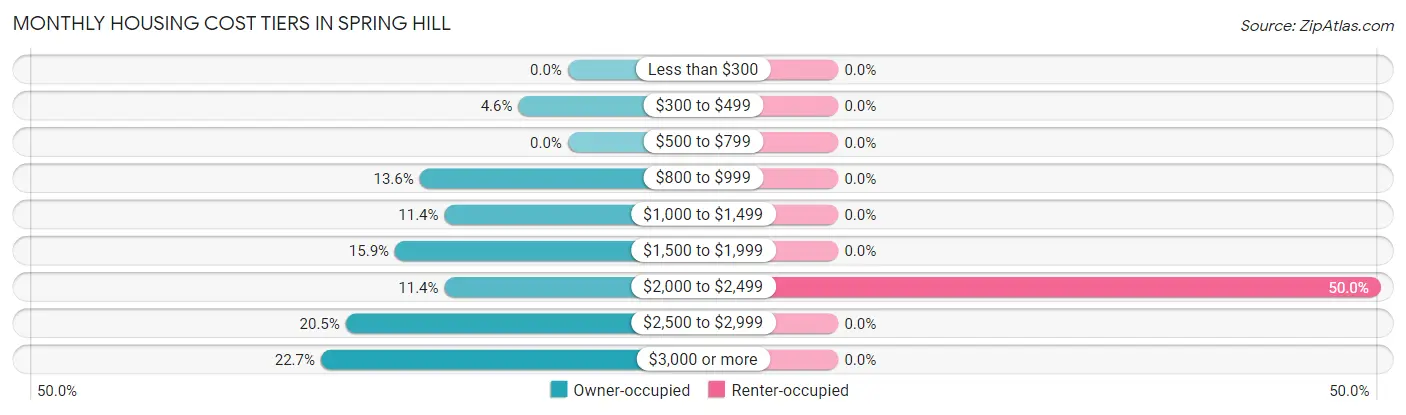
| Monthly Cost | Owner-occupied | Renter-occupied |
| Less than $300 | 0 (0.0%) | 0 (0.0%) |
| $300 to $499 | 2 (4.5%) | 0 (0.0%) |
| $500 to $799 | 0 (0.0%) | 0 (0.0%) |
| $800 to $999 | 6 (13.6%) | 0 (0.0%) |
| $1,000 to $1,499 | 5 (11.4%) | 0 (0.0%) |
| $1,500 to $1,999 | 7 (15.9%) | 0 (0.0%) |
| $2,000 to $2,499 | 5 (11.4%) | 2 (50.0%) |
| $2,500 to $2,999 | 9 (20.4%) | 0 (0.0%) |
| $3,000 or more | 10 (22.7%) | 0 (0.0%) |
| Total | 44 (100.0%) | 4 (100.0%) |
Physical Housing Characteristics in Spring Hill
Housing Structures in Spring Hill
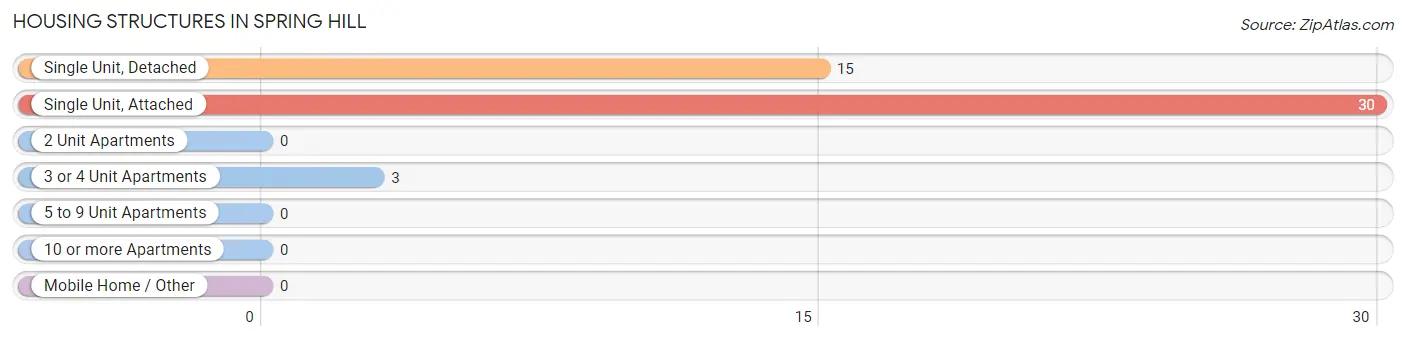
| Structure Type | # Housing Units | % Housing Units |
| Single Unit, Detached | 15 | 31.2% |
| Single Unit, Attached | 30 | 62.5% |
| 2 Unit Apartments | 0 | 0.0% |
| 3 or 4 Unit Apartments | 3 | 6.2% |
| 5 to 9 Unit Apartments | 0 | 0.0% |
| 10 or more Apartments | 0 | 0.0% |
| Mobile Home / Other | 0 | 0.0% |
| Total | 48 | 100.0% |
Housing Structures by Occupancy in Spring Hill
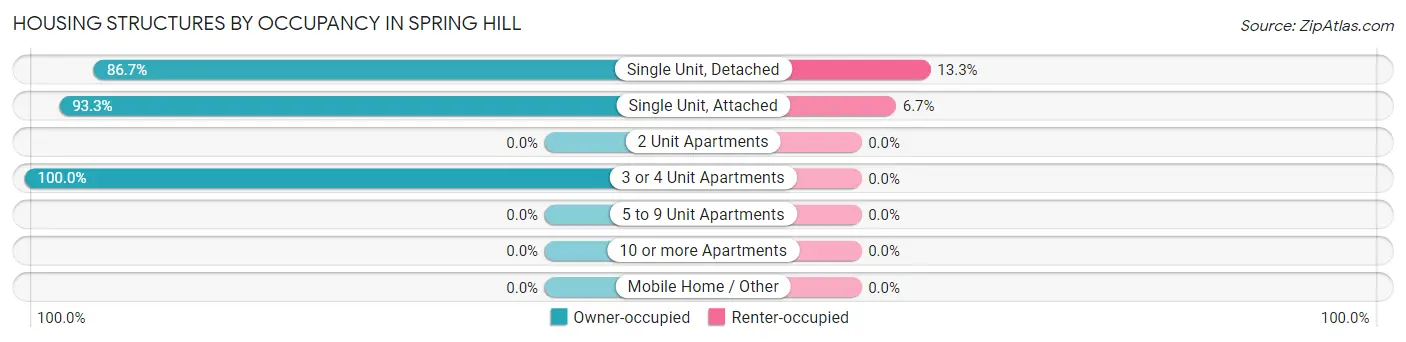
| Structure Type | Owner-occupied | Renter-occupied |
| Single Unit, Detached | 13 (86.7%) | 2 (13.3%) |
| Single Unit, Attached | 28 (93.3%) | 2 (6.7%) |
| 2 Unit Apartments | 0 (0.0%) | 0 (0.0%) |
| 3 or 4 Unit Apartments | 3 (100.0%) | 0 (0.0%) |
| 5 to 9 Unit Apartments | 0 (0.0%) | 0 (0.0%) |
| 10 or more Apartments | 0 (0.0%) | 0 (0.0%) |
| Mobile Home / Other | 0 (0.0%) | 0 (0.0%) |
| Total | 44 (91.7%) | 4 (8.3%) |
Housing Structures by Number of Rooms in Spring Hill
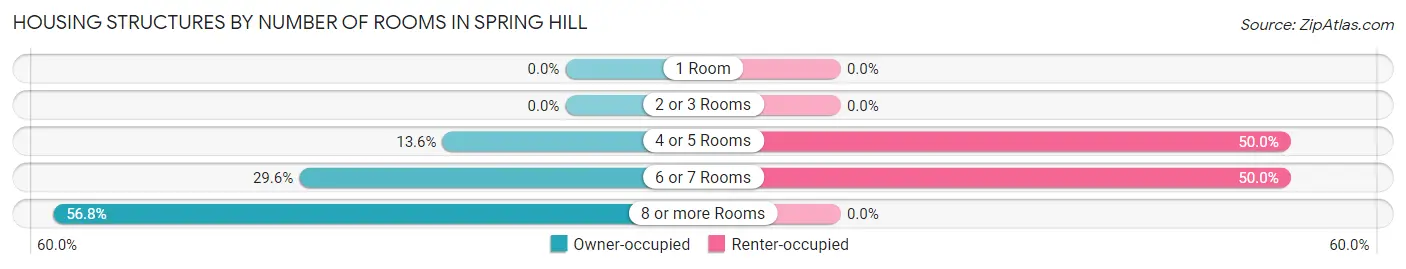
| Number of Rooms | Owner-occupied | Renter-occupied |
| 1 Room | 0 (0.0%) | 0 (0.0%) |
| 2 or 3 Rooms | 0 (0.0%) | 0 (0.0%) |
| 4 or 5 Rooms | 6 (13.6%) | 2 (50.0%) |
| 6 or 7 Rooms | 13 (29.5%) | 2 (50.0%) |
| 8 or more Rooms | 25 (56.8%) | 0 (0.0%) |
| Total | 44 (100.0%) | 4 (100.0%) |
Housing Structure by Heating Type in Spring Hill
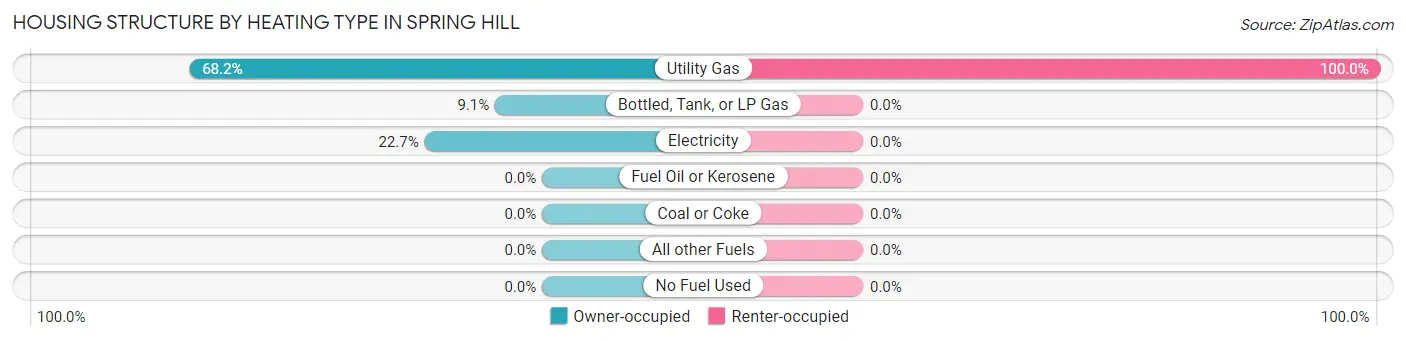
| Heating Type | Owner-occupied | Renter-occupied |
| Utility Gas | 30 (68.2%) | 4 (100.0%) |
| Bottled, Tank, or LP Gas | 4 (9.1%) | 0 (0.0%) |
| Electricity | 10 (22.7%) | 0 (0.0%) |
| Fuel Oil or Kerosene | 0 (0.0%) | 0 (0.0%) |
| Coal or Coke | 0 (0.0%) | 0 (0.0%) |
| All other Fuels | 0 (0.0%) | 0 (0.0%) |
| No Fuel Used | 0 (0.0%) | 0 (0.0%) |
| Total | 44 (100.0%) | 4 (100.0%) |
Household Vehicle Usage in Spring Hill
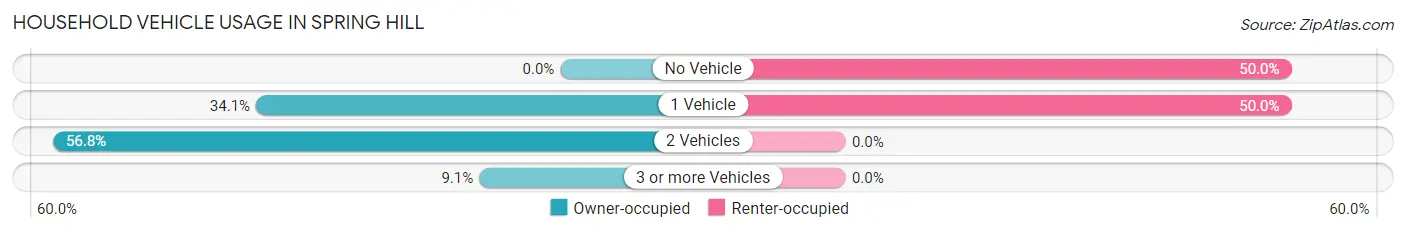
| Vehicles per Household | Owner-occupied | Renter-occupied |
| No Vehicle | 0 (0.0%) | 2 (50.0%) |
| 1 Vehicle | 15 (34.1%) | 2 (50.0%) |
| 2 Vehicles | 25 (56.8%) | 0 (0.0%) |
| 3 or more Vehicles | 4 (9.1%) | 0 (0.0%) |
| Total | 44 (100.0%) | 4 (100.0%) |
Real Estate & Mortgages in Spring Hill
Real Estate and Mortgage Overview in Spring Hill
| Characteristic | Without Mortgage | With Mortgage |
| Housing Units | 12 | 32 |
| Median Property Value | $340,000 | $330,800 |
| Median Household Income | $130,000 | $16 |
| Monthly Housing Costs | $1,000 | $10 |
| Real Estate Taxes | $3,250 | $0 |
Property Value by Mortgage Status in Spring Hill
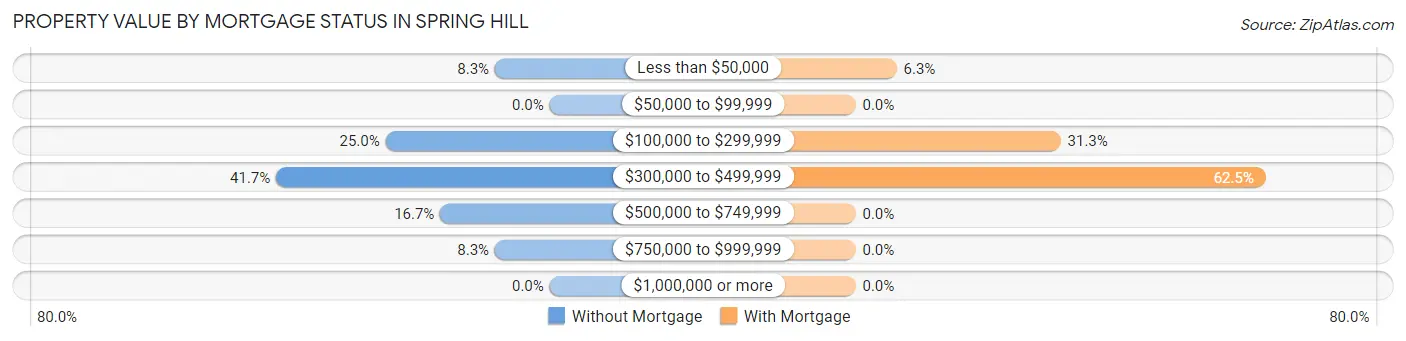
| Property Value | Without Mortgage | With Mortgage |
| Less than $50,000 | 1 (8.3%) | 2 (6.2%) |
| $50,000 to $99,999 | 0 (0.0%) | 0 (0.0%) |
| $100,000 to $299,999 | 3 (25.0%) | 10 (31.2%) |
| $300,000 to $499,999 | 5 (41.7%) | 20 (62.5%) |
| $500,000 to $749,999 | 2 (16.7%) | 0 (0.0%) |
| $750,000 to $999,999 | 1 (8.3%) | 0 (0.0%) |
| $1,000,000 or more | 0 (0.0%) | 0 (0.0%) |
| Total | 12 (100.0%) | 32 (100.0%) |
Household Income by Mortgage Status in Spring Hill
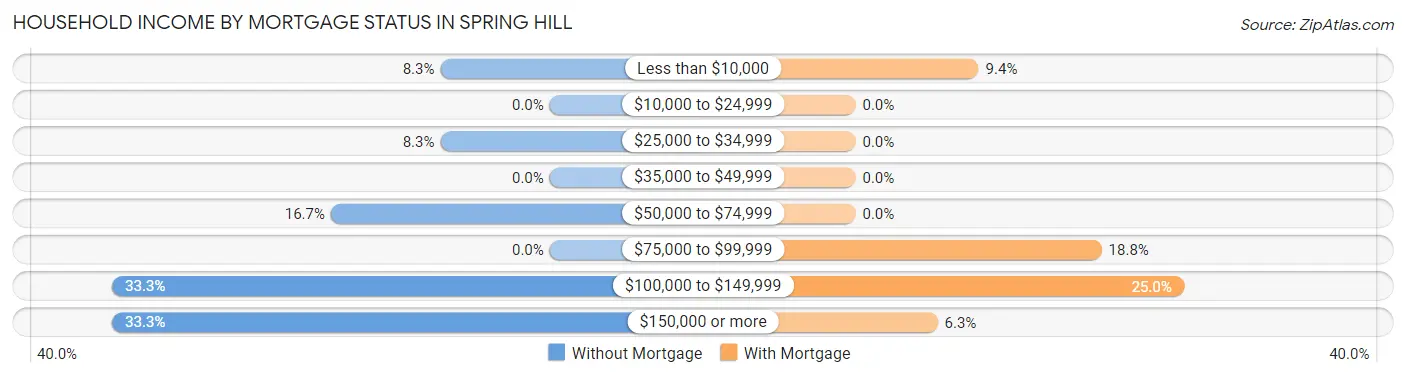
| Household Income | Without Mortgage | With Mortgage |
| Less than $10,000 | 1 (8.3%) | 3 (9.4%) |
| $10,000 to $24,999 | 0 (0.0%) | 0 (0.0%) |
| $25,000 to $34,999 | 1 (8.3%) | 0 (0.0%) |
| $35,000 to $49,999 | 0 (0.0%) | 0 (0.0%) |
| $50,000 to $74,999 | 2 (16.7%) | 0 (0.0%) |
| $75,000 to $99,999 | 0 (0.0%) | 6 (18.8%) |
| $100,000 to $149,999 | 4 (33.3%) | 8 (25.0%) |
| $150,000 or more | 4 (33.3%) | 2 (6.2%) |
| Total | 12 (100.0%) | 32 (100.0%) |
Property Value to Household Income Ratio in Spring Hill
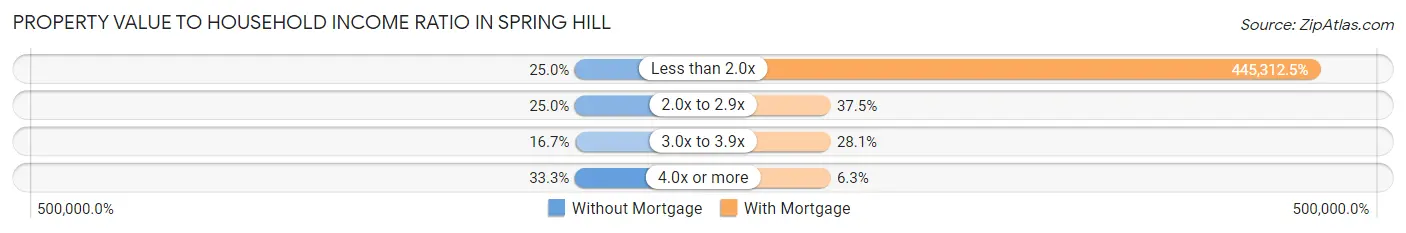
| Value-to-Income Ratio | Without Mortgage | With Mortgage |
| Less than 2.0x | 3 (25.0%) | 142,500 (445,312.5%) |
| 2.0x to 2.9x | 3 (25.0%) | 12 (37.5%) |
| 3.0x to 3.9x | 2 (16.7%) | 9 (28.1%) |
| 4.0x or more | 4 (33.3%) | 2 (6.2%) |
| Total | 12 (100.0%) | 32 (100.0%) |
Real Estate Taxes by Mortgage Status in Spring Hill
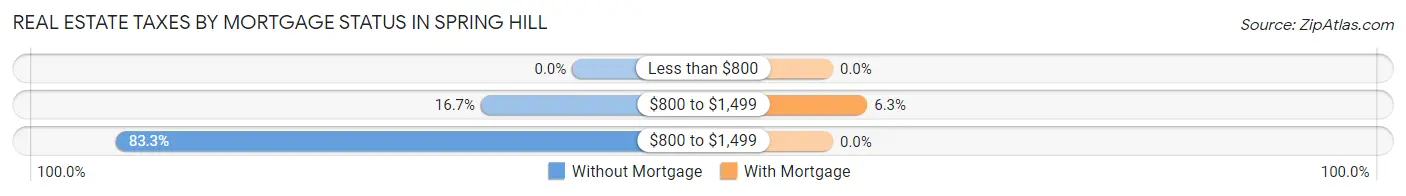
| Property Taxes | Without Mortgage | With Mortgage |
| Less than $800 | 0 (0.0%) | 0 (0.0%) |
| $800 to $1,499 | 2 (16.7%) | 2 (6.2%) |
| $800 to $1,499 | 10 (83.3%) | 0 (0.0%) |
| Total | 12 (100.0%) | 32 (100.0%) |
Health & Disability in Spring Hill
Health Insurance Coverage by Age in Spring Hill
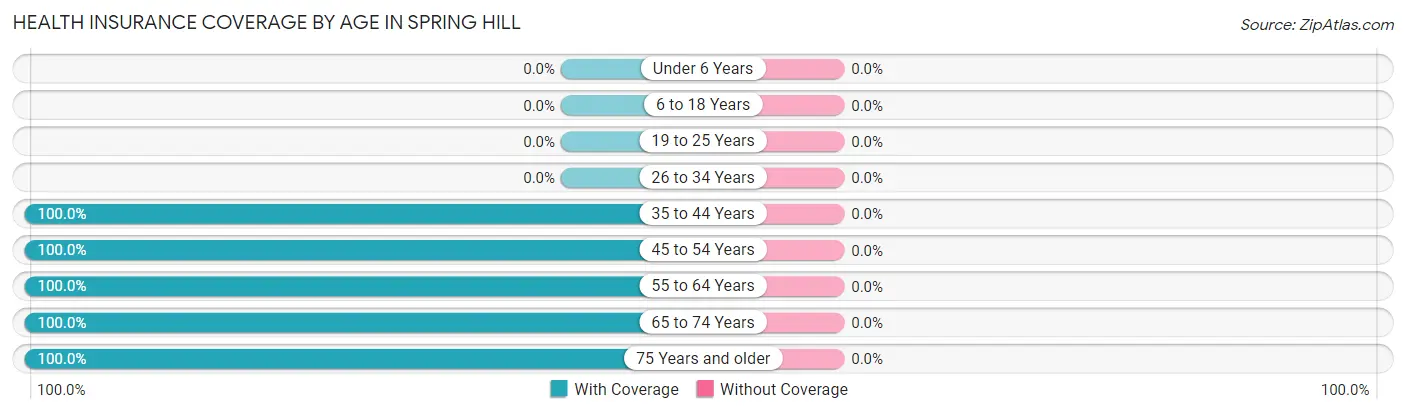
| Age Bracket | With Coverage | Without Coverage |
| Under 6 Years | 0 (0.0%) | 0 (0.0%) |
| 6 to 18 Years | 0 (0.0%) | 0 (0.0%) |
| 19 to 25 Years | 0 (0.0%) | 0 (0.0%) |
| 26 to 34 Years | 0 (0.0%) | 0 (0.0%) |
| 35 to 44 Years | 3 (100.0%) | 0 (0.0%) |
| 45 to 54 Years | 1 (100.0%) | 0 (0.0%) |
| 55 to 64 Years | 18 (100.0%) | 0 (0.0%) |
| 65 to 74 Years | 26 (100.0%) | 0 (0.0%) |
| 75 Years and older | 24 (100.0%) | 0 (0.0%) |
| Total | 72 (100.0%) | 0 (0.0%) |
Health Insurance Coverage by Citizenship Status in Spring Hill
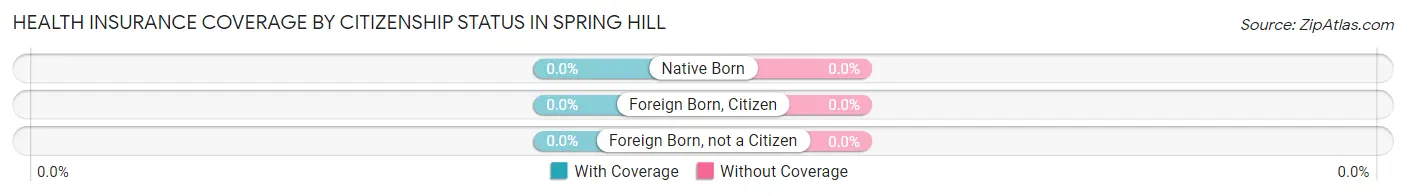
| Citizenship Status | With Coverage | Without Coverage |
| Native Born | 0 (0.0%) | 0 (0.0%) |
| Foreign Born, Citizen | 0 (0.0%) | 0 (0.0%) |
| Foreign Born, not a Citizen | 0 (0.0%) | 0 (0.0%) |
Health Insurance Coverage by Household Income in Spring Hill
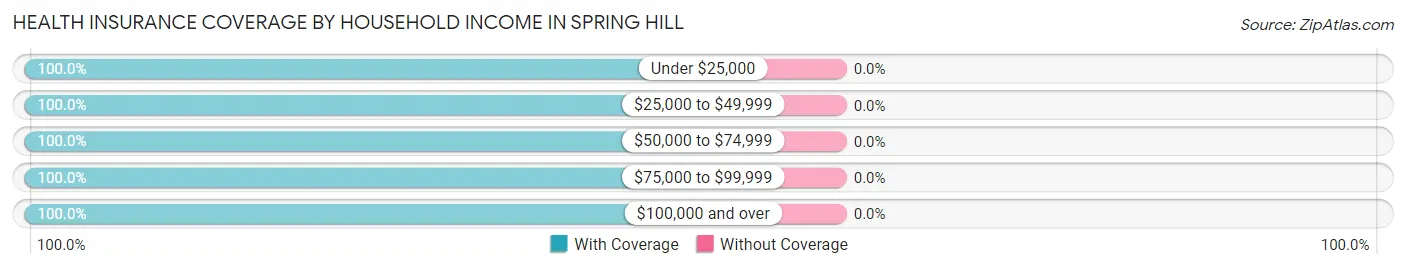
| Household Income | With Coverage | Without Coverage |
| Under $25,000 | 1 (100.0%) | 0 (0.0%) |
| $25,000 to $49,999 | 2 (100.0%) | 0 (0.0%) |
| $50,000 to $74,999 | 10 (100.0%) | 0 (0.0%) |
| $75,000 to $99,999 | 10 (100.0%) | 0 (0.0%) |
| $100,000 and over | 49 (100.0%) | 0 (0.0%) |
Public vs Private Health Insurance Coverage by Age in Spring Hill
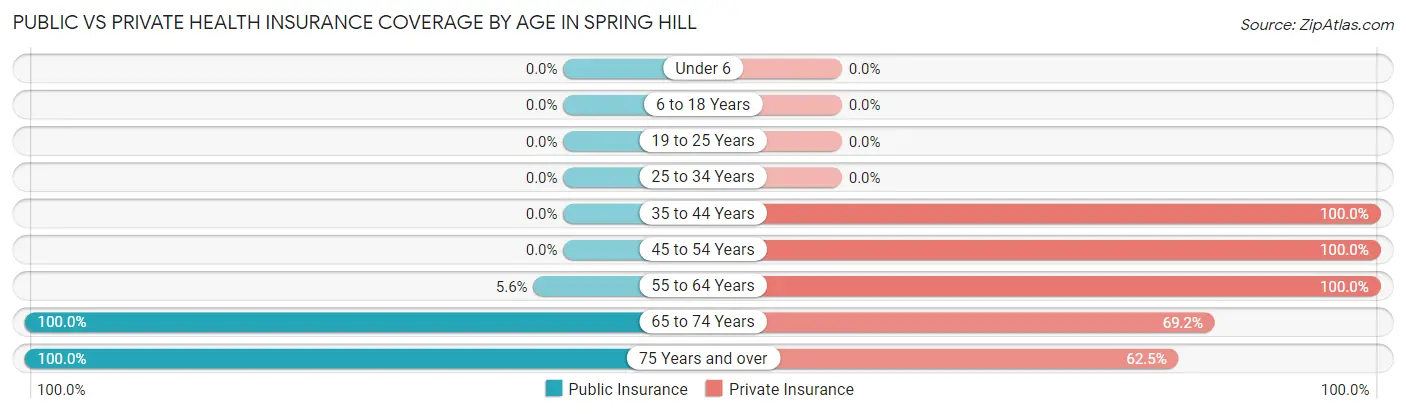
| Age Bracket | Public Insurance | Private Insurance |
| Under 6 | 0 (0.0%) | 0 (0.0%) |
| 6 to 18 Years | 0 (0.0%) | 0 (0.0%) |
| 19 to 25 Years | 0 (0.0%) | 0 (0.0%) |
| 25 to 34 Years | 0 (0.0%) | 0 (0.0%) |
| 35 to 44 Years | 0 (0.0%) | 3 (100.0%) |
| 45 to 54 Years | 0 (0.0%) | 1 (100.0%) |
| 55 to 64 Years | 1 (5.6%) | 18 (100.0%) |
| 65 to 74 Years | 26 (100.0%) | 18 (69.2%) |
| 75 Years and over | 24 (100.0%) | 15 (62.5%) |
| Total | 51 (70.8%) | 55 (76.4%) |
Disability Status by Sex by Age in Spring Hill
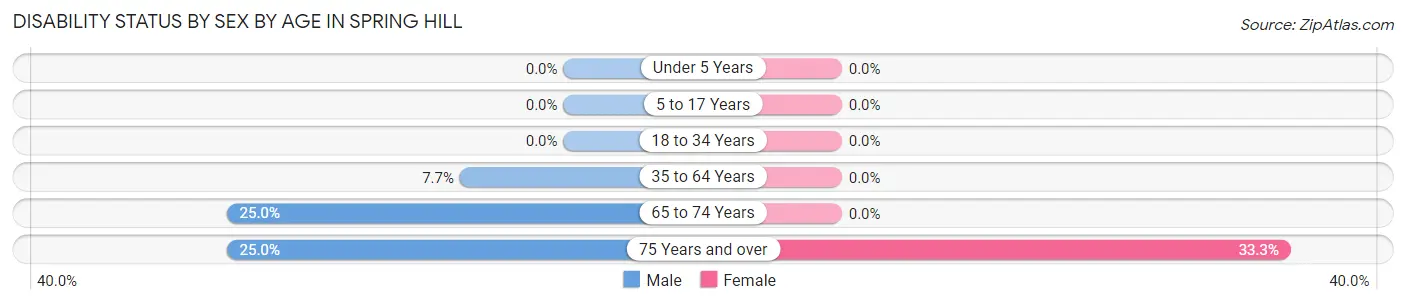
| Age Bracket | Male | Female |
| Under 5 Years | 0 (0.0%) | 0 (0.0%) |
| 5 to 17 Years | 0 (0.0%) | 0 (0.0%) |
| 18 to 34 Years | 0 (0.0%) | 0 (0.0%) |
| 35 to 64 Years | 1 (7.7%) | 0 (0.0%) |
| 65 to 74 Years | 2 (25.0%) | 0 (0.0%) |
| 75 Years and over | 3 (25.0%) | 4 (33.3%) |
Disability Class by Sex by Age in Spring Hill
Disability Class: Hearing Difficulty
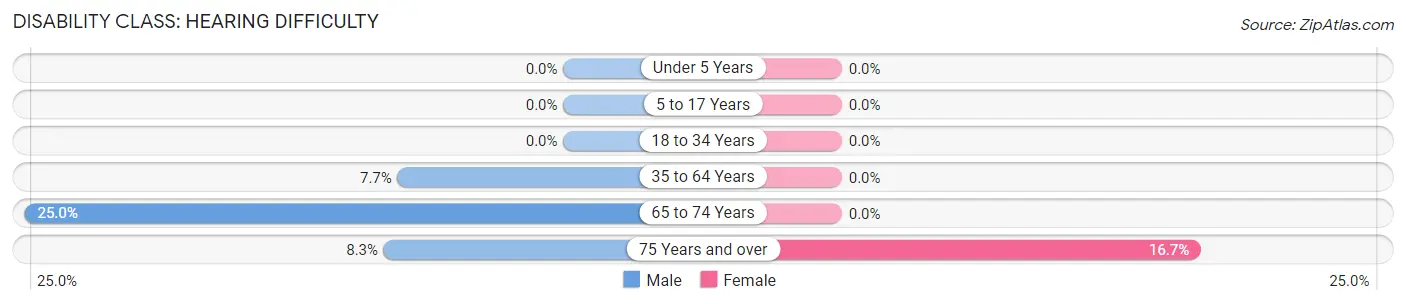
| Age Bracket | Male | Female |
| Under 5 Years | 0 (0.0%) | 0 (0.0%) |
| 5 to 17 Years | 0 (0.0%) | 0 (0.0%) |
| 18 to 34 Years | 0 (0.0%) | 0 (0.0%) |
| 35 to 64 Years | 1 (7.7%) | 0 (0.0%) |
| 65 to 74 Years | 2 (25.0%) | 0 (0.0%) |
| 75 Years and over | 1 (8.3%) | 2 (16.7%) |
Disability Class: Vision Difficulty
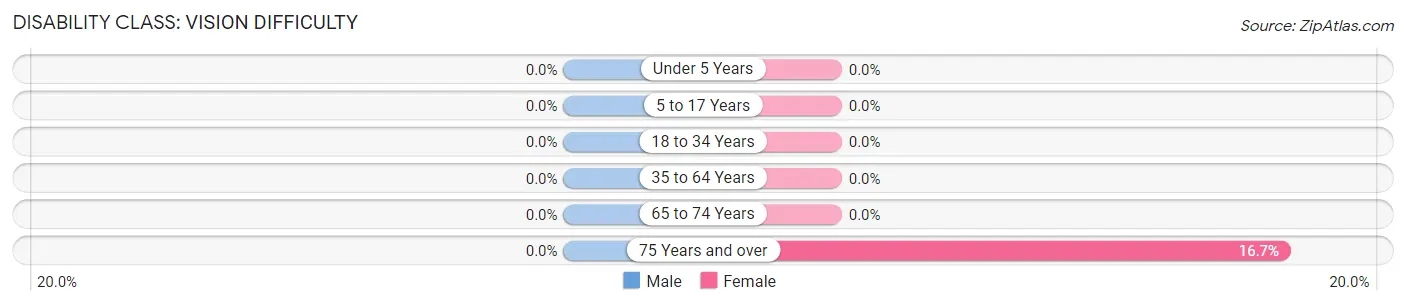
| Age Bracket | Male | Female |
| Under 5 Years | 0 (0.0%) | 0 (0.0%) |
| 5 to 17 Years | 0 (0.0%) | 0 (0.0%) |
| 18 to 34 Years | 0 (0.0%) | 0 (0.0%) |
| 35 to 64 Years | 0 (0.0%) | 0 (0.0%) |
| 65 to 74 Years | 0 (0.0%) | 0 (0.0%) |
| 75 Years and over | 0 (0.0%) | 2 (16.7%) |
Disability Class: Cognitive Difficulty
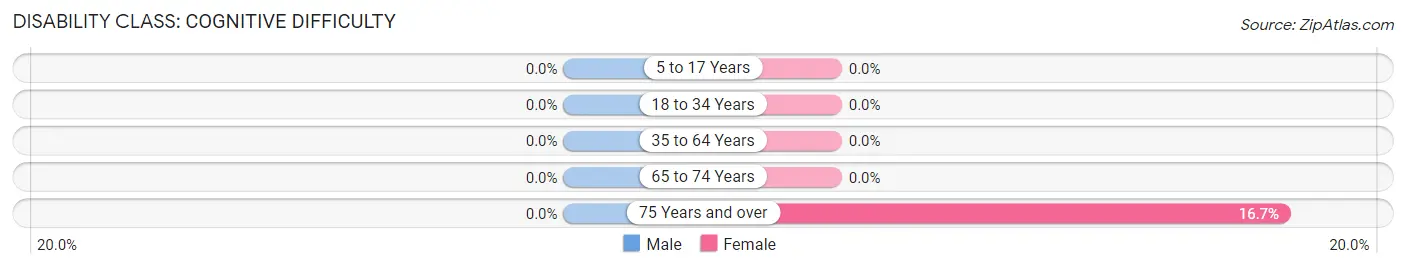
| Age Bracket | Male | Female |
| 5 to 17 Years | 0 (0.0%) | 0 (0.0%) |
| 18 to 34 Years | 0 (0.0%) | 0 (0.0%) |
| 35 to 64 Years | 0 (0.0%) | 0 (0.0%) |
| 65 to 74 Years | 0 (0.0%) | 0 (0.0%) |
| 75 Years and over | 0 (0.0%) | 2 (16.7%) |
Disability Class: Ambulatory Difficulty
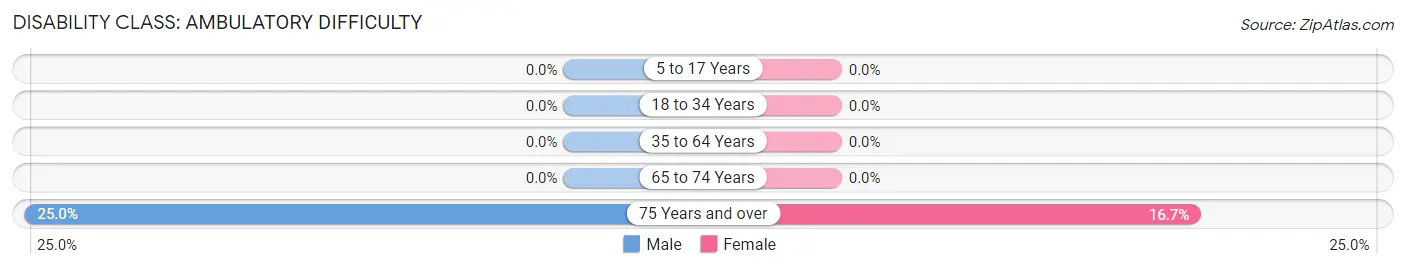
| Age Bracket | Male | Female |
| 5 to 17 Years | 0 (0.0%) | 0 (0.0%) |
| 18 to 34 Years | 0 (0.0%) | 0 (0.0%) |
| 35 to 64 Years | 0 (0.0%) | 0 (0.0%) |
| 65 to 74 Years | 0 (0.0%) | 0 (0.0%) |
| 75 Years and over | 3 (25.0%) | 2 (16.7%) |
Disability Class: Self-Care Difficulty
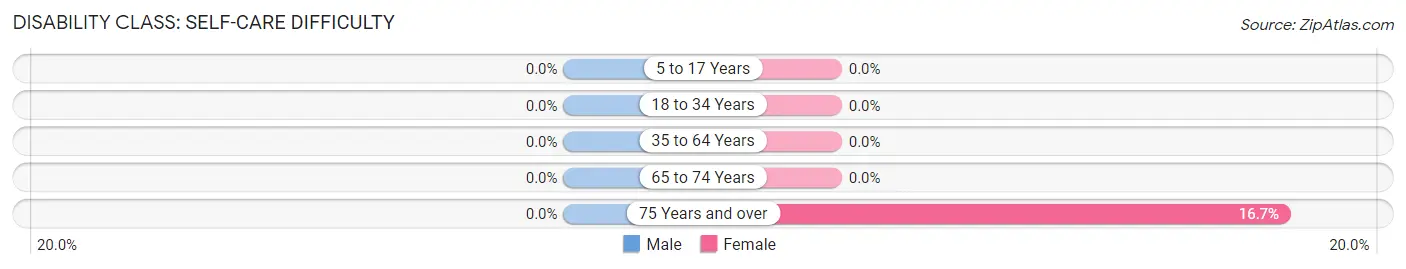
| Age Bracket | Male | Female |
| 5 to 17 Years | 0 (0.0%) | 0 (0.0%) |
| 18 to 34 Years | 0 (0.0%) | 0 (0.0%) |
| 35 to 64 Years | 0 (0.0%) | 0 (0.0%) |
| 65 to 74 Years | 0 (0.0%) | 0 (0.0%) |
| 75 Years and over | 0 (0.0%) | 2 (16.7%) |
Technology Access in Spring Hill
Computing Device Access in Spring Hill
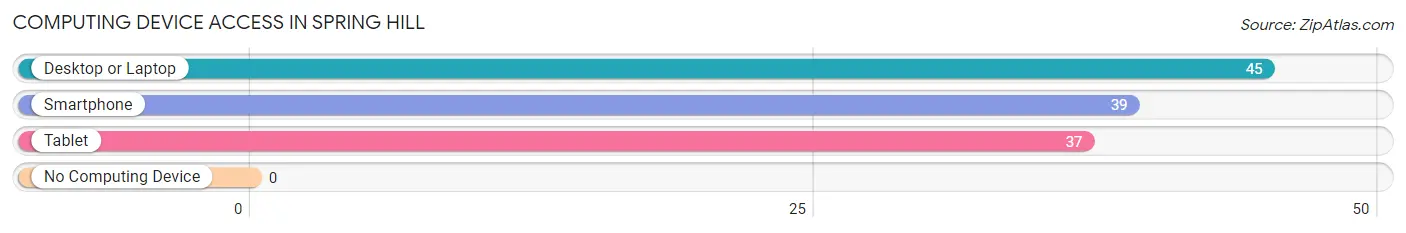
| Device Type | # Households | % Households |
| Desktop or Laptop | 45 | 93.8% |
| Smartphone | 39 | 81.2% |
| Tablet | 37 | 77.1% |
| No Computing Device | 0 | 0.0% |
| Total | 48 | 100.0% |
Internet Access in Spring Hill
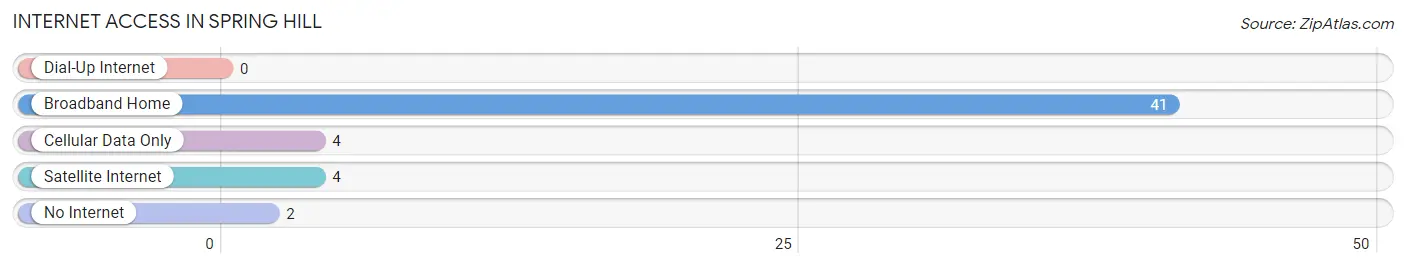
| Internet Type | # Households | % Households |
| Dial-Up Internet | 0 | 0.0% |
| Broadband Home | 41 | 85.4% |
| Cellular Data Only | 4 | 8.3% |
| Satellite Internet | 4 | 8.3% |
| No Internet | 2 | 4.2% |
| Total | 48 | 100.0% |
Spring Hill Summary
History
Spring Hill is a small town located in Johnson County, Indiana. It was founded in 1837 by a group of settlers from Kentucky and Tennessee. The town was named after a nearby spring that provided water to the settlers. The first post office was established in 1845 and the first school was built in 1848.
The town grew slowly but steadily over the years, and by the turn of the 20th century, it had become a thriving community with a population of around 500 people. The town was home to several businesses, including a general store, a blacksmith shop, a sawmill, and a gristmill.
In the early 1900s, the town began to experience a period of growth and prosperity. The population increased to over 1,000 people by 1910, and the town was home to several new businesses, including a bank, a hotel, a movie theater, and a newspaper.
The town continued to grow and prosper throughout the 20th century. In the 1950s, the population reached over 2,000 people and the town was home to several new businesses, including a grocery store, a hardware store, and a gas station.
Geography
Spring Hill is located in Johnson County, Indiana, approximately 25 miles south of Indianapolis. The town is situated on the banks of the White River, which flows through the town and provides a scenic backdrop. The town is surrounded by rolling hills and farmland, and is home to several parks and recreational areas.
The climate in Spring Hill is typical of the Midwest, with hot summers and cold winters. The average temperature in the summer is around 75 degrees Fahrenheit, and the average temperature in the winter is around 30 degrees Fahrenheit.
Economy
The economy of Spring Hill is largely based on agriculture and manufacturing. The town is home to several farms, which produce a variety of crops, including corn, soybeans, and wheat. The town is also home to several manufacturing companies, which produce a variety of products, including furniture, clothing, and automotive parts.
The town is also home to several small businesses, including restaurants, retail stores, and service providers. The town is also home to several banks and financial institutions, which provide banking services to the local community.
Demographics
As of the 2010 census, the population of Spring Hill was 2,845 people. The racial makeup of the town was 97.3% White, 0.7% African American, 0.3% Native American, 0.3% Asian, 0.1% Pacific Islander, and 1.3% from other races. The median household income was $45,938, and the median family income was $51,938.
Conclusion
Spring Hill is a small town located in Johnson County, Indiana. It was founded in 1837 by a group of settlers from Kentucky and Tennessee, and has since grown into a thriving community with a population of over 2,800 people. The town is largely based on agriculture and manufacturing, and is home to several small businesses, banks, and financial institutions. The town is surrounded by rolling hills and farmland, and is home to several parks and recreational areas.
Common Questions
What is Per Capita Income in Spring Hill?
Per Capita income in Spring Hill is $89,876.
What is the Median Family Income in Spring Hill?
Median Family Income in Spring Hill is $168,750.
What is the Median Household income in Spring Hill?
Median Household Income in Spring Hill is $130,000.
What is Income or Wage Gap in Spring Hill?
Income or Wage Gap in Spring Hill is 25.3%.
Women in Spring Hill earn 74.7 cents for every dollar earned by a man.
What is Inequality or Gini Index in Spring Hill?
Inequality or Gini Index in Spring Hill is 0.28.
What is the Total Population of Spring Hill?
Total Population of Spring Hill is 72.
What is the Total Male Population of Spring Hill?
Total Male Population of Spring Hill is 33.
What is the Total Female Population of Spring Hill?
Total Female Population of Spring Hill is 39.
What is the Ratio of Males per 100 Females in Spring Hill?
There are 84.62 Males per 100 Females in Spring Hill.
What is the Ratio of Females per 100 Males in Spring Hill?
There are 118.18 Females per 100 Males in Spring Hill.
What is the Median Population Age in Spring Hill?
Median Population Age in Spring Hill is 72.0 Years.
What is the Average Family Size in Spring Hill
Average Family Size in Spring Hill is 2.0 People.
What is the Average Household Size in Spring Hill
Average Household Size in Spring Hill is 1.5 People.
How Large is the Labor Force in Spring Hill?
There are 30 People in the Labor Forcein in Spring Hill.
What is the Percentage of People in the Labor Force in Spring Hill?
41.7% of People are in the Labor Force in Spring Hill.