Johnson Creek, WI Map & Demographics
Johnson Creek Map
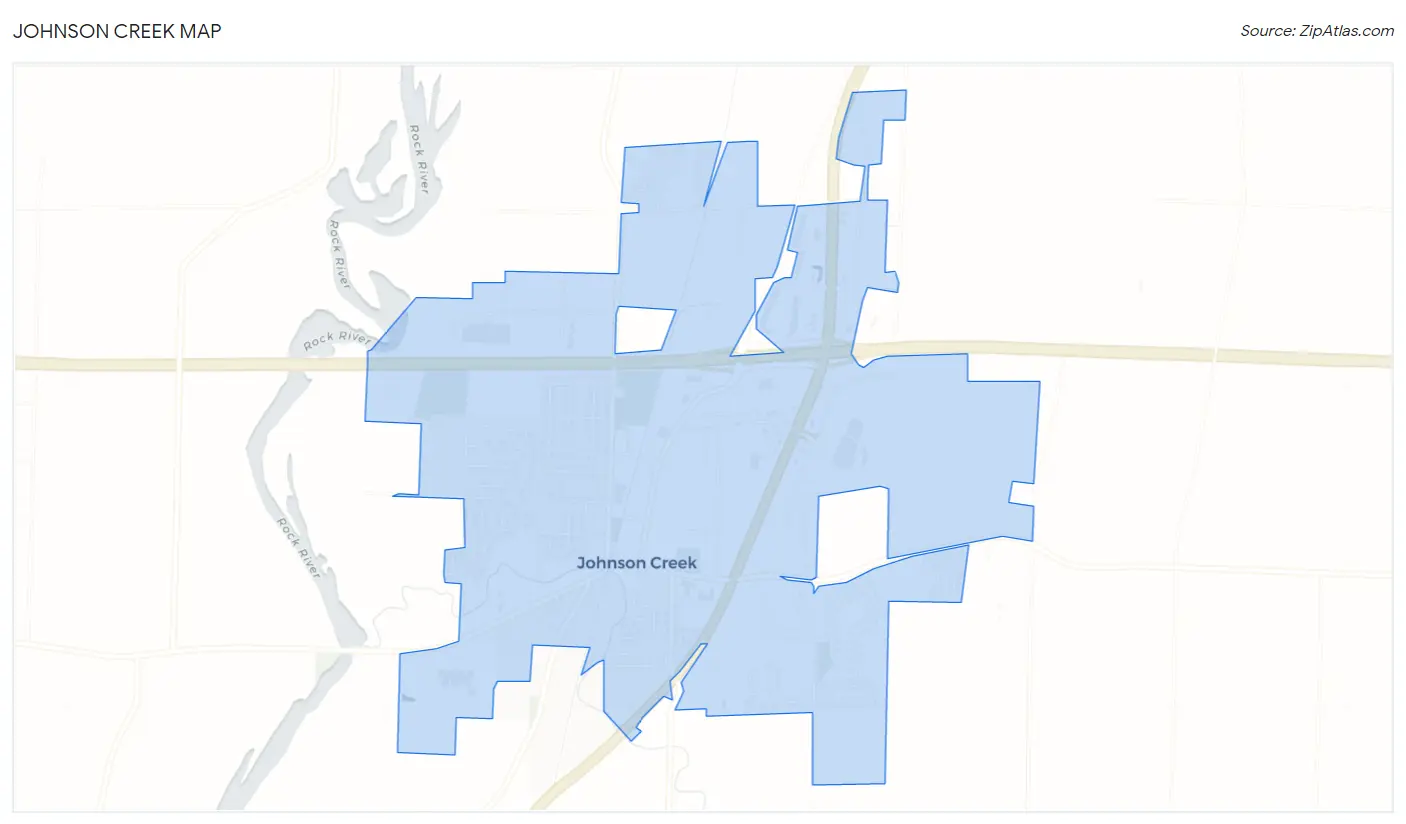
Johnson Creek Overview
$37,717
PER CAPITA INCOME
$107,031
AVG FAMILY INCOME
$92,826
AVG HOUSEHOLD INCOME
42.8%
WAGE / INCOME GAP [ % ]
57.2¢/ $1
WAGE / INCOME GAP [ $ ]
0.32
INEQUALITY / GINI INDEX
3,337
TOTAL POPULATION
1,761
MALE POPULATION
1,576
FEMALE POPULATION
111.74
MALES / 100 FEMALES
89.49
FEMALES / 100 MALES
34.5
MEDIAN AGE
3.2
AVG FAMILY SIZE
2.9
AVG HOUSEHOLD SIZE
1,941
LABOR FORCE [ PEOPLE ]
74.7%
PERCENT IN LABOR FORCE
2.1%
UNEMPLOYMENT RATE
Johnson Creek Zip Codes
Johnson Creek Area Codes
Income in Johnson Creek
Income Overview in Johnson Creek
Per Capita Income in Johnson Creek is $37,717, while median incomes of families and households are $107,031 and $92,826 respectively.
| Characteristic | Number | Measure |
| Per Capita Income | 3,337 | $37,717 |
| Median Family Income | 869 | $107,031 |
| Mean Family Income | 869 | $113,190 |
| Median Household Income | 1,134 | $92,826 |
| Mean Household Income | 1,134 | $107,340 |
| Income Deficit | 869 | $0 |
| Wage / Income Gap (%) | 3,337 | 42.79% |
| Wage / Income Gap ($) | 3,337 | 57.21¢ per $1 |
| Gini / Inequality Index | 3,337 | 0.32 |
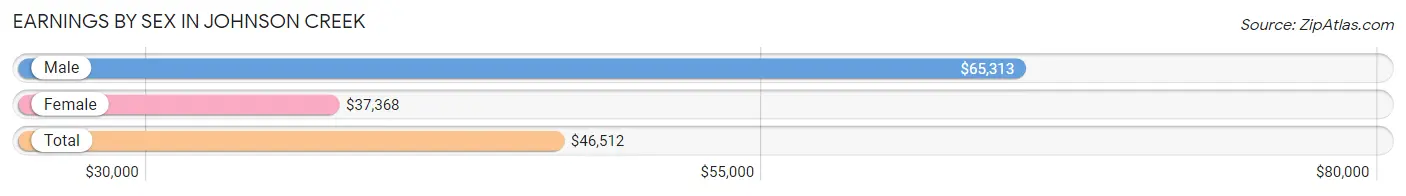
Earnings by Sex in Johnson Creek
Average Earnings in Johnson Creek are $46,512, $65,313 for men and $37,368 for women, a difference of 42.8%.
| Sex | Number | Average Earnings |
| Male | 1,117 (55.2%) | $65,313 |
| Female | 908 (44.8%) | $37,368 |
| Total | 2,025 (100.0%) | $46,512 |
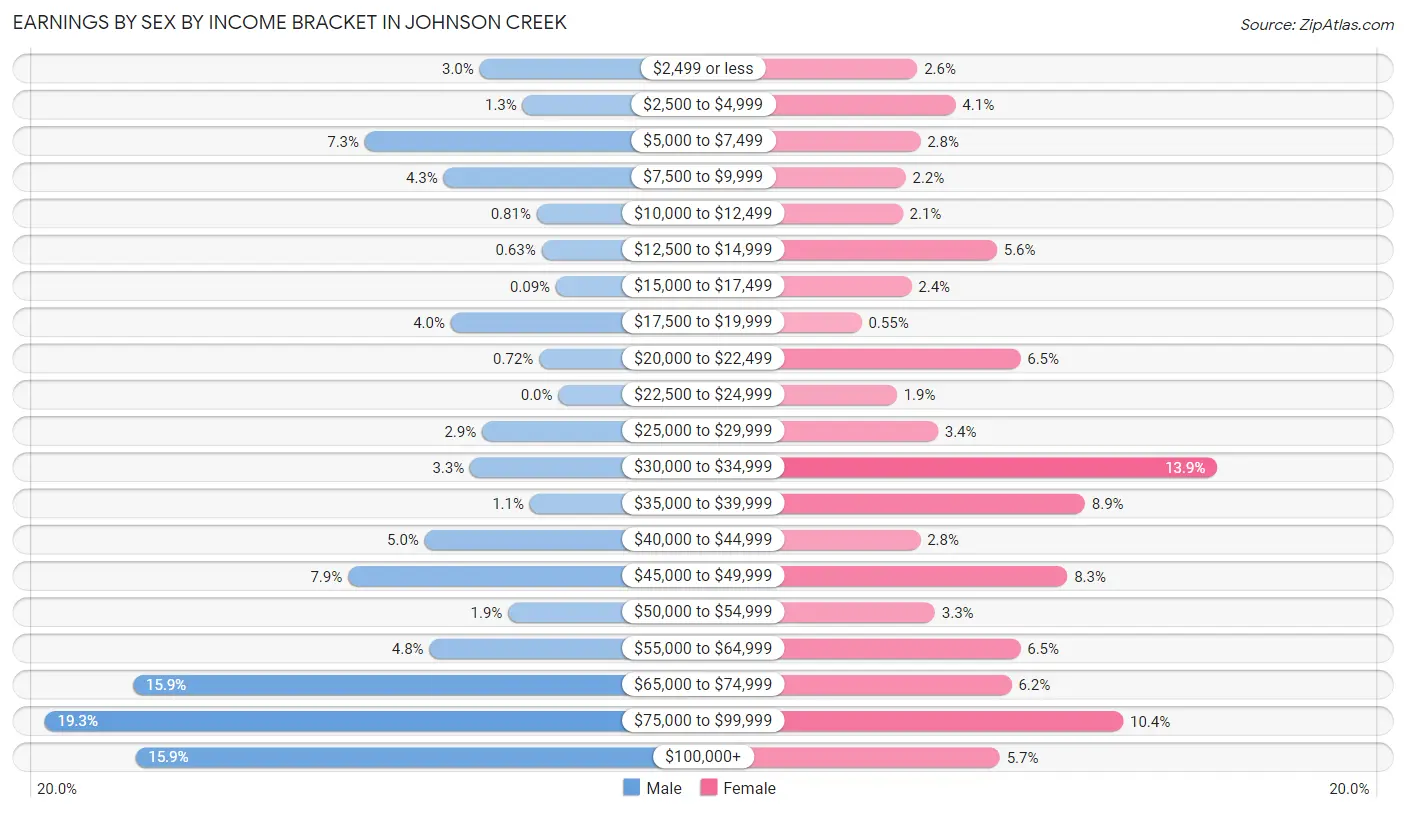
Earnings by Sex by Income Bracket in Johnson Creek
The most common earnings brackets in Johnson Creek are $75,000 to $99,999 for men (215 | 19.3%) and $30,000 to $34,999 for women (126 | 13.9%).
| Income | Male | Female |
| $2,499 or less | 33 (2.9%) | 24 (2.6%) |
| $2,500 to $4,999 | 15 (1.3%) | 37 (4.1%) |
| $5,000 to $7,499 | 81 (7.2%) | 25 (2.8%) |
| $7,500 to $9,999 | 48 (4.3%) | 20 (2.2%) |
| $10,000 to $12,499 | 9 (0.8%) | 19 (2.1%) |
| $12,500 to $14,999 | 7 (0.6%) | 51 (5.6%) |
| $15,000 to $17,499 | 1 (0.1%) | 22 (2.4%) |
| $17,500 to $19,999 | 45 (4.0%) | 5 (0.5%) |
| $20,000 to $22,499 | 8 (0.7%) | 59 (6.5%) |
| $22,500 to $24,999 | 0 (0.0%) | 17 (1.9%) |
| $25,000 to $29,999 | 32 (2.9%) | 31 (3.4%) |
| $30,000 to $34,999 | 37 (3.3%) | 126 (13.9%) |
| $35,000 to $39,999 | 12 (1.1%) | 81 (8.9%) |
| $40,000 to $44,999 | 56 (5.0%) | 25 (2.8%) |
| $45,000 to $49,999 | 88 (7.9%) | 75 (8.3%) |
| $50,000 to $54,999 | 21 (1.9%) | 30 (3.3%) |
| $55,000 to $64,999 | 54 (4.8%) | 59 (6.5%) |
| $65,000 to $74,999 | 178 (15.9%) | 56 (6.2%) |
| $75,000 to $99,999 | 215 (19.3%) | 94 (10.3%) |
| $100,000+ | 177 (15.9%) | 52 (5.7%) |
| Total | 1,117 (100.0%) | 908 (100.0%) |
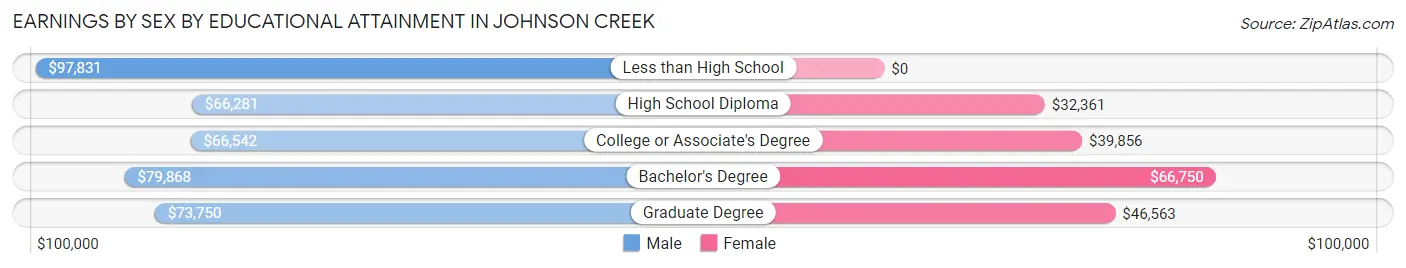
Earnings by Sex by Educational Attainment in Johnson Creek
Average earnings in Johnson Creek are $67,473 for men and $45,909 for women, a difference of 32.0%. Men with an educational attainment of less than high school enjoy the highest average annual earnings of $97,831, while those with high school diploma education earn the least with $66,281. Women with an educational attainment of bachelor's degree earn the most with the average annual earnings of $66,750, while those with high school diploma education have the smallest earnings of $32,361.
| Educational Attainment | Male Income | Female Income |
| Less than High School | $97,831 | $0 |
| High School Diploma | $66,281 | $32,361 |
| College or Associate's Degree | $66,542 | $39,856 |
| Bachelor's Degree | $79,868 | $66,750 |
| Graduate Degree | $73,750 | $46,563 |
| Total | $67,473 | $45,909 |
Family Income in Johnson Creek
Family Income Brackets in Johnson Creek
According to the Johnson Creek family income data, there are 252 families falling into the $100,000 to $149,999 income range, which is the most common income bracket and makes up 29.0% of all families.
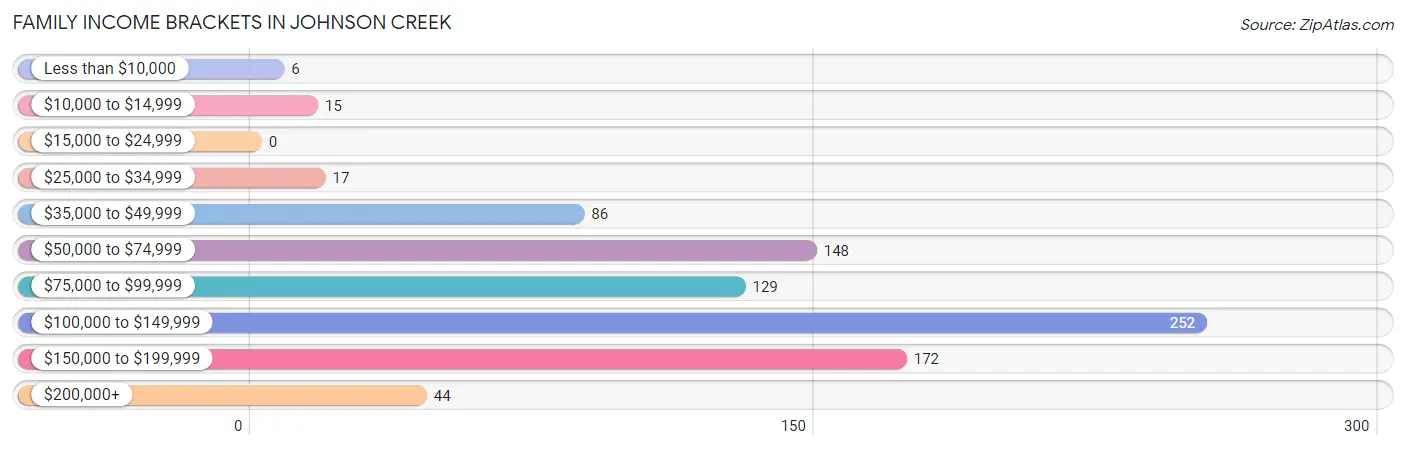
| Income Bracket | # Families | % Families |
| Less than $10,000 | 6 | 0.7% |
| $10,000 to $14,999 | 15 | 1.7% |
| $15,000 to $24,999 | 0 | 0.0% |
| $25,000 to $34,999 | 17 | 2.0% |
| $35,000 to $49,999 | 86 | 9.9% |
| $50,000 to $74,999 | 148 | 17.0% |
| $75,000 to $99,999 | 129 | 14.8% |
| $100,000 to $149,999 | 252 | 29.0% |
| $150,000 to $199,999 | 172 | 19.8% |
| $200,000+ | 44 | 5.1% |
Family Income by Famaliy Size in Johnson Creek
7+ person families (26 | 3.0%) account for the highest median family income in Johnson Creek with $193,523 per family, while 2-person families (359 | 41.3%) have the highest median income of $42,969 per family member.
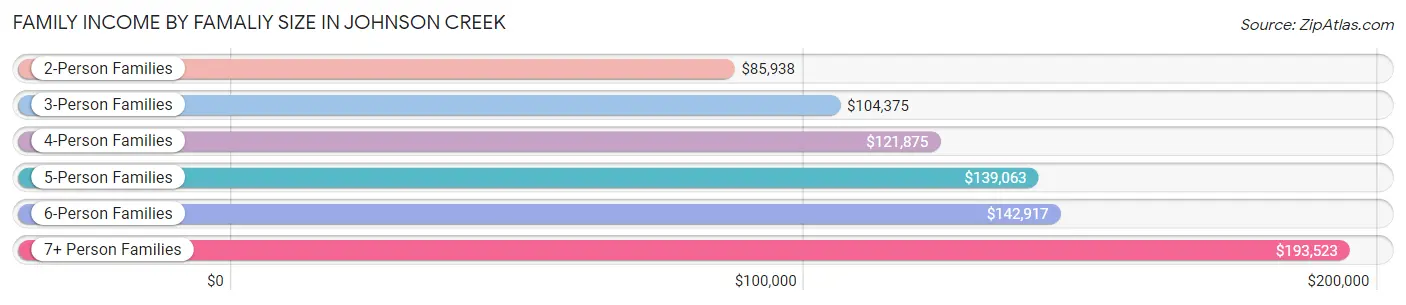
| Income Bracket | # Families | Median Income |
| 2-Person Families | 359 (41.3%) | $85,938 |
| 3-Person Families | 198 (22.8%) | $104,375 |
| 4-Person Families | 206 (23.7%) | $121,875 |
| 5-Person Families | 59 (6.8%) | $139,063 |
| 6-Person Families | 21 (2.4%) | $142,917 |
| 7+ Person Families | 26 (3.0%) | $193,523 |
| Total | 869 (100.0%) | $107,031 |
Family Income by Number of Earners in Johnson Creek
The median family income in Johnson Creek is $107,031, with families comprising 3+ earners (134) having the highest median family income of $142,000, while families with 1 earner (224) have the lowest median family income of $57,273, accounting for 15.4% and 25.8% of families, respectively.
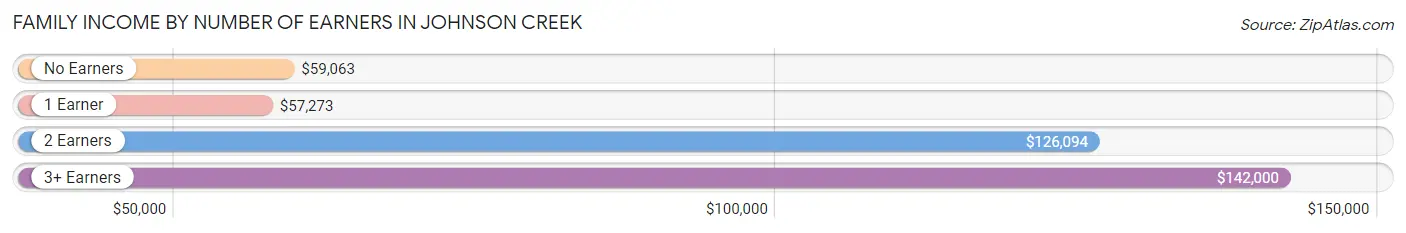
| Number of Earners | # Families | Median Income |
| No Earners | 45 (5.2%) | $59,063 |
| 1 Earner | 224 (25.8%) | $57,273 |
| 2 Earners | 466 (53.6%) | $126,094 |
| 3+ Earners | 134 (15.4%) | $142,000 |
| Total | 869 (100.0%) | $107,031 |
Household Income in Johnson Creek
Household Income Brackets in Johnson Creek
With 293 households falling in the category, the $100,000 to $149,999 income range is the most frequent in Johnson Creek, accounting for 25.8% of all households. In contrast, only 10 households (0.9%) fall into the less than $10,000 income bracket, making it the least populous group.
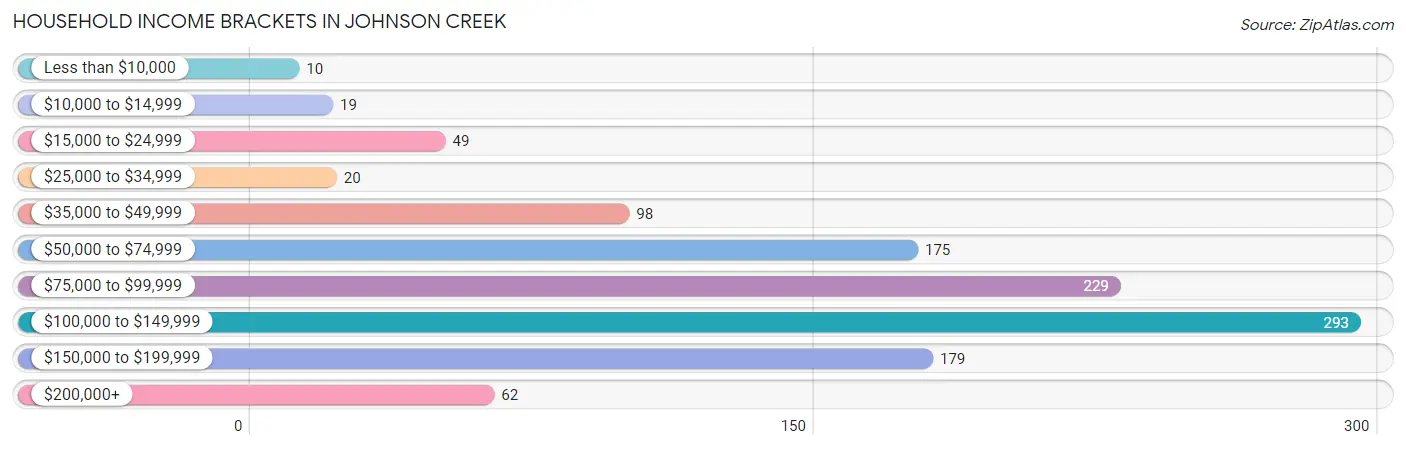
| Income Bracket | # Households | % Households |
| Less than $10,000 | 10 | 0.9% |
| $10,000 to $14,999 | 19 | 1.7% |
| $15,000 to $24,999 | 49 | 4.3% |
| $25,000 to $34,999 | 20 | 1.8% |
| $35,000 to $49,999 | 98 | 8.6% |
| $50,000 to $74,999 | 175 | 15.4% |
| $75,000 to $99,999 | 229 | 20.2% |
| $100,000 to $149,999 | 293 | 25.8% |
| $150,000 to $199,999 | 179 | 15.8% |
| $200,000+ | 62 | 5.5% |
Household Income by Householder Age in Johnson Creek
The median household income in Johnson Creek is $92,826, with the highest median household income of $114,167 found in the 25 to 44 years age bracket for the primary householder. A total of 418 households (36.9%) fall into this category. Meanwhile, the 65+ years age bracket for the primary householder has the lowest median household income of $64,943, with 171 households (15.1%) in this group.
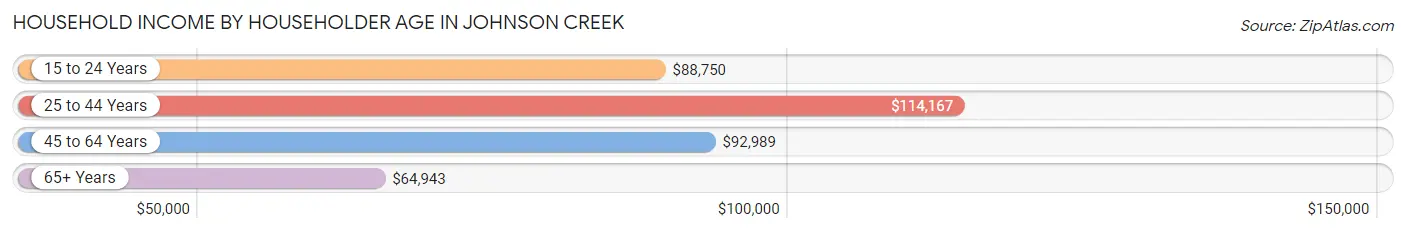
| Income Bracket | # Households | Median Income |
| 15 to 24 Years | 70 (6.2%) | $88,750 |
| 25 to 44 Years | 418 (36.9%) | $114,167 |
| 45 to 64 Years | 475 (41.9%) | $92,989 |
| 65+ Years | 171 (15.1%) | $64,943 |
| Total | 1,134 (100.0%) | $92,826 |
Poverty in Johnson Creek
Income Below Poverty by Sex and Age in Johnson Creek
With 4.4% poverty level for males and 7.4% for females among the residents of Johnson Creek, 6 to 11 year old males and 15 year old females are the most vulnerable to poverty, with 14 males (13.7%) and 13 females (100.0%) in their respective age groups living below the poverty level.
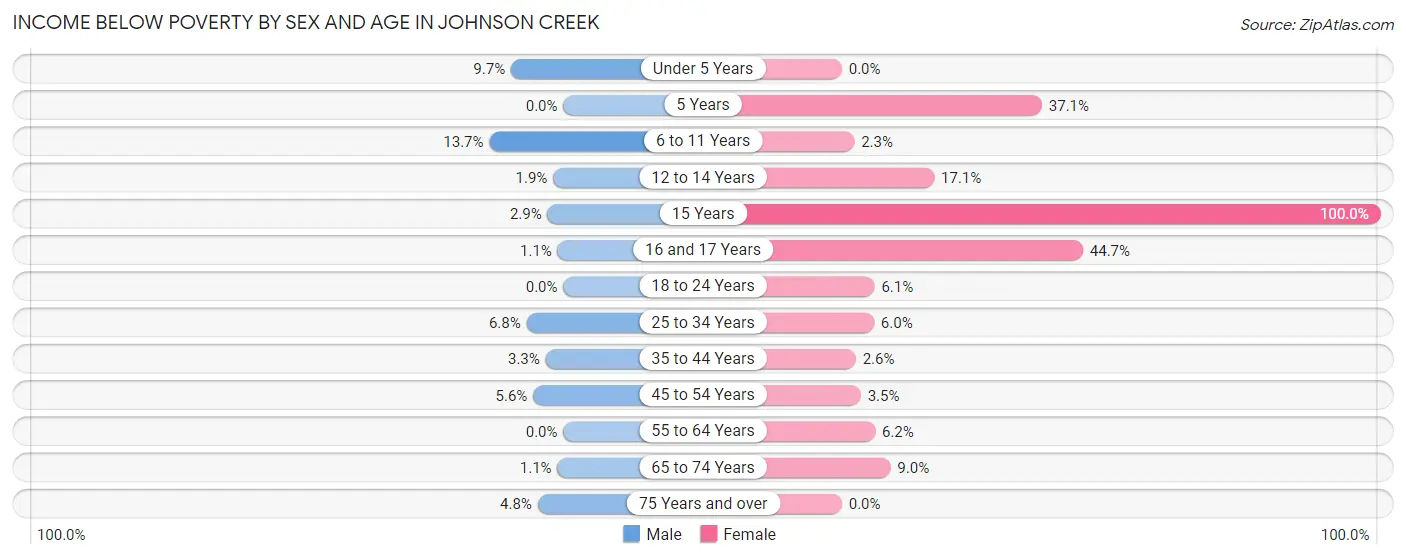
| Age Bracket | Male | Female |
| Under 5 Years | 21 (9.7%) | 0 (0.0%) |
| 5 Years | 0 (0.0%) | 13 (37.1%) |
| 6 to 11 Years | 14 (13.7%) | 3 (2.3%) |
| 12 to 14 Years | 1 (1.9%) | 6 (17.1%) |
| 15 Years | 1 (2.9%) | 13 (100.0%) |
| 16 and 17 Years | 1 (1.1%) | 17 (44.7%) |
| 18 to 24 Years | 0 (0.0%) | 14 (6.1%) |
| 25 to 34 Years | 14 (6.8%) | 14 (6.0%) |
| 35 to 44 Years | 8 (3.3%) | 6 (2.6%) |
| 45 to 54 Years | 14 (5.6%) | 5 (3.5%) |
| 55 to 64 Years | 0 (0.0%) | 13 (6.2%) |
| 65 to 74 Years | 1 (1.1%) | 12 (9.0%) |
| 75 Years and over | 2 (4.8%) | 0 (0.0%) |
| Total | 77 (4.4%) | 116 (7.4%) |
Income Above Poverty by Sex and Age in Johnson Creek
According to the poverty statistics in Johnson Creek, males aged 5 years and females aged under 5 years are the age groups that are most secure financially, with 100.0% of males and 100.0% of females in these age groups living above the poverty line.
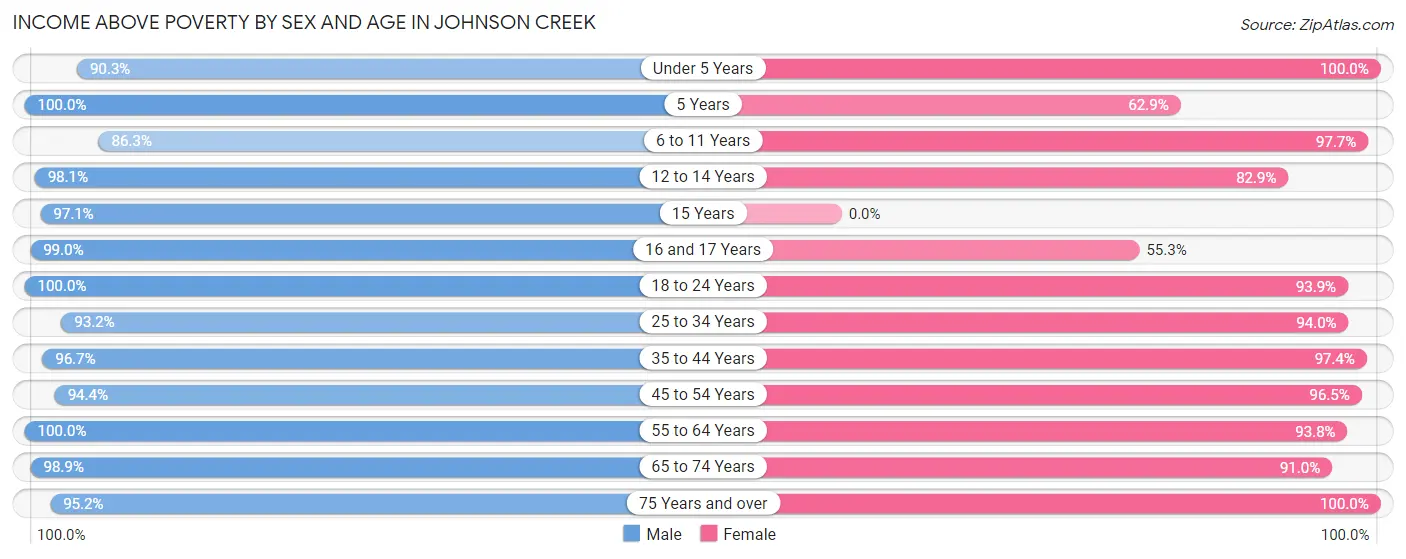
| Age Bracket | Male | Female |
| Under 5 Years | 195 (90.3%) | 103 (100.0%) |
| 5 Years | 17 (100.0%) | 22 (62.9%) |
| 6 to 11 Years | 88 (86.3%) | 127 (97.7%) |
| 12 to 14 Years | 52 (98.1%) | 29 (82.9%) |
| 15 Years | 33 (97.1%) | 0 (0.0%) |
| 16 and 17 Years | 94 (99.0%) | 21 (55.3%) |
| 18 to 24 Years | 179 (100.0%) | 217 (93.9%) |
| 25 to 34 Years | 191 (93.2%) | 221 (94.0%) |
| 35 to 44 Years | 235 (96.7%) | 227 (97.4%) |
| 45 to 54 Years | 236 (94.4%) | 137 (96.5%) |
| 55 to 64 Years | 226 (100.0%) | 198 (93.8%) |
| 65 to 74 Years | 90 (98.9%) | 121 (91.0%) |
| 75 Years and over | 40 (95.2%) | 37 (100.0%) |
| Total | 1,676 (95.6%) | 1,460 (92.6%) |
Income Below Poverty Among Married-Couple Families in Johnson Creek
The poverty statistics for married-couple families in Johnson Creek show that 2.9% or 20 of the total 696 families live below the poverty line. Families with 3 or 4 children have the highest poverty rate of 16.7%, comprising of 11 families. On the other hand, families with no children have the lowest poverty rate of 0.0%, which includes 0 families.
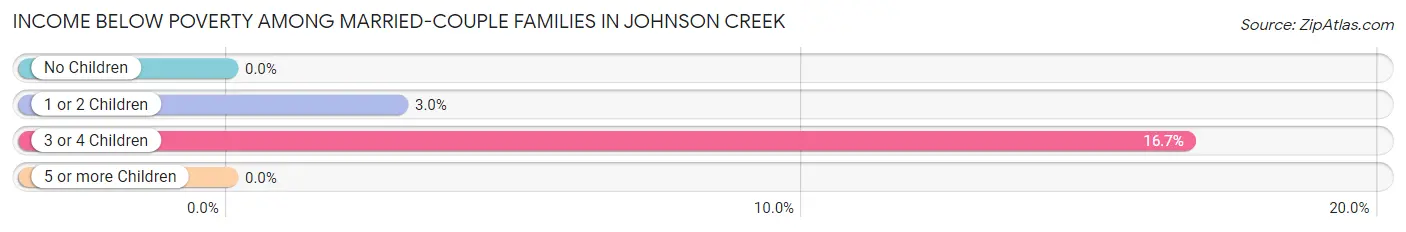
| Children | Above Poverty | Below Poverty |
| No Children | 323 (100.0%) | 0 (0.0%) |
| 1 or 2 Children | 295 (97.0%) | 9 (3.0%) |
| 3 or 4 Children | 55 (83.3%) | 11 (16.7%) |
| 5 or more Children | 3 (100.0%) | 0 (0.0%) |
| Total | 676 (97.1%) | 20 (2.9%) |
Income Below Poverty Among Single-Parent Households in Johnson Creek
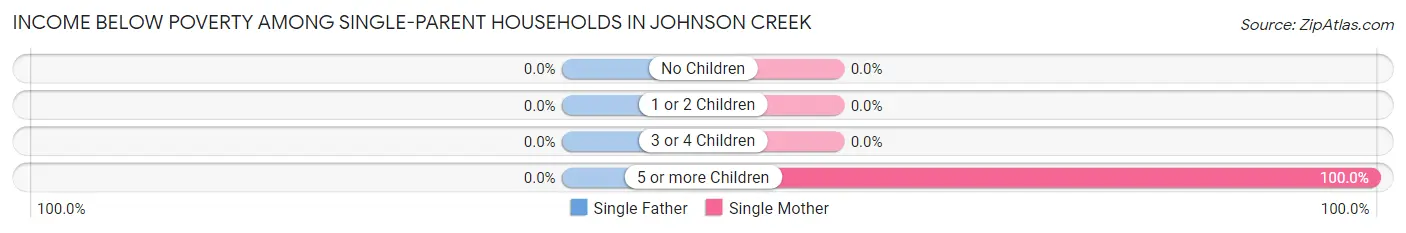
| Children | Single Father | Single Mother |
| No Children | 0 (0.0%) | 0 (0.0%) |
| 1 or 2 Children | 0 (0.0%) | 0 (0.0%) |
| 3 or 4 Children | 0 (0.0%) | 0 (0.0%) |
| 5 or more Children | 0 (0.0%) | 1 (100.0%) |
| Total | 0 (0.0%) | 1 (0.9%) |
Income Below Poverty Among Married-Couple vs Single-Parent Households in Johnson Creek
The poverty data for Johnson Creek shows that 20 of the married-couple family households (2.9%) and 1 of the single-parent households (0.6%) are living below the poverty level. Within the married-couple family households, those with 3 or 4 children have the highest poverty rate, with 11 households (16.7%) falling below the poverty line. Among the single-parent households, those with 5 or more children have the highest poverty rate, with 1 household (100.0%) living below poverty.
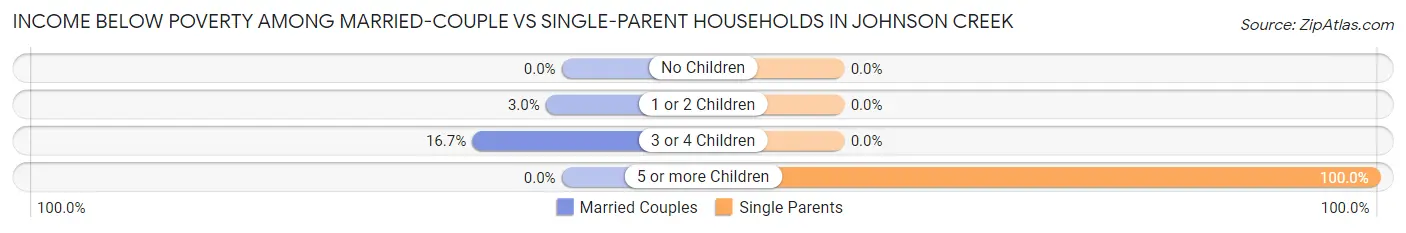
| Children | Married-Couple Families | Single-Parent Households |
| No Children | 0 (0.0%) | 0 (0.0%) |
| 1 or 2 Children | 9 (3.0%) | 0 (0.0%) |
| 3 or 4 Children | 11 (16.7%) | 0 (0.0%) |
| 5 or more Children | 0 (0.0%) | 1 (100.0%) |
| Total | 20 (2.9%) | 1 (0.6%) |
Race in Johnson Creek
The most populous races in Johnson Creek are White / Caucasian (2,966 | 88.9%), Two or more Races (172 | 5.1%), and Asian (143 | 4.3%).
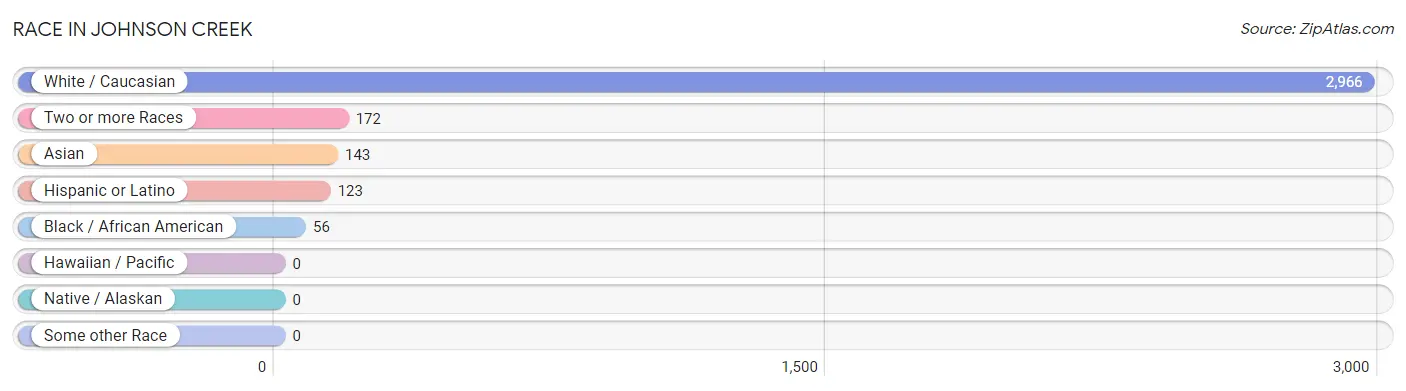
| Race | # Population | % Population |
| Asian | 143 | 4.3% |
| Black / African American | 56 | 1.7% |
| Hawaiian / Pacific | 0 | 0.0% |
| Hispanic or Latino | 123 | 3.7% |
| Native / Alaskan | 0 | 0.0% |
| White / Caucasian | 2,966 | 88.9% |
| Two or more Races | 172 | 5.1% |
| Some other Race | 0 | 0.0% |
| Total | 3,337 | 100.0% |
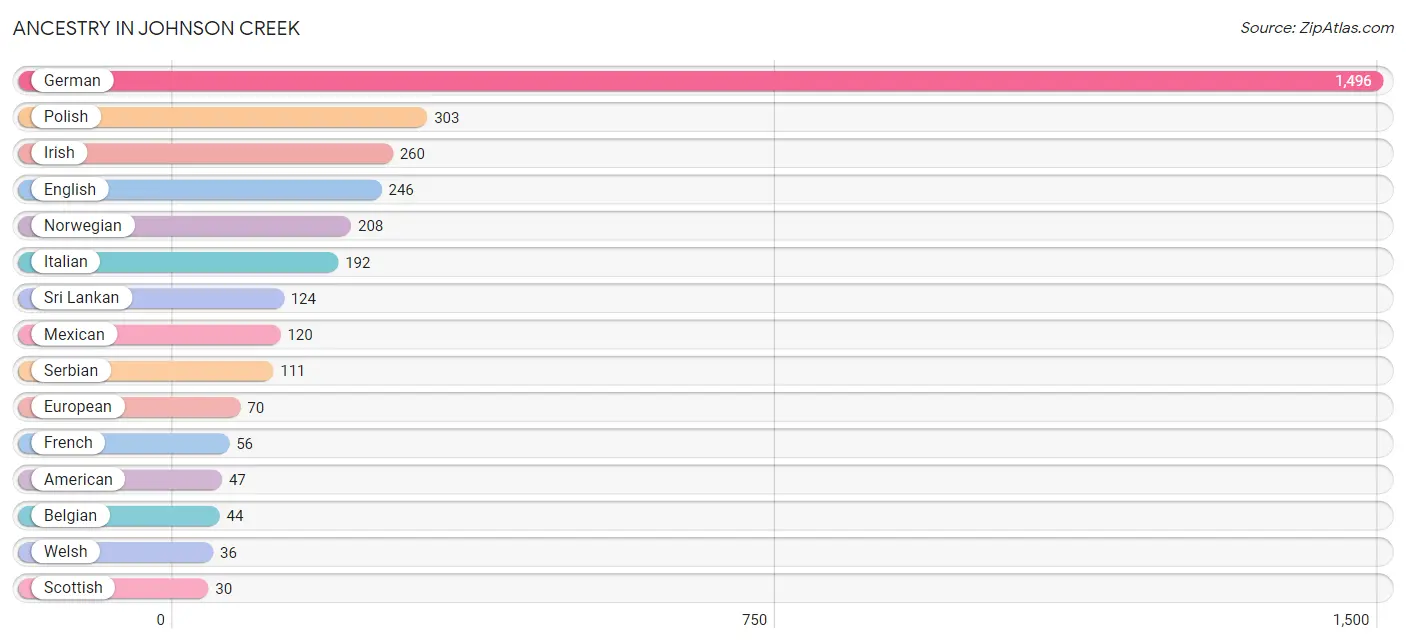
Ancestry in Johnson Creek
The most populous ancestries reported in Johnson Creek are German (1,496 | 44.8%), Polish (303 | 9.1%), Irish (260 | 7.8%), English (246 | 7.4%), and Norwegian (208 | 6.2%), together accounting for 75.3% of all Johnson Creek residents.
| Ancestry | # Population | % Population |
| American | 47 | 1.4% |
| Belgian | 44 | 1.3% |
| Bhutanese | 12 | 0.4% |
| Brazilian | 6 | 0.2% |
| British | 9 | 0.3% |
| Burmese | 3 | 0.1% |
| Celtic | 10 | 0.3% |
| Cherokee | 14 | 0.4% |
| Croatian | 16 | 0.5% |
| Czech | 28 | 0.8% |
| Danish | 23 | 0.7% |
| Dutch | 12 | 0.4% |
| Eastern European | 12 | 0.4% |
| English | 246 | 7.4% |
| European | 70 | 2.1% |
| Finnish | 4 | 0.1% |
| French | 56 | 1.7% |
| French Canadian | 9 | 0.3% |
| German | 1,496 | 44.8% |
| Greek | 11 | 0.3% |
| Indian (Asian) | 13 | 0.4% |
| Irish | 260 | 7.8% |
| Italian | 192 | 5.8% |
| Korean | 2 | 0.1% |
| Latvian | 11 | 0.3% |
| Mexican | 120 | 3.6% |
| Mexican American Indian | 9 | 0.3% |
| Northern European | 4 | 0.1% |
| Norwegian | 208 | 6.2% |
| Polish | 303 | 9.1% |
| Russian | 18 | 0.5% |
| Scotch-Irish | 9 | 0.3% |
| Scottish | 30 | 0.9% |
| Serbian | 111 | 3.3% |
| Slavic | 1 | 0.0% |
| Slovene | 3 | 0.1% |
| Spanish | 3 | 0.1% |
| Sri Lankan | 124 | 3.7% |
| Swedish | 17 | 0.5% |
| Swiss | 17 | 0.5% |
| Welsh | 36 | 1.1% | View All 41 Rows |
Immigrants in Johnson Creek
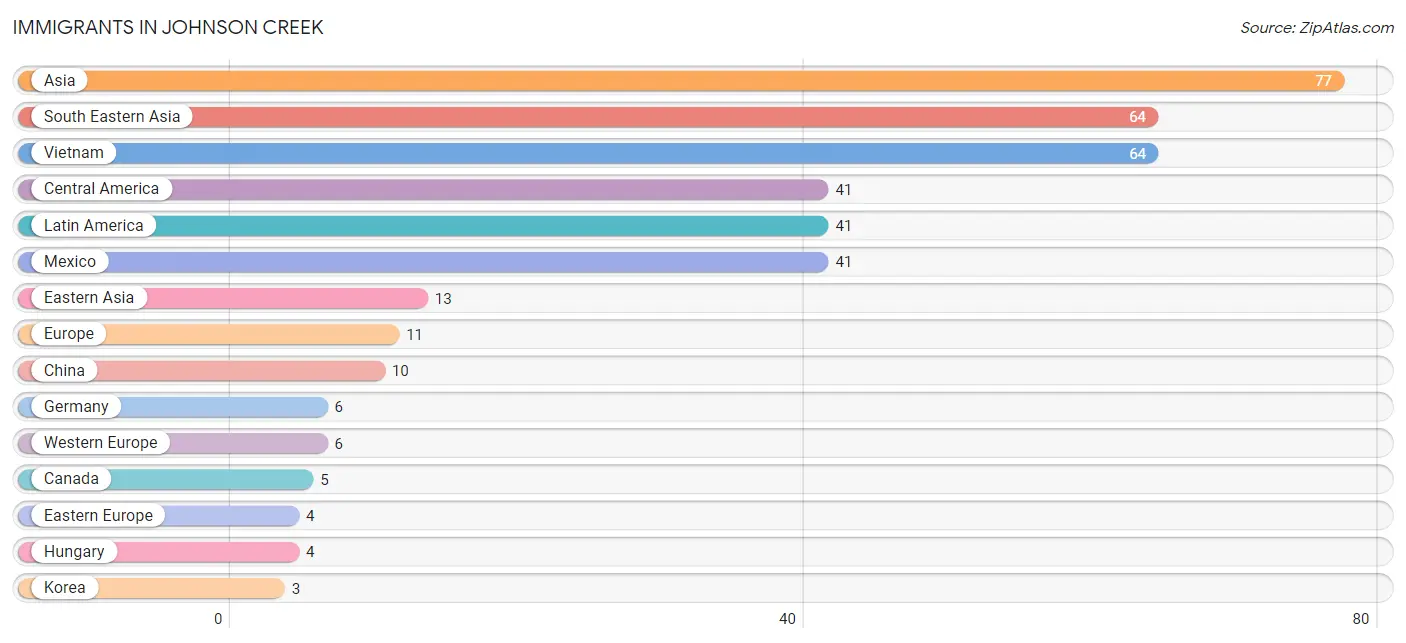
The most numerous immigrant groups reported in Johnson Creek came from Asia (77 | 2.3%), South Eastern Asia (64 | 1.9%), Vietnam (64 | 1.9%), Central America (41 | 1.2%), and Latin America (41 | 1.2%), together accounting for 8.6% of all Johnson Creek residents.
| Immigration Origin | # Population | % Population |
| Asia | 77 | 2.3% |
| Canada | 5 | 0.2% |
| Central America | 41 | 1.2% |
| China | 10 | 0.3% |
| Eastern Asia | 13 | 0.4% |
| Eastern Europe | 4 | 0.1% |
| Europe | 11 | 0.3% |
| Germany | 6 | 0.2% |
| Hungary | 4 | 0.1% |
| Italy | 1 | 0.0% |
| Korea | 3 | 0.1% |
| Latin America | 41 | 1.2% |
| Mexico | 41 | 1.2% |
| South Eastern Asia | 64 | 1.9% |
| Southern Europe | 1 | 0.0% |
| Vietnam | 64 | 1.9% |
| Western Europe | 6 | 0.2% | View All 17 Rows |
Sex and Age in Johnson Creek
Sex and Age in Johnson Creek
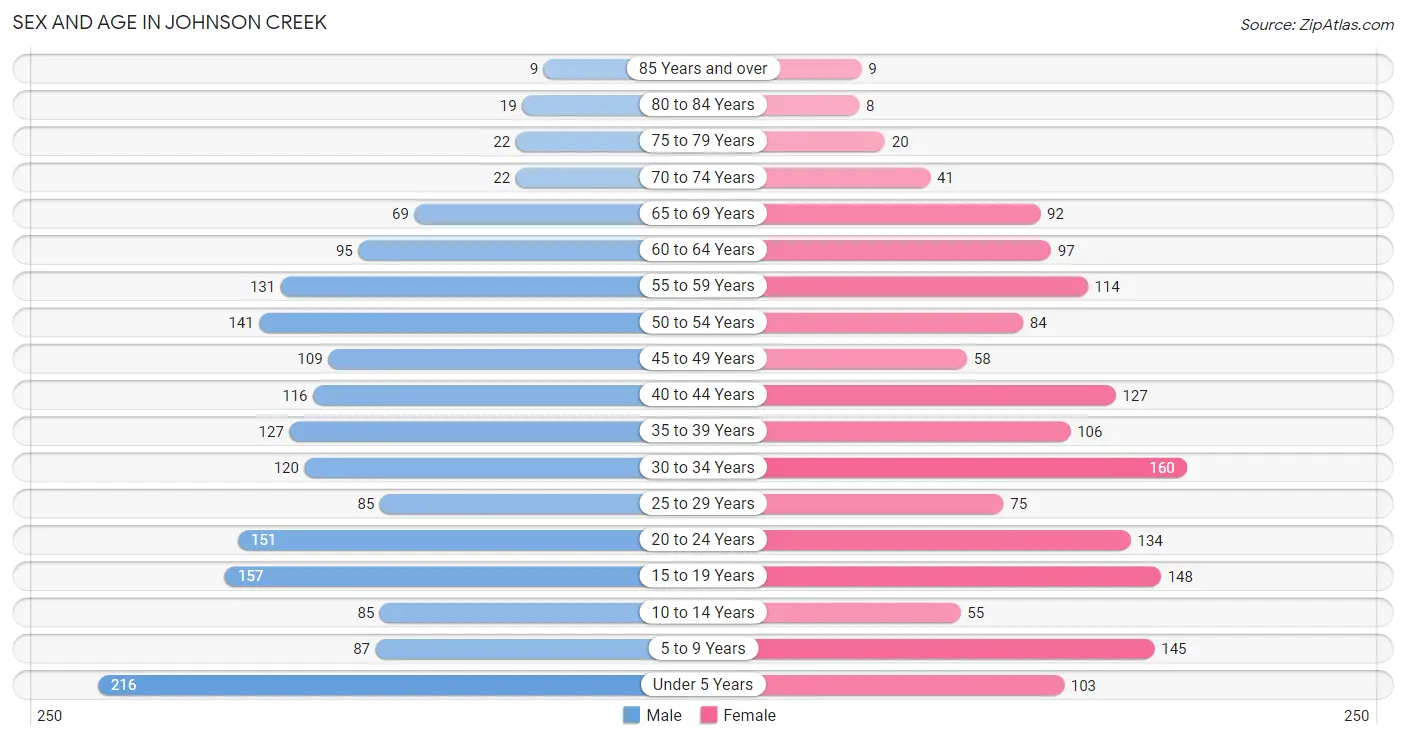
The most populous age groups in Johnson Creek are Under 5 Years (216 | 12.3%) for men and 30 to 34 Years (160 | 10.2%) for women.
| Age Bracket | Male | Female |
| Under 5 Years | 216 (12.3%) | 103 (6.5%) |
| 5 to 9 Years | 87 (4.9%) | 145 (9.2%) |
| 10 to 14 Years | 85 (4.8%) | 55 (3.5%) |
| 15 to 19 Years | 157 (8.9%) | 148 (9.4%) |
| 20 to 24 Years | 151 (8.6%) | 134 (8.5%) |
| 25 to 29 Years | 85 (4.8%) | 75 (4.8%) |
| 30 to 34 Years | 120 (6.8%) | 160 (10.2%) |
| 35 to 39 Years | 127 (7.2%) | 106 (6.7%) |
| 40 to 44 Years | 116 (6.6%) | 127 (8.1%) |
| 45 to 49 Years | 109 (6.2%) | 58 (3.7%) |
| 50 to 54 Years | 141 (8.0%) | 84 (5.3%) |
| 55 to 59 Years | 131 (7.4%) | 114 (7.2%) |
| 60 to 64 Years | 95 (5.4%) | 97 (6.1%) |
| 65 to 69 Years | 69 (3.9%) | 92 (5.8%) |
| 70 to 74 Years | 22 (1.3%) | 41 (2.6%) |
| 75 to 79 Years | 22 (1.3%) | 20 (1.3%) |
| 80 to 84 Years | 19 (1.1%) | 8 (0.5%) |
| 85 Years and over | 9 (0.5%) | 9 (0.6%) |
| Total | 1,761 (100.0%) | 1,576 (100.0%) |
Families and Households in Johnson Creek
Median Family Size in Johnson Creek
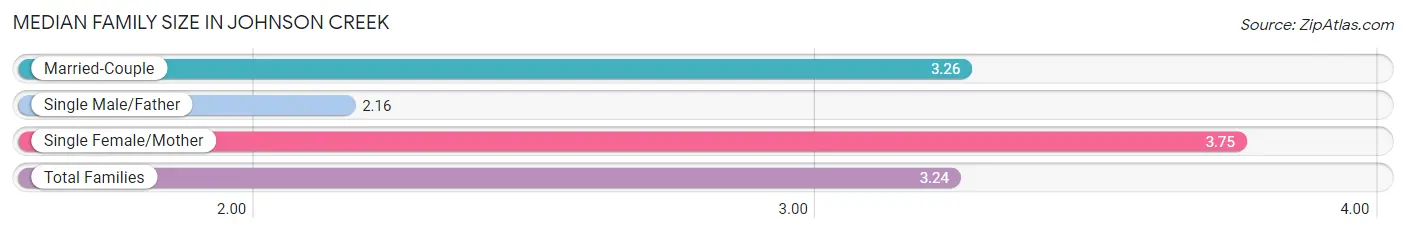
The median family size in Johnson Creek is 3.24 persons per family, with single female/mother families (106 | 12.2%) accounting for the largest median family size of 3.75 persons per family. On the other hand, single male/father families (67 | 7.7%) represent the smallest median family size with 2.16 persons per family.
| Family Type | # Families | Family Size |
| Married-Couple | 696 (80.1%) | 3.26 |
| Single Male/Father | 67 (7.7%) | 2.16 |
| Single Female/Mother | 106 (12.2%) | 3.75 |
| Total Families | 869 (100.0%) | 3.24 |
Median Household Size in Johnson Creek
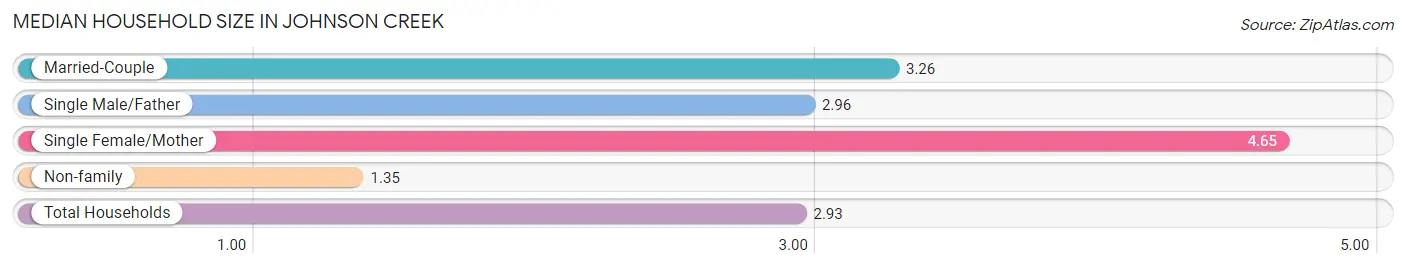
The median household size in Johnson Creek is 2.93 persons per household, with single female/mother households (106 | 9.3%) accounting for the largest median household size of 4.65 persons per household. non-family households (265 | 23.4%) represent the smallest median household size with 1.35 persons per household.
| Household Type | # Households | Household Size |
| Married-Couple | 696 (61.4%) | 3.26 |
| Single Male/Father | 67 (5.9%) | 2.96 |
| Single Female/Mother | 106 (9.3%) | 4.65 |
| Non-family | 265 (23.4%) | 1.35 |
| Total Households | 1,134 (100.0%) | 2.93 |
Household Size by Marriage Status in Johnson Creek
Out of a total of 1,134 households in Johnson Creek, 869 (76.6%) are family households, while 265 (23.4%) are nonfamily households. The most numerous type of family households are 2-person households, comprising 304, and the most common type of nonfamily households are 1-person households, comprising 187.
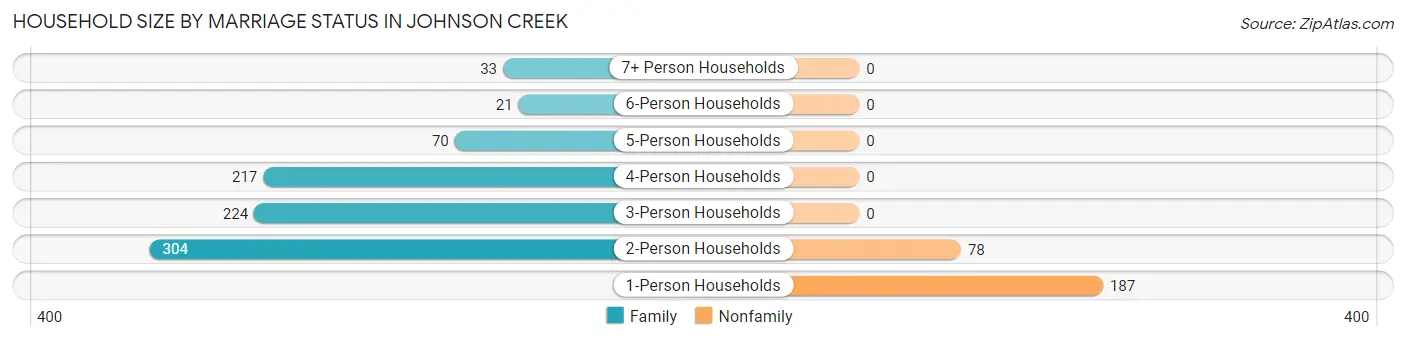
| Household Size | Family Households | Nonfamily Households |
| 1-Person Households | - | 187 (16.5%) |
| 2-Person Households | 304 (26.8%) | 78 (6.9%) |
| 3-Person Households | 224 (19.8%) | 0 (0.0%) |
| 4-Person Households | 217 (19.1%) | 0 (0.0%) |
| 5-Person Households | 70 (6.2%) | 0 (0.0%) |
| 6-Person Households | 21 (1.8%) | 0 (0.0%) |
| 7+ Person Households | 33 (2.9%) | 0 (0.0%) |
| Total | 869 (76.6%) | 265 (23.4%) |
Female Fertility in Johnson Creek
Fertility by Age in Johnson Creek
Average fertility rate in Johnson Creek is 74.0 births per 1,000 women. Women in the age bracket of 20 to 34 years have the highest fertility rate with 136.0 births per 1,000 women. Women in the age bracket of 20 to 34 years acount for 82.0% of all women with births.
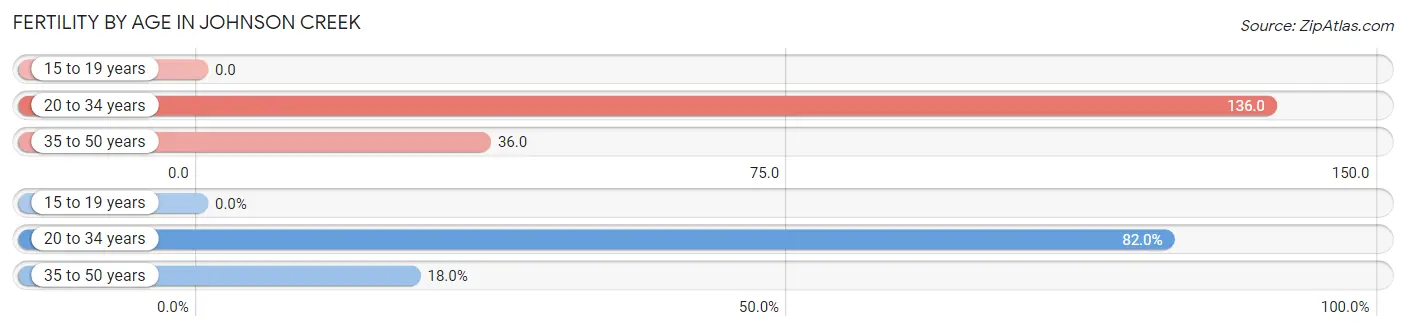
| Age Bracket | Women with Births | Births / 1,000 Women |
| 15 to 19 years | 0 (0.0%) | 0.0 |
| 20 to 34 years | 50 (82.0%) | 136.0 |
| 35 to 50 years | 11 (18.0%) | 36.0 |
| Total | 61 (100.0%) | 74.0 |
Fertility by Age by Marriage Status in Johnson Creek
86.9% of women with births (61) in Johnson Creek are married. The highest percentage of unmarried women with births falls into 20 to 34 years age bracket with 14.0% of them unmarried at the time of birth, while the lowest percentage of unmarried women with births belong to 35 to 50 years age bracket with 9.1% of them unmarried.
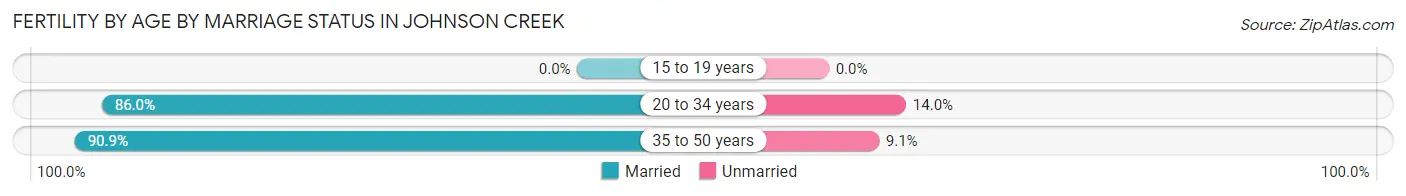
| Age Bracket | Married | Unmarried |
| 15 to 19 years | 0 (0.0%) | 0 (0.0%) |
| 20 to 34 years | 43 (86.0%) | 7 (14.0%) |
| 35 to 50 years | 10 (90.9%) | 1 (9.1%) |
| Total | 53 (86.9%) | 8 (13.1%) |
Fertility by Education in Johnson Creek
Average fertility rate in Johnson Creek is 74.0 births per 1,000 women. Women with the education attainment of bachelor's degree have the highest fertility rate of 217.0 births per 1,000 women, while women with the education attainment of less than high school have the lowest fertility at 13.0 births per 1,000 women. Women with the education attainment of bachelor's degree represent 57.4% of all women with births.
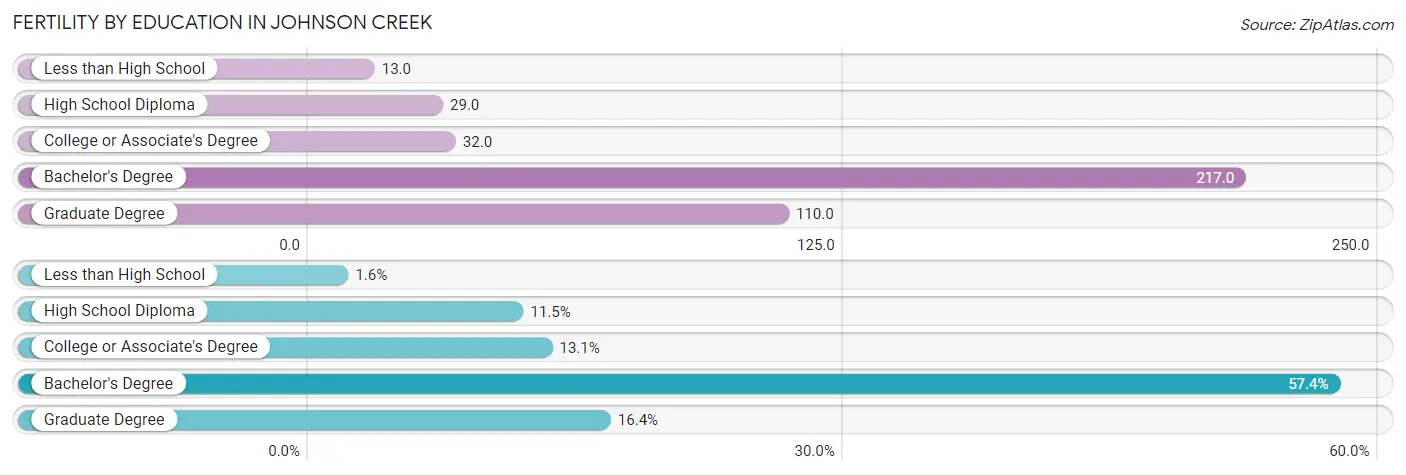
| Educational Attainment | Women with Births | Births / 1,000 Women |
| Less than High School | 1 (1.6%) | 13.0 |
| High School Diploma | 7 (11.5%) | 29.0 |
| College or Associate's Degree | 8 (13.1%) | 32.0 |
| Bachelor's Degree | 35 (57.4%) | 217.0 |
| Graduate Degree | 10 (16.4%) | 110.0 |
| Total | 61 (100.0%) | 74.0 |
Fertility by Education by Marriage Status in Johnson Creek
13.1% of women with births in Johnson Creek are unmarried. Women with the educational attainment of college or associate's degree are most likely to be married with 100.0% of them married at childbirth, while women with the educational attainment of less than high school are least likely to be married with 100.0% of them unmarried at childbirth.
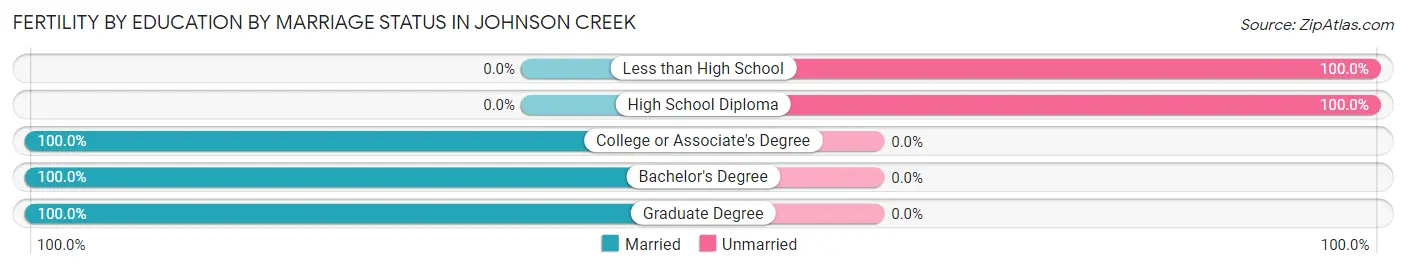
| Educational Attainment | Married | Unmarried |
| Less than High School | 0 (0.0%) | 1 (100.0%) |
| High School Diploma | 0 (0.0%) | 7 (100.0%) |
| College or Associate's Degree | 8 (100.0%) | 0 (0.0%) |
| Bachelor's Degree | 35 (100.0%) | 0 (0.0%) |
| Graduate Degree | 10 (100.0%) | 0 (0.0%) |
| Total | 53 (86.9%) | 8 (13.1%) |
Employment Characteristics in Johnson Creek
Employment by Class of Employer in Johnson Creek
Among the 1,901 employed individuals in Johnson Creek, private company employees (1,454 | 76.5%), not-for-profit organizations (137 | 7.2%), and local government employees (112 | 5.9%) make up the most common classes of employment.
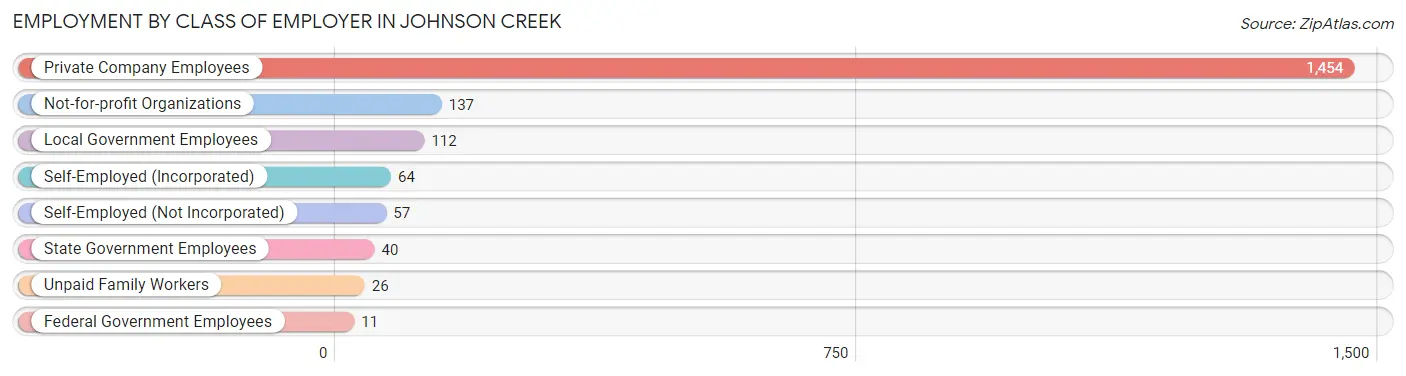
| Employer Class | # Employees | % Employees |
| Private Company Employees | 1,454 | 76.5% |
| Self-Employed (Incorporated) | 64 | 3.4% |
| Self-Employed (Not Incorporated) | 57 | 3.0% |
| Not-for-profit Organizations | 137 | 7.2% |
| Local Government Employees | 112 | 5.9% |
| State Government Employees | 40 | 2.1% |
| Federal Government Employees | 11 | 0.6% |
| Unpaid Family Workers | 26 | 1.4% |
| Total | 1,901 | 100.0% |
Employment Status by Age in Johnson Creek
According to the labor force statistics for Johnson Creek, out of the total population over 16 years of age (2,599), 74.7% or 1,941 individuals are in the labor force, with 2.1% or 41 of them unemployed. The age group with the highest labor force participation rate is 20 to 24 years, with 100.0% or 285 individuals in the labor force. Within the labor force, the 16 to 19 years age range has the highest percentage of unemployed individuals, with 13.7% or 21 of them being unemployed.
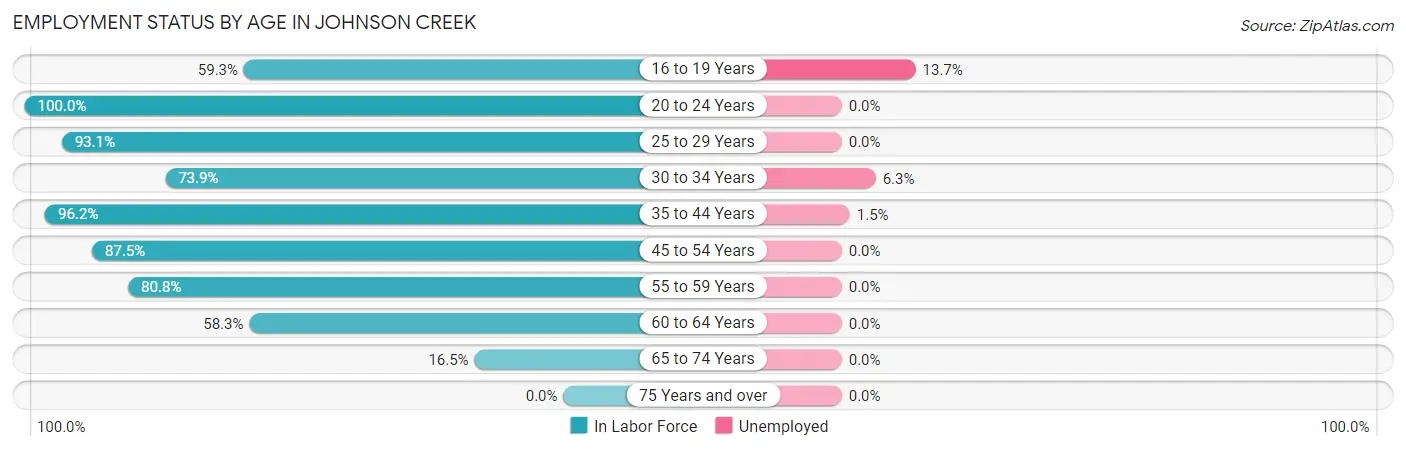
| Age Bracket | In Labor Force | Unemployed |
| 16 to 19 Years | 153 (59.3%) | 21 (13.7%) |
| 20 to 24 Years | 285 (100.0%) | 0 (0.0%) |
| 25 to 29 Years | 149 (93.1%) | 0 (0.0%) |
| 30 to 34 Years | 207 (73.9%) | 13 (6.3%) |
| 35 to 44 Years | 458 (96.2%) | 7 (1.5%) |
| 45 to 54 Years | 343 (87.5%) | 0 (0.0%) |
| 55 to 59 Years | 198 (80.8%) | 0 (0.0%) |
| 60 to 64 Years | 112 (58.3%) | 0 (0.0%) |
| 65 to 74 Years | 37 (16.5%) | 0 (0.0%) |
| 75 Years and over | 0 (0.0%) | 0 (0.0%) |
| Total | 1,941 (74.7%) | 41 (2.1%) |
Employment Status by Educational Attainment in Johnson Creek
According to labor force statistics for Johnson Creek, 84.1% of individuals (1,468) out of the total population between 25 and 64 years of age (1,745) are in the labor force, with 1.4% or 21 of them being unemployed. The group with the highest labor force participation rate are those with the educational attainment of bachelor's degree or higher, with 94.4% or 556 individuals in the labor force. Within the labor force, individuals with less than high school education have the highest percentage of unemployment, with 16.0% or 16 of them being unemployed.
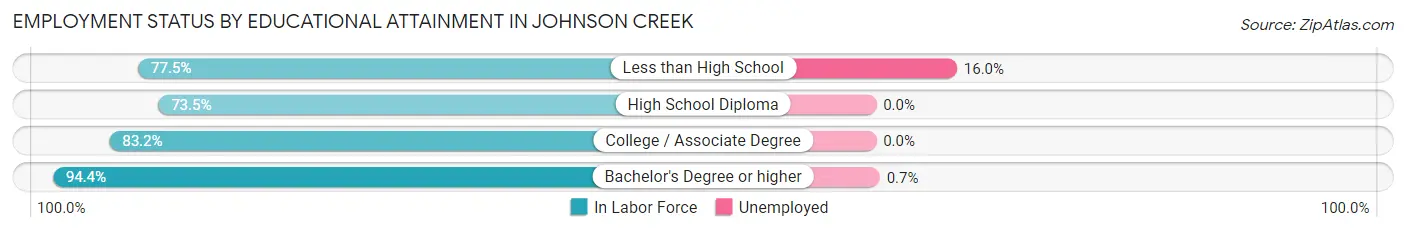
| Educational Attainment | In Labor Force | Unemployed |
| Less than High School | 100 (77.5%) | 21 (16.0%) |
| High School Diploma | 327 (73.5%) | 0 (0.0%) |
| College / Associate Degree | 484 (83.2%) | 0 (0.0%) |
| Bachelor's Degree or higher | 556 (94.4%) | 4 (0.7%) |
| Total | 1,468 (84.1%) | 24 (1.4%) |
Employment Occupations by Sex in Johnson Creek
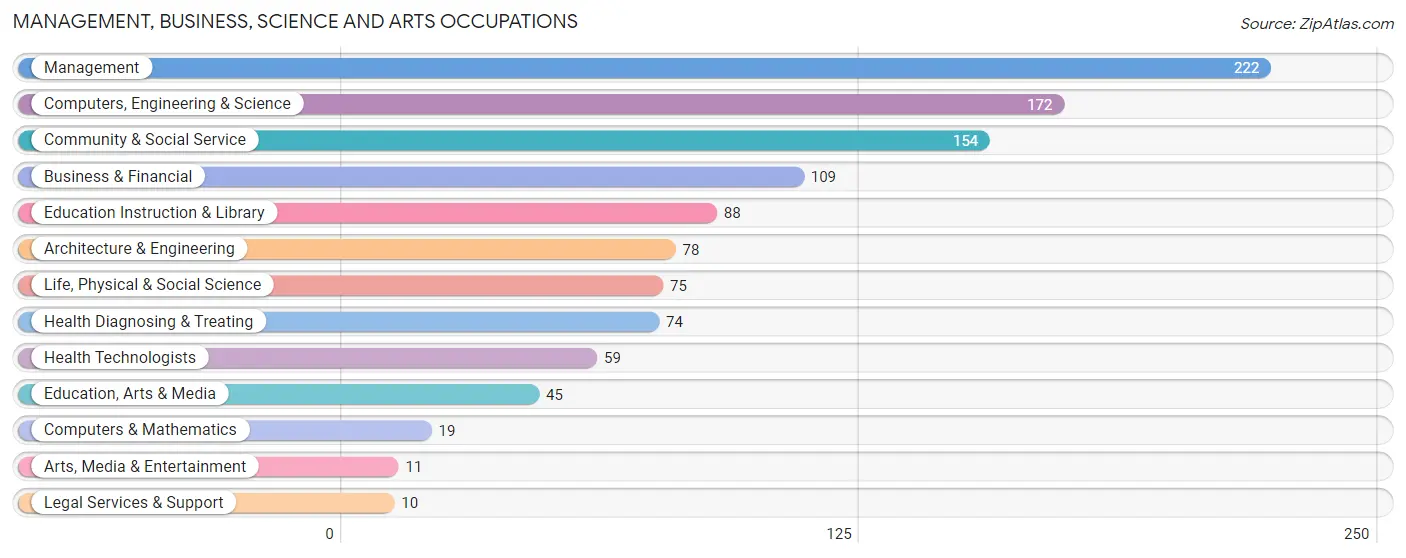
Management, Business, Science and Arts Occupations
The most common Management, Business, Science and Arts occupations in Johnson Creek are Management (222 | 11.7%), Computers, Engineering & Science (172 | 9.0%), Community & Social Service (154 | 8.1%), Business & Financial (109 | 5.7%), and Education Instruction & Library (88 | 4.6%).
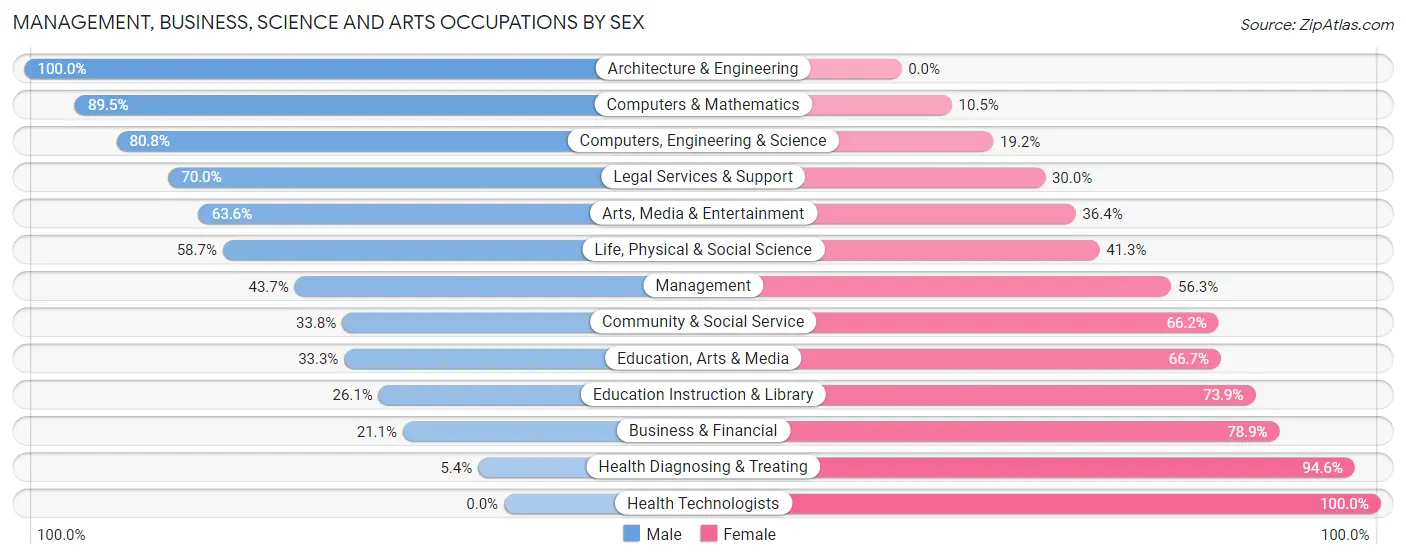
Management, Business, Science and Arts Occupations by Sex
Within the Management, Business, Science and Arts occupations in Johnson Creek, the most male-oriented occupations are Architecture & Engineering (100.0%), Computers & Mathematics (89.5%), and Computers, Engineering & Science (80.8%), while the most female-oriented occupations are Health Technologists (100.0%), Health Diagnosing & Treating (94.6%), and Business & Financial (78.9%).
| Occupation | Male | Female |
| Management | 97 (43.7%) | 125 (56.3%) |
| Business & Financial | 23 (21.1%) | 86 (78.9%) |
| Computers, Engineering & Science | 139 (80.8%) | 33 (19.2%) |
| Computers & Mathematics | 17 (89.5%) | 2 (10.5%) |
| Architecture & Engineering | 78 (100.0%) | 0 (0.0%) |
| Life, Physical & Social Science | 44 (58.7%) | 31 (41.3%) |
| Community & Social Service | 52 (33.8%) | 102 (66.2%) |
| Education, Arts & Media | 15 (33.3%) | 30 (66.7%) |
| Legal Services & Support | 7 (70.0%) | 3 (30.0%) |
| Education Instruction & Library | 23 (26.1%) | 65 (73.9%) |
| Arts, Media & Entertainment | 7 (63.6%) | 4 (36.4%) |
| Health Diagnosing & Treating | 4 (5.4%) | 70 (94.6%) |
| Health Technologists | 0 (0.0%) | 59 (100.0%) |
| Total (Category) | 315 (43.1%) | 416 (56.9%) |
| Total (Overall) | 1,063 (55.9%) | 838 (44.1%) |
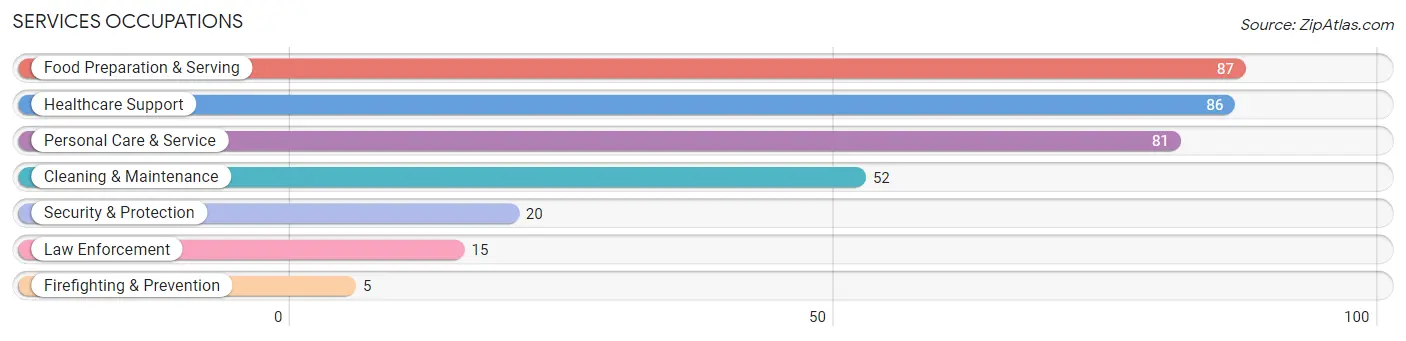
Services Occupations
The most common Services occupations in Johnson Creek are Food Preparation & Serving (87 | 4.6%), Healthcare Support (86 | 4.5%), Personal Care & Service (81 | 4.3%), Cleaning & Maintenance (52 | 2.7%), and Security & Protection (20 | 1.1%).
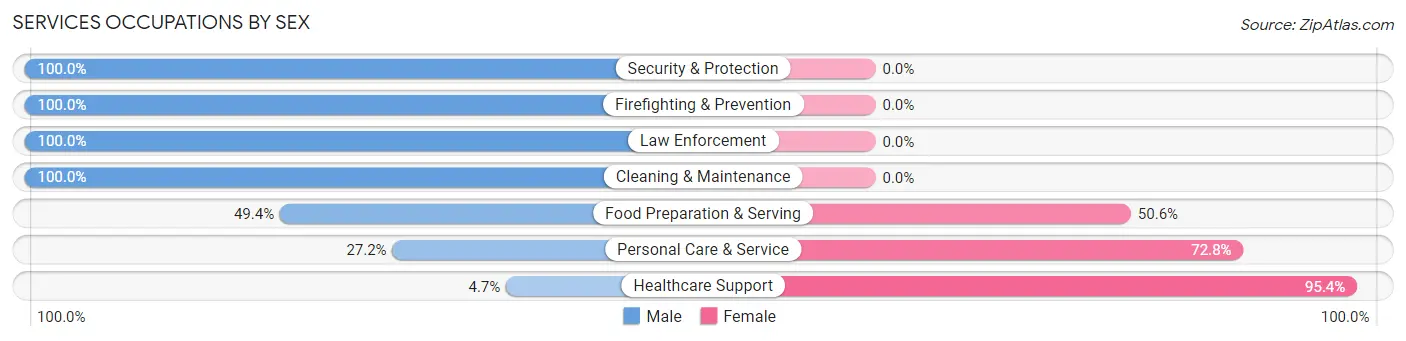
Services Occupations by Sex
Within the Services occupations in Johnson Creek, the most male-oriented occupations are Security & Protection (100.0%), Firefighting & Prevention (100.0%), and Law Enforcement (100.0%), while the most female-oriented occupations are Healthcare Support (95.4%), Personal Care & Service (72.8%), and Food Preparation & Serving (50.6%).
| Occupation | Male | Female |
| Healthcare Support | 4 (4.6%) | 82 (95.4%) |
| Security & Protection | 20 (100.0%) | 0 (0.0%) |
| Firefighting & Prevention | 5 (100.0%) | 0 (0.0%) |
| Law Enforcement | 15 (100.0%) | 0 (0.0%) |
| Food Preparation & Serving | 43 (49.4%) | 44 (50.6%) |
| Cleaning & Maintenance | 52 (100.0%) | 0 (0.0%) |
| Personal Care & Service | 22 (27.2%) | 59 (72.8%) |
| Total (Category) | 141 (43.2%) | 185 (56.8%) |
| Total (Overall) | 1,063 (55.9%) | 838 (44.1%) |
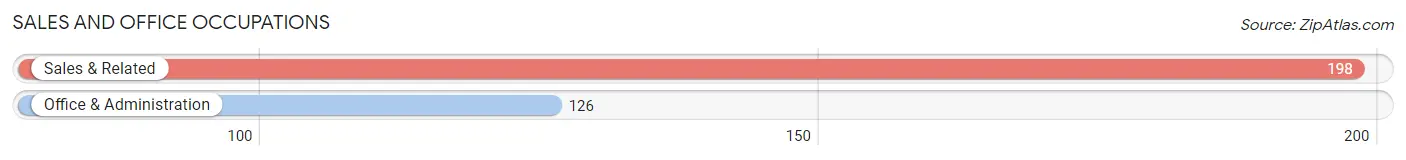
Sales and Office Occupations
The most common Sales and Office occupations in Johnson Creek are Sales & Related (198 | 10.4%), and Office & Administration (126 | 6.6%).
Sales and Office Occupations by Sex
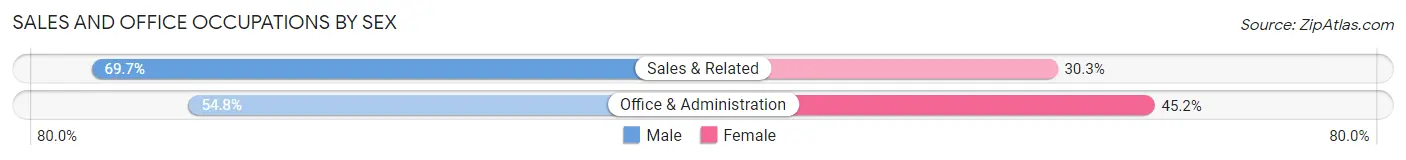
| Occupation | Male | Female |
| Sales & Related | 138 (69.7%) | 60 (30.3%) |
| Office & Administration | 69 (54.8%) | 57 (45.2%) |
| Total (Category) | 207 (63.9%) | 117 (36.1%) |
| Total (Overall) | 1,063 (55.9%) | 838 (44.1%) |
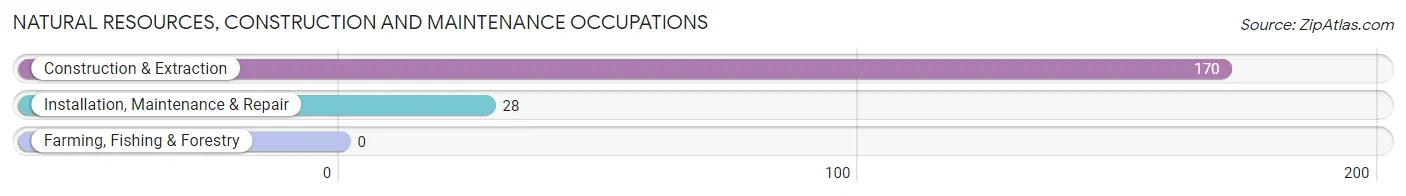
Natural Resources, Construction and Maintenance Occupations
The most common Natural Resources, Construction and Maintenance occupations in Johnson Creek are Construction & Extraction (170 | 8.9%), and Installation, Maintenance & Repair (28 | 1.5%).
Natural Resources, Construction and Maintenance Occupations by Sex
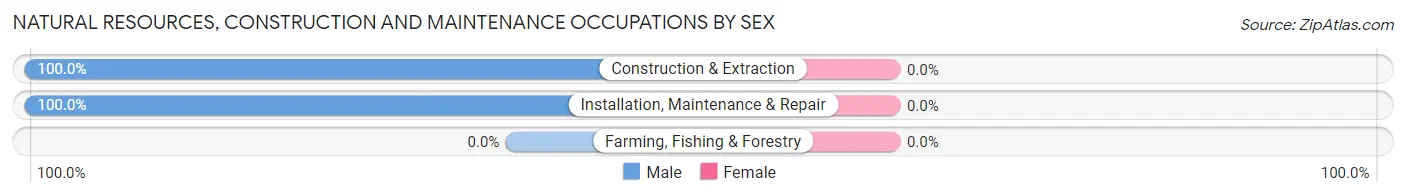
| Occupation | Male | Female |
| Farming, Fishing & Forestry | 0 (0.0%) | 0 (0.0%) |
| Construction & Extraction | 170 (100.0%) | 0 (0.0%) |
| Installation, Maintenance & Repair | 28 (100.0%) | 0 (0.0%) |
| Total (Category) | 198 (100.0%) | 0 (0.0%) |
| Total (Overall) | 1,063 (55.9%) | 838 (44.1%) |
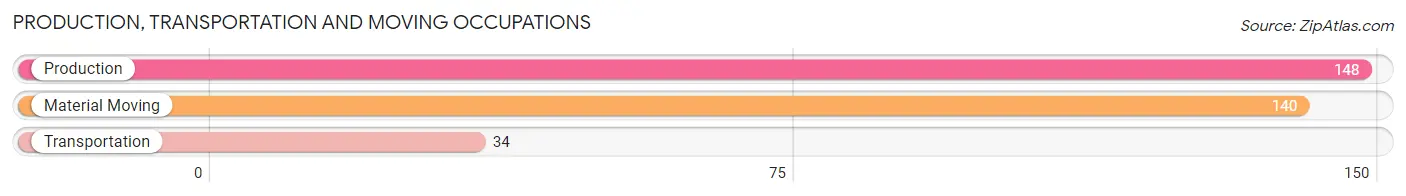
Production, Transportation and Moving Occupations
The most common Production, Transportation and Moving occupations in Johnson Creek are Production (148 | 7.8%), Material Moving (140 | 7.4%), and Transportation (34 | 1.8%).
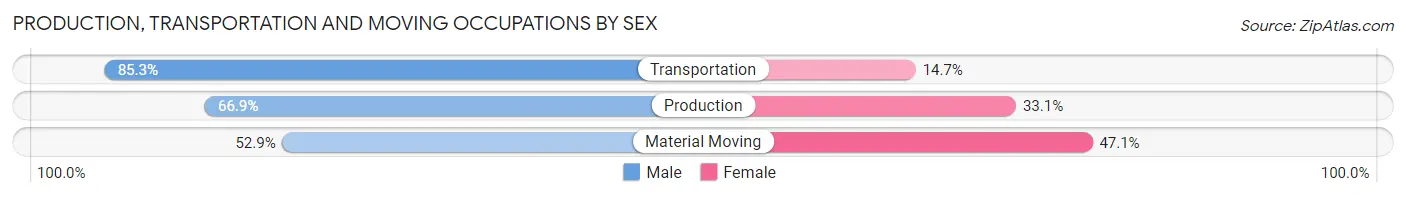
Production, Transportation and Moving Occupations by Sex
| Occupation | Male | Female |
| Production | 99 (66.9%) | 49 (33.1%) |
| Transportation | 29 (85.3%) | 5 (14.7%) |
| Material Moving | 74 (52.9%) | 66 (47.1%) |
| Total (Category) | 202 (62.7%) | 120 (37.3%) |
| Total (Overall) | 1,063 (55.9%) | 838 (44.1%) |
Employment Industries by Sex in Johnson Creek
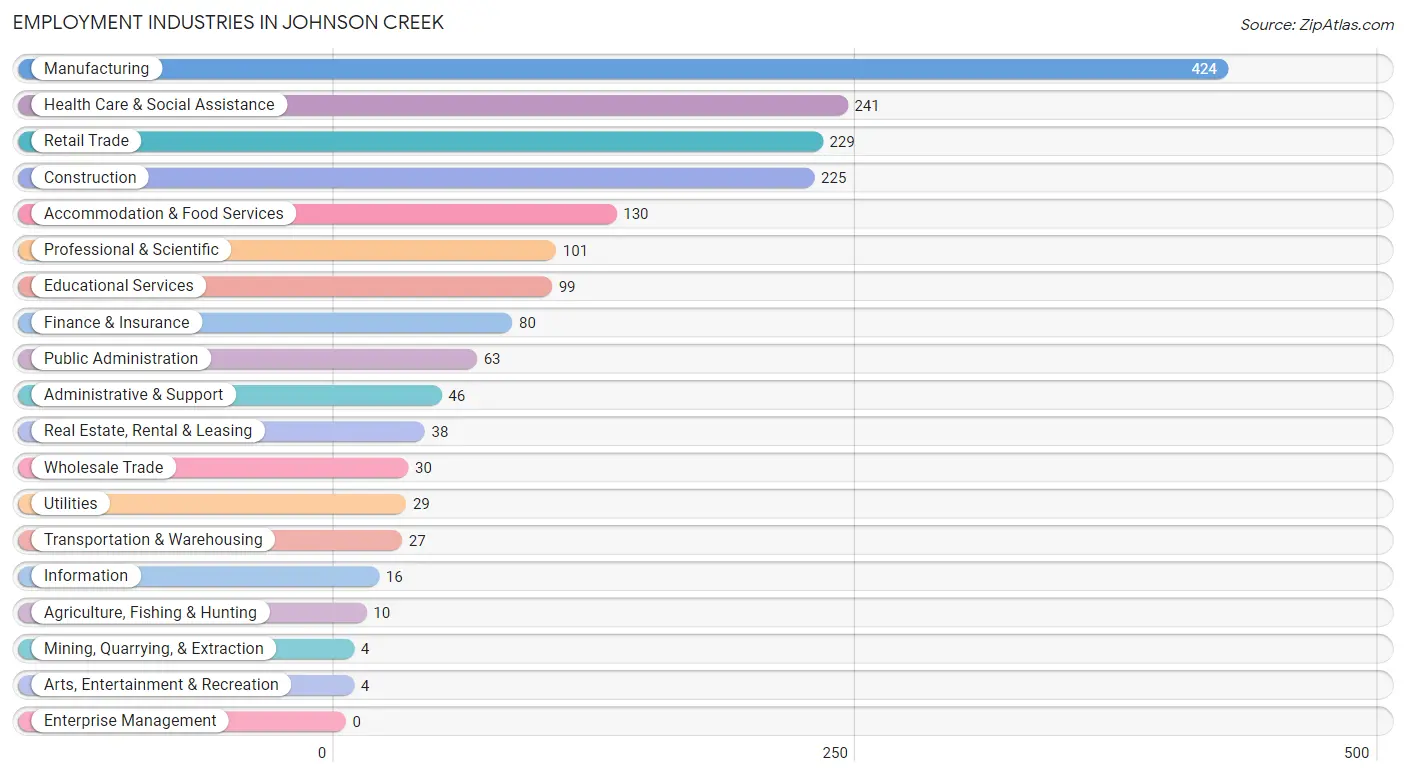
Employment Industries in Johnson Creek
The major employment industries in Johnson Creek include Manufacturing (424 | 22.3%), Health Care & Social Assistance (241 | 12.7%), Retail Trade (229 | 12.0%), Construction (225 | 11.8%), and Accommodation & Food Services (130 | 6.8%).
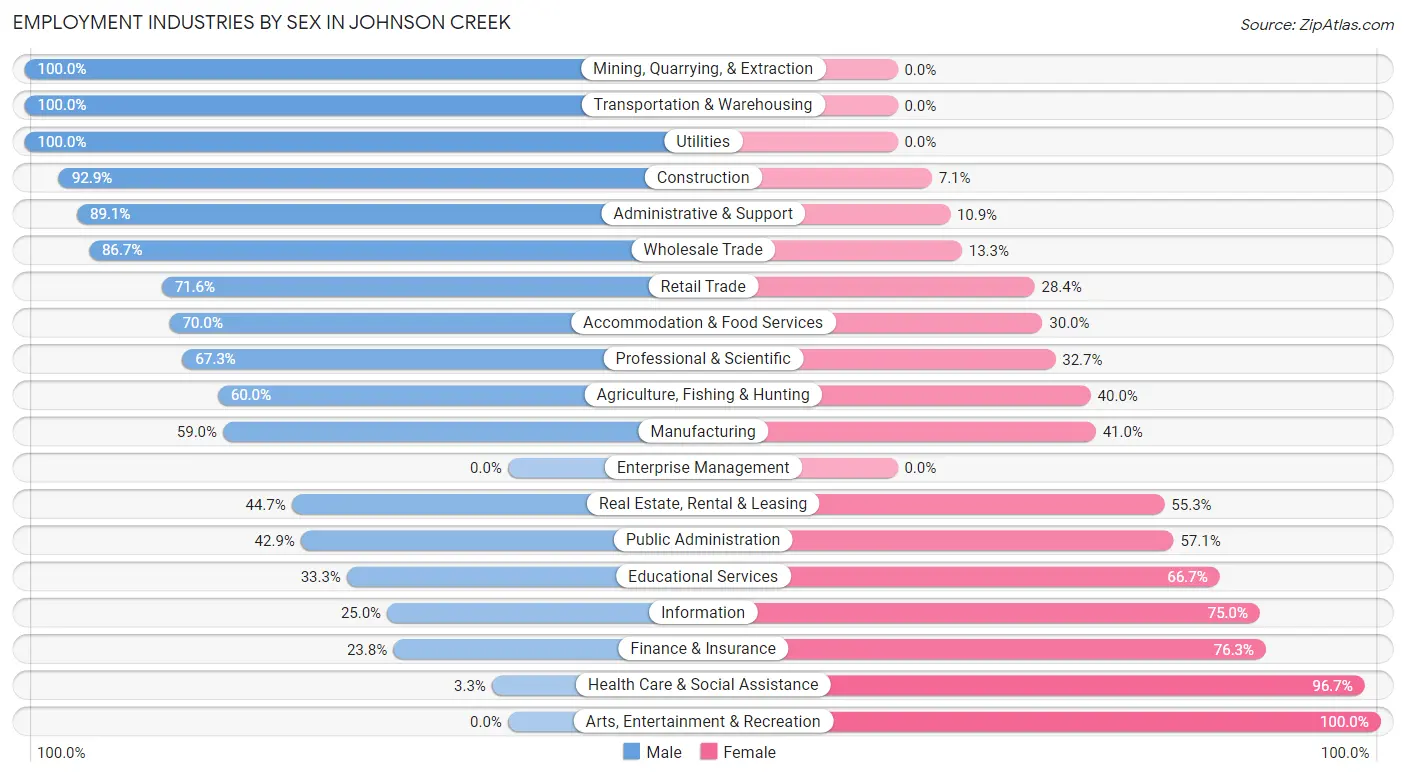
Employment Industries by Sex in Johnson Creek
The Johnson Creek industries that see more men than women are Mining, Quarrying, & Extraction (100.0%), Transportation & Warehousing (100.0%), and Utilities (100.0%), whereas the industries that tend to have a higher number of women are Arts, Entertainment & Recreation (100.0%), Health Care & Social Assistance (96.7%), and Finance & Insurance (76.2%).
| Industry | Male | Female |
| Agriculture, Fishing & Hunting | 6 (60.0%) | 4 (40.0%) |
| Mining, Quarrying, & Extraction | 4 (100.0%) | 0 (0.0%) |
| Construction | 209 (92.9%) | 16 (7.1%) |
| Manufacturing | 250 (59.0%) | 174 (41.0%) |
| Wholesale Trade | 26 (86.7%) | 4 (13.3%) |
| Retail Trade | 164 (71.6%) | 65 (28.4%) |
| Transportation & Warehousing | 27 (100.0%) | 0 (0.0%) |
| Utilities | 29 (100.0%) | 0 (0.0%) |
| Information | 4 (25.0%) | 12 (75.0%) |
| Finance & Insurance | 19 (23.7%) | 61 (76.2%) |
| Real Estate, Rental & Leasing | 17 (44.7%) | 21 (55.3%) |
| Professional & Scientific | 68 (67.3%) | 33 (32.7%) |
| Enterprise Management | 0 (0.0%) | 0 (0.0%) |
| Administrative & Support | 41 (89.1%) | 5 (10.9%) |
| Educational Services | 33 (33.3%) | 66 (66.7%) |
| Health Care & Social Assistance | 8 (3.3%) | 233 (96.7%) |
| Arts, Entertainment & Recreation | 0 (0.0%) | 4 (100.0%) |
| Accommodation & Food Services | 91 (70.0%) | 39 (30.0%) |
| Public Administration | 27 (42.9%) | 36 (57.1%) |
| Total | 1,063 (55.9%) | 838 (44.1%) |
Education in Johnson Creek
School Enrollment in Johnson Creek
The most common levels of schooling among the 869 students in Johnson Creek are high school (224 | 25.8%), college / undergraduate (190 | 21.9%), and elementary school (174 | 20.0%).
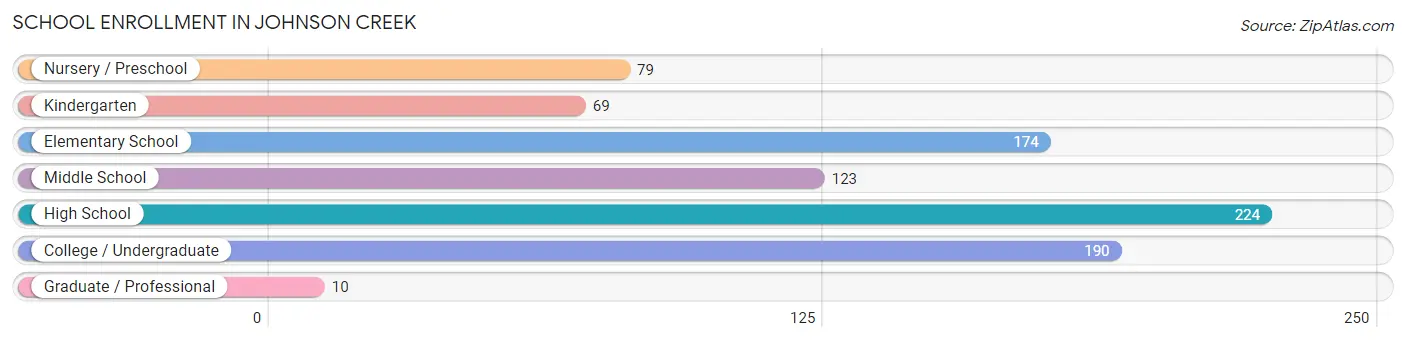
| School Level | # Students | % Students |
| Nursery / Preschool | 79 | 9.1% |
| Kindergarten | 69 | 7.9% |
| Elementary School | 174 | 20.0% |
| Middle School | 123 | 14.1% |
| High School | 224 | 25.8% |
| College / Undergraduate | 190 | 21.9% |
| Graduate / Professional | 10 | 1.1% |
| Total | 869 | 100.0% |
School Enrollment by Age by Funding Source in Johnson Creek
Out of a total of 869 students who are enrolled in schools in Johnson Creek, 180 (20.7%) attend a private institution, while the remaining 689 (79.3%) are enrolled in public schools. The age group of 18 to 19 year olds has the highest likelihood of being enrolled in private schools, with 64 (61.0% in the age bracket) enrolled. Conversely, the age group of 35 years and over has the lowest likelihood of being enrolled in a private school, with 32 (100.0% in the age bracket) attending a public institution.
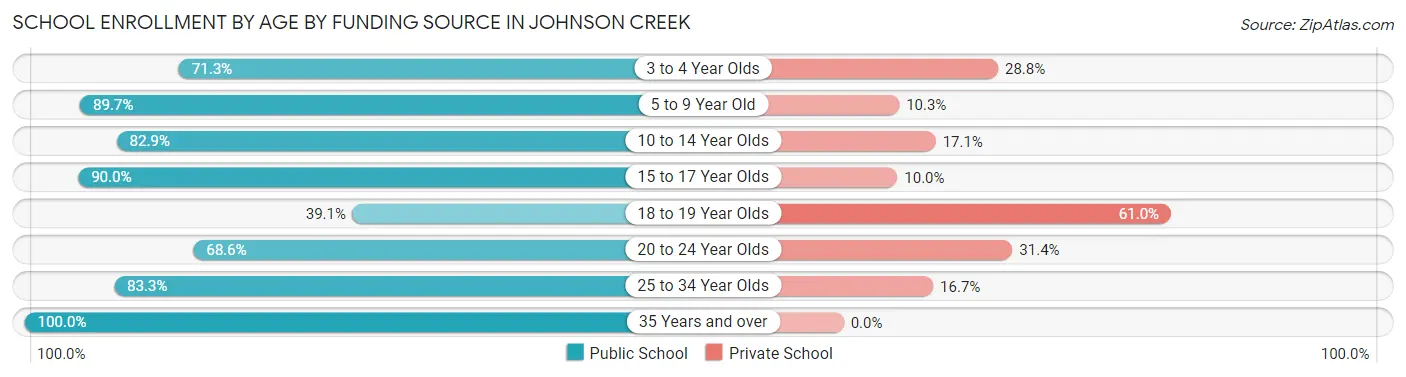
| Age Bracket | Public School | Private School |
| 3 to 4 Year Olds | 57 (71.3%) | 23 (28.7%) |
| 5 to 9 Year Old | 208 (89.7%) | 24 (10.3%) |
| 10 to 14 Year Olds | 116 (82.9%) | 24 (17.1%) |
| 15 to 17 Year Olds | 162 (90.0%) | 18 (10.0%) |
| 18 to 19 Year Olds | 41 (39.1%) | 64 (61.0%) |
| 20 to 24 Year Olds | 48 (68.6%) | 22 (31.4%) |
| 25 to 34 Year Olds | 25 (83.3%) | 5 (16.7%) |
| 35 Years and over | 32 (100.0%) | 0 (0.0%) |
| Total | 689 (79.3%) | 180 (20.7%) |
Educational Attainment by Field of Study in Johnson Creek
Business (143 | 20.6%), education (93 | 13.4%), science & technology (71 | 10.2%), arts & humanities (60 | 8.6%), and bio, nature & agricultural (59 | 8.5%) are the most common fields of study among 694 individuals in Johnson Creek who have obtained a bachelor's degree or higher.
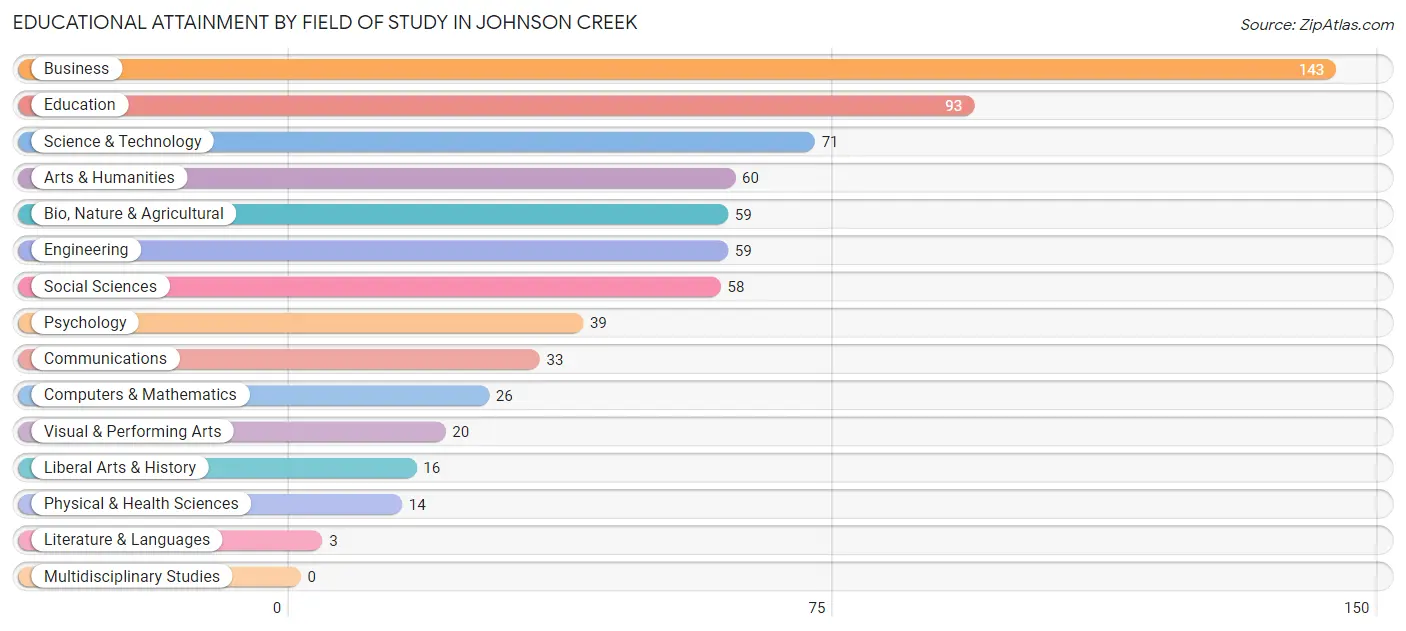
| Field of Study | # Graduates | % Graduates |
| Computers & Mathematics | 26 | 3.7% |
| Bio, Nature & Agricultural | 59 | 8.5% |
| Physical & Health Sciences | 14 | 2.0% |
| Psychology | 39 | 5.6% |
| Social Sciences | 58 | 8.4% |
| Engineering | 59 | 8.5% |
| Multidisciplinary Studies | 0 | 0.0% |
| Science & Technology | 71 | 10.2% |
| Business | 143 | 20.6% |
| Education | 93 | 13.4% |
| Literature & Languages | 3 | 0.4% |
| Liberal Arts & History | 16 | 2.3% |
| Visual & Performing Arts | 20 | 2.9% |
| Communications | 33 | 4.8% |
| Arts & Humanities | 60 | 8.6% |
| Total | 694 | 100.0% |
Transportation & Commute in Johnson Creek
Vehicle Availability by Sex in Johnson Creek
The most prevalent vehicle ownership categories in Johnson Creek are males with 2 vehicles (617, accounting for 58.0%) and females with 2 vehicles (436, making up 73.6%).
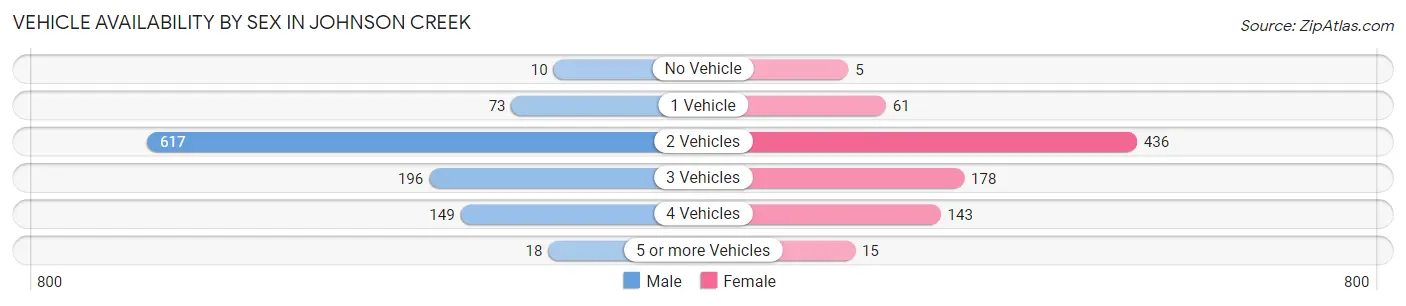
| Vehicles Available | Male | Female |
| No Vehicle | 10 (0.9%) | 5 (0.6%) |
| 1 Vehicle | 73 (6.9%) | 61 (7.3%) |
| 2 Vehicles | 617 (58.0%) | 436 (52.0%) |
| 3 Vehicles | 196 (18.4%) | 178 (21.2%) |
| 4 Vehicles | 149 (14.0%) | 143 (17.1%) |
| 5 or more Vehicles | 18 (1.7%) | 15 (1.8%) |
| Total | 1,063 (100.0%) | 838 (100.0%) |
Commute Time in Johnson Creek
The most frequently occuring commute durations in Johnson Creek are 30 to 34 minutes (323 commuters, 18.2%), 5 to 9 minutes (269 commuters, 15.1%), and 45 to 59 minutes (216 commuters, 12.1%).
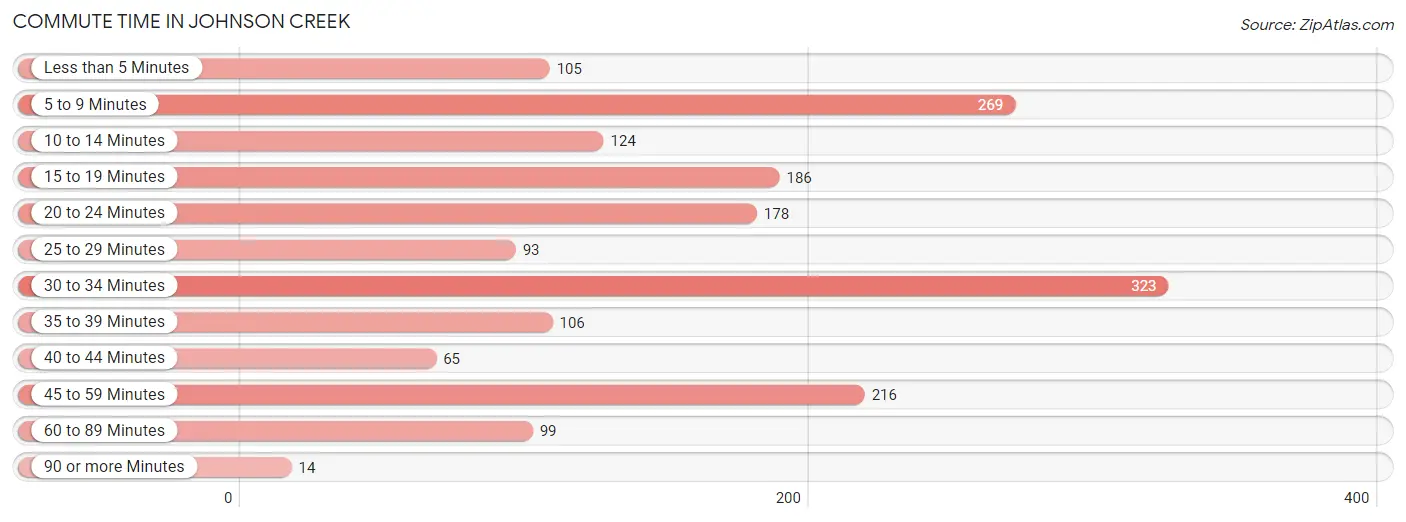
| Commute Time | # Commuters | % Commuters |
| Less than 5 Minutes | 105 | 5.9% |
| 5 to 9 Minutes | 269 | 15.1% |
| 10 to 14 Minutes | 124 | 7.0% |
| 15 to 19 Minutes | 186 | 10.5% |
| 20 to 24 Minutes | 178 | 10.0% |
| 25 to 29 Minutes | 93 | 5.2% |
| 30 to 34 Minutes | 323 | 18.2% |
| 35 to 39 Minutes | 106 | 6.0% |
| 40 to 44 Minutes | 65 | 3.7% |
| 45 to 59 Minutes | 216 | 12.1% |
| 60 to 89 Minutes | 99 | 5.6% |
| 90 or more Minutes | 14 | 0.8% |
Commute Time by Sex in Johnson Creek
The most common commute times in Johnson Creek are 30 to 34 minutes (230 commuters, 22.5%) for males and 15 to 19 minutes (133 commuters, 17.6%) for females.
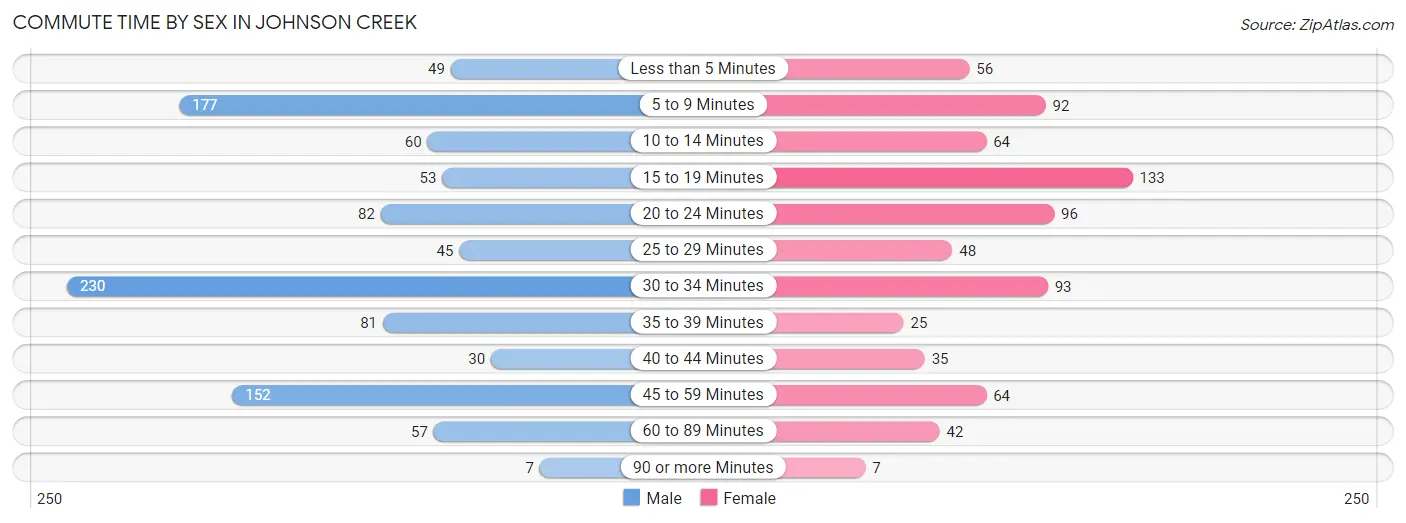
| Commute Time | Male | Female |
| Less than 5 Minutes | 49 (4.8%) | 56 (7.4%) |
| 5 to 9 Minutes | 177 (17.3%) | 92 (12.2%) |
| 10 to 14 Minutes | 60 (5.9%) | 64 (8.5%) |
| 15 to 19 Minutes | 53 (5.2%) | 133 (17.6%) |
| 20 to 24 Minutes | 82 (8.0%) | 96 (12.7%) |
| 25 to 29 Minutes | 45 (4.4%) | 48 (6.4%) |
| 30 to 34 Minutes | 230 (22.5%) | 93 (12.3%) |
| 35 to 39 Minutes | 81 (7.9%) | 25 (3.3%) |
| 40 to 44 Minutes | 30 (2.9%) | 35 (4.6%) |
| 45 to 59 Minutes | 152 (14.9%) | 64 (8.5%) |
| 60 to 89 Minutes | 57 (5.6%) | 42 (5.6%) |
| 90 or more Minutes | 7 (0.7%) | 7 (0.9%) |
Time of Departure to Work by Sex in Johnson Creek
The most frequent times of departure to work in Johnson Creek are 12:00 AM to 4:59 AM (163, 15.9%) for males and 4:00 PM to 11:59 PM (161, 21.3%) for females.
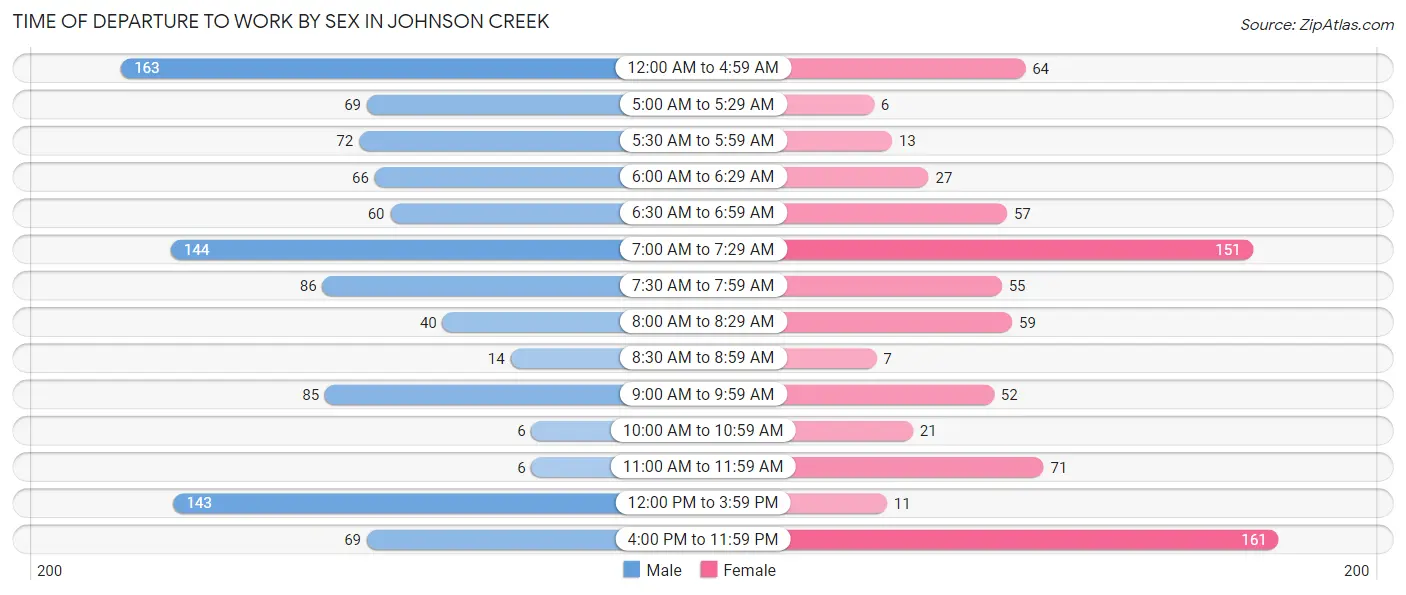
| Time of Departure | Male | Female |
| 12:00 AM to 4:59 AM | 163 (15.9%) | 64 (8.5%) |
| 5:00 AM to 5:29 AM | 69 (6.7%) | 6 (0.8%) |
| 5:30 AM to 5:59 AM | 72 (7.0%) | 13 (1.7%) |
| 6:00 AM to 6:29 AM | 66 (6.5%) | 27 (3.6%) |
| 6:30 AM to 6:59 AM | 60 (5.9%) | 57 (7.5%) |
| 7:00 AM to 7:29 AM | 144 (14.1%) | 151 (20.0%) |
| 7:30 AM to 7:59 AM | 86 (8.4%) | 55 (7.3%) |
| 8:00 AM to 8:29 AM | 40 (3.9%) | 59 (7.8%) |
| 8:30 AM to 8:59 AM | 14 (1.4%) | 7 (0.9%) |
| 9:00 AM to 9:59 AM | 85 (8.3%) | 52 (6.9%) |
| 10:00 AM to 10:59 AM | 6 (0.6%) | 21 (2.8%) |
| 11:00 AM to 11:59 AM | 6 (0.6%) | 71 (9.4%) |
| 12:00 PM to 3:59 PM | 143 (14.0%) | 11 (1.5%) |
| 4:00 PM to 11:59 PM | 69 (6.7%) | 161 (21.3%) |
| Total | 1,023 (100.0%) | 755 (100.0%) |
Housing Occupancy in Johnson Creek
Occupancy by Ownership in Johnson Creek
Of the total 1,134 dwellings in Johnson Creek, owner-occupied units account for 892 (78.7%), while renter-occupied units make up 242 (21.3%).
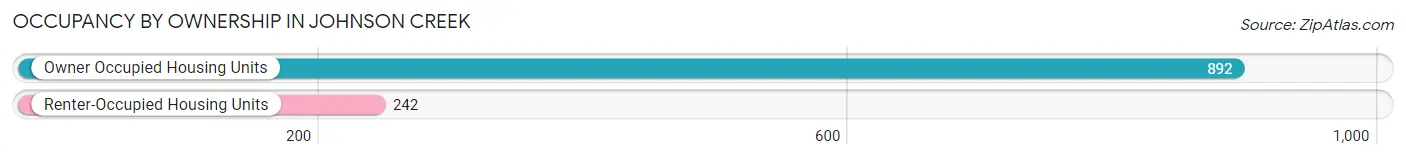
| Occupancy | # Housing Units | % Housing Units |
| Owner Occupied Housing Units | 892 | 78.7% |
| Renter-Occupied Housing Units | 242 | 21.3% |
| Total Occupied Housing Units | 1,134 | 100.0% |
Occupancy by Household Size in Johnson Creek
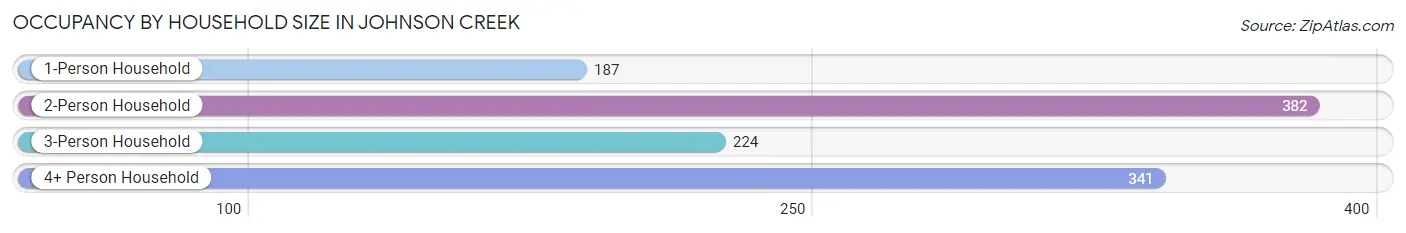
| Household Size | # Housing Units | % Housing Units |
| 1-Person Household | 187 | 16.5% |
| 2-Person Household | 382 | 33.7% |
| 3-Person Household | 224 | 19.8% |
| 4+ Person Household | 341 | 30.1% |
| Total Housing Units | 1,134 | 100.0% |
Occupancy by Ownership by Household Size in Johnson Creek
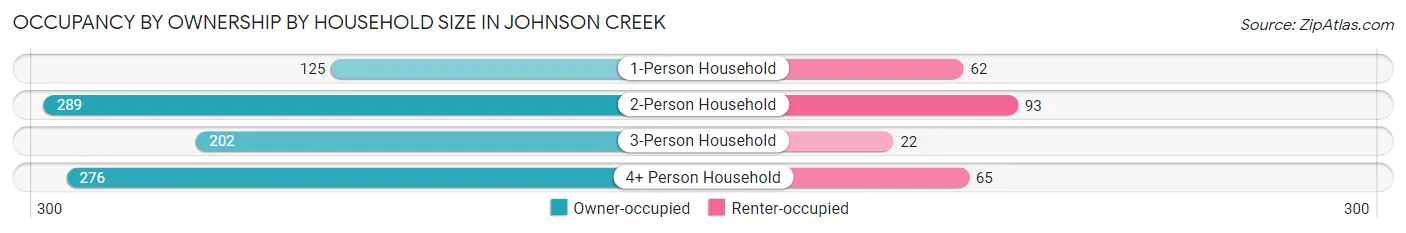
| Household Size | Owner-occupied | Renter-occupied |
| 1-Person Household | 125 (66.8%) | 62 (33.2%) |
| 2-Person Household | 289 (75.6%) | 93 (24.3%) |
| 3-Person Household | 202 (90.2%) | 22 (9.8%) |
| 4+ Person Household | 276 (80.9%) | 65 (19.1%) |
| Total Housing Units | 892 (78.7%) | 242 (21.3%) |
Occupancy by Educational Attainment in Johnson Creek
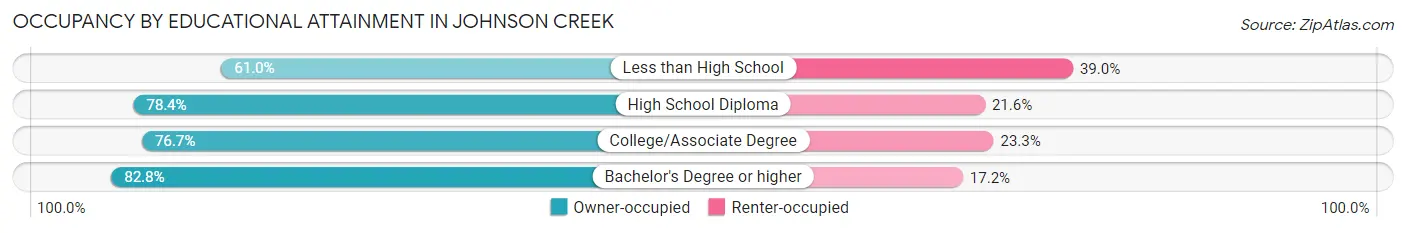
| Household Size | Owner-occupied | Renter-occupied |
| Less than High School | 25 (61.0%) | 16 (39.0%) |
| High School Diploma | 269 (78.4%) | 74 (21.6%) |
| College/Associate Degree | 290 (76.7%) | 88 (23.3%) |
| Bachelor's Degree or higher | 308 (82.8%) | 64 (17.2%) |
Occupancy by Age of Householder in Johnson Creek
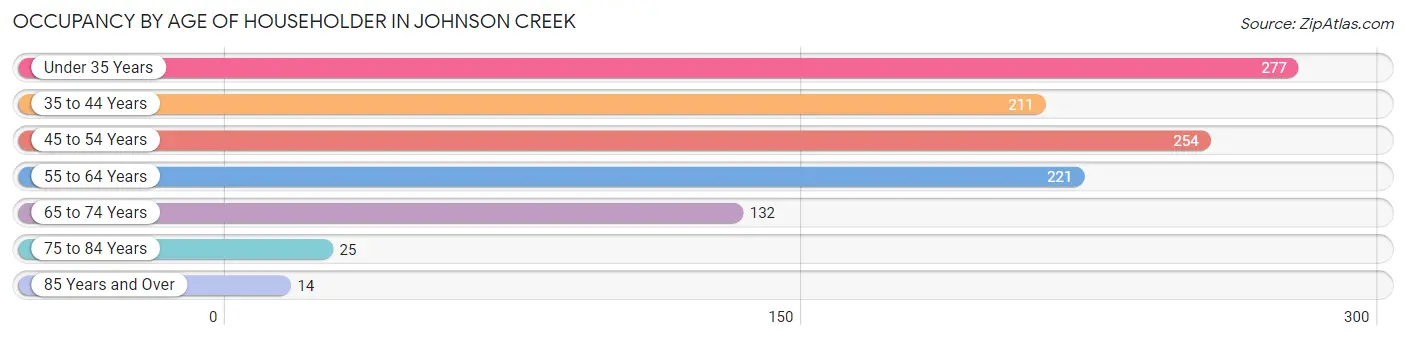
| Age Bracket | # Households | % Households |
| Under 35 Years | 277 | 24.4% |
| 35 to 44 Years | 211 | 18.6% |
| 45 to 54 Years | 254 | 22.4% |
| 55 to 64 Years | 221 | 19.5% |
| 65 to 74 Years | 132 | 11.6% |
| 75 to 84 Years | 25 | 2.2% |
| 85 Years and Over | 14 | 1.2% |
| Total | 1,134 | 100.0% |
Housing Finances in Johnson Creek
Median Income by Occupancy in Johnson Creek
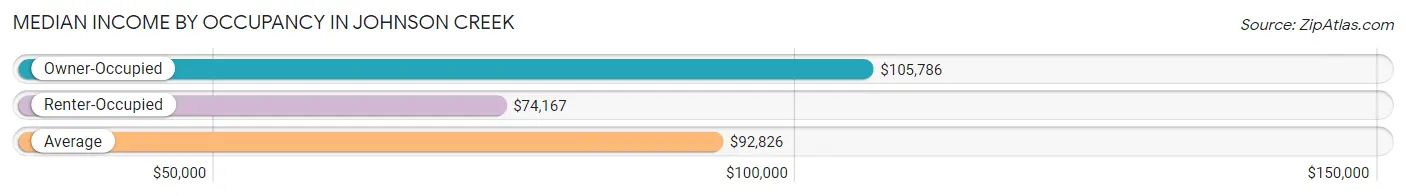
| Occupancy Type | # Households | Median Income |
| Owner-Occupied | 892 (78.7%) | $105,786 |
| Renter-Occupied | 242 (21.3%) | $74,167 |
| Average | 1,134 (100.0%) | $92,826 |
Occupancy by Householder Income Bracket in Johnson Creek
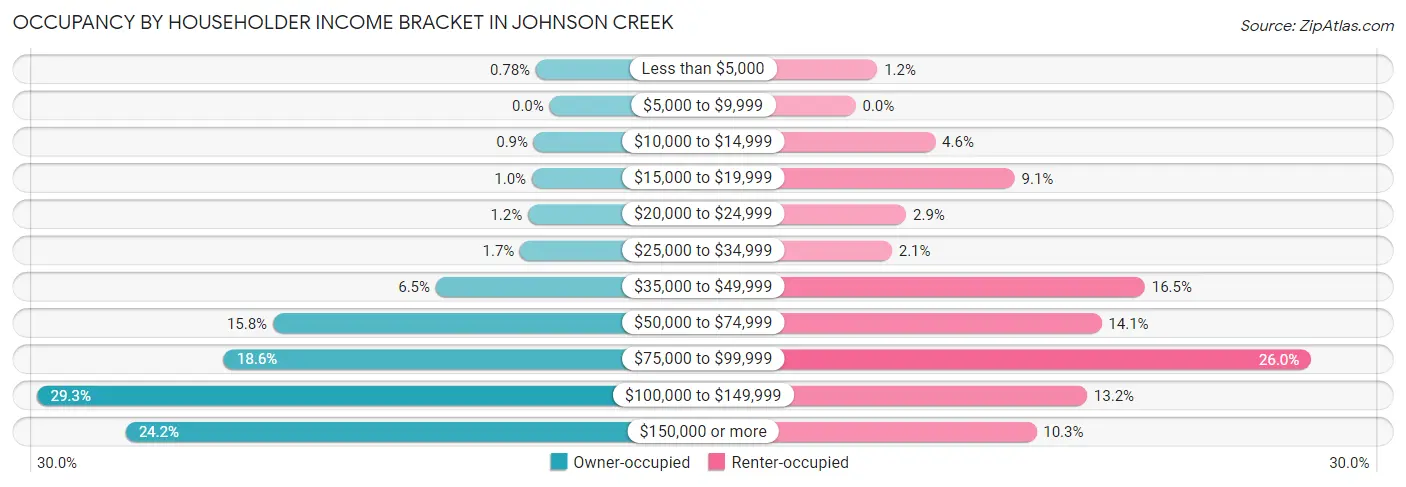
| Income Bracket | Owner-occupied | Renter-occupied |
| Less than $5,000 | 7 (0.8%) | 3 (1.2%) |
| $5,000 to $9,999 | 0 (0.0%) | 0 (0.0%) |
| $10,000 to $14,999 | 8 (0.9%) | 11 (4.5%) |
| $15,000 to $19,999 | 9 (1.0%) | 22 (9.1%) |
| $20,000 to $24,999 | 11 (1.2%) | 7 (2.9%) |
| $25,000 to $34,999 | 15 (1.7%) | 5 (2.1%) |
| $35,000 to $49,999 | 58 (6.5%) | 40 (16.5%) |
| $50,000 to $74,999 | 141 (15.8%) | 34 (14.1%) |
| $75,000 to $99,999 | 166 (18.6%) | 63 (26.0%) |
| $100,000 to $149,999 | 261 (29.3%) | 32 (13.2%) |
| $150,000 or more | 216 (24.2%) | 25 (10.3%) |
| Total | 892 (100.0%) | 242 (100.0%) |
Monthly Housing Cost Tiers in Johnson Creek
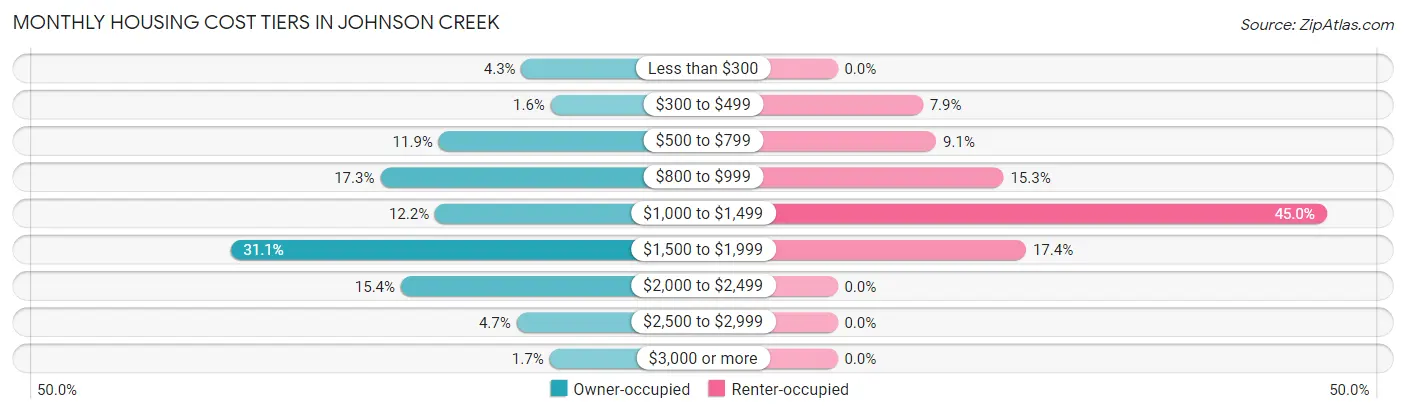
| Monthly Cost | Owner-occupied | Renter-occupied |
| Less than $300 | 38 (4.3%) | 0 (0.0%) |
| $300 to $499 | 14 (1.6%) | 19 (7.9%) |
| $500 to $799 | 106 (11.9%) | 22 (9.1%) |
| $800 to $999 | 154 (17.3%) | 37 (15.3%) |
| $1,000 to $1,499 | 109 (12.2%) | 109 (45.0%) |
| $1,500 to $1,999 | 277 (31.0%) | 42 (17.4%) |
| $2,000 to $2,499 | 137 (15.4%) | 0 (0.0%) |
| $2,500 to $2,999 | 42 (4.7%) | 0 (0.0%) |
| $3,000 or more | 15 (1.7%) | 0 (0.0%) |
| Total | 892 (100.0%) | 242 (100.0%) |
Physical Housing Characteristics in Johnson Creek
Housing Structures in Johnson Creek
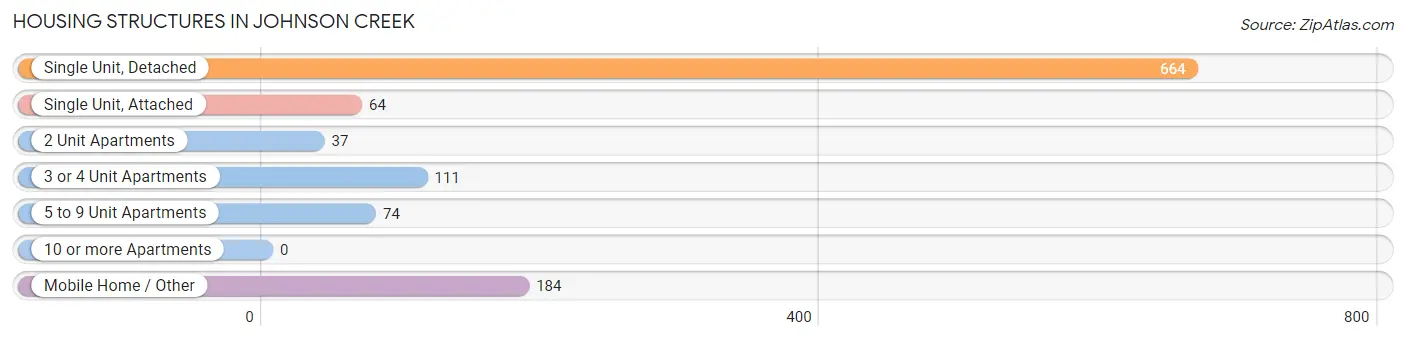
| Structure Type | # Housing Units | % Housing Units |
| Single Unit, Detached | 664 | 58.6% |
| Single Unit, Attached | 64 | 5.6% |
| 2 Unit Apartments | 37 | 3.3% |
| 3 or 4 Unit Apartments | 111 | 9.8% |
| 5 to 9 Unit Apartments | 74 | 6.5% |
| 10 or more Apartments | 0 | 0.0% |
| Mobile Home / Other | 184 | 16.2% |
| Total | 1,134 | 100.0% |
Housing Structures by Occupancy in Johnson Creek
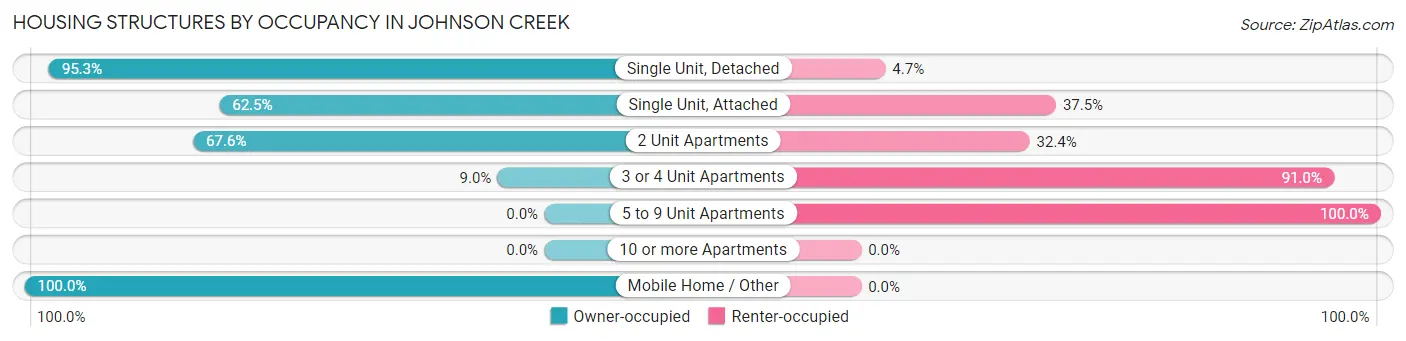
| Structure Type | Owner-occupied | Renter-occupied |
| Single Unit, Detached | 633 (95.3%) | 31 (4.7%) |
| Single Unit, Attached | 40 (62.5%) | 24 (37.5%) |
| 2 Unit Apartments | 25 (67.6%) | 12 (32.4%) |
| 3 or 4 Unit Apartments | 10 (9.0%) | 101 (91.0%) |
| 5 to 9 Unit Apartments | 0 (0.0%) | 74 (100.0%) |
| 10 or more Apartments | 0 (0.0%) | 0 (0.0%) |
| Mobile Home / Other | 184 (100.0%) | 0 (0.0%) |
| Total | 892 (78.7%) | 242 (21.3%) |
Housing Structures by Number of Rooms in Johnson Creek
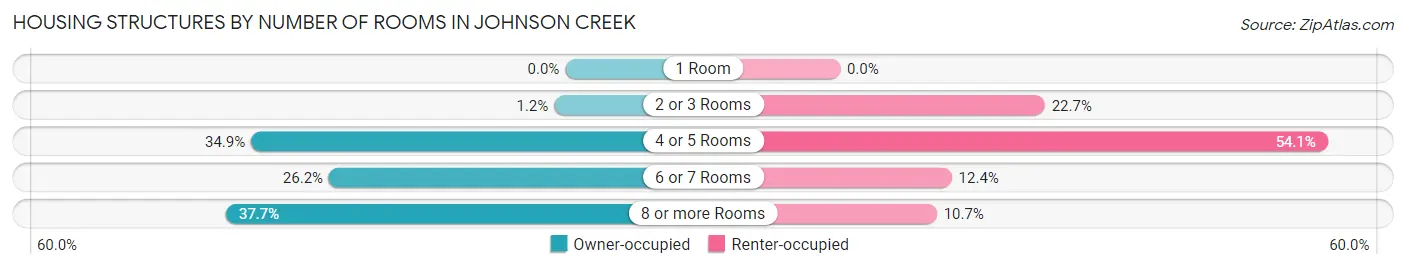
| Number of Rooms | Owner-occupied | Renter-occupied |
| 1 Room | 0 (0.0%) | 0 (0.0%) |
| 2 or 3 Rooms | 11 (1.2%) | 55 (22.7%) |
| 4 or 5 Rooms | 311 (34.9%) | 131 (54.1%) |
| 6 or 7 Rooms | 234 (26.2%) | 30 (12.4%) |
| 8 or more Rooms | 336 (37.7%) | 26 (10.7%) |
| Total | 892 (100.0%) | 242 (100.0%) |
Housing Structure by Heating Type in Johnson Creek
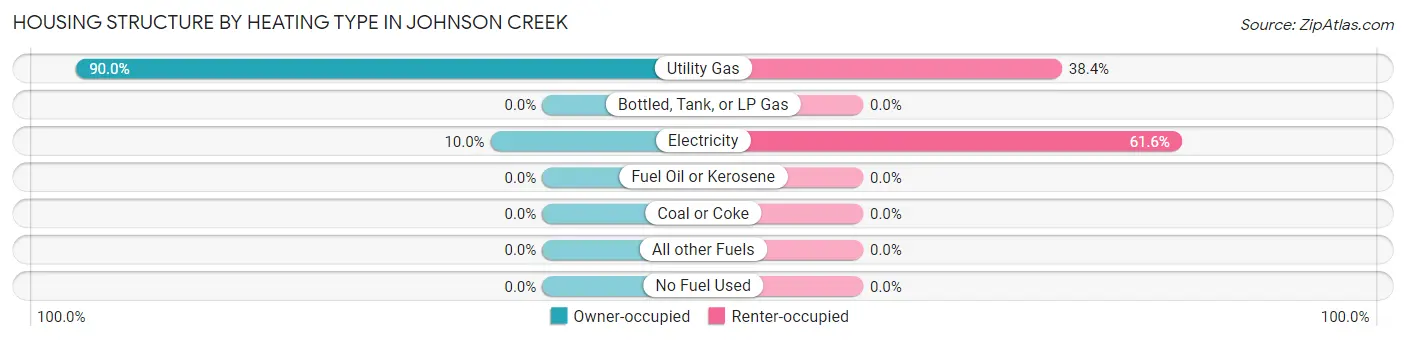
| Heating Type | Owner-occupied | Renter-occupied |
| Utility Gas | 803 (90.0%) | 93 (38.4%) |
| Bottled, Tank, or LP Gas | 0 (0.0%) | 0 (0.0%) |
| Electricity | 89 (10.0%) | 149 (61.6%) |
| Fuel Oil or Kerosene | 0 (0.0%) | 0 (0.0%) |
| Coal or Coke | 0 (0.0%) | 0 (0.0%) |
| All other Fuels | 0 (0.0%) | 0 (0.0%) |
| No Fuel Used | 0 (0.0%) | 0 (0.0%) |
| Total | 892 (100.0%) | 242 (100.0%) |
Household Vehicle Usage in Johnson Creek
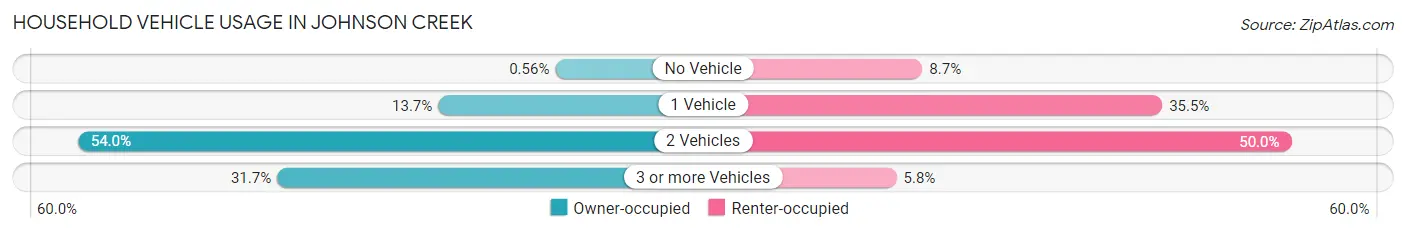
| Vehicles per Household | Owner-occupied | Renter-occupied |
| No Vehicle | 5 (0.6%) | 21 (8.7%) |
| 1 Vehicle | 122 (13.7%) | 86 (35.5%) |
| 2 Vehicles | 482 (54.0%) | 121 (50.0%) |
| 3 or more Vehicles | 283 (31.7%) | 14 (5.8%) |
| Total | 892 (100.0%) | 242 (100.0%) |
Real Estate & Mortgages in Johnson Creek
Real Estate and Mortgage Overview in Johnson Creek
| Characteristic | Without Mortgage | With Mortgage |
| Housing Units | 268 | 624 |
| Median Property Value | $212,900 | $284,200 |
| Median Household Income | $80,000 | $152 |
| Monthly Housing Costs | $744 | $15 |
| Real Estate Taxes | $4,180 | $53 |
Property Value by Mortgage Status in Johnson Creek
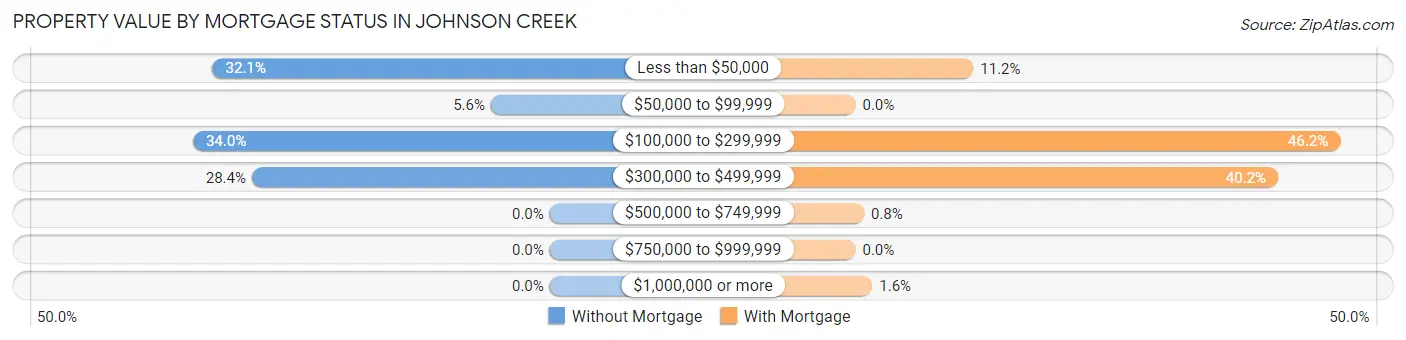
| Property Value | Without Mortgage | With Mortgage |
| Less than $50,000 | 86 (32.1%) | 70 (11.2%) |
| $50,000 to $99,999 | 15 (5.6%) | 0 (0.0%) |
| $100,000 to $299,999 | 91 (34.0%) | 288 (46.2%) |
| $300,000 to $499,999 | 76 (28.4%) | 251 (40.2%) |
| $500,000 to $749,999 | 0 (0.0%) | 5 (0.8%) |
| $750,000 to $999,999 | 0 (0.0%) | 0 (0.0%) |
| $1,000,000 or more | 0 (0.0%) | 10 (1.6%) |
| Total | 268 (100.0%) | 624 (100.0%) |
Household Income by Mortgage Status in Johnson Creek
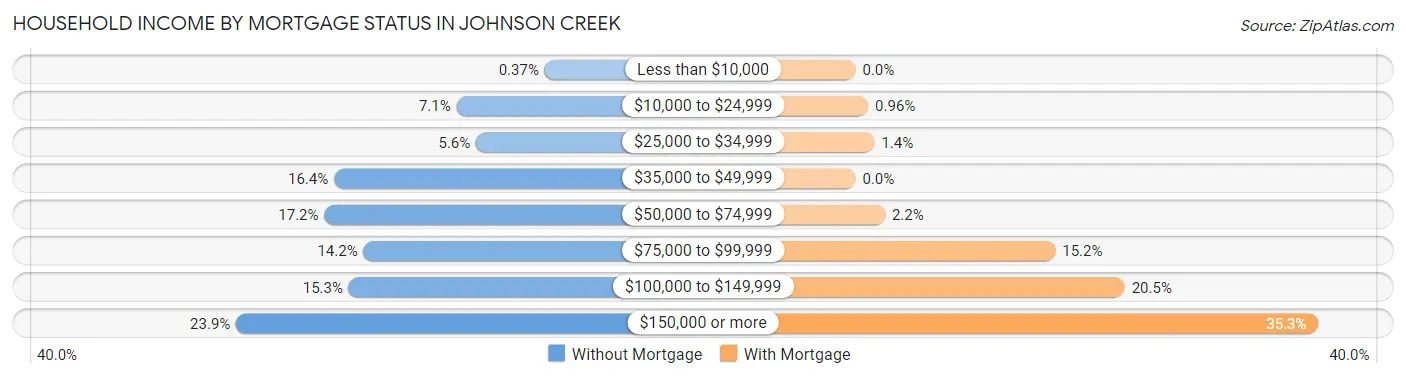
| Household Income | Without Mortgage | With Mortgage |
| Less than $10,000 | 1 (0.4%) | 0 (0.0%) |
| $10,000 to $24,999 | 19 (7.1%) | 6 (1.0%) |
| $25,000 to $34,999 | 15 (5.6%) | 9 (1.4%) |
| $35,000 to $49,999 | 44 (16.4%) | 0 (0.0%) |
| $50,000 to $74,999 | 46 (17.2%) | 14 (2.2%) |
| $75,000 to $99,999 | 38 (14.2%) | 95 (15.2%) |
| $100,000 to $149,999 | 41 (15.3%) | 128 (20.5%) |
| $150,000 or more | 64 (23.9%) | 220 (35.3%) |
| Total | 268 (100.0%) | 624 (100.0%) |
Property Value to Household Income Ratio in Johnson Creek
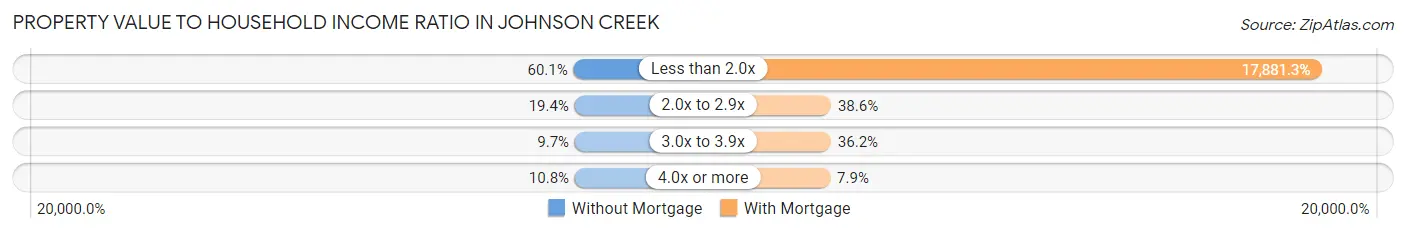
| Value-to-Income Ratio | Without Mortgage | With Mortgage |
| Less than 2.0x | 161 (60.1%) | 111,579 (17,881.2%) |
| 2.0x to 2.9x | 52 (19.4%) | 241 (38.6%) |
| 3.0x to 3.9x | 26 (9.7%) | 226 (36.2%) |
| 4.0x or more | 29 (10.8%) | 49 (7.9%) |
| Total | 268 (100.0%) | 624 (100.0%) |
Real Estate Taxes by Mortgage Status in Johnson Creek
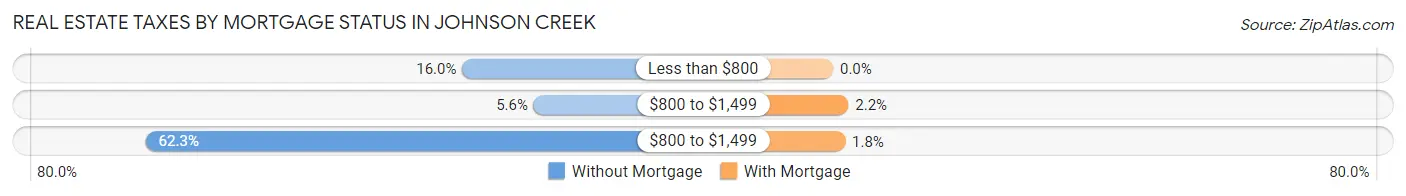
| Property Taxes | Without Mortgage | With Mortgage |
| Less than $800 | 43 (16.0%) | 0 (0.0%) |
| $800 to $1,499 | 15 (5.6%) | 14 (2.2%) |
| $800 to $1,499 | 167 (62.3%) | 11 (1.8%) |
| Total | 268 (100.0%) | 624 (100.0%) |
Health & Disability in Johnson Creek
Health Insurance Coverage by Age in Johnson Creek
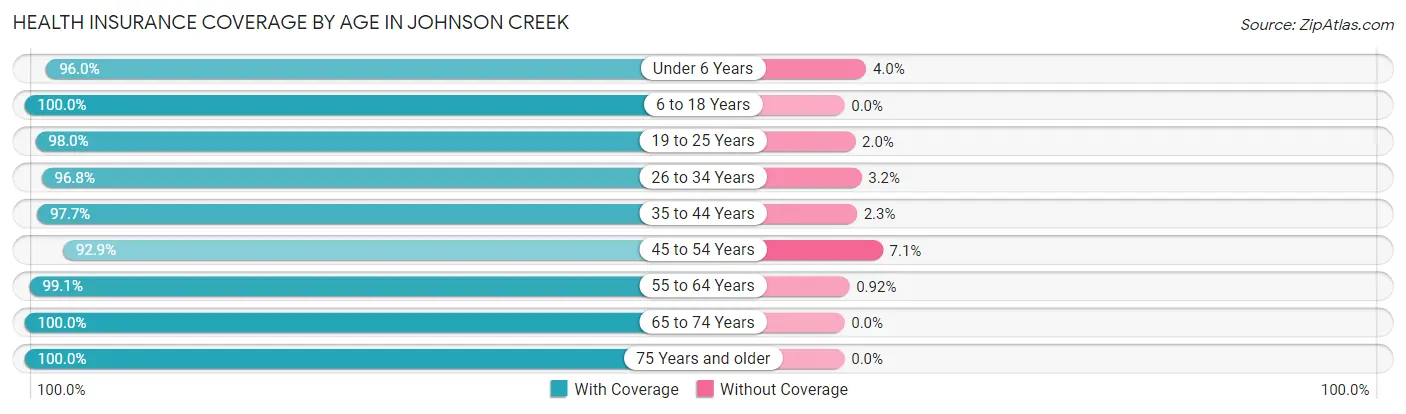
| Age Bracket | With Coverage | Without Coverage |
| Under 6 Years | 356 (96.0%) | 15 (4.0%) |
| 6 to 18 Years | 542 (100.0%) | 0 (0.0%) |
| 19 to 25 Years | 390 (98.0%) | 8 (2.0%) |
| 26 to 34 Years | 397 (96.8%) | 13 (3.2%) |
| 35 to 44 Years | 465 (97.7%) | 11 (2.3%) |
| 45 to 54 Years | 364 (92.9%) | 28 (7.1%) |
| 55 to 64 Years | 433 (99.1%) | 4 (0.9%) |
| 65 to 74 Years | 224 (100.0%) | 0 (0.0%) |
| 75 Years and older | 79 (100.0%) | 0 (0.0%) |
| Total | 3,250 (97.6%) | 79 (2.4%) |
Health Insurance Coverage by Citizenship Status in Johnson Creek
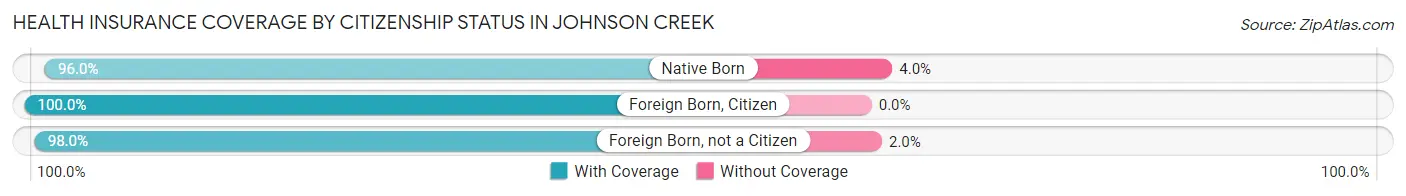
| Citizenship Status | With Coverage | Without Coverage |
| Native Born | 356 (96.0%) | 15 (4.0%) |
| Foreign Born, Citizen | 542 (100.0%) | 0 (0.0%) |
| Foreign Born, not a Citizen | 390 (98.0%) | 8 (2.0%) |
Health Insurance Coverage by Household Income in Johnson Creek
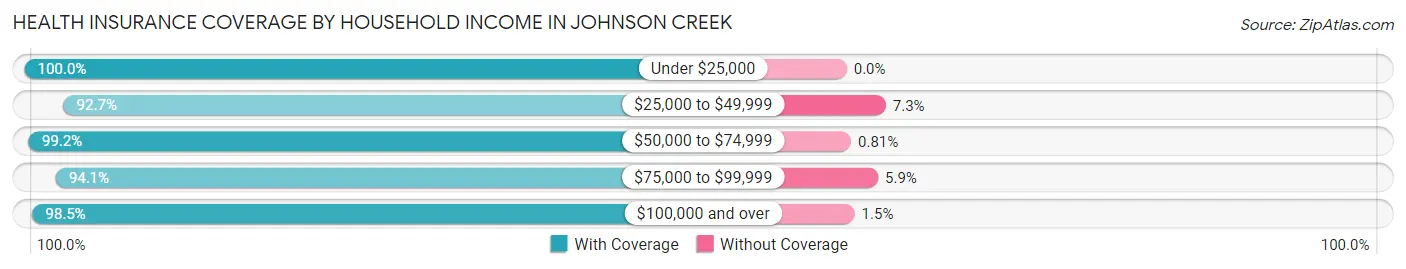
| Household Income | With Coverage | Without Coverage |
| Under $25,000 | 170 (100.0%) | 0 (0.0%) |
| $25,000 to $49,999 | 190 (92.7%) | 15 (7.3%) |
| $50,000 to $74,999 | 492 (99.2%) | 4 (0.8%) |
| $75,000 to $99,999 | 514 (94.1%) | 32 (5.9%) |
| $100,000 and over | 1,876 (98.5%) | 28 (1.5%) |
Public vs Private Health Insurance Coverage by Age in Johnson Creek
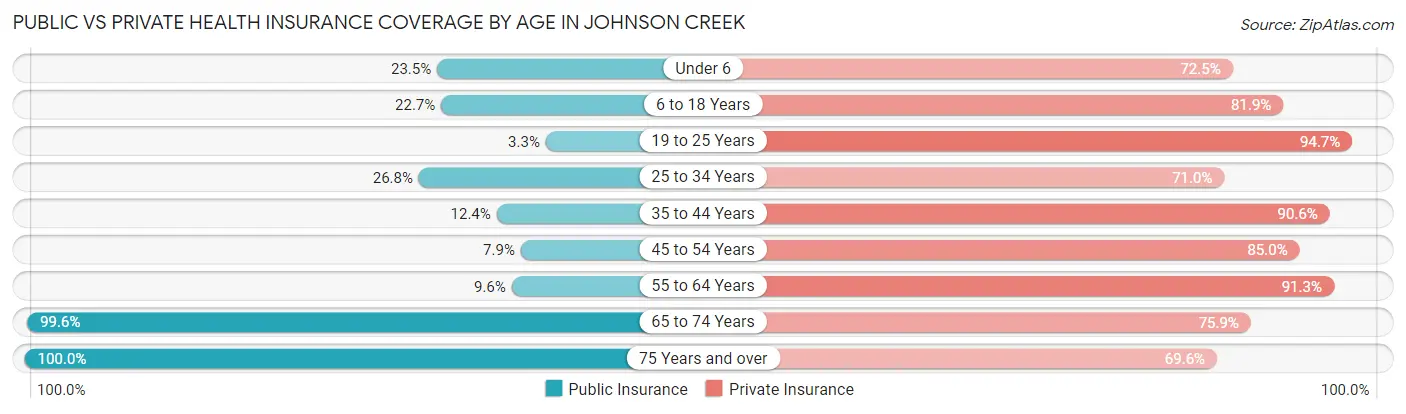
| Age Bracket | Public Insurance | Private Insurance |
| Under 6 | 87 (23.4%) | 269 (72.5%) |
| 6 to 18 Years | 123 (22.7%) | 444 (81.9%) |
| 19 to 25 Years | 13 (3.3%) | 377 (94.7%) |
| 25 to 34 Years | 110 (26.8%) | 291 (71.0%) |
| 35 to 44 Years | 59 (12.4%) | 431 (90.5%) |
| 45 to 54 Years | 31 (7.9%) | 333 (85.0%) |
| 55 to 64 Years | 42 (9.6%) | 399 (91.3%) |
| 65 to 74 Years | 223 (99.6%) | 170 (75.9%) |
| 75 Years and over | 79 (100.0%) | 55 (69.6%) |
| Total | 767 (23.0%) | 2,769 (83.2%) |
Disability Status by Sex by Age in Johnson Creek
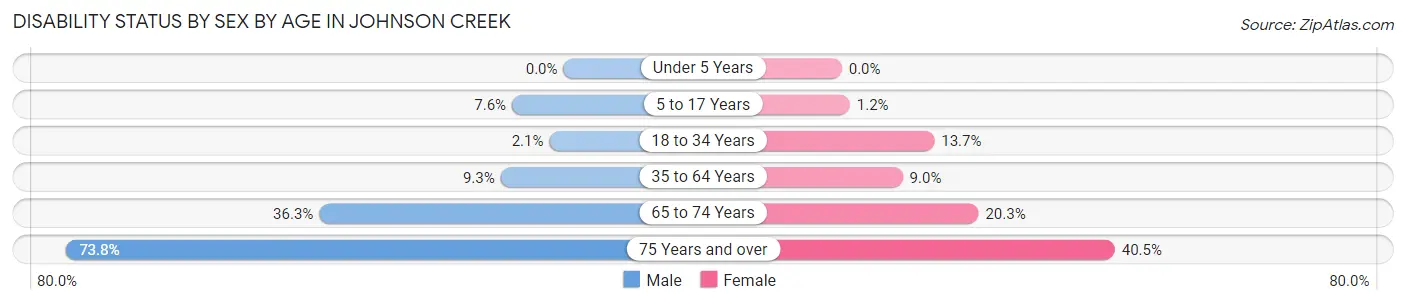
| Age Bracket | Male | Female |
| Under 5 Years | 0 (0.0%) | 0 (0.0%) |
| 5 to 17 Years | 23 (7.6%) | 3 (1.2%) |
| 18 to 34 Years | 8 (2.1%) | 64 (13.7%) |
| 35 to 64 Years | 67 (9.3%) | 53 (9.0%) |
| 65 to 74 Years | 33 (36.3%) | 27 (20.3%) |
| 75 Years and over | 31 (73.8%) | 15 (40.5%) |
Disability Class by Sex by Age in Johnson Creek
Disability Class: Hearing Difficulty
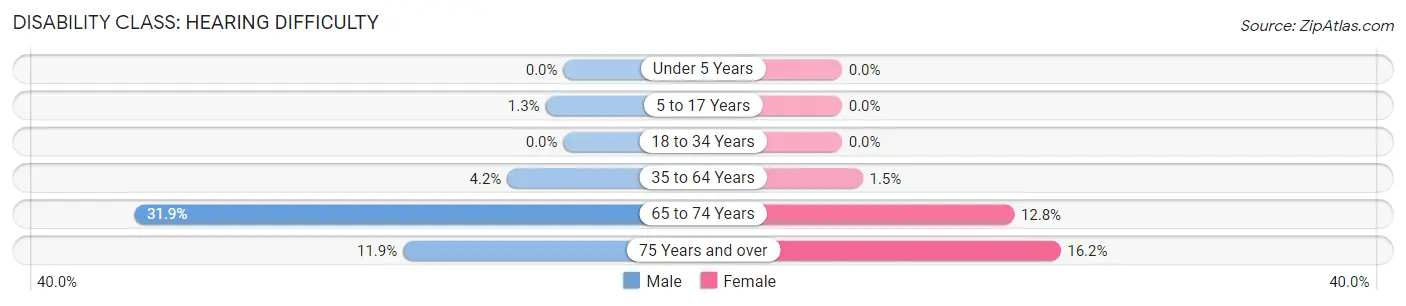
| Age Bracket | Male | Female |
| Under 5 Years | 0 (0.0%) | 0 (0.0%) |
| 5 to 17 Years | 4 (1.3%) | 0 (0.0%) |
| 18 to 34 Years | 0 (0.0%) | 0 (0.0%) |
| 35 to 64 Years | 30 (4.2%) | 9 (1.5%) |
| 65 to 74 Years | 29 (31.9%) | 17 (12.8%) |
| 75 Years and over | 5 (11.9%) | 6 (16.2%) |
Disability Class: Vision Difficulty
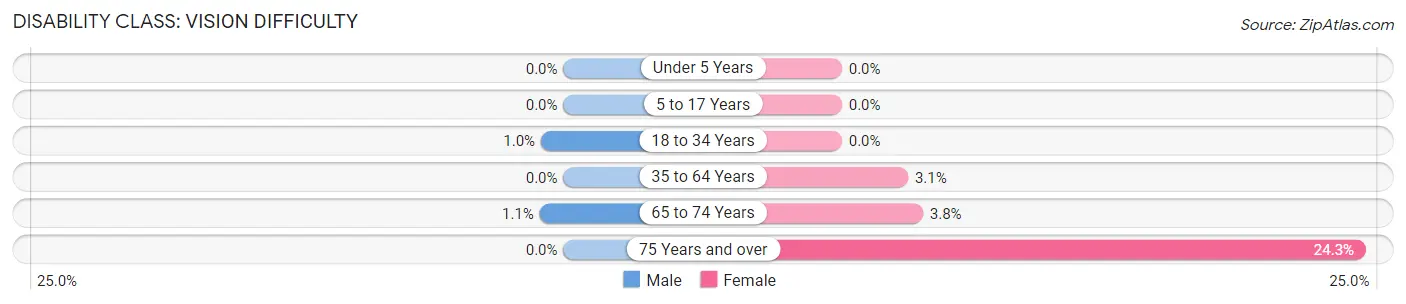
| Age Bracket | Male | Female |
| Under 5 Years | 0 (0.0%) | 0 (0.0%) |
| 5 to 17 Years | 0 (0.0%) | 0 (0.0%) |
| 18 to 34 Years | 4 (1.0%) | 0 (0.0%) |
| 35 to 64 Years | 0 (0.0%) | 18 (3.1%) |
| 65 to 74 Years | 1 (1.1%) | 5 (3.8%) |
| 75 Years and over | 0 (0.0%) | 9 (24.3%) |
Disability Class: Cognitive Difficulty
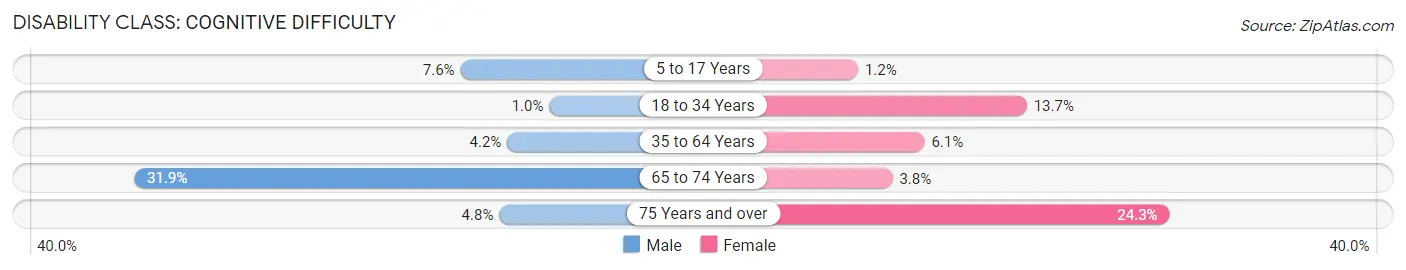
| Age Bracket | Male | Female |
| 5 to 17 Years | 23 (7.6%) | 3 (1.2%) |
| 18 to 34 Years | 4 (1.0%) | 64 (13.7%) |
| 35 to 64 Years | 30 (4.2%) | 36 (6.1%) |
| 65 to 74 Years | 29 (31.9%) | 5 (3.8%) |
| 75 Years and over | 2 (4.8%) | 9 (24.3%) |
Disability Class: Ambulatory Difficulty
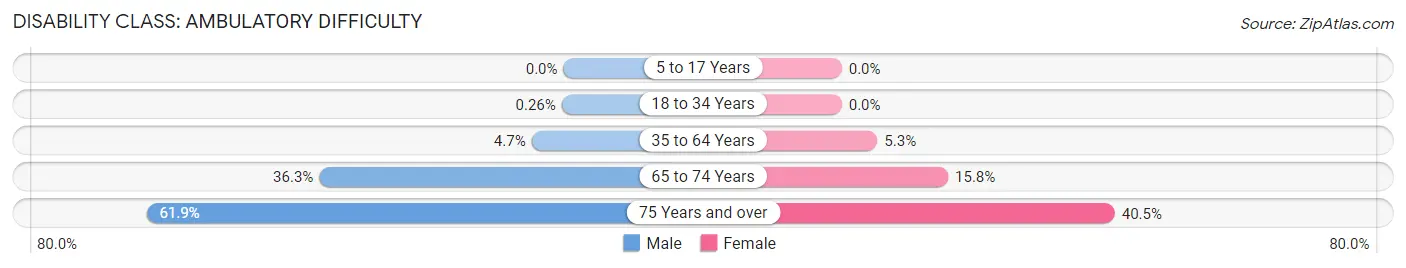
| Age Bracket | Male | Female |
| 5 to 17 Years | 0 (0.0%) | 0 (0.0%) |
| 18 to 34 Years | 1 (0.3%) | 0 (0.0%) |
| 35 to 64 Years | 34 (4.7%) | 31 (5.3%) |
| 65 to 74 Years | 33 (36.3%) | 21 (15.8%) |
| 75 Years and over | 26 (61.9%) | 15 (40.5%) |
Disability Class: Self-Care Difficulty
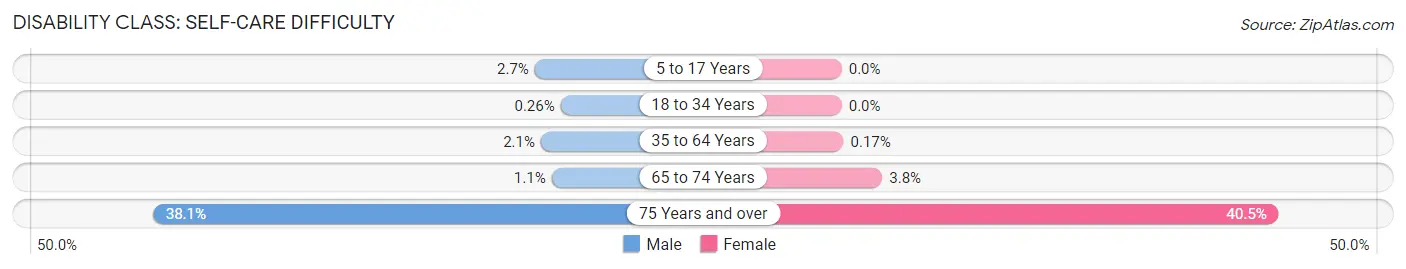
| Age Bracket | Male | Female |
| 5 to 17 Years | 8 (2.7%) | 0 (0.0%) |
| 18 to 34 Years | 1 (0.3%) | 0 (0.0%) |
| 35 to 64 Years | 15 (2.1%) | 1 (0.2%) |
| 65 to 74 Years | 1 (1.1%) | 5 (3.8%) |
| 75 Years and over | 16 (38.1%) | 15 (40.5%) |
Technology Access in Johnson Creek
Computing Device Access in Johnson Creek
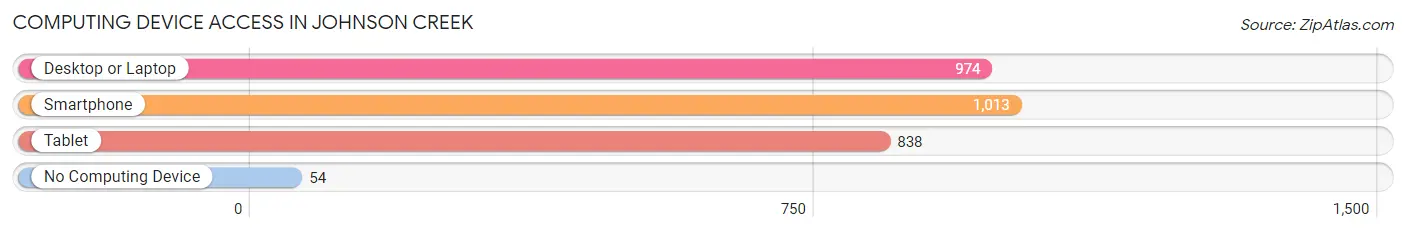
| Device Type | # Households | % Households |
| Desktop or Laptop | 974 | 85.9% |
| Smartphone | 1,013 | 89.3% |
| Tablet | 838 | 73.9% |
| No Computing Device | 54 | 4.8% |
| Total | 1,134 | 100.0% |
Internet Access in Johnson Creek
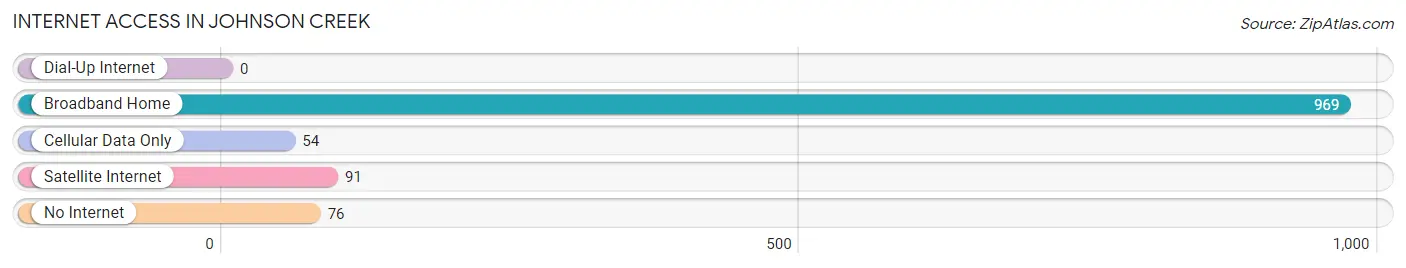
| Internet Type | # Households | % Households |
| Dial-Up Internet | 0 | 0.0% |
| Broadband Home | 969 | 85.5% |
| Cellular Data Only | 54 | 4.8% |
| Satellite Internet | 91 | 8.0% |
| No Internet | 76 | 6.7% |
| Total | 1,134 | 100.0% |
Johnson Creek Summary
History
The area now known as Johnson Creek, Wisconsin was first settled in the early 1800s by a group of settlers from New York. The settlers were attracted to the area due to its abundance of natural resources, including timber, water, and fertile soil. The first settlers built a sawmill and a gristmill, which provided the foundation for the town’s economy.
In 1845, the town was officially incorporated as Johnson Creek, named after the creek that runs through the area. The town quickly grew, and by the late 1800s, it had become a thriving community with a variety of businesses, including a hotel, a general store, a blacksmith shop, and a post office.
In the early 1900s, Johnson Creek experienced a period of growth and prosperity. The town was home to several factories, including a paper mill, a furniture factory, and a canning factory. The town also had a railroad station, which connected it to the larger cities of Milwaukee and Madison.
In the 1950s, Johnson Creek began to decline as many of its factories closed and the railroad station was abandoned. The town’s population decreased, and many of its businesses closed.
In the late 1990s, Johnson Creek began to experience a resurgence. The town was designated as a historic district, and many of its buildings were restored. The town also began to attract new businesses, including a winery, a brewery, and a distillery.
Geography
Johnson Creek is located in Jefferson County, Wisconsin, approximately 25 miles southeast of Madison. The town is situated on the banks of the Crawfish River, which flows through the area. The town is surrounded by rolling hills and farmland, and is home to several parks and nature preserves.
The town has a total area of 2.2 square miles, all of which is land. The town has a humid continental climate, with cold winters and hot, humid summers.
Economy
Johnson Creek’s economy is largely based on tourism and agriculture. The town is home to several wineries, breweries, and distilleries, which attract visitors from all over the state. The town is also home to several farms, which produce a variety of crops, including corn, soybeans, and hay.
The town is also home to several small businesses, including restaurants, shops, and a variety of services. The town is also home to a small industrial park, which houses several light manufacturing businesses.
Demographics
As of the 2010 census, Johnson Creek had a population of 1,845. The town has a median household income of $50,000, and the median age is 43. The town is predominantly white, with 92.3% of the population identifying as white. The town also has a small Hispanic population, with 4.3% of the population identifying as Hispanic or Latino.
Conclusion
Johnson Creek, Wisconsin is a small town with a rich history and a vibrant economy. The town is home to several wineries, breweries, and distilleries, as well as a variety of small businesses. The town is predominantly white, with a small Hispanic population. The town has a median household income of $50,000, and the median age is 43. Johnson Creek is a great place to live, work, and visit.
Common Questions
What is Per Capita Income in Johnson Creek?
Per Capita income in Johnson Creek is $37,717.
What is the Median Family Income in Johnson Creek?
Median Family Income in Johnson Creek is $107,031.
What is the Median Household income in Johnson Creek?
Median Household Income in Johnson Creek is $92,826.
What is Income or Wage Gap in Johnson Creek?
Income or Wage Gap in Johnson Creek is 42.8%.
Women in Johnson Creek earn 57.2 cents for every dollar earned by a man.
What is Inequality or Gini Index in Johnson Creek?
Inequality or Gini Index in Johnson Creek is 0.32.
What is the Total Population of Johnson Creek?
Total Population of Johnson Creek is 3,337.
What is the Total Male Population of Johnson Creek?
Total Male Population of Johnson Creek is 1,761.
What is the Total Female Population of Johnson Creek?
Total Female Population of Johnson Creek is 1,576.
What is the Ratio of Males per 100 Females in Johnson Creek?
There are 111.74 Males per 100 Females in Johnson Creek.
What is the Ratio of Females per 100 Males in Johnson Creek?
There are 89.49 Females per 100 Males in Johnson Creek.
What is the Median Population Age in Johnson Creek?
Median Population Age in Johnson Creek is 34.5 Years.
What is the Average Family Size in Johnson Creek
Average Family Size in Johnson Creek is 3.2 People.
What is the Average Household Size in Johnson Creek
Average Household Size in Johnson Creek is 2.9 People.
How Large is the Labor Force in Johnson Creek?
There are 1,941 People in the Labor Forcein in Johnson Creek.
What is the Percentage of People in the Labor Force in Johnson Creek?
74.7% of People are in the Labor Force in Johnson Creek.
What is the Unemployment Rate in Johnson Creek?
Unemployment Rate in Johnson Creek is 2.1%.