St George, MO Map & Demographics
St George Map
St George Overview
$30,840
PER CAPITA INCOME
$69,679
AVG FAMILY INCOME
$63,159
AVG HOUSEHOLD INCOME
39.7%
WAGE / INCOME GAP [ % ]
60.3¢/ $1
WAGE / INCOME GAP [ $ ]
0.33
INEQUALITY / GINI INDEX
1,875
TOTAL POPULATION
803
MALE POPULATION
1,072
FEMALE POPULATION
74.91
MALES / 100 FEMALES
133.50
FEMALES / 100 MALES
34.9
MEDIAN AGE
2.9
AVG FAMILY SIZE
2.5
AVG HOUSEHOLD SIZE
1,228
LABOR FORCE [ PEOPLE ]
77.0%
PERCENT IN LABOR FORCE
1.4%
UNEMPLOYMENT RATE
Income in St George
Income Overview in St George
Per Capita Income in St George is $30,840, while median incomes of families and households are $69,679 and $63,159 respectively.
| Characteristic | Number | Measure |
| Per Capita Income | 1,875 | $30,840 |
| Median Family Income | 517 | $69,679 |
| Mean Family Income | 517 | $84,492 |
| Median Household Income | 747 | $63,159 |
| Mean Household Income | 747 | $75,318 |
| Income Deficit | 517 | $0 |
| Wage / Income Gap (%) | 1,875 | 39.69% |
| Wage / Income Gap ($) | 1,875 | 60.31¢ per $1 |
| Gini / Inequality Index | 1,875 | 0.33 |
Earnings by Sex in St George
Average Earnings in St George are $37,888, $47,520 for men and $28,661 for women, a difference of 39.7%.
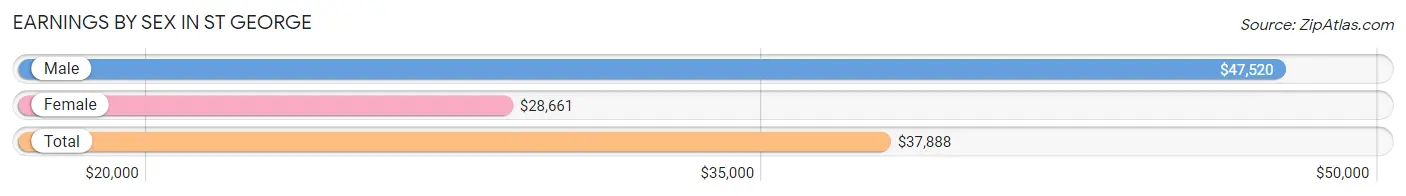
| Sex | Number | Average Earnings |
| Male | 569 (43.0%) | $47,520 |
| Female | 753 (57.0%) | $28,661 |
| Total | 1,322 (100.0%) | $37,888 |
Earnings by Sex by Income Bracket in St George
The most common earnings brackets in St George are $45,000 to $49,999 for men (92 | 16.2%) and $2,499 or less for women (83 | 11.0%).
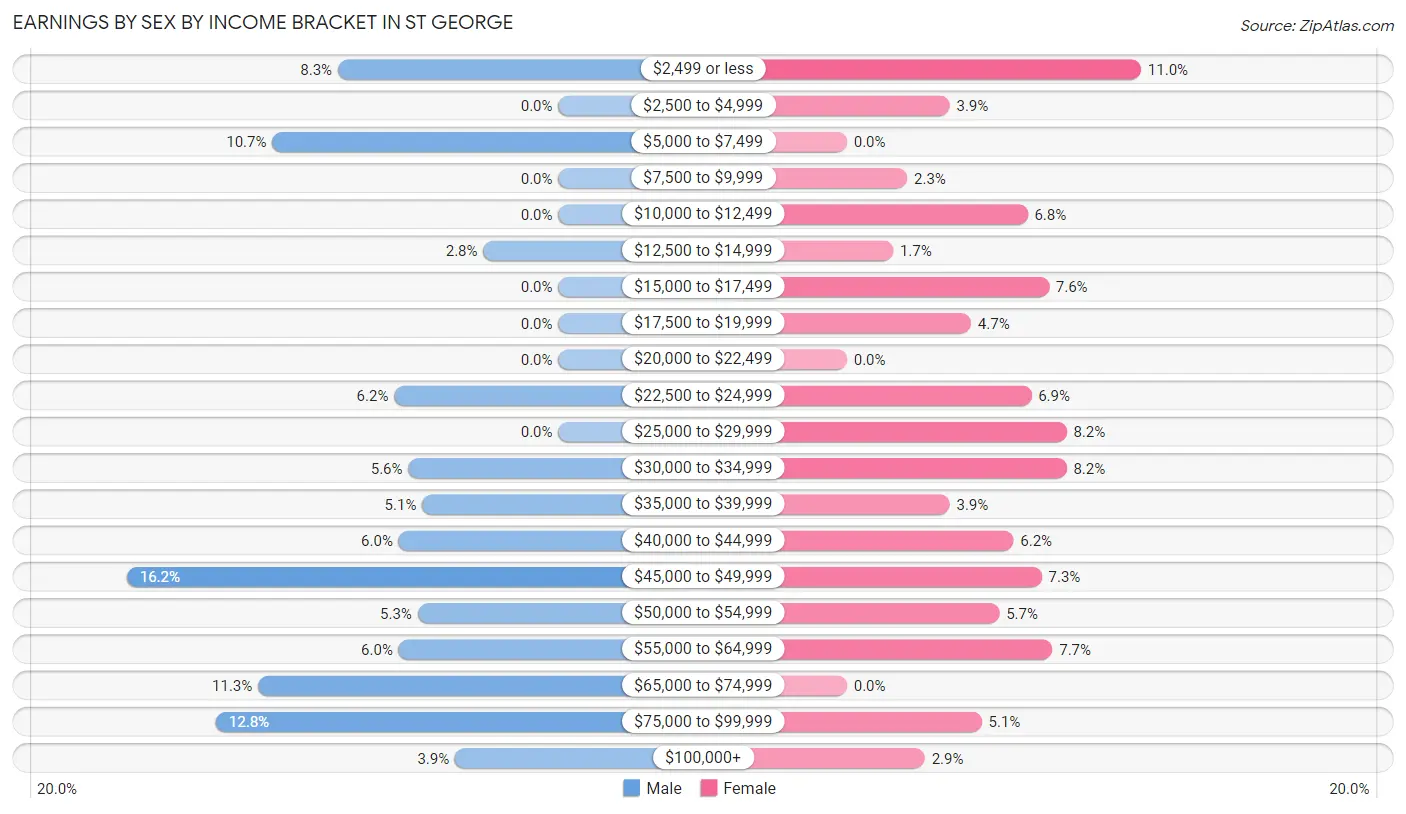
| Income | Male | Female |
| $2,499 or less | 47 (8.3%) | 83 (11.0%) |
| $2,500 to $4,999 | 0 (0.0%) | 29 (3.8%) |
| $5,000 to $7,499 | 61 (10.7%) | 0 (0.0%) |
| $7,500 to $9,999 | 0 (0.0%) | 17 (2.3%) |
| $10,000 to $12,499 | 0 (0.0%) | 51 (6.8%) |
| $12,500 to $14,999 | 16 (2.8%) | 13 (1.7%) |
| $15,000 to $17,499 | 0 (0.0%) | 57 (7.6%) |
| $17,500 to $19,999 | 0 (0.0%) | 35 (4.6%) |
| $20,000 to $22,499 | 0 (0.0%) | 0 (0.0%) |
| $22,500 to $24,999 | 35 (6.1%) | 52 (6.9%) |
| $25,000 to $29,999 | 0 (0.0%) | 62 (8.2%) |
| $30,000 to $34,999 | 32 (5.6%) | 62 (8.2%) |
| $35,000 to $39,999 | 29 (5.1%) | 29 (3.8%) |
| $40,000 to $44,999 | 34 (6.0%) | 47 (6.2%) |
| $45,000 to $49,999 | 92 (16.2%) | 55 (7.3%) |
| $50,000 to $54,999 | 30 (5.3%) | 43 (5.7%) |
| $55,000 to $64,999 | 34 (6.0%) | 58 (7.7%) |
| $65,000 to $74,999 | 64 (11.3%) | 0 (0.0%) |
| $75,000 to $99,999 | 73 (12.8%) | 38 (5.1%) |
| $100,000+ | 22 (3.9%) | 22 (2.9%) |
| Total | 569 (100.0%) | 753 (100.0%) |
Earnings by Sex by Educational Attainment in St George
Average earnings in St George are $47,458 for men and $42,857 for women, a difference of 9.7%. Men with an educational attainment of less than high school enjoy the highest average annual earnings of $48,750, while those with high school diploma education earn the least with $43,182. Women with an educational attainment of bachelor's degree earn the most with the average annual earnings of $47,909, while those with high school diploma education have the smallest earnings of $18,679.
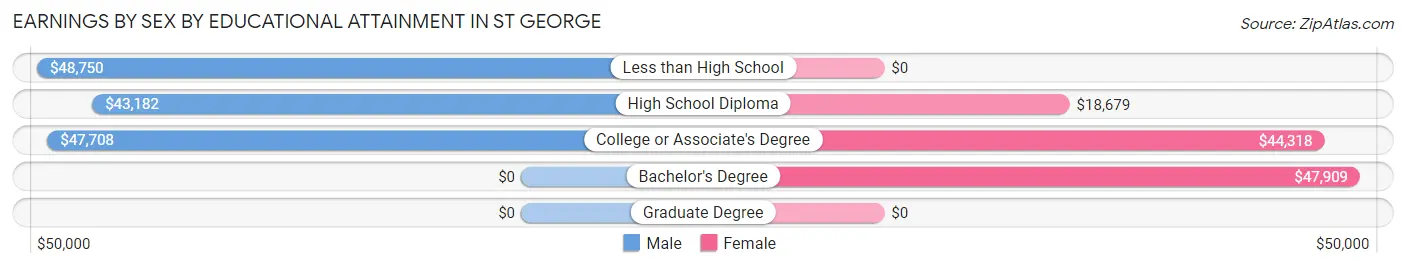
| Educational Attainment | Male Income | Female Income |
| Less than High School | $48,750 | $0 |
| High School Diploma | $43,182 | $18,679 |
| College or Associate's Degree | $47,708 | $44,318 |
| Bachelor's Degree | - | - |
| Graduate Degree | - | - |
| Total | $47,458 | $42,857 |
Family Income in St George
Family Income Brackets in St George
According to the St George family income data, there are 129 families falling into the $100,000 to $149,999 income range, which is the most common income bracket and makes up 24.9% of all families.
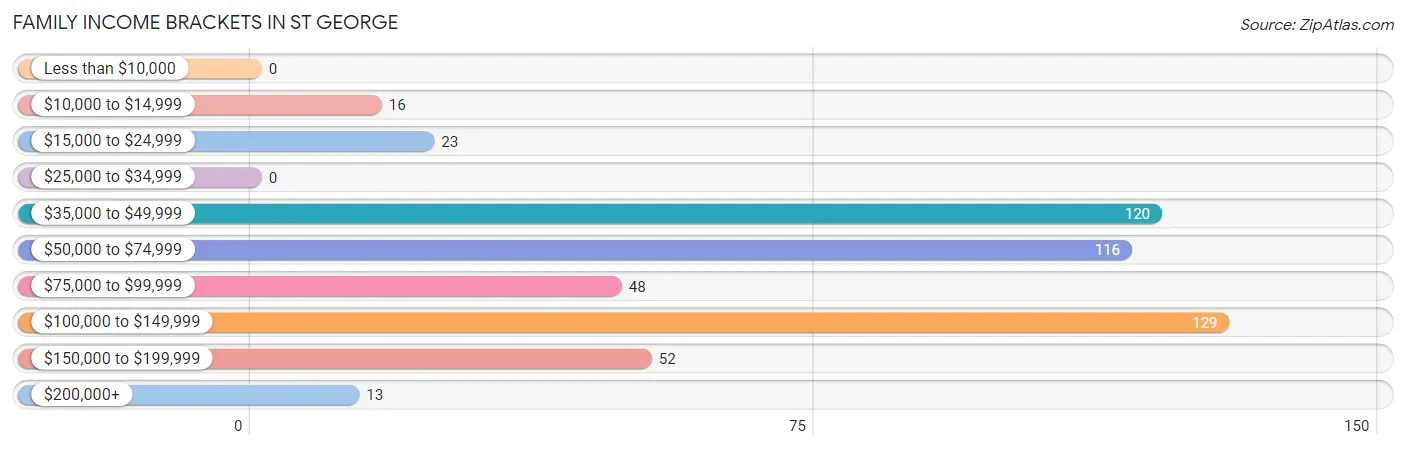
| Income Bracket | # Families | % Families |
| Less than $10,000 | 0 | 0.0% |
| $10,000 to $14,999 | 16 | 3.1% |
| $15,000 to $24,999 | 23 | 4.4% |
| $25,000 to $34,999 | 0 | 0.0% |
| $35,000 to $49,999 | 120 | 23.2% |
| $50,000 to $74,999 | 116 | 22.4% |
| $75,000 to $99,999 | 48 | 9.3% |
| $100,000 to $149,999 | 129 | 25.0% |
| $150,000 to $199,999 | 52 | 10.1% |
| $200,000+ | 13 | 2.5% |
Family Income by Famaliy Size in St George
3-person families (188 | 36.4%) account for the highest median family income in St George with $87,833 per family, while 2-person families (228 | 44.1%) have the highest median income of $31,750 per family member.
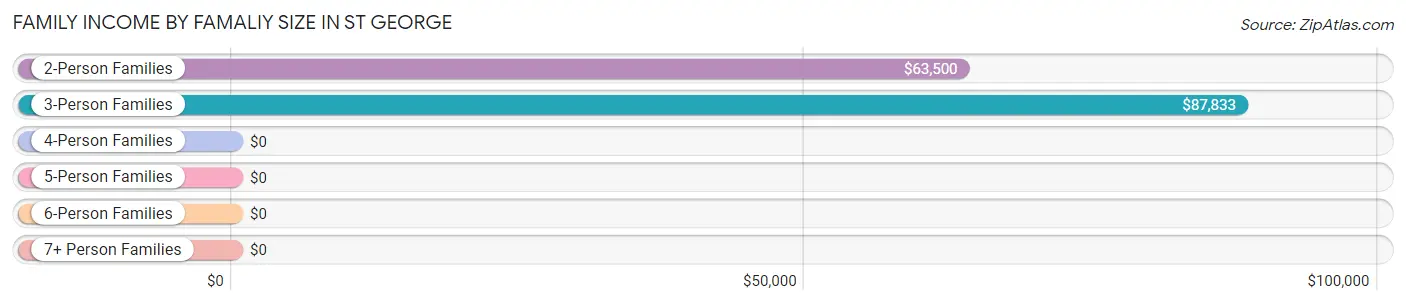
| Income Bracket | # Families | Median Income |
| 2-Person Families | 228 (44.1%) | $63,500 |
| 3-Person Families | 188 (36.4%) | $87,833 |
| 4-Person Families | 88 (17.0%) | $0 |
| 5-Person Families | 0 (0.0%) | $0 |
| 6-Person Families | 0 (0.0%) | $0 |
| 7+ Person Families | 13 (2.5%) | $0 |
| Total | 517 (100.0%) | $69,679 |
Family Income by Number of Earners in St George
The median family income in St George is $69,679, with families comprising 3+ earners (120) having the highest median family income of $131,953, while families with 1 earner (113) have the lowest median family income of $39,931, accounting for 23.2% and 21.9% of families, respectively.
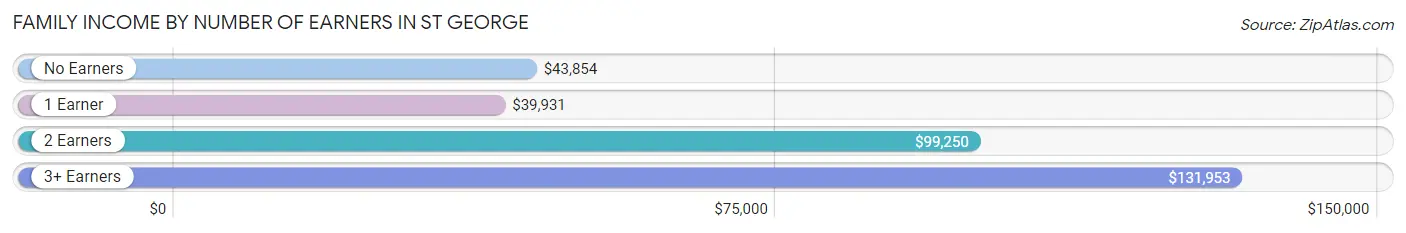
| Number of Earners | # Families | Median Income |
| No Earners | 60 (11.6%) | $43,854 |
| 1 Earner | 113 (21.9%) | $39,931 |
| 2 Earners | 224 (43.3%) | $99,250 |
| 3+ Earners | 120 (23.2%) | $131,953 |
| Total | 517 (100.0%) | $69,679 |
Household Income in St George
Household Income Brackets in St George
With 202 households falling in the category, the $35,000 to $49,999 income range is the most frequent in St George, accounting for 27.0% of all households.
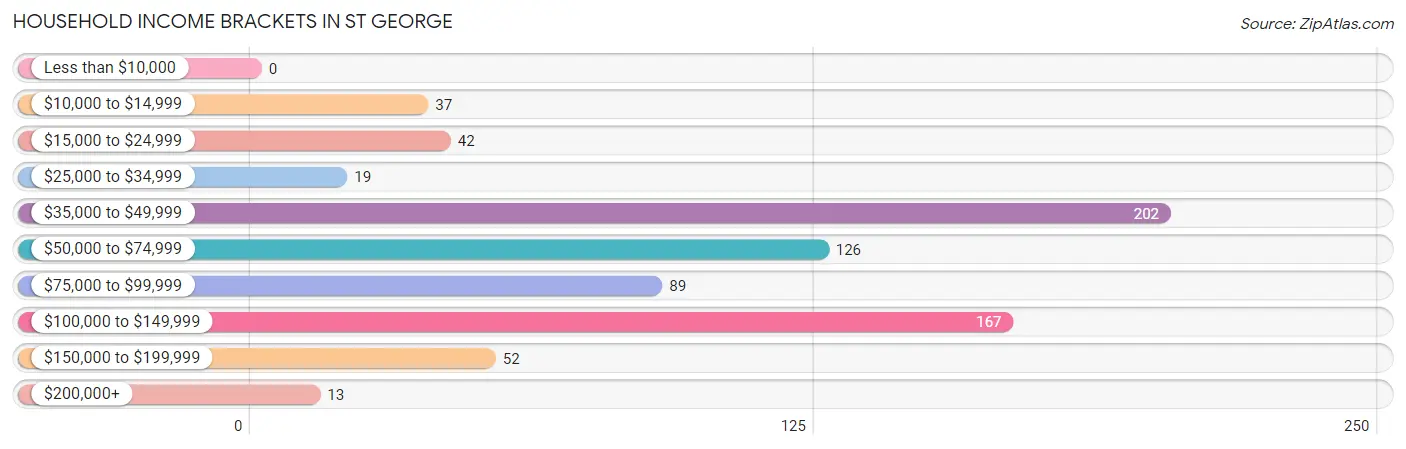
| Income Bracket | # Households | % Households |
| Less than $10,000 | 0 | 0.0% |
| $10,000 to $14,999 | 37 | 5.0% |
| $15,000 to $24,999 | 42 | 5.6% |
| $25,000 to $34,999 | 19 | 2.5% |
| $35,000 to $49,999 | 202 | 27.0% |
| $50,000 to $74,999 | 126 | 16.9% |
| $75,000 to $99,999 | 89 | 11.9% |
| $100,000 to $149,999 | 167 | 22.4% |
| $150,000 to $199,999 | 52 | 7.0% |
| $200,000+ | 13 | 1.7% |
Household Income by Householder Age in St George
The median household income in St George is $63,159, with the highest median household income of $80,143 found in the 45 to 64 years age bracket for the primary householder. A total of 288 households (38.6%) fall into this category. Meanwhile, the 15 to 24 years age bracket for the primary householder has the lowest median household income of $0, with 49 households (6.6%) in this group.
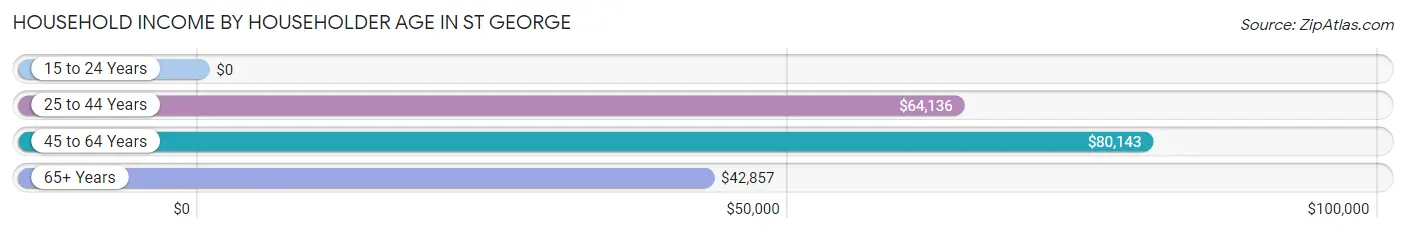
| Income Bracket | # Households | Median Income |
| 15 to 24 Years | 49 (6.6%) | $0 |
| 25 to 44 Years | 296 (39.6%) | $64,136 |
| 45 to 64 Years | 288 (38.6%) | $80,143 |
| 65+ Years | 114 (15.3%) | $42,857 |
| Total | 747 (100.0%) | $63,159 |
Poverty in St George
Income Below Poverty by Sex and Age in St George
With 12.7% poverty level for males and 12.0% for females among the residents of St George, under 5 year old males and under 5 year old females are the most vulnerable to poverty, with 23 males (57.5%) and 38 females (56.7%) in their respective age groups living below the poverty level.
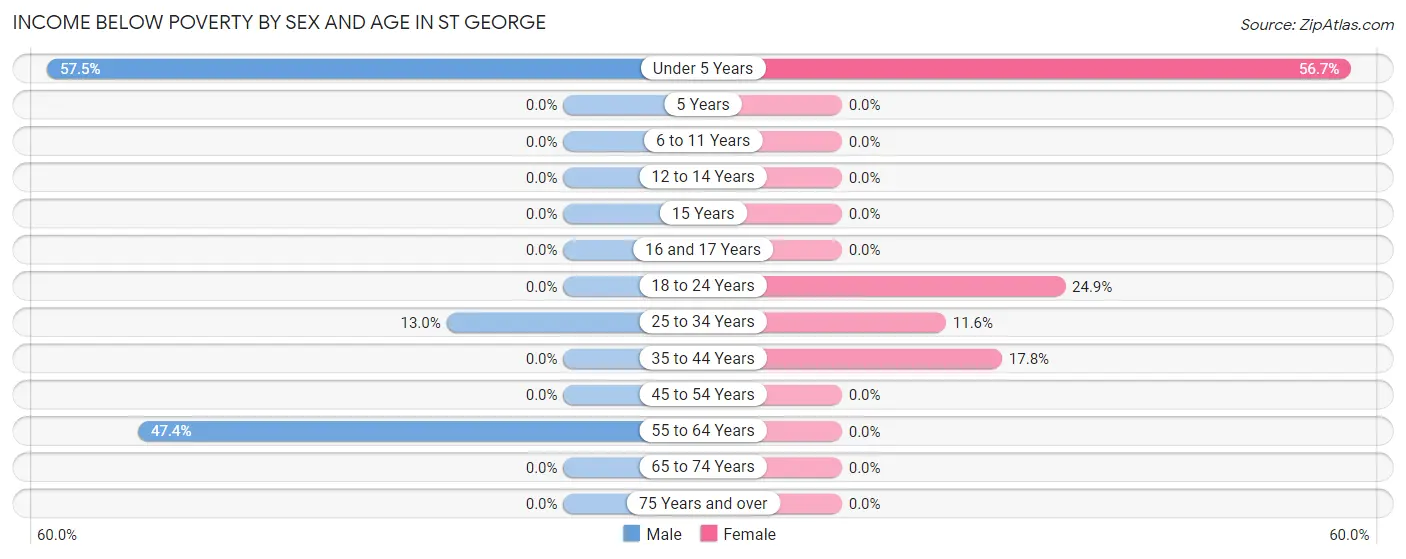
| Age Bracket | Male | Female |
| Under 5 Years | 23 (57.5%) | 38 (56.7%) |
| 5 Years | 0 (0.0%) | 0 (0.0%) |
| 6 to 11 Years | 0 (0.0%) | 0 (0.0%) |
| 12 to 14 Years | 0 (0.0%) | 0 (0.0%) |
| 15 Years | 0 (0.0%) | 0 (0.0%) |
| 16 and 17 Years | 0 (0.0%) | 0 (0.0%) |
| 18 to 24 Years | 0 (0.0%) | 48 (24.9%) |
| 25 to 34 Years | 16 (13.0%) | 19 (11.6%) |
| 35 to 44 Years | 0 (0.0%) | 23 (17.8%) |
| 45 to 54 Years | 0 (0.0%) | 0 (0.0%) |
| 55 to 64 Years | 63 (47.4%) | 0 (0.0%) |
| 65 to 74 Years | 0 (0.0%) | 0 (0.0%) |
| 75 Years and over | 0 (0.0%) | 0 (0.0%) |
| Total | 102 (12.7%) | 128 (12.0%) |
Income Above Poverty by Sex and Age in St George
According to the poverty statistics in St George, males aged 5 years and females aged 5 years are the age groups that are most secure financially, with 100.0% of males and 100.0% of females in these age groups living above the poverty line.
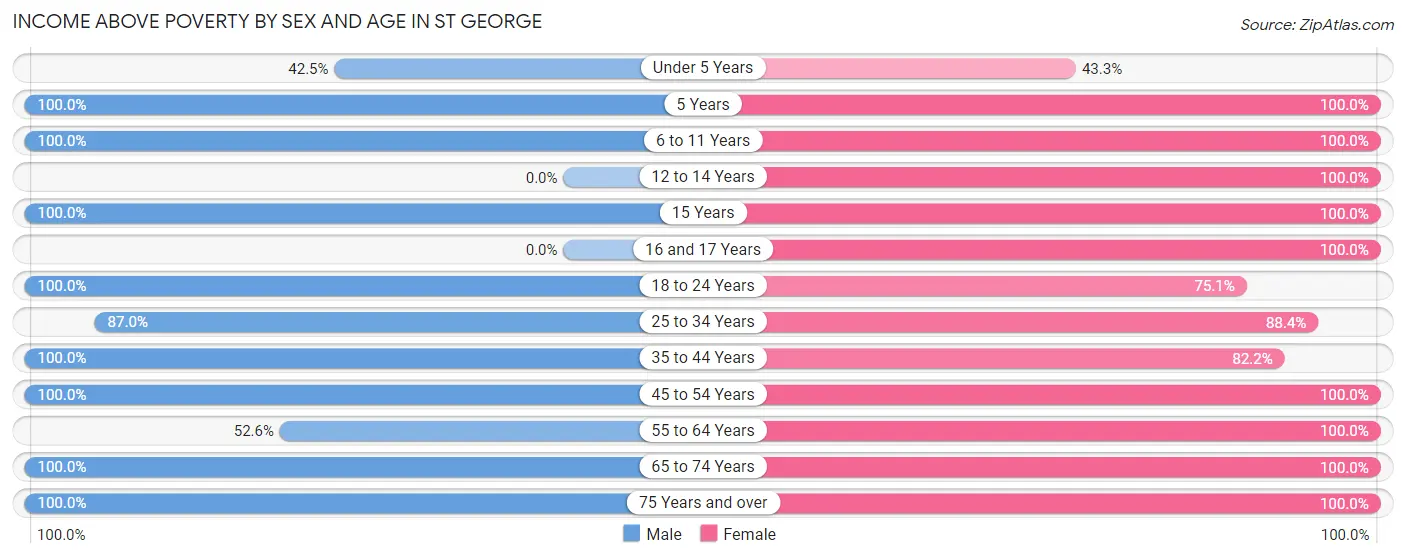
| Age Bracket | Male | Female |
| Under 5 Years | 17 (42.5%) | 29 (43.3%) |
| 5 Years | 10 (100.0%) | 37 (100.0%) |
| 6 to 11 Years | 51 (100.0%) | 10 (100.0%) |
| 12 to 14 Years | 0 (0.0%) | 25 (100.0%) |
| 15 Years | 21 (100.0%) | 13 (100.0%) |
| 16 and 17 Years | 0 (0.0%) | 68 (100.0%) |
| 18 to 24 Years | 113 (100.0%) | 145 (75.1%) |
| 25 to 34 Years | 107 (87.0%) | 145 (88.4%) |
| 35 to 44 Years | 96 (100.0%) | 106 (82.2%) |
| 45 to 54 Years | 138 (100.0%) | 156 (100.0%) |
| 55 to 64 Years | 70 (52.6%) | 106 (100.0%) |
| 65 to 74 Years | 45 (100.0%) | 34 (100.0%) |
| 75 Years and over | 33 (100.0%) | 64 (100.0%) |
| Total | 701 (87.3%) | 938 (88.0%) |
Income Below Poverty Among Married-Couple Families in St George
The poverty statistics for married-couple families in St George show that 4.2% or 16 of the total 377 families live below the poverty line. Families with 1 or 2 children have the highest poverty rate of 7.9%, comprising of 16 families. On the other hand, families with no children have the lowest poverty rate of 0.0%, which includes 0 families.
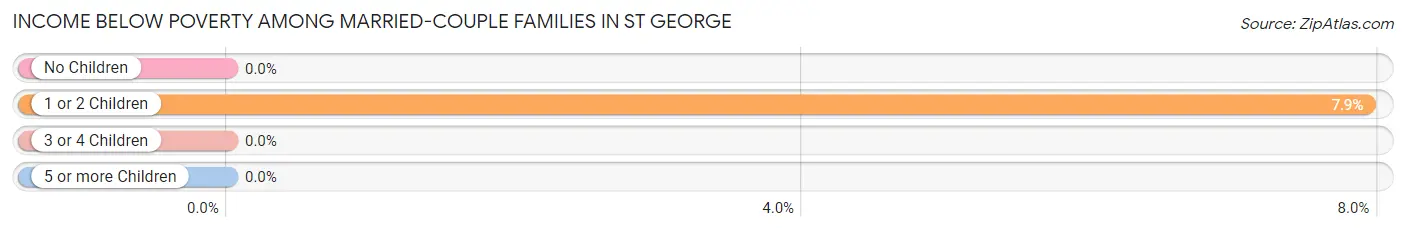
| Children | Above Poverty | Below Poverty |
| No Children | 175 (100.0%) | 0 (0.0%) |
| 1 or 2 Children | 186 (92.1%) | 16 (7.9%) |
| 3 or 4 Children | 0 (0.0%) | 0 (0.0%) |
| 5 or more Children | 0 (0.0%) | 0 (0.0%) |
| Total | 361 (95.8%) | 16 (4.2%) |
Income Below Poverty Among Single-Parent Households in St George
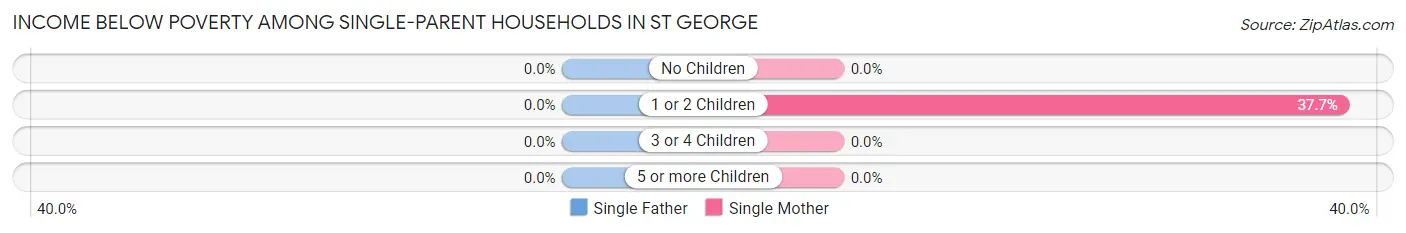
| Children | Single Father | Single Mother |
| No Children | 0 (0.0%) | 0 (0.0%) |
| 1 or 2 Children | 0 (0.0%) | 23 (37.7%) |
| 3 or 4 Children | 0 (0.0%) | 0 (0.0%) |
| 5 or more Children | 0 (0.0%) | 0 (0.0%) |
| Total | 0 (0.0%) | 23 (19.8%) |
Income Below Poverty Among Married-Couple vs Single-Parent Households in St George
The poverty data for St George shows that 16 of the married-couple family households (4.2%) and 23 of the single-parent households (16.4%) are living below the poverty level. Within the married-couple family households, those with 1 or 2 children have the highest poverty rate, with 16 households (7.9%) falling below the poverty line. Among the single-parent households, those with 1 or 2 children have the highest poverty rate, with 23 household (37.7%) living below poverty.
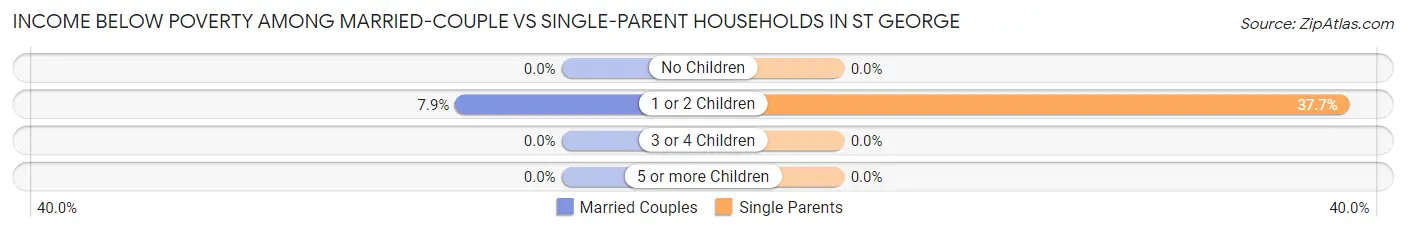
| Children | Married-Couple Families | Single-Parent Households |
| No Children | 0 (0.0%) | 0 (0.0%) |
| 1 or 2 Children | 16 (7.9%) | 23 (37.7%) |
| 3 or 4 Children | 0 (0.0%) | 0 (0.0%) |
| 5 or more Children | 0 (0.0%) | 0 (0.0%) |
| Total | 16 (4.2%) | 23 (16.4%) |
Race in St George
The most populous races in St George are White / Caucasian (1,707 | 91.0%), Asian (55 | 2.9%), and Native / Alaskan (47 | 2.5%).
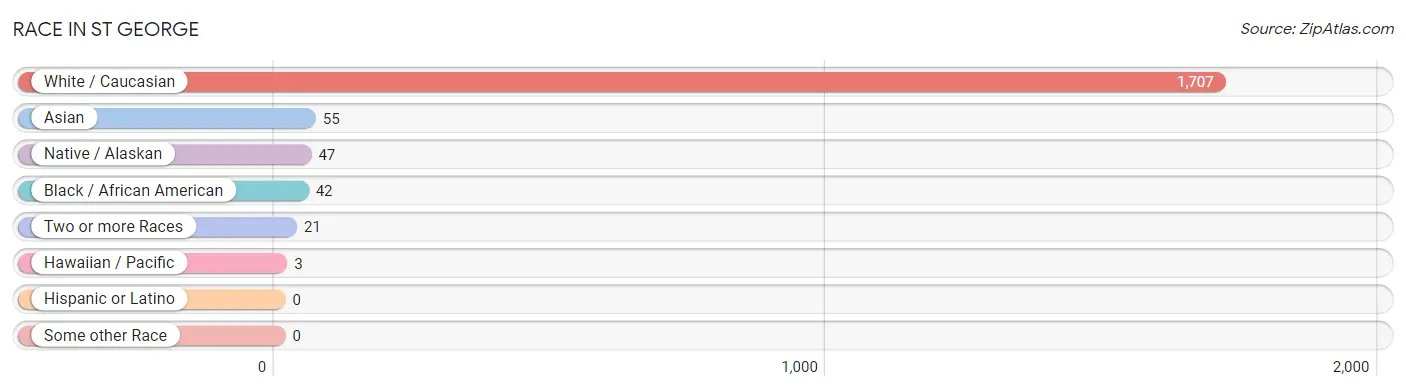
| Race | # Population | % Population |
| Asian | 55 | 2.9% |
| Black / African American | 42 | 2.2% |
| Hawaiian / Pacific | 3 | 0.2% |
| Hispanic or Latino | 0 | 0.0% |
| Native / Alaskan | 47 | 2.5% |
| White / Caucasian | 1,707 | 91.0% |
| Two or more Races | 21 | 1.1% |
| Some other Race | 0 | 0.0% |
| Total | 1,875 | 100.0% |
Ancestry in St George
The most populous ancestries reported in St George are Yugoslavian (494 | 26.4%), German (434 | 23.2%), English (226 | 12.0%), Irish (147 | 7.8%), and Italian (109 | 5.8%), together accounting for 75.2% of all St George residents.
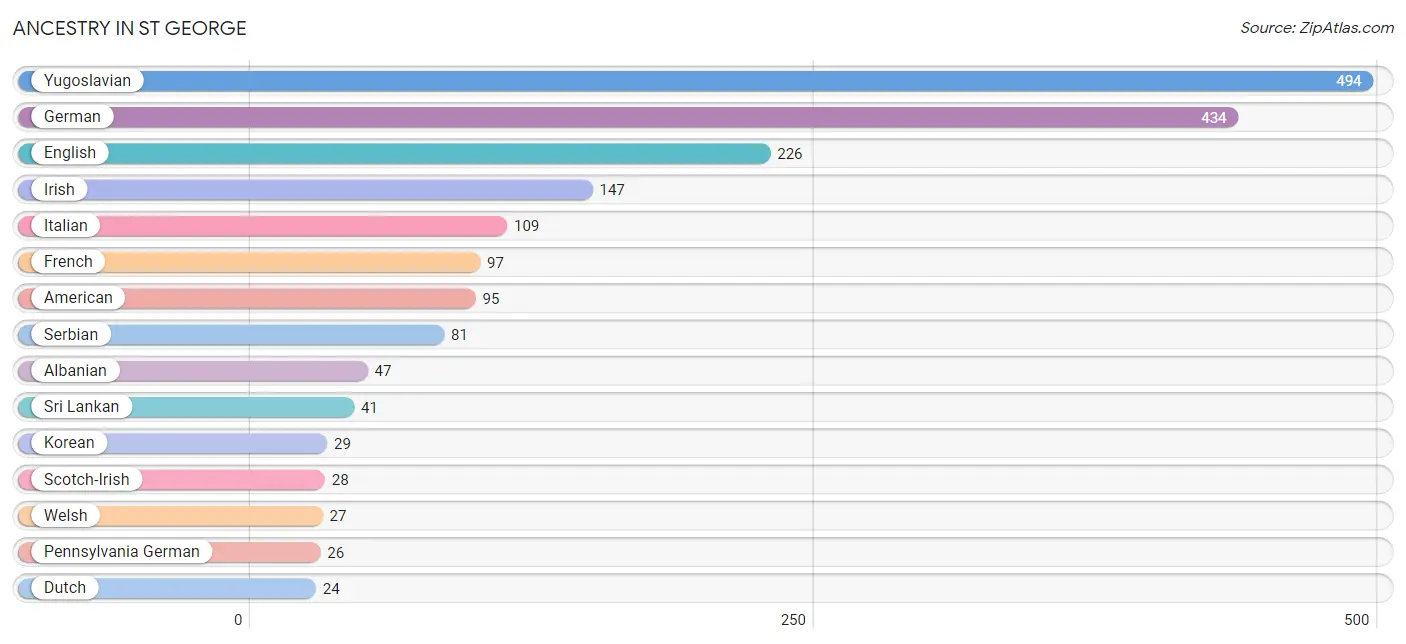
| Ancestry | # Population | % Population |
| Albanian | 47 | 2.5% |
| American | 95 | 5.1% |
| Dutch | 24 | 1.3% |
| English | 226 | 12.0% |
| French | 97 | 5.2% |
| German | 434 | 23.2% |
| Irish | 147 | 7.8% |
| Italian | 109 | 5.8% |
| Korean | 29 | 1.5% |
| Lithuanian | 12 | 0.6% |
| Pennsylvania German | 26 | 1.4% |
| Polish | 11 | 0.6% |
| Scotch-Irish | 28 | 1.5% |
| Scottish | 19 | 1.0% |
| Serbian | 81 | 4.3% |
| Sri Lankan | 41 | 2.2% |
| Swedish | 19 | 1.0% |
| Welsh | 27 | 1.4% |
| Yugoslavian | 494 | 26.4% | View All 19 Rows |
Immigrants in St George
The most numerous immigrant groups reported in St George came from Europe (499 | 26.6%), Eastern Europe (420 | 22.4%), Bosnia and Herzegovina (288 | 15.4%), Germany (79 | 4.2%), and Western Europe (79 | 4.2%), together accounting for 72.8% of all St George residents.
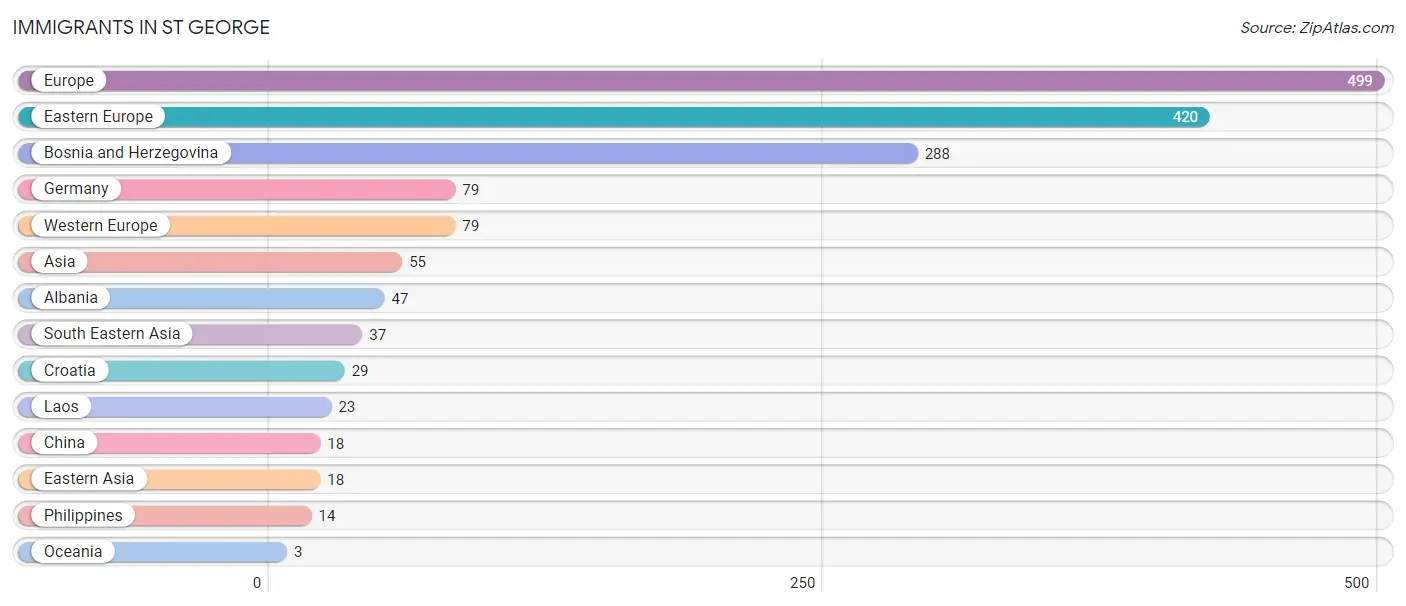
| Immigration Origin | # Population | % Population |
| Albania | 47 | 2.5% |
| Asia | 55 | 2.9% |
| Bosnia and Herzegovina | 288 | 15.4% |
| China | 18 | 1.0% |
| Croatia | 29 | 1.5% |
| Eastern Asia | 18 | 1.0% |
| Eastern Europe | 420 | 22.4% |
| Europe | 499 | 26.6% |
| Germany | 79 | 4.2% |
| Laos | 23 | 1.2% |
| Oceania | 3 | 0.2% |
| Philippines | 14 | 0.7% |
| South Eastern Asia | 37 | 2.0% |
| Western Europe | 79 | 4.2% | View All 14 Rows |
Sex and Age in St George
Sex and Age in St George
The most populous age groups in St George are 20 to 24 Years (96 | 12.0%) for men and 15 to 19 Years (169 | 15.8%) for women.
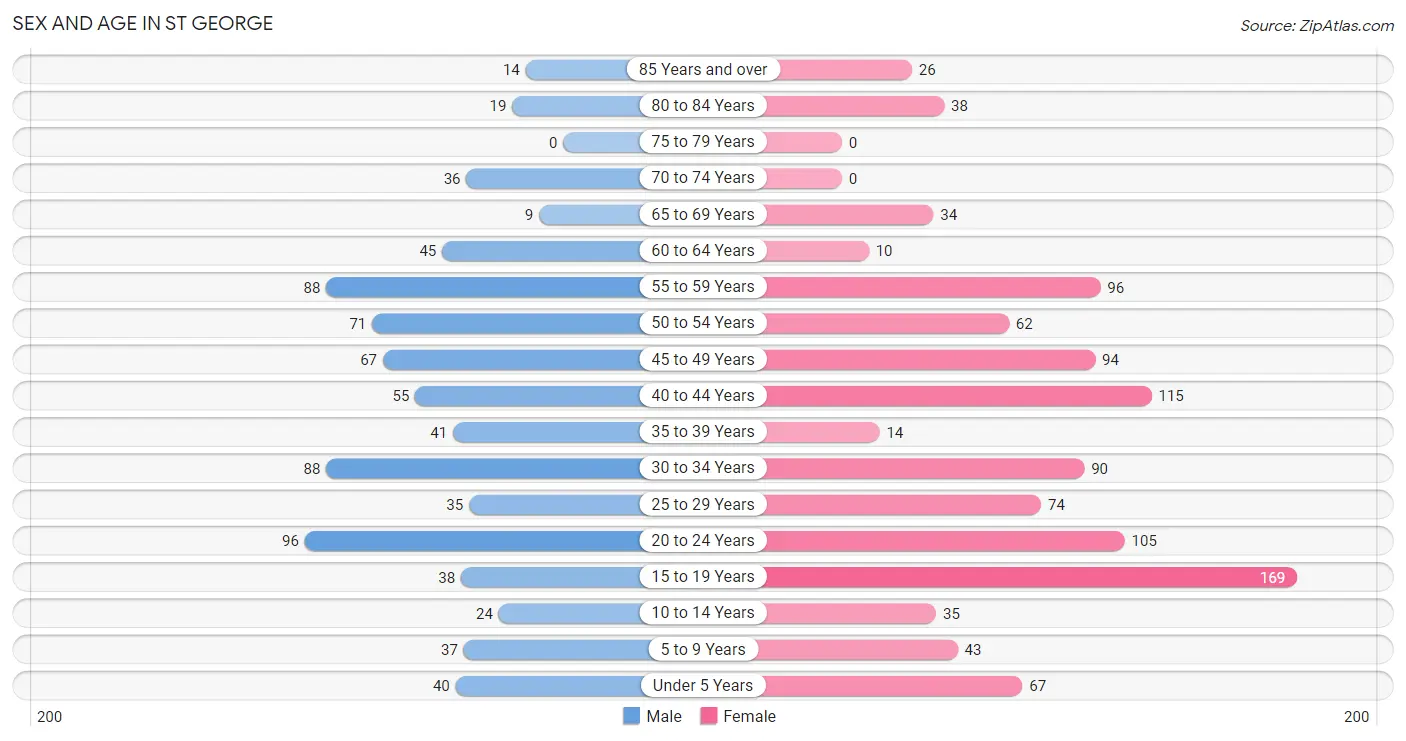
| Age Bracket | Male | Female |
| Under 5 Years | 40 (5.0%) | 67 (6.2%) |
| 5 to 9 Years | 37 (4.6%) | 43 (4.0%) |
| 10 to 14 Years | 24 (3.0%) | 35 (3.3%) |
| 15 to 19 Years | 38 (4.7%) | 169 (15.8%) |
| 20 to 24 Years | 96 (12.0%) | 105 (9.8%) |
| 25 to 29 Years | 35 (4.4%) | 74 (6.9%) |
| 30 to 34 Years | 88 (11.0%) | 90 (8.4%) |
| 35 to 39 Years | 41 (5.1%) | 14 (1.3%) |
| 40 to 44 Years | 55 (6.9%) | 115 (10.7%) |
| 45 to 49 Years | 67 (8.3%) | 94 (8.8%) |
| 50 to 54 Years | 71 (8.8%) | 62 (5.8%) |
| 55 to 59 Years | 88 (11.0%) | 96 (9.0%) |
| 60 to 64 Years | 45 (5.6%) | 10 (0.9%) |
| 65 to 69 Years | 9 (1.1%) | 34 (3.2%) |
| 70 to 74 Years | 36 (4.5%) | 0 (0.0%) |
| 75 to 79 Years | 0 (0.0%) | 0 (0.0%) |
| 80 to 84 Years | 19 (2.4%) | 38 (3.5%) |
| 85 Years and over | 14 (1.7%) | 26 (2.4%) |
| Total | 803 (100.0%) | 1,072 (100.0%) |
Families and Households in St George
Median Family Size in St George
The median family size in St George is 2.90 persons per family, with married-couple families (377 | 72.9%) accounting for the largest median family size of 3.1 persons per family. On the other hand, single male/father families (24 | 4.6%) represent the smallest median family size with 2.08 persons per family.
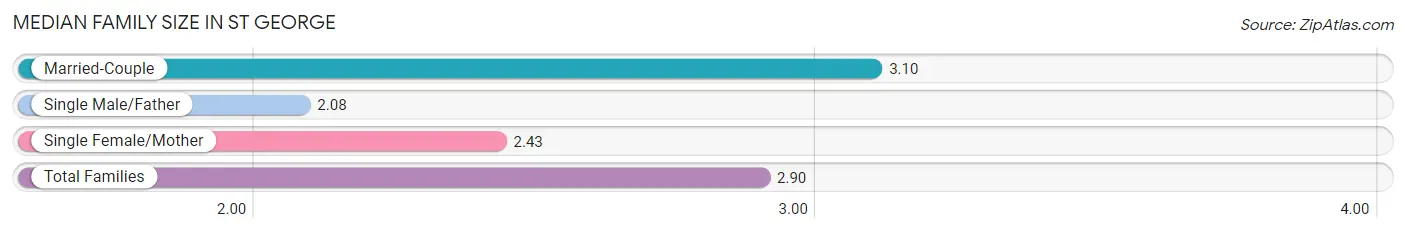
| Family Type | # Families | Family Size |
| Married-Couple | 377 (72.9%) | 3.10 |
| Single Male/Father | 24 (4.6%) | 2.08 |
| Single Female/Mother | 116 (22.4%) | 2.43 |
| Total Families | 517 (100.0%) | 2.90 |
Median Household Size in St George
The median household size in St George is 2.51 persons per household, with married-couple households (377 | 50.5%) accounting for the largest median household size of 3.22 persons per household. non-family households (230 | 30.8%) represent the smallest median household size with 1.22 persons per household.
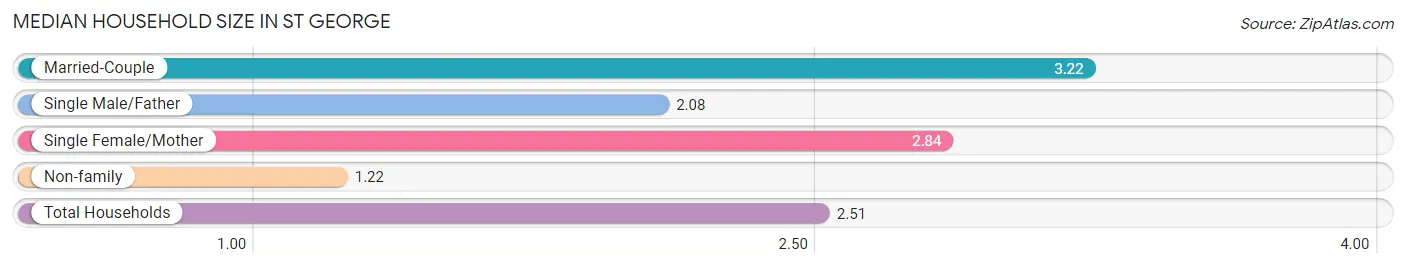
| Household Type | # Households | Household Size |
| Married-Couple | 377 (50.5%) | 3.22 |
| Single Male/Father | 24 (3.2%) | 2.08 |
| Single Female/Mother | 116 (15.5%) | 2.84 |
| Non-family | 230 (30.8%) | 1.22 |
| Total Households | 747 (100.0%) | 2.51 |
Household Size by Marriage Status in St George
Out of a total of 747 households in St George, 517 (69.2%) are family households, while 230 (30.8%) are nonfamily households. The most numerous type of family households are 2-person households, comprising 214, and the most common type of nonfamily households are 1-person households, comprising 183.
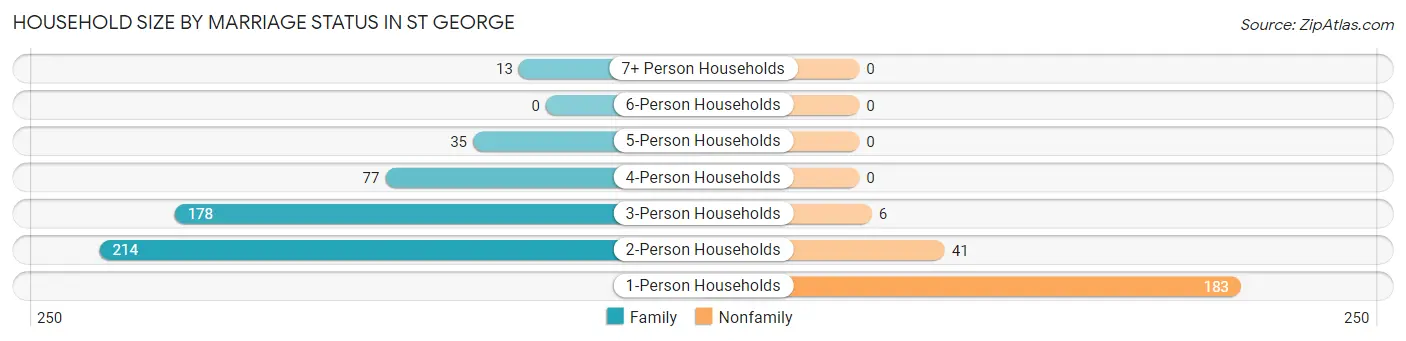
| Household Size | Family Households | Nonfamily Households |
| 1-Person Households | - | 183 (24.5%) |
| 2-Person Households | 214 (28.6%) | 41 (5.5%) |
| 3-Person Households | 178 (23.8%) | 6 (0.8%) |
| 4-Person Households | 77 (10.3%) | 0 (0.0%) |
| 5-Person Households | 35 (4.7%) | 0 (0.0%) |
| 6-Person Households | 0 (0.0%) | 0 (0.0%) |
| 7+ Person Households | 13 (1.7%) | 0 (0.0%) |
| Total | 517 (69.2%) | 230 (30.8%) |
Female Fertility in St George
Fertility by Age in St George
Average fertility rate in St George is 29.0 births per 1,000 women. Women in the age bracket of 20 to 34 years have the highest fertility rate with 74.0 births per 1,000 women. Women in the age bracket of 20 to 34 years acount for 100.0% of all women with births.
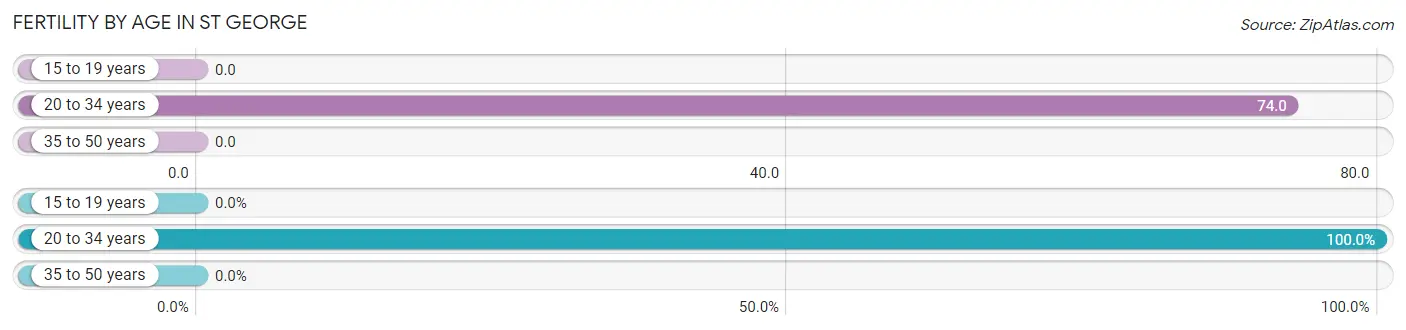
| Age Bracket | Women with Births | Births / 1,000 Women |
| 15 to 19 years | 0 (0.0%) | 0.0 |
| 20 to 34 years | 20 (100.0%) | 74.0 |
| 35 to 50 years | 0 (0.0%) | 0.0 |
| Total | 20 (100.0%) | 29.0 |
Fertility by Age by Marriage Status in St George
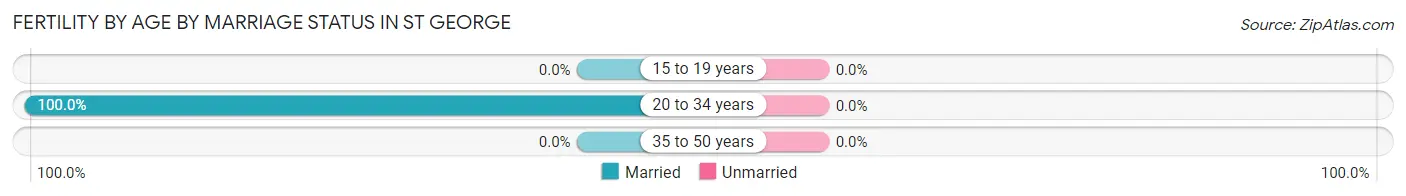
| Age Bracket | Married | Unmarried |
| 15 to 19 years | 0 (0.0%) | 0 (0.0%) |
| 20 to 34 years | 20 (100.0%) | 0 (0.0%) |
| 35 to 50 years | 0 (0.0%) | 0 (0.0%) |
| Total | 20 (100.0%) | 0 (0.0%) |
Fertility by Education in St George
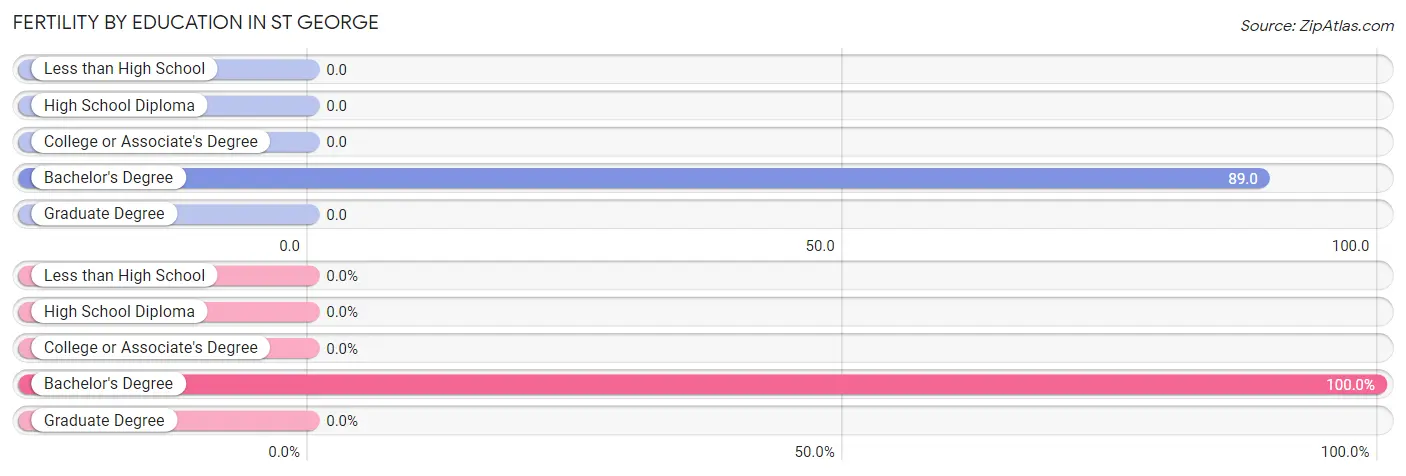
| Educational Attainment | Women with Births | Births / 1,000 Women |
| Less than High School | 0 (0.0%) | 0.0 |
| High School Diploma | 0 (0.0%) | 0.0 |
| College or Associate's Degree | 0 (0.0%) | 0.0 |
| Bachelor's Degree | 20 (100.0%) | 89.0 |
| Graduate Degree | 0 (0.0%) | 0.0 |
| Total | 20 (100.0%) | 29.0 |
Fertility by Education by Marriage Status in St George
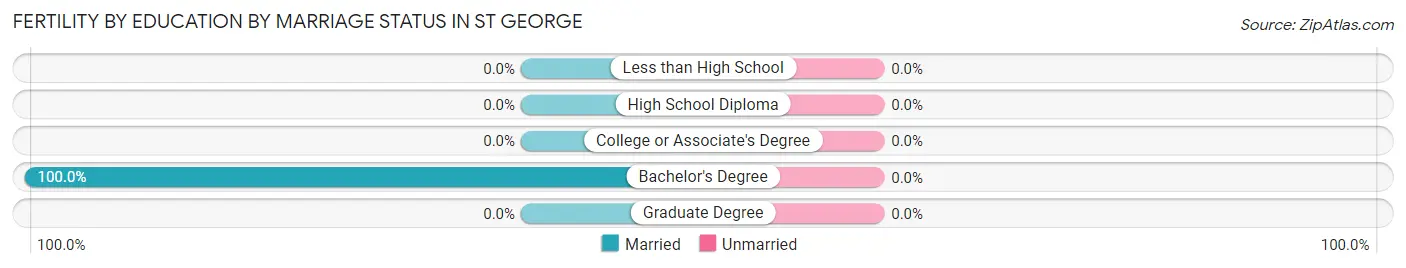
| Educational Attainment | Married | Unmarried |
| Less than High School | 0 (0.0%) | 0 (0.0%) |
| High School Diploma | 0 (0.0%) | 0 (0.0%) |
| College or Associate's Degree | 0 (0.0%) | 0 (0.0%) |
| Bachelor's Degree | 20 (100.0%) | 0 (0.0%) |
| Graduate Degree | 0 (0.0%) | 0 (0.0%) |
| Total | 20 (100.0%) | 0 (0.0%) |
Employment Characteristics in St George
Employment by Class of Employer in St George
Among the 1,154 employed individuals in St George, private company employees (753 | 65.2%), not-for-profit organizations (150 | 13.0%), and local government employees (147 | 12.7%) make up the most common classes of employment.
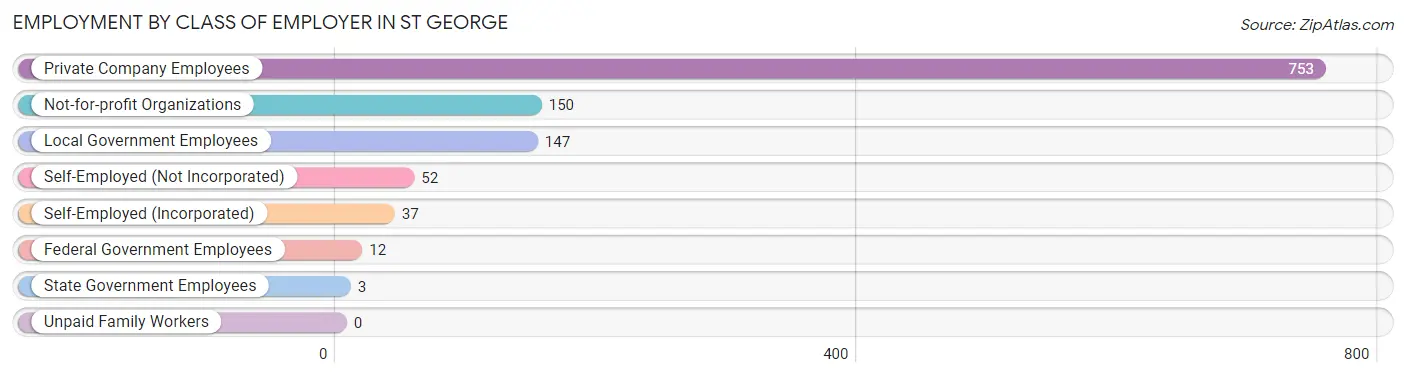
| Employer Class | # Employees | % Employees |
| Private Company Employees | 753 | 65.2% |
| Self-Employed (Incorporated) | 37 | 3.2% |
| Self-Employed (Not Incorporated) | 52 | 4.5% |
| Not-for-profit Organizations | 150 | 13.0% |
| Local Government Employees | 147 | 12.7% |
| State Government Employees | 3 | 0.3% |
| Federal Government Employees | 12 | 1.0% |
| Unpaid Family Workers | 0 | 0.0% |
| Total | 1,154 | 100.0% |
Employment Status by Age in St George
According to the labor force statistics for St George, out of the total population over 16 years of age (1,595), 77.0% or 1,228 individuals are in the labor force, with 1.4% or 17 of them unemployed. The age group with the highest labor force participation rate is 35 to 44 years, with 100.0% or 225 individuals in the labor force. Within the labor force, the 45 to 54 years age range has the highest percentage of unemployed individuals, with 5.8% or 17 of them being unemployed.
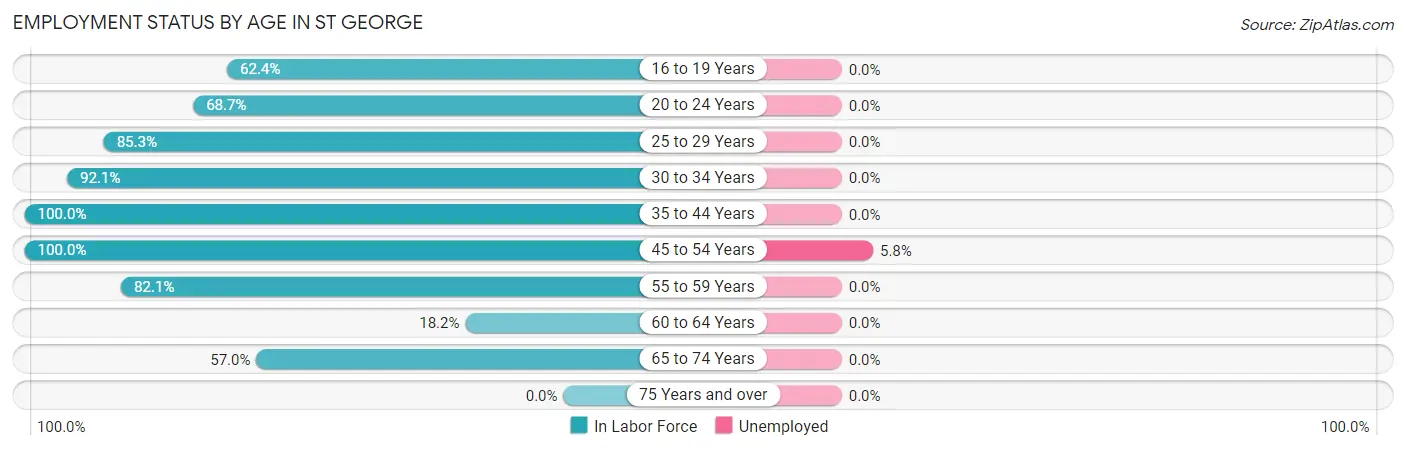
| Age Bracket | In Labor Force | Unemployed |
| 16 to 19 Years | 108 (62.4%) | 0 (0.0%) |
| 20 to 24 Years | 138 (68.7%) | 0 (0.0%) |
| 25 to 29 Years | 93 (85.3%) | 0 (0.0%) |
| 30 to 34 Years | 164 (92.1%) | 0 (0.0%) |
| 35 to 44 Years | 225 (100.0%) | 0 (0.0%) |
| 45 to 54 Years | 294 (100.0%) | 17 (5.8%) |
| 55 to 59 Years | 151 (82.1%) | 0 (0.0%) |
| 60 to 64 Years | 10 (18.2%) | 0 (0.0%) |
| 65 to 74 Years | 45 (57.0%) | 0 (0.0%) |
| 75 Years and over | 0 (0.0%) | 0 (0.0%) |
| Total | 1,228 (77.0%) | 17 (1.4%) |
Employment Status by Educational Attainment in St George
According to labor force statistics for St George, 89.7% of individuals (937) out of the total population between 25 and 64 years of age (1,045) are in the labor force, with 1.8% or 17 of them being unemployed. The group with the highest labor force participation rate are those with the educational attainment of less than high school, with 100.0% or 163 individuals in the labor force. Within the labor force, individuals with less than high school education have the highest percentage of unemployment, with 10.4% or 17 of them being unemployed.
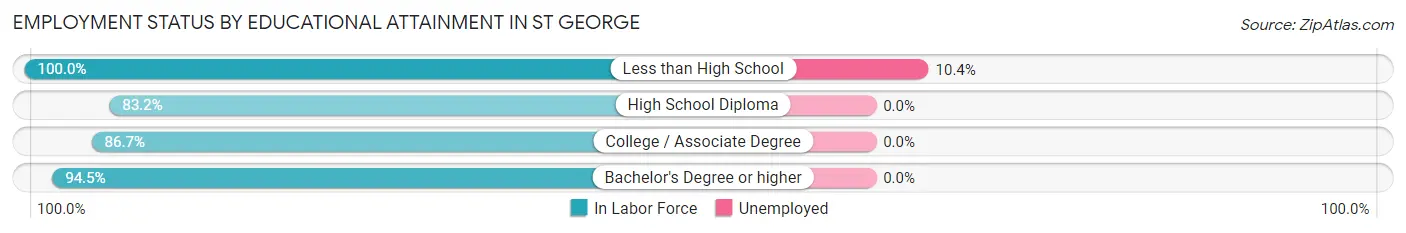
| Educational Attainment | In Labor Force | Unemployed |
| Less than High School | 163 (100.0%) | 17 (10.4%) |
| High School Diploma | 242 (83.2%) | 0 (0.0%) |
| College / Associate Degree | 293 (86.7%) | 0 (0.0%) |
| Bachelor's Degree or higher | 239 (94.5%) | 0 (0.0%) |
| Total | 937 (89.7%) | 19 (1.8%) |
Employment Occupations by Sex in St George
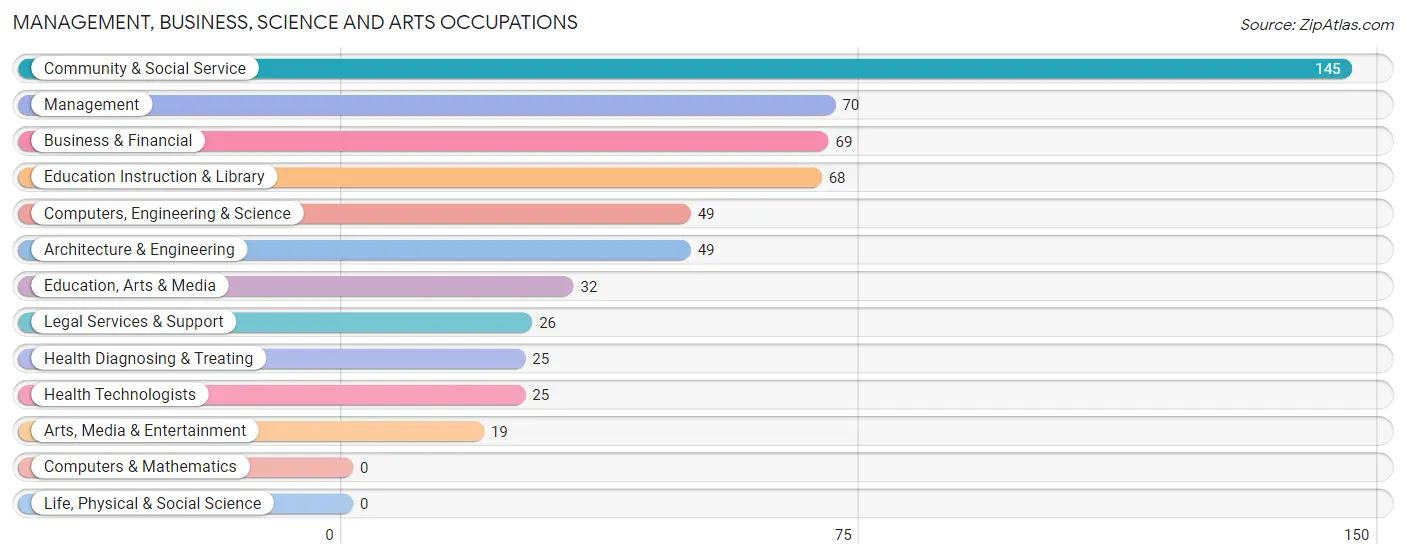
Management, Business, Science and Arts Occupations
The most common Management, Business, Science and Arts occupations in St George are Community & Social Service (145 | 12.0%), Management (70 | 5.8%), Business & Financial (69 | 5.7%), Education Instruction & Library (68 | 5.6%), and Computers, Engineering & Science (49 | 4.1%).
Management, Business, Science and Arts Occupations by Sex
Within the Management, Business, Science and Arts occupations in St George, the most male-oriented occupations are Computers, Engineering & Science (100.0%), Architecture & Engineering (100.0%), and Arts, Media & Entertainment (100.0%), while the most female-oriented occupations are Education, Arts & Media (100.0%), Education Instruction & Library (100.0%), and Health Diagnosing & Treating (100.0%).
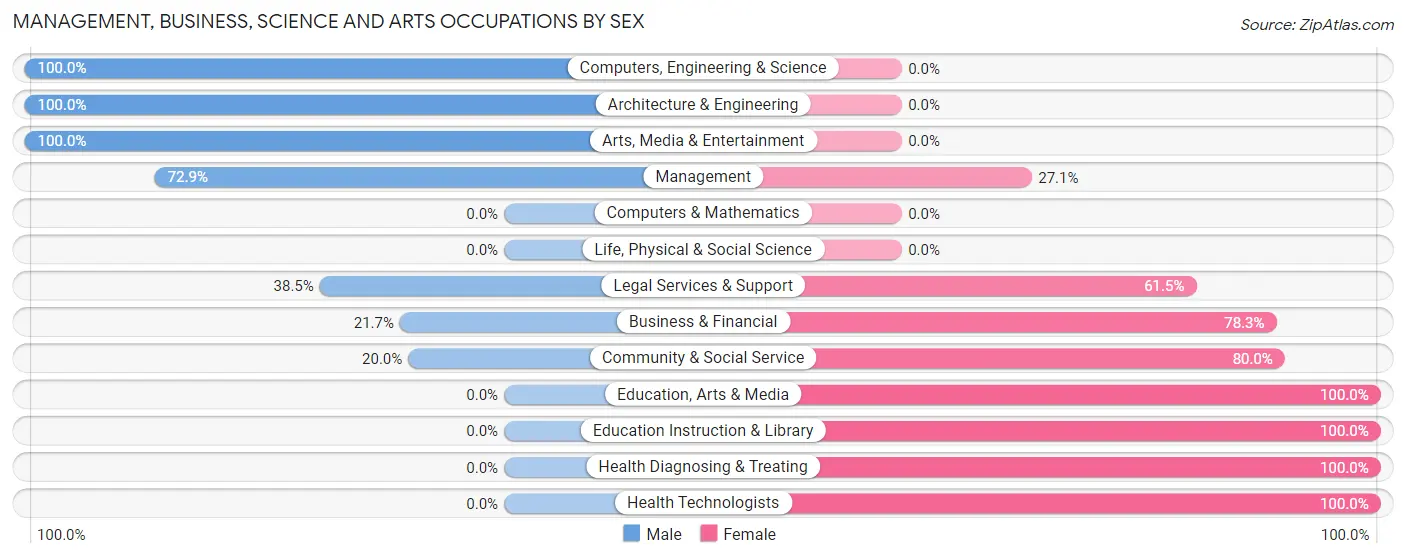
| Occupation | Male | Female |
| Management | 51 (72.9%) | 19 (27.1%) |
| Business & Financial | 15 (21.7%) | 54 (78.3%) |
| Computers, Engineering & Science | 49 (100.0%) | 0 (0.0%) |
| Computers & Mathematics | 0 (0.0%) | 0 (0.0%) |
| Architecture & Engineering | 49 (100.0%) | 0 (0.0%) |
| Life, Physical & Social Science | 0 (0.0%) | 0 (0.0%) |
| Community & Social Service | 29 (20.0%) | 116 (80.0%) |
| Education, Arts & Media | 0 (0.0%) | 32 (100.0%) |
| Legal Services & Support | 10 (38.5%) | 16 (61.5%) |
| Education Instruction & Library | 0 (0.0%) | 68 (100.0%) |
| Arts, Media & Entertainment | 19 (100.0%) | 0 (0.0%) |
| Health Diagnosing & Treating | 0 (0.0%) | 25 (100.0%) |
| Health Technologists | 0 (0.0%) | 25 (100.0%) |
| Total (Category) | 144 (40.2%) | 214 (59.8%) |
| Total (Overall) | 569 (47.0%) | 642 (53.0%) |
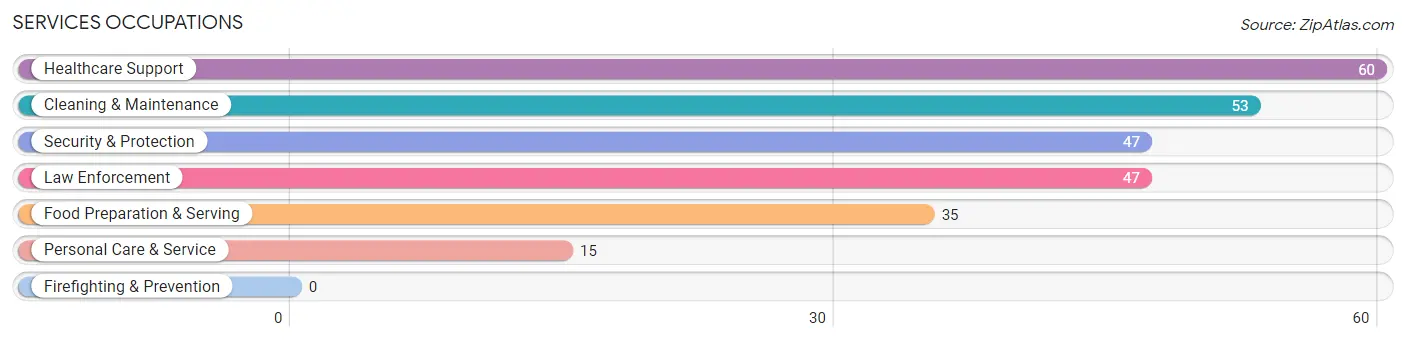
Services Occupations
The most common Services occupations in St George are Healthcare Support (60 | 5.0%), Cleaning & Maintenance (53 | 4.4%), Security & Protection (47 | 3.9%), Law Enforcement (47 | 3.9%), and Food Preparation & Serving (35 | 2.9%).
Services Occupations by Sex
Within the Services occupations in St George, the most male-oriented occupations are Security & Protection (100.0%), Law Enforcement (100.0%), and Food Preparation & Serving (100.0%), while the most female-oriented occupations are Healthcare Support (100.0%), Personal Care & Service (100.0%), and Cleaning & Maintenance (20.7%).
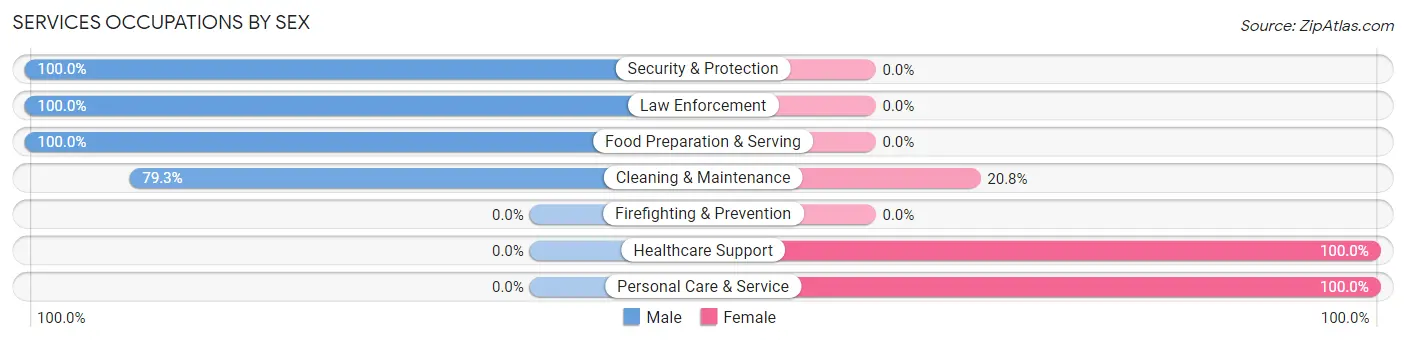
| Occupation | Male | Female |
| Healthcare Support | 0 (0.0%) | 60 (100.0%) |
| Security & Protection | 47 (100.0%) | 0 (0.0%) |
| Firefighting & Prevention | 0 (0.0%) | 0 (0.0%) |
| Law Enforcement | 47 (100.0%) | 0 (0.0%) |
| Food Preparation & Serving | 35 (100.0%) | 0 (0.0%) |
| Cleaning & Maintenance | 42 (79.2%) | 11 (20.7%) |
| Personal Care & Service | 0 (0.0%) | 15 (100.0%) |
| Total (Category) | 124 (59.1%) | 86 (40.9%) |
| Total (Overall) | 569 (47.0%) | 642 (53.0%) |
Sales and Office Occupations
The most common Sales and Office occupations in St George are Office & Administration (220 | 18.2%), and Sales & Related (22 | 1.8%).

Sales and Office Occupations by Sex

| Occupation | Male | Female |
| Sales & Related | 12 (54.5%) | 10 (45.5%) |
| Office & Administration | 41 (18.6%) | 179 (81.4%) |
| Total (Category) | 53 (21.9%) | 189 (78.1%) |
| Total (Overall) | 569 (47.0%) | 642 (53.0%) |
Natural Resources, Construction and Maintenance Occupations
The most common Natural Resources, Construction and Maintenance occupations in St George are Construction & Extraction (71 | 5.9%), and Installation, Maintenance & Repair (46 | 3.8%).
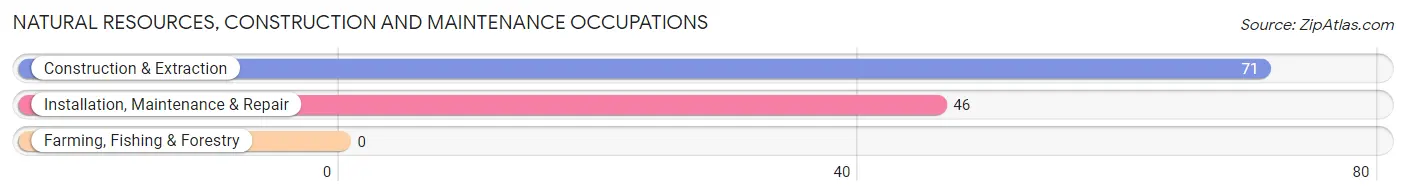
Natural Resources, Construction and Maintenance Occupations by Sex

| Occupation | Male | Female |
| Farming, Fishing & Forestry | 0 (0.0%) | 0 (0.0%) |
| Construction & Extraction | 71 (100.0%) | 0 (0.0%) |
| Installation, Maintenance & Repair | 46 (100.0%) | 0 (0.0%) |
| Total (Category) | 117 (100.0%) | 0 (0.0%) |
| Total (Overall) | 569 (47.0%) | 642 (53.0%) |
Production, Transportation and Moving Occupations
The most common Production, Transportation and Moving occupations in St George are Material Moving (112 | 9.2%), Production (103 | 8.5%), and Transportation (69 | 5.7%).
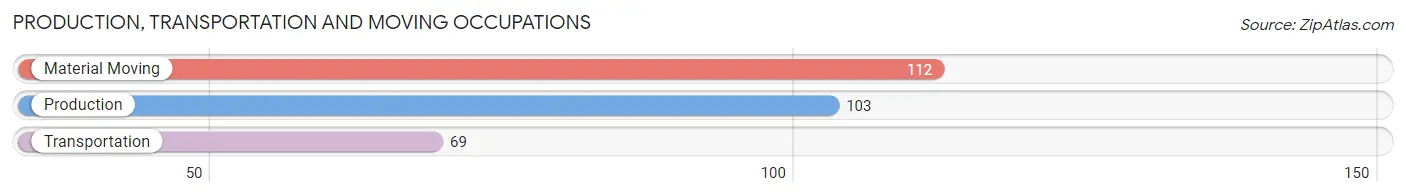
Production, Transportation and Moving Occupations by Sex
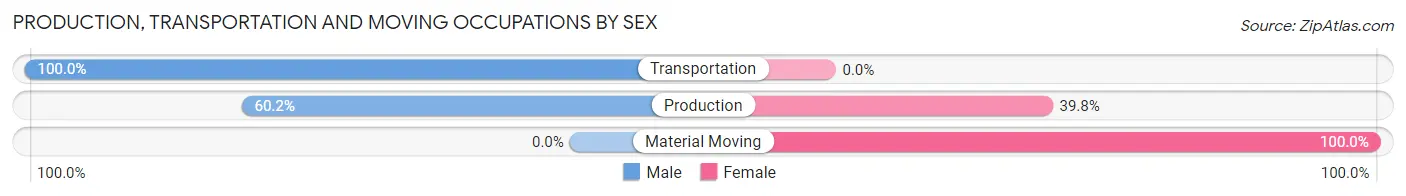
| Occupation | Male | Female |
| Production | 62 (60.2%) | 41 (39.8%) |
| Transportation | 69 (100.0%) | 0 (0.0%) |
| Material Moving | 0 (0.0%) | 112 (100.0%) |
| Total (Category) | 131 (46.1%) | 153 (53.9%) |
| Total (Overall) | 569 (47.0%) | 642 (53.0%) |
Employment Industries by Sex in St George
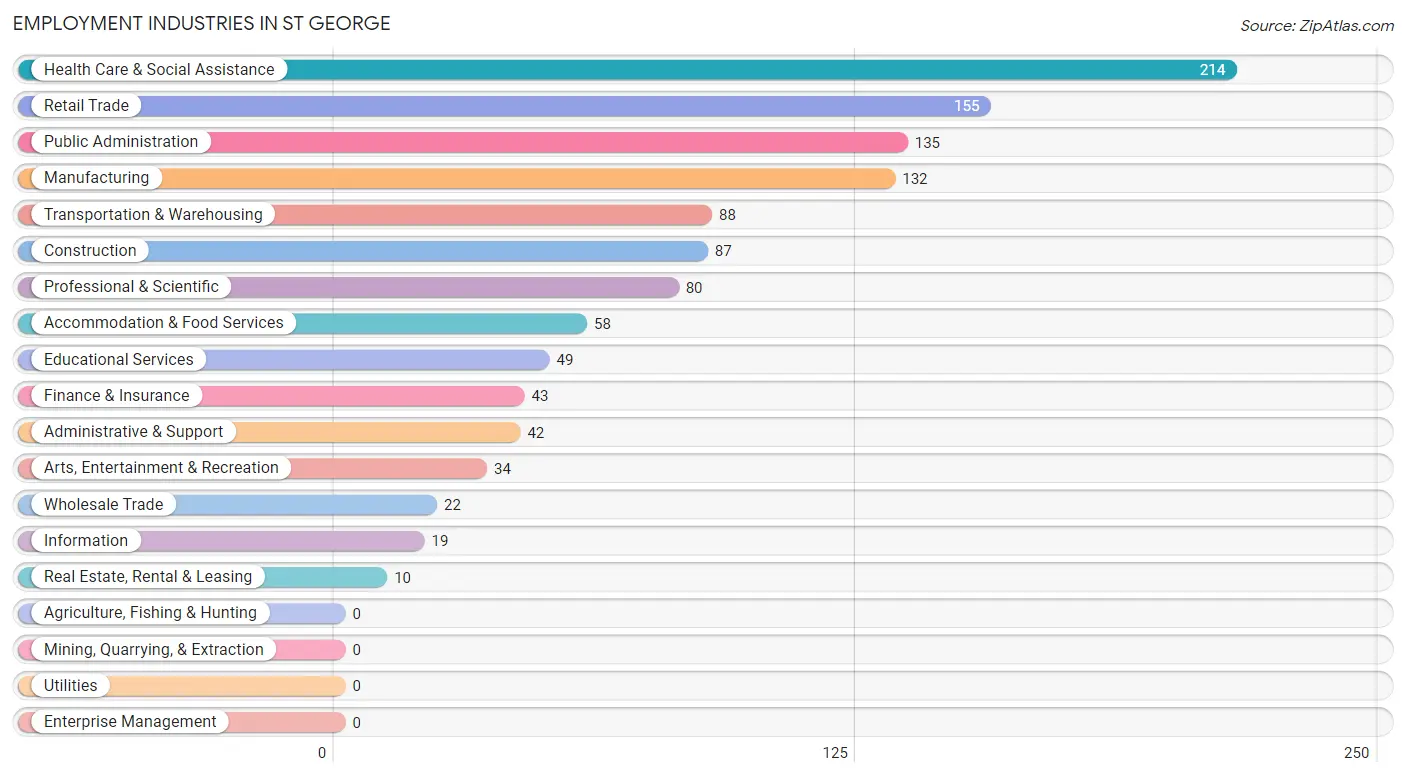
Employment Industries in St George
The major employment industries in St George include Health Care & Social Assistance (214 | 17.7%), Retail Trade (155 | 12.8%), Public Administration (135 | 11.2%), Manufacturing (132 | 10.9%), and Transportation & Warehousing (88 | 7.3%).
Employment Industries by Sex in St George
The St George industries that see more men than women are Construction (100.0%), Wholesale Trade (100.0%), and Transportation & Warehousing (100.0%), whereas the industries that tend to have a higher number of women are Retail Trade (100.0%), Finance & Insurance (100.0%), and Educational Services (100.0%).
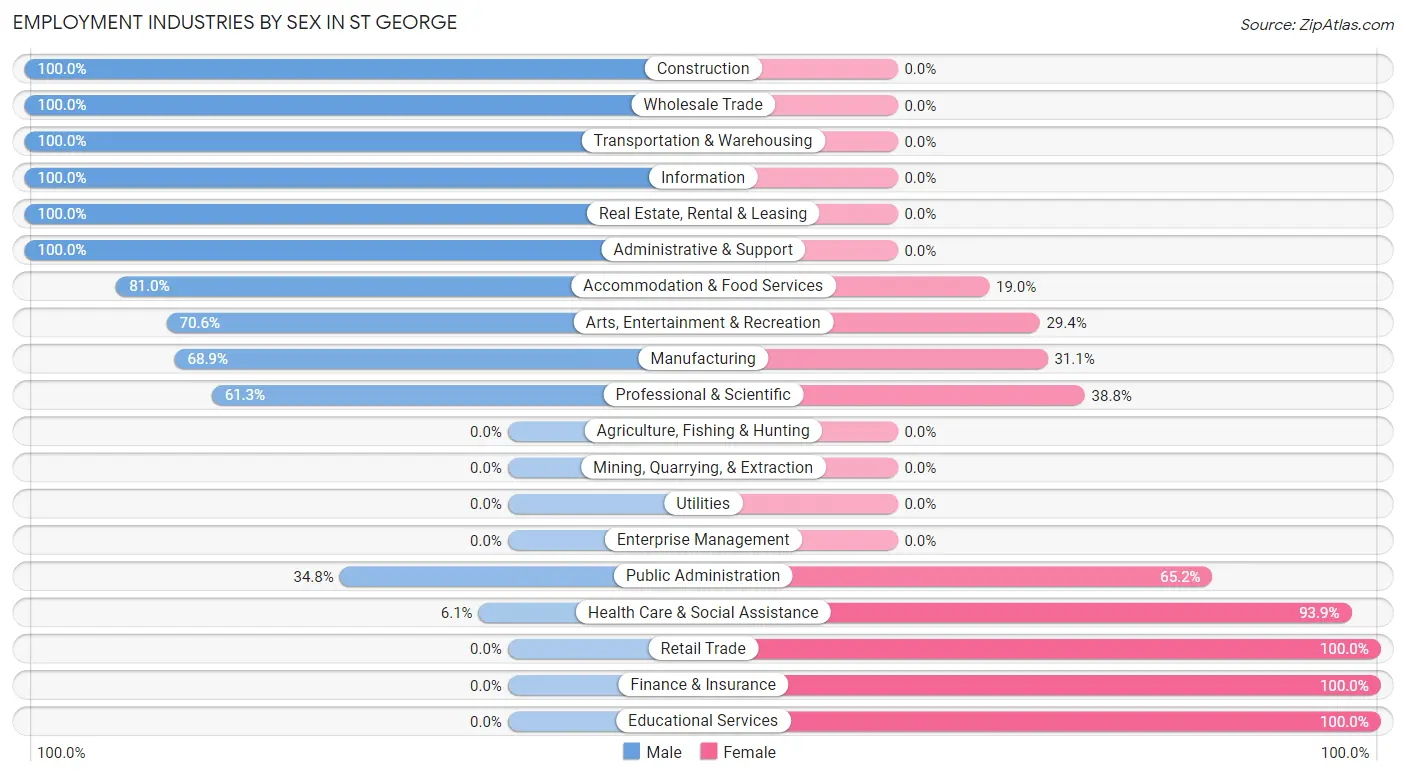
| Industry | Male | Female |
| Agriculture, Fishing & Hunting | 0 (0.0%) | 0 (0.0%) |
| Mining, Quarrying, & Extraction | 0 (0.0%) | 0 (0.0%) |
| Construction | 87 (100.0%) | 0 (0.0%) |
| Manufacturing | 91 (68.9%) | 41 (31.1%) |
| Wholesale Trade | 22 (100.0%) | 0 (0.0%) |
| Retail Trade | 0 (0.0%) | 155 (100.0%) |
| Transportation & Warehousing | 88 (100.0%) | 0 (0.0%) |
| Utilities | 0 (0.0%) | 0 (0.0%) |
| Information | 19 (100.0%) | 0 (0.0%) |
| Finance & Insurance | 0 (0.0%) | 43 (100.0%) |
| Real Estate, Rental & Leasing | 10 (100.0%) | 0 (0.0%) |
| Professional & Scientific | 49 (61.3%) | 31 (38.8%) |
| Enterprise Management | 0 (0.0%) | 0 (0.0%) |
| Administrative & Support | 42 (100.0%) | 0 (0.0%) |
| Educational Services | 0 (0.0%) | 49 (100.0%) |
| Health Care & Social Assistance | 13 (6.1%) | 201 (93.9%) |
| Arts, Entertainment & Recreation | 24 (70.6%) | 10 (29.4%) |
| Accommodation & Food Services | 47 (81.0%) | 11 (19.0%) |
| Public Administration | 47 (34.8%) | 88 (65.2%) |
| Total | 569 (47.0%) | 642 (53.0%) |
Education in St George
School Enrollment in St George
The most common levels of schooling among the 462 students in St George are college / undergraduate (138 | 29.9%), high school (133 | 28.8%), and nursery / preschool (65 | 14.1%).
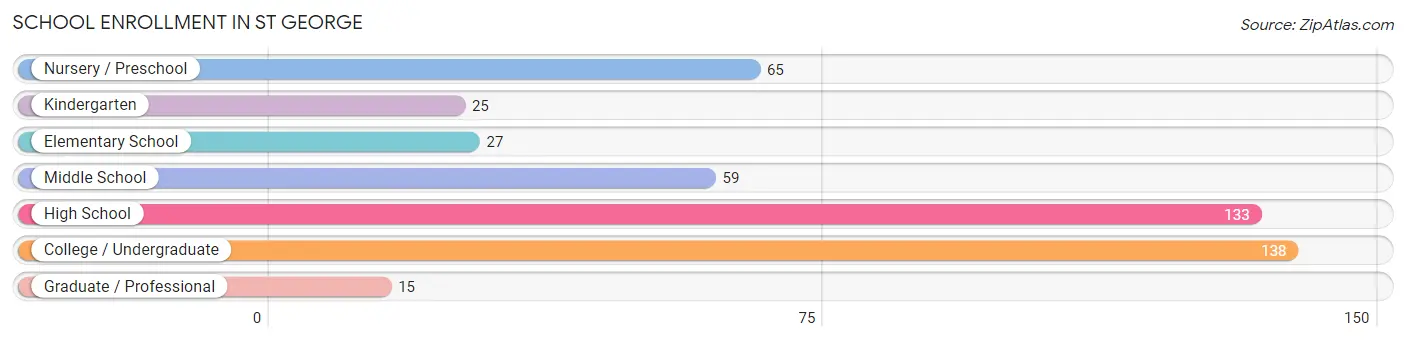
| School Level | # Students | % Students |
| Nursery / Preschool | 65 | 14.1% |
| Kindergarten | 25 | 5.4% |
| Elementary School | 27 | 5.8% |
| Middle School | 59 | 12.8% |
| High School | 133 | 28.8% |
| College / Undergraduate | 138 | 29.9% |
| Graduate / Professional | 15 | 3.3% |
| Total | 462 | 100.0% |
School Enrollment by Age by Funding Source in St George
Out of a total of 462 students who are enrolled in schools in St George, 123 (26.6%) attend a private institution, while the remaining 339 (73.4%) are enrolled in public schools. The age group of 3 to 4 year olds has the highest likelihood of being enrolled in private schools, with 23 (62.2% in the age bracket) enrolled. Conversely, the age group of 10 to 14 year olds has the lowest likelihood of being enrolled in a private school, with 59 (100.0% in the age bracket) attending a public institution.
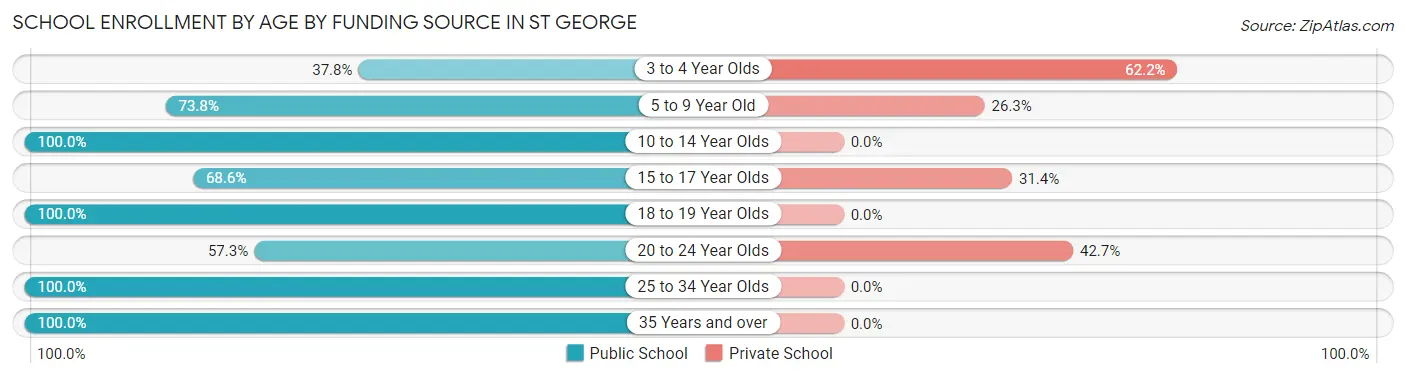
| Age Bracket | Public School | Private School |
| 3 to 4 Year Olds | 14 (37.8%) | 23 (62.2%) |
| 5 to 9 Year Old | 59 (73.8%) | 21 (26.3%) |
| 10 to 14 Year Olds | 59 (100.0%) | 0 (0.0%) |
| 15 to 17 Year Olds | 70 (68.6%) | 32 (31.4%) |
| 18 to 19 Year Olds | 48 (100.0%) | 0 (0.0%) |
| 20 to 24 Year Olds | 63 (57.3%) | 47 (42.7%) |
| 25 to 34 Year Olds | 3 (100.0%) | 0 (0.0%) |
| 35 Years and over | 23 (100.0%) | 0 (0.0%) |
| Total | 339 (73.4%) | 123 (26.6%) |
Educational Attainment by Field of Study in St George
Business (99 | 34.4%), science & technology (45 | 15.6%), arts & humanities (44 | 15.3%), psychology (38 | 13.2%), and liberal arts & history (29 | 10.1%) are the most common fields of study among 288 individuals in St George who have obtained a bachelor's degree or higher.
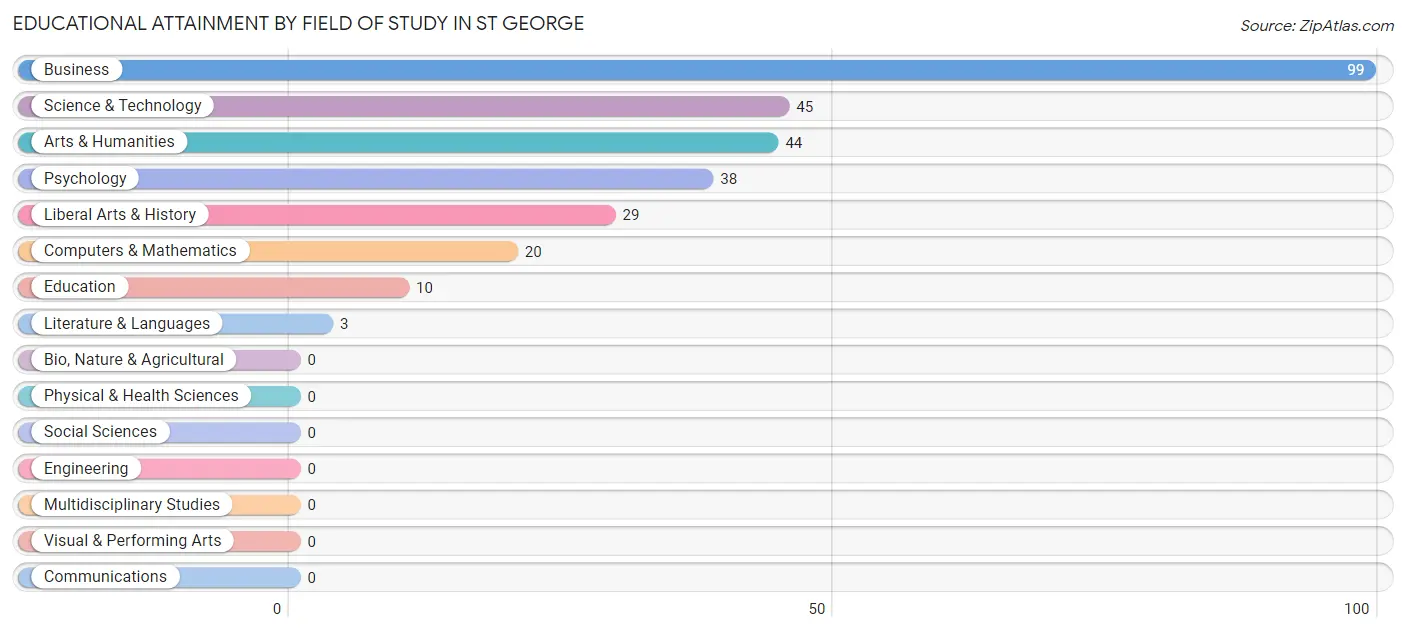
| Field of Study | # Graduates | % Graduates |
| Computers & Mathematics | 20 | 6.9% |
| Bio, Nature & Agricultural | 0 | 0.0% |
| Physical & Health Sciences | 0 | 0.0% |
| Psychology | 38 | 13.2% |
| Social Sciences | 0 | 0.0% |
| Engineering | 0 | 0.0% |
| Multidisciplinary Studies | 0 | 0.0% |
| Science & Technology | 45 | 15.6% |
| Business | 99 | 34.4% |
| Education | 10 | 3.5% |
| Literature & Languages | 3 | 1.0% |
| Liberal Arts & History | 29 | 10.1% |
| Visual & Performing Arts | 0 | 0.0% |
| Communications | 0 | 0.0% |
| Arts & Humanities | 44 | 15.3% |
| Total | 288 | 100.0% |
Transportation & Commute in St George
Vehicle Availability by Sex in St George
The most prevalent vehicle ownership categories in St George are males with 2 vehicles (156, accounting for 27.4%) and females with 2 vehicles (140, making up 26.7%).
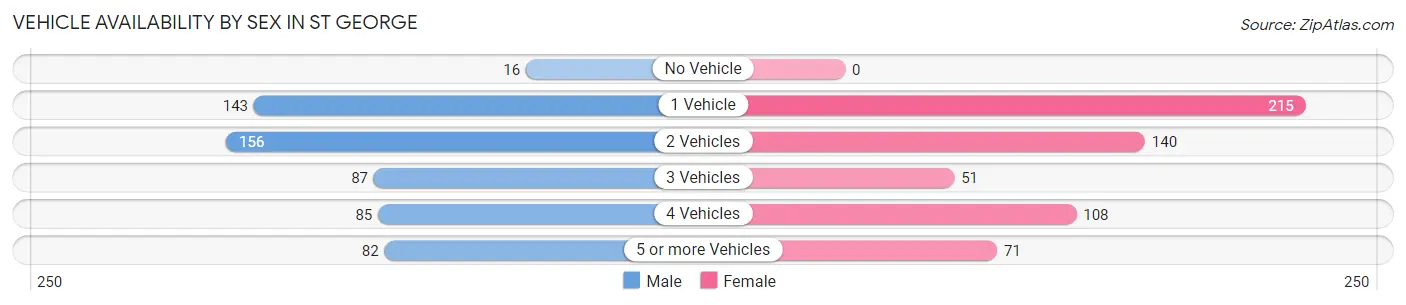
| Vehicles Available | Male | Female |
| No Vehicle | 16 (2.8%) | 0 (0.0%) |
| 1 Vehicle | 143 (25.1%) | 215 (36.7%) |
| 2 Vehicles | 156 (27.4%) | 140 (23.9%) |
| 3 Vehicles | 87 (15.3%) | 51 (8.7%) |
| 4 Vehicles | 85 (14.9%) | 108 (18.5%) |
| 5 or more Vehicles | 82 (14.4%) | 71 (12.1%) |
| Total | 569 (100.0%) | 585 (100.0%) |
Commute Time in St George
The most frequently occuring commute durations in St George are 15 to 19 minutes (257 commuters, 27.8%), 25 to 29 minutes (143 commuters, 15.5%), and 20 to 24 minutes (138 commuters, 14.9%).
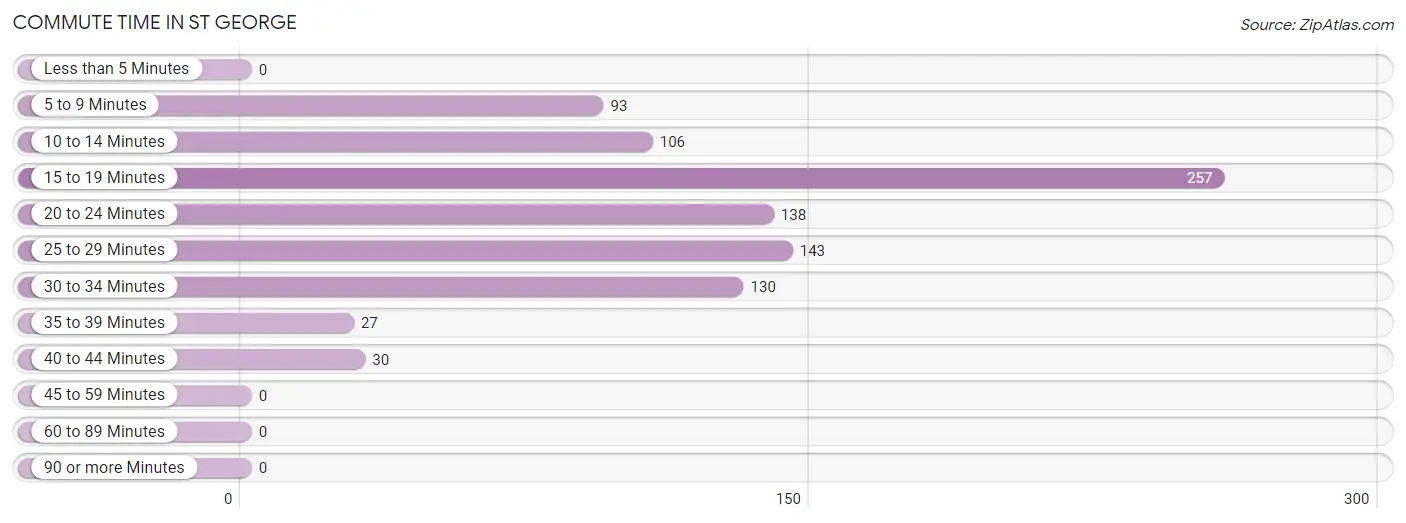
| Commute Time | # Commuters | % Commuters |
| Less than 5 Minutes | 0 | 0.0% |
| 5 to 9 Minutes | 93 | 10.1% |
| 10 to 14 Minutes | 106 | 11.5% |
| 15 to 19 Minutes | 257 | 27.8% |
| 20 to 24 Minutes | 138 | 14.9% |
| 25 to 29 Minutes | 143 | 15.5% |
| 30 to 34 Minutes | 130 | 14.1% |
| 35 to 39 Minutes | 27 | 2.9% |
| 40 to 44 Minutes | 30 | 3.3% |
| 45 to 59 Minutes | 0 | 0.0% |
| 60 to 89 Minutes | 0 | 0.0% |
| 90 or more Minutes | 0 | 0.0% |
Commute Time by Sex in St George
The most common commute times in St George are 10 to 14 minutes (106 commuters, 23.3%) for males and 15 to 19 minutes (207 commuters, 44.2%) for females.
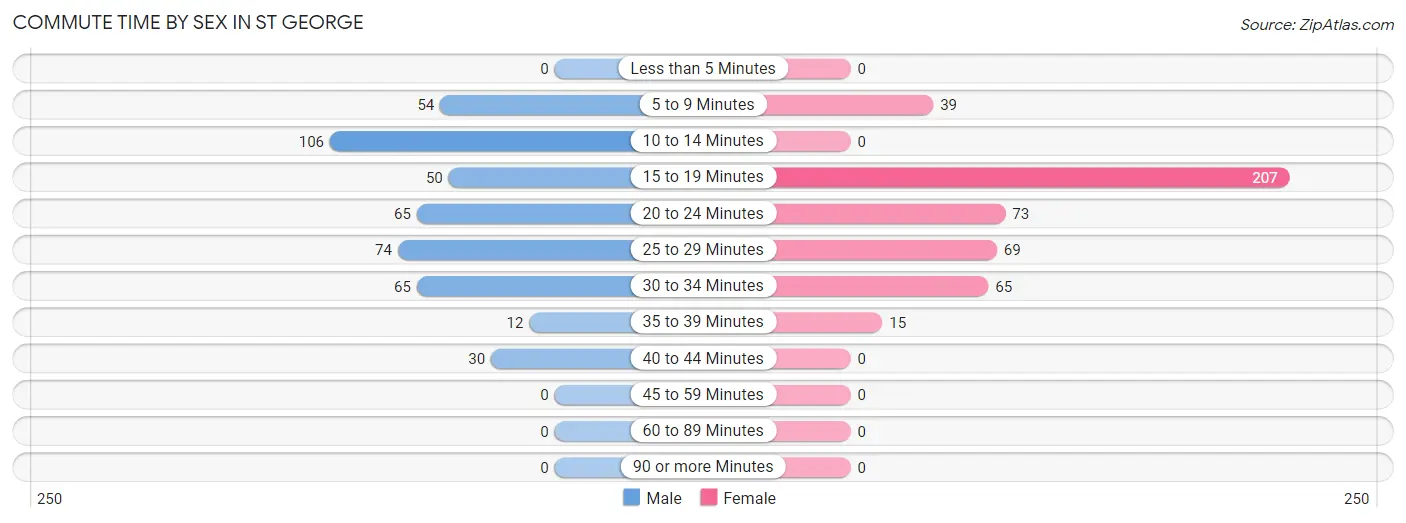
| Commute Time | Male | Female |
| Less than 5 Minutes | 0 (0.0%) | 0 (0.0%) |
| 5 to 9 Minutes | 54 (11.8%) | 39 (8.3%) |
| 10 to 14 Minutes | 106 (23.3%) | 0 (0.0%) |
| 15 to 19 Minutes | 50 (11.0%) | 207 (44.2%) |
| 20 to 24 Minutes | 65 (14.2%) | 73 (15.6%) |
| 25 to 29 Minutes | 74 (16.2%) | 69 (14.7%) |
| 30 to 34 Minutes | 65 (14.2%) | 65 (13.9%) |
| 35 to 39 Minutes | 12 (2.6%) | 15 (3.2%) |
| 40 to 44 Minutes | 30 (6.6%) | 0 (0.0%) |
| 45 to 59 Minutes | 0 (0.0%) | 0 (0.0%) |
| 60 to 89 Minutes | 0 (0.0%) | 0 (0.0%) |
| 90 or more Minutes | 0 (0.0%) | 0 (0.0%) |
Time of Departure to Work by Sex in St George
The most frequent times of departure to work in St George are 6:30 AM to 6:59 AM (124, 27.2%) for males and 5:00 AM to 5:29 AM (107, 22.9%) for females.
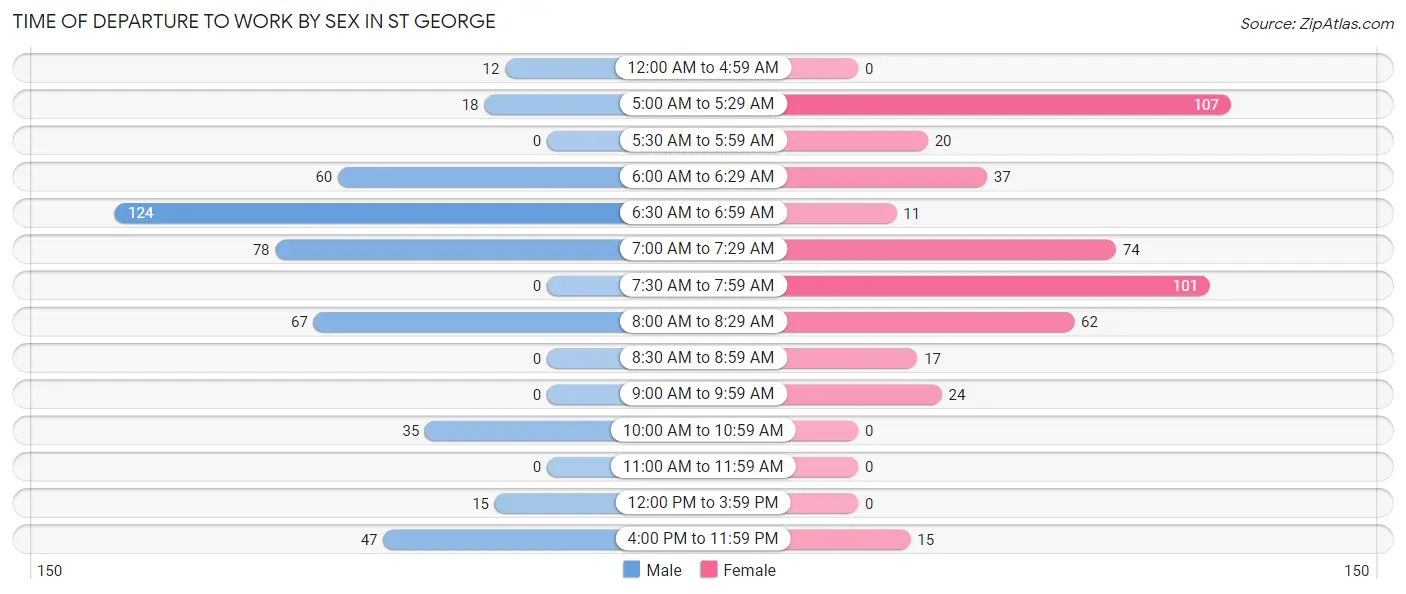
| Time of Departure | Male | Female |
| 12:00 AM to 4:59 AM | 12 (2.6%) | 0 (0.0%) |
| 5:00 AM to 5:29 AM | 18 (4.0%) | 107 (22.9%) |
| 5:30 AM to 5:59 AM | 0 (0.0%) | 20 (4.3%) |
| 6:00 AM to 6:29 AM | 60 (13.2%) | 37 (7.9%) |
| 6:30 AM to 6:59 AM | 124 (27.2%) | 11 (2.4%) |
| 7:00 AM to 7:29 AM | 78 (17.1%) | 74 (15.8%) |
| 7:30 AM to 7:59 AM | 0 (0.0%) | 101 (21.6%) |
| 8:00 AM to 8:29 AM | 67 (14.7%) | 62 (13.3%) |
| 8:30 AM to 8:59 AM | 0 (0.0%) | 17 (3.6%) |
| 9:00 AM to 9:59 AM | 0 (0.0%) | 24 (5.1%) |
| 10:00 AM to 10:59 AM | 35 (7.7%) | 0 (0.0%) |
| 11:00 AM to 11:59 AM | 0 (0.0%) | 0 (0.0%) |
| 12:00 PM to 3:59 PM | 15 (3.3%) | 0 (0.0%) |
| 4:00 PM to 11:59 PM | 47 (10.3%) | 15 (3.2%) |
| Total | 456 (100.0%) | 468 (100.0%) |
Housing Occupancy in St George
Occupancy by Ownership in St George
Of the total 747 dwellings in St George, owner-occupied units account for 569 (76.2%), while renter-occupied units make up 178 (23.8%).
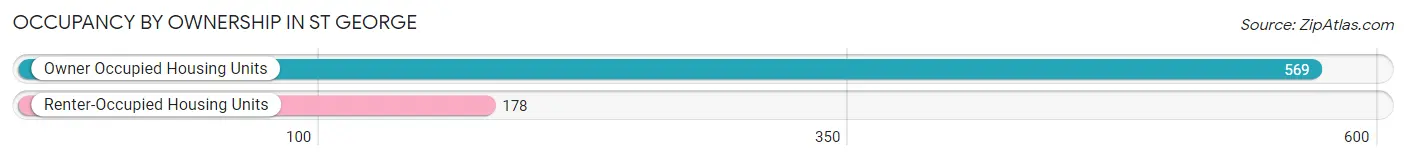
| Occupancy | # Housing Units | % Housing Units |
| Owner Occupied Housing Units | 569 | 76.2% |
| Renter-Occupied Housing Units | 178 | 23.8% |
| Total Occupied Housing Units | 747 | 100.0% |
Occupancy by Household Size in St George
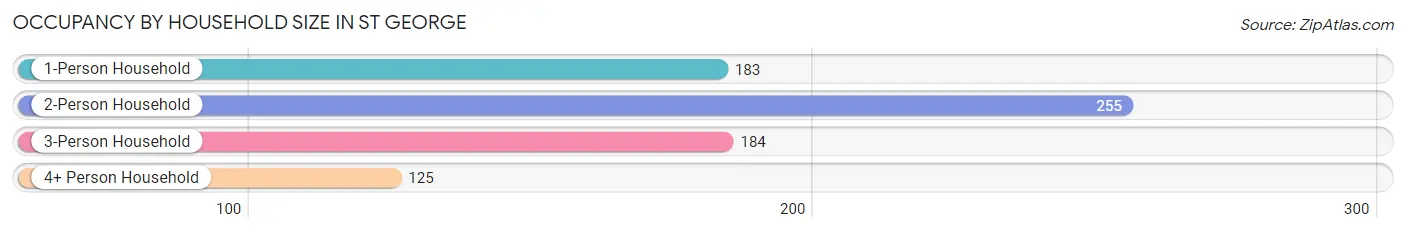
| Household Size | # Housing Units | % Housing Units |
| 1-Person Household | 183 | 24.5% |
| 2-Person Household | 255 | 34.1% |
| 3-Person Household | 184 | 24.6% |
| 4+ Person Household | 125 | 16.7% |
| Total Housing Units | 747 | 100.0% |
Occupancy by Ownership by Household Size in St George
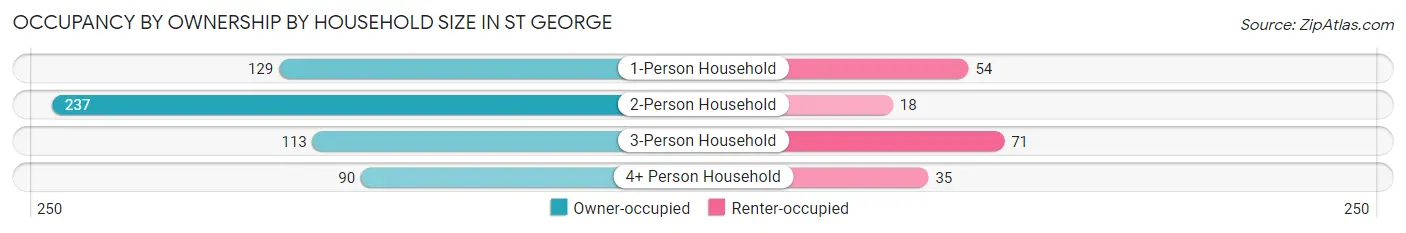
| Household Size | Owner-occupied | Renter-occupied |
| 1-Person Household | 129 (70.5%) | 54 (29.5%) |
| 2-Person Household | 237 (92.9%) | 18 (7.1%) |
| 3-Person Household | 113 (61.4%) | 71 (38.6%) |
| 4+ Person Household | 90 (72.0%) | 35 (28.0%) |
| Total Housing Units | 569 (76.2%) | 178 (23.8%) |
Occupancy by Educational Attainment in St George
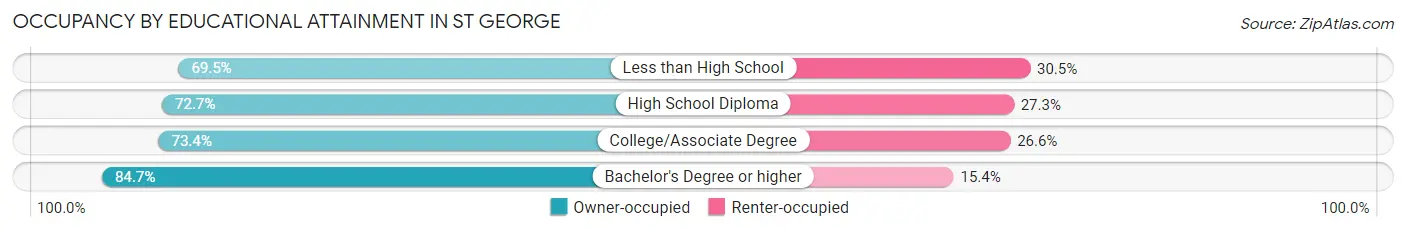
| Household Size | Owner-occupied | Renter-occupied |
| Less than High School | 41 (69.5%) | 18 (30.5%) |
| High School Diploma | 136 (72.7%) | 51 (27.3%) |
| College/Associate Degree | 210 (73.4%) | 76 (26.6%) |
| Bachelor's Degree or higher | 182 (84.7%) | 33 (15.3%) |
Occupancy by Age of Householder in St George
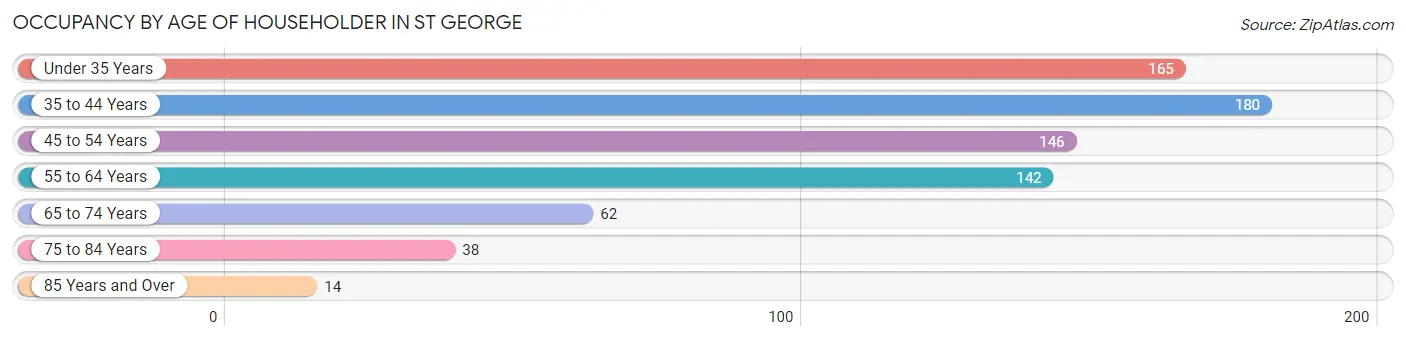
| Age Bracket | # Households | % Households |
| Under 35 Years | 165 | 22.1% |
| 35 to 44 Years | 180 | 24.1% |
| 45 to 54 Years | 146 | 19.5% |
| 55 to 64 Years | 142 | 19.0% |
| 65 to 74 Years | 62 | 8.3% |
| 75 to 84 Years | 38 | 5.1% |
| 85 Years and Over | 14 | 1.9% |
| Total | 747 | 100.0% |
Housing Finances in St George
Median Income by Occupancy in St George
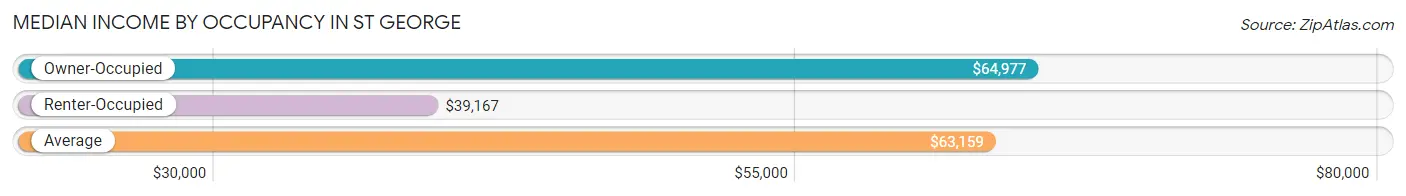
| Occupancy Type | # Households | Median Income |
| Owner-Occupied | 569 (76.2%) | $64,977 |
| Renter-Occupied | 178 (23.8%) | $39,167 |
| Average | 747 (100.0%) | $63,159 |
Occupancy by Householder Income Bracket in St George
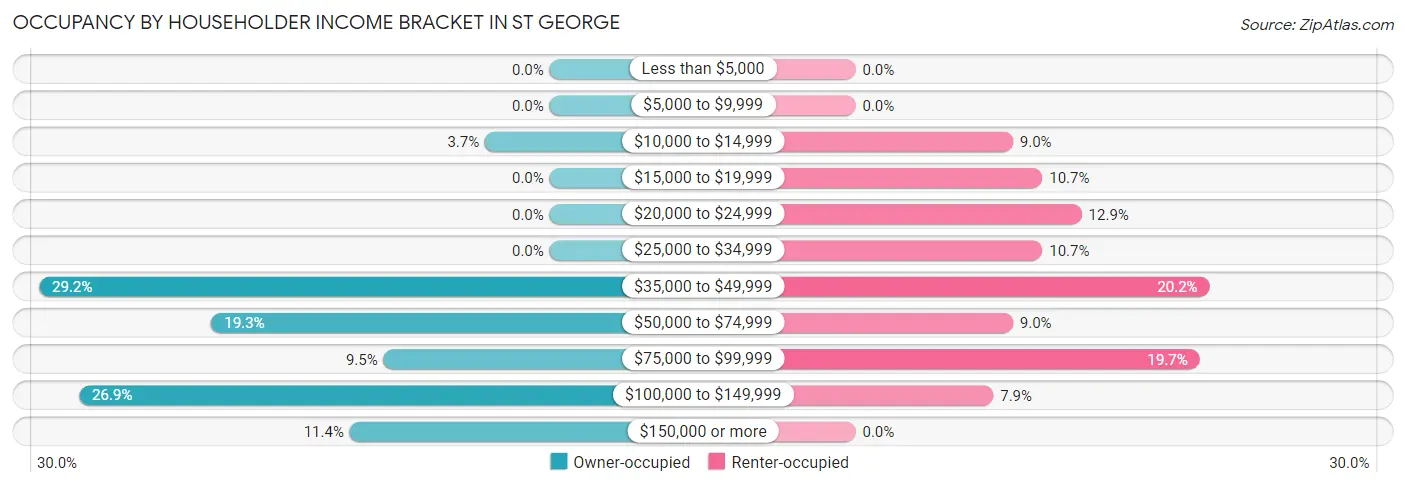
| Income Bracket | Owner-occupied | Renter-occupied |
| Less than $5,000 | 0 (0.0%) | 0 (0.0%) |
| $5,000 to $9,999 | 0 (0.0%) | 0 (0.0%) |
| $10,000 to $14,999 | 21 (3.7%) | 16 (9.0%) |
| $15,000 to $19,999 | 0 (0.0%) | 19 (10.7%) |
| $20,000 to $24,999 | 0 (0.0%) | 23 (12.9%) |
| $25,000 to $34,999 | 0 (0.0%) | 19 (10.7%) |
| $35,000 to $49,999 | 166 (29.2%) | 36 (20.2%) |
| $50,000 to $74,999 | 110 (19.3%) | 16 (9.0%) |
| $75,000 to $99,999 | 54 (9.5%) | 35 (19.7%) |
| $100,000 to $149,999 | 153 (26.9%) | 14 (7.9%) |
| $150,000 or more | 65 (11.4%) | 0 (0.0%) |
| Total | 569 (100.0%) | 178 (100.0%) |
Monthly Housing Cost Tiers in St George
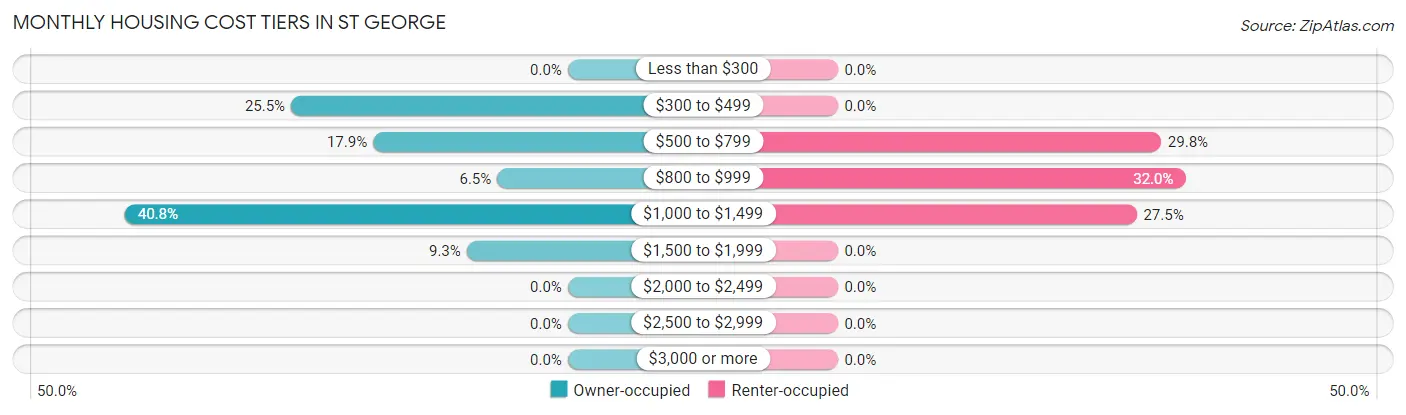
| Monthly Cost | Owner-occupied | Renter-occupied |
| Less than $300 | 0 (0.0%) | 0 (0.0%) |
| $300 to $499 | 145 (25.5%) | 0 (0.0%) |
| $500 to $799 | 102 (17.9%) | 53 (29.8%) |
| $800 to $999 | 37 (6.5%) | 57 (32.0%) |
| $1,000 to $1,499 | 232 (40.8%) | 49 (27.5%) |
| $1,500 to $1,999 | 53 (9.3%) | 0 (0.0%) |
| $2,000 to $2,499 | 0 (0.0%) | 0 (0.0%) |
| $2,500 to $2,999 | 0 (0.0%) | 0 (0.0%) |
| $3,000 or more | 0 (0.0%) | 0 (0.0%) |
| Total | 569 (100.0%) | 178 (100.0%) |
Physical Housing Characteristics in St George
Housing Structures in St George
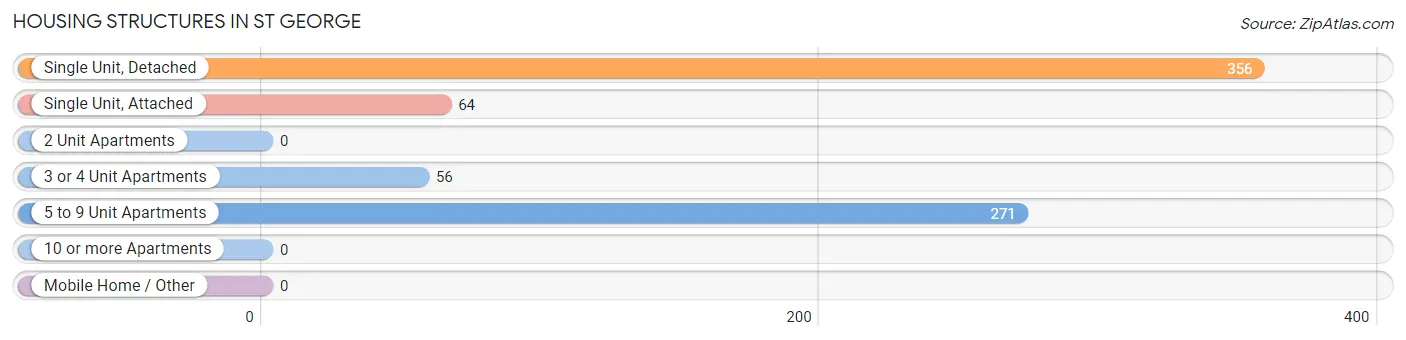
| Structure Type | # Housing Units | % Housing Units |
| Single Unit, Detached | 356 | 47.7% |
| Single Unit, Attached | 64 | 8.6% |
| 2 Unit Apartments | 0 | 0.0% |
| 3 or 4 Unit Apartments | 56 | 7.5% |
| 5 to 9 Unit Apartments | 271 | 36.3% |
| 10 or more Apartments | 0 | 0.0% |
| Mobile Home / Other | 0 | 0.0% |
| Total | 747 | 100.0% |
Housing Structures by Occupancy in St George
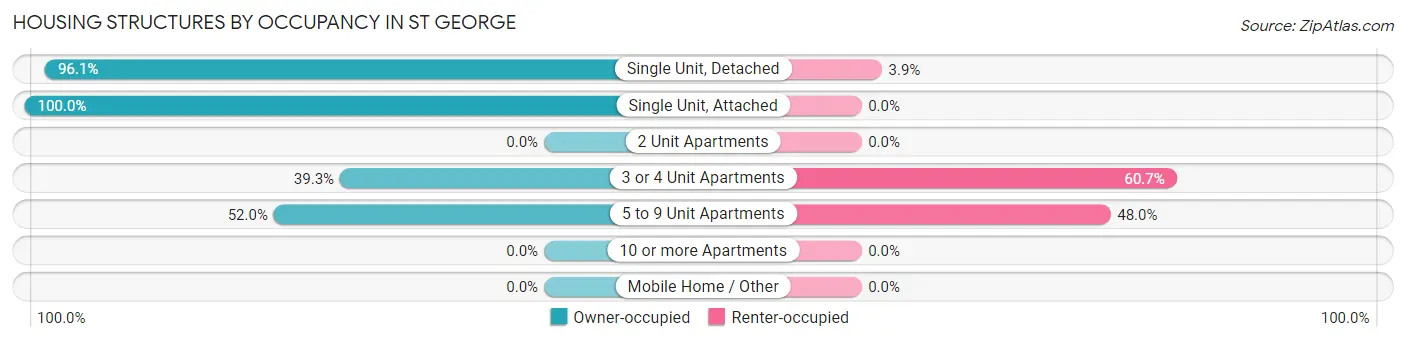
| Structure Type | Owner-occupied | Renter-occupied |
| Single Unit, Detached | 342 (96.1%) | 14 (3.9%) |
| Single Unit, Attached | 64 (100.0%) | 0 (0.0%) |
| 2 Unit Apartments | 0 (0.0%) | 0 (0.0%) |
| 3 or 4 Unit Apartments | 22 (39.3%) | 34 (60.7%) |
| 5 to 9 Unit Apartments | 141 (52.0%) | 130 (48.0%) |
| 10 or more Apartments | 0 (0.0%) | 0 (0.0%) |
| Mobile Home / Other | 0 (0.0%) | 0 (0.0%) |
| Total | 569 (76.2%) | 178 (23.8%) |
Housing Structures by Number of Rooms in St George
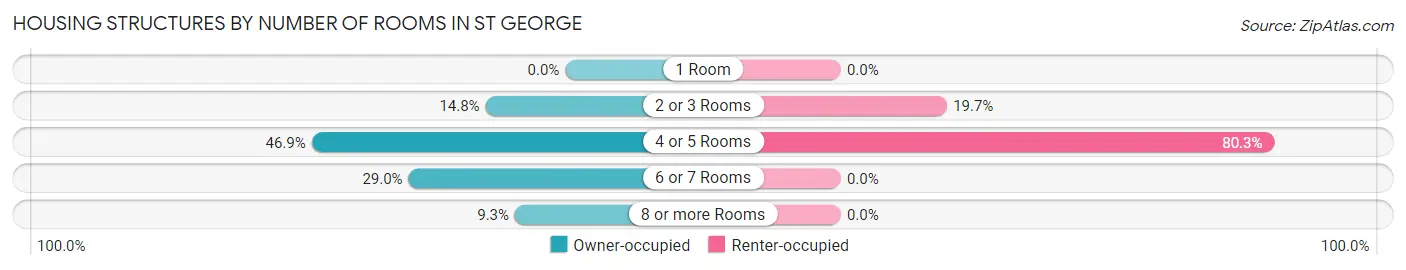
| Number of Rooms | Owner-occupied | Renter-occupied |
| 1 Room | 0 (0.0%) | 0 (0.0%) |
| 2 or 3 Rooms | 84 (14.8%) | 35 (19.7%) |
| 4 or 5 Rooms | 267 (46.9%) | 143 (80.3%) |
| 6 or 7 Rooms | 165 (29.0%) | 0 (0.0%) |
| 8 or more Rooms | 53 (9.3%) | 0 (0.0%) |
| Total | 569 (100.0%) | 178 (100.0%) |
Housing Structure by Heating Type in St George
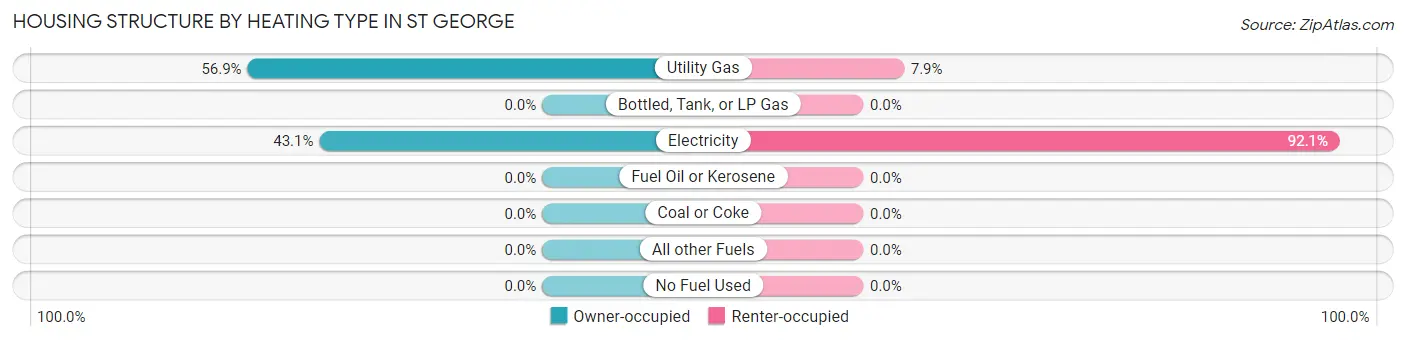
| Heating Type | Owner-occupied | Renter-occupied |
| Utility Gas | 324 (56.9%) | 14 (7.9%) |
| Bottled, Tank, or LP Gas | 0 (0.0%) | 0 (0.0%) |
| Electricity | 245 (43.1%) | 164 (92.1%) |
| Fuel Oil or Kerosene | 0 (0.0%) | 0 (0.0%) |
| Coal or Coke | 0 (0.0%) | 0 (0.0%) |
| All other Fuels | 0 (0.0%) | 0 (0.0%) |
| No Fuel Used | 0 (0.0%) | 0 (0.0%) |
| Total | 569 (100.0%) | 178 (100.0%) |
Household Vehicle Usage in St George
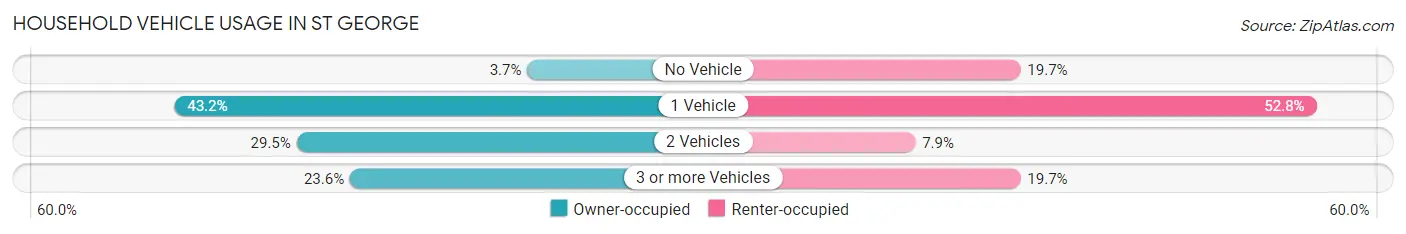
| Vehicles per Household | Owner-occupied | Renter-occupied |
| No Vehicle | 21 (3.7%) | 35 (19.7%) |
| 1 Vehicle | 246 (43.2%) | 94 (52.8%) |
| 2 Vehicles | 168 (29.5%) | 14 (7.9%) |
| 3 or more Vehicles | 134 (23.5%) | 35 (19.7%) |
| Total | 569 (100.0%) | 178 (100.0%) |
Real Estate & Mortgages in St George
Real Estate and Mortgage Overview in St George
| Characteristic | Without Mortgage | With Mortgage |
| Housing Units | 247 | 322 |
| Median Property Value | $75,200 | $162,900 |
| Median Household Income | - | - |
| Monthly Housing Costs | $478 | $0 |
| Real Estate Taxes | $1,197 | $0 |
Property Value by Mortgage Status in St George
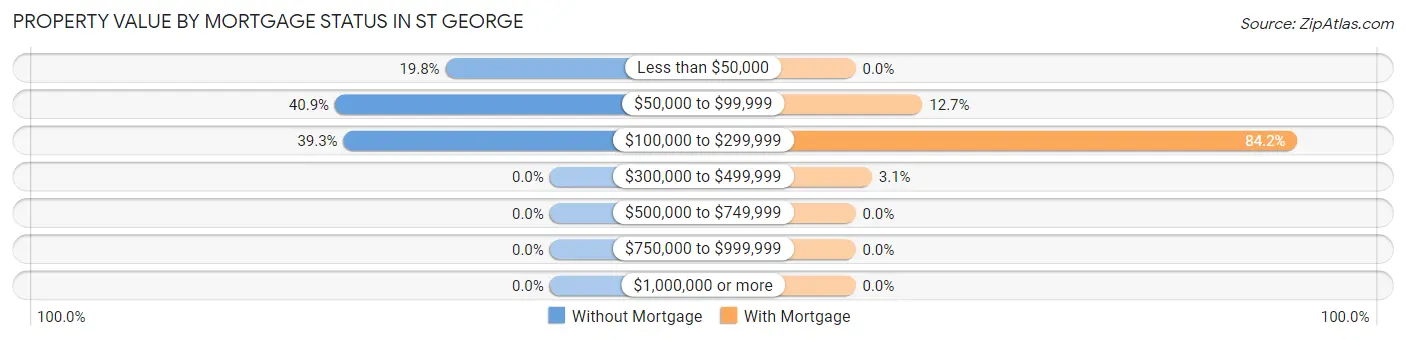
| Property Value | Without Mortgage | With Mortgage |
| Less than $50,000 | 49 (19.8%) | 0 (0.0%) |
| $50,000 to $99,999 | 101 (40.9%) | 41 (12.7%) |
| $100,000 to $299,999 | 97 (39.3%) | 271 (84.2%) |
| $300,000 to $499,999 | 0 (0.0%) | 10 (3.1%) |
| $500,000 to $749,999 | 0 (0.0%) | 0 (0.0%) |
| $750,000 to $999,999 | 0 (0.0%) | 0 (0.0%) |
| $1,000,000 or more | 0 (0.0%) | 0 (0.0%) |
| Total | 247 (100.0%) | 322 (100.0%) |
Household Income by Mortgage Status in St George
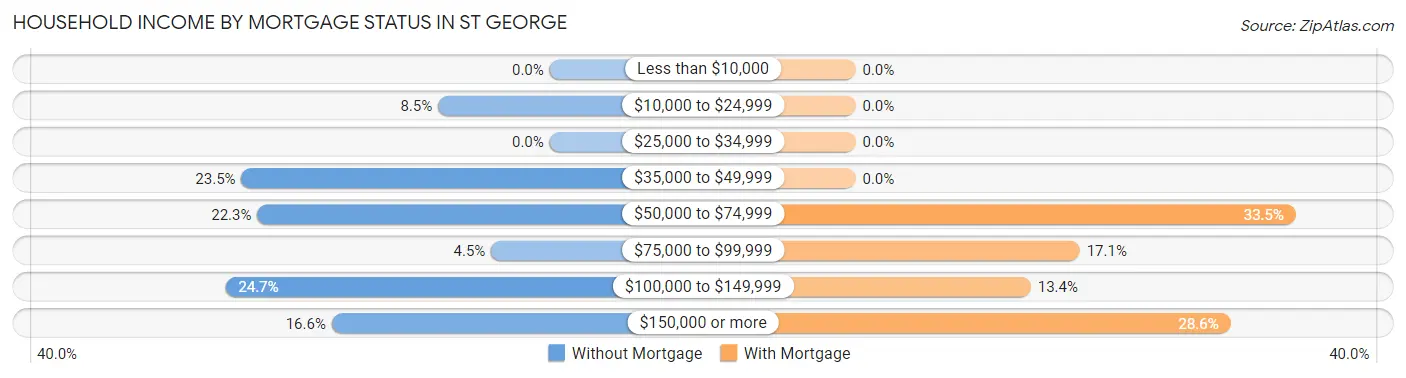
| Household Income | Without Mortgage | With Mortgage |
| Less than $10,000 | 0 (0.0%) | 0 (0.0%) |
| $10,000 to $24,999 | 21 (8.5%) | 0 (0.0%) |
| $25,000 to $34,999 | 0 (0.0%) | 0 (0.0%) |
| $35,000 to $49,999 | 58 (23.5%) | 0 (0.0%) |
| $50,000 to $74,999 | 55 (22.3%) | 108 (33.5%) |
| $75,000 to $99,999 | 11 (4.4%) | 55 (17.1%) |
| $100,000 to $149,999 | 61 (24.7%) | 43 (13.4%) |
| $150,000 or more | 41 (16.6%) | 92 (28.6%) |
| Total | 247 (100.0%) | 322 (100.0%) |
Property Value to Household Income Ratio in St George
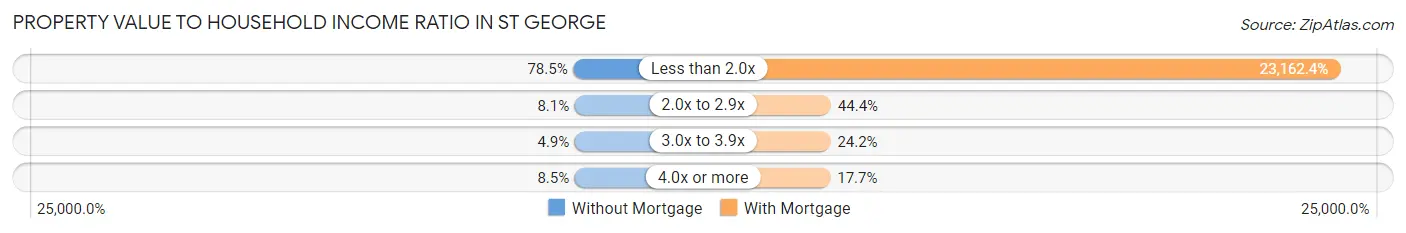
| Value-to-Income Ratio | Without Mortgage | With Mortgage |
| Less than 2.0x | 194 (78.5%) | 74,583 (23,162.4%) |
| 2.0x to 2.9x | 20 (8.1%) | 143 (44.4%) |
| 3.0x to 3.9x | 12 (4.9%) | 78 (24.2%) |
| 4.0x or more | 21 (8.5%) | 57 (17.7%) |
| Total | 247 (100.0%) | 322 (100.0%) |
Real Estate Taxes by Mortgage Status in St George

| Property Taxes | Without Mortgage | With Mortgage |
| Less than $800 | 21 (8.5%) | 0 (0.0%) |
| $800 to $1,499 | 154 (62.4%) | 0 (0.0%) |
| $800 to $1,499 | 44 (17.8%) | 15 (4.7%) |
| Total | 247 (100.0%) | 322 (100.0%) |
Health & Disability in St George
Health Insurance Coverage by Age in St George

| Age Bracket | With Coverage | Without Coverage |
| Under 6 Years | 160 (100.0%) | 0 (0.0%) |
| 6 to 18 Years | 276 (100.0%) | 0 (0.0%) |
| 19 to 25 Years | 230 (100.0%) | 0 (0.0%) |
| 26 to 34 Years | 240 (87.3%) | 35 (12.7%) |
| 35 to 44 Years | 202 (89.8%) | 23 (10.2%) |
| 45 to 54 Years | 294 (100.0%) | 0 (0.0%) |
| 55 to 64 Years | 239 (100.0%) | 0 (0.0%) |
| 65 to 74 Years | 79 (100.0%) | 0 (0.0%) |
| 75 Years and older | 97 (100.0%) | 0 (0.0%) |
| Total | 1,817 (96.9%) | 58 (3.1%) |
Health Insurance Coverage by Citizenship Status in St George

| Citizenship Status | With Coverage | Without Coverage |
| Native Born | 160 (100.0%) | 0 (0.0%) |
| Foreign Born, Citizen | 276 (100.0%) | 0 (0.0%) |
| Foreign Born, not a Citizen | 230 (100.0%) | 0 (0.0%) |
Health Insurance Coverage by Household Income in St George
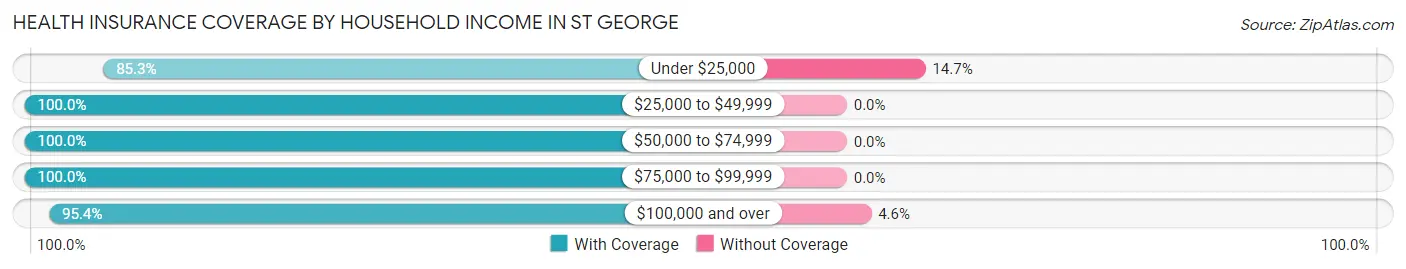
| Household Income | With Coverage | Without Coverage |
| Under $25,000 | 133 (85.3%) | 23 (14.7%) |
| $25,000 to $49,999 | 371 (100.0%) | 0 (0.0%) |
| $50,000 to $74,999 | 220 (100.0%) | 0 (0.0%) |
| $75,000 to $99,999 | 363 (100.0%) | 0 (0.0%) |
| $100,000 and over | 730 (95.4%) | 35 (4.6%) |
Public vs Private Health Insurance Coverage by Age in St George
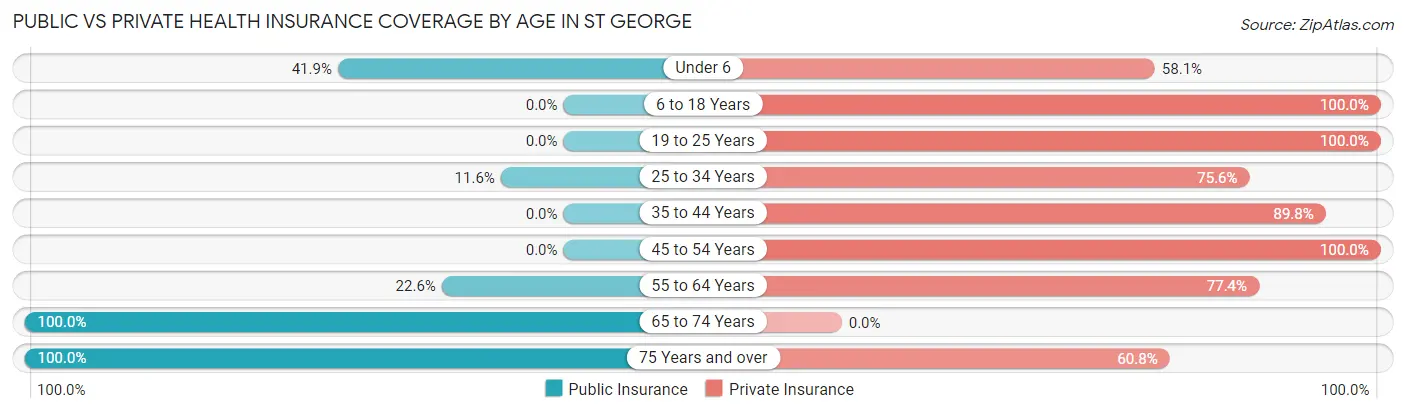
| Age Bracket | Public Insurance | Private Insurance |
| Under 6 | 67 (41.9%) | 93 (58.1%) |
| 6 to 18 Years | 0 (0.0%) | 276 (100.0%) |
| 19 to 25 Years | 0 (0.0%) | 230 (100.0%) |
| 25 to 34 Years | 32 (11.6%) | 208 (75.6%) |
| 35 to 44 Years | 0 (0.0%) | 202 (89.8%) |
| 45 to 54 Years | 0 (0.0%) | 294 (100.0%) |
| 55 to 64 Years | 54 (22.6%) | 185 (77.4%) |
| 65 to 74 Years | 79 (100.0%) | 0 (0.0%) |
| 75 Years and over | 97 (100.0%) | 59 (60.8%) |
| Total | 329 (17.5%) | 1,547 (82.5%) |
Disability Status by Sex by Age in St George
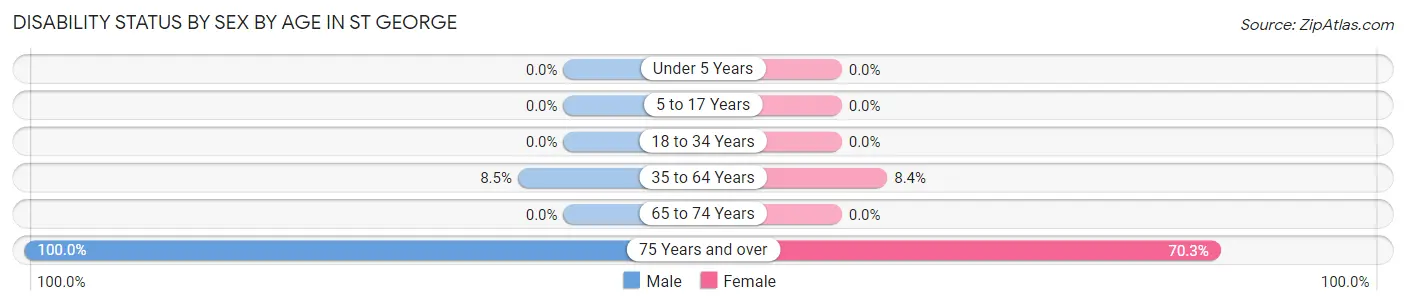
| Age Bracket | Male | Female |
| Under 5 Years | 0 (0.0%) | 0 (0.0%) |
| 5 to 17 Years | 0 (0.0%) | 0 (0.0%) |
| 18 to 34 Years | 0 (0.0%) | 0 (0.0%) |
| 35 to 64 Years | 31 (8.5%) | 33 (8.4%) |
| 65 to 74 Years | 0 (0.0%) | 0 (0.0%) |
| 75 Years and over | 33 (100.0%) | 45 (70.3%) |
Disability Class by Sex by Age in St George
Disability Class: Hearing Difficulty
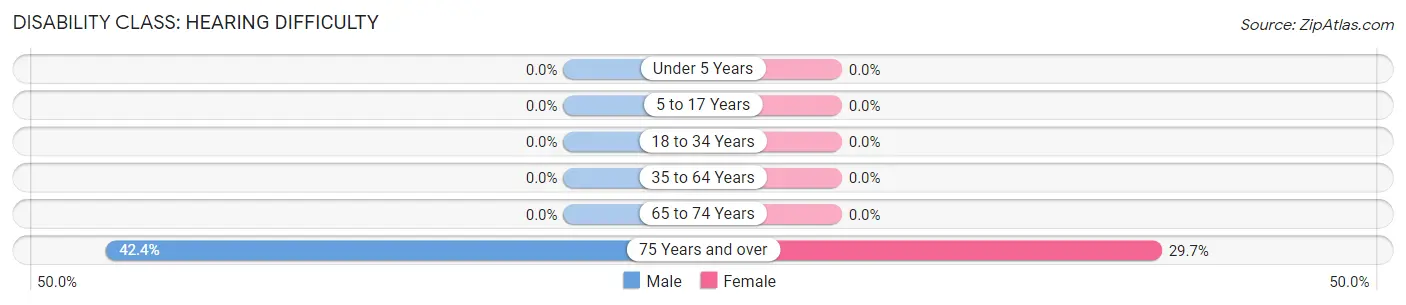
| Age Bracket | Male | Female |
| Under 5 Years | 0 (0.0%) | 0 (0.0%) |
| 5 to 17 Years | 0 (0.0%) | 0 (0.0%) |
| 18 to 34 Years | 0 (0.0%) | 0 (0.0%) |
| 35 to 64 Years | 0 (0.0%) | 0 (0.0%) |
| 65 to 74 Years | 0 (0.0%) | 0 (0.0%) |
| 75 Years and over | 14 (42.4%) | 19 (29.7%) |
Disability Class: Vision Difficulty
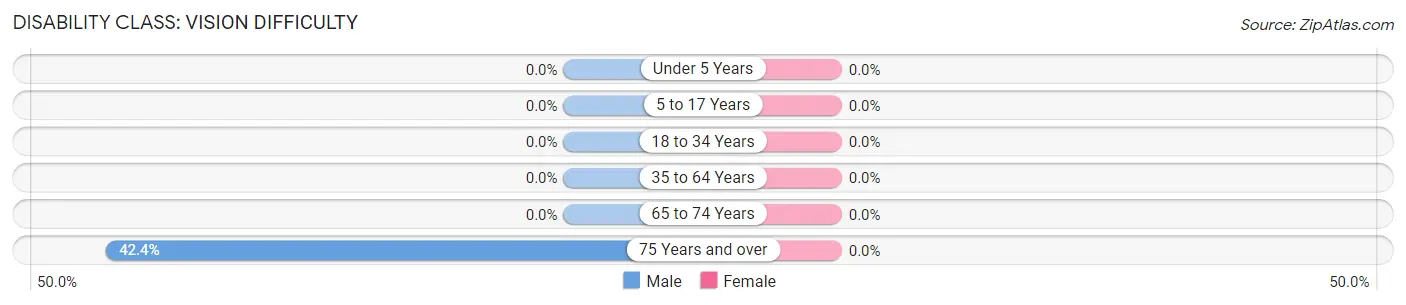
| Age Bracket | Male | Female |
| Under 5 Years | 0 (0.0%) | 0 (0.0%) |
| 5 to 17 Years | 0 (0.0%) | 0 (0.0%) |
| 18 to 34 Years | 0 (0.0%) | 0 (0.0%) |
| 35 to 64 Years | 0 (0.0%) | 0 (0.0%) |
| 65 to 74 Years | 0 (0.0%) | 0 (0.0%) |
| 75 Years and over | 14 (42.4%) | 0 (0.0%) |
Disability Class: Cognitive Difficulty
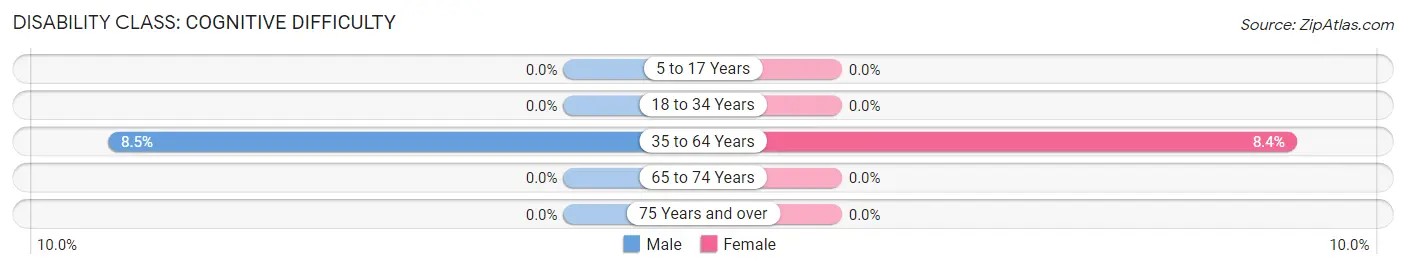
| Age Bracket | Male | Female |
| 5 to 17 Years | 0 (0.0%) | 0 (0.0%) |
| 18 to 34 Years | 0 (0.0%) | 0 (0.0%) |
| 35 to 64 Years | 31 (8.5%) | 33 (8.4%) |
| 65 to 74 Years | 0 (0.0%) | 0 (0.0%) |
| 75 Years and over | 0 (0.0%) | 0 (0.0%) |
Disability Class: Ambulatory Difficulty
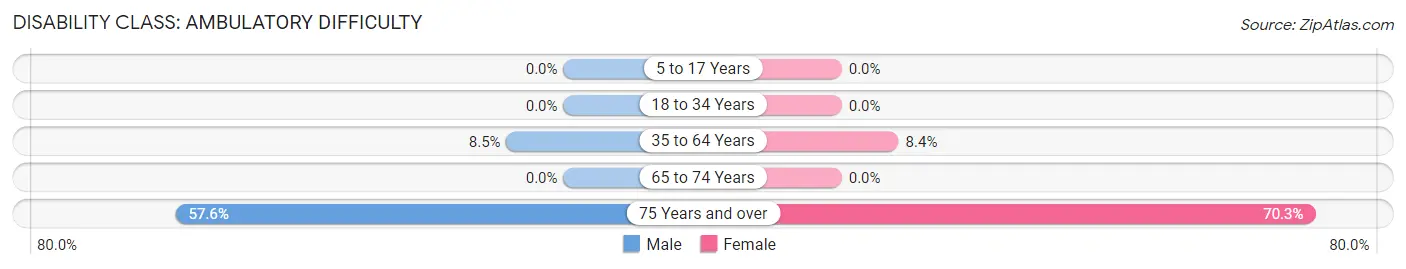
| Age Bracket | Male | Female |
| 5 to 17 Years | 0 (0.0%) | 0 (0.0%) |
| 18 to 34 Years | 0 (0.0%) | 0 (0.0%) |
| 35 to 64 Years | 31 (8.5%) | 33 (8.4%) |
| 65 to 74 Years | 0 (0.0%) | 0 (0.0%) |
| 75 Years and over | 19 (57.6%) | 45 (70.3%) |
Disability Class: Self-Care Difficulty
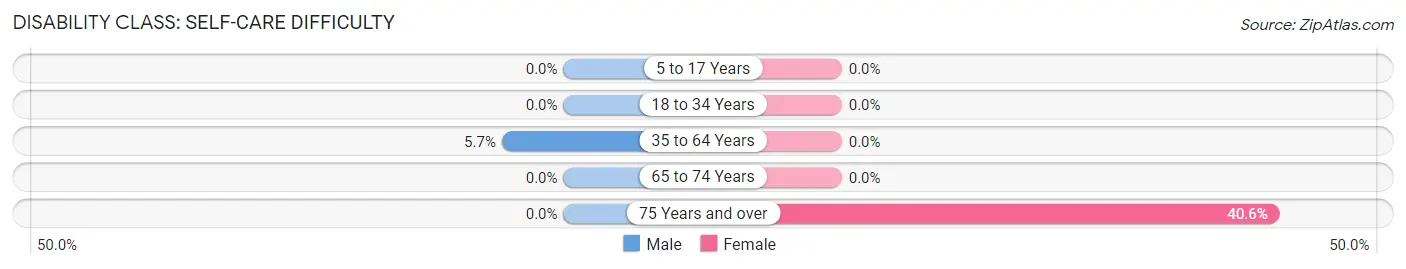
| Age Bracket | Male | Female |
| 5 to 17 Years | 0 (0.0%) | 0 (0.0%) |
| 18 to 34 Years | 0 (0.0%) | 0 (0.0%) |
| 35 to 64 Years | 21 (5.7%) | 0 (0.0%) |
| 65 to 74 Years | 0 (0.0%) | 0 (0.0%) |
| 75 Years and over | 0 (0.0%) | 26 (40.6%) |
Technology Access in St George
Computing Device Access in St George
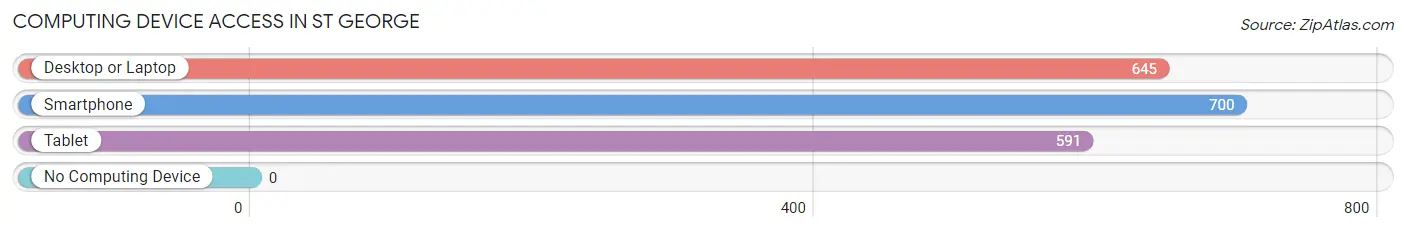
| Device Type | # Households | % Households |
| Desktop or Laptop | 645 | 86.4% |
| Smartphone | 700 | 93.7% |
| Tablet | 591 | 79.1% |
| No Computing Device | 0 | 0.0% |
| Total | 747 | 100.0% |
Internet Access in St George
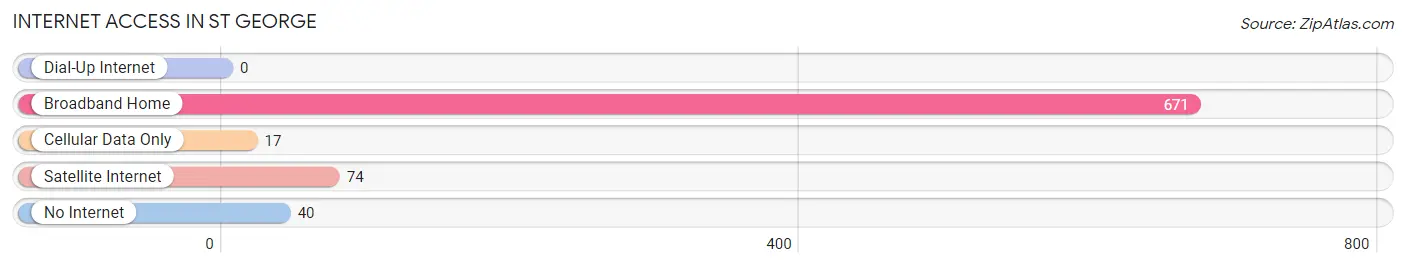
| Internet Type | # Households | % Households |
| Dial-Up Internet | 0 | 0.0% |
| Broadband Home | 671 | 89.8% |
| Cellular Data Only | 17 | 2.3% |
| Satellite Internet | 74 | 9.9% |
| No Internet | 40 | 5.3% |
| Total | 747 | 100.0% |
St George Summary
Geography
St. George is a small city located in the southeastern corner of Missouri, in the Bootheel region. It is situated in the Mississippi Alluvial Plain, which is a flat, low-lying area that is prone to flooding. The city is located on the banks of the St. Francis River, and is surrounded by agricultural land. The city has a total area of 1.2 square miles, all of which is land.
History
St. George was founded in 1872 by a group of settlers from the nearby town of Pemiscot. The town was named after St. George, the patron saint of England. The settlers were attracted to the area due to its fertile soil and abundant natural resources. The town quickly grew, and by the early 1900s, it had become a thriving agricultural center.
The town was also home to a number of businesses, including a cotton gin, a sawmill, and a gristmill. In the 1920s, the town was connected to the rest of the state by the St. Francis River Bridge, which allowed for increased trade and commerce.
In the 1950s, the town began to decline as the agricultural industry shifted away from the area. The population decreased, and many businesses closed. In the 1970s, the town was revitalized by the construction of a new bridge over the St. Francis River. This allowed for increased trade and commerce, and the town began to grow again.
Economy
St. George’s economy is largely based on agriculture. The town is home to a number of farms, which produce a variety of crops, including cotton, soybeans, corn, and wheat. The town is also home to a number of businesses, including a lumber mill, a feed mill, and a grain elevator.
The town is also home to a number of small businesses, including restaurants, retail stores, and service providers. The town is also home to a number of manufacturing companies, which produce a variety of products, including furniture, clothing, and automotive parts.
Demographics
As of the 2010 census, the population of St. George was 1,845. The population is largely white (94.2%), with small percentages of African American (2.7%), Hispanic (1.2%), and Asian (0.7%) residents. The median household income is $31,250, and the median age is 41.
Conclusion
St. George is a small city located in the southeastern corner of Missouri. It was founded in 1872 by a group of settlers from the nearby town of Pemiscot, and was named after St. George, the patron saint of England. The town quickly grew, and by the early 1900s, it had become a thriving agricultural center. In the 1950s, the town began to decline as the agricultural industry shifted away from the area. In the 1970s, the town was revitalized by the construction of a new bridge over the St. Francis River. Today, the town’s economy is largely based on agriculture, and it is home to a number of small businesses. The population of St. George is 1,845, and the median household income is $31,250.
Common Questions
What is Per Capita Income in St George?
Per Capita income in St George is $30,840.
What is the Median Family Income in St George?
Median Family Income in St George is $69,679.
What is the Median Household income in St George?
Median Household Income in St George is $63,159.
What is Income or Wage Gap in St George?
Income or Wage Gap in St George is 39.7%.
Women in St George earn 60.3 cents for every dollar earned by a man.
What is Inequality or Gini Index in St George?
Inequality or Gini Index in St George is 0.33.
What is the Total Population of St George?
Total Population of St George is 1,875.
What is the Total Male Population of St George?
Total Male Population of St George is 803.
What is the Total Female Population of St George?
Total Female Population of St George is 1,072.
What is the Ratio of Males per 100 Females in St George?
There are 74.91 Males per 100 Females in St George.
What is the Ratio of Females per 100 Males in St George?
There are 133.50 Females per 100 Males in St George.
What is the Median Population Age in St George?
Median Population Age in St George is 34.9 Years.
What is the Average Family Size in St George
Average Family Size in St George is 2.9 People.
What is the Average Household Size in St George
Average Household Size in St George is 2.5 People.
How Large is the Labor Force in St George?
There are 1,228 People in the Labor Forcein in St George.
What is the Percentage of People in the Labor Force in St George?
77.0% of People are in the Labor Force in St George.
What is the Unemployment Rate in St George?
Unemployment Rate in St George is 1.4%.