Cook, MN Map & Demographics
Cook Map
Cook Overview
$36,777
PER CAPITA INCOME
$80,341
AVG FAMILY INCOME
$43,750
AVG HOUSEHOLD INCOME
56.6%
WAGE / INCOME GAP [ % ]
43.4¢/ $1
WAGE / INCOME GAP [ $ ]
0.46
INEQUALITY / GINI INDEX
459
TOTAL POPULATION
196
MALE POPULATION
263
FEMALE POPULATION
74.52
MALES / 100 FEMALES
134.18
FEMALES / 100 MALES
53.8
MEDIAN AGE
2.5
AVG FAMILY SIZE
1.5
AVG HOUSEHOLD SIZE
196
LABOR FORCE [ PEOPLE ]
49.5%
PERCENT IN LABOR FORCE
6.6%
UNEMPLOYMENT RATE
Cook Zip Codes
Cook Area Codes
Income in Cook
Income Overview in Cook
Per Capita Income in Cook is $36,777, while median incomes of families and households are $80,341 and $43,750 respectively.
| Characteristic | Number | Measure |
| Per Capita Income | 459 | $36,777 |
| Median Family Income | 85 | $80,341 |
| Mean Family Income | 85 | $96,756 |
| Median Household Income | 263 | $43,750 |
| Mean Household Income | 263 | $62,405 |
| Income Deficit | 85 | $0 |
| Wage / Income Gap (%) | 459 | 56.58% |
| Wage / Income Gap ($) | 459 | 43.42¢ per $1 |
| Gini / Inequality Index | 459 | 0.46 |
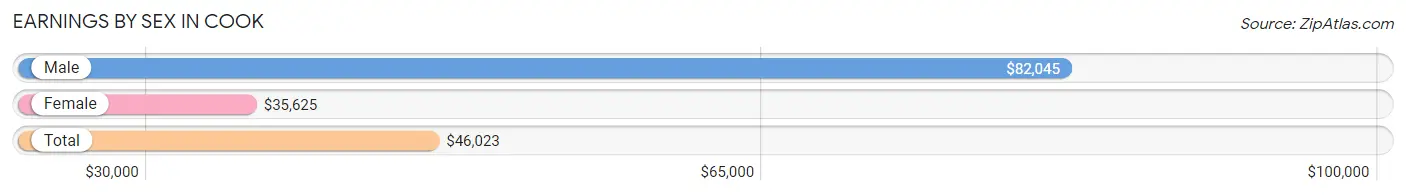
Earnings by Sex in Cook
Average Earnings in Cook are $46,023, $82,045 for men and $35,625 for women, a difference of 56.6%.
| Sex | Number | Average Earnings |
| Male | 98 (47.8%) | $82,045 |
| Female | 107 (52.2%) | $35,625 |
| Total | 205 (100.0%) | $46,023 |
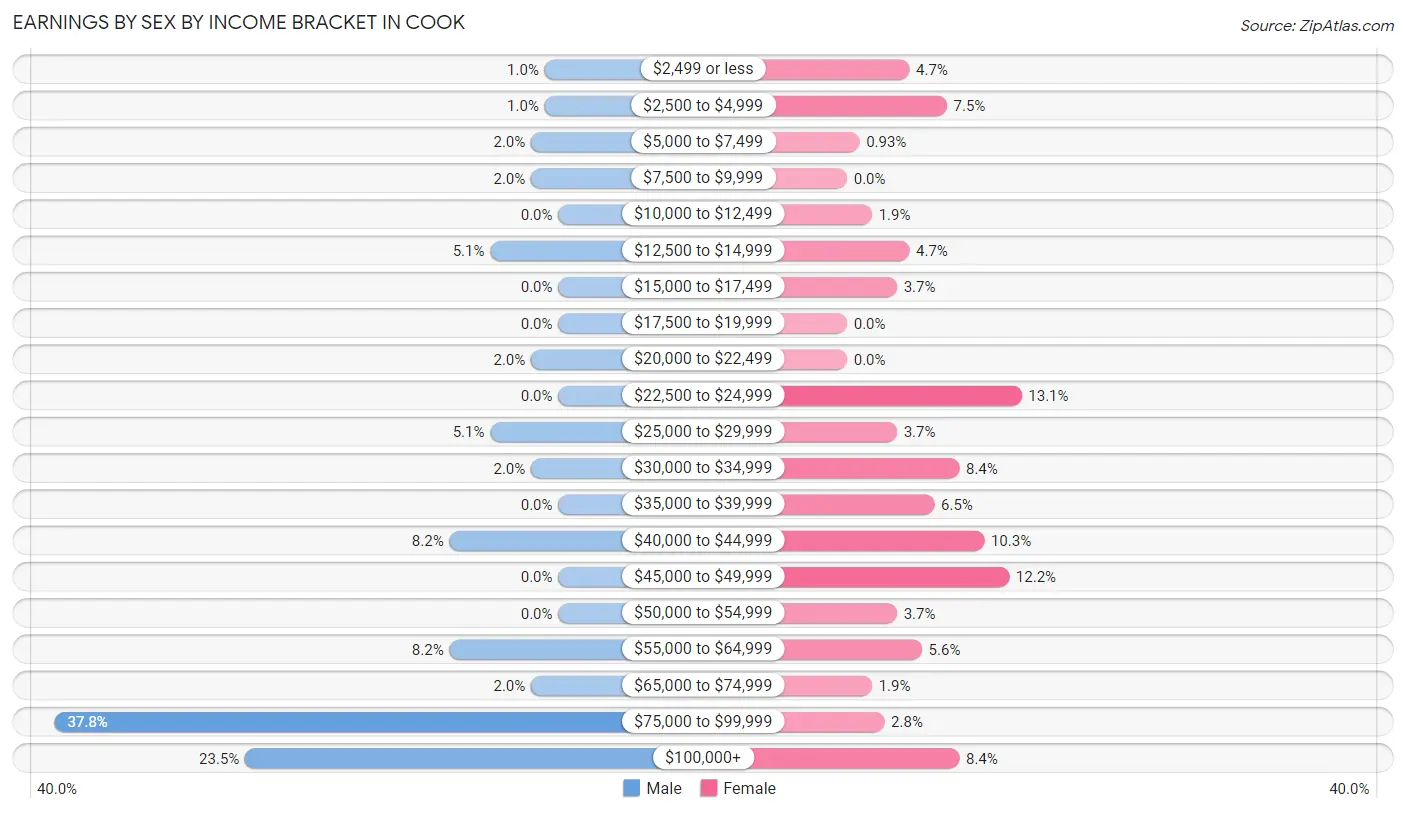
Earnings by Sex by Income Bracket in Cook
The most common earnings brackets in Cook are $75,000 to $99,999 for men (37 | 37.8%) and $22,500 to $24,999 for women (14 | 13.1%).
| Income | Male | Female |
| $2,499 or less | 1 (1.0%) | 5 (4.7%) |
| $2,500 to $4,999 | 1 (1.0%) | 8 (7.5%) |
| $5,000 to $7,499 | 2 (2.0%) | 1 (0.9%) |
| $7,500 to $9,999 | 2 (2.0%) | 0 (0.0%) |
| $10,000 to $12,499 | 0 (0.0%) | 2 (1.9%) |
| $12,500 to $14,999 | 5 (5.1%) | 5 (4.7%) |
| $15,000 to $17,499 | 0 (0.0%) | 4 (3.7%) |
| $17,500 to $19,999 | 0 (0.0%) | 0 (0.0%) |
| $20,000 to $22,499 | 2 (2.0%) | 0 (0.0%) |
| $22,500 to $24,999 | 0 (0.0%) | 14 (13.1%) |
| $25,000 to $29,999 | 5 (5.1%) | 4 (3.7%) |
| $30,000 to $34,999 | 2 (2.0%) | 9 (8.4%) |
| $35,000 to $39,999 | 0 (0.0%) | 7 (6.5%) |
| $40,000 to $44,999 | 8 (8.2%) | 11 (10.3%) |
| $45,000 to $49,999 | 0 (0.0%) | 13 (12.1%) |
| $50,000 to $54,999 | 0 (0.0%) | 4 (3.7%) |
| $55,000 to $64,999 | 8 (8.2%) | 6 (5.6%) |
| $65,000 to $74,999 | 2 (2.0%) | 2 (1.9%) |
| $75,000 to $99,999 | 37 (37.8%) | 3 (2.8%) |
| $100,000+ | 23 (23.5%) | 9 (8.4%) |
| Total | 98 (100.0%) | 107 (100.0%) |
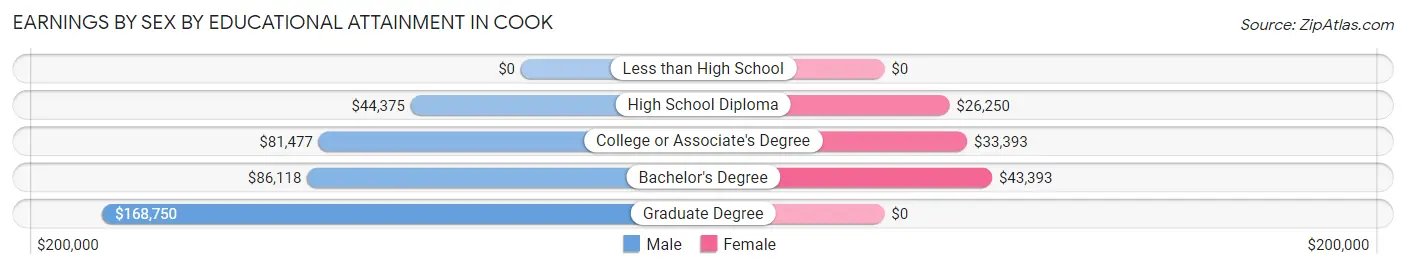
Earnings by Sex by Educational Attainment in Cook
Average earnings in Cook are $82,045 for men and $37,292 for women, a difference of 54.5%. Men with an educational attainment of graduate degree enjoy the highest average annual earnings of $168,750, while those with high school diploma education earn the least with $44,375. Women with an educational attainment of bachelor's degree earn the most with the average annual earnings of $43,393, while those with high school diploma education have the smallest earnings of $26,250.
| Educational Attainment | Male Income | Female Income |
| Less than High School | - | - |
| High School Diploma | $44,375 | $26,250 |
| College or Associate's Degree | $81,477 | $33,393 |
| Bachelor's Degree | $86,118 | $43,393 |
| Graduate Degree | $168,750 | $0 |
| Total | $82,045 | $37,292 |
Family Income in Cook
Family Income Brackets in Cook
According to the Cook family income data, there are 22 families falling into the $100,000 to $149,999 income range, which is the most common income bracket and makes up 25.9% of all families.
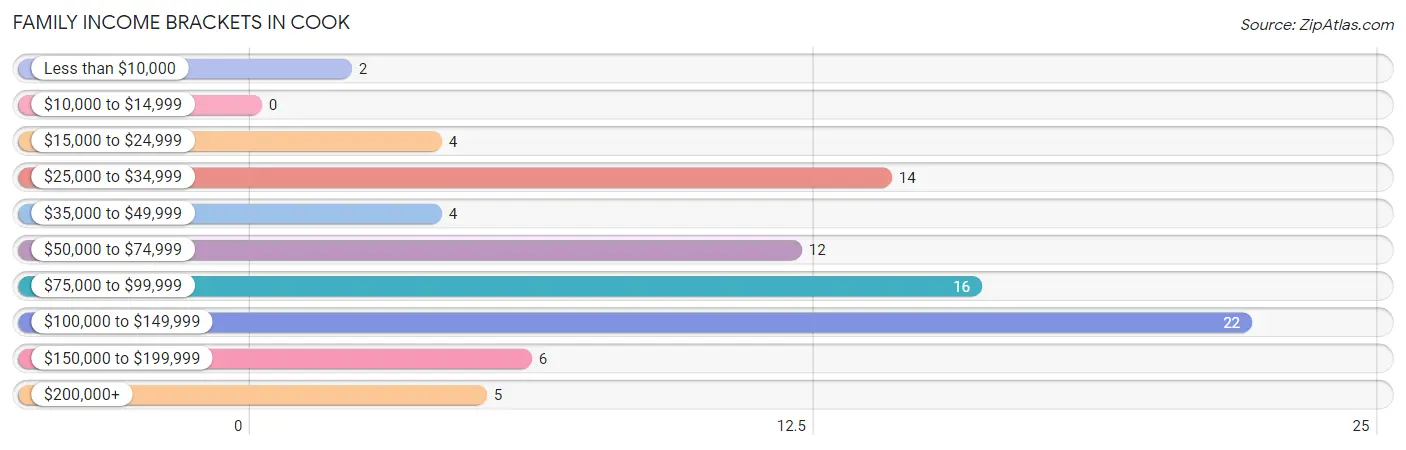
| Income Bracket | # Families | % Families |
| Less than $10,000 | 2 | 2.4% |
| $10,000 to $14,999 | 0 | 0.0% |
| $15,000 to $24,999 | 4 | 4.7% |
| $25,000 to $34,999 | 14 | 16.5% |
| $35,000 to $49,999 | 4 | 4.7% |
| $50,000 to $74,999 | 12 | 14.1% |
| $75,000 to $99,999 | 16 | 18.8% |
| $100,000 to $149,999 | 22 | 25.9% |
| $150,000 to $199,999 | 6 | 7.1% |
| $200,000+ | 5 | 5.9% |
Family Income by Famaliy Size in Cook
4-person families (10 | 11.8%) account for the highest median family income in Cook with $151,250 per family, while 2-person families (52 | 61.2%) have the highest median income of $40,454 per family member.
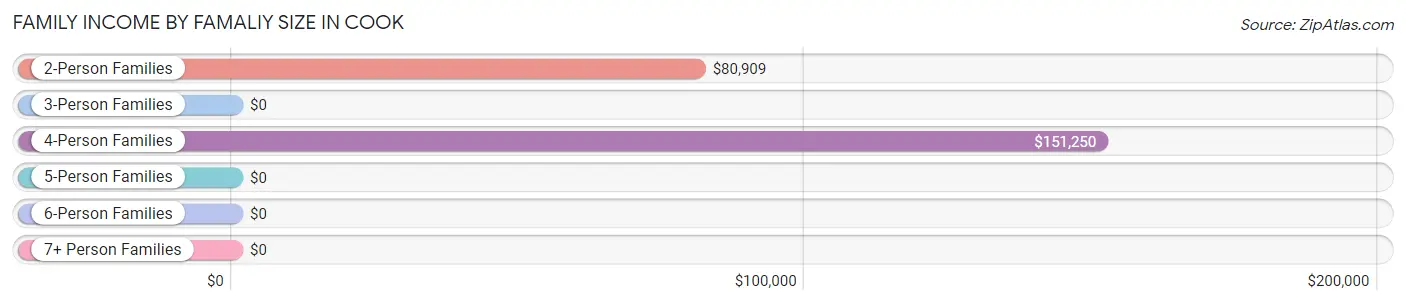
| Income Bracket | # Families | Median Income |
| 2-Person Families | 52 (61.2%) | $80,909 |
| 3-Person Families | 21 (24.7%) | $0 |
| 4-Person Families | 10 (11.8%) | $151,250 |
| 5-Person Families | 2 (2.4%) | $0 |
| 6-Person Families | 0 (0.0%) | $0 |
| 7+ Person Families | 0 (0.0%) | $0 |
| Total | 85 (100.0%) | $80,341 |
Family Income by Number of Earners in Cook
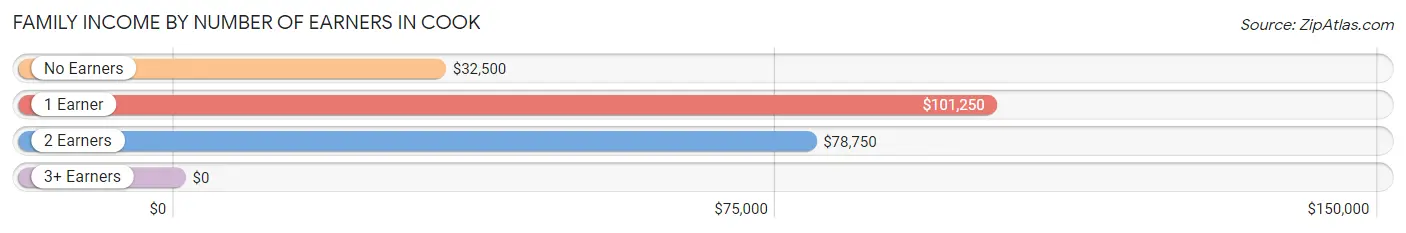
| Number of Earners | # Families | Median Income |
| No Earners | 18 (21.2%) | $32,500 |
| 1 Earner | 38 (44.7%) | $101,250 |
| 2 Earners | 25 (29.4%) | $78,750 |
| 3+ Earners | 4 (4.7%) | $0 |
| Total | 85 (100.0%) | $80,341 |
Household Income in Cook
Household Income Brackets in Cook
With 58 households falling in the category, the $15,000 to $24,999 income range is the most frequent in Cook, accounting for 22.1% of all households. In contrast, only 5 households (1.9%) fall into the $200,000+ income bracket, making it the least populous group.
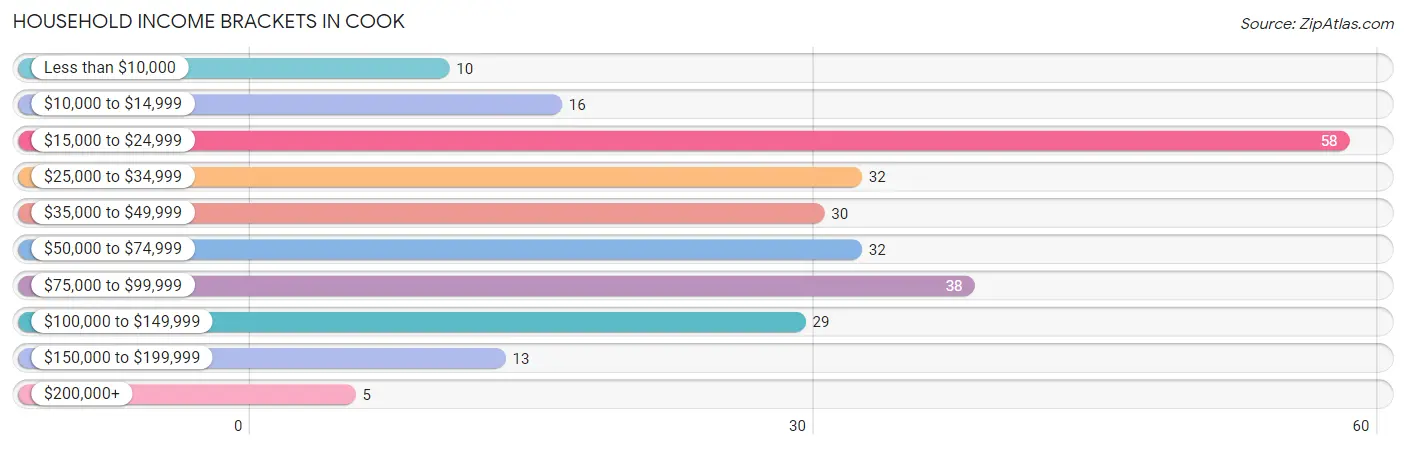
| Income Bracket | # Households | % Households |
| Less than $10,000 | 10 | 3.8% |
| $10,000 to $14,999 | 16 | 6.1% |
| $15,000 to $24,999 | 58 | 22.1% |
| $25,000 to $34,999 | 32 | 12.2% |
| $35,000 to $49,999 | 30 | 11.4% |
| $50,000 to $74,999 | 32 | 12.2% |
| $75,000 to $99,999 | 38 | 14.4% |
| $100,000 to $149,999 | 29 | 11.0% |
| $150,000 to $199,999 | 13 | 4.9% |
| $200,000+ | 5 | 1.9% |
Household Income by Householder Age in Cook
The median household income in Cook is $43,750, with the highest median household income of $82,500 found in the 25 to 44 years age bracket for the primary householder. A total of 84 households (31.9%) fall into this category. Meanwhile, the 15 to 24 years age bracket for the primary householder has the lowest median household income of $0, with 4 households (1.5%) in this group.
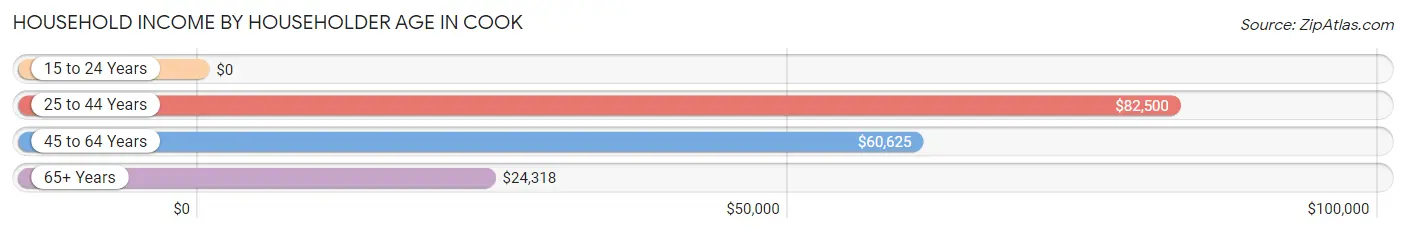
| Income Bracket | # Households | Median Income |
| 15 to 24 Years | 4 (1.5%) | $0 |
| 25 to 44 Years | 84 (31.9%) | $82,500 |
| 45 to 64 Years | 75 (28.5%) | $60,625 |
| 65+ Years | 100 (38.0%) | $24,318 |
| Total | 263 (100.0%) | $43,750 |
Poverty in Cook
Income Below Poverty by Sex and Age in Cook
With 9.7% poverty level for males and 9.3% for females among the residents of Cook, 18 to 24 year old males and 6 to 11 year old females are the most vulnerable to poverty, with 1 males (100.0%) and 2 females (28.6%) in their respective age groups living below the poverty level.
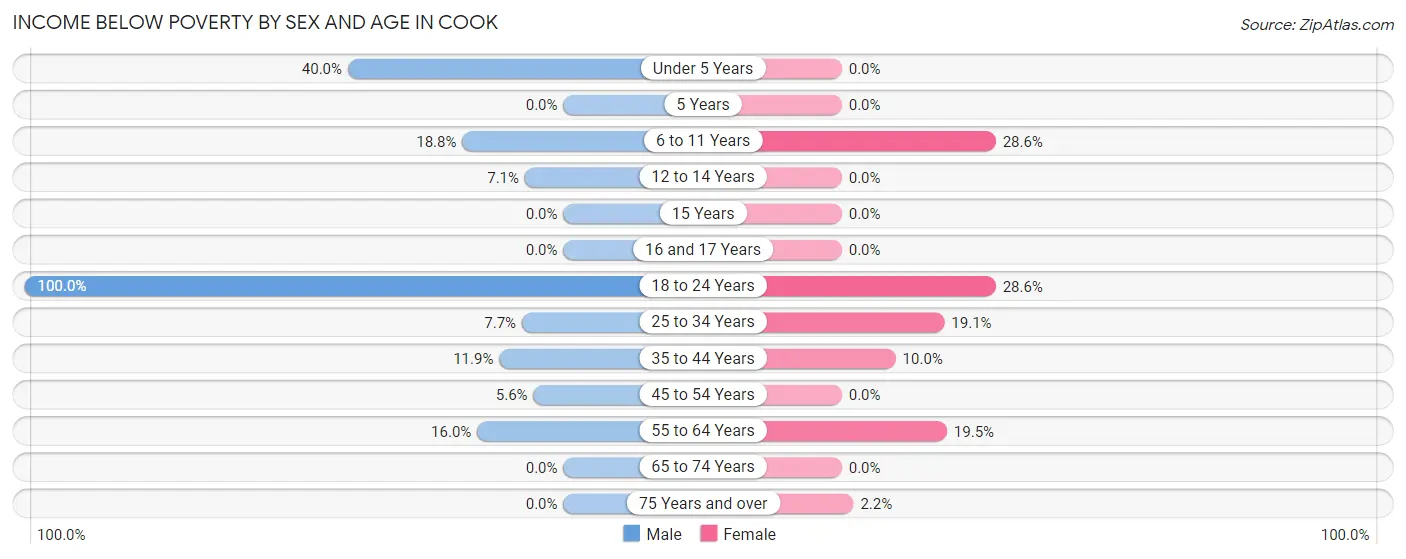
| Age Bracket | Male | Female |
| Under 5 Years | 2 (40.0%) | 0 (0.0%) |
| 5 Years | 0 (0.0%) | 0 (0.0%) |
| 6 to 11 Years | 3 (18.8%) | 2 (28.6%) |
| 12 to 14 Years | 1 (7.1%) | 0 (0.0%) |
| 15 Years | 0 (0.0%) | 0 (0.0%) |
| 16 and 17 Years | 0 (0.0%) | 0 (0.0%) |
| 18 to 24 Years | 1 (100.0%) | 2 (28.6%) |
| 25 to 34 Years | 1 (7.7%) | 4 (19.1%) |
| 35 to 44 Years | 5 (11.9%) | 4 (10.0%) |
| 45 to 54 Years | 1 (5.6%) | 0 (0.0%) |
| 55 to 64 Years | 4 (16.0%) | 8 (19.5%) |
| 65 to 74 Years | 0 (0.0%) | 0 (0.0%) |
| 75 Years and over | 0 (0.0%) | 1 (2.2%) |
| Total | 18 (9.7%) | 21 (9.3%) |
Income Above Poverty by Sex and Age in Cook
According to the poverty statistics in Cook, males aged 15 years and females aged under 5 years are the age groups that are most secure financially, with 100.0% of males and 100.0% of females in these age groups living above the poverty line.
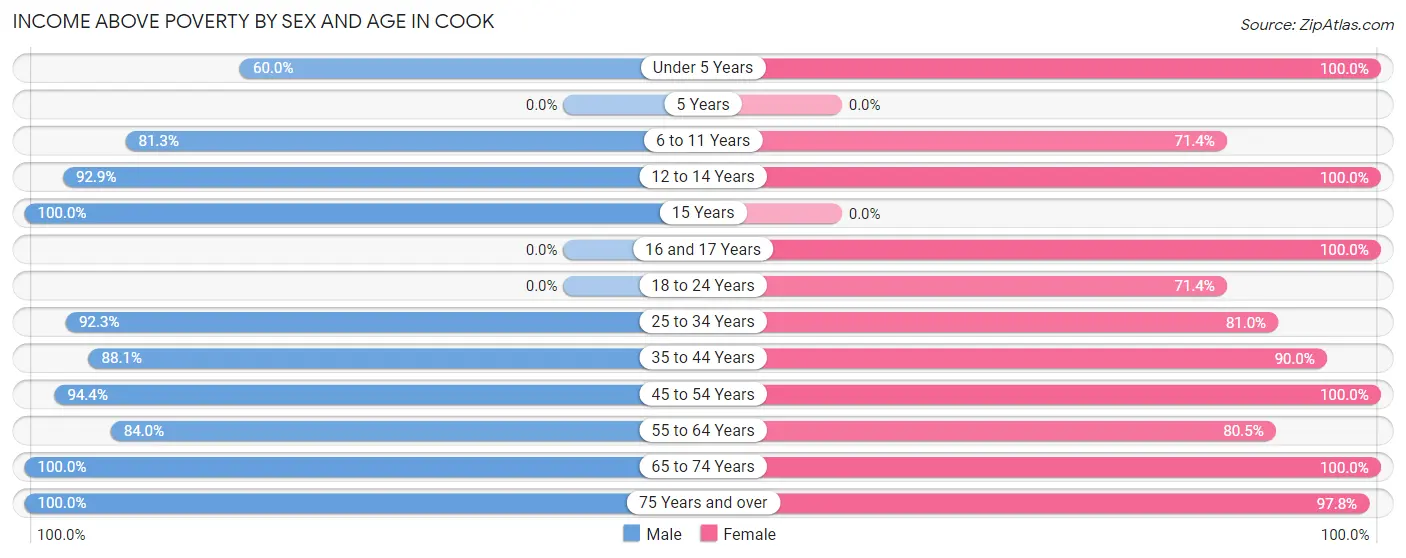
| Age Bracket | Male | Female |
| Under 5 Years | 3 (60.0%) | 12 (100.0%) |
| 5 Years | 0 (0.0%) | 0 (0.0%) |
| 6 to 11 Years | 13 (81.2%) | 5 (71.4%) |
| 12 to 14 Years | 13 (92.9%) | 7 (100.0%) |
| 15 Years | 2 (100.0%) | 0 (0.0%) |
| 16 and 17 Years | 0 (0.0%) | 9 (100.0%) |
| 18 to 24 Years | 0 (0.0%) | 5 (71.4%) |
| 25 to 34 Years | 12 (92.3%) | 17 (80.9%) |
| 35 to 44 Years | 37 (88.1%) | 36 (90.0%) |
| 45 to 54 Years | 17 (94.4%) | 17 (100.0%) |
| 55 to 64 Years | 21 (84.0%) | 33 (80.5%) |
| 65 to 74 Years | 22 (100.0%) | 19 (100.0%) |
| 75 Years and over | 27 (100.0%) | 45 (97.8%) |
| Total | 167 (90.3%) | 205 (90.7%) |
Income Below Poverty Among Married-Couple Families in Cook
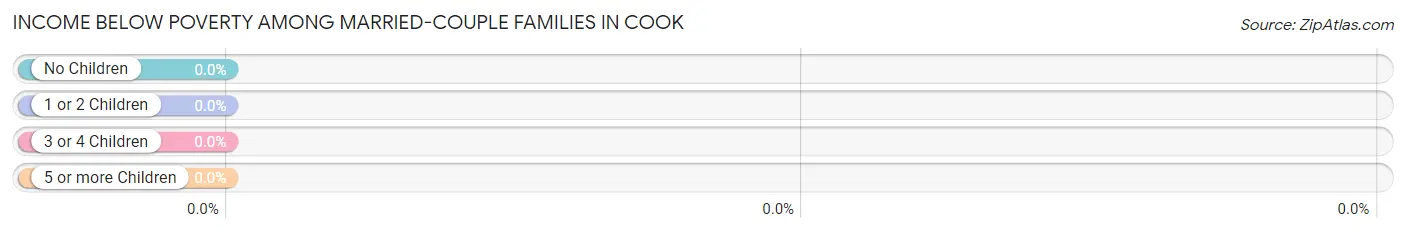
| Children | Above Poverty | Below Poverty |
| No Children | 34 (100.0%) | 0 (0.0%) |
| 1 or 2 Children | 12 (100.0%) | 0 (0.0%) |
| 3 or 4 Children | 2 (100.0%) | 0 (0.0%) |
| 5 or more Children | 0 (0.0%) | 0 (0.0%) |
| Total | 48 (100.0%) | 0 (0.0%) |
Income Below Poverty Among Single-Parent Households in Cook
According to the poverty data in Cook, 9.5% or 2 single-father households and 25.0% or 4 single-mother households are living below the poverty line. Among single-father households, those with 1 or 2 children have the highest poverty rate, with 2 households (9.5%) experiencing poverty. Likewise, among single-mother households, those with 1 or 2 children have the highest poverty rate, with 4 households (28.6%) falling below the poverty line.
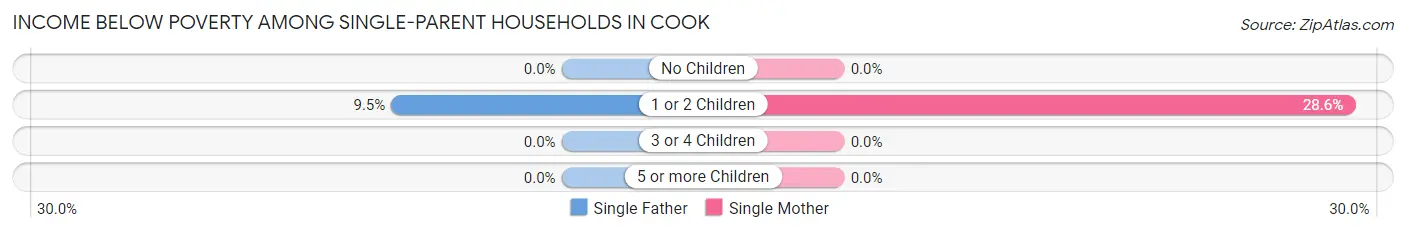
| Children | Single Father | Single Mother |
| No Children | 0 (0.0%) | 0 (0.0%) |
| 1 or 2 Children | 2 (9.5%) | 4 (28.6%) |
| 3 or 4 Children | 0 (0.0%) | 0 (0.0%) |
| 5 or more Children | 0 (0.0%) | 0 (0.0%) |
| Total | 2 (9.5%) | 4 (25.0%) |
Income Below Poverty Among Married-Couple vs Single-Parent Households in Cook
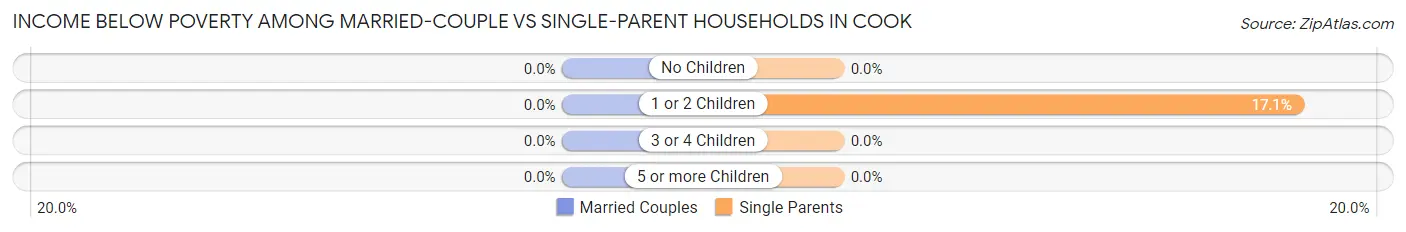
| Children | Married-Couple Families | Single-Parent Households |
| No Children | 0 (0.0%) | 0 (0.0%) |
| 1 or 2 Children | 0 (0.0%) | 6 (17.1%) |
| 3 or 4 Children | 0 (0.0%) | 0 (0.0%) |
| 5 or more Children | 0 (0.0%) | 0 (0.0%) |
| Total | 0 (0.0%) | 6 (16.2%) |
Race in Cook
The most populous races in Cook are White / Caucasian (422 | 91.9%), Two or more Races (22 | 4.8%), and Hispanic or Latino (10 | 2.2%).
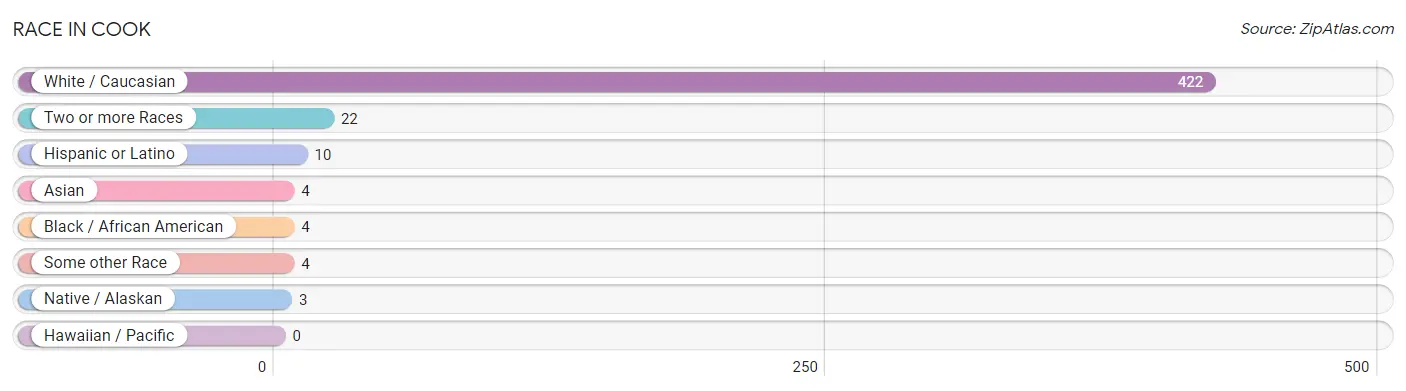
| Race | # Population | % Population |
| Asian | 4 | 0.9% |
| Black / African American | 4 | 0.9% |
| Hawaiian / Pacific | 0 | 0.0% |
| Hispanic or Latino | 10 | 2.2% |
| Native / Alaskan | 3 | 0.6% |
| White / Caucasian | 422 | 91.9% |
| Two or more Races | 22 | 4.8% |
| Some other Race | 4 | 0.9% |
| Total | 459 | 100.0% |
Ancestry in Cook
The most populous ancestries reported in Cook are Norwegian (116 | 25.3%), German (89 | 19.4%), Finnish (74 | 16.1%), Swedish (52 | 11.3%), and Irish (43 | 9.4%), together accounting for 81.5% of all Cook residents.
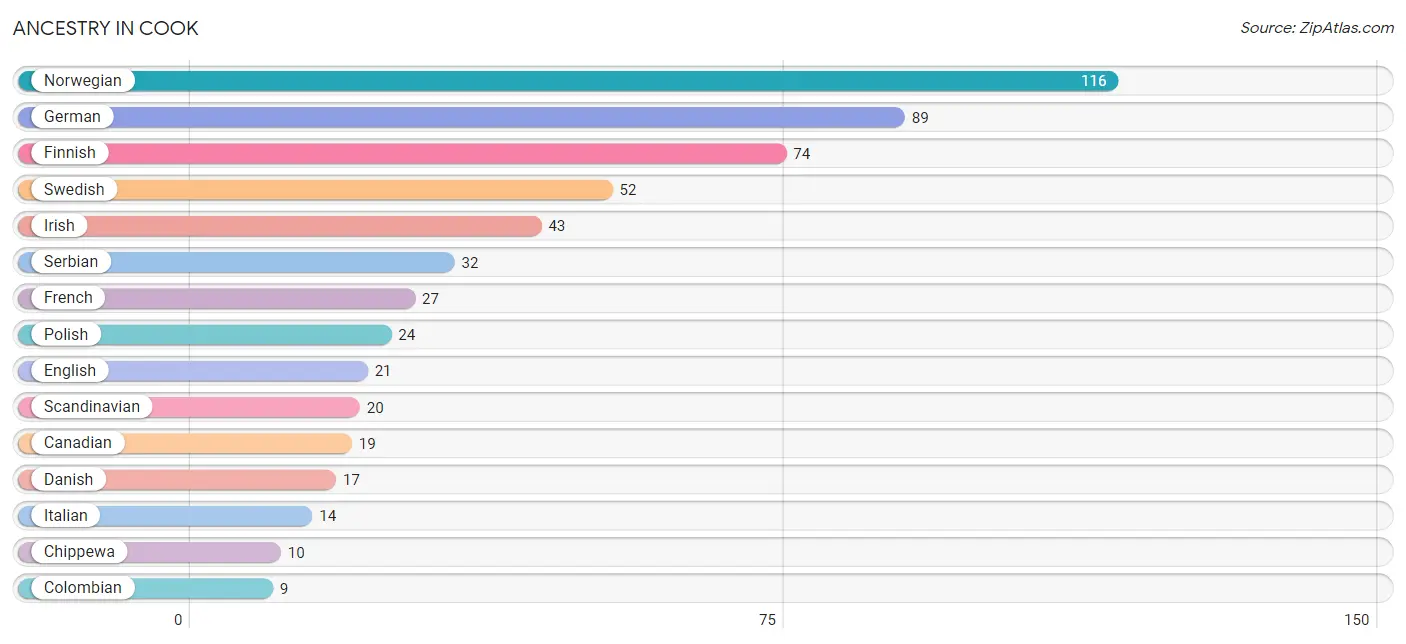
| Ancestry | # Population | % Population |
| American | 7 | 1.5% |
| Austrian | 2 | 0.4% |
| British | 3 | 0.6% |
| Canadian | 19 | 4.1% |
| Central American | 1 | 0.2% |
| Chippewa | 10 | 2.2% |
| Colombian | 9 | 2.0% |
| Czech | 2 | 0.4% |
| Danish | 17 | 3.7% |
| English | 21 | 4.6% |
| Finnish | 74 | 16.1% |
| French | 27 | 5.9% |
| French Canadian | 5 | 1.1% |
| German | 89 | 19.4% |
| Greek | 2 | 0.4% |
| Guatemalan | 1 | 0.2% |
| Irish | 43 | 9.4% |
| Italian | 14 | 3.0% |
| Northern European | 2 | 0.4% |
| Norwegian | 116 | 25.3% |
| Polish | 24 | 5.2% |
| Russian | 4 | 0.9% |
| Scandinavian | 20 | 4.4% |
| Scottish | 4 | 0.9% |
| Serbian | 32 | 7.0% |
| Sioux | 2 | 0.4% |
| Slovene | 4 | 0.9% |
| South American | 9 | 2.0% |
| Swedish | 52 | 11.3% |
| Swiss | 3 | 0.6% |
| Welsh | 2 | 0.4% | View All 31 Rows |
Immigrants in Cook
The most numerous immigrant groups reported in Cook came from Latin America (7 | 1.5%), Asia (4 | 0.9%), Pakistan (4 | 0.9%), South Central Asia (4 | 0.9%), and Caribbean (3 | 0.6%), together accounting for 4.8% of all Cook residents.
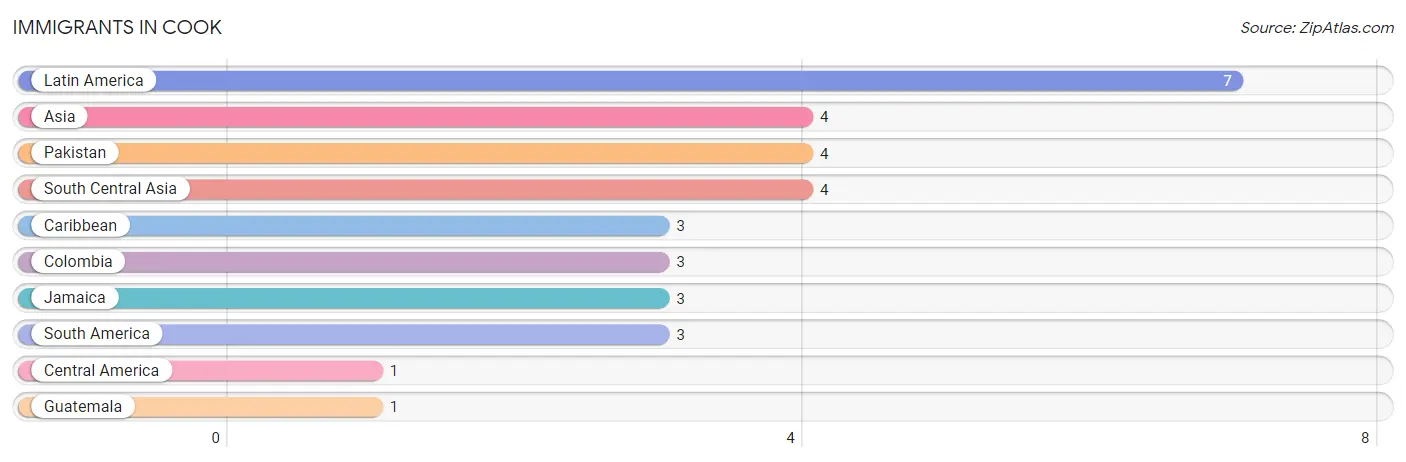
| Immigration Origin | # Population | % Population |
| Asia | 4 | 0.9% |
| Caribbean | 3 | 0.6% |
| Central America | 1 | 0.2% |
| Colombia | 3 | 0.6% |
| Guatemala | 1 | 0.2% |
| Jamaica | 3 | 0.6% |
| Latin America | 7 | 1.5% |
| Pakistan | 4 | 0.9% |
| South America | 3 | 0.6% |
| South Central Asia | 4 | 0.9% | View All 10 Rows |
Sex and Age in Cook
Sex and Age in Cook
The most populous age groups in Cook are 40 to 44 Years (30 | 15.3%) for men and 85 Years and over (57 | 21.7%) for women.
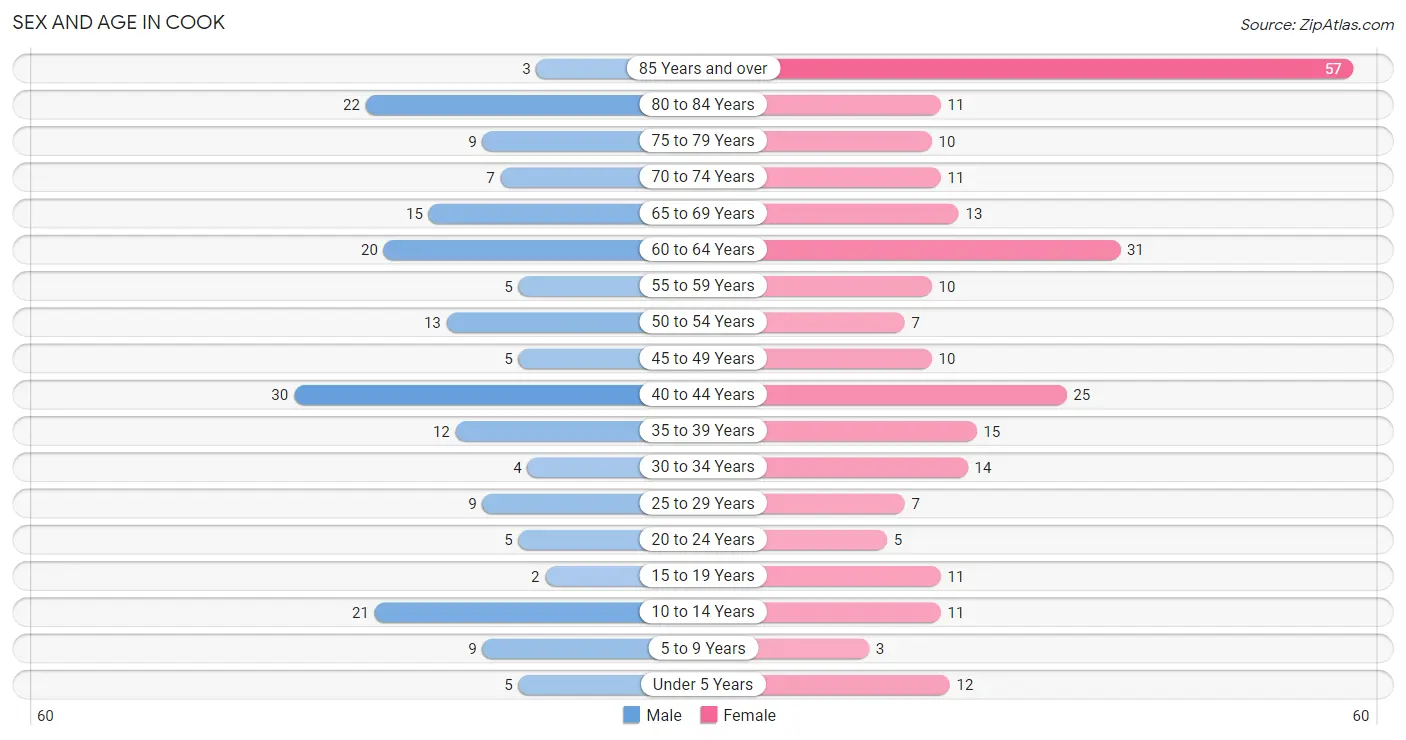
| Age Bracket | Male | Female |
| Under 5 Years | 5 (2.5%) | 12 (4.6%) |
| 5 to 9 Years | 9 (4.6%) | 3 (1.1%) |
| 10 to 14 Years | 21 (10.7%) | 11 (4.2%) |
| 15 to 19 Years | 2 (1.0%) | 11 (4.2%) |
| 20 to 24 Years | 5 (2.5%) | 5 (1.9%) |
| 25 to 29 Years | 9 (4.6%) | 7 (2.7%) |
| 30 to 34 Years | 4 (2.0%) | 14 (5.3%) |
| 35 to 39 Years | 12 (6.1%) | 15 (5.7%) |
| 40 to 44 Years | 30 (15.3%) | 25 (9.5%) |
| 45 to 49 Years | 5 (2.5%) | 10 (3.8%) |
| 50 to 54 Years | 13 (6.6%) | 7 (2.7%) |
| 55 to 59 Years | 5 (2.5%) | 10 (3.8%) |
| 60 to 64 Years | 20 (10.2%) | 31 (11.8%) |
| 65 to 69 Years | 15 (7.6%) | 13 (4.9%) |
| 70 to 74 Years | 7 (3.6%) | 11 (4.2%) |
| 75 to 79 Years | 9 (4.6%) | 10 (3.8%) |
| 80 to 84 Years | 22 (11.2%) | 11 (4.2%) |
| 85 Years and over | 3 (1.5%) | 57 (21.7%) |
| Total | 196 (100.0%) | 263 (100.0%) |
Families and Households in Cook
Median Family Size in Cook
The median family size in Cook is 2.48 persons per family, with single female/mother families (16 | 18.8%) accounting for the largest median family size of 3.06 persons per family. On the other hand, single male/father families (21 | 24.7%) represent the smallest median family size with 2.00 persons per family.
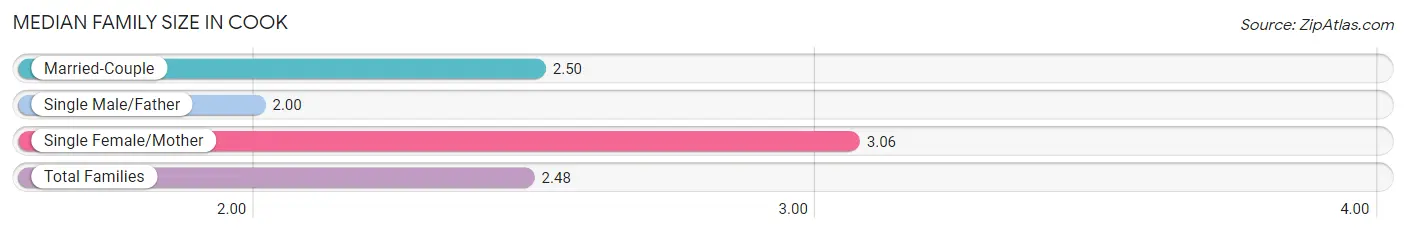
| Family Type | # Families | Family Size |
| Married-Couple | 48 (56.5%) | 2.50 |
| Single Male/Father | 21 (24.7%) | 2.00 |
| Single Female/Mother | 16 (18.8%) | 3.06 |
| Total Families | 85 (100.0%) | 2.48 |
Median Household Size in Cook
The median household size in Cook is 1.54 persons per household, with single female/mother households (16 | 6.1%) accounting for the largest median household size of 3.31 persons per household. non-family households (178 | 67.7%) represent the smallest median household size with 1.03 persons per household.
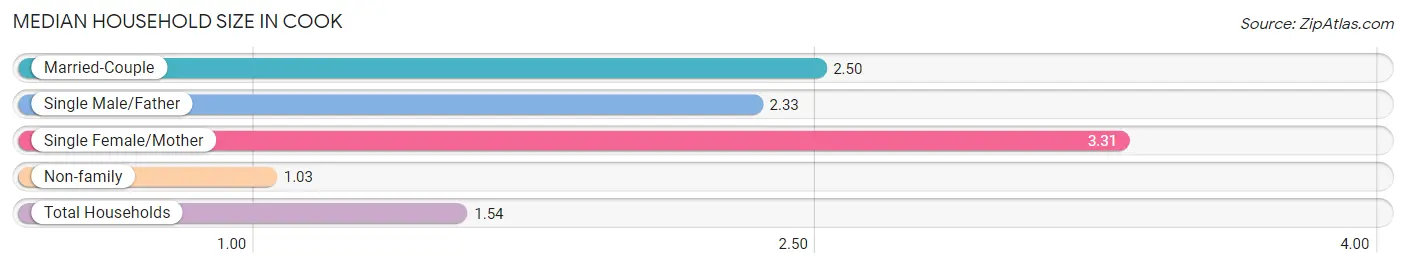
| Household Type | # Households | Household Size |
| Married-Couple | 48 (18.2%) | 2.50 |
| Single Male/Father | 21 (8.0%) | 2.33 |
| Single Female/Mother | 16 (6.1%) | 3.31 |
| Non-family | 178 (67.7%) | 1.03 |
| Total Households | 263 (100.0%) | 1.54 |
Household Size by Marriage Status in Cook
Out of a total of 263 households in Cook, 85 (32.3%) are family households, while 178 (67.7%) are nonfamily households. The most numerous type of family households are 2-person households, comprising 47, and the most common type of nonfamily households are 1-person households, comprising 171.
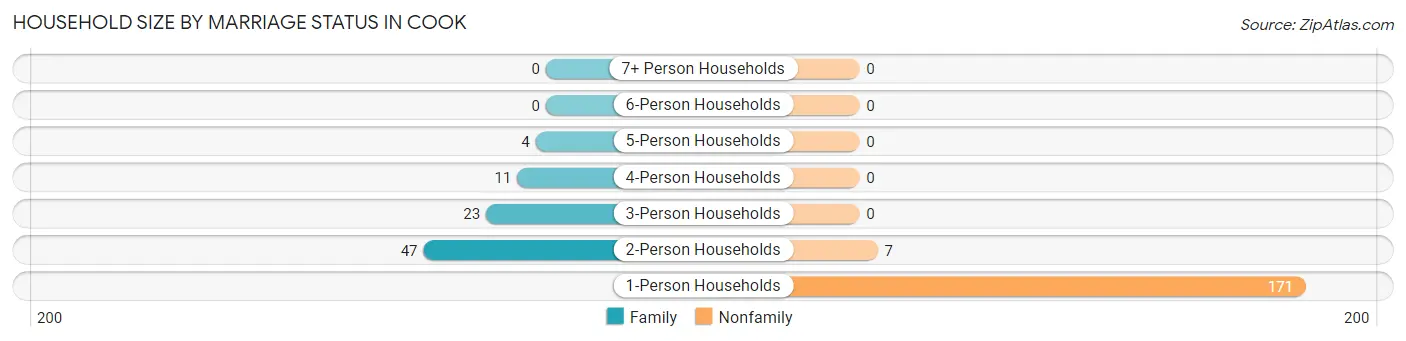
| Household Size | Family Households | Nonfamily Households |
| 1-Person Households | - | 171 (65.0%) |
| 2-Person Households | 47 (17.9%) | 7 (2.7%) |
| 3-Person Households | 23 (8.7%) | 0 (0.0%) |
| 4-Person Households | 11 (4.2%) | 0 (0.0%) |
| 5-Person Households | 4 (1.5%) | 0 (0.0%) |
| 6-Person Households | 0 (0.0%) | 0 (0.0%) |
| 7+ Person Households | 0 (0.0%) | 0 (0.0%) |
| Total | 85 (32.3%) | 178 (67.7%) |
Female Fertility in Cook
Fertility by Age in Cook
Average fertility rate in Cook is 23.0 births per 1,000 women. Women in the age bracket of 35 to 50 years have the highest fertility rate with 40.0 births per 1,000 women. Women in the age bracket of 35 to 50 years acount for 100.0% of all women with births.
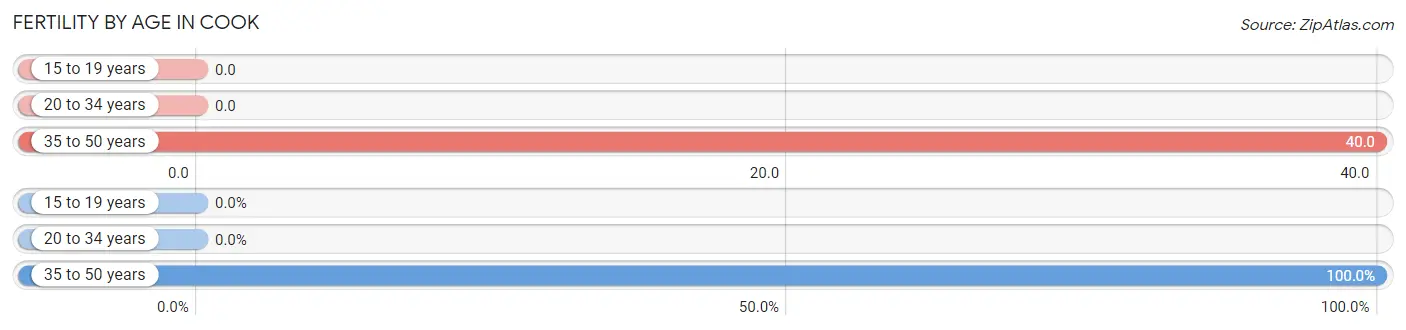
| Age Bracket | Women with Births | Births / 1,000 Women |
| 15 to 19 years | 0 (0.0%) | 0.0 |
| 20 to 34 years | 0 (0.0%) | 0.0 |
| 35 to 50 years | 2 (100.0%) | 40.0 |
| Total | 2 (100.0%) | 23.0 |
Fertility by Age by Marriage Status in Cook
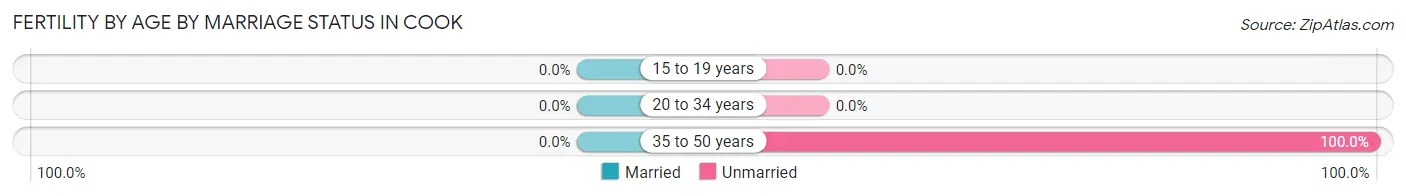
| Age Bracket | Married | Unmarried |
| 15 to 19 years | 0 (0.0%) | 0 (0.0%) |
| 20 to 34 years | 0 (0.0%) | 0 (0.0%) |
| 35 to 50 years | 0 (0.0%) | 2 (100.0%) |
| Total | 0 (0.0%) | 2 (100.0%) |
Fertility by Education in Cook
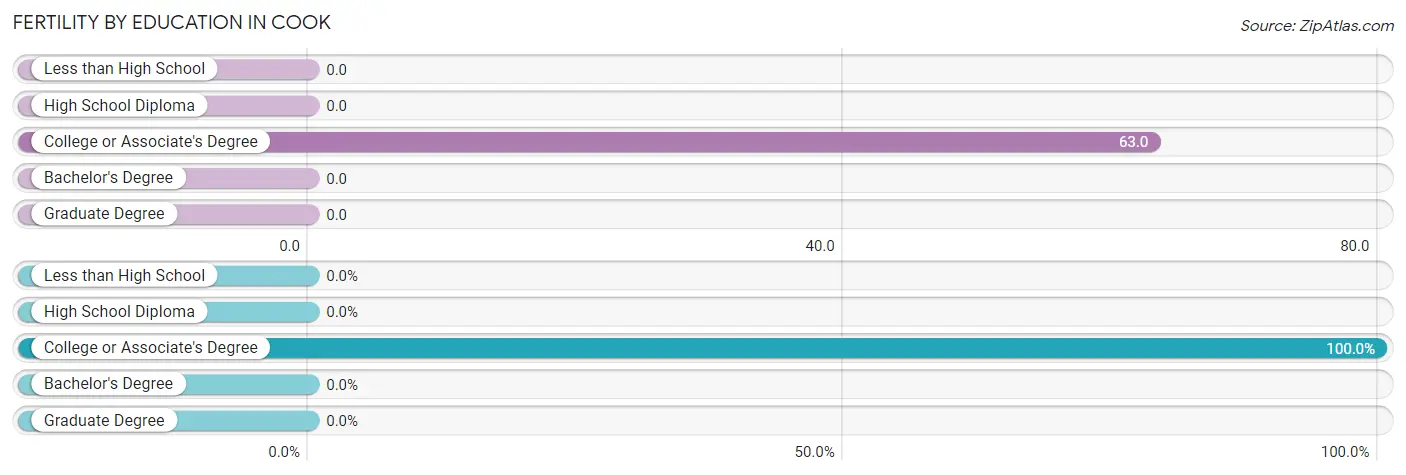
| Educational Attainment | Women with Births | Births / 1,000 Women |
| Less than High School | 0 (0.0%) | 0.0 |
| High School Diploma | 0 (0.0%) | 0.0 |
| College or Associate's Degree | 2 (100.0%) | 63.0 |
| Bachelor's Degree | 0 (0.0%) | 0.0 |
| Graduate Degree | 0 (0.0%) | 0.0 |
| Total | 2 (100.0%) | 23.0 |
Fertility by Education by Marriage Status in Cook
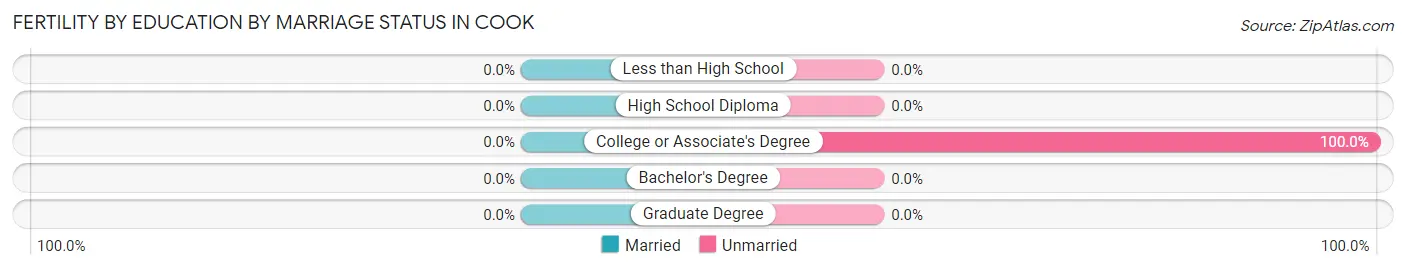
| Educational Attainment | Married | Unmarried |
| Less than High School | 0 (0.0%) | 0 (0.0%) |
| High School Diploma | 0 (0.0%) | 0 (0.0%) |
| College or Associate's Degree | 0 (0.0%) | 2 (100.0%) |
| Bachelor's Degree | 0 (0.0%) | 0 (0.0%) |
| Graduate Degree | 0 (0.0%) | 0 (0.0%) |
| Total | 0 (0.0%) | 2 (100.0%) |
Employment Characteristics in Cook
Employment by Class of Employer in Cook
Among the 180 employed individuals in Cook, private company employees (114 | 63.3%), not-for-profit organizations (35 | 19.4%), and local government employees (15 | 8.3%) make up the most common classes of employment.
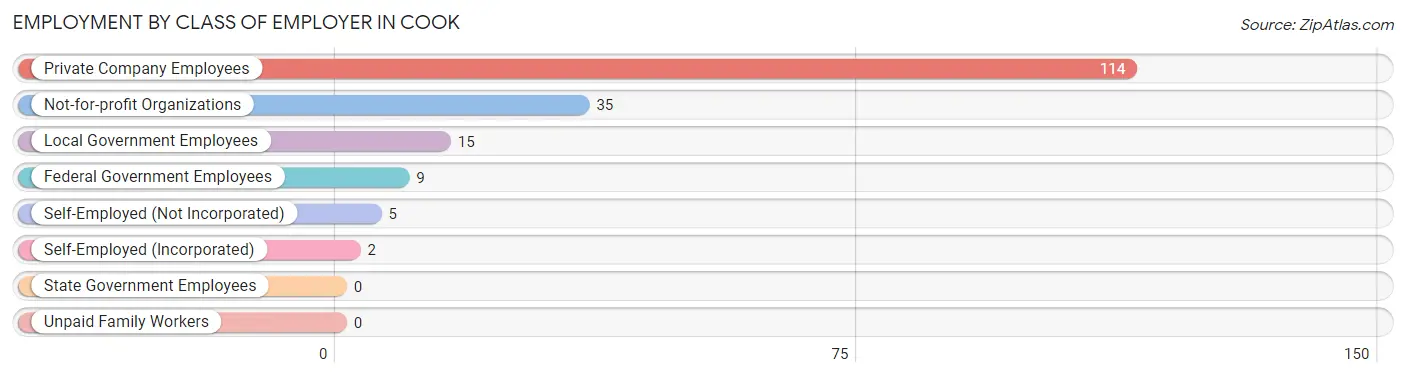
| Employer Class | # Employees | % Employees |
| Private Company Employees | 114 | 63.3% |
| Self-Employed (Incorporated) | 2 | 1.1% |
| Self-Employed (Not Incorporated) | 5 | 2.8% |
| Not-for-profit Organizations | 35 | 19.4% |
| Local Government Employees | 15 | 8.3% |
| State Government Employees | 0 | 0.0% |
| Federal Government Employees | 9 | 5.0% |
| Unpaid Family Workers | 0 | 0.0% |
| Total | 180 | 100.0% |
Employment Status by Age in Cook
According to the labor force statistics for Cook, out of the total population over 16 years of age (396), 49.5% or 196 individuals are in the labor force, with 6.6% or 13 of them unemployed. The age group with the highest labor force participation rate is 30 to 34 years, with 94.4% or 17 individuals in the labor force. Within the labor force, the 60 to 64 years age range has the highest percentage of unemployed individuals, with 31.3% or 10 of them being unemployed.
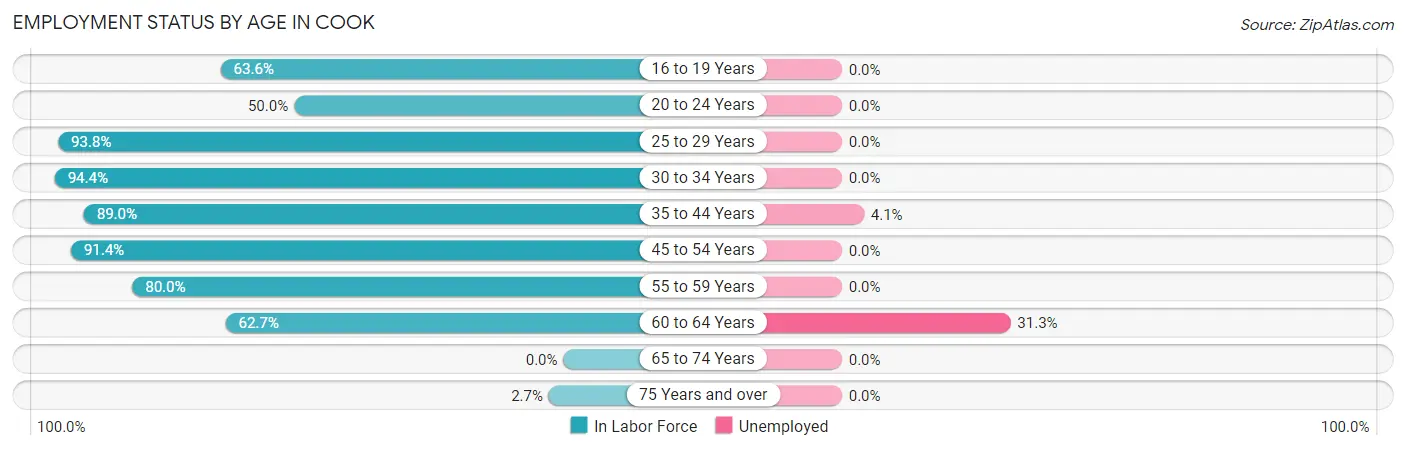
| Age Bracket | In Labor Force | Unemployed |
| 16 to 19 Years | 7 (63.6%) | 0 (0.0%) |
| 20 to 24 Years | 5 (50.0%) | 0 (0.0%) |
| 25 to 29 Years | 15 (93.8%) | 0 (0.0%) |
| 30 to 34 Years | 17 (94.4%) | 0 (0.0%) |
| 35 to 44 Years | 73 (89.0%) | 3 (4.1%) |
| 45 to 54 Years | 32 (91.4%) | 0 (0.0%) |
| 55 to 59 Years | 12 (80.0%) | 0 (0.0%) |
| 60 to 64 Years | 32 (62.7%) | 10 (31.3%) |
| 65 to 74 Years | 0 (0.0%) | 0 (0.0%) |
| 75 Years and over | 3 (2.7%) | 0 (0.0%) |
| Total | 196 (49.5%) | 13 (6.6%) |
Employment Status by Educational Attainment in Cook
According to labor force statistics for Cook, 83.4% of individuals (181) out of the total population between 25 and 64 years of age (217) are in the labor force, with 7.2% or 13 of them being unemployed. The group with the highest labor force participation rate are those with the educational attainment of bachelor's degree or higher, with 100.0% or 54 individuals in the labor force. Within the labor force, individuals with high school diploma education have the highest percentage of unemployment, with 24.1% or 13 of them being unemployed.
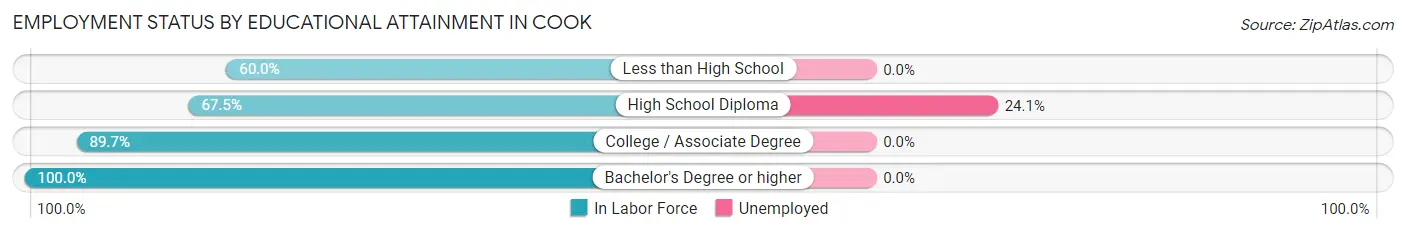
| Educational Attainment | In Labor Force | Unemployed |
| Less than High School | 3 (60.0%) | 0 (0.0%) |
| High School Diploma | 54 (67.5%) | 19 (24.1%) |
| College / Associate Degree | 70 (89.7%) | 0 (0.0%) |
| Bachelor's Degree or higher | 54 (100.0%) | 0 (0.0%) |
| Total | 181 (83.4%) | 16 (7.2%) |
Employment Occupations by Sex in Cook
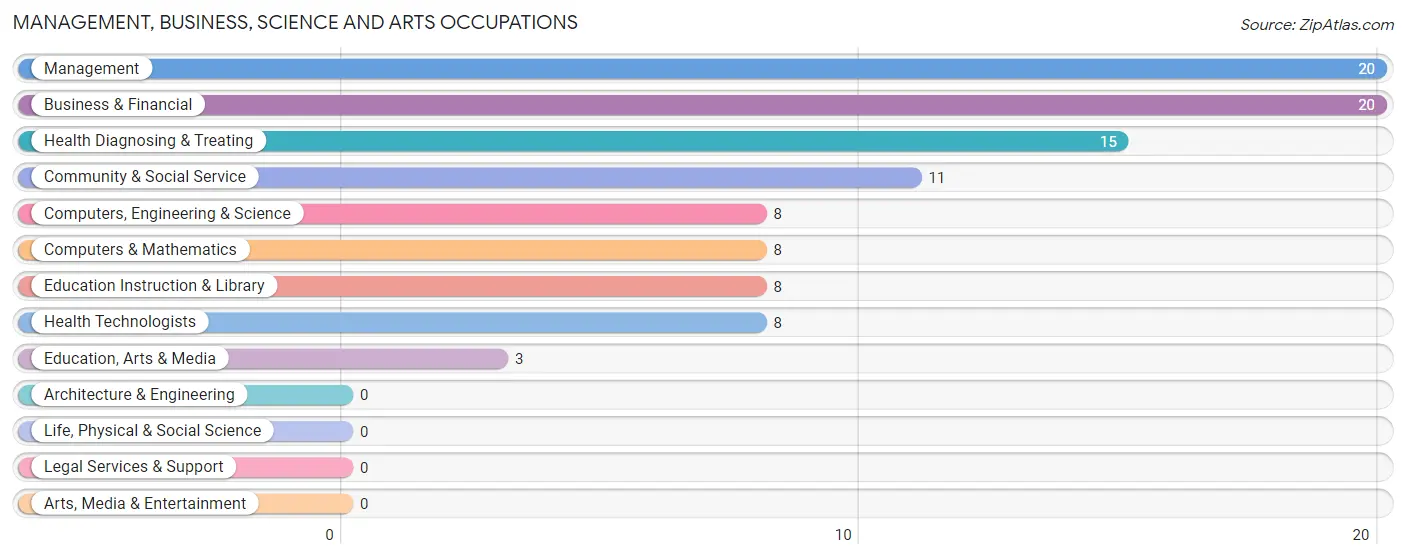
Management, Business, Science and Arts Occupations
The most common Management, Business, Science and Arts occupations in Cook are Management (20 | 10.9%), Business & Financial (20 | 10.9%), Health Diagnosing & Treating (15 | 8.2%), Community & Social Service (11 | 6.0%), and Computers, Engineering & Science (8 | 4.4%).
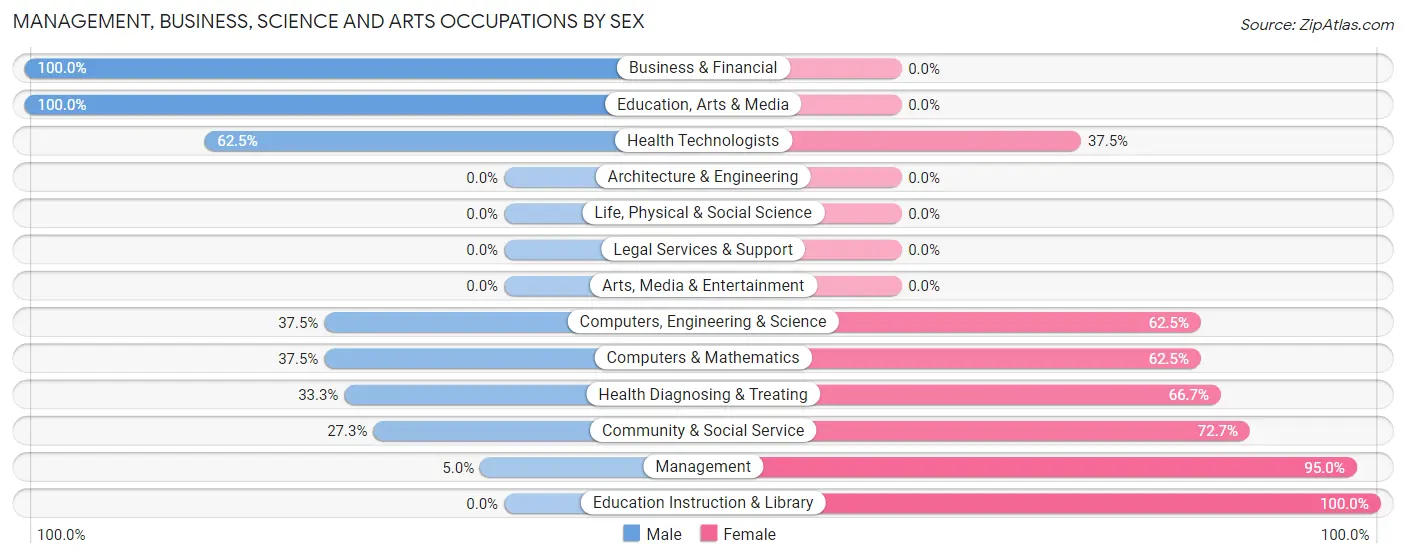
Management, Business, Science and Arts Occupations by Sex
Within the Management, Business, Science and Arts occupations in Cook, the most male-oriented occupations are Business & Financial (100.0%), Education, Arts & Media (100.0%), and Health Technologists (62.5%), while the most female-oriented occupations are Education Instruction & Library (100.0%), Management (95.0%), and Community & Social Service (72.7%).
| Occupation | Male | Female |
| Management | 1 (5.0%) | 19 (95.0%) |
| Business & Financial | 20 (100.0%) | 0 (0.0%) |
| Computers, Engineering & Science | 3 (37.5%) | 5 (62.5%) |
| Computers & Mathematics | 3 (37.5%) | 5 (62.5%) |
| Architecture & Engineering | 0 (0.0%) | 0 (0.0%) |
| Life, Physical & Social Science | 0 (0.0%) | 0 (0.0%) |
| Community & Social Service | 3 (27.3%) | 8 (72.7%) |
| Education, Arts & Media | 3 (100.0%) | 0 (0.0%) |
| Legal Services & Support | 0 (0.0%) | 0 (0.0%) |
| Education Instruction & Library | 0 (0.0%) | 8 (100.0%) |
| Arts, Media & Entertainment | 0 (0.0%) | 0 (0.0%) |
| Health Diagnosing & Treating | 5 (33.3%) | 10 (66.7%) |
| Health Technologists | 5 (62.5%) | 3 (37.5%) |
| Total (Category) | 32 (43.2%) | 42 (56.8%) |
| Total (Overall) | 89 (48.6%) | 94 (51.4%) |
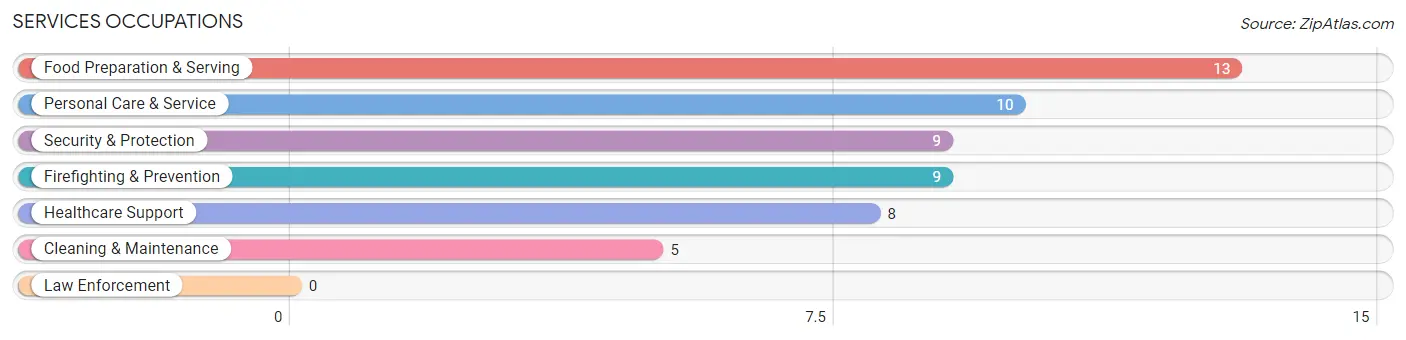
Services Occupations
The most common Services occupations in Cook are Food Preparation & Serving (13 | 7.1%), Personal Care & Service (10 | 5.5%), Security & Protection (9 | 4.9%), Firefighting & Prevention (9 | 4.9%), and Healthcare Support (8 | 4.4%).
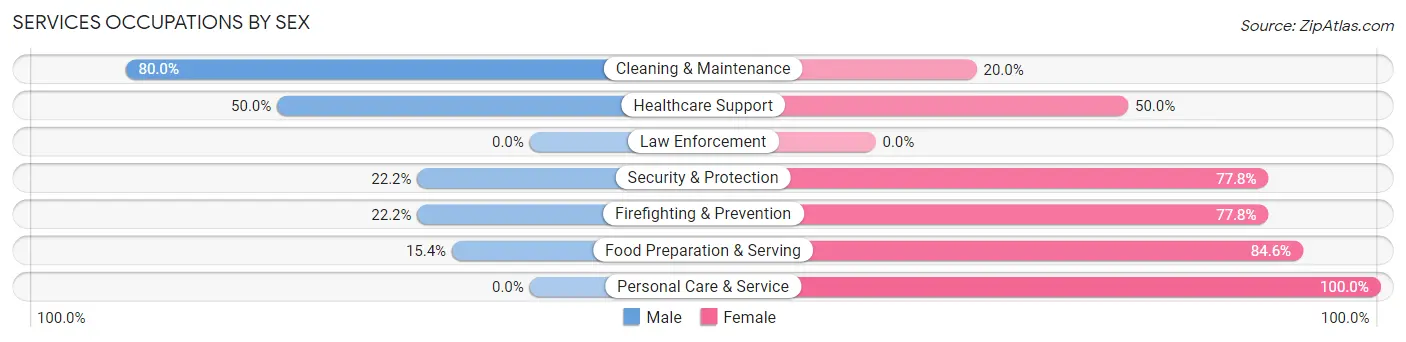
Services Occupations by Sex
Within the Services occupations in Cook, the most male-oriented occupations are Cleaning & Maintenance (80.0%), Healthcare Support (50.0%), and Security & Protection (22.2%), while the most female-oriented occupations are Personal Care & Service (100.0%), Food Preparation & Serving (84.6%), and Security & Protection (77.8%).
| Occupation | Male | Female |
| Healthcare Support | 4 (50.0%) | 4 (50.0%) |
| Security & Protection | 2 (22.2%) | 7 (77.8%) |
| Firefighting & Prevention | 2 (22.2%) | 7 (77.8%) |
| Law Enforcement | 0 (0.0%) | 0 (0.0%) |
| Food Preparation & Serving | 2 (15.4%) | 11 (84.6%) |
| Cleaning & Maintenance | 4 (80.0%) | 1 (20.0%) |
| Personal Care & Service | 0 (0.0%) | 10 (100.0%) |
| Total (Category) | 12 (26.7%) | 33 (73.3%) |
| Total (Overall) | 89 (48.6%) | 94 (51.4%) |
Sales and Office Occupations
The most common Sales and Office occupations in Cook are Office & Administration (11 | 6.0%), and Sales & Related (8 | 4.4%).

Sales and Office Occupations by Sex
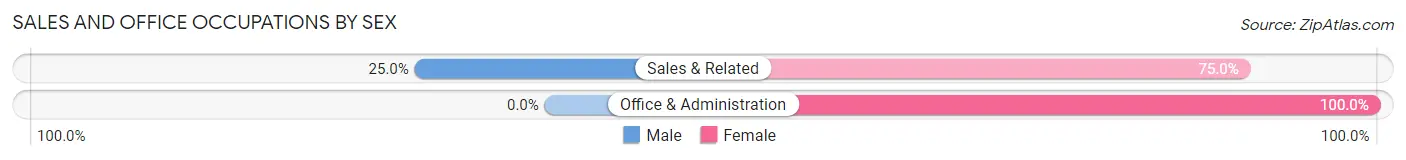
| Occupation | Male | Female |
| Sales & Related | 2 (25.0%) | 6 (75.0%) |
| Office & Administration | 0 (0.0%) | 11 (100.0%) |
| Total (Category) | 2 (10.5%) | 17 (89.5%) |
| Total (Overall) | 89 (48.6%) | 94 (51.4%) |
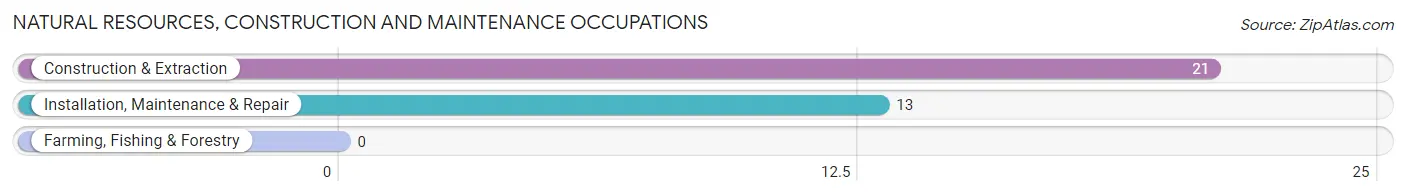
Natural Resources, Construction and Maintenance Occupations
The most common Natural Resources, Construction and Maintenance occupations in Cook are Construction & Extraction (21 | 11.5%), and Installation, Maintenance & Repair (13 | 7.1%).
Natural Resources, Construction and Maintenance Occupations by Sex
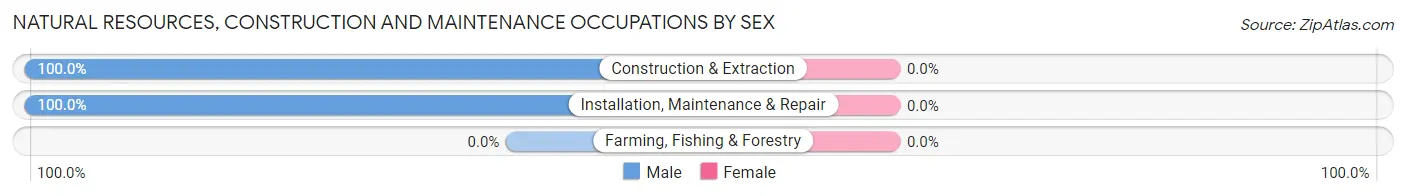
| Occupation | Male | Female |
| Farming, Fishing & Forestry | 0 (0.0%) | 0 (0.0%) |
| Construction & Extraction | 21 (100.0%) | 0 (0.0%) |
| Installation, Maintenance & Repair | 13 (100.0%) | 0 (0.0%) |
| Total (Category) | 34 (100.0%) | 0 (0.0%) |
| Total (Overall) | 89 (48.6%) | 94 (51.4%) |
Production, Transportation and Moving Occupations
The most common Production, Transportation and Moving occupations in Cook are Production (7 | 3.8%), Transportation (2 | 1.1%), and Material Moving (2 | 1.1%).
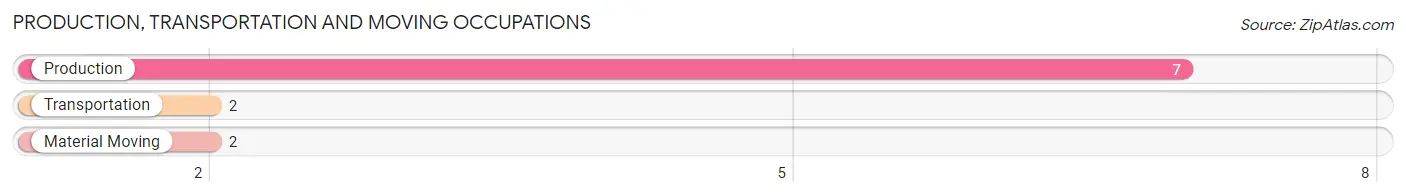
Production, Transportation and Moving Occupations by Sex
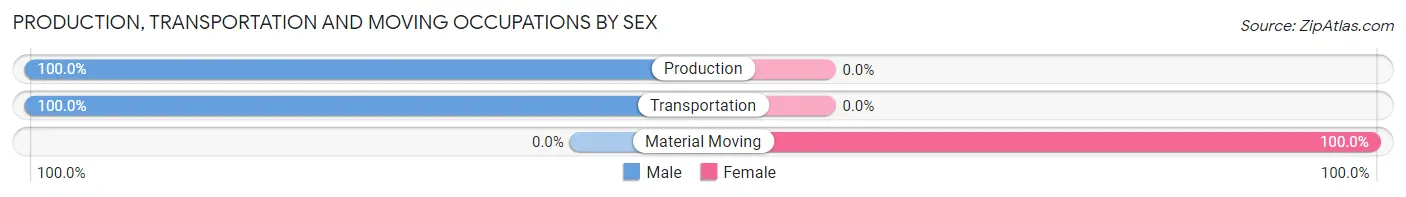
| Occupation | Male | Female |
| Production | 7 (100.0%) | 0 (0.0%) |
| Transportation | 2 (100.0%) | 0 (0.0%) |
| Material Moving | 0 (0.0%) | 2 (100.0%) |
| Total (Category) | 9 (81.8%) | 2 (18.2%) |
| Total (Overall) | 89 (48.6%) | 94 (51.4%) |
Employment Industries by Sex in Cook
Employment Industries in Cook
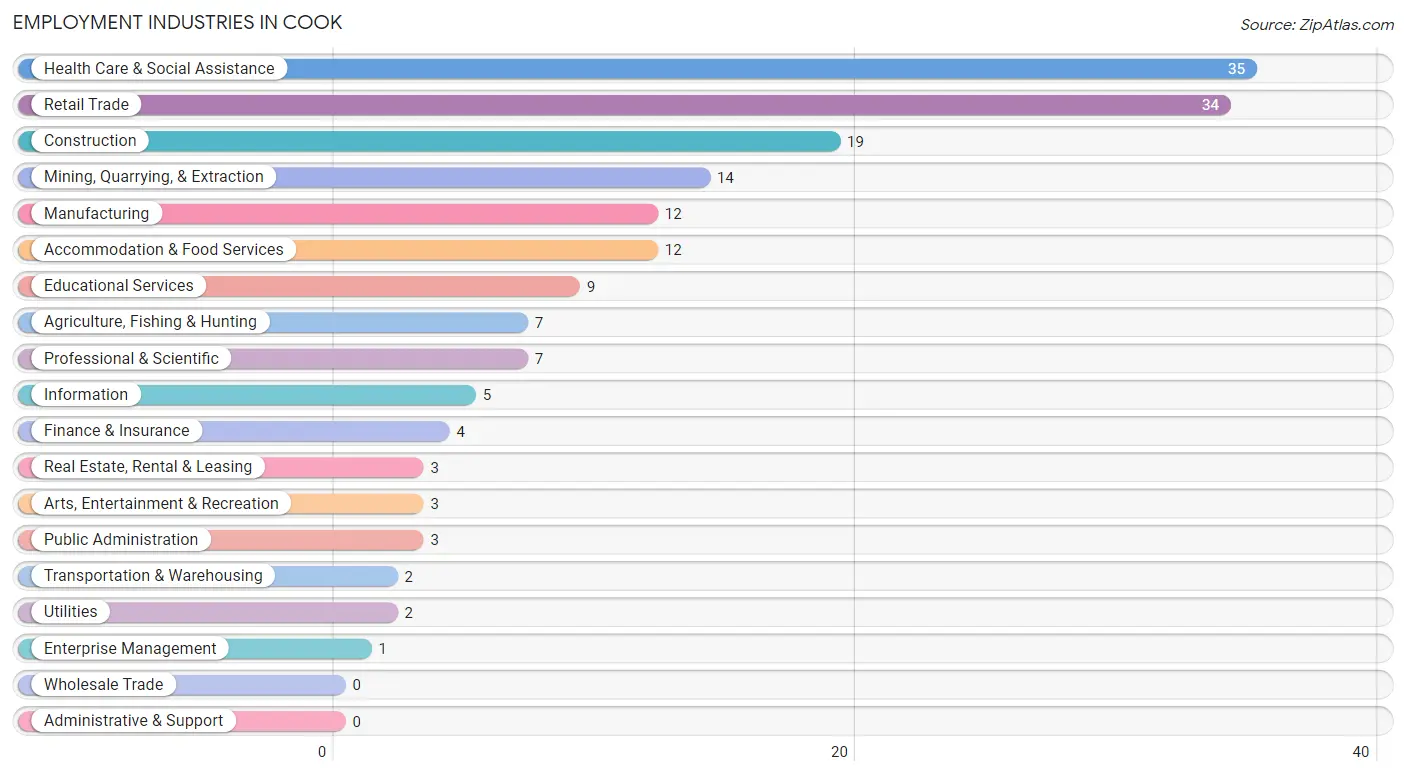
The major employment industries in Cook include Health Care & Social Assistance (35 | 19.1%), Retail Trade (34 | 18.6%), Construction (19 | 10.4%), Mining, Quarrying, & Extraction (14 | 7.6%), and Manufacturing (12 | 6.6%).
Employment Industries by Sex in Cook
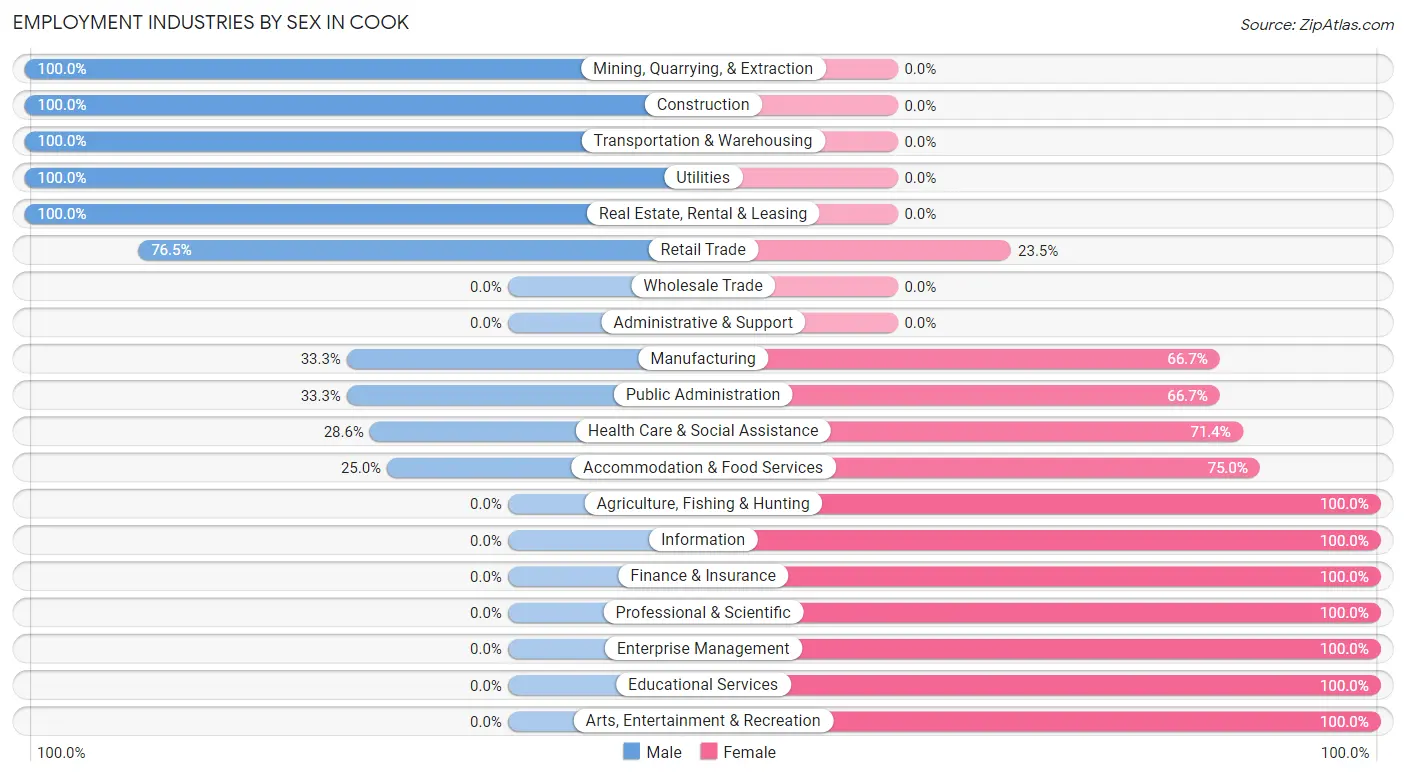
The Cook industries that see more men than women are Mining, Quarrying, & Extraction (100.0%), Construction (100.0%), and Transportation & Warehousing (100.0%), whereas the industries that tend to have a higher number of women are Agriculture, Fishing & Hunting (100.0%), Information (100.0%), and Finance & Insurance (100.0%).
| Industry | Male | Female |
| Agriculture, Fishing & Hunting | 0 (0.0%) | 7 (100.0%) |
| Mining, Quarrying, & Extraction | 14 (100.0%) | 0 (0.0%) |
| Construction | 19 (100.0%) | 0 (0.0%) |
| Manufacturing | 4 (33.3%) | 8 (66.7%) |
| Wholesale Trade | 0 (0.0%) | 0 (0.0%) |
| Retail Trade | 26 (76.5%) | 8 (23.5%) |
| Transportation & Warehousing | 2 (100.0%) | 0 (0.0%) |
| Utilities | 2 (100.0%) | 0 (0.0%) |
| Information | 0 (0.0%) | 5 (100.0%) |
| Finance & Insurance | 0 (0.0%) | 4 (100.0%) |
| Real Estate, Rental & Leasing | 3 (100.0%) | 0 (0.0%) |
| Professional & Scientific | 0 (0.0%) | 7 (100.0%) |
| Enterprise Management | 0 (0.0%) | 1 (100.0%) |
| Administrative & Support | 0 (0.0%) | 0 (0.0%) |
| Educational Services | 0 (0.0%) | 9 (100.0%) |
| Health Care & Social Assistance | 10 (28.6%) | 25 (71.4%) |
| Arts, Entertainment & Recreation | 0 (0.0%) | 3 (100.0%) |
| Accommodation & Food Services | 3 (25.0%) | 9 (75.0%) |
| Public Administration | 1 (33.3%) | 2 (66.7%) |
| Total | 89 (48.6%) | 94 (51.4%) |
Education in Cook
School Enrollment in Cook
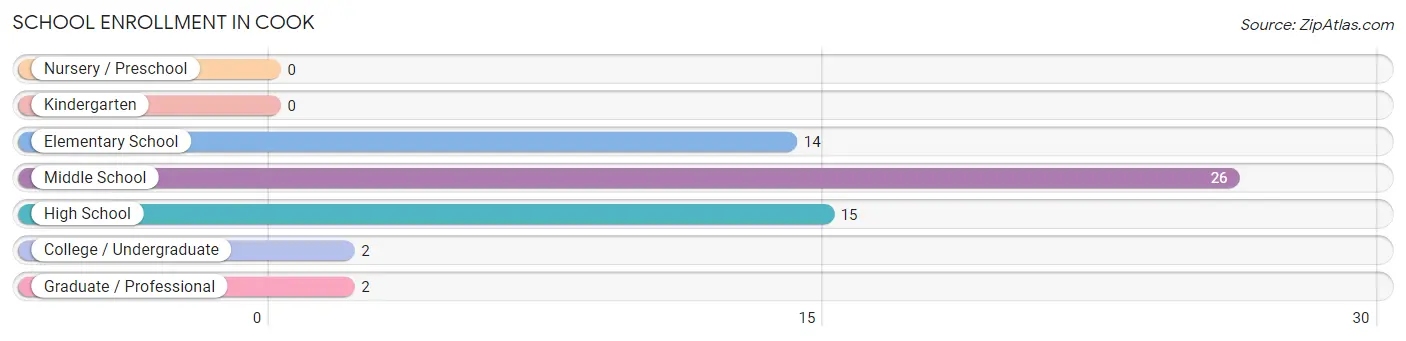
The most common levels of schooling among the 59 students in Cook are middle school (26 | 44.1%), high school (15 | 25.4%), and elementary school (14 | 23.7%).
| School Level | # Students | % Students |
| Nursery / Preschool | 0 | 0.0% |
| Kindergarten | 0 | 0.0% |
| Elementary School | 14 | 23.7% |
| Middle School | 26 | 44.1% |
| High School | 15 | 25.4% |
| College / Undergraduate | 2 | 3.4% |
| Graduate / Professional | 2 | 3.4% |
| Total | 59 | 100.0% |
School Enrollment by Age by Funding Source in Cook
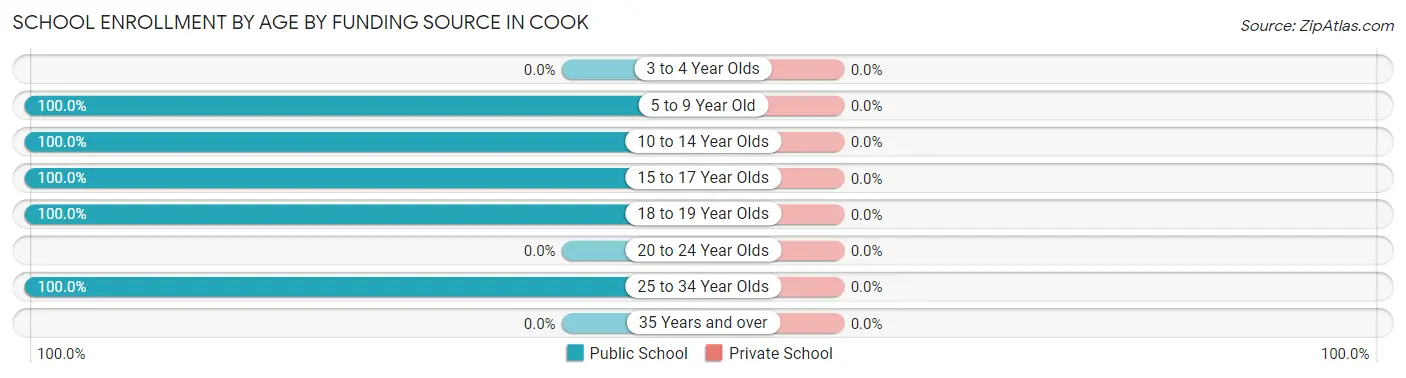
| Age Bracket | Public School | Private School |
| 3 to 4 Year Olds | 0 (0.0%) | 0 (0.0%) |
| 5 to 9 Year Old | 12 (100.0%) | 0 (0.0%) |
| 10 to 14 Year Olds | 32 (100.0%) | 0 (0.0%) |
| 15 to 17 Year Olds | 11 (100.0%) | 0 (0.0%) |
| 18 to 19 Year Olds | 2 (100.0%) | 0 (0.0%) |
| 20 to 24 Year Olds | 0 (0.0%) | 0 (0.0%) |
| 25 to 34 Year Olds | 2 (100.0%) | 0 (0.0%) |
| 35 Years and over | 0 (0.0%) | 0 (0.0%) |
| Total | 59 (100.0%) | 0 (0.0%) |
Educational Attainment by Field of Study in Cook
Engineering (27 | 42.2%), bio, nature & agricultural (10 | 15.6%), social sciences (9 | 14.1%), arts & humanities (6 | 9.4%), and computers & mathematics (4 | 6.2%) are the most common fields of study among 64 individuals in Cook who have obtained a bachelor's degree or higher.
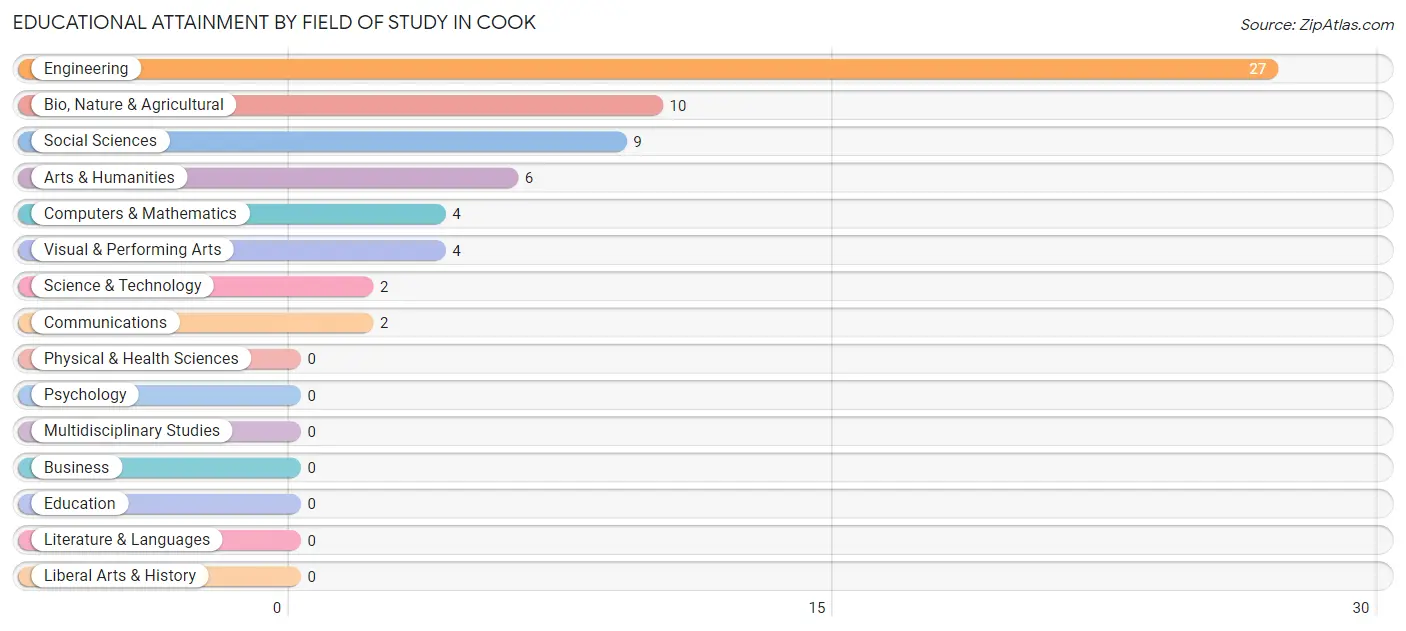
| Field of Study | # Graduates | % Graduates |
| Computers & Mathematics | 4 | 6.2% |
| Bio, Nature & Agricultural | 10 | 15.6% |
| Physical & Health Sciences | 0 | 0.0% |
| Psychology | 0 | 0.0% |
| Social Sciences | 9 | 14.1% |
| Engineering | 27 | 42.2% |
| Multidisciplinary Studies | 0 | 0.0% |
| Science & Technology | 2 | 3.1% |
| Business | 0 | 0.0% |
| Education | 0 | 0.0% |
| Literature & Languages | 0 | 0.0% |
| Liberal Arts & History | 0 | 0.0% |
| Visual & Performing Arts | 4 | 6.2% |
| Communications | 2 | 3.1% |
| Arts & Humanities | 6 | 9.4% |
| Total | 64 | 100.0% |
Transportation & Commute in Cook
Vehicle Availability by Sex in Cook
The most prevalent vehicle ownership categories in Cook are males with 2 vehicles (39, accounting for 46.4%) and females with 2 vehicles (39, making up 41.9%).
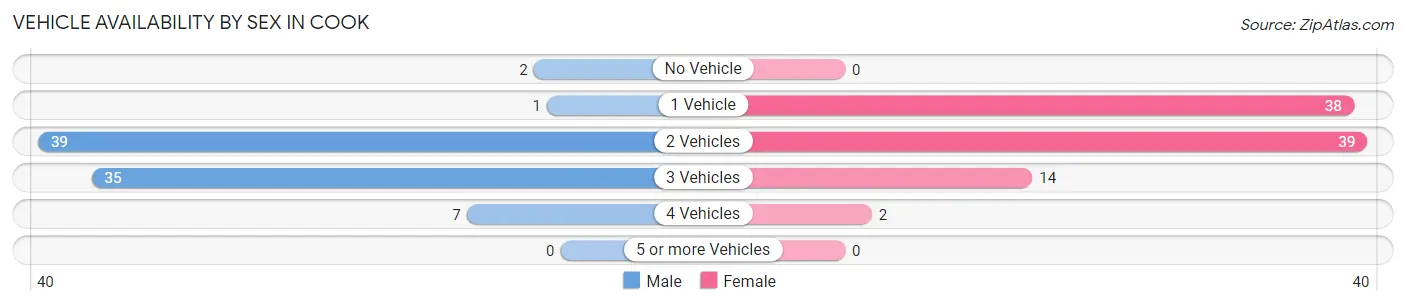
| Vehicles Available | Male | Female |
| No Vehicle | 2 (2.4%) | 0 (0.0%) |
| 1 Vehicle | 1 (1.2%) | 38 (40.9%) |
| 2 Vehicles | 39 (46.4%) | 39 (41.9%) |
| 3 Vehicles | 35 (41.7%) | 14 (15.0%) |
| 4 Vehicles | 7 (8.3%) | 2 (2.1%) |
| 5 or more Vehicles | 0 (0.0%) | 0 (0.0%) |
| Total | 84 (100.0%) | 93 (100.0%) |
Commute Time in Cook
The most frequently occuring commute durations in Cook are less than 5 minutes (73 commuters, 41.2%), 5 to 9 minutes (27 commuters, 15.2%), and 30 to 34 minutes (20 commuters, 11.3%).
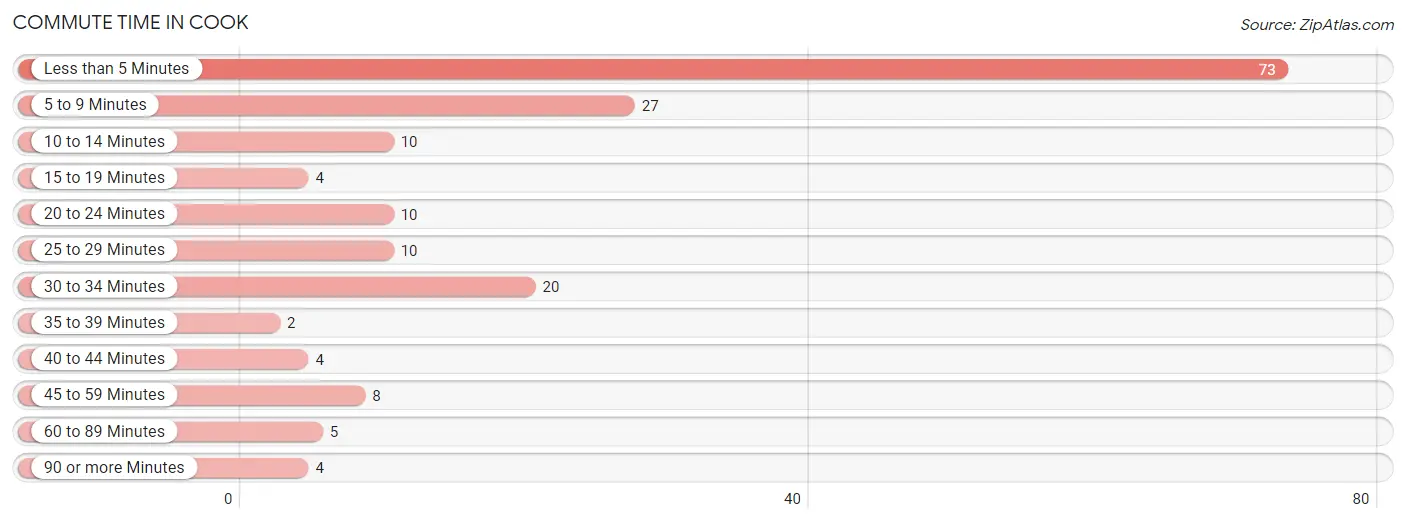
| Commute Time | # Commuters | % Commuters |
| Less than 5 Minutes | 73 | 41.2% |
| 5 to 9 Minutes | 27 | 15.2% |
| 10 to 14 Minutes | 10 | 5.7% |
| 15 to 19 Minutes | 4 | 2.3% |
| 20 to 24 Minutes | 10 | 5.7% |
| 25 to 29 Minutes | 10 | 5.7% |
| 30 to 34 Minutes | 20 | 11.3% |
| 35 to 39 Minutes | 2 | 1.1% |
| 40 to 44 Minutes | 4 | 2.3% |
| 45 to 59 Minutes | 8 | 4.5% |
| 60 to 89 Minutes | 5 | 2.8% |
| 90 or more Minutes | 4 | 2.3% |
Commute Time by Sex in Cook
The most common commute times in Cook are less than 5 minutes (28 commuters, 32.6%) for males and less than 5 minutes (45 commuters, 49.4%) for females.
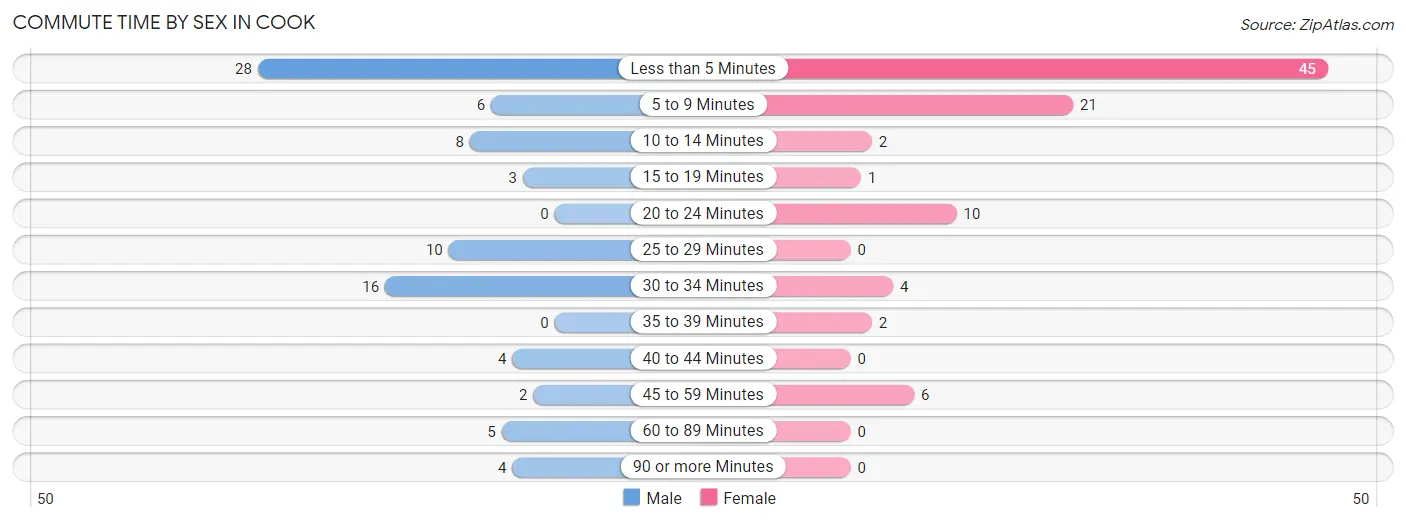
| Commute Time | Male | Female |
| Less than 5 Minutes | 28 (32.6%) | 45 (49.4%) |
| 5 to 9 Minutes | 6 (7.0%) | 21 (23.1%) |
| 10 to 14 Minutes | 8 (9.3%) | 2 (2.2%) |
| 15 to 19 Minutes | 3 (3.5%) | 1 (1.1%) |
| 20 to 24 Minutes | 0 (0.0%) | 10 (11.0%) |
| 25 to 29 Minutes | 10 (11.6%) | 0 (0.0%) |
| 30 to 34 Minutes | 16 (18.6%) | 4 (4.4%) |
| 35 to 39 Minutes | 0 (0.0%) | 2 (2.2%) |
| 40 to 44 Minutes | 4 (4.6%) | 0 (0.0%) |
| 45 to 59 Minutes | 2 (2.3%) | 6 (6.6%) |
| 60 to 89 Minutes | 5 (5.8%) | 0 (0.0%) |
| 90 or more Minutes | 4 (4.6%) | 0 (0.0%) |
Time of Departure to Work by Sex in Cook
The most frequent times of departure to work in Cook are 5:30 AM to 5:59 AM (32, 37.2%) for males and 8:00 AM to 8:29 AM (26, 28.6%) for females.
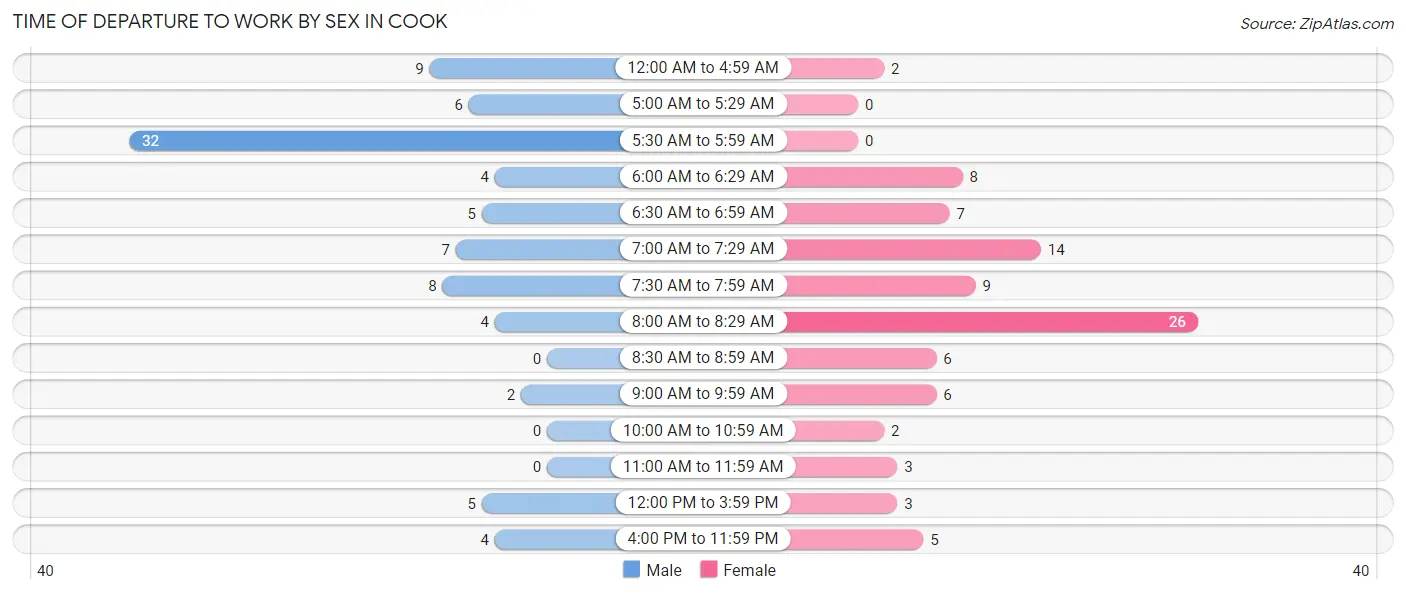
| Time of Departure | Male | Female |
| 12:00 AM to 4:59 AM | 9 (10.5%) | 2 (2.2%) |
| 5:00 AM to 5:29 AM | 6 (7.0%) | 0 (0.0%) |
| 5:30 AM to 5:59 AM | 32 (37.2%) | 0 (0.0%) |
| 6:00 AM to 6:29 AM | 4 (4.6%) | 8 (8.8%) |
| 6:30 AM to 6:59 AM | 5 (5.8%) | 7 (7.7%) |
| 7:00 AM to 7:29 AM | 7 (8.1%) | 14 (15.4%) |
| 7:30 AM to 7:59 AM | 8 (9.3%) | 9 (9.9%) |
| 8:00 AM to 8:29 AM | 4 (4.6%) | 26 (28.6%) |
| 8:30 AM to 8:59 AM | 0 (0.0%) | 6 (6.6%) |
| 9:00 AM to 9:59 AM | 2 (2.3%) | 6 (6.6%) |
| 10:00 AM to 10:59 AM | 0 (0.0%) | 2 (2.2%) |
| 11:00 AM to 11:59 AM | 0 (0.0%) | 3 (3.3%) |
| 12:00 PM to 3:59 PM | 5 (5.8%) | 3 (3.3%) |
| 4:00 PM to 11:59 PM | 4 (4.6%) | 5 (5.5%) |
| Total | 86 (100.0%) | 91 (100.0%) |
Housing Occupancy in Cook
Occupancy by Ownership in Cook
Of the total 263 dwellings in Cook, owner-occupied units account for 189 (71.9%), while renter-occupied units make up 74 (28.1%).
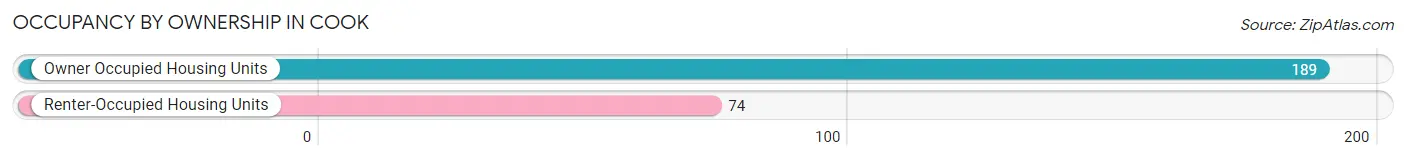
| Occupancy | # Housing Units | % Housing Units |
| Owner Occupied Housing Units | 189 | 71.9% |
| Renter-Occupied Housing Units | 74 | 28.1% |
| Total Occupied Housing Units | 263 | 100.0% |
Occupancy by Household Size in Cook
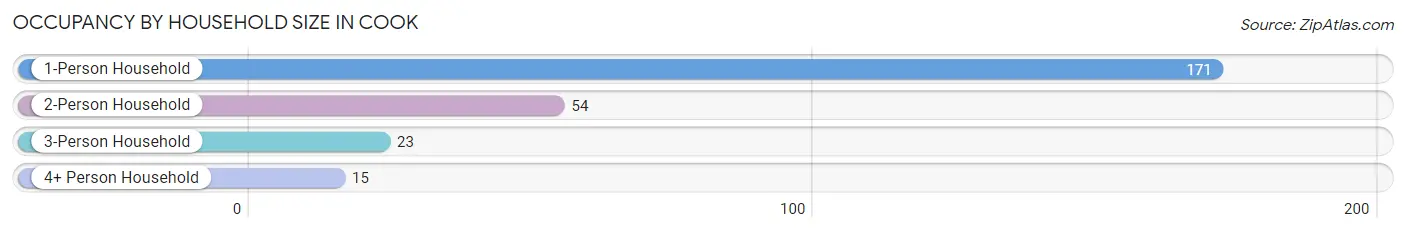
| Household Size | # Housing Units | % Housing Units |
| 1-Person Household | 171 | 65.0% |
| 2-Person Household | 54 | 20.5% |
| 3-Person Household | 23 | 8.7% |
| 4+ Person Household | 15 | 5.7% |
| Total Housing Units | 263 | 100.0% |
Occupancy by Ownership by Household Size in Cook
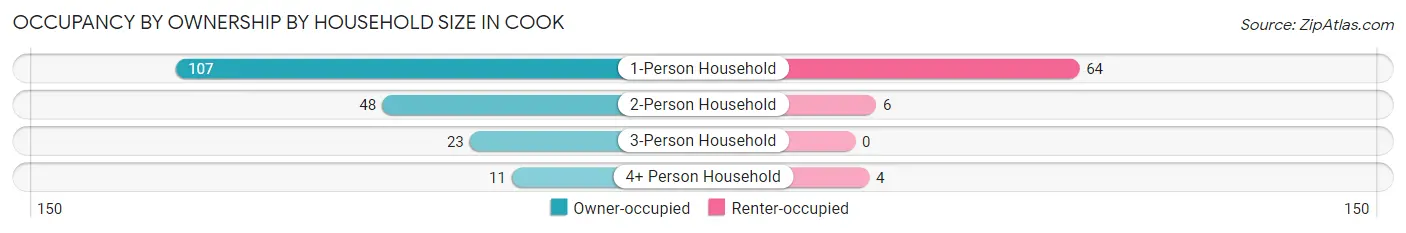
| Household Size | Owner-occupied | Renter-occupied |
| 1-Person Household | 107 (62.6%) | 64 (37.4%) |
| 2-Person Household | 48 (88.9%) | 6 (11.1%) |
| 3-Person Household | 23 (100.0%) | 0 (0.0%) |
| 4+ Person Household | 11 (73.3%) | 4 (26.7%) |
| Total Housing Units | 189 (71.9%) | 74 (28.1%) |
Occupancy by Educational Attainment in Cook
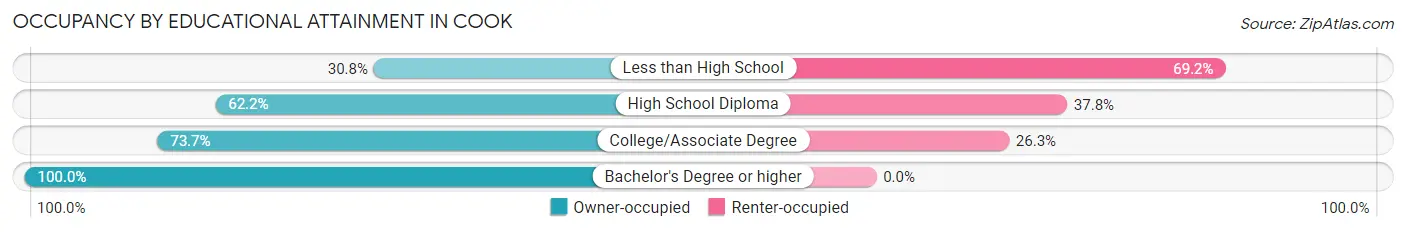
| Household Size | Owner-occupied | Renter-occupied |
| Less than High School | 4 (30.8%) | 9 (69.2%) |
| High School Diploma | 74 (62.2%) | 45 (37.8%) |
| College/Associate Degree | 56 (73.7%) | 20 (26.3%) |
| Bachelor's Degree or higher | 55 (100.0%) | 0 (0.0%) |
Occupancy by Age of Householder in Cook
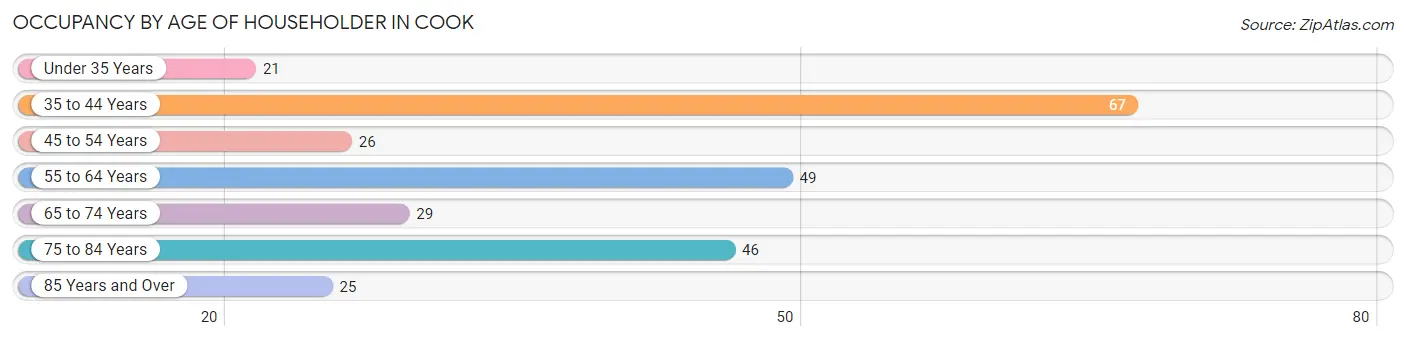
| Age Bracket | # Households | % Households |
| Under 35 Years | 21 | 8.0% |
| 35 to 44 Years | 67 | 25.5% |
| 45 to 54 Years | 26 | 9.9% |
| 55 to 64 Years | 49 | 18.6% |
| 65 to 74 Years | 29 | 11.0% |
| 75 to 84 Years | 46 | 17.5% |
| 85 Years and Over | 25 | 9.5% |
| Total | 263 | 100.0% |
Housing Finances in Cook
Median Income by Occupancy in Cook
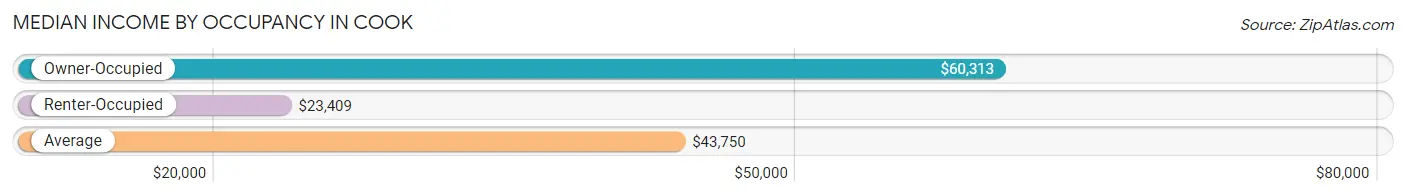
| Occupancy Type | # Households | Median Income |
| Owner-Occupied | 189 (71.9%) | $60,313 |
| Renter-Occupied | 74 (28.1%) | $23,409 |
| Average | 263 (100.0%) | $43,750 |
Occupancy by Householder Income Bracket in Cook
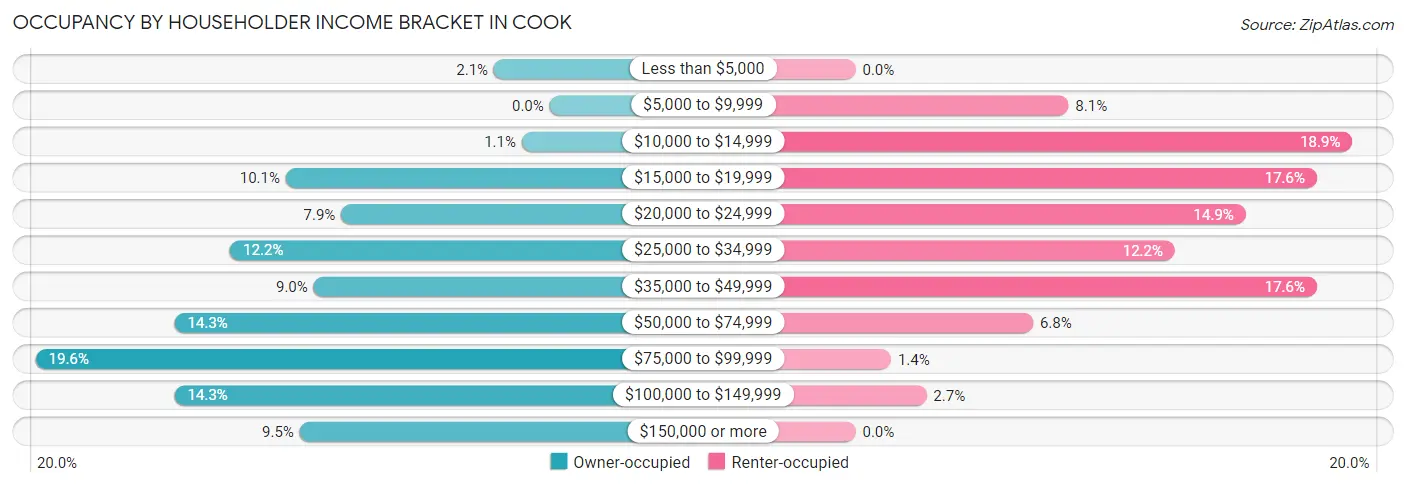
| Income Bracket | Owner-occupied | Renter-occupied |
| Less than $5,000 | 4 (2.1%) | 0 (0.0%) |
| $5,000 to $9,999 | 0 (0.0%) | 6 (8.1%) |
| $10,000 to $14,999 | 2 (1.1%) | 14 (18.9%) |
| $15,000 to $19,999 | 19 (10.1%) | 13 (17.6%) |
| $20,000 to $24,999 | 15 (7.9%) | 11 (14.9%) |
| $25,000 to $34,999 | 23 (12.2%) | 9 (12.2%) |
| $35,000 to $49,999 | 17 (9.0%) | 13 (17.6%) |
| $50,000 to $74,999 | 27 (14.3%) | 5 (6.8%) |
| $75,000 to $99,999 | 37 (19.6%) | 1 (1.3%) |
| $100,000 to $149,999 | 27 (14.3%) | 2 (2.7%) |
| $150,000 or more | 18 (9.5%) | 0 (0.0%) |
| Total | 189 (100.0%) | 74 (100.0%) |
Monthly Housing Cost Tiers in Cook
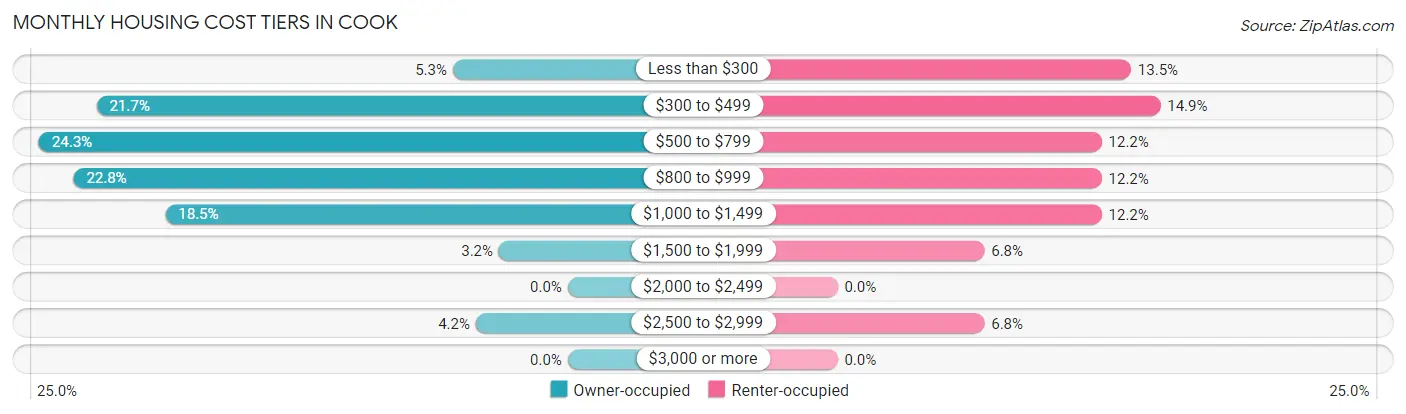
| Monthly Cost | Owner-occupied | Renter-occupied |
| Less than $300 | 10 (5.3%) | 10 (13.5%) |
| $300 to $499 | 41 (21.7%) | 11 (14.9%) |
| $500 to $799 | 46 (24.3%) | 9 (12.2%) |
| $800 to $999 | 43 (22.8%) | 9 (12.2%) |
| $1,000 to $1,499 | 35 (18.5%) | 9 (12.2%) |
| $1,500 to $1,999 | 6 (3.2%) | 5 (6.8%) |
| $2,000 to $2,499 | 0 (0.0%) | 0 (0.0%) |
| $2,500 to $2,999 | 8 (4.2%) | 5 (6.8%) |
| $3,000 or more | 0 (0.0%) | 0 (0.0%) |
| Total | 189 (100.0%) | 74 (100.0%) |
Physical Housing Characteristics in Cook
Housing Structures in Cook
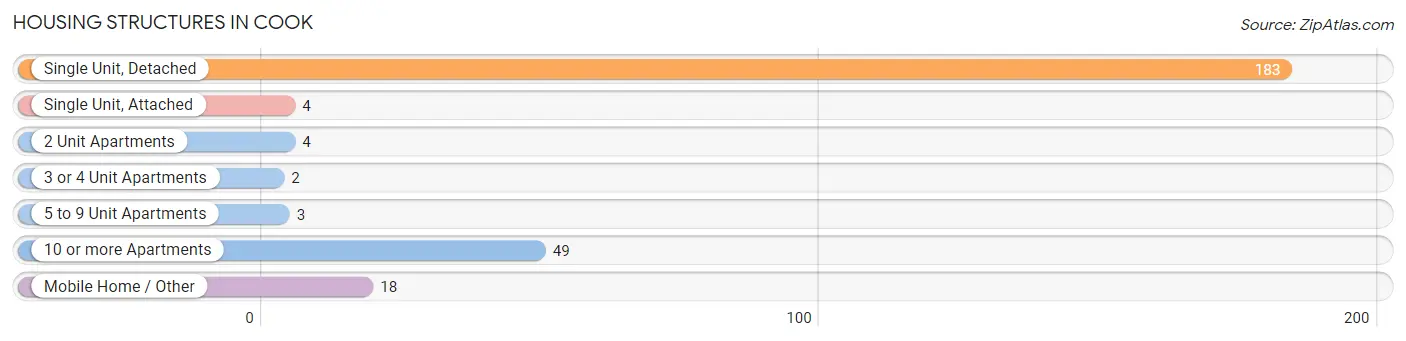
| Structure Type | # Housing Units | % Housing Units |
| Single Unit, Detached | 183 | 69.6% |
| Single Unit, Attached | 4 | 1.5% |
| 2 Unit Apartments | 4 | 1.5% |
| 3 or 4 Unit Apartments | 2 | 0.8% |
| 5 to 9 Unit Apartments | 3 | 1.1% |
| 10 or more Apartments | 49 | 18.6% |
| Mobile Home / Other | 18 | 6.8% |
| Total | 263 | 100.0% |
Housing Structures by Occupancy in Cook
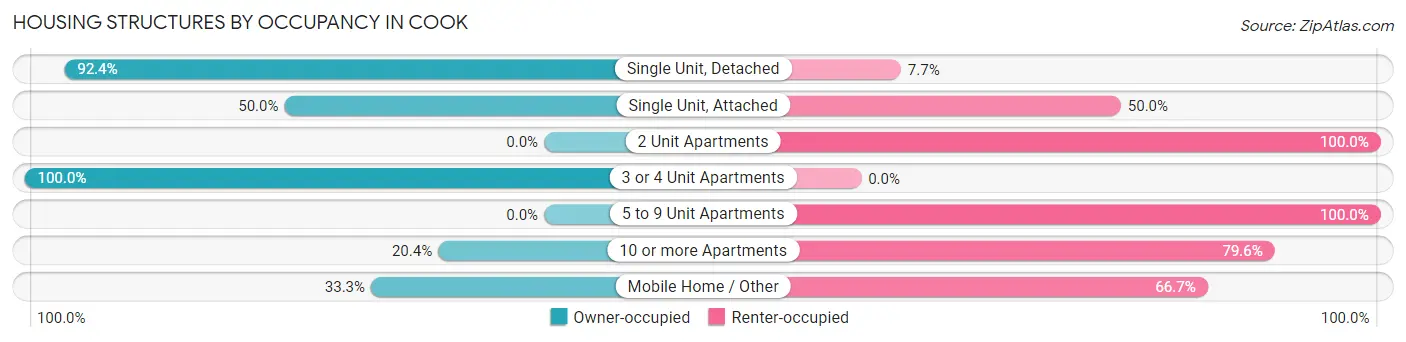
| Structure Type | Owner-occupied | Renter-occupied |
| Single Unit, Detached | 169 (92.3%) | 14 (7.6%) |
| Single Unit, Attached | 2 (50.0%) | 2 (50.0%) |
| 2 Unit Apartments | 0 (0.0%) | 4 (100.0%) |
| 3 or 4 Unit Apartments | 2 (100.0%) | 0 (0.0%) |
| 5 to 9 Unit Apartments | 0 (0.0%) | 3 (100.0%) |
| 10 or more Apartments | 10 (20.4%) | 39 (79.6%) |
| Mobile Home / Other | 6 (33.3%) | 12 (66.7%) |
| Total | 189 (71.9%) | 74 (28.1%) |
Housing Structures by Number of Rooms in Cook
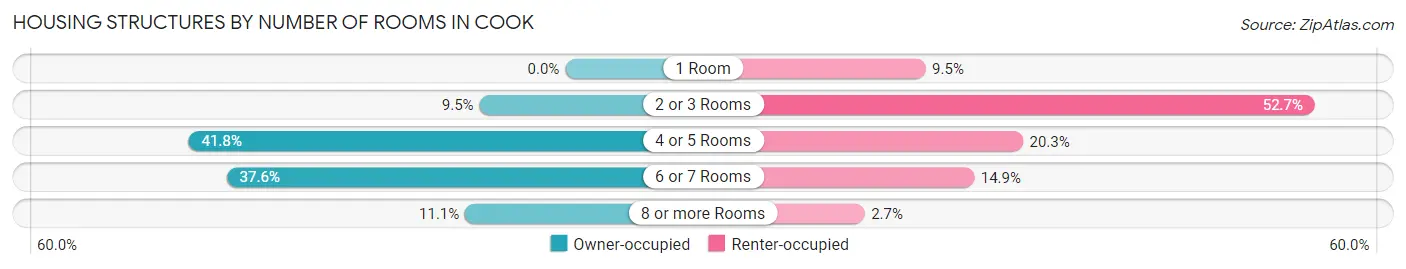
| Number of Rooms | Owner-occupied | Renter-occupied |
| 1 Room | 0 (0.0%) | 7 (9.5%) |
| 2 or 3 Rooms | 18 (9.5%) | 39 (52.7%) |
| 4 or 5 Rooms | 79 (41.8%) | 15 (20.3%) |
| 6 or 7 Rooms | 71 (37.6%) | 11 (14.9%) |
| 8 or more Rooms | 21 (11.1%) | 2 (2.7%) |
| Total | 189 (100.0%) | 74 (100.0%) |
Housing Structure by Heating Type in Cook
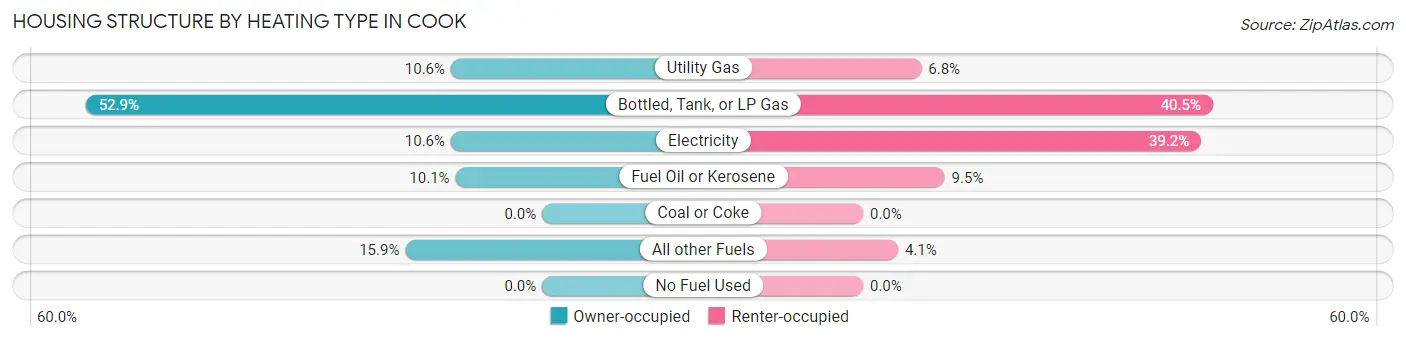
| Heating Type | Owner-occupied | Renter-occupied |
| Utility Gas | 20 (10.6%) | 5 (6.8%) |
| Bottled, Tank, or LP Gas | 100 (52.9%) | 30 (40.5%) |
| Electricity | 20 (10.6%) | 29 (39.2%) |
| Fuel Oil or Kerosene | 19 (10.1%) | 7 (9.5%) |
| Coal or Coke | 0 (0.0%) | 0 (0.0%) |
| All other Fuels | 30 (15.9%) | 3 (4.1%) |
| No Fuel Used | 0 (0.0%) | 0 (0.0%) |
| Total | 189 (100.0%) | 74 (100.0%) |
Household Vehicle Usage in Cook
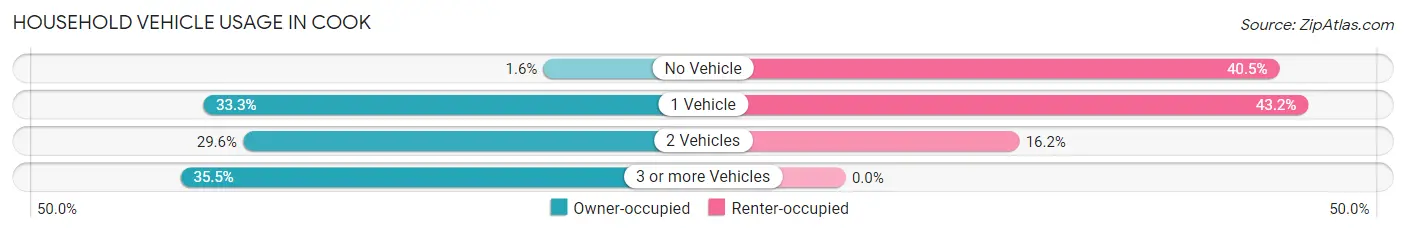
| Vehicles per Household | Owner-occupied | Renter-occupied |
| No Vehicle | 3 (1.6%) | 30 (40.5%) |
| 1 Vehicle | 63 (33.3%) | 32 (43.2%) |
| 2 Vehicles | 56 (29.6%) | 12 (16.2%) |
| 3 or more Vehicles | 67 (35.4%) | 0 (0.0%) |
| Total | 189 (100.0%) | 74 (100.0%) |
Real Estate & Mortgages in Cook
Real Estate and Mortgage Overview in Cook
| Characteristic | Without Mortgage | With Mortgage |
| Housing Units | 95 | 94 |
| Median Property Value | $100,400 | $78,600 |
| Median Household Income | $28,594 | $13 |
| Monthly Housing Costs | $489 | $0 |
| Real Estate Taxes | $735 | $3 |
Property Value by Mortgage Status in Cook
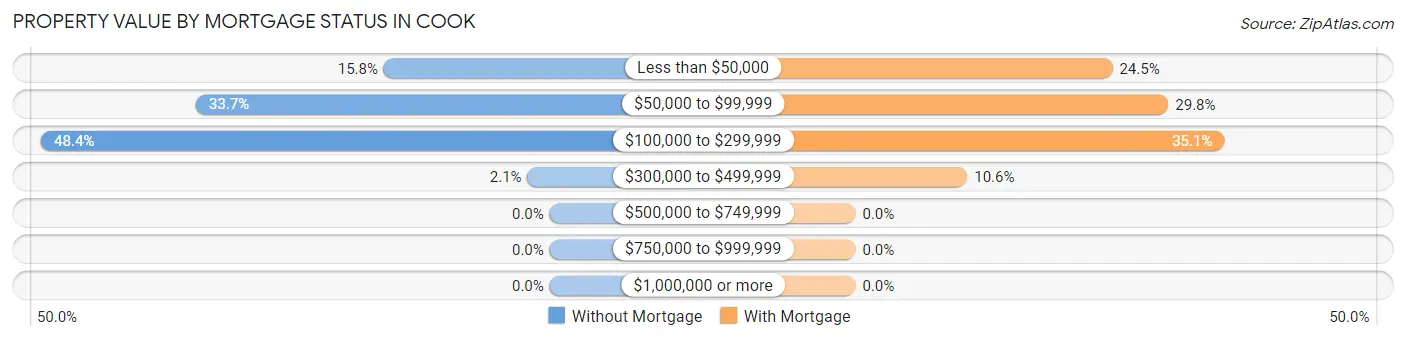
| Property Value | Without Mortgage | With Mortgage |
| Less than $50,000 | 15 (15.8%) | 23 (24.5%) |
| $50,000 to $99,999 | 32 (33.7%) | 28 (29.8%) |
| $100,000 to $299,999 | 46 (48.4%) | 33 (35.1%) |
| $300,000 to $499,999 | 2 (2.1%) | 10 (10.6%) |
| $500,000 to $749,999 | 0 (0.0%) | 0 (0.0%) |
| $750,000 to $999,999 | 0 (0.0%) | 0 (0.0%) |
| $1,000,000 or more | 0 (0.0%) | 0 (0.0%) |
| Total | 95 (100.0%) | 94 (100.0%) |
Household Income by Mortgage Status in Cook
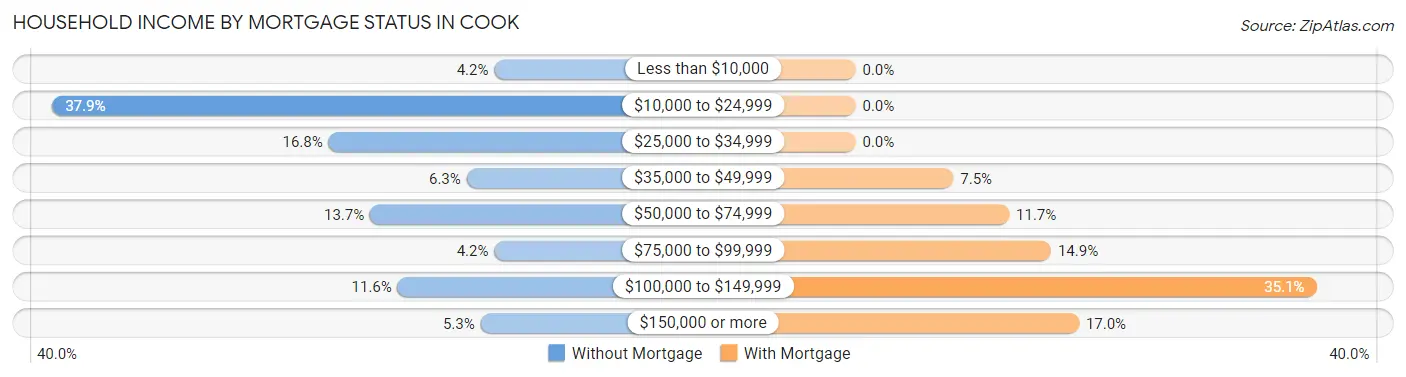
| Household Income | Without Mortgage | With Mortgage |
| Less than $10,000 | 4 (4.2%) | 0 (0.0%) |
| $10,000 to $24,999 | 36 (37.9%) | 0 (0.0%) |
| $25,000 to $34,999 | 16 (16.8%) | 0 (0.0%) |
| $35,000 to $49,999 | 6 (6.3%) | 7 (7.4%) |
| $50,000 to $74,999 | 13 (13.7%) | 11 (11.7%) |
| $75,000 to $99,999 | 4 (4.2%) | 14 (14.9%) |
| $100,000 to $149,999 | 11 (11.6%) | 33 (35.1%) |
| $150,000 or more | 5 (5.3%) | 16 (17.0%) |
| Total | 95 (100.0%) | 94 (100.0%) |
Property Value to Household Income Ratio in Cook
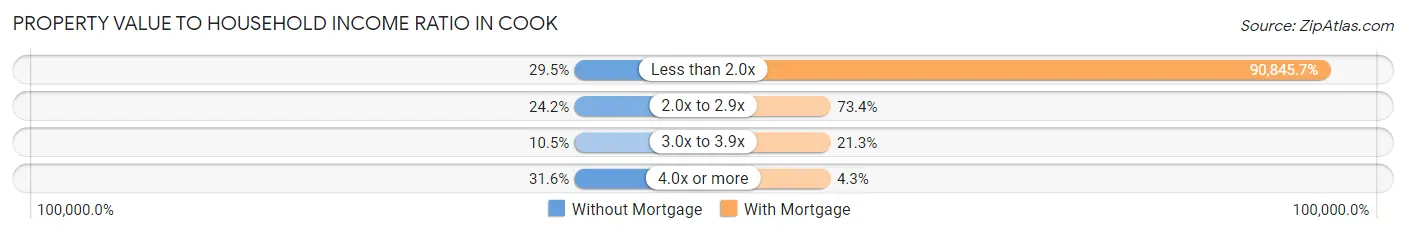
| Value-to-Income Ratio | Without Mortgage | With Mortgage |
| Less than 2.0x | 28 (29.5%) | 85,395 (90,845.7%) |
| 2.0x to 2.9x | 23 (24.2%) | 69 (73.4%) |
| 3.0x to 3.9x | 10 (10.5%) | 20 (21.3%) |
| 4.0x or more | 30 (31.6%) | 4 (4.3%) |
| Total | 95 (100.0%) | 94 (100.0%) |
Real Estate Taxes by Mortgage Status in Cook
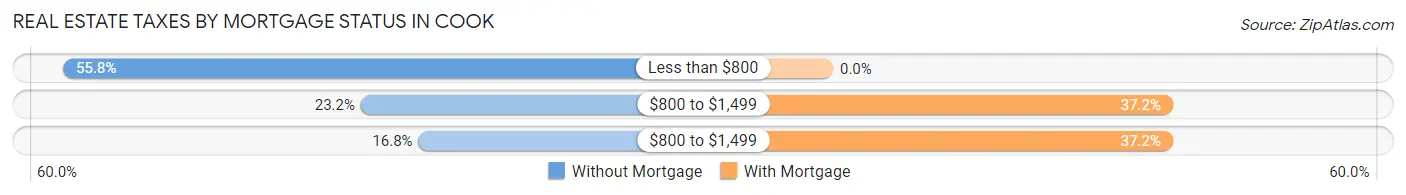
| Property Taxes | Without Mortgage | With Mortgage |
| Less than $800 | 53 (55.8%) | 0 (0.0%) |
| $800 to $1,499 | 22 (23.2%) | 35 (37.2%) |
| $800 to $1,499 | 16 (16.8%) | 35 (37.2%) |
| Total | 95 (100.0%) | 94 (100.0%) |
Health & Disability in Cook
Health Insurance Coverage by Age in Cook
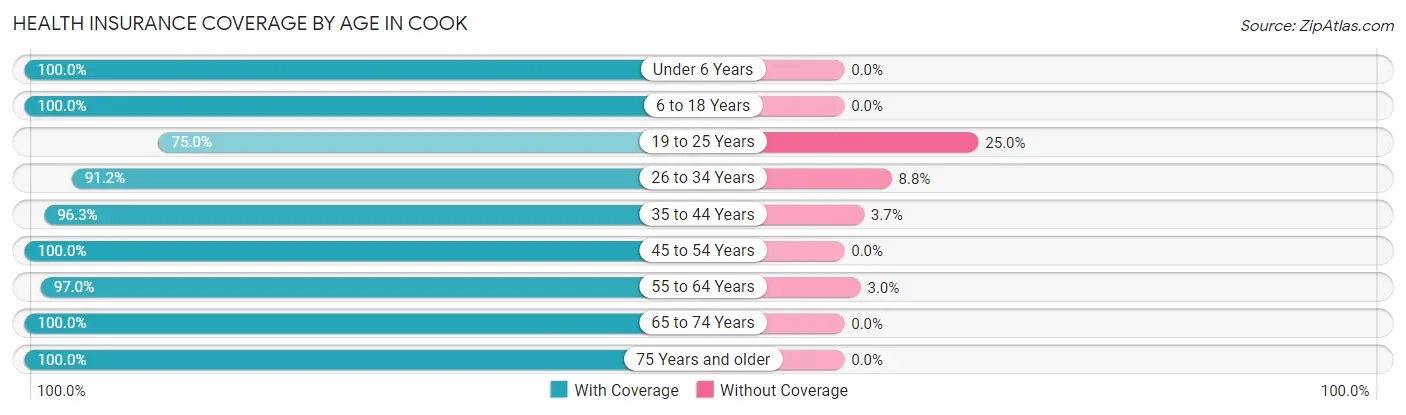
| Age Bracket | With Coverage | Without Coverage |
| Under 6 Years | 17 (100.0%) | 0 (0.0%) |
| 6 to 18 Years | 55 (100.0%) | 0 (0.0%) |
| 19 to 25 Years | 6 (75.0%) | 2 (25.0%) |
| 26 to 34 Years | 31 (91.2%) | 3 (8.8%) |
| 35 to 44 Years | 79 (96.3%) | 3 (3.7%) |
| 45 to 54 Years | 35 (100.0%) | 0 (0.0%) |
| 55 to 64 Years | 64 (97.0%) | 2 (3.0%) |
| 65 to 74 Years | 41 (100.0%) | 0 (0.0%) |
| 75 Years and older | 73 (100.0%) | 0 (0.0%) |
| Total | 401 (97.6%) | 10 (2.4%) |
Health Insurance Coverage by Citizenship Status in Cook
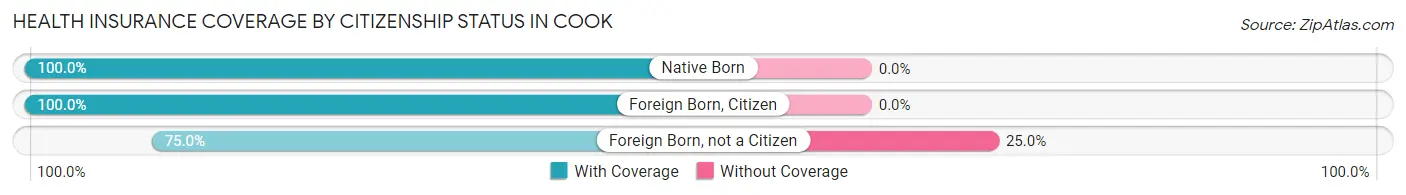
| Citizenship Status | With Coverage | Without Coverage |
| Native Born | 17 (100.0%) | 0 (0.0%) |
| Foreign Born, Citizen | 55 (100.0%) | 0 (0.0%) |
| Foreign Born, not a Citizen | 6 (75.0%) | 2 (25.0%) |
Health Insurance Coverage by Household Income in Cook
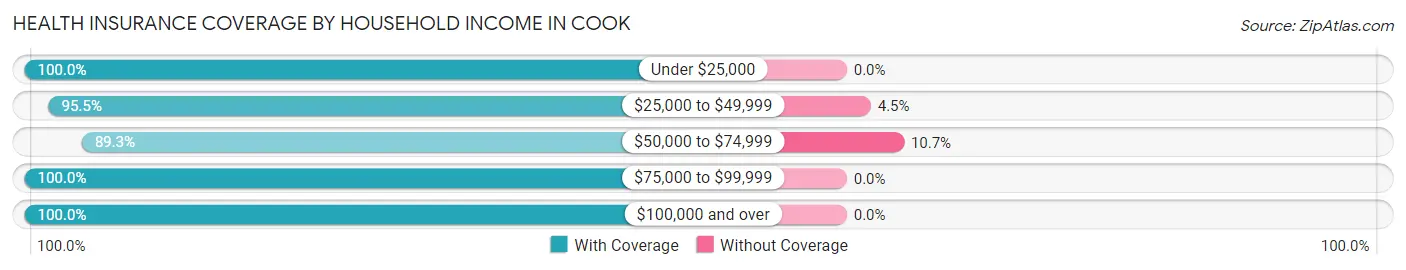
| Household Income | With Coverage | Without Coverage |
| Under $25,000 | 92 (100.0%) | 0 (0.0%) |
| $25,000 to $49,999 | 85 (95.5%) | 4 (4.5%) |
| $50,000 to $74,999 | 50 (89.3%) | 6 (10.7%) |
| $75,000 to $99,999 | 53 (100.0%) | 0 (0.0%) |
| $100,000 and over | 116 (100.0%) | 0 (0.0%) |
Public vs Private Health Insurance Coverage by Age in Cook
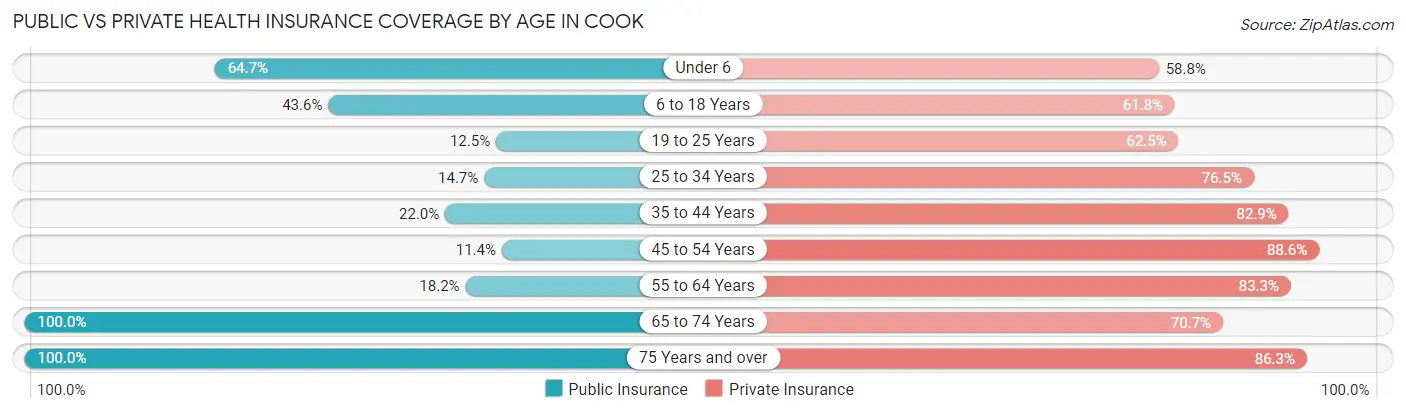
| Age Bracket | Public Insurance | Private Insurance |
| Under 6 | 11 (64.7%) | 10 (58.8%) |
| 6 to 18 Years | 24 (43.6%) | 34 (61.8%) |
| 19 to 25 Years | 1 (12.5%) | 5 (62.5%) |
| 25 to 34 Years | 5 (14.7%) | 26 (76.5%) |
| 35 to 44 Years | 18 (22.0%) | 68 (82.9%) |
| 45 to 54 Years | 4 (11.4%) | 31 (88.6%) |
| 55 to 64 Years | 12 (18.2%) | 55 (83.3%) |
| 65 to 74 Years | 41 (100.0%) | 29 (70.7%) |
| 75 Years and over | 73 (100.0%) | 63 (86.3%) |
| Total | 189 (46.0%) | 321 (78.1%) |
Disability Status by Sex by Age in Cook
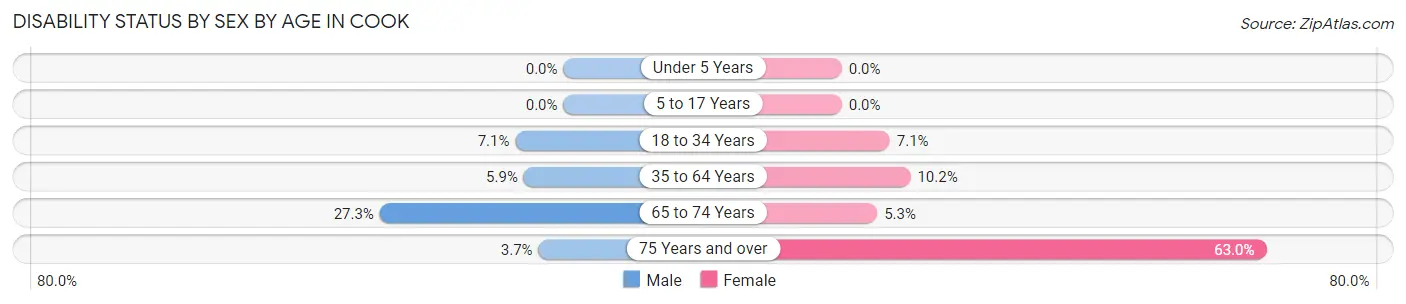
| Age Bracket | Male | Female |
| Under 5 Years | 0 (0.0%) | 0 (0.0%) |
| 5 to 17 Years | 0 (0.0%) | 0 (0.0%) |
| 18 to 34 Years | 1 (7.1%) | 2 (7.1%) |
| 35 to 64 Years | 5 (5.9%) | 10 (10.2%) |
| 65 to 74 Years | 6 (27.3%) | 1 (5.3%) |
| 75 Years and over | 1 (3.7%) | 29 (63.0%) |
Disability Class by Sex by Age in Cook
Disability Class: Hearing Difficulty
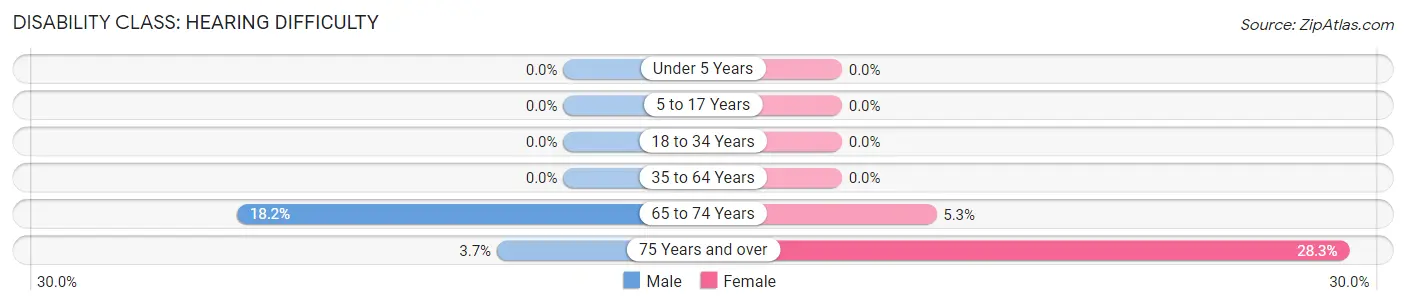
| Age Bracket | Male | Female |
| Under 5 Years | 0 (0.0%) | 0 (0.0%) |
| 5 to 17 Years | 0 (0.0%) | 0 (0.0%) |
| 18 to 34 Years | 0 (0.0%) | 0 (0.0%) |
| 35 to 64 Years | 0 (0.0%) | 0 (0.0%) |
| 65 to 74 Years | 4 (18.2%) | 1 (5.3%) |
| 75 Years and over | 1 (3.7%) | 13 (28.3%) |
Disability Class: Vision Difficulty
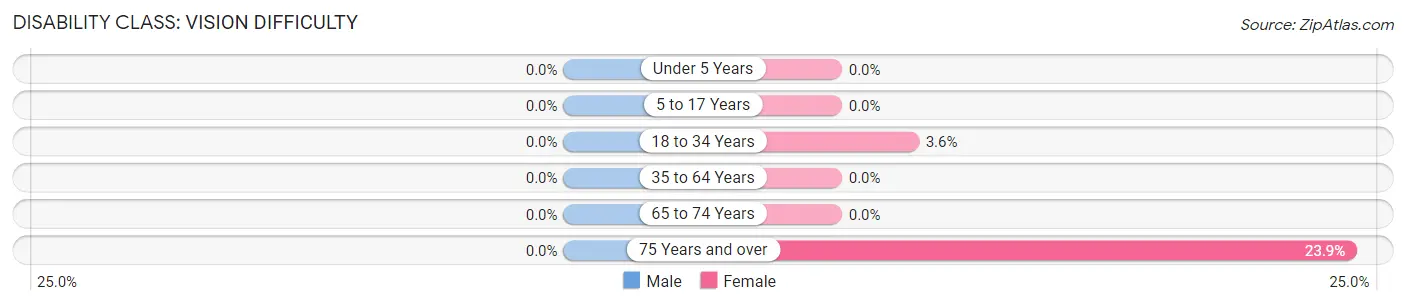
| Age Bracket | Male | Female |
| Under 5 Years | 0 (0.0%) | 0 (0.0%) |
| 5 to 17 Years | 0 (0.0%) | 0 (0.0%) |
| 18 to 34 Years | 0 (0.0%) | 1 (3.6%) |
| 35 to 64 Years | 0 (0.0%) | 0 (0.0%) |
| 65 to 74 Years | 0 (0.0%) | 0 (0.0%) |
| 75 Years and over | 0 (0.0%) | 11 (23.9%) |
Disability Class: Cognitive Difficulty
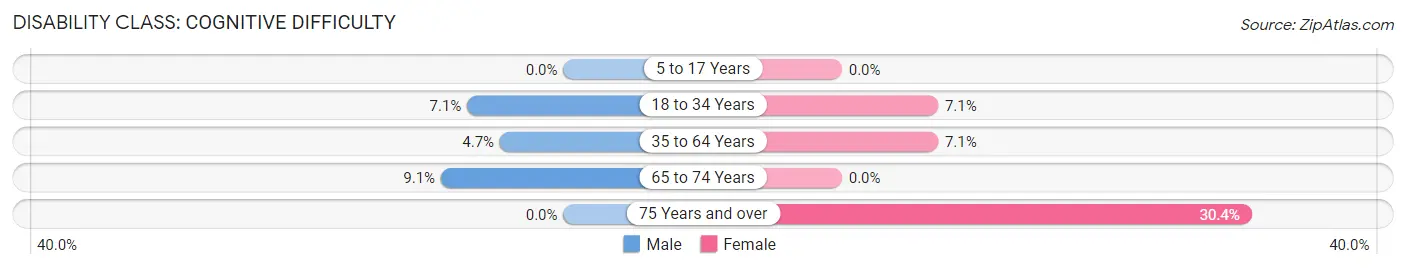
| Age Bracket | Male | Female |
| 5 to 17 Years | 0 (0.0%) | 0 (0.0%) |
| 18 to 34 Years | 1 (7.1%) | 2 (7.1%) |
| 35 to 64 Years | 4 (4.7%) | 7 (7.1%) |
| 65 to 74 Years | 2 (9.1%) | 0 (0.0%) |
| 75 Years and over | 0 (0.0%) | 14 (30.4%) |
Disability Class: Ambulatory Difficulty
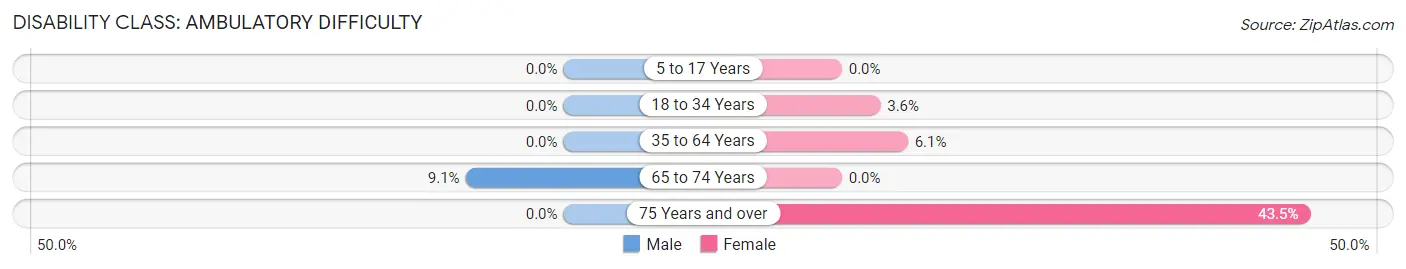
| Age Bracket | Male | Female |
| 5 to 17 Years | 0 (0.0%) | 0 (0.0%) |
| 18 to 34 Years | 0 (0.0%) | 1 (3.6%) |
| 35 to 64 Years | 0 (0.0%) | 6 (6.1%) |
| 65 to 74 Years | 2 (9.1%) | 0 (0.0%) |
| 75 Years and over | 0 (0.0%) | 20 (43.5%) |
Disability Class: Self-Care Difficulty
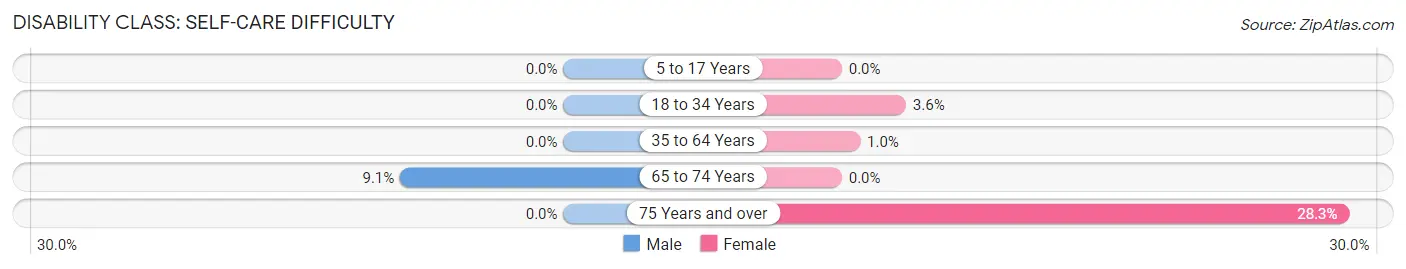
| Age Bracket | Male | Female |
| 5 to 17 Years | 0 (0.0%) | 0 (0.0%) |
| 18 to 34 Years | 0 (0.0%) | 1 (3.6%) |
| 35 to 64 Years | 0 (0.0%) | 1 (1.0%) |
| 65 to 74 Years | 2 (9.1%) | 0 (0.0%) |
| 75 Years and over | 0 (0.0%) | 13 (28.3%) |
Technology Access in Cook
Computing Device Access in Cook
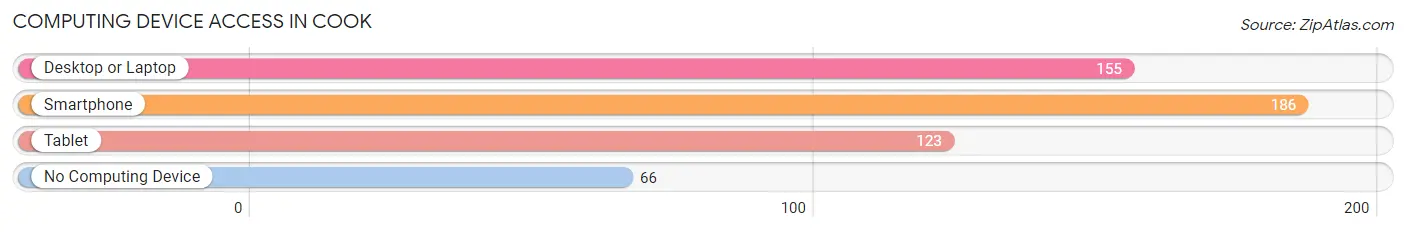
| Device Type | # Households | % Households |
| Desktop or Laptop | 155 | 58.9% |
| Smartphone | 186 | 70.7% |
| Tablet | 123 | 46.8% |
| No Computing Device | 66 | 25.1% |
| Total | 263 | 100.0% |
Internet Access in Cook
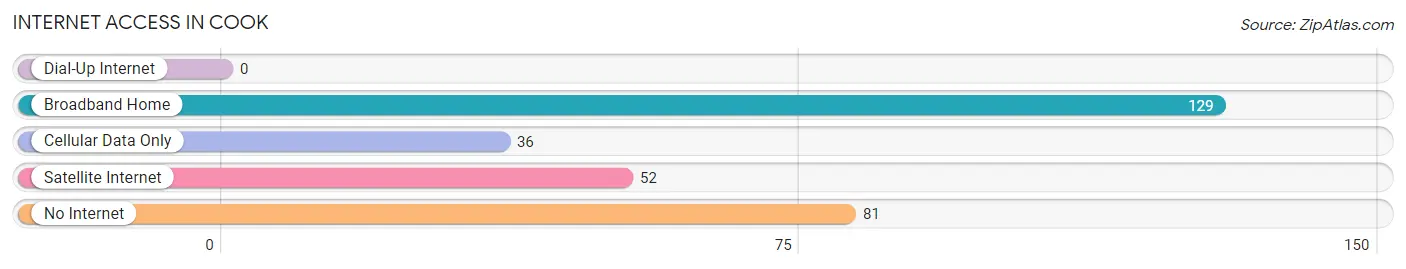
| Internet Type | # Households | % Households |
| Dial-Up Internet | 0 | 0.0% |
| Broadband Home | 129 | 49.0% |
| Cellular Data Only | 36 | 13.7% |
| Satellite Internet | 52 | 19.8% |
| No Internet | 81 | 30.8% |
| Total | 263 | 100.0% |
Cook Summary
Minnesota is a state located in the Midwestern United States. It is bordered by Wisconsin to the east, Iowa to the south, North Dakota and South Dakota to the west, and the Canadian provinces of Ontario and Manitoba to the north. Minnesota was admitted to the Union as the 32nd state on May 11, 1858. The state has a population of 5.6 million people, making it the 21st most populous state in the United States.
History
The area that is now Minnesota was first inhabited by Native American tribes, including the Dakota, Ojibwe, and Sioux. The first Europeans to explore the area were French fur traders, who arrived in the late 17th century. The area was part of the French colony of New France until 1763, when it was ceded to Great Britain after the French and Indian War. The area was then part of the British colony of Canada until the War of 1812, when it was ceded to the United States.
The Minnesota Territory was organized in 1849, and the state was admitted to the Union in 1858. During the American Civil War, Minnesota was a Union state and provided thousands of soldiers to the Union Army. After the war, Minnesota experienced rapid growth and development, becoming an important center of industry and agriculture.
Geography
Minnesota is located in the Midwestern United States, bordered by Wisconsin to the east, Iowa to the south, North Dakota and South Dakota to the west, and the Canadian provinces of Ontario and Manitoba to the north. The state has a total area of 86,943 square miles, making it the 12th largest state in the United States.
The state is divided into 87 counties and contains 87 state parks. Minnesota is home to the Boundary Waters Canoe Area Wilderness, the largest wilderness area east of the Mississippi River. The state also contains the Mississippi National River and Recreation Area, a 72-mile stretch of the Mississippi River that is managed by the National Park Service.
Economy
Minnesota has a diversified economy, with major industries including agriculture, manufacturing, finance, and technology. The state is a major producer of corn, soybeans, and hogs, and is also a major producer of dairy products.
Manufacturing is a major part of the state’s economy, with major industries including food processing, machinery, and medical technology. Minnesota is also a major center of finance, with major companies such as U.S. Bank, Wells Fargo, and Target Corporation headquartered in the state.
Demographics
As of 2019, the population of Minnesota was estimated to be 5.6 million people. The state has a population density of 67.3 people per square mile, making it the 21st most populous state in the United States.
The racial makeup of Minnesota is 84.2% White, 8.2% Black or African American, 4.3% Asian, and 2.7% from two or more races. The state also has a large Native American population, with 4.2% of the population identifying as Native American.
The median household income in Minnesota is $68,388, and the median home value is $223,400. The state has a poverty rate of 9.7%, and the unemployment rate is 3.2%.
Common Questions
What is Per Capita Income in Cook?
Per Capita income in Cook is $36,777.
What is the Median Family Income in Cook?
Median Family Income in Cook is $80,341.
What is the Median Household income in Cook?
Median Household Income in Cook is $43,750.
What is Income or Wage Gap in Cook?
Income or Wage Gap in Cook is 56.6%.
Women in Cook earn 43.4 cents for every dollar earned by a man.
What is Inequality or Gini Index in Cook?
Inequality or Gini Index in Cook is 0.46.
What is the Total Population of Cook?
Total Population of Cook is 459.
What is the Total Male Population of Cook?
Total Male Population of Cook is 196.
What is the Total Female Population of Cook?
Total Female Population of Cook is 263.
What is the Ratio of Males per 100 Females in Cook?
There are 74.52 Males per 100 Females in Cook.
What is the Ratio of Females per 100 Males in Cook?
There are 134.18 Females per 100 Males in Cook.
What is the Median Population Age in Cook?
Median Population Age in Cook is 53.8 Years.
What is the Average Family Size in Cook
Average Family Size in Cook is 2.5 People.
What is the Average Household Size in Cook
Average Household Size in Cook is 1.5 People.
How Large is the Labor Force in Cook?
There are 196 People in the Labor Forcein in Cook.
What is the Percentage of People in the Labor Force in Cook?
49.5% of People are in the Labor Force in Cook.
What is the Unemployment Rate in Cook?
Unemployment Rate in Cook is 6.6%.