Melstone, MT Map & Demographics
Melstone Map
Melstone Overview
$30,075
PER CAPITA INCOME
0.44
INEQUALITY / GINI INDEX
68
TOTAL POPULATION
42
MALE POPULATION
26
FEMALE POPULATION
161.54
MALES / 100 FEMALES
61.90
FEMALES / 100 MALES
42.7
MEDIAN AGE
2.6
AVG FAMILY SIZE
2.1
AVG HOUSEHOLD SIZE
41
LABOR FORCE [ PEOPLE ]
89.1%
PERCENT IN LABOR FORCE
Melstone Zip Codes
Melstone Area Codes
Income in Melstone
Income Overview in Melstone
| Characteristic | Number | Measure |
| Per Capita Income | 68 | $30,075 |
| Median Family Income | 22 | $0 |
| Mean Family Income | 22 | $83,695 |
| Median Household Income | 32 | $0 |
| Mean Household Income | 32 | $66,756 |
| Income Deficit | 22 | $0 |
| Wage / Income Gap (%) | 68 | 0.00% |
| Wage / Income Gap ($) | 68 | 100.00¢ per $1 |
| Gini / Inequality Index | 68 | 0.44 |
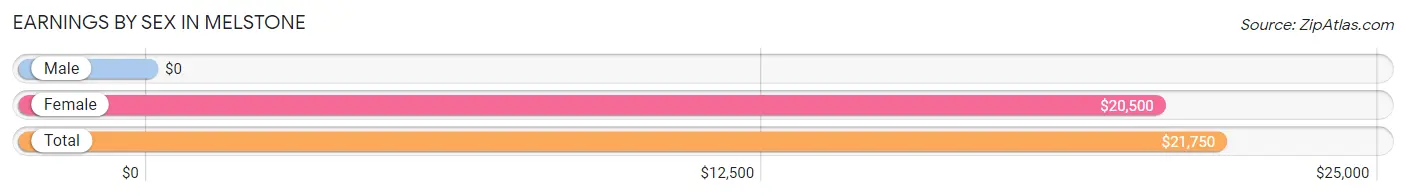
Earnings by Sex in Melstone
| Sex | Number | Average Earnings |
| Male | 15 (36.6%) | $0 |
| Female | 26 (63.4%) | $20,500 |
| Total | 41 (100.0%) | $21,750 |
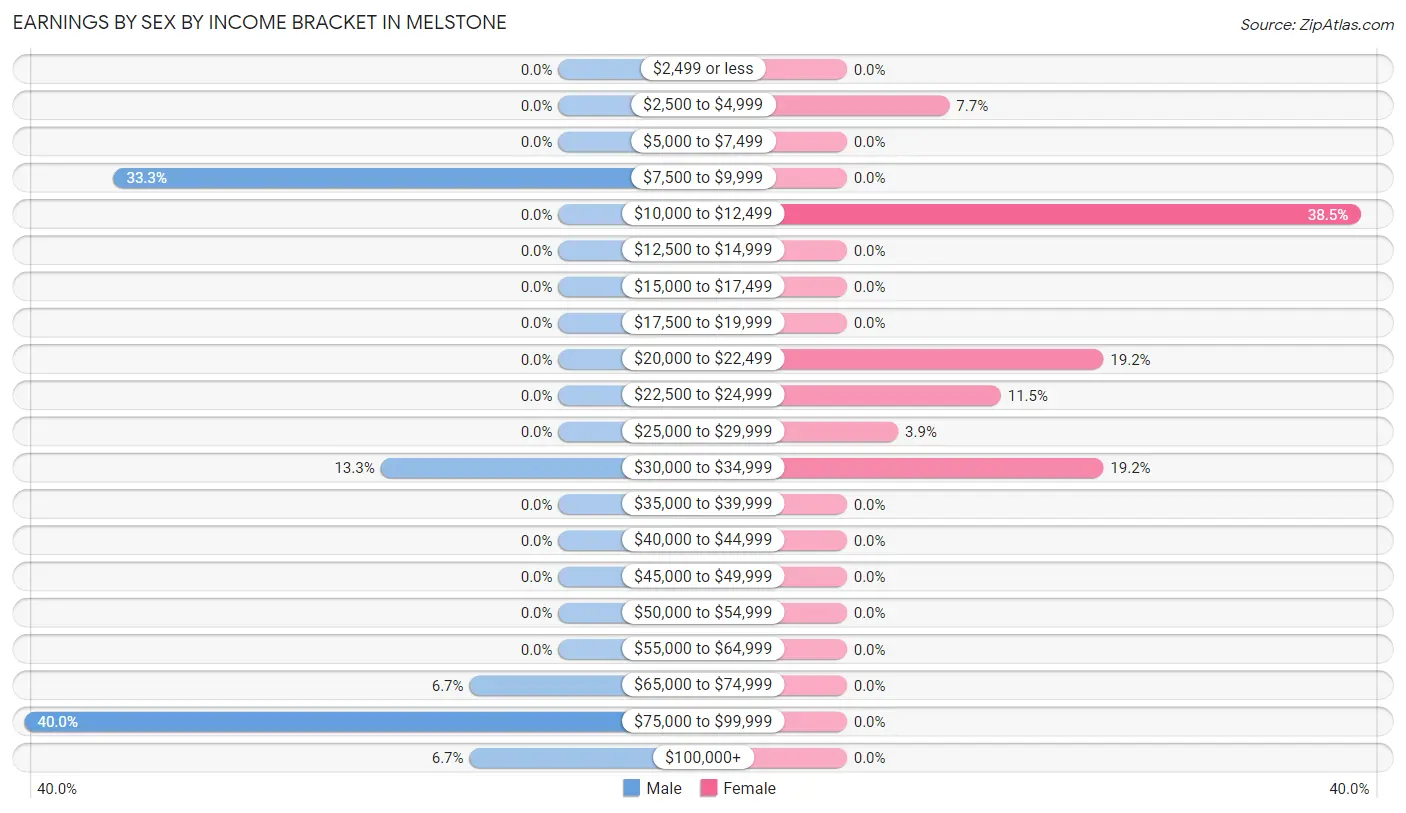
Earnings by Sex by Income Bracket in Melstone
The most common earnings brackets in Melstone are $75,000 to $99,999 for men (6 | 40.0%) and $10,000 to $12,499 for women (10 | 38.5%).
| Income | Male | Female |
| $2,499 or less | 0 (0.0%) | 0 (0.0%) |
| $2,500 to $4,999 | 0 (0.0%) | 2 (7.7%) |
| $5,000 to $7,499 | 0 (0.0%) | 0 (0.0%) |
| $7,500 to $9,999 | 5 (33.3%) | 0 (0.0%) |
| $10,000 to $12,499 | 0 (0.0%) | 10 (38.5%) |
| $12,500 to $14,999 | 0 (0.0%) | 0 (0.0%) |
| $15,000 to $17,499 | 0 (0.0%) | 0 (0.0%) |
| $17,500 to $19,999 | 0 (0.0%) | 0 (0.0%) |
| $20,000 to $22,499 | 0 (0.0%) | 5 (19.2%) |
| $22,500 to $24,999 | 0 (0.0%) | 3 (11.5%) |
| $25,000 to $29,999 | 0 (0.0%) | 1 (3.8%) |
| $30,000 to $34,999 | 2 (13.3%) | 5 (19.2%) |
| $35,000 to $39,999 | 0 (0.0%) | 0 (0.0%) |
| $40,000 to $44,999 | 0 (0.0%) | 0 (0.0%) |
| $45,000 to $49,999 | 0 (0.0%) | 0 (0.0%) |
| $50,000 to $54,999 | 0 (0.0%) | 0 (0.0%) |
| $55,000 to $64,999 | 0 (0.0%) | 0 (0.0%) |
| $65,000 to $74,999 | 1 (6.7%) | 0 (0.0%) |
| $75,000 to $99,999 | 6 (40.0%) | 0 (0.0%) |
| $100,000+ | 1 (6.7%) | 0 (0.0%) |
| Total | 15 (100.0%) | 26 (100.0%) |
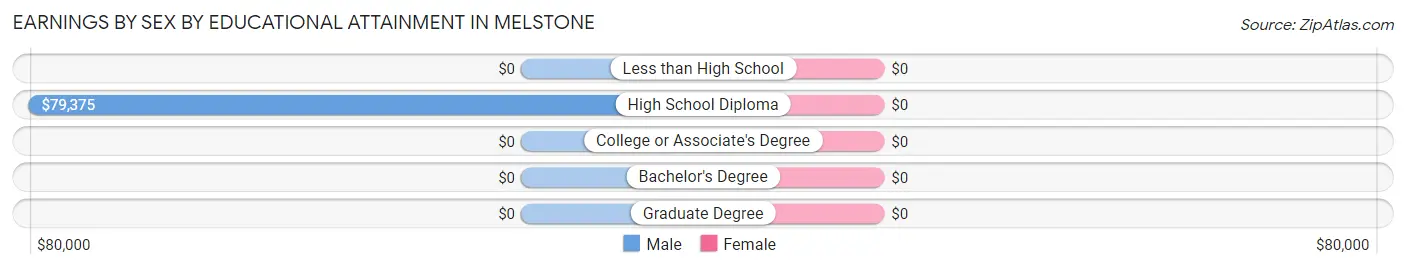
Earnings by Sex by Educational Attainment in Melstone
| Educational Attainment | Male Income | Female Income |
| Less than High School | - | - |
| High School Diploma | $79,375 | $0 |
| College or Associate's Degree | - | - |
| Bachelor's Degree | - | - |
| Graduate Degree | - | - |
| Total | - | - |
Family Income in Melstone
Family Income Brackets in Melstone
According to the Melstone family income data, there are 9 families falling into the $25,000 to $34,999 income range, which is the most common income bracket and makes up 40.9% of all families.
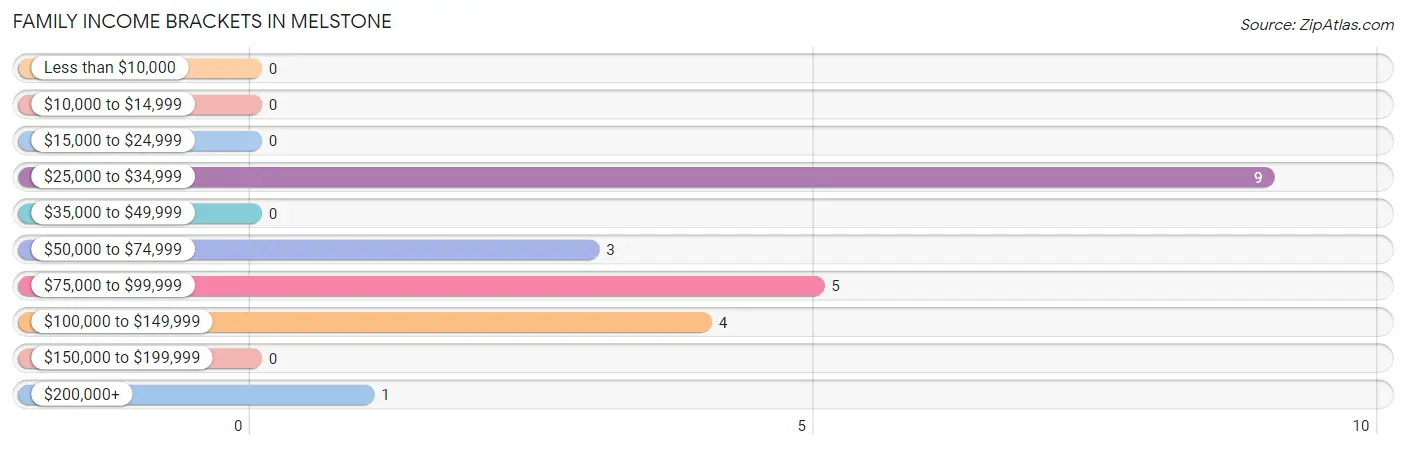
| Income Bracket | # Families | % Families |
| Less than $10,000 | 0 | 0.0% |
| $10,000 to $14,999 | 0 | 0.0% |
| $15,000 to $24,999 | 0 | 0.0% |
| $25,000 to $34,999 | 9 | 40.9% |
| $35,000 to $49,999 | 0 | 0.0% |
| $50,000 to $74,999 | 3 | 13.6% |
| $75,000 to $99,999 | 5 | 22.7% |
| $100,000 to $149,999 | 4 | 18.2% |
| $150,000 to $199,999 | 0 | 0.0% |
| $200,000+ | 1 | 4.5% |
Family Income by Famaliy Size in Melstone
2-person families (7 | 31.8%) account for the highest median family income in Melstone with $122,813 per family, while 2-person families (7 | 31.8%) have the highest median income of $61,406 per family member.
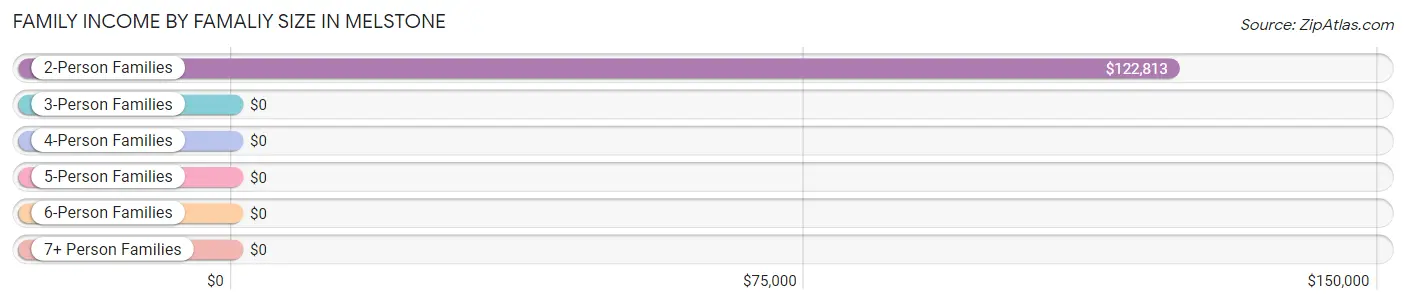
| Income Bracket | # Families | Median Income |
| 2-Person Families | 7 (31.8%) | $122,813 |
| 3-Person Families | 12 (54.5%) | $0 |
| 4-Person Families | 3 (13.6%) | $0 |
| 5-Person Families | 0 (0.0%) | $0 |
| 6-Person Families | 0 (0.0%) | $0 |
| 7+ Person Families | 0 (0.0%) | $0 |
| Total | 22 (100.0%) | $0 |
Family Income by Number of Earners in Melstone
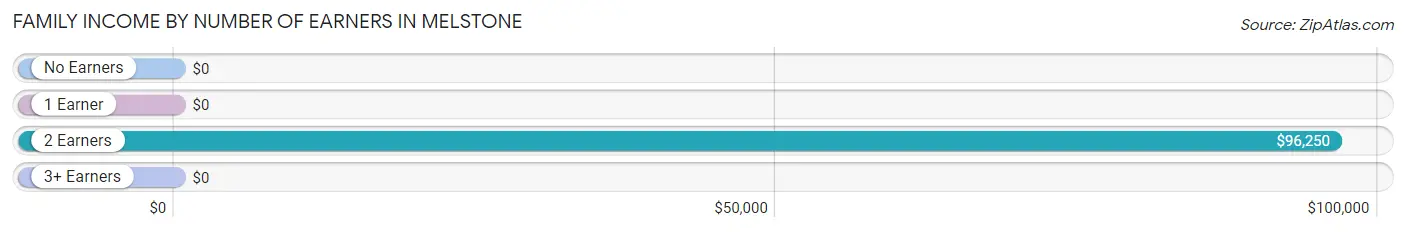
| Number of Earners | # Families | Median Income |
| No Earners | 0 (0.0%) | $0 |
| 1 Earner | 10 (45.5%) | $0 |
| 2 Earners | 11 (50.0%) | $96,250 |
| 3+ Earners | 1 (4.5%) | $0 |
| Total | 22 (100.0%) | $0 |
Household Income in Melstone
Household Income Brackets in Melstone
With 9 households falling in the category, the $25,000 to $34,999 income range is the most frequent in Melstone, accounting for 28.1% of all households.
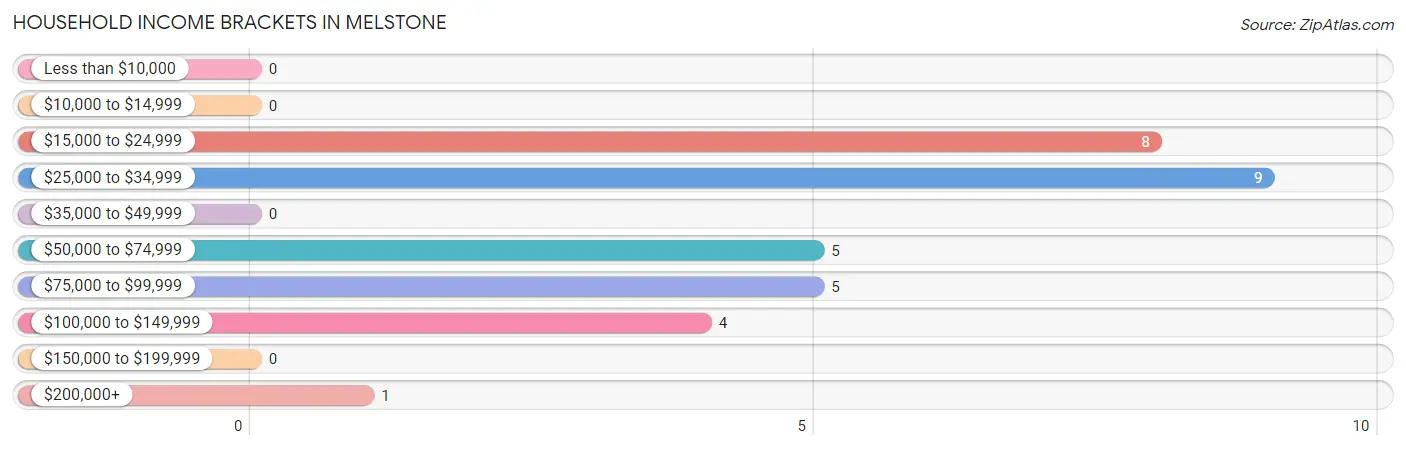
| Income Bracket | # Households | % Households |
| Less than $10,000 | 0 | 0.0% |
| $10,000 to $14,999 | 0 | 0.0% |
| $15,000 to $24,999 | 8 | 25.0% |
| $25,000 to $34,999 | 9 | 28.1% |
| $35,000 to $49,999 | 0 | 0.0% |
| $50,000 to $74,999 | 5 | 15.6% |
| $75,000 to $99,999 | 5 | 15.6% |
| $100,000 to $149,999 | 4 | 12.5% |
| $150,000 to $199,999 | 0 | 0.0% |
| $200,000+ | 1 | 3.1% |
Household Income by Householder Age in Melstone
| Income Bracket | # Households | Median Income |
| 15 to 24 Years | 0 (0.0%) | $0 |
| 25 to 44 Years | 8 (25.0%) | $0 |
| 45 to 64 Years | 22 (68.8%) | $0 |
| 65+ Years | 2 (6.2%) | $0 |
| Total | 32 (100.0%) | $0 |
Poverty in Melstone
Income Below Poverty by Sex and Age in Melstone
| Age Bracket | Male | Female |
| Under 5 Years | 0 (0.0%) | 0 (0.0%) |
| 5 Years | 0 (0.0%) | 0 (0.0%) |
| 6 to 11 Years | 0 (0.0%) | 0 (0.0%) |
| 12 to 14 Years | 0 (0.0%) | 0 (0.0%) |
| 15 Years | 0 (0.0%) | 0 (0.0%) |
| 16 and 17 Years | 0 (0.0%) | 0 (0.0%) |
| 18 to 24 Years | 0 (0.0%) | 0 (0.0%) |
| 25 to 34 Years | 0 (0.0%) | 0 (0.0%) |
| 35 to 44 Years | 0 (0.0%) | 0 (0.0%) |
| 45 to 54 Years | 0 (0.0%) | 0 (0.0%) |
| 55 to 64 Years | 0 (0.0%) | 0 (0.0%) |
| 65 to 74 Years | 0 (0.0%) | 0 (0.0%) |
| 75 Years and over | 0 (0.0%) | 0 (0.0%) |
| Total | 0 (0.0%) | 0 (0.0%) |
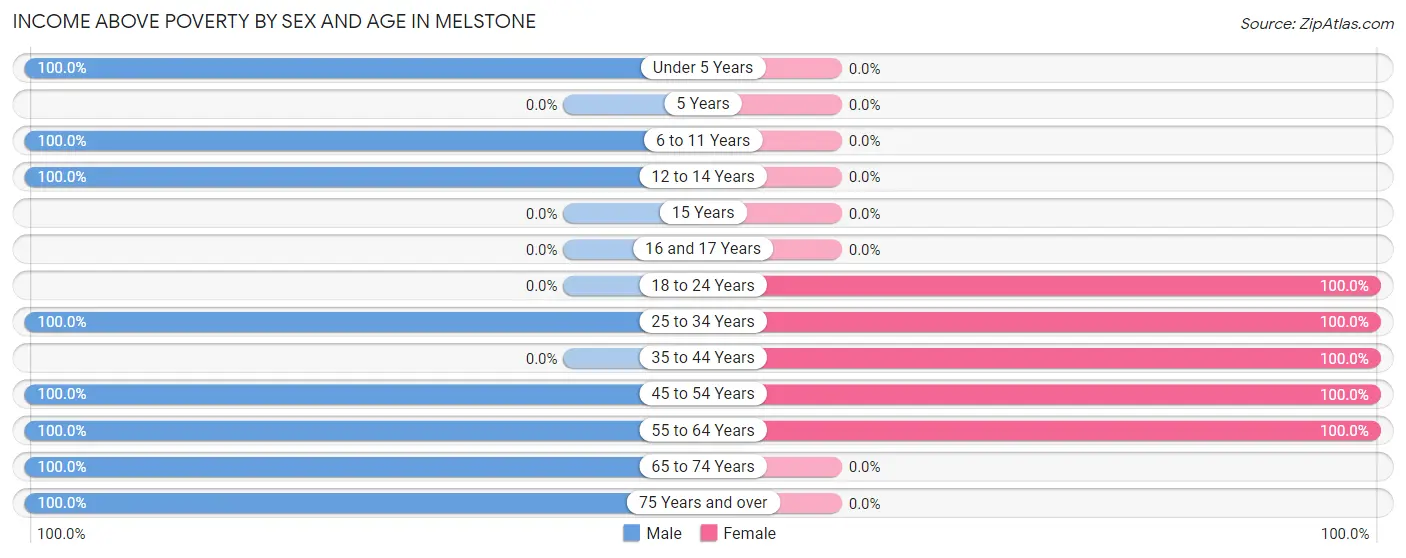
Income Above Poverty by Sex and Age in Melstone
According to the poverty statistics in Melstone, males aged under 5 years and females aged 18 to 24 years are the age groups that are most secure financially, with 100.0% of males and 100.0% of females in these age groups living above the poverty line.
| Age Bracket | Male | Female |
| Under 5 Years | 2 (100.0%) | 0 (0.0%) |
| 5 Years | 0 (0.0%) | 0 (0.0%) |
| 6 to 11 Years | 14 (100.0%) | 0 (0.0%) |
| 12 to 14 Years | 6 (100.0%) | 0 (0.0%) |
| 15 Years | 0 (0.0%) | 0 (0.0%) |
| 16 and 17 Years | 0 (0.0%) | 0 (0.0%) |
| 18 to 24 Years | 0 (0.0%) | 2 (100.0%) |
| 25 to 34 Years | 3 (100.0%) | 3 (100.0%) |
| 35 to 44 Years | 0 (0.0%) | 5 (100.0%) |
| 45 to 54 Years | 3 (100.0%) | 12 (100.0%) |
| 55 to 64 Years | 9 (100.0%) | 4 (100.0%) |
| 65 to 74 Years | 2 (100.0%) | 0 (0.0%) |
| 75 Years and over | 3 (100.0%) | 0 (0.0%) |
| Total | 42 (100.0%) | 26 (100.0%) |
Income Below Poverty Among Married-Couple Families in Melstone
| Children | Above Poverty | Below Poverty |
| No Children | 6 (100.0%) | 0 (0.0%) |
| 1 or 2 Children | 6 (100.0%) | 0 (0.0%) |
| 3 or 4 Children | 0 (0.0%) | 0 (0.0%) |
| 5 or more Children | 0 (0.0%) | 0 (0.0%) |
| Total | 12 (100.0%) | 0 (0.0%) |
Income Below Poverty Among Single-Parent Households in Melstone
| Children | Single Father | Single Mother |
| No Children | 0 (0.0%) | 0 (0.0%) |
| 1 or 2 Children | 0 (0.0%) | 0 (0.0%) |
| 3 or 4 Children | 0 (0.0%) | 0 (0.0%) |
| 5 or more Children | 0 (0.0%) | 0 (0.0%) |
| Total | 0 (0.0%) | 0 (0.0%) |
Income Below Poverty Among Married-Couple vs Single-Parent Households in Melstone
| Children | Married-Couple Families | Single-Parent Households |
| No Children | 0 (0.0%) | 0 (0.0%) |
| 1 or 2 Children | 0 (0.0%) | 0 (0.0%) |
| 3 or 4 Children | 0 (0.0%) | 0 (0.0%) |
| 5 or more Children | 0 (0.0%) | 0 (0.0%) |
| Total | 0 (0.0%) | 0 (0.0%) |
Race in Melstone
The most populous races in Melstone are White / Caucasian (43 | 63.2%), Native / Alaskan (22 | 32.4%), and Hispanic or Latino (3 | 4.4%).
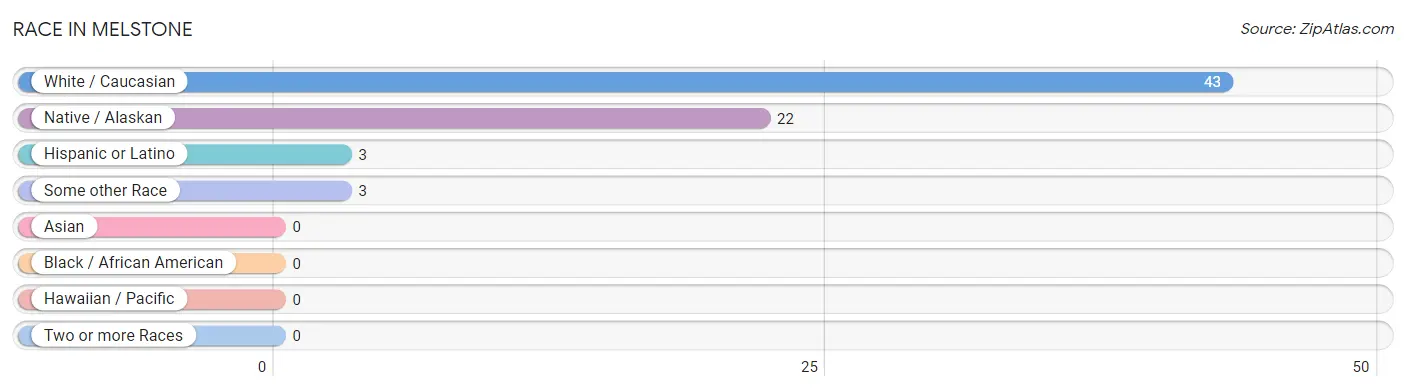
| Race | # Population | % Population |
| Asian | 0 | 0.0% |
| Black / African American | 0 | 0.0% |
| Hawaiian / Pacific | 0 | 0.0% |
| Hispanic or Latino | 3 | 4.4% |
| Native / Alaskan | 22 | 32.4% |
| White / Caucasian | 43 | 63.2% |
| Two or more Races | 0 | 0.0% |
| Some other Race | 3 | 4.4% |
| Total | 68 | 100.0% |
Ancestry in Melstone
The most populous ancestries reported in Melstone are Sioux (22 | 32.4%), German (21 | 30.9%), Irish (9 | 13.2%), English (6 | 8.8%), and Serbian (5 | 7.3%), together accounting for 92.6% of all Melstone residents.
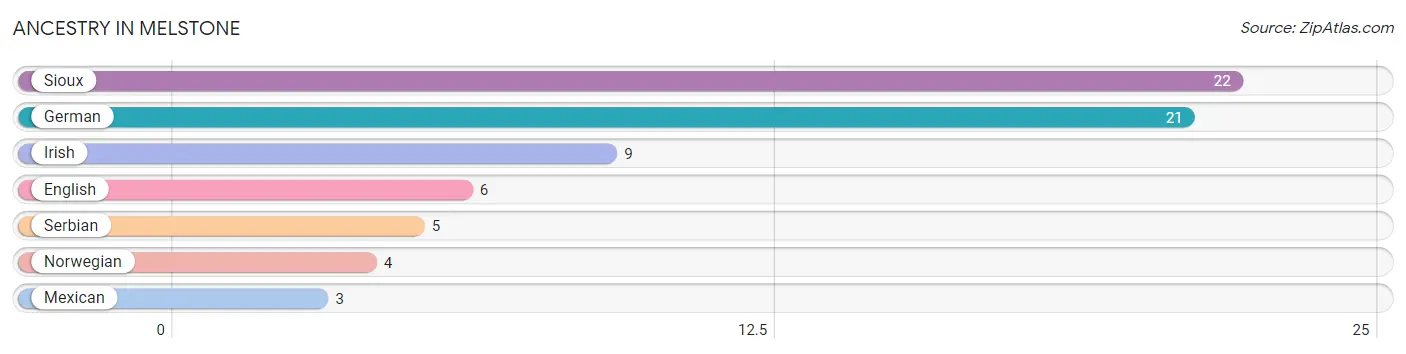
| Ancestry | # Population | % Population |
| English | 6 | 8.8% |
| German | 21 | 30.9% |
| Irish | 9 | 13.2% |
| Mexican | 3 | 4.4% |
| Norwegian | 4 | 5.9% |
| Serbian | 5 | 7.3% |
| Sioux | 22 | 32.4% | View All 7 Rows |
Immigrants in Melstone

| Immigration Origin | # Population | % Population | View All 0 Rows |
Sex and Age in Melstone
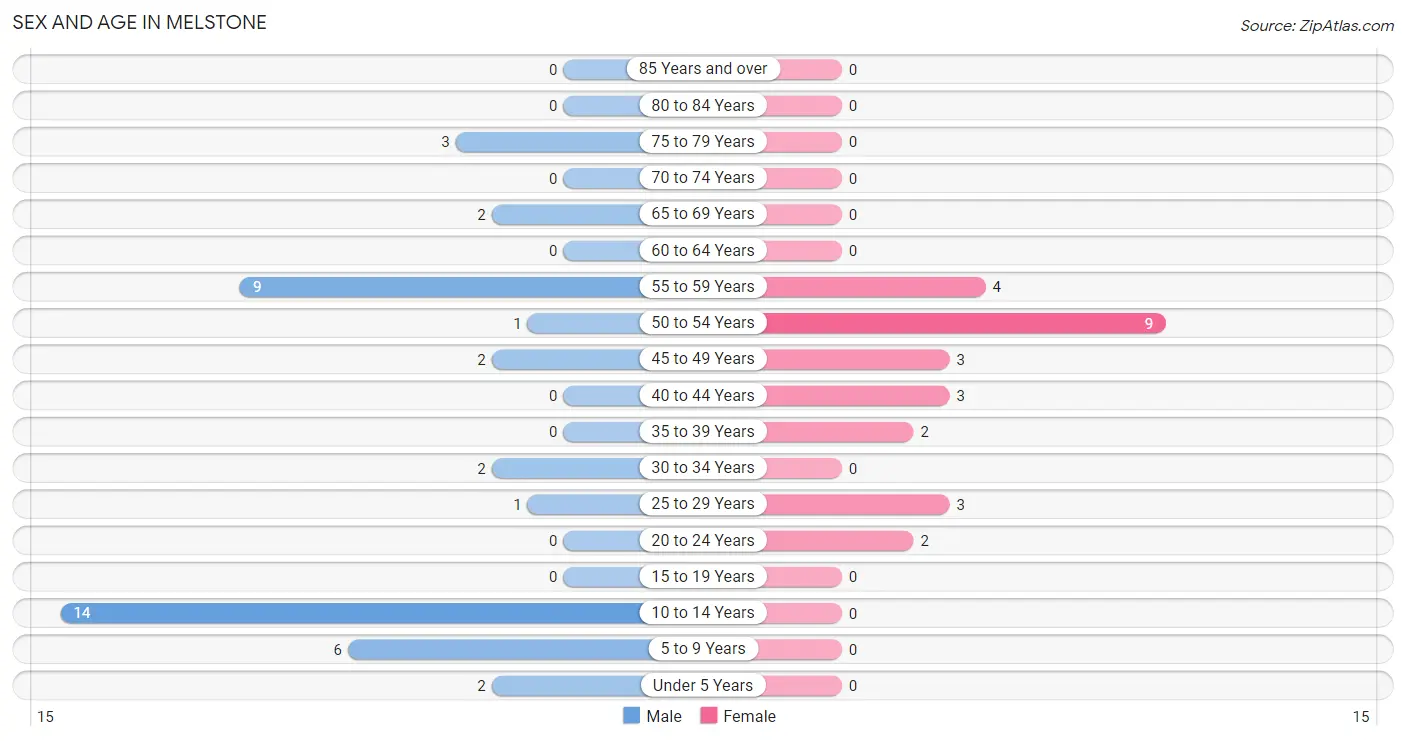
Sex and Age in Melstone
The most populous age groups in Melstone are 10 to 14 Years (14 | 33.3%) for men and 50 to 54 Years (9 | 34.6%) for women.
| Age Bracket | Male | Female |
| Under 5 Years | 2 (4.8%) | 0 (0.0%) |
| 5 to 9 Years | 6 (14.3%) | 0 (0.0%) |
| 10 to 14 Years | 14 (33.3%) | 0 (0.0%) |
| 15 to 19 Years | 0 (0.0%) | 0 (0.0%) |
| 20 to 24 Years | 0 (0.0%) | 2 (7.7%) |
| 25 to 29 Years | 1 (2.4%) | 3 (11.5%) |
| 30 to 34 Years | 2 (4.8%) | 0 (0.0%) |
| 35 to 39 Years | 0 (0.0%) | 2 (7.7%) |
| 40 to 44 Years | 0 (0.0%) | 3 (11.5%) |
| 45 to 49 Years | 2 (4.8%) | 3 (11.5%) |
| 50 to 54 Years | 1 (2.4%) | 9 (34.6%) |
| 55 to 59 Years | 9 (21.4%) | 4 (15.4%) |
| 60 to 64 Years | 0 (0.0%) | 0 (0.0%) |
| 65 to 69 Years | 2 (4.8%) | 0 (0.0%) |
| 70 to 74 Years | 0 (0.0%) | 0 (0.0%) |
| 75 to 79 Years | 3 (7.1%) | 0 (0.0%) |
| 80 to 84 Years | 0 (0.0%) | 0 (0.0%) |
| 85 Years and over | 0 (0.0%) | 0 (0.0%) |
| Total | 42 (100.0%) | 26 (100.0%) |
Families and Households in Melstone
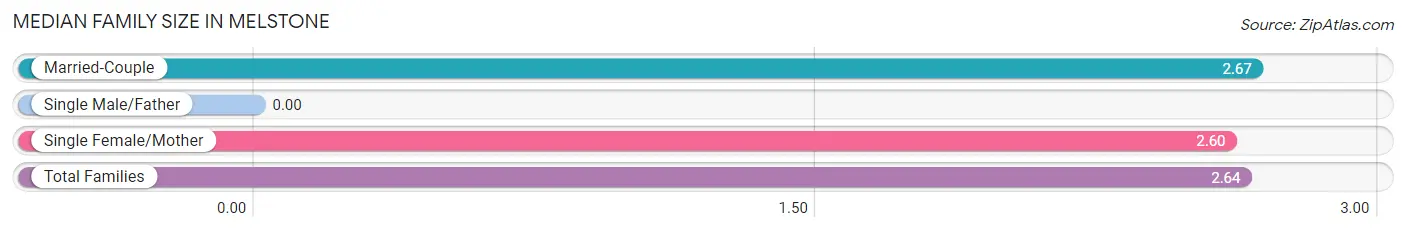
Median Family Size in Melstone
| Family Type | # Families | Family Size |
| Married-Couple | 12 (54.5%) | 2.67 |
| Single Male/Father | 0 (0.0%) | - |
| Single Female/Mother | 10 (45.5%) | 2.60 |
| Total Families | 22 (100.0%) | 2.64 |
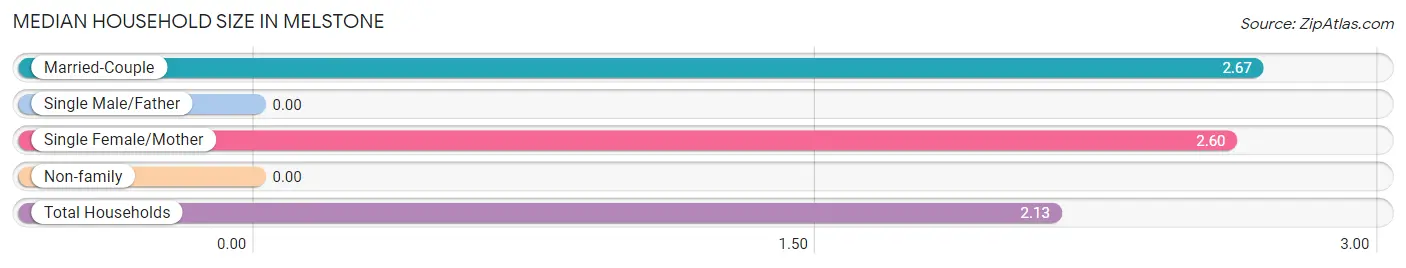
Median Household Size in Melstone
| Household Type | # Households | Household Size |
| Married-Couple | 12 (37.5%) | 2.67 |
| Single Male/Father | 0 (0.0%) | - |
| Single Female/Mother | 10 (31.2%) | 2.60 |
| Non-family | 10 (31.2%) | - |
| Total Households | 32 (100.0%) | 2.13 |
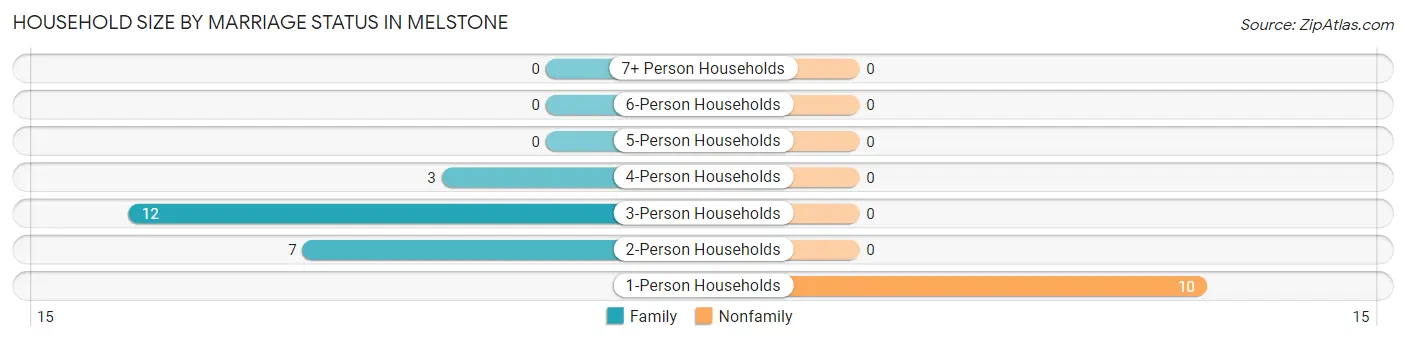
Household Size by Marriage Status in Melstone
Out of a total of 32 households in Melstone, 22 (68.8%) are family households, while 10 (31.2%) are nonfamily households. The most numerous type of family households are 3-person households, comprising 12, and the most common type of nonfamily households are 1-person households, comprising 10.
| Household Size | Family Households | Nonfamily Households |
| 1-Person Households | - | 10 (31.2%) |
| 2-Person Households | 7 (21.9%) | 0 (0.0%) |
| 3-Person Households | 12 (37.5%) | 0 (0.0%) |
| 4-Person Households | 3 (9.4%) | 0 (0.0%) |
| 5-Person Households | 0 (0.0%) | 0 (0.0%) |
| 6-Person Households | 0 (0.0%) | 0 (0.0%) |
| 7+ Person Households | 0 (0.0%) | 0 (0.0%) |
| Total | 22 (68.8%) | 10 (31.2%) |
Female Fertility in Melstone
Fertility by Age in Melstone
Average fertility rate in Melstone is 136.0 births per 1,000 women. Women in the age bracket of 20 to 34 years have the highest fertility rate with 600.0 births per 1,000 women. Women in the age bracket of 20 to 34 years acount for 100.0% of all women with births.
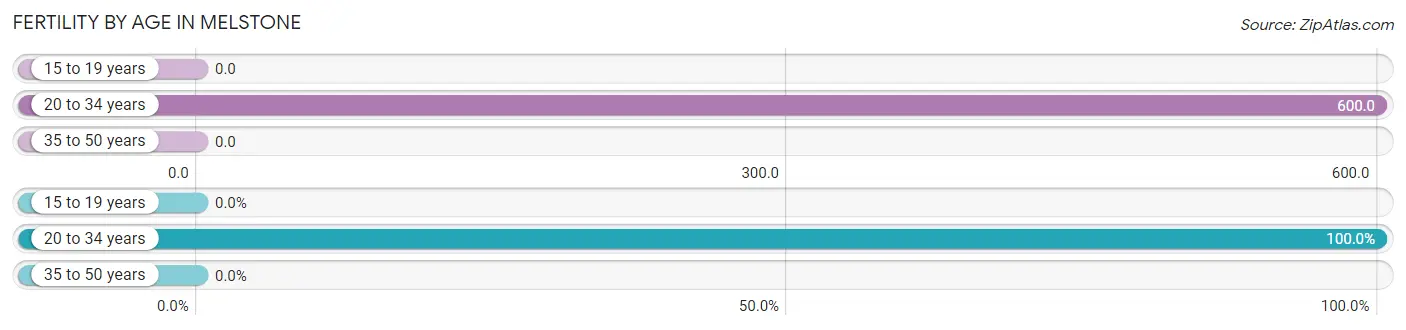
| Age Bracket | Women with Births | Births / 1,000 Women |
| 15 to 19 years | 0 (0.0%) | 0.0 |
| 20 to 34 years | 3 (100.0%) | 600.0 |
| 35 to 50 years | 0 (0.0%) | 0.0 |
| Total | 3 (100.0%) | 136.0 |
Fertility by Age by Marriage Status in Melstone
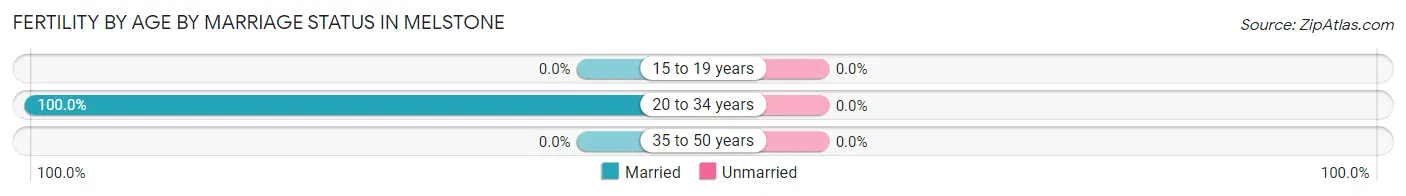
| Age Bracket | Married | Unmarried |
| 15 to 19 years | 0 (0.0%) | 0 (0.0%) |
| 20 to 34 years | 3 (100.0%) | 0 (0.0%) |
| 35 to 50 years | 0 (0.0%) | 0 (0.0%) |
| Total | 3 (100.0%) | 0 (0.0%) |
Fertility by Education in Melstone
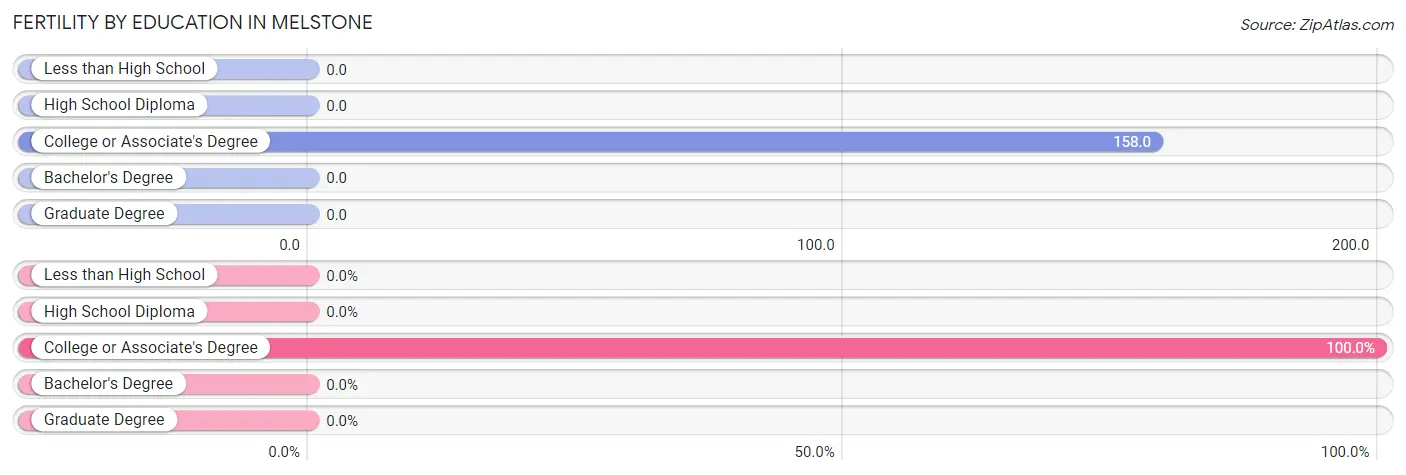
| Educational Attainment | Women with Births | Births / 1,000 Women |
| Less than High School | 0 (0.0%) | 0.0 |
| High School Diploma | 0 (0.0%) | 0.0 |
| College or Associate's Degree | 3 (100.0%) | 158.0 |
| Bachelor's Degree | 0 (0.0%) | 0.0 |
| Graduate Degree | 0 (0.0%) | 0.0 |
| Total | 3 (100.0%) | 136.0 |
Fertility by Education by Marriage Status in Melstone
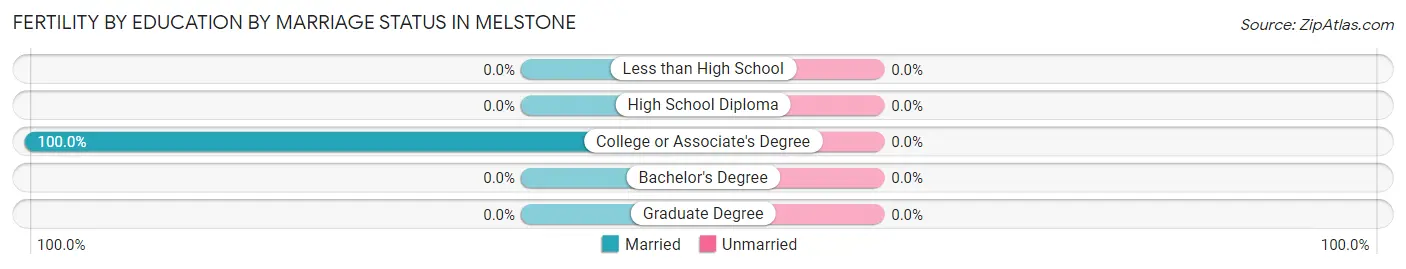
| Educational Attainment | Married | Unmarried |
| Less than High School | 0 (0.0%) | 0 (0.0%) |
| High School Diploma | 0 (0.0%) | 0 (0.0%) |
| College or Associate's Degree | 3 (100.0%) | 0 (0.0%) |
| Bachelor's Degree | 0 (0.0%) | 0 (0.0%) |
| Graduate Degree | 0 (0.0%) | 0 (0.0%) |
| Total | 3 (100.0%) | 0 (0.0%) |
Employment Characteristics in Melstone
Employment by Class of Employer in Melstone
Among the 35 employed individuals in Melstone, private company employees (16 | 45.7%), local government employees (16 | 45.7%), and state government employees (2 | 5.7%) make up the most common classes of employment.
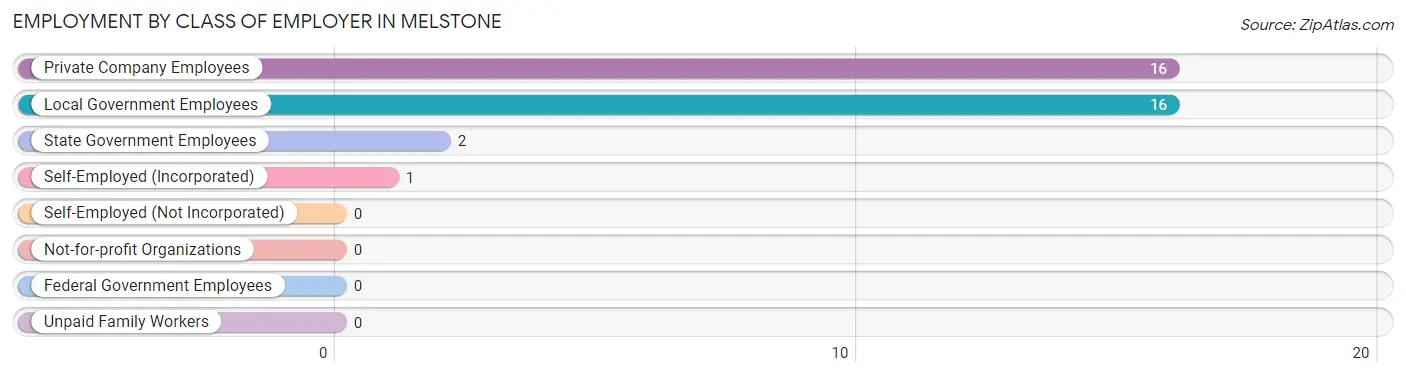
| Employer Class | # Employees | % Employees |
| Private Company Employees | 16 | 45.7% |
| Self-Employed (Incorporated) | 1 | 2.9% |
| Self-Employed (Not Incorporated) | 0 | 0.0% |
| Not-for-profit Organizations | 0 | 0.0% |
| Local Government Employees | 16 | 45.7% |
| State Government Employees | 2 | 5.7% |
| Federal Government Employees | 0 | 0.0% |
| Unpaid Family Workers | 0 | 0.0% |
| Total | 35 | 100.0% |
Employment Status by Age in Melstone
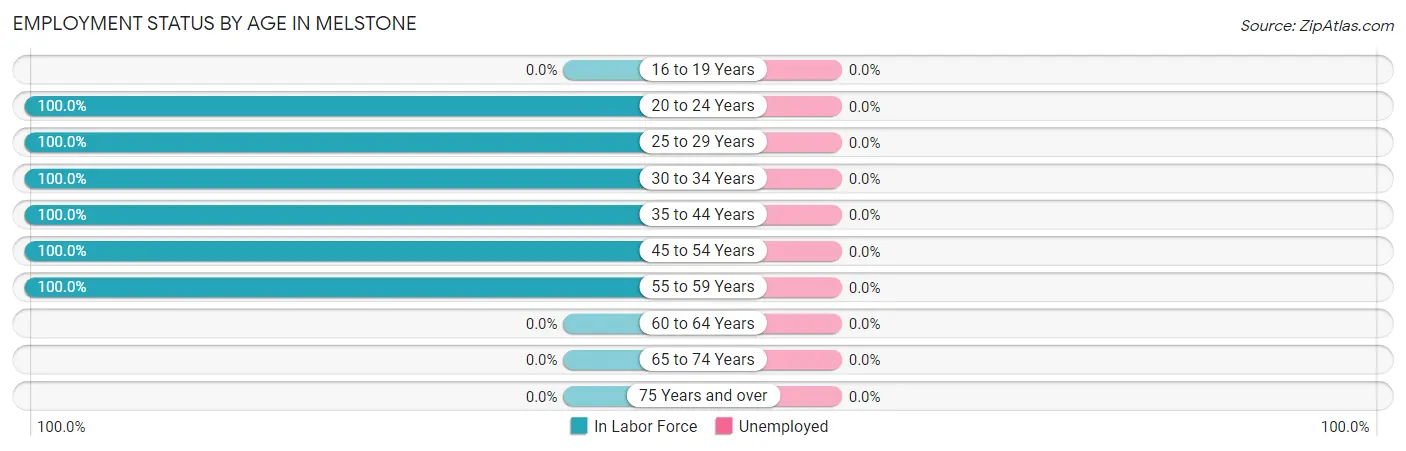
| Age Bracket | In Labor Force | Unemployed |
| 16 to 19 Years | 0 (0.0%) | 0 (0.0%) |
| 20 to 24 Years | 2 (100.0%) | 0 (0.0%) |
| 25 to 29 Years | 4 (100.0%) | 0 (0.0%) |
| 30 to 34 Years | 2 (100.0%) | 0 (0.0%) |
| 35 to 44 Years | 5 (100.0%) | 0 (0.0%) |
| 45 to 54 Years | 15 (100.0%) | 0 (0.0%) |
| 55 to 59 Years | 13 (100.0%) | 0 (0.0%) |
| 60 to 64 Years | 0 (0.0%) | 0 (0.0%) |
| 65 to 74 Years | 0 (0.0%) | 0 (0.0%) |
| 75 Years and over | 0 (0.0%) | 0 (0.0%) |
| Total | 41 (89.1%) | 0 (0.0%) |
Employment Status by Educational Attainment in Melstone
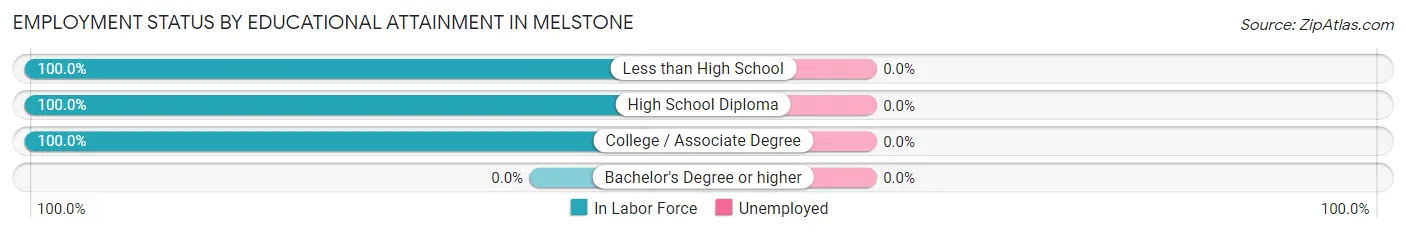
| Educational Attainment | In Labor Force | Unemployed |
| Less than High School | 3 (100.0%) | 0 (0.0%) |
| High School Diploma | 13 (100.0%) | 0 (0.0%) |
| College / Associate Degree | 23 (100.0%) | 0 (0.0%) |
| Bachelor's Degree or higher | 0 (0.0%) | 0 (0.0%) |
| Total | 39 (100.0%) | 0 (0.0%) |
Employment Occupations by Sex in Melstone
Management, Business, Science and Arts Occupations
The most common Management, Business, Science and Arts occupations in Melstone are Community & Social Service (9 | 22.0%), Education Instruction & Library (9 | 22.0%), Management (4 | 9.8%), Health Diagnosing & Treating (4 | 9.8%), and Health Technologists (4 | 9.8%).
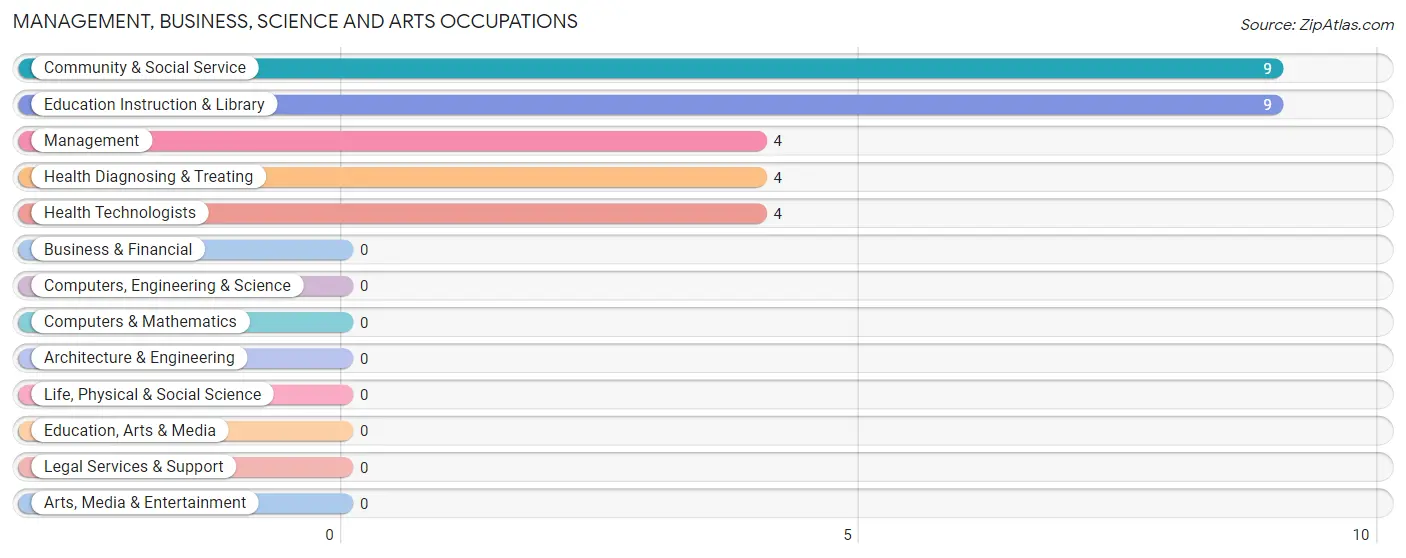
Management, Business, Science and Arts Occupations by Sex
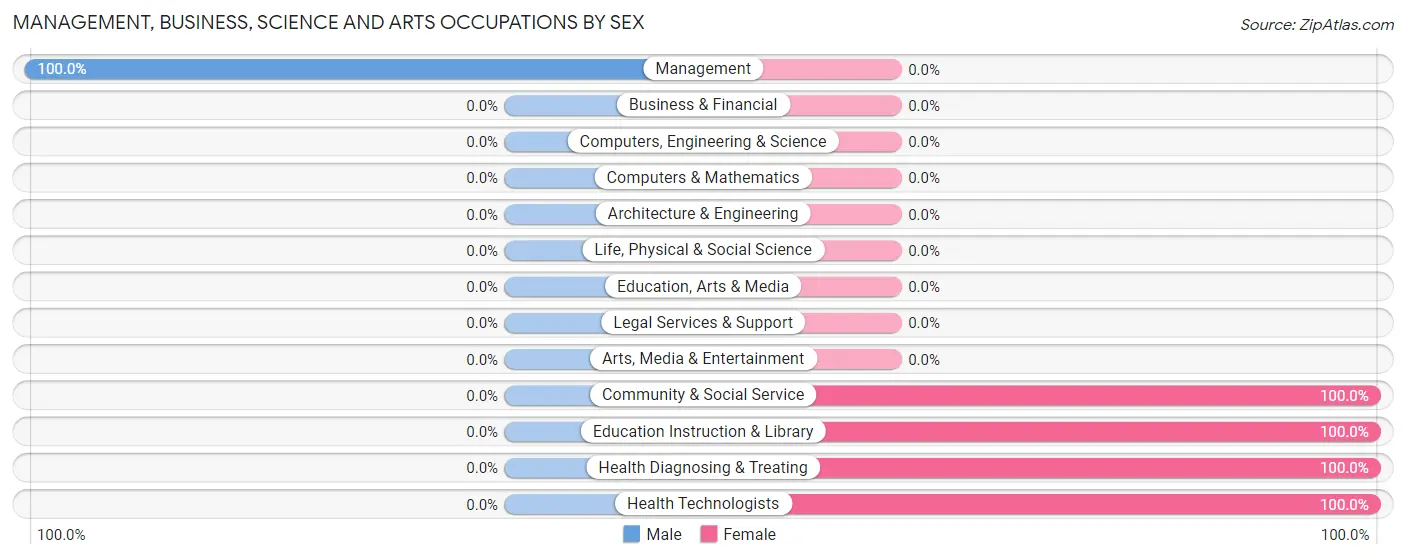
| Occupation | Male | Female |
| Management | 4 (100.0%) | 0 (0.0%) |
| Business & Financial | 0 (0.0%) | 0 (0.0%) |
| Computers, Engineering & Science | 0 (0.0%) | 0 (0.0%) |
| Computers & Mathematics | 0 (0.0%) | 0 (0.0%) |
| Architecture & Engineering | 0 (0.0%) | 0 (0.0%) |
| Life, Physical & Social Science | 0 (0.0%) | 0 (0.0%) |
| Community & Social Service | 0 (0.0%) | 9 (100.0%) |
| Education, Arts & Media | 0 (0.0%) | 0 (0.0%) |
| Legal Services & Support | 0 (0.0%) | 0 (0.0%) |
| Education Instruction & Library | 0 (0.0%) | 9 (100.0%) |
| Arts, Media & Entertainment | 0 (0.0%) | 0 (0.0%) |
| Health Diagnosing & Treating | 0 (0.0%) | 4 (100.0%) |
| Health Technologists | 0 (0.0%) | 4 (100.0%) |
| Total (Category) | 4 (23.5%) | 13 (76.5%) |
| Total (Overall) | 15 (36.6%) | 26 (63.4%) |
Services Occupations
The most common Services occupations in Melstone are Food Preparation & Serving (1 | 2.4%), and Cleaning & Maintenance (1 | 2.4%).
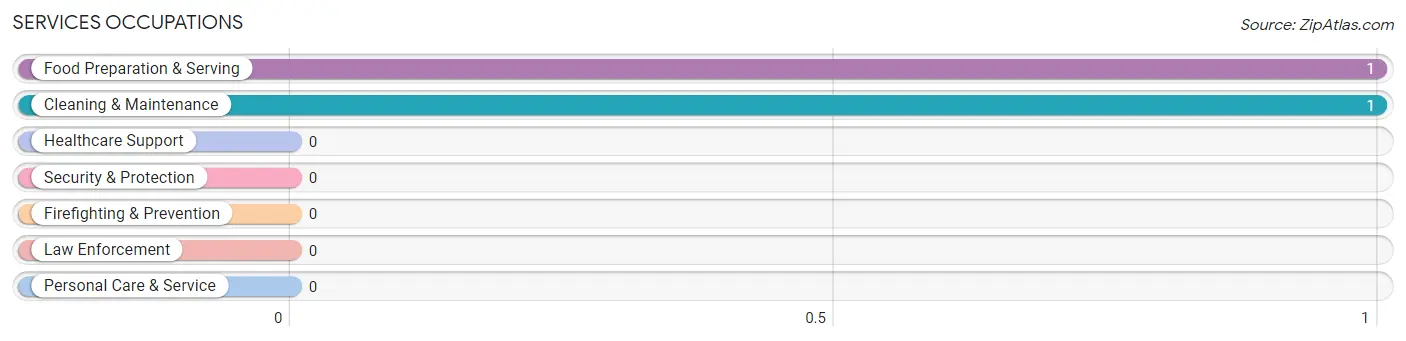
Services Occupations by Sex
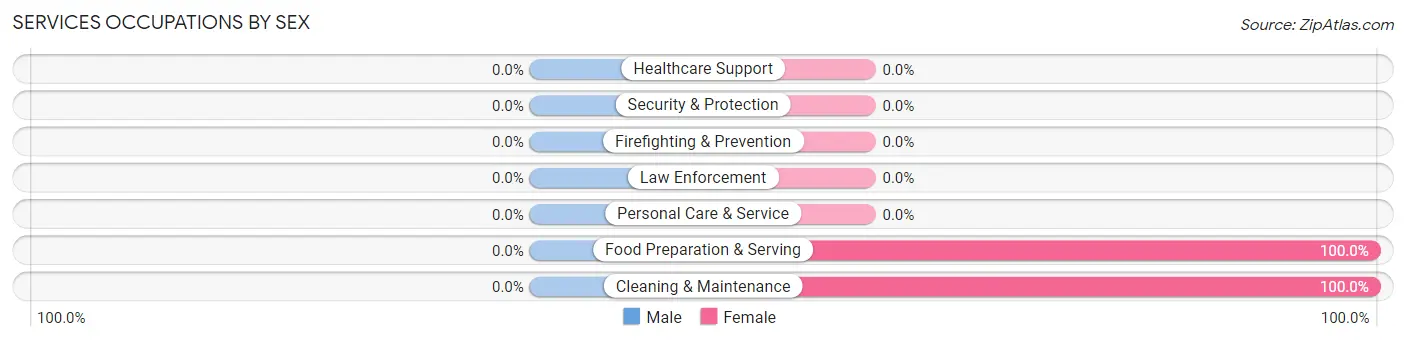
| Occupation | Male | Female |
| Healthcare Support | 0 (0.0%) | 0 (0.0%) |
| Security & Protection | 0 (0.0%) | 0 (0.0%) |
| Firefighting & Prevention | 0 (0.0%) | 0 (0.0%) |
| Law Enforcement | 0 (0.0%) | 0 (0.0%) |
| Food Preparation & Serving | 0 (0.0%) | 1 (100.0%) |
| Cleaning & Maintenance | 0 (0.0%) | 1 (100.0%) |
| Personal Care & Service | 0 (0.0%) | 0 (0.0%) |
| Total (Category) | 0 (0.0%) | 2 (100.0%) |
| Total (Overall) | 15 (36.6%) | 26 (63.4%) |
Sales and Office Occupations
The most common Sales and Office occupations in Melstone are Office & Administration (6 | 14.6%), and Sales & Related (2 | 4.9%).
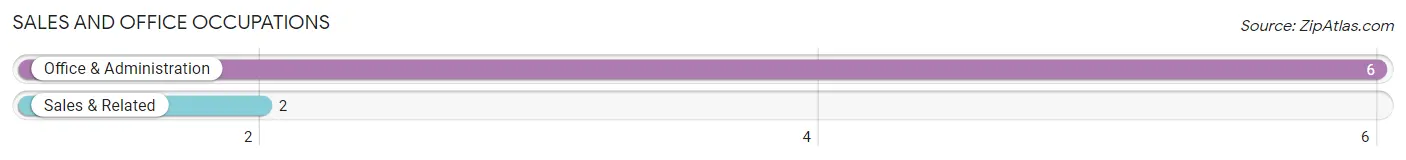
Sales and Office Occupations by Sex
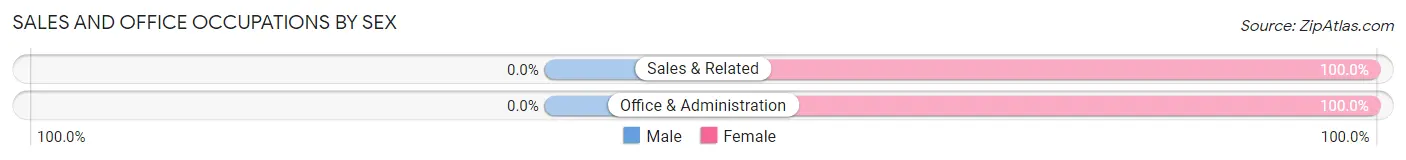
| Occupation | Male | Female |
| Sales & Related | 0 (0.0%) | 2 (100.0%) |
| Office & Administration | 0 (0.0%) | 6 (100.0%) |
| Total (Category) | 0 (0.0%) | 8 (100.0%) |
| Total (Overall) | 15 (36.6%) | 26 (63.4%) |
Natural Resources, Construction and Maintenance Occupations
The most common Natural Resources, Construction and Maintenance occupations in Melstone are , and Construction & Extraction (4 | 9.8%).
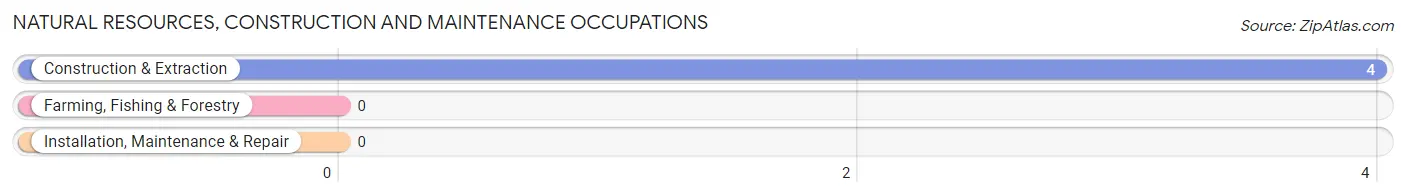
Natural Resources, Construction and Maintenance Occupations by Sex
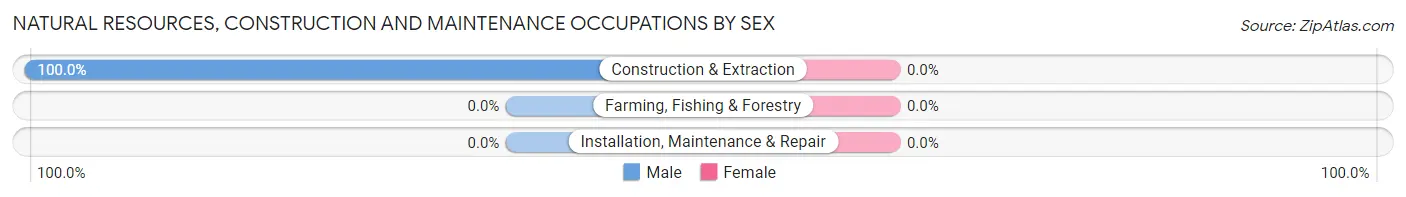
| Occupation | Male | Female |
| Farming, Fishing & Forestry | 0 (0.0%) | 0 (0.0%) |
| Construction & Extraction | 4 (100.0%) | 0 (0.0%) |
| Installation, Maintenance & Repair | 0 (0.0%) | 0 (0.0%) |
| Total (Category) | 4 (100.0%) | 0 (0.0%) |
| Total (Overall) | 15 (36.6%) | 26 (63.4%) |
Production, Transportation and Moving Occupations
The most common Production, Transportation and Moving occupations in Melstone are Transportation (5 | 12.2%), and Material Moving (5 | 12.2%).
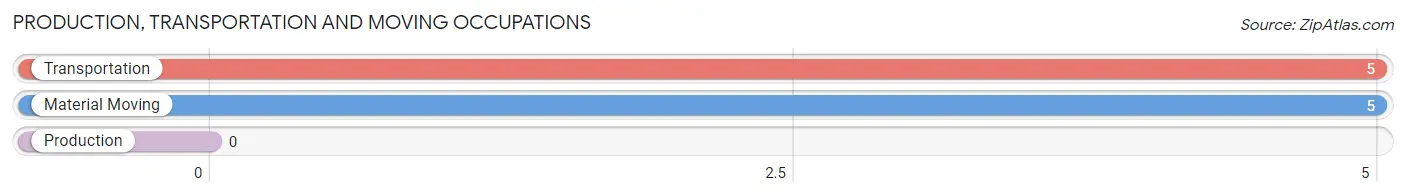
Production, Transportation and Moving Occupations by Sex
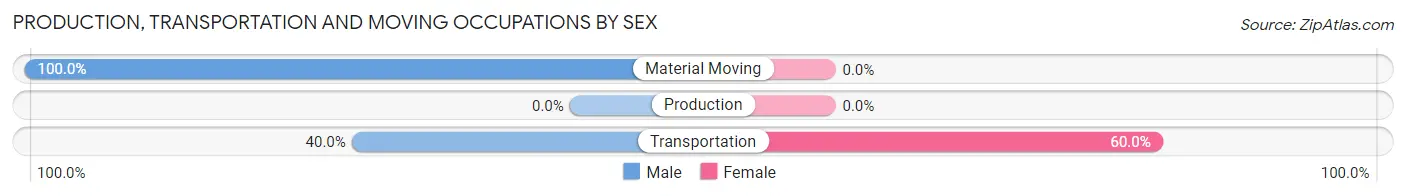
| Occupation | Male | Female |
| Production | 0 (0.0%) | 0 (0.0%) |
| Transportation | 2 (40.0%) | 3 (60.0%) |
| Material Moving | 5 (100.0%) | 0 (0.0%) |
| Total (Category) | 7 (70.0%) | 3 (30.0%) |
| Total (Overall) | 15 (36.6%) | 26 (63.4%) |
Employment Industries by Sex in Melstone
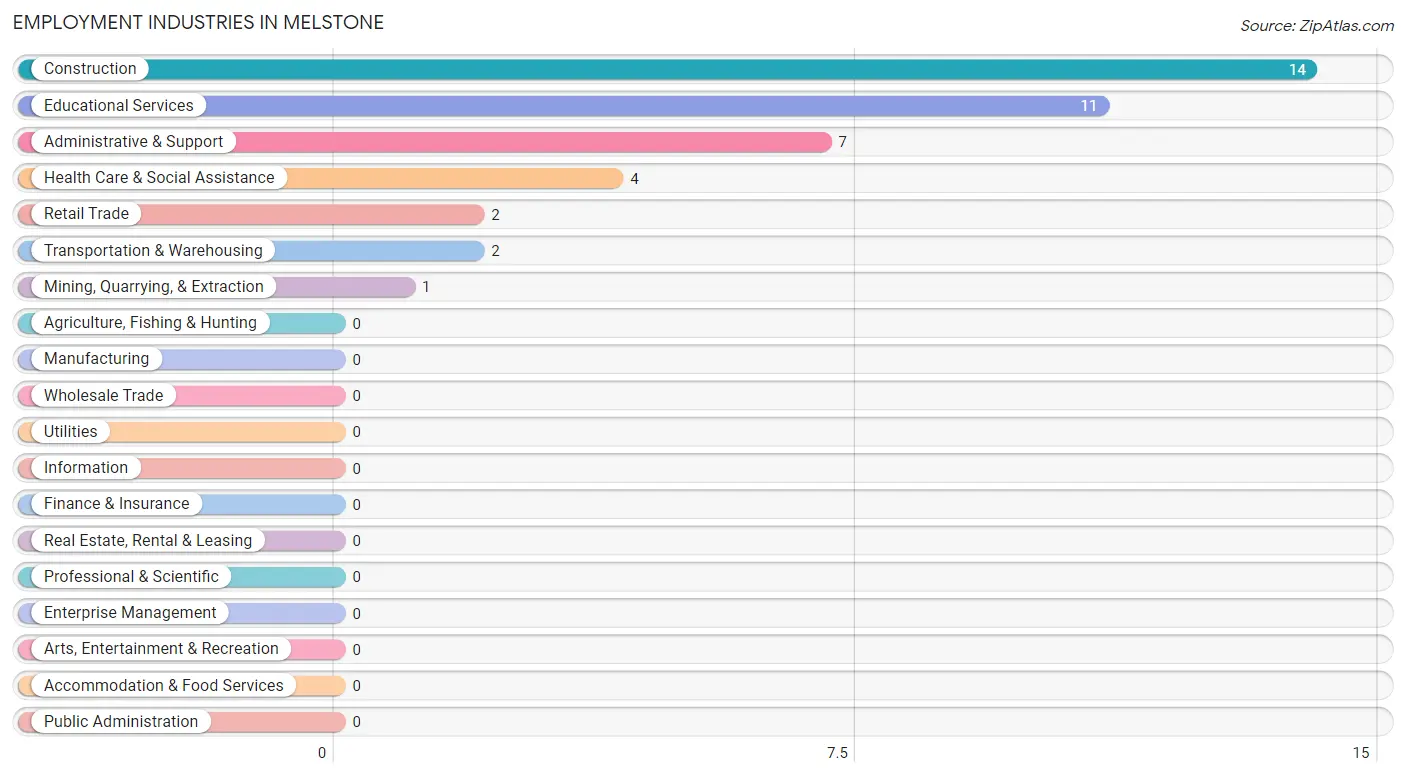
Employment Industries in Melstone
The major employment industries in Melstone include Construction (14 | 34.2%), Educational Services (11 | 26.8%), Administrative & Support (7 | 17.1%), Health Care & Social Assistance (4 | 9.8%), and Retail Trade (2 | 4.9%).
Employment Industries by Sex in Melstone
The Melstone industries that see more men than women are Mining, Quarrying, & Extraction (100.0%), Transportation & Warehousing (100.0%), and Administrative & Support (71.4%), whereas the industries that tend to have a higher number of women are Retail Trade (100.0%), Educational Services (100.0%), and Health Care & Social Assistance (100.0%).
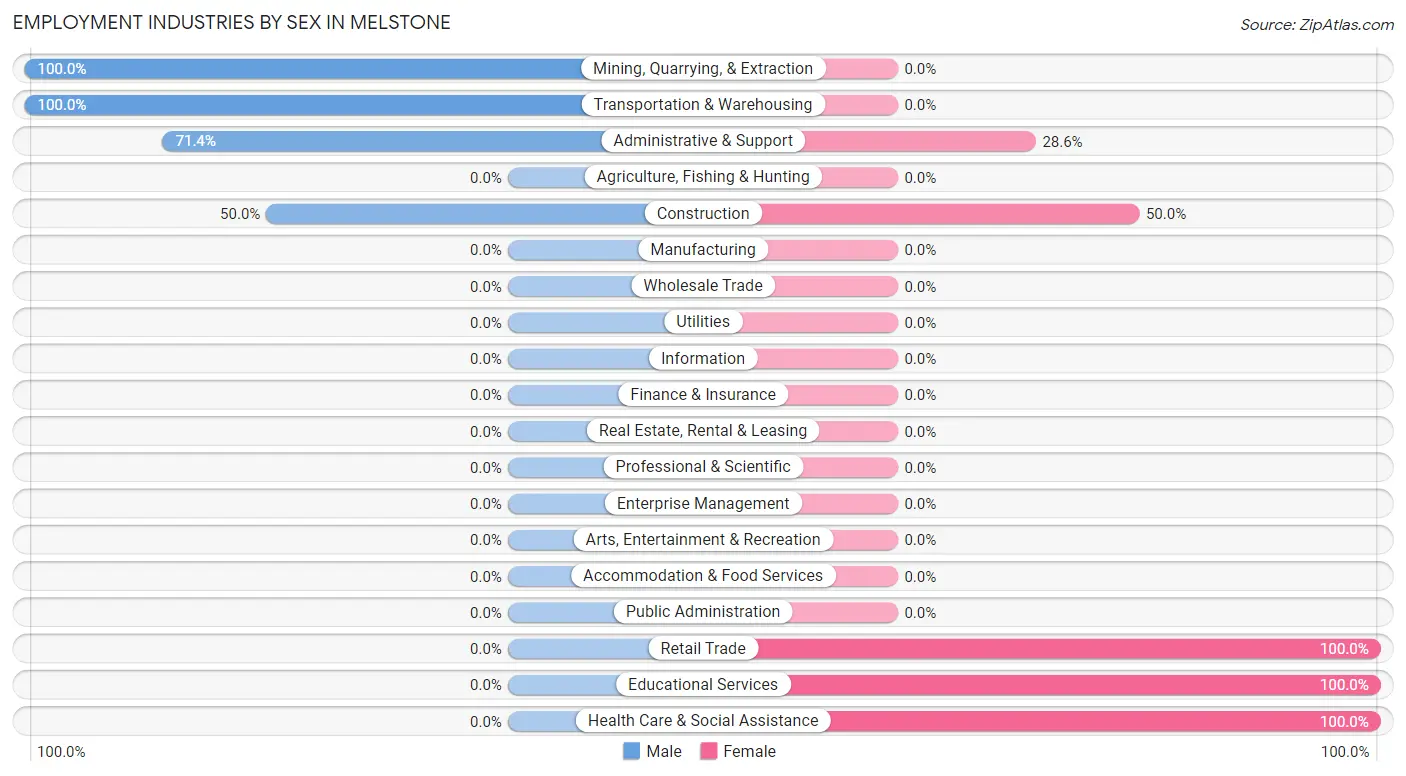
| Industry | Male | Female |
| Agriculture, Fishing & Hunting | 0 (0.0%) | 0 (0.0%) |
| Mining, Quarrying, & Extraction | 1 (100.0%) | 0 (0.0%) |
| Construction | 7 (50.0%) | 7 (50.0%) |
| Manufacturing | 0 (0.0%) | 0 (0.0%) |
| Wholesale Trade | 0 (0.0%) | 0 (0.0%) |
| Retail Trade | 0 (0.0%) | 2 (100.0%) |
| Transportation & Warehousing | 2 (100.0%) | 0 (0.0%) |
| Utilities | 0 (0.0%) | 0 (0.0%) |
| Information | 0 (0.0%) | 0 (0.0%) |
| Finance & Insurance | 0 (0.0%) | 0 (0.0%) |
| Real Estate, Rental & Leasing | 0 (0.0%) | 0 (0.0%) |
| Professional & Scientific | 0 (0.0%) | 0 (0.0%) |
| Enterprise Management | 0 (0.0%) | 0 (0.0%) |
| Administrative & Support | 5 (71.4%) | 2 (28.6%) |
| Educational Services | 0 (0.0%) | 11 (100.0%) |
| Health Care & Social Assistance | 0 (0.0%) | 4 (100.0%) |
| Arts, Entertainment & Recreation | 0 (0.0%) | 0 (0.0%) |
| Accommodation & Food Services | 0 (0.0%) | 0 (0.0%) |
| Public Administration | 0 (0.0%) | 0 (0.0%) |
| Total | 15 (36.6%) | 26 (63.4%) |
Education in Melstone
School Enrollment in Melstone
The most common levels of schooling among the 20 students in Melstone are middle school (14 | 70.0%), kindergarten (3 | 15.0%), and elementary school (3 | 15.0%).
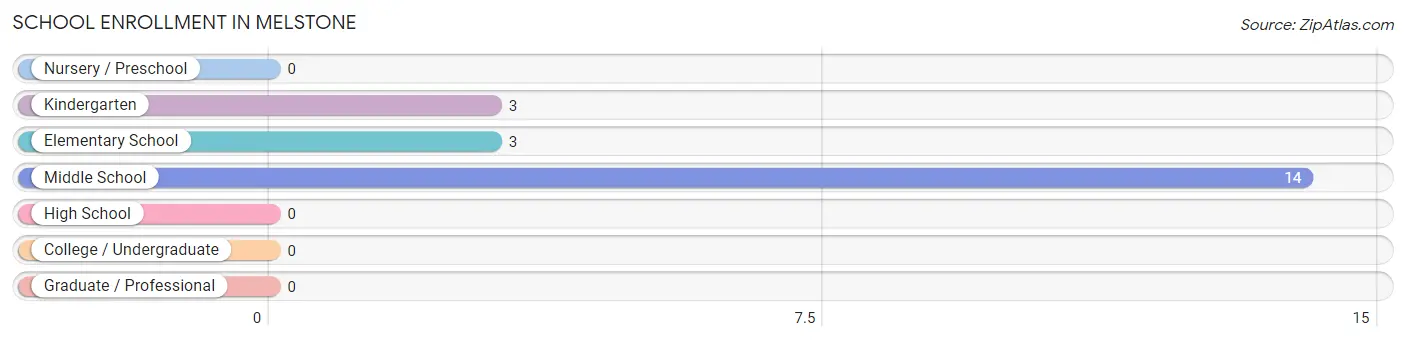
| School Level | # Students | % Students |
| Nursery / Preschool | 0 | 0.0% |
| Kindergarten | 3 | 15.0% |
| Elementary School | 3 | 15.0% |
| Middle School | 14 | 70.0% |
| High School | 0 | 0.0% |
| College / Undergraduate | 0 | 0.0% |
| Graduate / Professional | 0 | 0.0% |
| Total | 20 | 100.0% |
School Enrollment by Age by Funding Source in Melstone
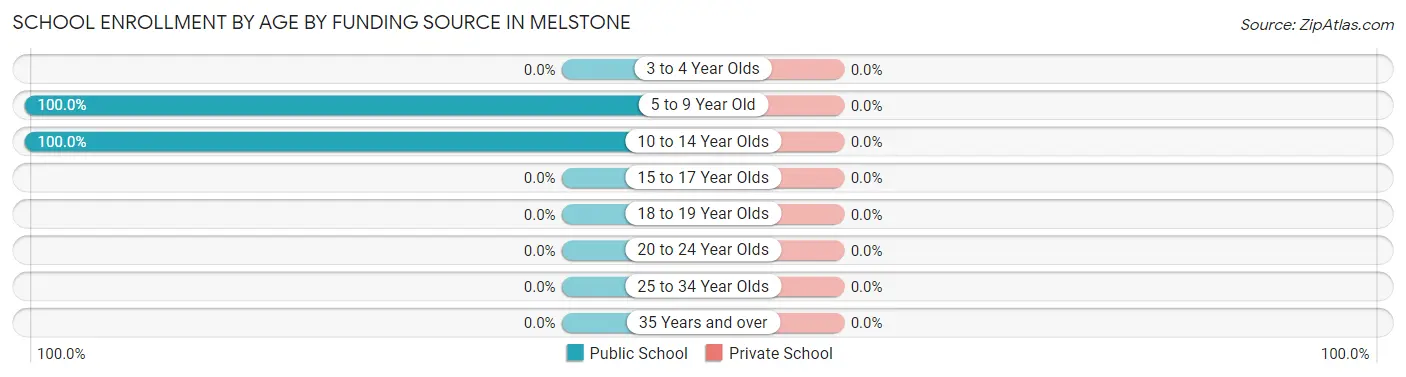
| Age Bracket | Public School | Private School |
| 3 to 4 Year Olds | 0 (0.0%) | 0 (0.0%) |
| 5 to 9 Year Old | 6 (100.0%) | 0 (0.0%) |
| 10 to 14 Year Olds | 14 (100.0%) | 0 (0.0%) |
| 15 to 17 Year Olds | 0 (0.0%) | 0 (0.0%) |
| 18 to 19 Year Olds | 0 (0.0%) | 0 (0.0%) |
| 20 to 24 Year Olds | 0 (0.0%) | 0 (0.0%) |
| 25 to 34 Year Olds | 0 (0.0%) | 0 (0.0%) |
| 35 Years and over | 0 (0.0%) | 0 (0.0%) |
| Total | 20 (100.0%) | 0 (0.0%) |
Educational Attainment by Field of Study in Melstone
, and bio, nature & agricultural (2 | 100.0%) are the most common fields of study among 2 individuals in Melstone who have obtained a bachelor's degree or higher.
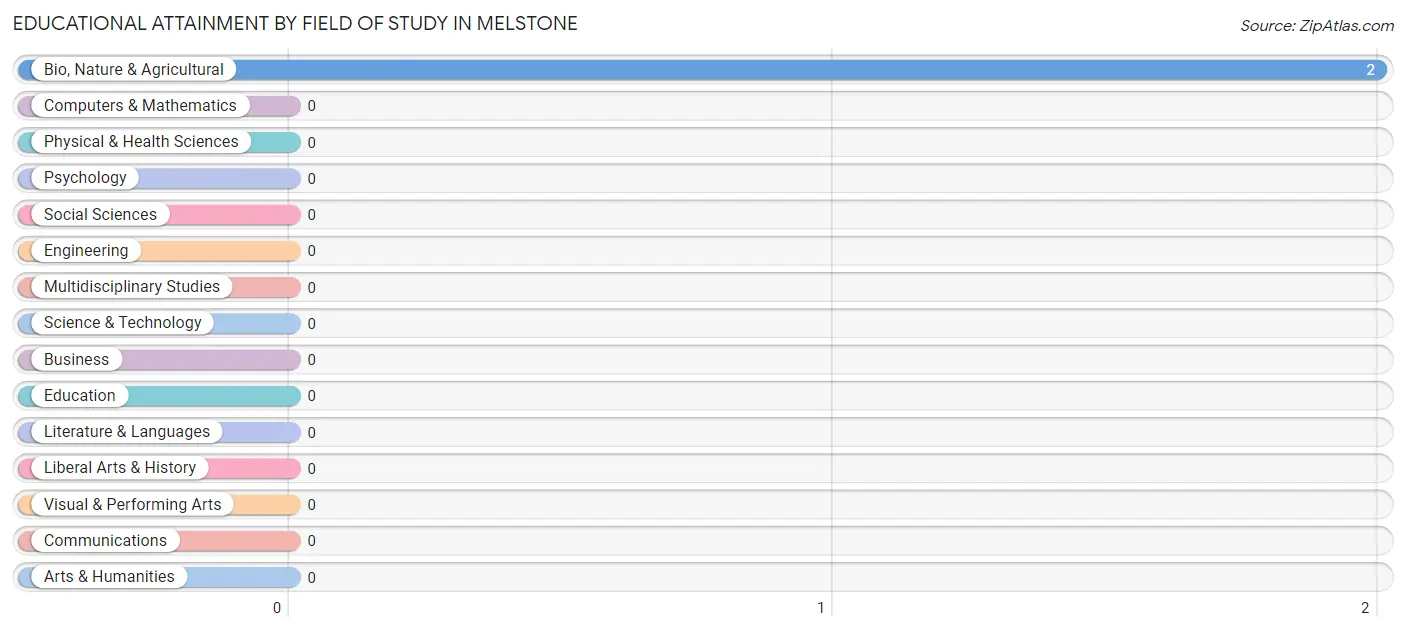
| Field of Study | # Graduates | % Graduates |
| Computers & Mathematics | 0 | 0.0% |
| Bio, Nature & Agricultural | 2 | 100.0% |
| Physical & Health Sciences | 0 | 0.0% |
| Psychology | 0 | 0.0% |
| Social Sciences | 0 | 0.0% |
| Engineering | 0 | 0.0% |
| Multidisciplinary Studies | 0 | 0.0% |
| Science & Technology | 0 | 0.0% |
| Business | 0 | 0.0% |
| Education | 0 | 0.0% |
| Literature & Languages | 0 | 0.0% |
| Liberal Arts & History | 0 | 0.0% |
| Visual & Performing Arts | 0 | 0.0% |
| Communications | 0 | 0.0% |
| Arts & Humanities | 0 | 0.0% |
| Total | 2 | 100.0% |
Transportation & Commute in Melstone
Vehicle Availability by Sex in Melstone
The most prevalent vehicle ownership categories in Melstone are males with 4 vehicles (8, accounting for 53.3%) and females with 4 vehicles (6, making up 40.0%).
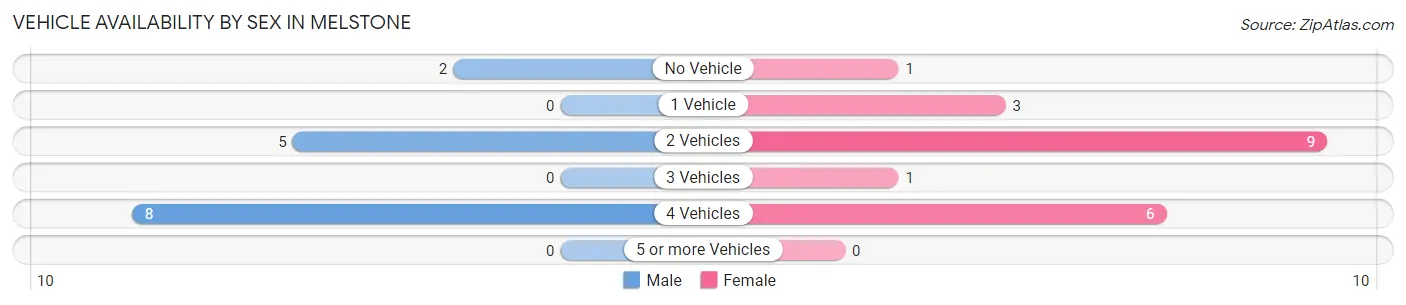
| Vehicles Available | Male | Female |
| No Vehicle | 2 (13.3%) | 1 (5.0%) |
| 1 Vehicle | 0 (0.0%) | 3 (15.0%) |
| 2 Vehicles | 5 (33.3%) | 9 (45.0%) |
| 3 Vehicles | 0 (0.0%) | 1 (5.0%) |
| 4 Vehicles | 8 (53.3%) | 6 (30.0%) |
| 5 or more Vehicles | 0 (0.0%) | 0 (0.0%) |
| Total | 15 (100.0%) | 20 (100.0%) |
Commute Time in Melstone
The most frequently occuring commute durations in Melstone are less than 5 minutes (22 commuters, 62.9%), 30 to 34 minutes (5 commuters, 14.3%), and 5 to 9 minutes (3 commuters, 8.6%).
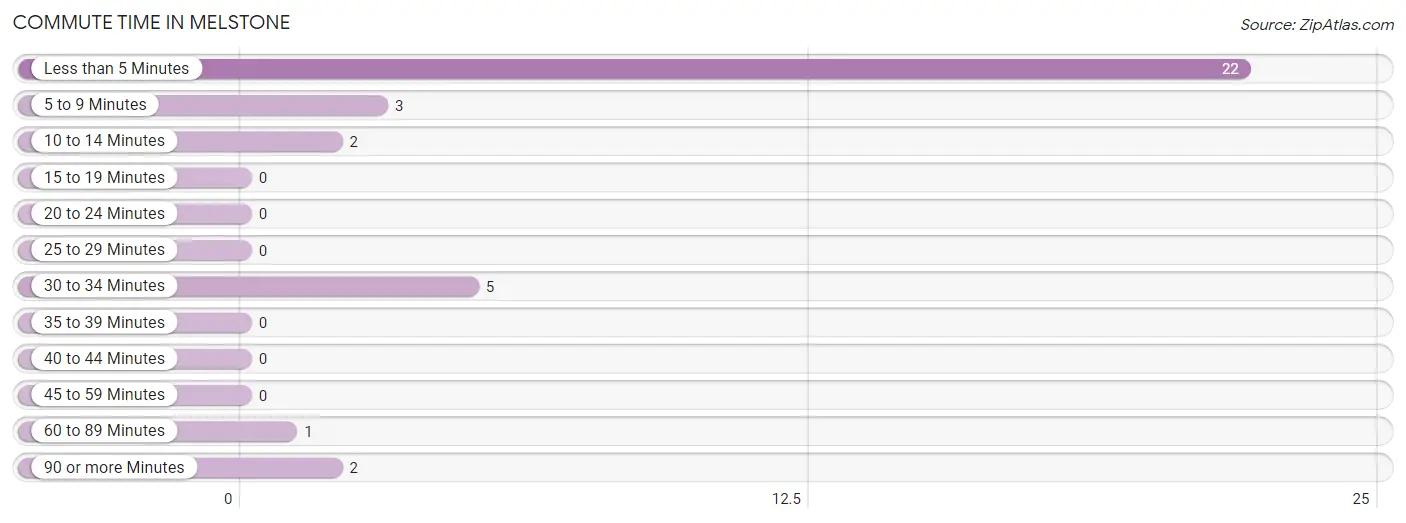
| Commute Time | # Commuters | % Commuters |
| Less than 5 Minutes | 22 | 62.9% |
| 5 to 9 Minutes | 3 | 8.6% |
| 10 to 14 Minutes | 2 | 5.7% |
| 15 to 19 Minutes | 0 | 0.0% |
| 20 to 24 Minutes | 0 | 0.0% |
| 25 to 29 Minutes | 0 | 0.0% |
| 30 to 34 Minutes | 5 | 14.3% |
| 35 to 39 Minutes | 0 | 0.0% |
| 40 to 44 Minutes | 0 | 0.0% |
| 45 to 59 Minutes | 0 | 0.0% |
| 60 to 89 Minutes | 1 | 2.9% |
| 90 or more Minutes | 2 | 5.7% |
Commute Time by Sex in Melstone
The most common commute times in Melstone are less than 5 minutes (6 commuters, 40.0%) for males and less than 5 minutes (16 commuters, 80.0%) for females.
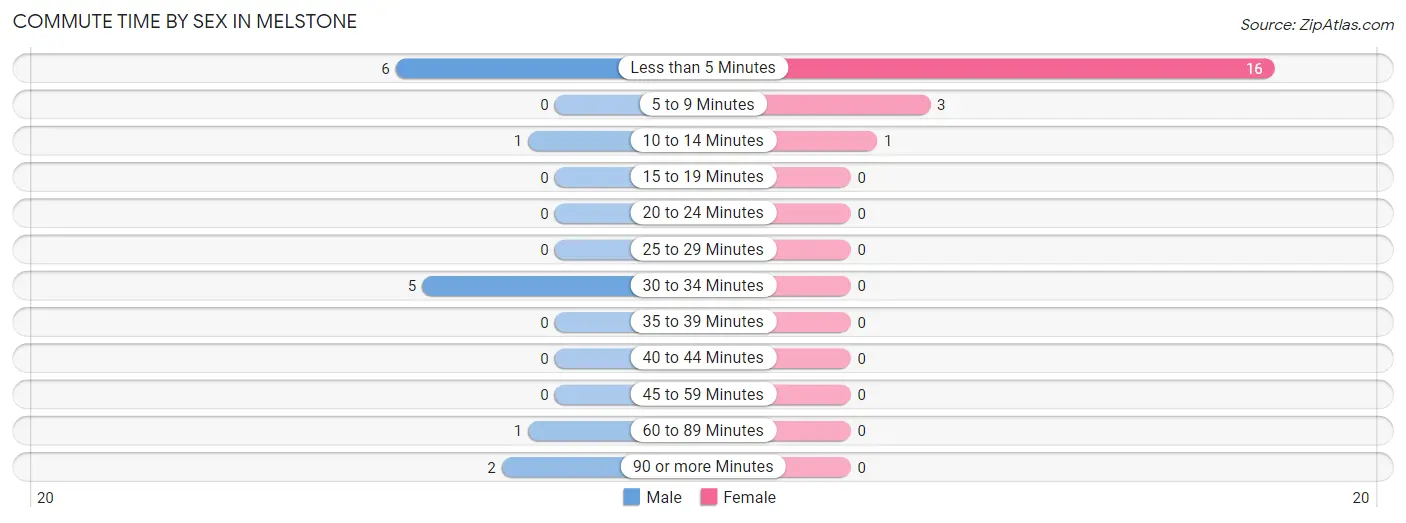
| Commute Time | Male | Female |
| Less than 5 Minutes | 6 (40.0%) | 16 (80.0%) |
| 5 to 9 Minutes | 0 (0.0%) | 3 (15.0%) |
| 10 to 14 Minutes | 1 (6.7%) | 1 (5.0%) |
| 15 to 19 Minutes | 0 (0.0%) | 0 (0.0%) |
| 20 to 24 Minutes | 0 (0.0%) | 0 (0.0%) |
| 25 to 29 Minutes | 0 (0.0%) | 0 (0.0%) |
| 30 to 34 Minutes | 5 (33.3%) | 0 (0.0%) |
| 35 to 39 Minutes | 0 (0.0%) | 0 (0.0%) |
| 40 to 44 Minutes | 0 (0.0%) | 0 (0.0%) |
| 45 to 59 Minutes | 0 (0.0%) | 0 (0.0%) |
| 60 to 89 Minutes | 1 (6.7%) | 0 (0.0%) |
| 90 or more Minutes | 2 (13.3%) | 0 (0.0%) |
Time of Departure to Work by Sex in Melstone
The most frequent times of departure to work in Melstone are 7:30 AM to 7:59 AM (10, 66.7%) for males and 8:00 AM to 8:29 AM (9, 45.0%) for females.
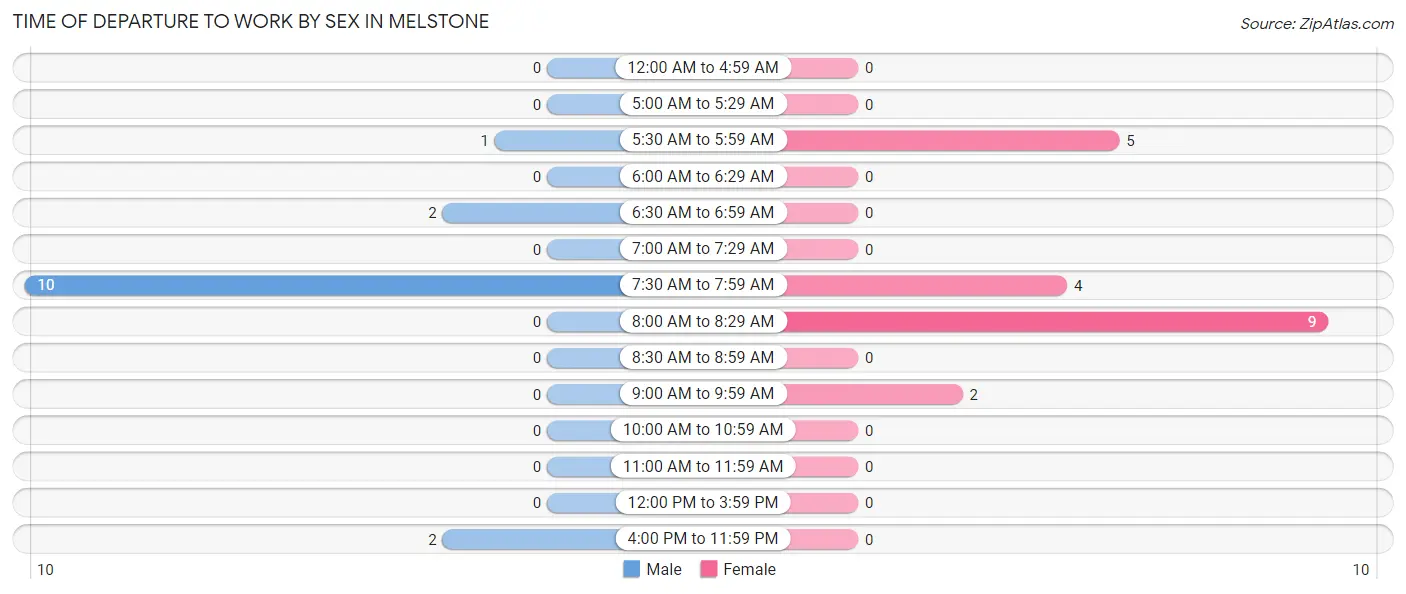
| Time of Departure | Male | Female |
| 12:00 AM to 4:59 AM | 0 (0.0%) | 0 (0.0%) |
| 5:00 AM to 5:29 AM | 0 (0.0%) | 0 (0.0%) |
| 5:30 AM to 5:59 AM | 1 (6.7%) | 5 (25.0%) |
| 6:00 AM to 6:29 AM | 0 (0.0%) | 0 (0.0%) |
| 6:30 AM to 6:59 AM | 2 (13.3%) | 0 (0.0%) |
| 7:00 AM to 7:29 AM | 0 (0.0%) | 0 (0.0%) |
| 7:30 AM to 7:59 AM | 10 (66.7%) | 4 (20.0%) |
| 8:00 AM to 8:29 AM | 0 (0.0%) | 9 (45.0%) |
| 8:30 AM to 8:59 AM | 0 (0.0%) | 0 (0.0%) |
| 9:00 AM to 9:59 AM | 0 (0.0%) | 2 (10.0%) |
| 10:00 AM to 10:59 AM | 0 (0.0%) | 0 (0.0%) |
| 11:00 AM to 11:59 AM | 0 (0.0%) | 0 (0.0%) |
| 12:00 PM to 3:59 PM | 0 (0.0%) | 0 (0.0%) |
| 4:00 PM to 11:59 PM | 2 (13.3%) | 0 (0.0%) |
| Total | 15 (100.0%) | 20 (100.0%) |
Housing Occupancy in Melstone
Occupancy by Ownership in Melstone
Of the total 32 dwellings in Melstone, owner-occupied units account for 23 (71.9%), while renter-occupied units make up 9 (28.1%).
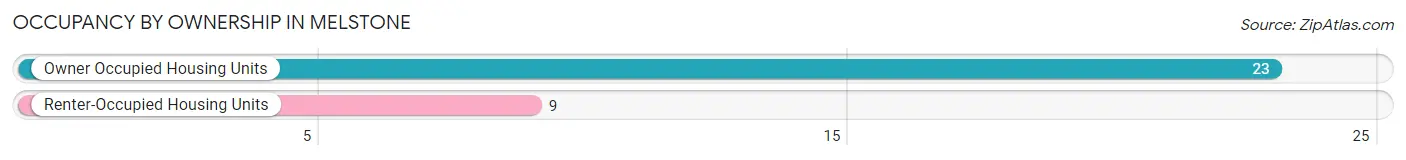
| Occupancy | # Housing Units | % Housing Units |
| Owner Occupied Housing Units | 23 | 71.9% |
| Renter-Occupied Housing Units | 9 | 28.1% |
| Total Occupied Housing Units | 32 | 100.0% |
Occupancy by Household Size in Melstone
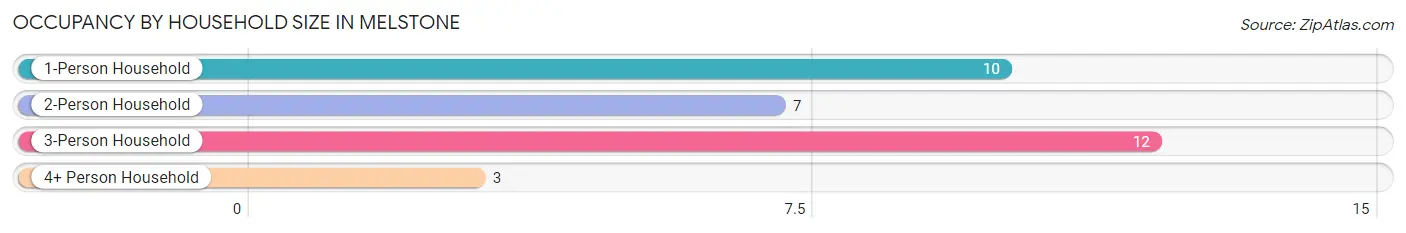
| Household Size | # Housing Units | % Housing Units |
| 1-Person Household | 10 | 31.2% |
| 2-Person Household | 7 | 21.9% |
| 3-Person Household | 12 | 37.5% |
| 4+ Person Household | 3 | 9.4% |
| Total Housing Units | 32 | 100.0% |
Occupancy by Ownership by Household Size in Melstone
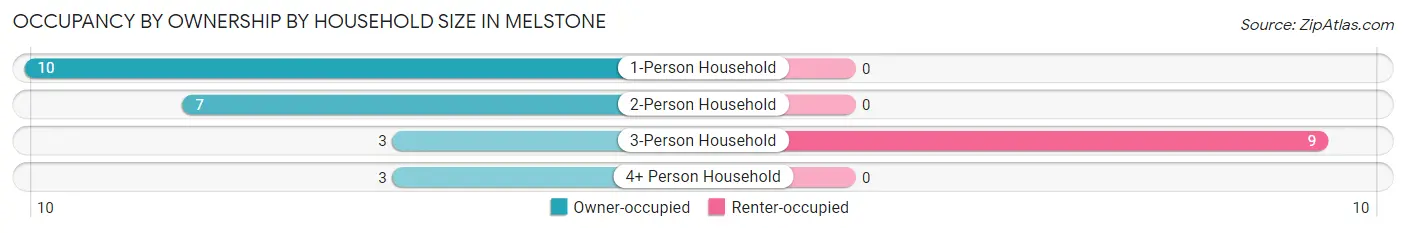
| Household Size | Owner-occupied | Renter-occupied |
| 1-Person Household | 10 (100.0%) | 0 (0.0%) |
| 2-Person Household | 7 (100.0%) | 0 (0.0%) |
| 3-Person Household | 3 (25.0%) | 9 (75.0%) |
| 4+ Person Household | 3 (100.0%) | 0 (0.0%) |
| Total Housing Units | 23 (71.9%) | 9 (28.1%) |
Occupancy by Educational Attainment in Melstone
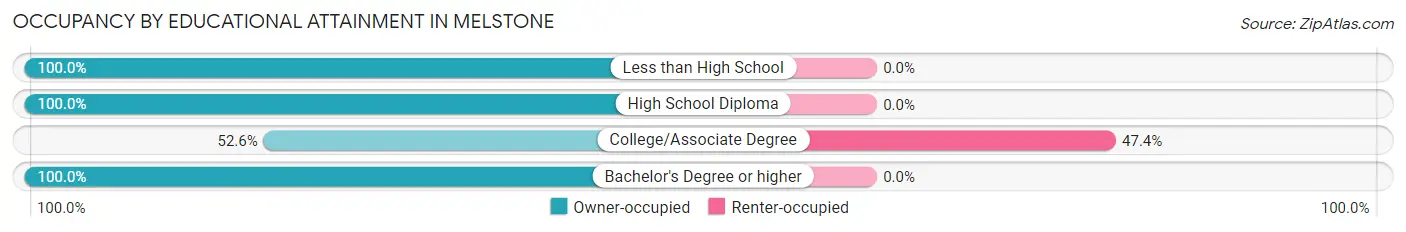
| Household Size | Owner-occupied | Renter-occupied |
| Less than High School | 3 (100.0%) | 0 (0.0%) |
| High School Diploma | 8 (100.0%) | 0 (0.0%) |
| College/Associate Degree | 10 (52.6%) | 9 (47.4%) |
| Bachelor's Degree or higher | 2 (100.0%) | 0 (0.0%) |
Occupancy by Age of Householder in Melstone
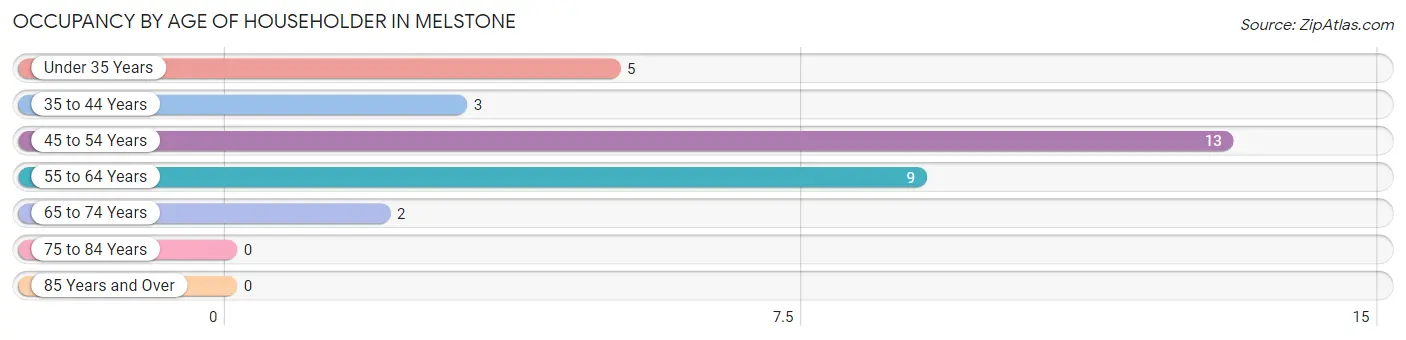
| Age Bracket | # Households | % Households |
| Under 35 Years | 5 | 15.6% |
| 35 to 44 Years | 3 | 9.4% |
| 45 to 54 Years | 13 | 40.6% |
| 55 to 64 Years | 9 | 28.1% |
| 65 to 74 Years | 2 | 6.2% |
| 75 to 84 Years | 0 | 0.0% |
| 85 Years and Over | 0 | 0.0% |
| Total | 32 | 100.0% |
Housing Finances in Melstone
Median Income by Occupancy in Melstone
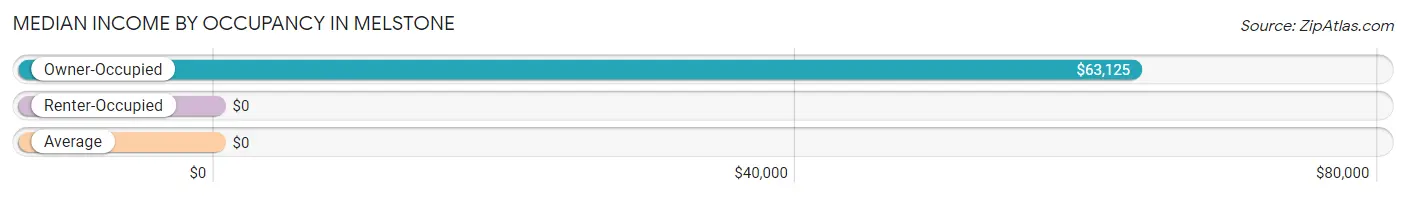
| Occupancy Type | # Households | Median Income |
| Owner-Occupied | 23 (71.9%) | $63,125 |
| Renter-Occupied | 9 (28.1%) | $0 |
| Average | 32 (100.0%) | $0 |
Occupancy by Householder Income Bracket in Melstone
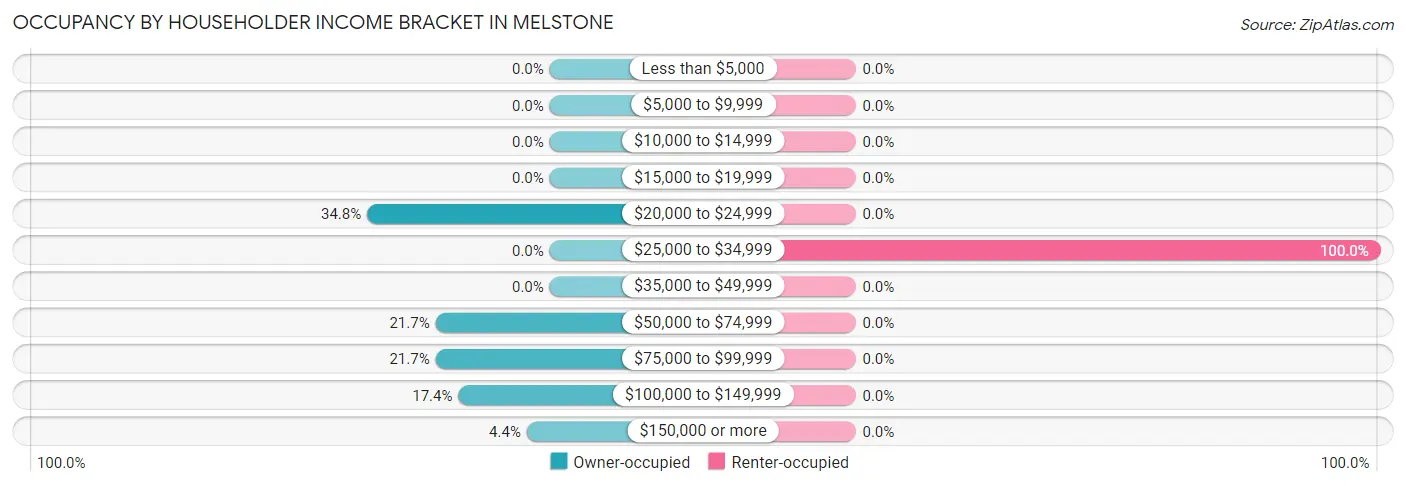
| Income Bracket | Owner-occupied | Renter-occupied |
| Less than $5,000 | 0 (0.0%) | 0 (0.0%) |
| $5,000 to $9,999 | 0 (0.0%) | 0 (0.0%) |
| $10,000 to $14,999 | 0 (0.0%) | 0 (0.0%) |
| $15,000 to $19,999 | 0 (0.0%) | 0 (0.0%) |
| $20,000 to $24,999 | 8 (34.8%) | 0 (0.0%) |
| $25,000 to $34,999 | 0 (0.0%) | 9 (100.0%) |
| $35,000 to $49,999 | 0 (0.0%) | 0 (0.0%) |
| $50,000 to $74,999 | 5 (21.7%) | 0 (0.0%) |
| $75,000 to $99,999 | 5 (21.7%) | 0 (0.0%) |
| $100,000 to $149,999 | 4 (17.4%) | 0 (0.0%) |
| $150,000 or more | 1 (4.3%) | 0 (0.0%) |
| Total | 23 (100.0%) | 9 (100.0%) |
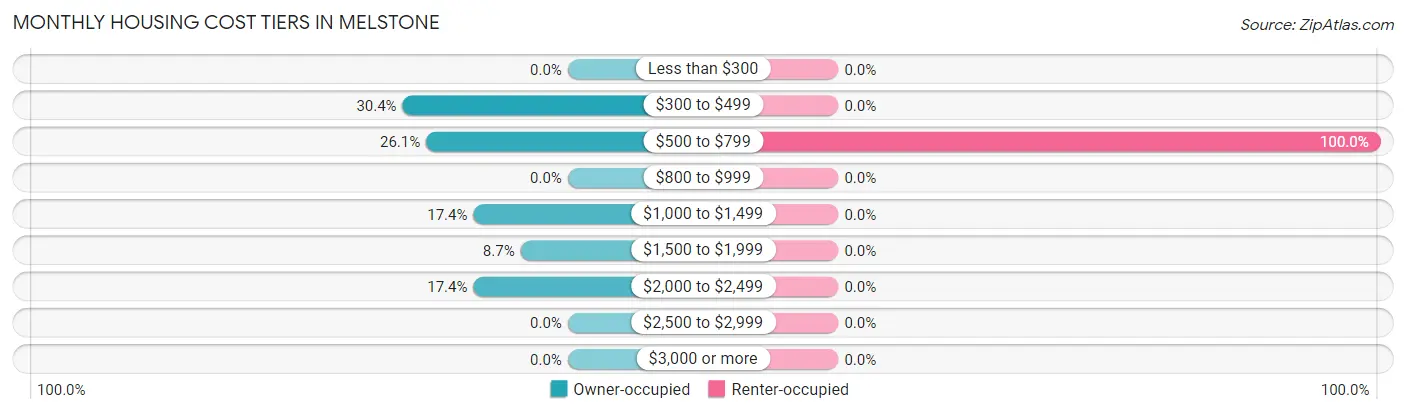
Monthly Housing Cost Tiers in Melstone
| Monthly Cost | Owner-occupied | Renter-occupied |
| Less than $300 | 0 (0.0%) | 0 (0.0%) |
| $300 to $499 | 7 (30.4%) | 0 (0.0%) |
| $500 to $799 | 6 (26.1%) | 9 (100.0%) |
| $800 to $999 | 0 (0.0%) | 0 (0.0%) |
| $1,000 to $1,499 | 4 (17.4%) | 0 (0.0%) |
| $1,500 to $1,999 | 2 (8.7%) | 0 (0.0%) |
| $2,000 to $2,499 | 4 (17.4%) | 0 (0.0%) |
| $2,500 to $2,999 | 0 (0.0%) | 0 (0.0%) |
| $3,000 or more | 0 (0.0%) | 0 (0.0%) |
| Total | 23 (100.0%) | 9 (100.0%) |
Physical Housing Characteristics in Melstone
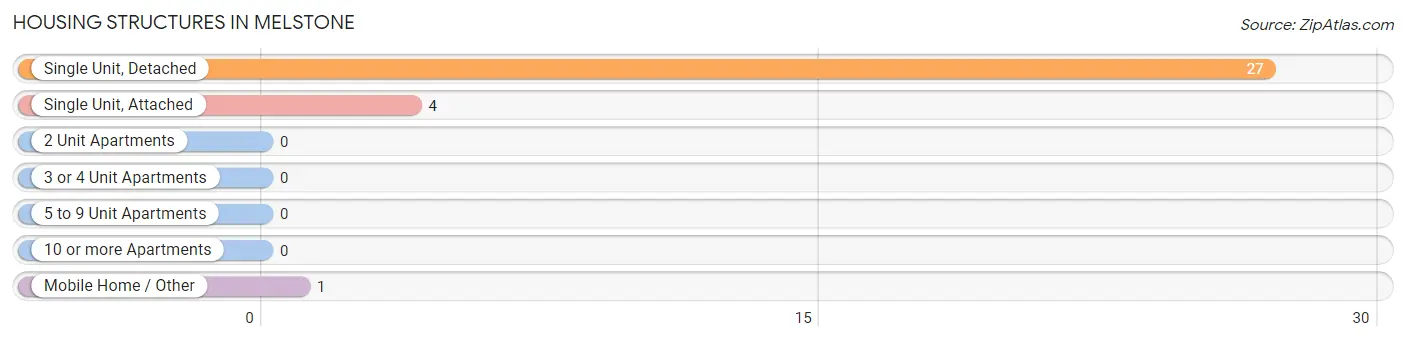
Housing Structures in Melstone
| Structure Type | # Housing Units | % Housing Units |
| Single Unit, Detached | 27 | 84.4% |
| Single Unit, Attached | 4 | 12.5% |
| 2 Unit Apartments | 0 | 0.0% |
| 3 or 4 Unit Apartments | 0 | 0.0% |
| 5 to 9 Unit Apartments | 0 | 0.0% |
| 10 or more Apartments | 0 | 0.0% |
| Mobile Home / Other | 1 | 3.1% |
| Total | 32 | 100.0% |
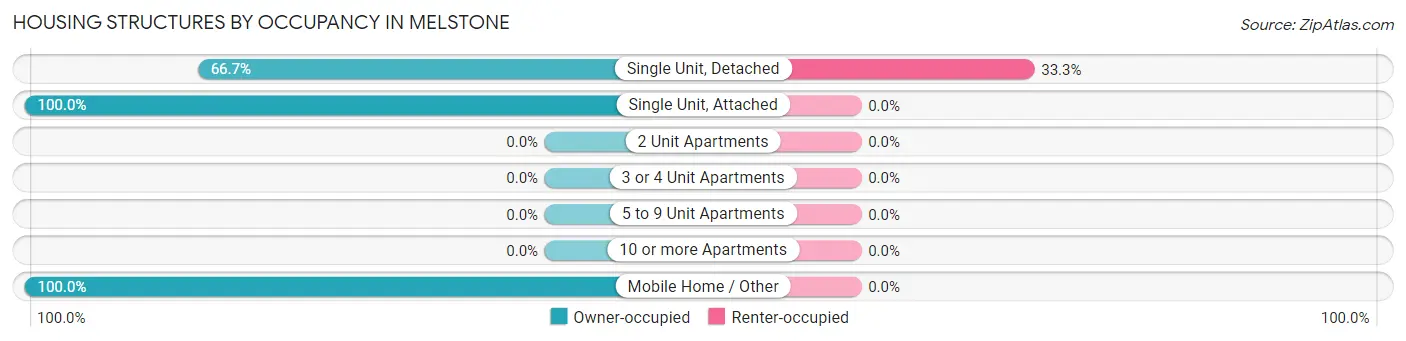
Housing Structures by Occupancy in Melstone
| Structure Type | Owner-occupied | Renter-occupied |
| Single Unit, Detached | 18 (66.7%) | 9 (33.3%) |
| Single Unit, Attached | 4 (100.0%) | 0 (0.0%) |
| 2 Unit Apartments | 0 (0.0%) | 0 (0.0%) |
| 3 or 4 Unit Apartments | 0 (0.0%) | 0 (0.0%) |
| 5 to 9 Unit Apartments | 0 (0.0%) | 0 (0.0%) |
| 10 or more Apartments | 0 (0.0%) | 0 (0.0%) |
| Mobile Home / Other | 1 (100.0%) | 0 (0.0%) |
| Total | 23 (71.9%) | 9 (28.1%) |
Housing Structures by Number of Rooms in Melstone
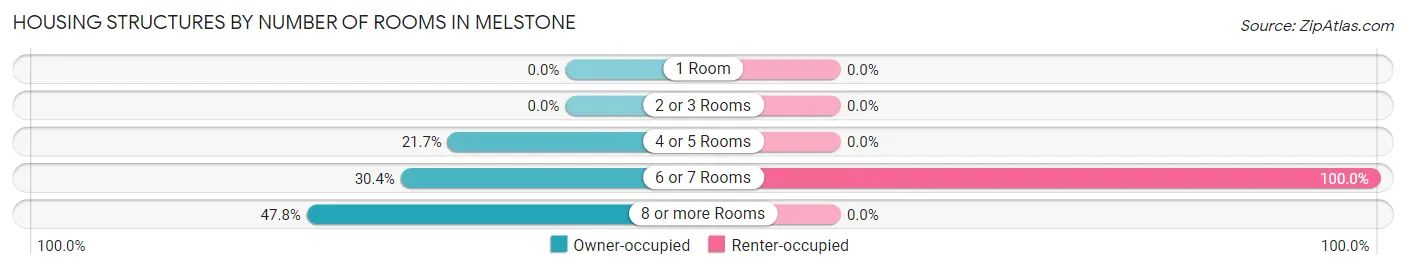
| Number of Rooms | Owner-occupied | Renter-occupied |
| 1 Room | 0 (0.0%) | 0 (0.0%) |
| 2 or 3 Rooms | 0 (0.0%) | 0 (0.0%) |
| 4 or 5 Rooms | 5 (21.7%) | 0 (0.0%) |
| 6 or 7 Rooms | 7 (30.4%) | 9 (100.0%) |
| 8 or more Rooms | 11 (47.8%) | 0 (0.0%) |
| Total | 23 (100.0%) | 9 (100.0%) |
Housing Structure by Heating Type in Melstone
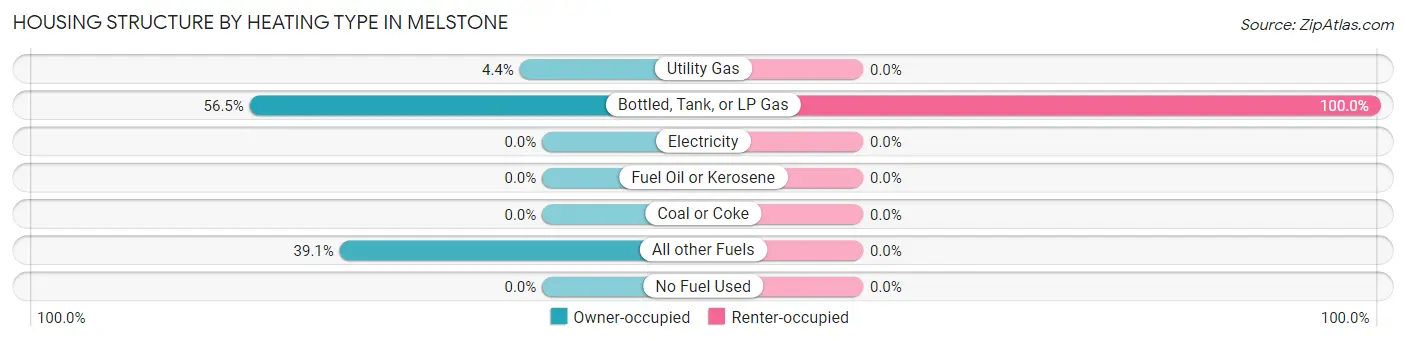
| Heating Type | Owner-occupied | Renter-occupied |
| Utility Gas | 1 (4.3%) | 0 (0.0%) |
| Bottled, Tank, or LP Gas | 13 (56.5%) | 9 (100.0%) |
| Electricity | 0 (0.0%) | 0 (0.0%) |
| Fuel Oil or Kerosene | 0 (0.0%) | 0 (0.0%) |
| Coal or Coke | 0 (0.0%) | 0 (0.0%) |
| All other Fuels | 9 (39.1%) | 0 (0.0%) |
| No Fuel Used | 0 (0.0%) | 0 (0.0%) |
| Total | 23 (100.0%) | 9 (100.0%) |
Household Vehicle Usage in Melstone
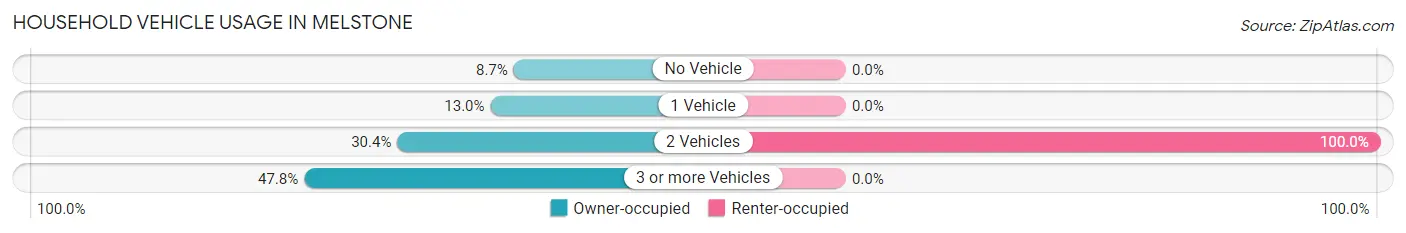
| Vehicles per Household | Owner-occupied | Renter-occupied |
| No Vehicle | 2 (8.7%) | 0 (0.0%) |
| 1 Vehicle | 3 (13.0%) | 0 (0.0%) |
| 2 Vehicles | 7 (30.4%) | 9 (100.0%) |
| 3 or more Vehicles | 11 (47.8%) | 0 (0.0%) |
| Total | 23 (100.0%) | 9 (100.0%) |
Real Estate & Mortgages in Melstone
Real Estate and Mortgage Overview in Melstone
| Characteristic | Without Mortgage | With Mortgage |
| Housing Units | 2 | 21 |
| Median Property Value | - | - |
| Median Household Income | - | - |
| Monthly Housing Costs | - | - |
| Real Estate Taxes | - | - |
Property Value by Mortgage Status in Melstone
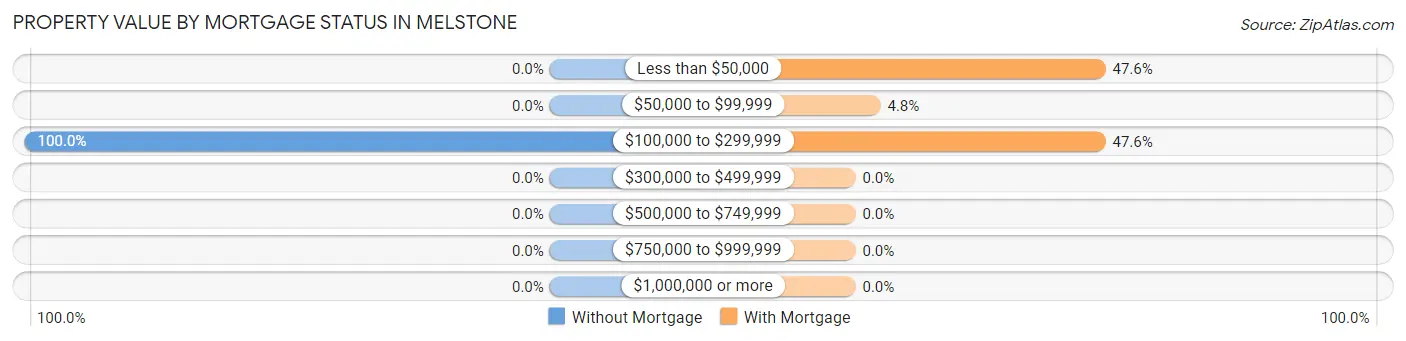
| Property Value | Without Mortgage | With Mortgage |
| Less than $50,000 | 0 (0.0%) | 10 (47.6%) |
| $50,000 to $99,999 | 0 (0.0%) | 1 (4.8%) |
| $100,000 to $299,999 | 2 (100.0%) | 10 (47.6%) |
| $300,000 to $499,999 | 0 (0.0%) | 0 (0.0%) |
| $500,000 to $749,999 | 0 (0.0%) | 0 (0.0%) |
| $750,000 to $999,999 | 0 (0.0%) | 0 (0.0%) |
| $1,000,000 or more | 0 (0.0%) | 0 (0.0%) |
| Total | 2 (100.0%) | 21 (100.0%) |
Household Income by Mortgage Status in Melstone
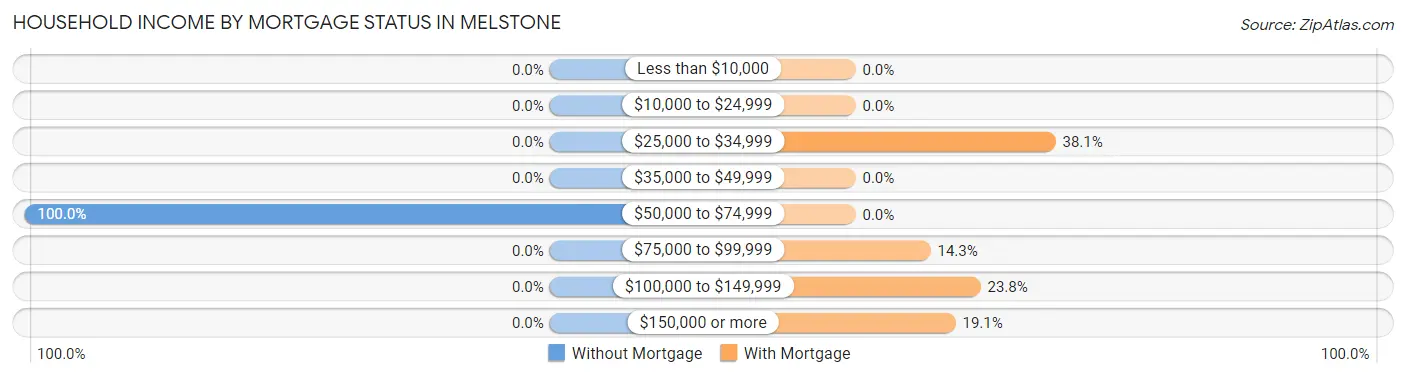
| Household Income | Without Mortgage | With Mortgage |
| Less than $10,000 | 0 (0.0%) | 0 (0.0%) |
| $10,000 to $24,999 | 0 (0.0%) | 0 (0.0%) |
| $25,000 to $34,999 | 0 (0.0%) | 8 (38.1%) |
| $35,000 to $49,999 | 0 (0.0%) | 0 (0.0%) |
| $50,000 to $74,999 | 2 (100.0%) | 0 (0.0%) |
| $75,000 to $99,999 | 0 (0.0%) | 3 (14.3%) |
| $100,000 to $149,999 | 0 (0.0%) | 5 (23.8%) |
| $150,000 or more | 0 (0.0%) | 4 (19.1%) |
| Total | 2 (100.0%) | 21 (100.0%) |
Property Value to Household Income Ratio in Melstone
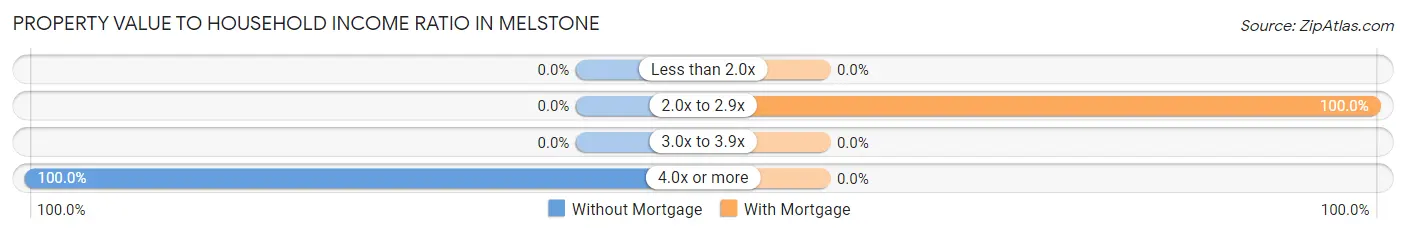
| Value-to-Income Ratio | Without Mortgage | With Mortgage |
| Less than 2.0x | 0 (0.0%) | 0 (0.0%) |
| 2.0x to 2.9x | 0 (0.0%) | 21 (100.0%) |
| 3.0x to 3.9x | 0 (0.0%) | 0 (0.0%) |
| 4.0x or more | 2 (100.0%) | 0 (0.0%) |
| Total | 2 (100.0%) | 21 (100.0%) |
Real Estate Taxes by Mortgage Status in Melstone
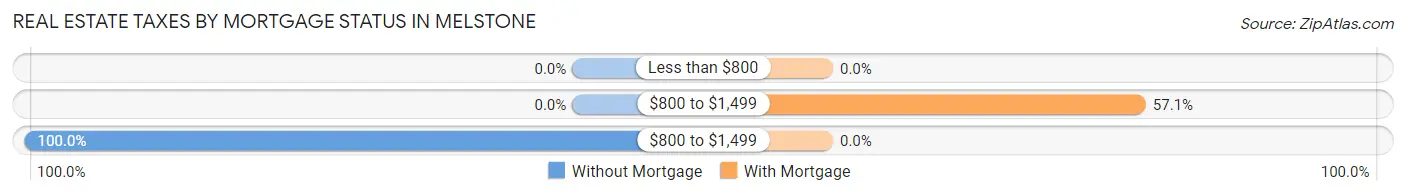
| Property Taxes | Without Mortgage | With Mortgage |
| Less than $800 | 0 (0.0%) | 0 (0.0%) |
| $800 to $1,499 | 0 (0.0%) | 12 (57.1%) |
| $800 to $1,499 | 2 (100.0%) | 0 (0.0%) |
| Total | 2 (100.0%) | 21 (100.0%) |
Health & Disability in Melstone
Health Insurance Coverage by Age in Melstone
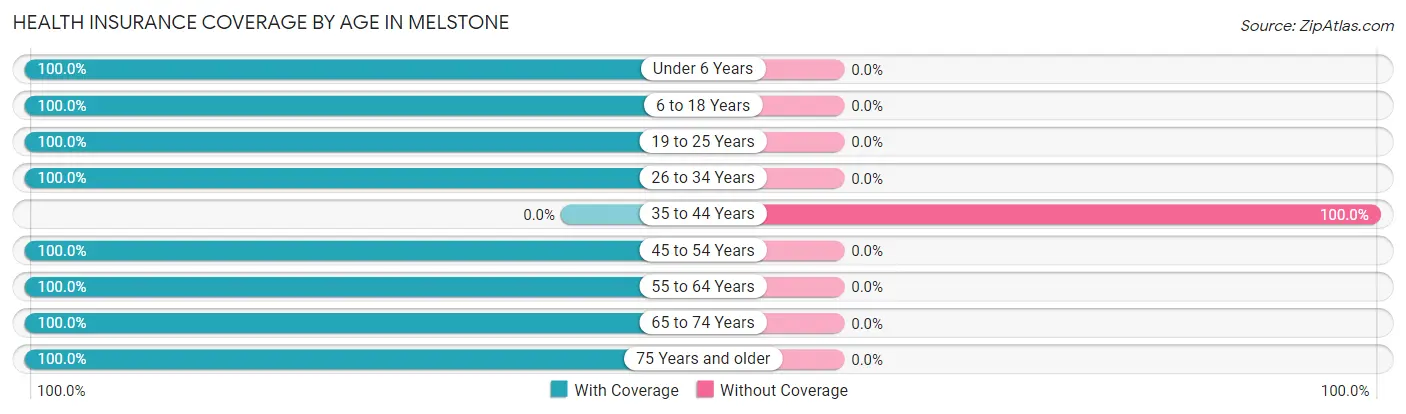
| Age Bracket | With Coverage | Without Coverage |
| Under 6 Years | 2 (100.0%) | 0 (0.0%) |
| 6 to 18 Years | 20 (100.0%) | 0 (0.0%) |
| 19 to 25 Years | 2 (100.0%) | 0 (0.0%) |
| 26 to 34 Years | 6 (100.0%) | 0 (0.0%) |
| 35 to 44 Years | 0 (0.0%) | 5 (100.0%) |
| 45 to 54 Years | 15 (100.0%) | 0 (0.0%) |
| 55 to 64 Years | 13 (100.0%) | 0 (0.0%) |
| 65 to 74 Years | 2 (100.0%) | 0 (0.0%) |
| 75 Years and older | 3 (100.0%) | 0 (0.0%) |
| Total | 63 (92.6%) | 5 (7.3%) |
Health Insurance Coverage by Citizenship Status in Melstone
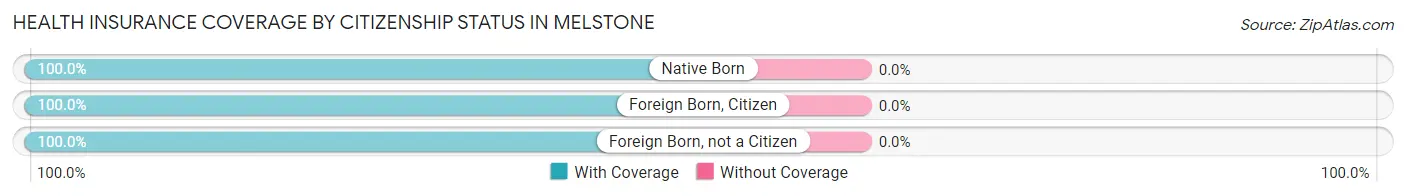
| Citizenship Status | With Coverage | Without Coverage |
| Native Born | 2 (100.0%) | 0 (0.0%) |
| Foreign Born, Citizen | 20 (100.0%) | 0 (0.0%) |
| Foreign Born, not a Citizen | 2 (100.0%) | 0 (0.0%) |
Health Insurance Coverage by Household Income in Melstone
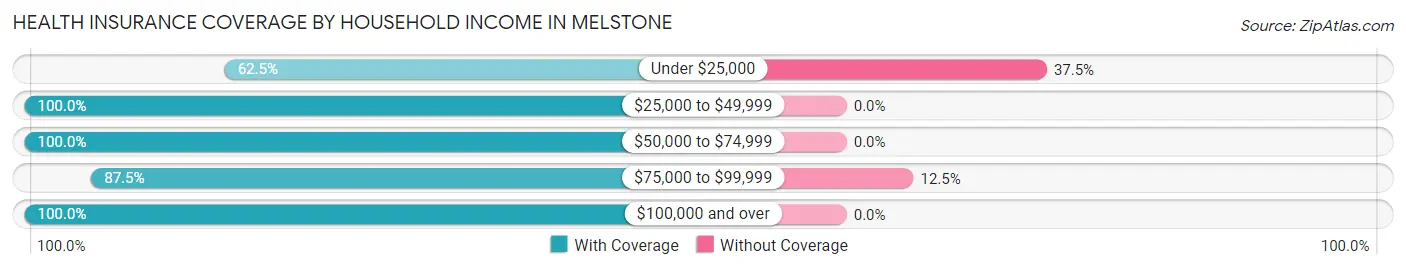
| Household Income | With Coverage | Without Coverage |
| Under $25,000 | 5 (62.5%) | 3 (37.5%) |
| $25,000 to $49,999 | 22 (100.0%) | 0 (0.0%) |
| $50,000 to $74,999 | 9 (100.0%) | 0 (0.0%) |
| $75,000 to $99,999 | 14 (87.5%) | 2 (12.5%) |
| $100,000 and over | 13 (100.0%) | 0 (0.0%) |
Public vs Private Health Insurance Coverage by Age in Melstone
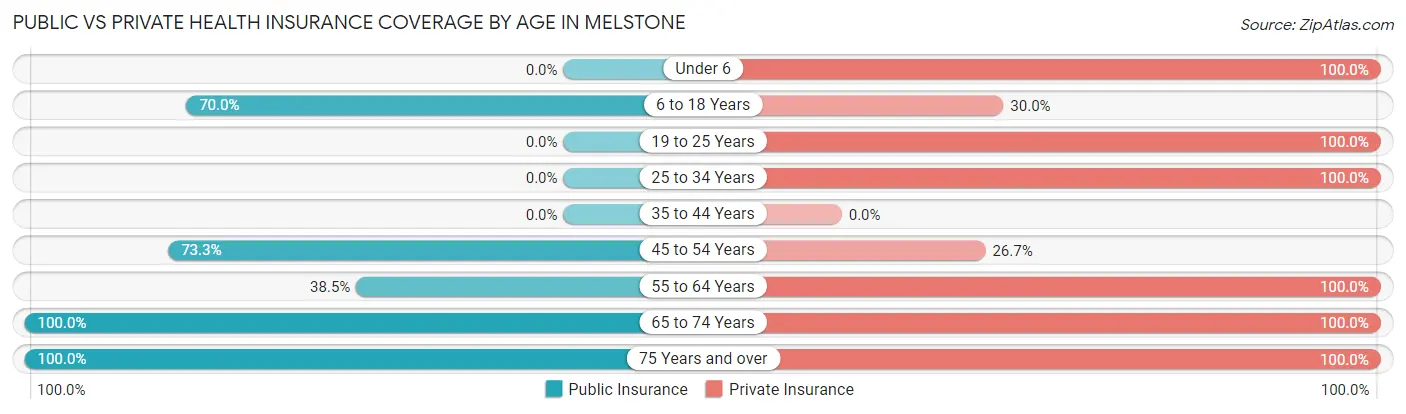
| Age Bracket | Public Insurance | Private Insurance |
| Under 6 | 0 (0.0%) | 2 (100.0%) |
| 6 to 18 Years | 14 (70.0%) | 6 (30.0%) |
| 19 to 25 Years | 0 (0.0%) | 2 (100.0%) |
| 25 to 34 Years | 0 (0.0%) | 6 (100.0%) |
| 35 to 44 Years | 0 (0.0%) | 0 (0.0%) |
| 45 to 54 Years | 11 (73.3%) | 4 (26.7%) |
| 55 to 64 Years | 5 (38.5%) | 13 (100.0%) |
| 65 to 74 Years | 2 (100.0%) | 2 (100.0%) |
| 75 Years and over | 3 (100.0%) | 3 (100.0%) |
| Total | 35 (51.5%) | 38 (55.9%) |
Disability Status by Sex by Age in Melstone
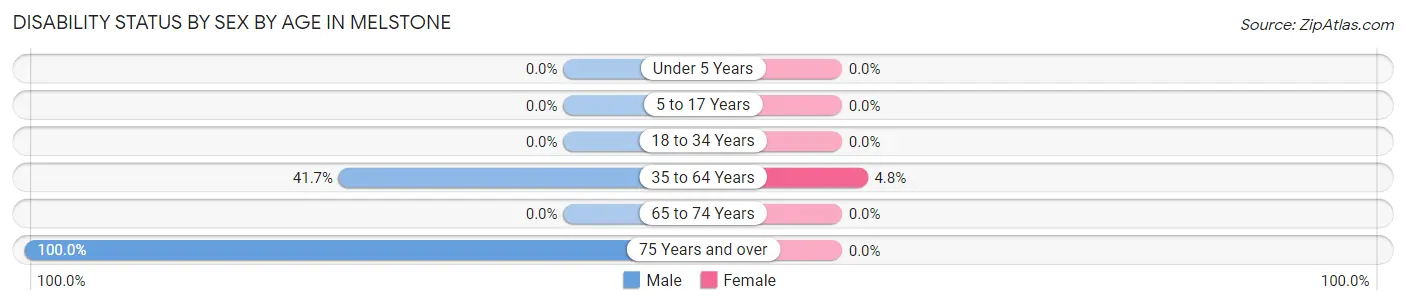
| Age Bracket | Male | Female |
| Under 5 Years | 0 (0.0%) | 0 (0.0%) |
| 5 to 17 Years | 0 (0.0%) | 0 (0.0%) |
| 18 to 34 Years | 0 (0.0%) | 0 (0.0%) |
| 35 to 64 Years | 5 (41.7%) | 1 (4.8%) |
| 65 to 74 Years | 0 (0.0%) | 0 (0.0%) |
| 75 Years and over | 3 (100.0%) | 0 (0.0%) |
Disability Class by Sex by Age in Melstone
Disability Class: Hearing Difficulty
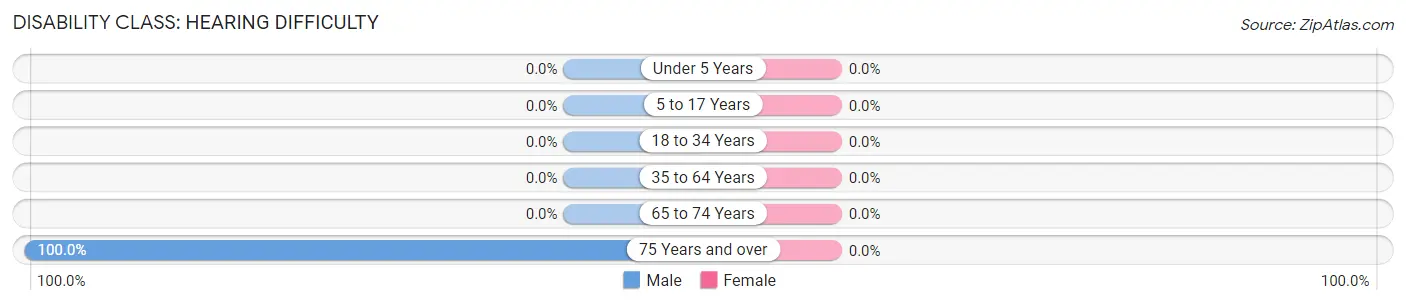
| Age Bracket | Male | Female |
| Under 5 Years | 0 (0.0%) | 0 (0.0%) |
| 5 to 17 Years | 0 (0.0%) | 0 (0.0%) |
| 18 to 34 Years | 0 (0.0%) | 0 (0.0%) |
| 35 to 64 Years | 0 (0.0%) | 0 (0.0%) |
| 65 to 74 Years | 0 (0.0%) | 0 (0.0%) |
| 75 Years and over | 3 (100.0%) | 0 (0.0%) |
Disability Class: Vision Difficulty
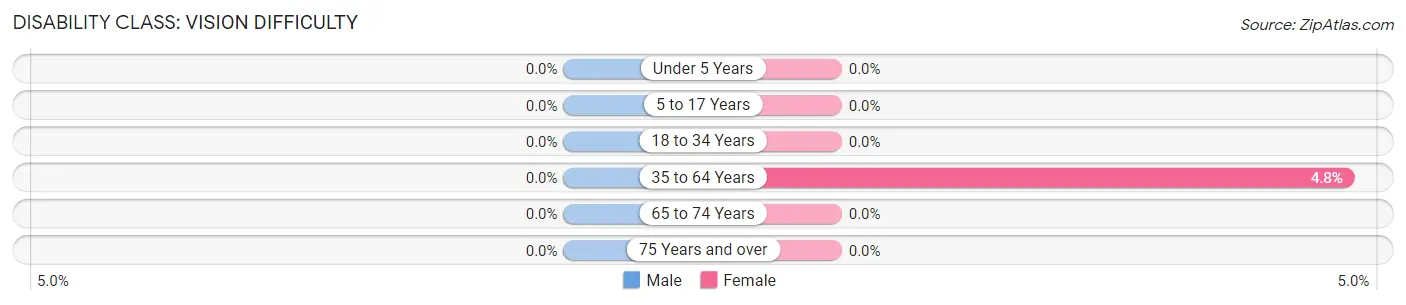
| Age Bracket | Male | Female |
| Under 5 Years | 0 (0.0%) | 0 (0.0%) |
| 5 to 17 Years | 0 (0.0%) | 0 (0.0%) |
| 18 to 34 Years | 0 (0.0%) | 0 (0.0%) |
| 35 to 64 Years | 0 (0.0%) | 1 (4.8%) |
| 65 to 74 Years | 0 (0.0%) | 0 (0.0%) |
| 75 Years and over | 0 (0.0%) | 0 (0.0%) |
Disability Class: Cognitive Difficulty
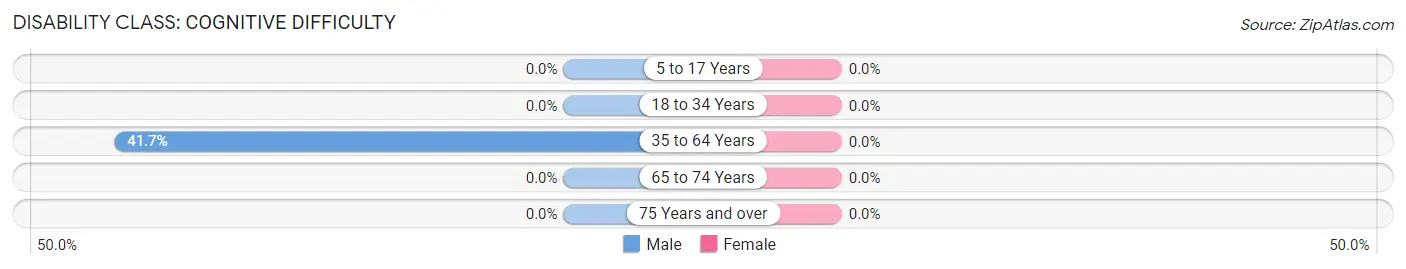
| Age Bracket | Male | Female |
| 5 to 17 Years | 0 (0.0%) | 0 (0.0%) |
| 18 to 34 Years | 0 (0.0%) | 0 (0.0%) |
| 35 to 64 Years | 5 (41.7%) | 0 (0.0%) |
| 65 to 74 Years | 0 (0.0%) | 0 (0.0%) |
| 75 Years and over | 0 (0.0%) | 0 (0.0%) |
Disability Class: Ambulatory Difficulty
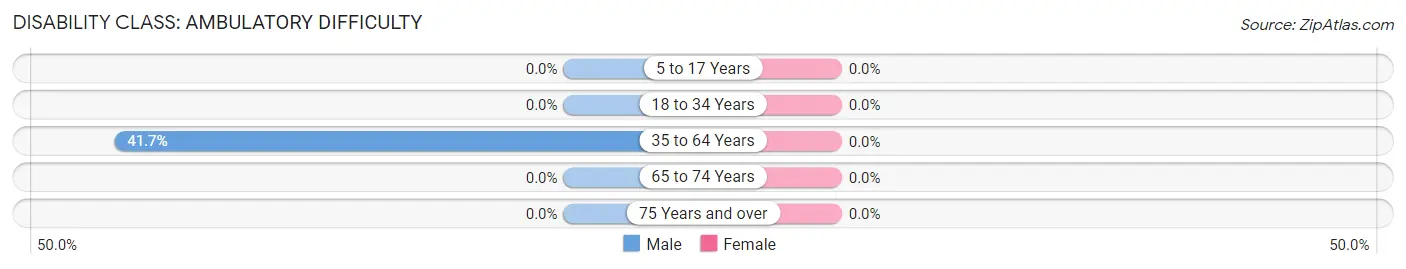
| Age Bracket | Male | Female |
| 5 to 17 Years | 0 (0.0%) | 0 (0.0%) |
| 18 to 34 Years | 0 (0.0%) | 0 (0.0%) |
| 35 to 64 Years | 5 (41.7%) | 0 (0.0%) |
| 65 to 74 Years | 0 (0.0%) | 0 (0.0%) |
| 75 Years and over | 0 (0.0%) | 0 (0.0%) |
Disability Class: Self-Care Difficulty
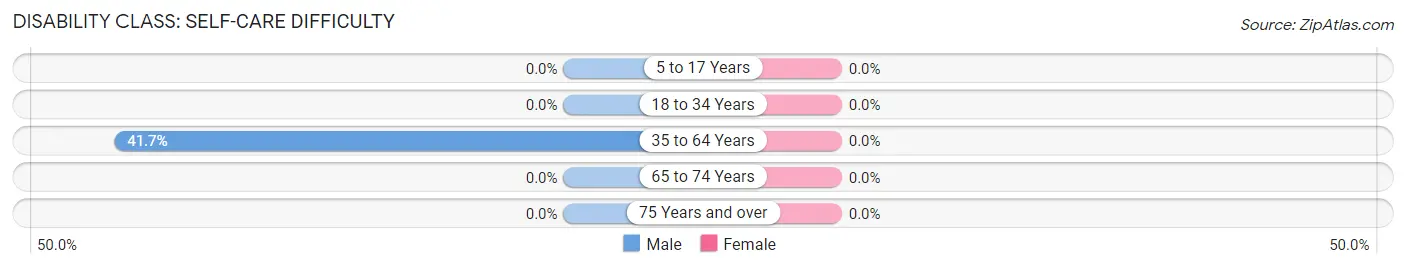
| Age Bracket | Male | Female |
| 5 to 17 Years | 0 (0.0%) | 0 (0.0%) |
| 18 to 34 Years | 0 (0.0%) | 0 (0.0%) |
| 35 to 64 Years | 5 (41.7%) | 0 (0.0%) |
| 65 to 74 Years | 0 (0.0%) | 0 (0.0%) |
| 75 Years and over | 0 (0.0%) | 0 (0.0%) |
Technology Access in Melstone
Computing Device Access in Melstone
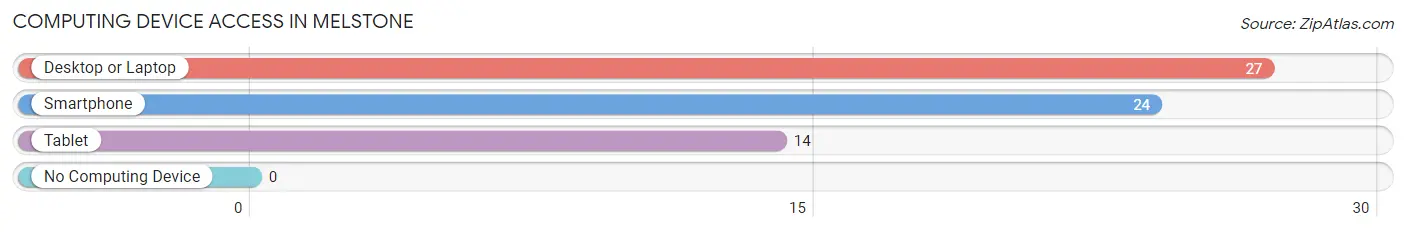
| Device Type | # Households | % Households |
| Desktop or Laptop | 27 | 84.4% |
| Smartphone | 24 | 75.0% |
| Tablet | 14 | 43.8% |
| No Computing Device | 0 | 0.0% |
| Total | 32 | 100.0% |
Internet Access in Melstone
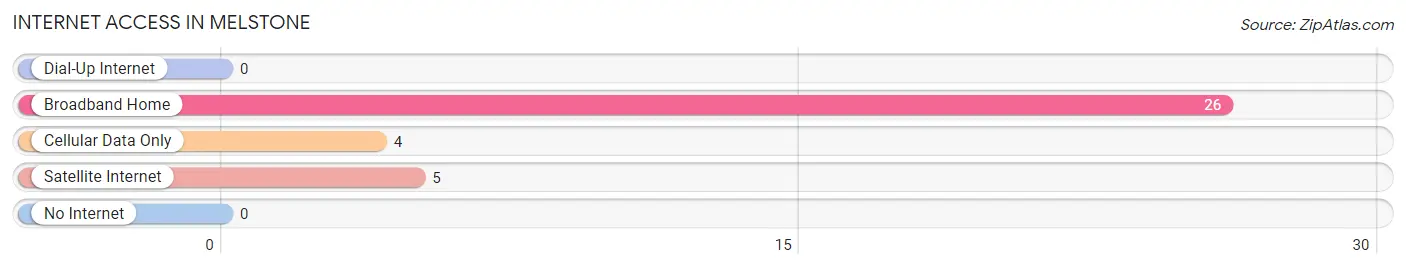
| Internet Type | # Households | % Households |
| Dial-Up Internet | 0 | 0.0% |
| Broadband Home | 26 | 81.2% |
| Cellular Data Only | 4 | 12.5% |
| Satellite Internet | 5 | 15.6% |
| No Internet | 0 | 0.0% |
| Total | 32 | 100.0% |
Melstone Summary
History
Melstone, Montana is a small town located in Musselshell County, Montana. It is situated on the banks of the Musselshell River, about 25 miles east of Roundup, Montana. The town was founded in 1882 by a group of homesteaders who were looking for a place to settle and raise their families. The town was named after Mel Stone, one of the original homesteaders.
The town grew slowly over the years, but it was not until the early 1900s that it began to really take off. In 1906, the Northern Pacific Railroad built a line through the town, connecting it to the larger cities of Billings and Miles City. This allowed for the transportation of goods and people, and it helped to spur the growth of the town.
In the early 1900s, Melstone was a bustling little town with a variety of businesses, including a bank, a hotel, a general store, a blacksmith, a livery stable, and a saloon. The town also had a school, a post office, and a newspaper.
The town continued to grow and prosper until the Great Depression hit in the 1930s. Many of the businesses in town closed, and the population began to decline. The town was able to survive, however, and it continued to be a small but vibrant community.
In the 1950s, the town began to experience a resurgence. The Northern Pacific Railroad was replaced by the Burlington Northern Railroad, and the town was connected to the larger cities of Billings and Miles City. This allowed for the transportation of goods and people, and it helped to spur the growth of the town.
The town continued to grow and prosper until the 1980s, when the economy began to decline. Many of the businesses in town closed, and the population began to decline. The town was able to survive, however, and it continues to be a small but vibrant community.
Geography
Melstone is located in Musselshell County, Montana. It is situated on the banks of the Musselshell River, about 25 miles east of Roundup, Montana. The town is located in the northern part of the state, and it is surrounded by rolling hills and prairies. The town is located at an elevation of 3,400 feet, and the climate is semi-arid.
The town is located in the Northern Great Plains region of the United States, and it is part of the Yellowstone River Valley. The town is located in the Yellowstone River watershed, and it is part of the larger Missouri River watershed.
Economy
The economy of Melstone is largely based on agriculture and ranching. The town is home to several large ranches, and the surrounding area is used for cattle and sheep grazing. The town is also home to several small businesses, including a grocery store, a hardware store, a restaurant, and a gas station.
The town is also home to a small manufacturing plant, which produces agricultural equipment. The town is also home to a small airport, which serves the surrounding area.
Demographics
As of the 2010 census, the population of Melstone was 545. The town is predominantly white, with a small Hispanic population. The median household income is $37,500, and the median age is 44. The town is home to a variety of religious denominations, including Catholic, Lutheran, and Methodist.
Common Questions
What is Per Capita Income in Melstone?
Per Capita income in Melstone is $30,075.
What is Inequality or Gini Index in Melstone?
Inequality or Gini Index in Melstone is 0.44.
What is the Total Population of Melstone?
Total Population of Melstone is 68.
What is the Total Male Population of Melstone?
Total Male Population of Melstone is 42.
What is the Total Female Population of Melstone?
Total Female Population of Melstone is 26.
What is the Ratio of Males per 100 Females in Melstone?
There are 161.54 Males per 100 Females in Melstone.
What is the Ratio of Females per 100 Males in Melstone?
There are 61.90 Females per 100 Males in Melstone.
What is the Median Population Age in Melstone?
Median Population Age in Melstone is 42.7 Years.
What is the Average Family Size in Melstone
Average Family Size in Melstone is 2.6 People.
What is the Average Household Size in Melstone
Average Household Size in Melstone is 2.1 People.
How Large is the Labor Force in Melstone?
There are 41 People in the Labor Forcein in Melstone.
What is the Percentage of People in the Labor Force in Melstone?
89.1% of People are in the Labor Force in Melstone.