Jupiter Farms, FL Map & Demographics
Jupiter Farms Map
Jupiter Farms Overview
$50,290
PER CAPITA INCOME
$144,063
AVG FAMILY INCOME
$135,334
AVG HOUSEHOLD INCOME
48.6%
WAGE / INCOME GAP [ % ]
51.4¢/ $1
WAGE / INCOME GAP [ $ ]
0.37
INEQUALITY / GINI INDEX
13,358
TOTAL POPULATION
6,959
MALE POPULATION
6,399
FEMALE POPULATION
108.75
MALES / 100 FEMALES
91.95
FEMALES / 100 MALES
43.1
MEDIAN AGE
3.4
AVG FAMILY SIZE
3.0
AVG HOUSEHOLD SIZE
6,916
LABOR FORCE [ PEOPLE ]
64.9%
PERCENT IN LABOR FORCE
2.8%
UNEMPLOYMENT RATE
Income in Jupiter Farms
Income Overview in Jupiter Farms
Per Capita Income in Jupiter Farms is $50,290, while median incomes of families and households are $144,063 and $135,334 respectively.
| Characteristic | Number | Measure |
| Per Capita Income | 13,358 | $50,290 |
| Median Family Income | 3,546 | $144,063 |
| Mean Family Income | 3,546 | $156,940 |
| Median Household Income | 4,379 | $135,334 |
| Mean Household Income | 4,379 | $148,403 |
| Income Deficit | 3,546 | $0 |
| Wage / Income Gap (%) | 13,358 | 48.58% |
| Wage / Income Gap ($) | 13,358 | 51.42¢ per $1 |
| Gini / Inequality Index | 13,358 | 0.37 |
Earnings by Sex in Jupiter Farms
Average Earnings in Jupiter Farms are $52,928, $67,904 for men and $34,916 for women, a difference of 48.6%.
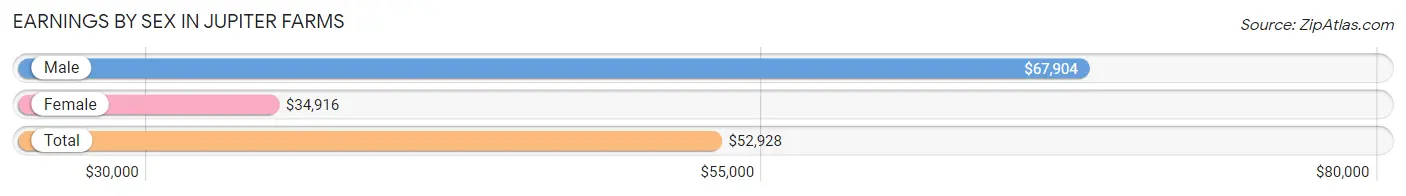
| Sex | Number | Average Earnings |
| Male | 3,995 (56.1%) | $67,904 |
| Female | 3,127 (43.9%) | $34,916 |
| Total | 7,122 (100.0%) | $52,928 |
Earnings by Sex by Income Bracket in Jupiter Farms
The most common earnings brackets in Jupiter Farms are $100,000+ for men (1,305 | 32.7%) and $55,000 to $64,999 for women (412 | 13.2%).
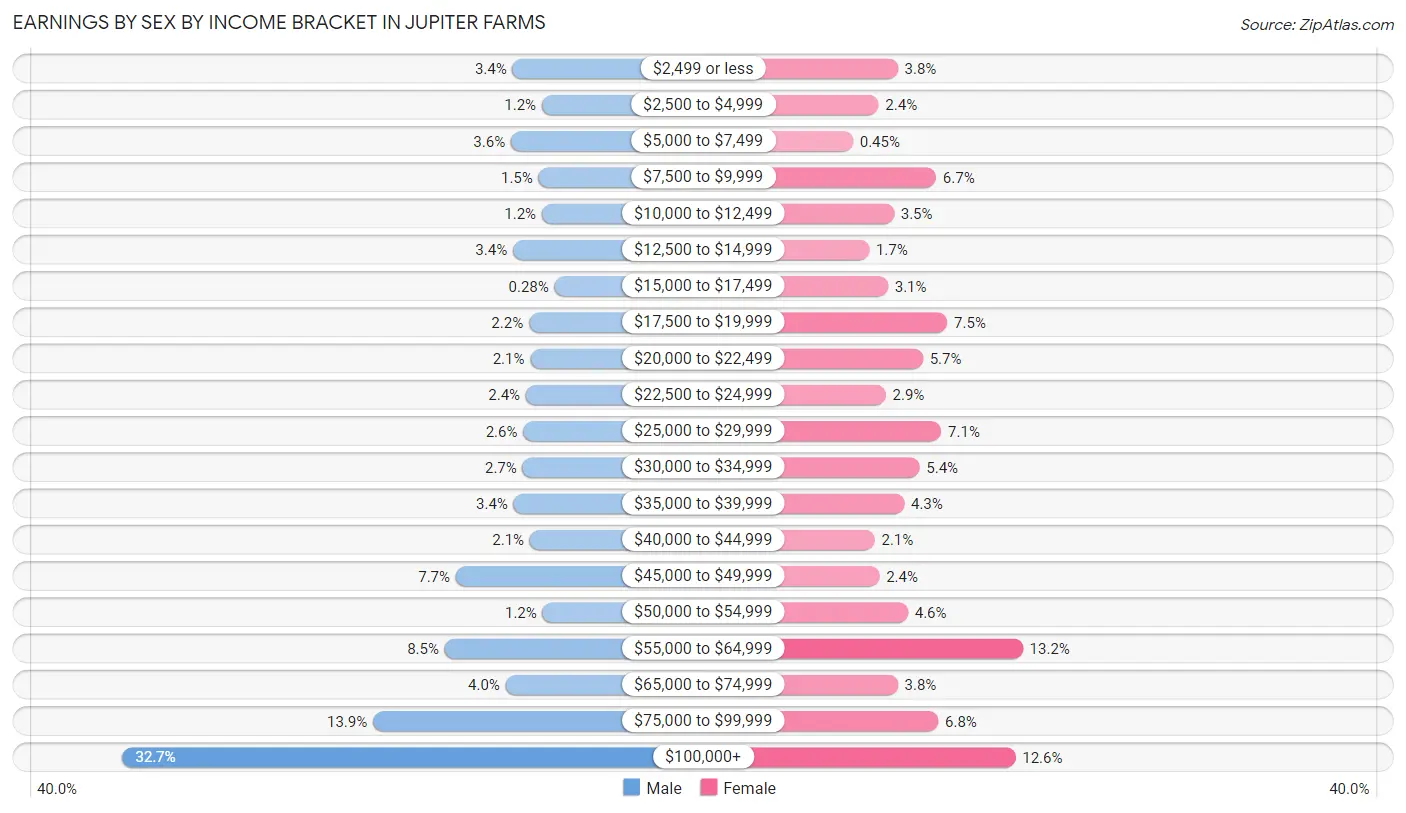
| Income | Male | Female |
| $2,499 or less | 137 (3.4%) | 119 (3.8%) |
| $2,500 to $4,999 | 49 (1.2%) | 74 (2.4%) |
| $5,000 to $7,499 | 142 (3.5%) | 14 (0.4%) |
| $7,500 to $9,999 | 59 (1.5%) | 209 (6.7%) |
| $10,000 to $12,499 | 49 (1.2%) | 110 (3.5%) |
| $12,500 to $14,999 | 136 (3.4%) | 52 (1.7%) |
| $15,000 to $17,499 | 11 (0.3%) | 96 (3.1%) |
| $17,500 to $19,999 | 88 (2.2%) | 235 (7.5%) |
| $20,000 to $22,499 | 84 (2.1%) | 178 (5.7%) |
| $22,500 to $24,999 | 97 (2.4%) | 91 (2.9%) |
| $25,000 to $29,999 | 105 (2.6%) | 221 (7.1%) |
| $30,000 to $34,999 | 107 (2.7%) | 170 (5.4%) |
| $35,000 to $39,999 | 134 (3.4%) | 134 (4.3%) |
| $40,000 to $44,999 | 85 (2.1%) | 65 (2.1%) |
| $45,000 to $49,999 | 307 (7.7%) | 76 (2.4%) |
| $50,000 to $54,999 | 47 (1.2%) | 143 (4.6%) |
| $55,000 to $64,999 | 340 (8.5%) | 412 (13.2%) |
| $65,000 to $74,999 | 158 (4.0%) | 119 (3.8%) |
| $75,000 to $99,999 | 555 (13.9%) | 214 (6.8%) |
| $100,000+ | 1,305 (32.7%) | 395 (12.6%) |
| Total | 3,995 (100.0%) | 3,127 (100.0%) |
Earnings by Sex by Educational Attainment in Jupiter Farms
Average earnings in Jupiter Farms are $76,821 for men and $40,427 for women, a difference of 47.4%. Men with an educational attainment of graduate degree enjoy the highest average annual earnings of $139,524, while those with less than high school education earn the least with $30,179. Women with an educational attainment of graduate degree earn the most with the average annual earnings of $62,193, while those with high school diploma education have the smallest earnings of $25,707.
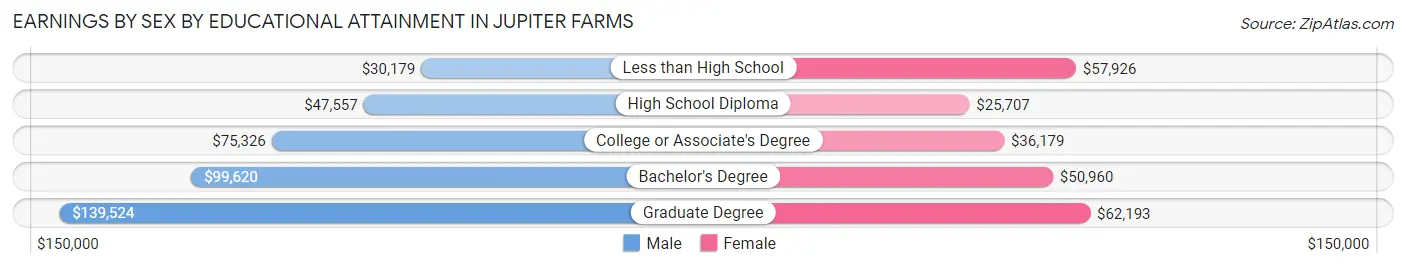
| Educational Attainment | Male Income | Female Income |
| Less than High School | $30,179 | $57,926 |
| High School Diploma | $47,557 | $25,707 |
| College or Associate's Degree | $75,326 | $36,179 |
| Bachelor's Degree | $99,620 | $50,960 |
| Graduate Degree | $139,524 | $62,193 |
| Total | $76,821 | $40,427 |
Family Income in Jupiter Farms
Family Income Brackets in Jupiter Farms
According to the Jupiter Farms family income data, there are 879 families falling into the $150,000 to $199,999 income range, which is the most common income bracket and makes up 24.8% of all families. Conversely, the less than $10,000 income bracket is the least frequent group with only 7 families (0.2%) belonging to this category.
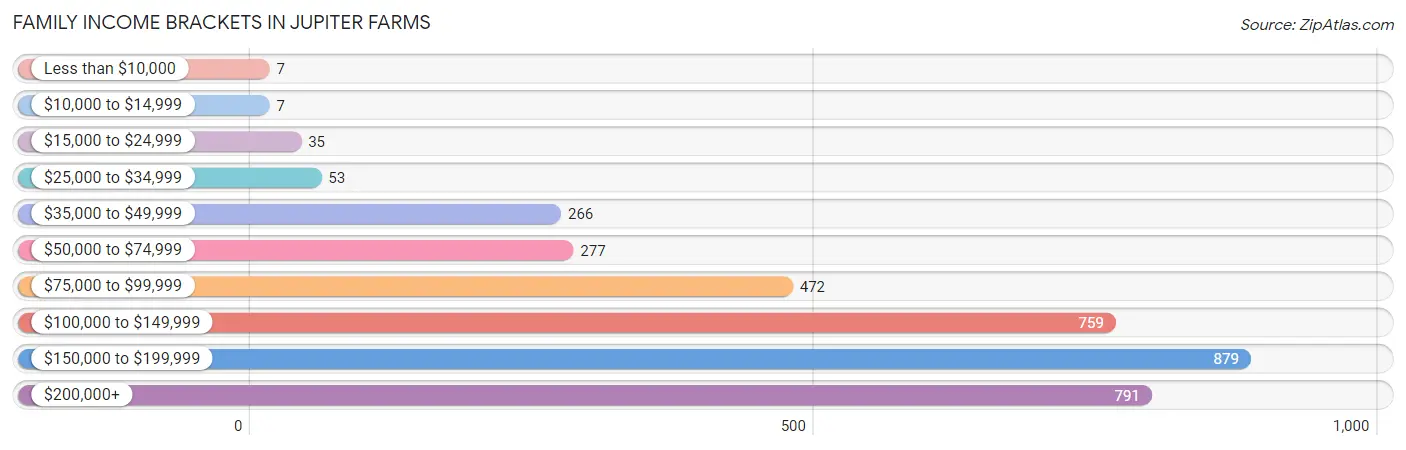
| Income Bracket | # Families | % Families |
| Less than $10,000 | 7 | 0.2% |
| $10,000 to $14,999 | 7 | 0.2% |
| $15,000 to $24,999 | 35 | 1.0% |
| $25,000 to $34,999 | 53 | 1.5% |
| $35,000 to $49,999 | 266 | 7.5% |
| $50,000 to $74,999 | 277 | 7.8% |
| $75,000 to $99,999 | 472 | 13.3% |
| $100,000 to $149,999 | 759 | 21.4% |
| $150,000 to $199,999 | 879 | 24.8% |
| $200,000+ | 791 | 22.3% |
Family Income by Famaliy Size in Jupiter Farms
7+ person families (20 | 0.6%) account for the highest median family income in Jupiter Farms with $222,143 per family, while 2-person families (1,377 | 38.8%) have the highest median income of $65,032 per family member.
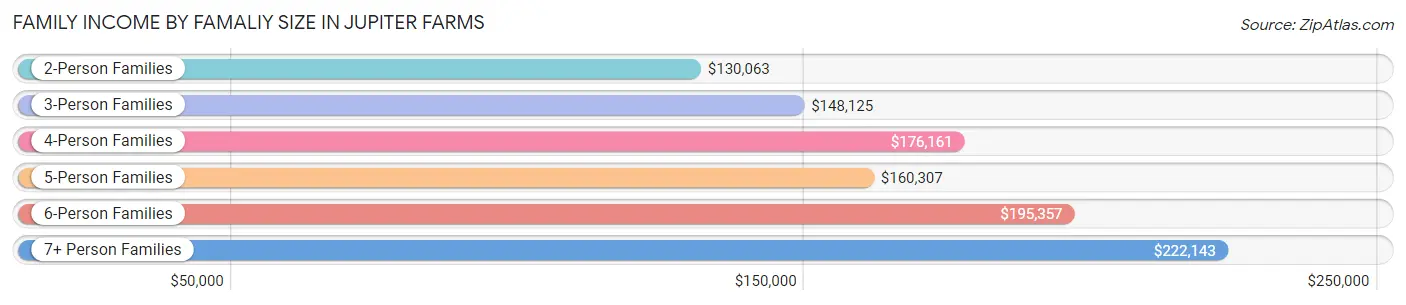
| Income Bracket | # Families | Median Income |
| 2-Person Families | 1,377 (38.8%) | $130,063 |
| 3-Person Families | 899 (25.4%) | $148,125 |
| 4-Person Families | 909 (25.6%) | $176,161 |
| 5-Person Families | 241 (6.8%) | $160,307 |
| 6-Person Families | 100 (2.8%) | $195,357 |
| 7+ Person Families | 20 (0.6%) | $222,143 |
| Total | 3,546 (100.0%) | $144,063 |
Family Income by Number of Earners in Jupiter Farms
The median family income in Jupiter Farms is $144,063, with families comprising 3+ earners (390) having the highest median family income of $196,607, while families with no earners (432) have the lowest median family income of $95,250, accounting for 11.0% and 12.2% of families, respectively.
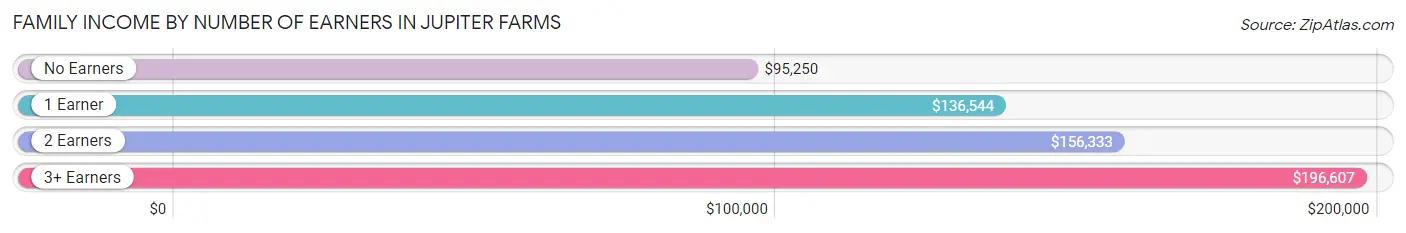
| Number of Earners | # Families | Median Income |
| No Earners | 432 (12.2%) | $95,250 |
| 1 Earner | 892 (25.2%) | $136,544 |
| 2 Earners | 1,832 (51.7%) | $156,333 |
| 3+ Earners | 390 (11.0%) | $196,607 |
| Total | 3,546 (100.0%) | $144,063 |
Household Income in Jupiter Farms
Household Income Brackets in Jupiter Farms
With 959 households falling in the category, the $150,000 to $199,999 income range is the most frequent in Jupiter Farms, accounting for 21.9% of all households. In contrast, only 31 households (0.7%) fall into the $10,000 to $14,999 income bracket, making it the least populous group.
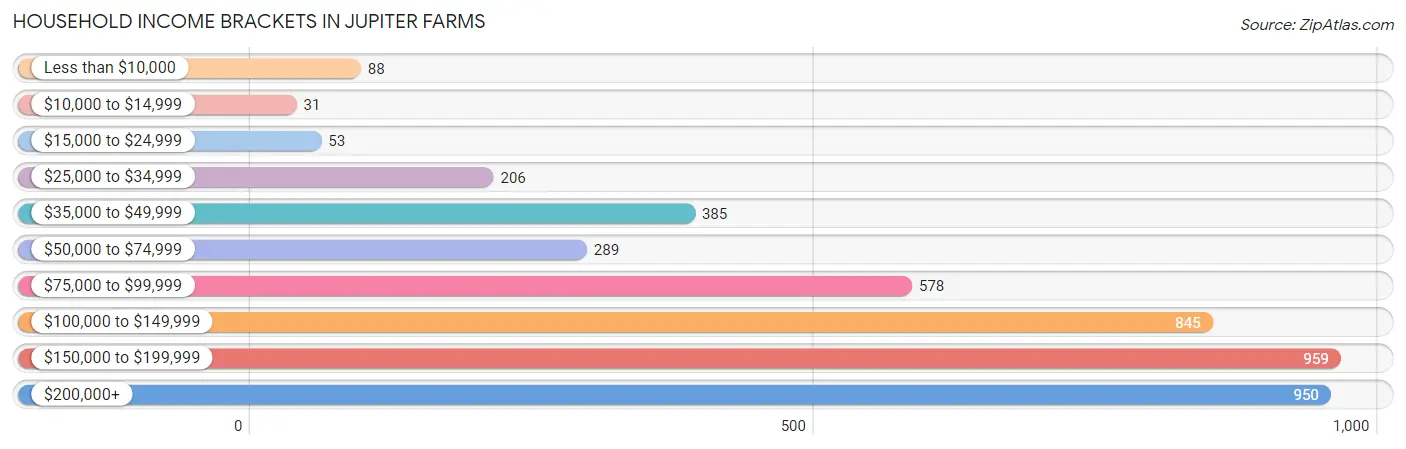
| Income Bracket | # Households | % Households |
| Less than $10,000 | 88 | 2.0% |
| $10,000 to $14,999 | 31 | 0.7% |
| $15,000 to $24,999 | 53 | 1.2% |
| $25,000 to $34,999 | 206 | 4.7% |
| $35,000 to $49,999 | 385 | 8.8% |
| $50,000 to $74,999 | 289 | 6.6% |
| $75,000 to $99,999 | 578 | 13.2% |
| $100,000 to $149,999 | 845 | 19.3% |
| $150,000 to $199,999 | 959 | 21.9% |
| $200,000+ | 950 | 21.7% |
Household Income by Householder Age in Jupiter Farms
The median household income in Jupiter Farms is $135,334, with the highest median household income of $160,123 found in the 25 to 44 years age bracket for the primary householder. A total of 1,138 households (26.0%) fall into this category. Meanwhile, the 15 to 24 years age bracket for the primary householder has the lowest median household income of $0, with 17 households (0.4%) in this group.
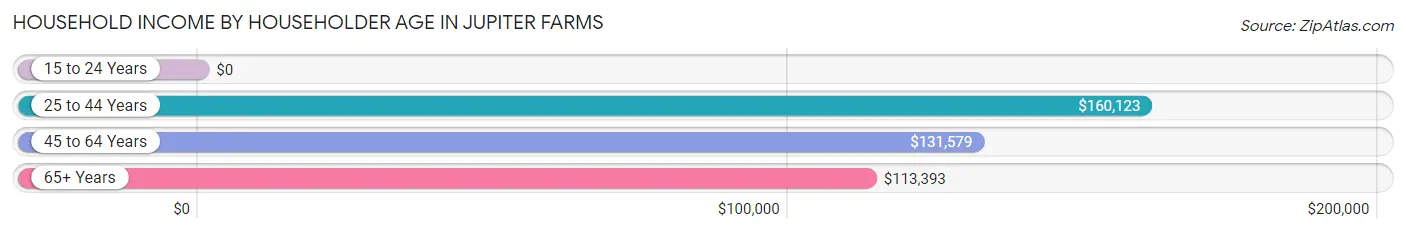
| Income Bracket | # Households | Median Income |
| 15 to 24 Years | 17 (0.4%) | $0 |
| 25 to 44 Years | 1,138 (26.0%) | $160,123 |
| 45 to 64 Years | 2,204 (50.3%) | $131,579 |
| 65+ Years | 1,020 (23.3%) | $113,393 |
| Total | 4,379 (100.0%) | $135,334 |
Poverty in Jupiter Farms
Income Below Poverty by Sex and Age in Jupiter Farms
With 2.6% poverty level for males and 2.4% for females among the residents of Jupiter Farms, 18 to 24 year old males and 18 to 24 year old females are the most vulnerable to poverty, with 54 males (10.3%) and 22 females (6.2%) in their respective age groups living below the poverty level.
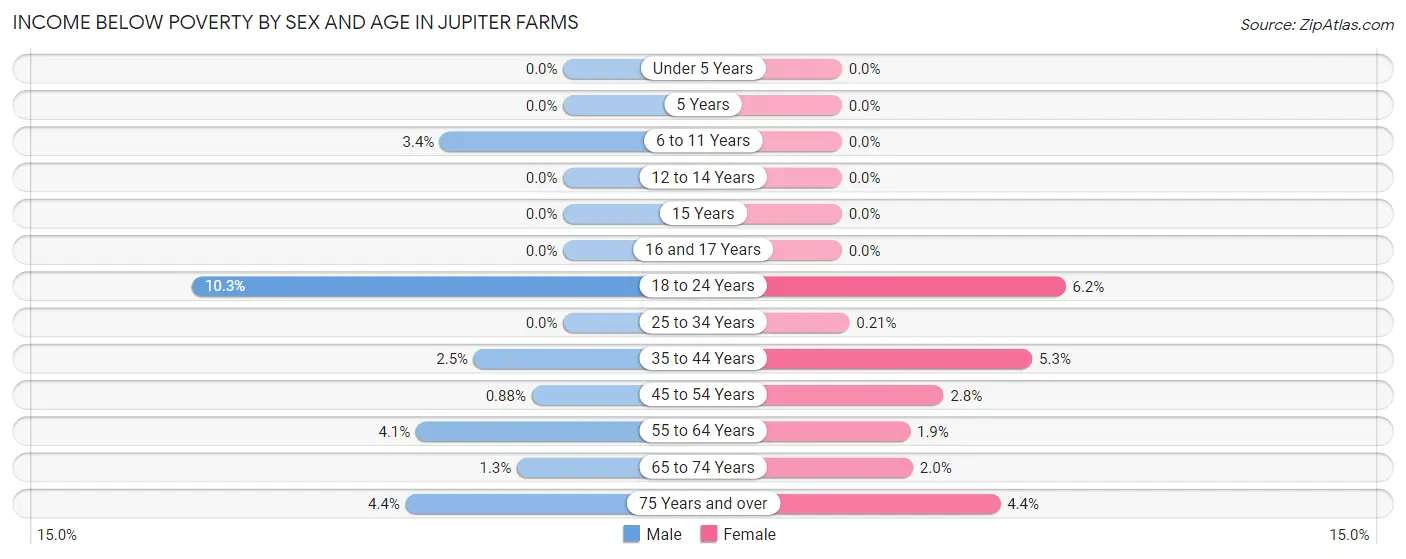
| Age Bracket | Male | Female |
| Under 5 Years | 0 (0.0%) | 0 (0.0%) |
| 5 Years | 0 (0.0%) | 0 (0.0%) |
| 6 to 11 Years | 15 (3.4%) | 0 (0.0%) |
| 12 to 14 Years | 0 (0.0%) | 0 (0.0%) |
| 15 Years | 0 (0.0%) | 0 (0.0%) |
| 16 and 17 Years | 0 (0.0%) | 0 (0.0%) |
| 18 to 24 Years | 54 (10.3%) | 22 (6.2%) |
| 25 to 34 Years | 0 (0.0%) | 1 (0.2%) |
| 35 to 44 Years | 29 (2.5%) | 46 (5.3%) |
| 45 to 54 Years | 7 (0.9%) | 28 (2.8%) |
| 55 to 64 Years | 53 (4.1%) | 20 (1.9%) |
| 65 to 74 Years | 9 (1.3%) | 17 (2.0%) |
| 75 Years and over | 15 (4.4%) | 19 (4.4%) |
| Total | 182 (2.6%) | 153 (2.4%) |
Income Above Poverty by Sex and Age in Jupiter Farms
According to the poverty statistics in Jupiter Farms, males aged under 5 years and females aged under 5 years are the age groups that are most secure financially, with 100.0% of males and 100.0% of females in these age groups living above the poverty line.
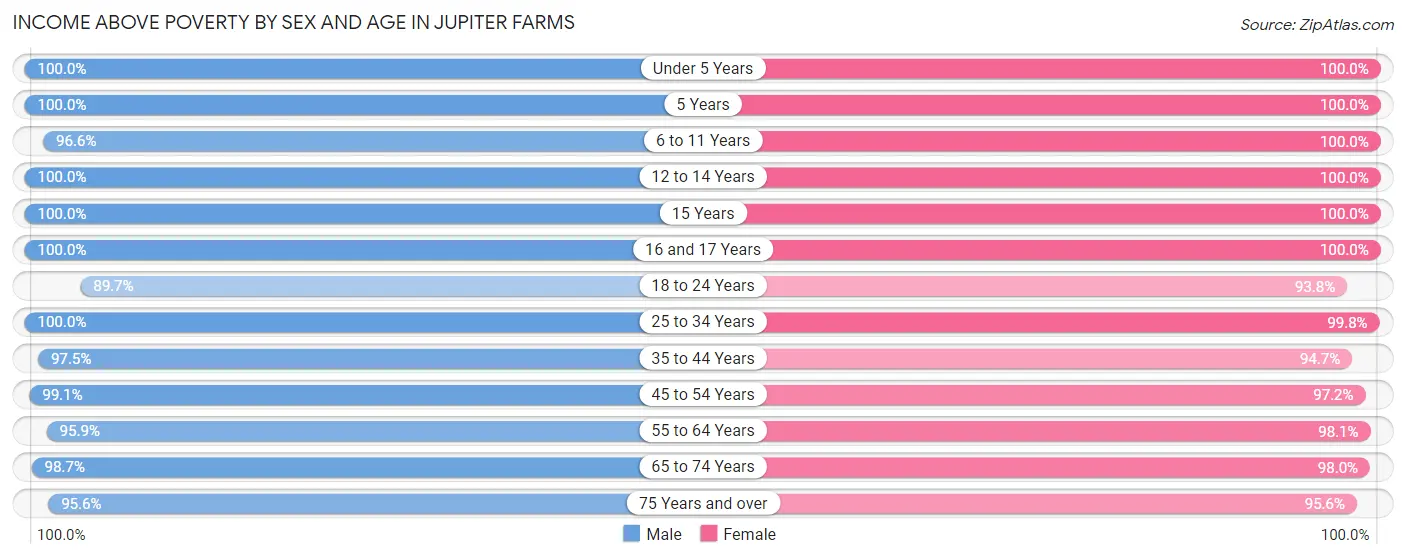
| Age Bracket | Male | Female |
| Under 5 Years | 479 (100.0%) | 530 (100.0%) |
| 5 Years | 28 (100.0%) | 106 (100.0%) |
| 6 to 11 Years | 422 (96.6%) | 430 (100.0%) |
| 12 to 14 Years | 258 (100.0%) | 187 (100.0%) |
| 15 Years | 86 (100.0%) | 57 (100.0%) |
| 16 and 17 Years | 136 (100.0%) | 43 (100.0%) |
| 18 to 24 Years | 468 (89.7%) | 331 (93.8%) |
| 25 to 34 Years | 626 (100.0%) | 477 (99.8%) |
| 35 to 44 Years | 1,138 (97.5%) | 822 (94.7%) |
| 45 to 54 Years | 791 (99.1%) | 963 (97.2%) |
| 55 to 64 Years | 1,241 (95.9%) | 1,034 (98.1%) |
| 65 to 74 Years | 687 (98.7%) | 840 (98.0%) |
| 75 Years and over | 327 (95.6%) | 412 (95.6%) |
| Total | 6,687 (97.4%) | 6,232 (97.6%) |
Income Below Poverty Among Married-Couple Families in Jupiter Farms
The poverty statistics for married-couple families in Jupiter Farms show that 0.4% or 14 of the total 3,086 families live below the poverty line. Families with 1 or 2 children have the highest poverty rate of 0.6%, comprising of 7 families. On the other hand, families with 3 or 4 children have the lowest poverty rate of 0.0%, which includes 0 families.
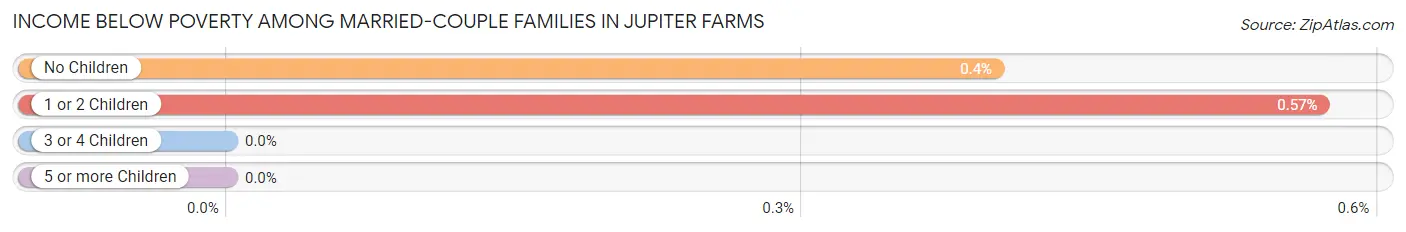
| Children | Above Poverty | Below Poverty |
| No Children | 1,731 (99.6%) | 7 (0.4%) |
| 1 or 2 Children | 1,212 (99.4%) | 7 (0.6%) |
| 3 or 4 Children | 116 (100.0%) | 0 (0.0%) |
| 5 or more Children | 13 (100.0%) | 0 (0.0%) |
| Total | 3,072 (99.6%) | 14 (0.4%) |
Income Below Poverty Among Single-Parent Households in Jupiter Farms
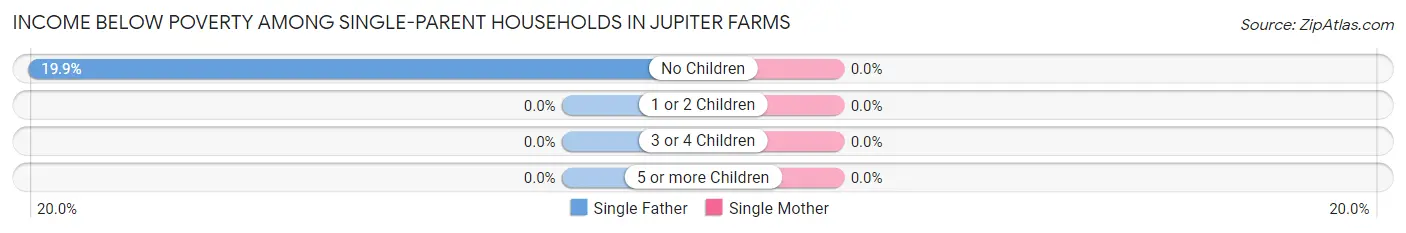
| Children | Single Father | Single Mother |
| No Children | 28 (19.9%) | 0 (0.0%) |
| 1 or 2 Children | 0 (0.0%) | 0 (0.0%) |
| 3 or 4 Children | 0 (0.0%) | 0 (0.0%) |
| 5 or more Children | 0 (0.0%) | 0 (0.0%) |
| Total | 28 (16.3%) | 0 (0.0%) |
Income Below Poverty Among Married-Couple vs Single-Parent Households in Jupiter Farms
The poverty data for Jupiter Farms shows that 14 of the married-couple family households (0.4%) and 28 of the single-parent households (6.1%) are living below the poverty level. Within the married-couple family households, those with 1 or 2 children have the highest poverty rate, with 7 households (0.6%) falling below the poverty line. Among the single-parent households, those with no children have the highest poverty rate, with 28 household (10.3%) living below poverty.
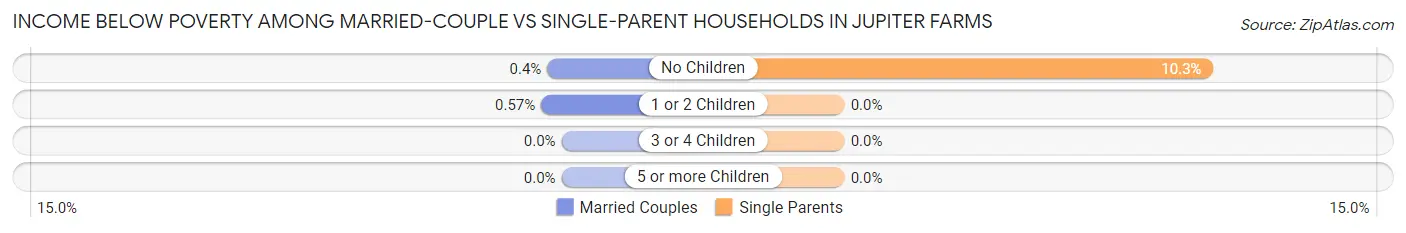
| Children | Married-Couple Families | Single-Parent Households |
| No Children | 7 (0.4%) | 28 (10.3%) |
| 1 or 2 Children | 7 (0.6%) | 0 (0.0%) |
| 3 or 4 Children | 0 (0.0%) | 0 (0.0%) |
| 5 or more Children | 0 (0.0%) | 0 (0.0%) |
| Total | 14 (0.4%) | 28 (6.1%) |
Race in Jupiter Farms
The most populous races in Jupiter Farms are White / Caucasian (11,169 | 83.6%), Two or more Races (1,579 | 11.8%), and Hispanic or Latino (1,108 | 8.3%).
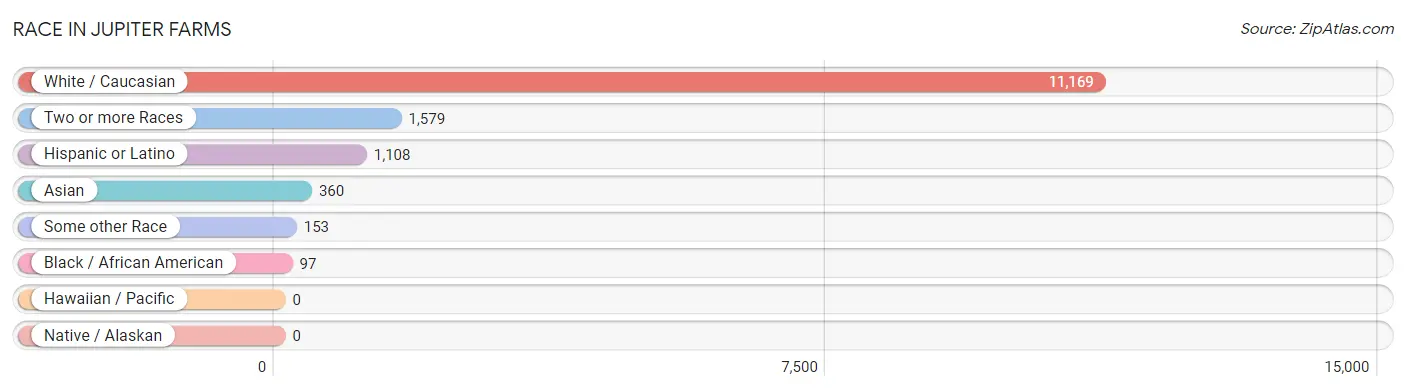
| Race | # Population | % Population |
| Asian | 360 | 2.7% |
| Black / African American | 97 | 0.7% |
| Hawaiian / Pacific | 0 | 0.0% |
| Hispanic or Latino | 1,108 | 8.3% |
| Native / Alaskan | 0 | 0.0% |
| White / Caucasian | 11,169 | 83.6% |
| Two or more Races | 1,579 | 11.8% |
| Some other Race | 153 | 1.1% |
| Total | 13,358 | 100.0% |
Ancestry in Jupiter Farms
The most populous ancestries reported in Jupiter Farms are German (2,097 | 15.7%), English (1,991 | 14.9%), Irish (1,891 | 14.2%), Italian (1,044 | 7.8%), and American (919 | 6.9%), together accounting for 59.5% of all Jupiter Farms residents.
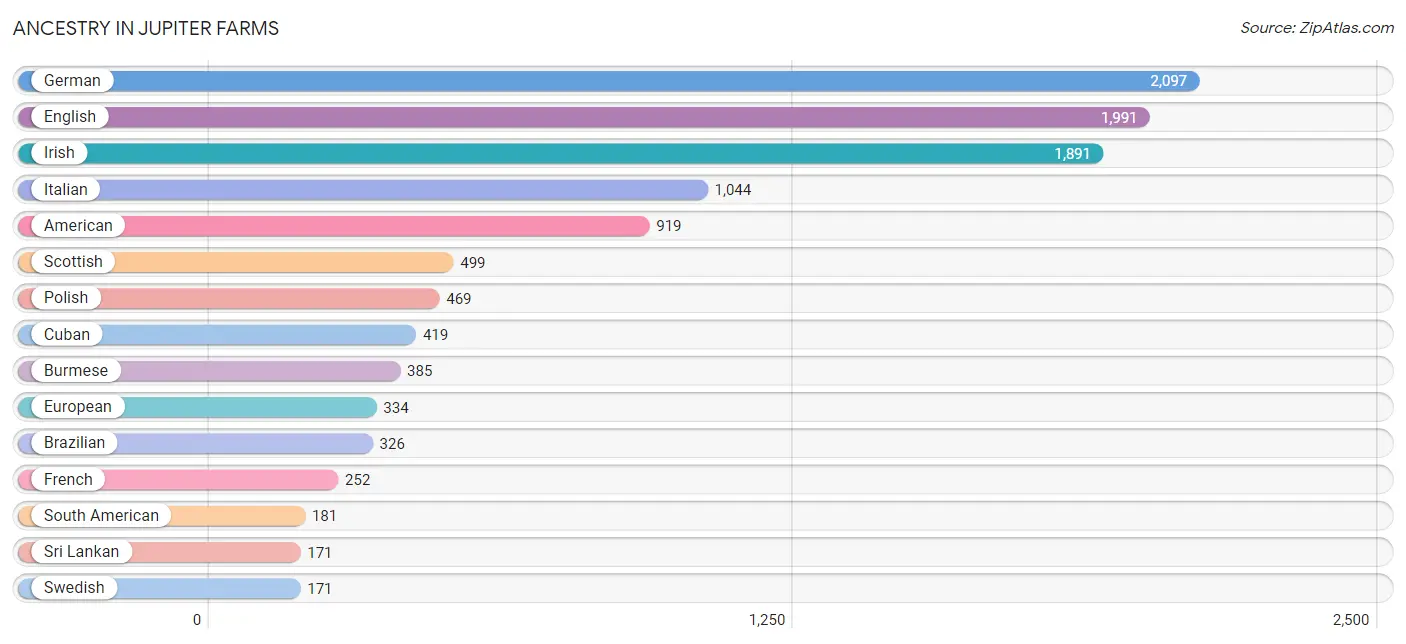
| Ancestry | # Population | % Population |
| American | 919 | 6.9% |
| Austrian | 146 | 1.1% |
| Belgian | 48 | 0.4% |
| Bhutanese | 116 | 0.9% |
| Brazilian | 326 | 2.4% |
| British | 108 | 0.8% |
| Burmese | 385 | 2.9% |
| Canadian | 128 | 1.0% |
| Central American | 25 | 0.2% |
| Cherokee | 4 | 0.0% |
| Colombian | 134 | 1.0% |
| Croatian | 26 | 0.2% |
| Cuban | 419 | 3.1% |
| Czech | 24 | 0.2% |
| Czechoslovakian | 64 | 0.5% |
| Danish | 20 | 0.2% |
| Dominican | 79 | 0.6% |
| Dutch | 151 | 1.1% |
| Eastern European | 147 | 1.1% |
| Ecuadorian | 18 | 0.1% |
| English | 1,991 | 14.9% |
| European | 334 | 2.5% |
| Finnish | 13 | 0.1% |
| French | 252 | 1.9% |
| French Canadian | 25 | 0.2% |
| German | 2,097 | 15.7% |
| Guyanese | 9 | 0.1% |
| Honduran | 25 | 0.2% |
| Hopi | 6 | 0.0% |
| Hungarian | 155 | 1.2% |
| Indian (Asian) | 95 | 0.7% |
| Indonesian | 29 | 0.2% |
| Irish | 1,891 | 14.2% |
| Israeli | 13 | 0.1% |
| Italian | 1,044 | 7.8% |
| Jamaican | 114 | 0.9% |
| Korean | 16 | 0.1% |
| Latvian | 10 | 0.1% |
| Lithuanian | 127 | 0.9% |
| Mexican | 162 | 1.2% |
| Norwegian | 117 | 0.9% |
| Peruvian | 29 | 0.2% |
| Polish | 469 | 3.5% |
| Portuguese | 26 | 0.2% |
| Puerto Rican | 141 | 1.1% |
| Russian | 88 | 0.7% |
| Scotch-Irish | 120 | 0.9% |
| Scottish | 499 | 3.7% |
| South American | 181 | 1.3% |
| Spaniard | 24 | 0.2% |
| Sri Lankan | 171 | 1.3% |
| Swedish | 171 | 1.3% |
| Swiss | 26 | 0.2% |
| Taiwanese | 27 | 0.2% |
| Welsh | 73 | 0.5% |
| West Indian | 23 | 0.2% | View All 56 Rows |
Immigrants in Jupiter Farms
The most numerous immigrant groups reported in Jupiter Farms came from Latin America (584 | 4.4%), South America (352 | 2.6%), Brazil (246 | 1.8%), Europe (217 | 1.6%), and Asia (216 | 1.6%), together accounting for 12.1% of all Jupiter Farms residents.
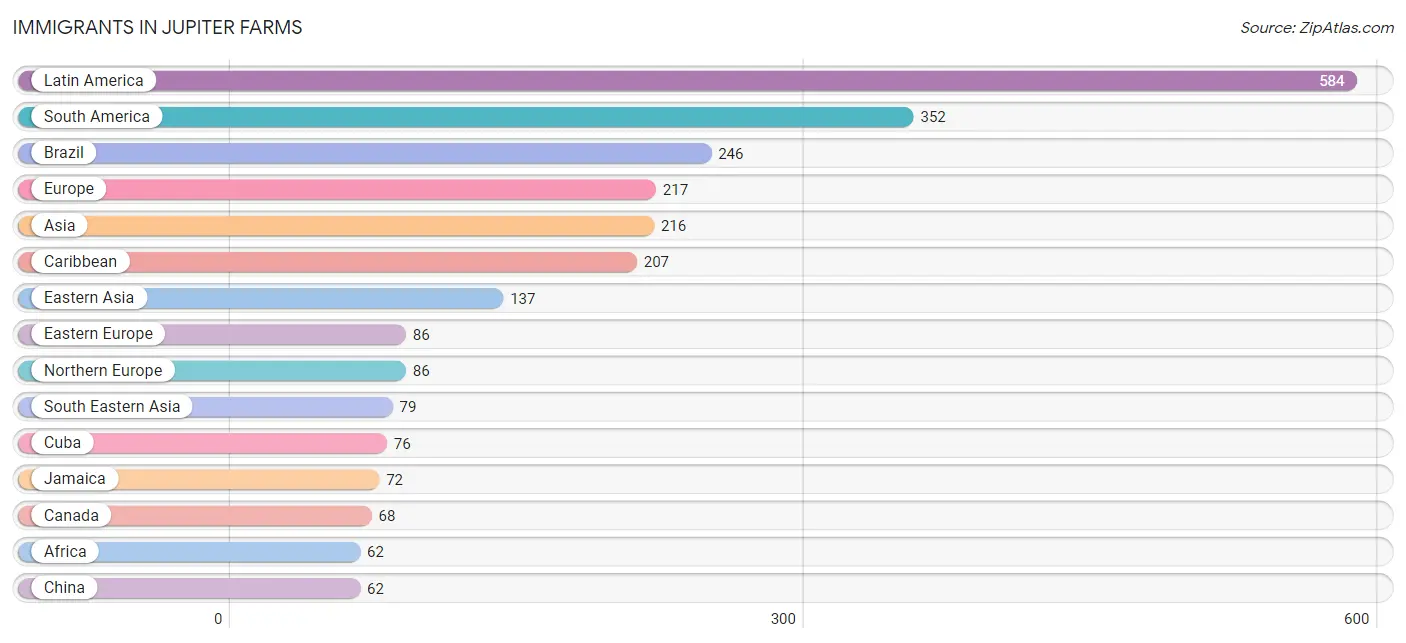
| Immigration Origin | # Population | % Population |
| Africa | 62 | 0.5% |
| Asia | 216 | 1.6% |
| Barbados | 4 | 0.0% |
| Belgium | 22 | 0.2% |
| Brazil | 246 | 1.8% |
| Canada | 68 | 0.5% |
| Caribbean | 207 | 1.5% |
| Central America | 25 | 0.2% |
| China | 62 | 0.5% |
| Colombia | 36 | 0.3% |
| Cuba | 76 | 0.6% |
| Czechoslovakia | 35 | 0.3% |
| Dominican Republic | 21 | 0.2% |
| Eastern Africa | 6 | 0.0% |
| Eastern Asia | 137 | 1.0% |
| Eastern Europe | 86 | 0.6% |
| Ecuador | 18 | 0.1% |
| England | 30 | 0.2% |
| Europe | 217 | 1.6% |
| Guyana | 9 | 0.1% |
| Honduras | 25 | 0.2% |
| Hong Kong | 15 | 0.1% |
| Jamaica | 72 | 0.5% |
| Japan | 19 | 0.1% |
| Korea | 56 | 0.4% |
| Latin America | 584 | 4.4% |
| Netherlands | 23 | 0.2% |
| Northern Europe | 86 | 0.6% |
| Peru | 30 | 0.2% |
| Philippines | 10 | 0.1% |
| Poland | 51 | 0.4% |
| South Africa | 56 | 0.4% |
| South America | 352 | 2.6% |
| South Eastern Asia | 79 | 0.6% |
| Sweden | 42 | 0.3% |
| Taiwan | 39 | 0.3% |
| Trinidad and Tobago | 23 | 0.2% |
| Vietnam | 57 | 0.4% |
| Western Europe | 45 | 0.3% |
| Zimbabwe | 6 | 0.0% | View All 40 Rows |
Sex and Age in Jupiter Farms
Sex and Age in Jupiter Farms
The most populous age groups in Jupiter Farms are 60 to 64 Years (784 | 11.3%) for men and 35 to 39 Years (592 | 9.2%) for women.
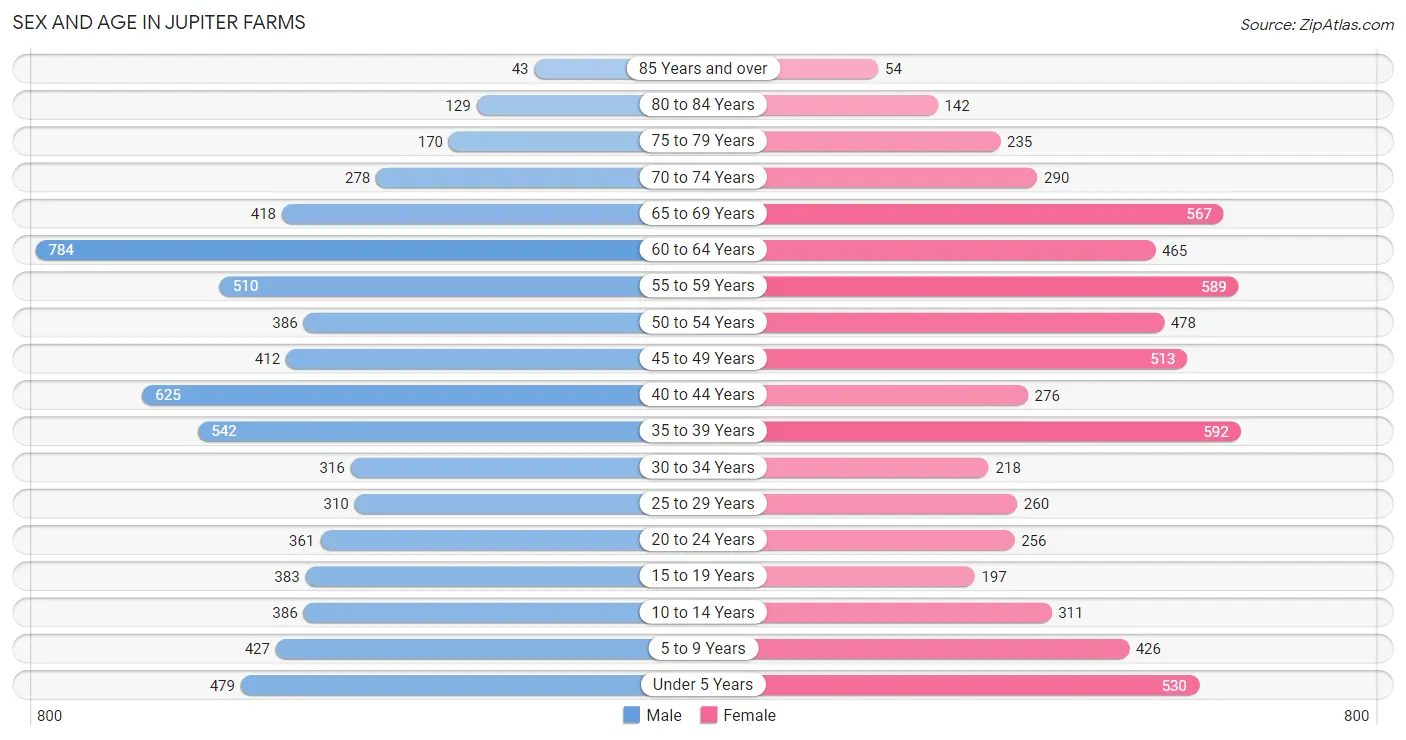
| Age Bracket | Male | Female |
| Under 5 Years | 479 (6.9%) | 530 (8.3%) |
| 5 to 9 Years | 427 (6.1%) | 426 (6.7%) |
| 10 to 14 Years | 386 (5.6%) | 311 (4.9%) |
| 15 to 19 Years | 383 (5.5%) | 197 (3.1%) |
| 20 to 24 Years | 361 (5.2%) | 256 (4.0%) |
| 25 to 29 Years | 310 (4.4%) | 260 (4.1%) |
| 30 to 34 Years | 316 (4.5%) | 218 (3.4%) |
| 35 to 39 Years | 542 (7.8%) | 592 (9.2%) |
| 40 to 44 Years | 625 (9.0%) | 276 (4.3%) |
| 45 to 49 Years | 412 (5.9%) | 513 (8.0%) |
| 50 to 54 Years | 386 (5.6%) | 478 (7.5%) |
| 55 to 59 Years | 510 (7.3%) | 589 (9.2%) |
| 60 to 64 Years | 784 (11.3%) | 465 (7.3%) |
| 65 to 69 Years | 418 (6.0%) | 567 (8.9%) |
| 70 to 74 Years | 278 (4.0%) | 290 (4.5%) |
| 75 to 79 Years | 170 (2.4%) | 235 (3.7%) |
| 80 to 84 Years | 129 (1.8%) | 142 (2.2%) |
| 85 Years and over | 43 (0.6%) | 54 (0.8%) |
| Total | 6,959 (100.0%) | 6,399 (100.0%) |
Families and Households in Jupiter Farms
Median Family Size in Jupiter Farms
The median family size in Jupiter Farms is 3.35 persons per family, with married-couple families (3,086 | 87.0%) accounting for the largest median family size of 3.4 persons per family. On the other hand, single male/father families (172 | 4.9%) represent the smallest median family size with 2.43 persons per family.
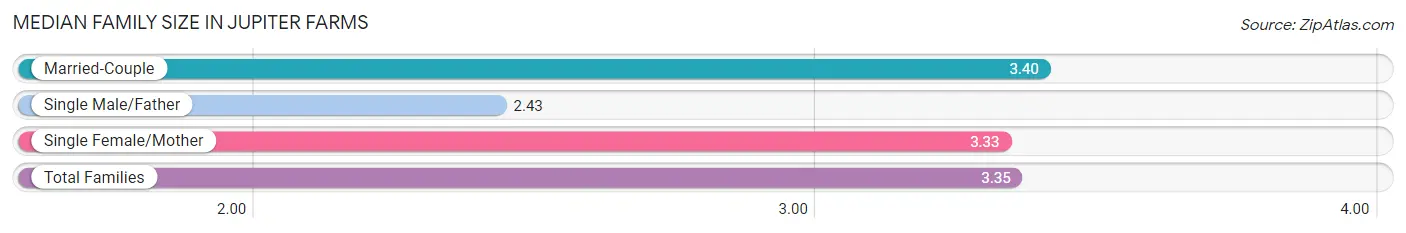
| Family Type | # Families | Family Size |
| Married-Couple | 3,086 (87.0%) | 3.40 |
| Single Male/Father | 172 (4.9%) | 2.43 |
| Single Female/Mother | 288 (8.1%) | 3.33 |
| Total Families | 3,546 (100.0%) | 3.35 |
Median Household Size in Jupiter Farms
The median household size in Jupiter Farms is 3.05 persons per household, with single female/mother households (288 | 6.6%) accounting for the largest median household size of 3.75 persons per household. non-family households (833 | 19.0%) represent the smallest median household size with 1.44 persons per household.
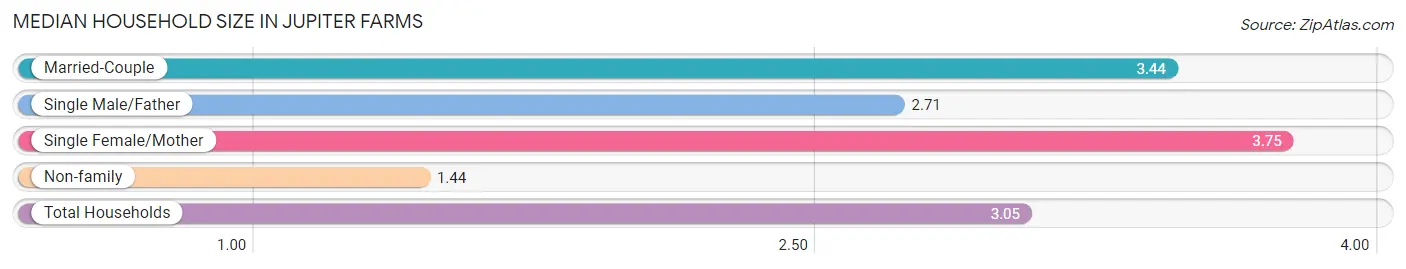
| Household Type | # Households | Household Size |
| Married-Couple | 3,086 (70.5%) | 3.44 |
| Single Male/Father | 172 (3.9%) | 2.71 |
| Single Female/Mother | 288 (6.6%) | 3.75 |
| Non-family | 833 (19.0%) | 1.44 |
| Total Households | 4,379 (100.0%) | 3.05 |
Household Size by Marriage Status in Jupiter Farms
Out of a total of 4,379 households in Jupiter Farms, 3,546 (81.0%) are family households, while 833 (19.0%) are nonfamily households. The most numerous type of family households are 2-person households, comprising 1,292, and the most common type of nonfamily households are 1-person households, comprising 600.
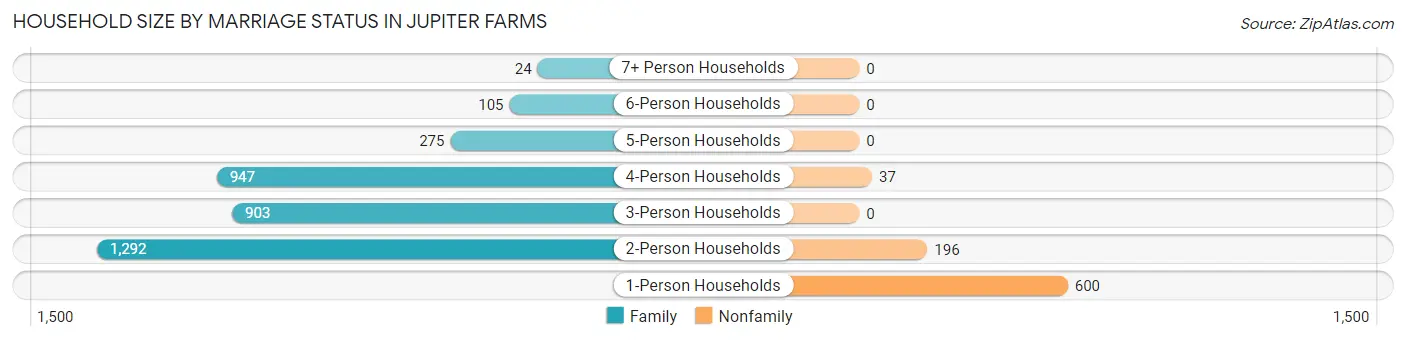
| Household Size | Family Households | Nonfamily Households |
| 1-Person Households | - | 600 (13.7%) |
| 2-Person Households | 1,292 (29.5%) | 196 (4.5%) |
| 3-Person Households | 903 (20.6%) | 0 (0.0%) |
| 4-Person Households | 947 (21.6%) | 37 (0.8%) |
| 5-Person Households | 275 (6.3%) | 0 (0.0%) |
| 6-Person Households | 105 (2.4%) | 0 (0.0%) |
| 7+ Person Households | 24 (0.5%) | 0 (0.0%) |
| Total | 3,546 (81.0%) | 833 (19.0%) |
Female Fertility in Jupiter Farms
Fertility by Age in Jupiter Farms
Average fertility rate in Jupiter Farms is 152.0 births per 1,000 women. Women in the age bracket of 20 to 34 years have the highest fertility rate with 169.0 births per 1,000 women. Women in the age bracket of 35 to 50 years acount for 65.5% of all women with births.
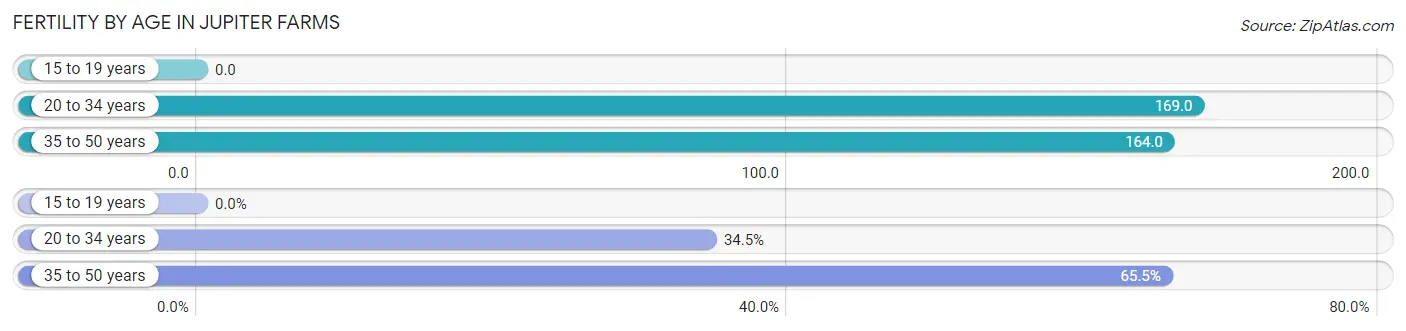
| Age Bracket | Women with Births | Births / 1,000 Women |
| 15 to 19 years | 0 (0.0%) | 0.0 |
| 20 to 34 years | 124 (34.5%) | 169.0 |
| 35 to 50 years | 235 (65.5%) | 164.0 |
| Total | 359 (100.0%) | 152.0 |
Fertility by Age by Marriage Status in Jupiter Farms
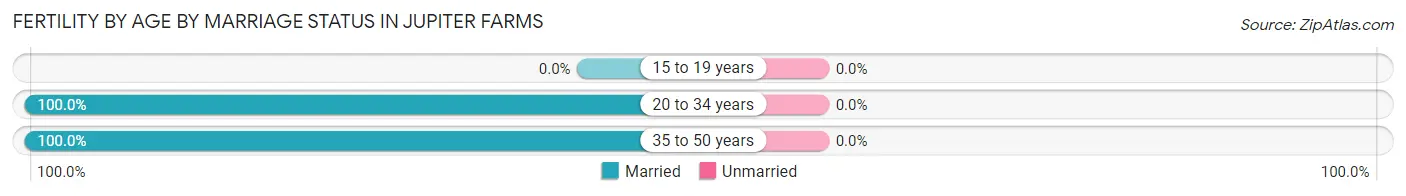
| Age Bracket | Married | Unmarried |
| 15 to 19 years | 0 (0.0%) | 0 (0.0%) |
| 20 to 34 years | 124 (100.0%) | 0 (0.0%) |
| 35 to 50 years | 235 (100.0%) | 0 (0.0%) |
| Total | 359 (100.0%) | 0 (0.0%) |
Fertility by Education in Jupiter Farms
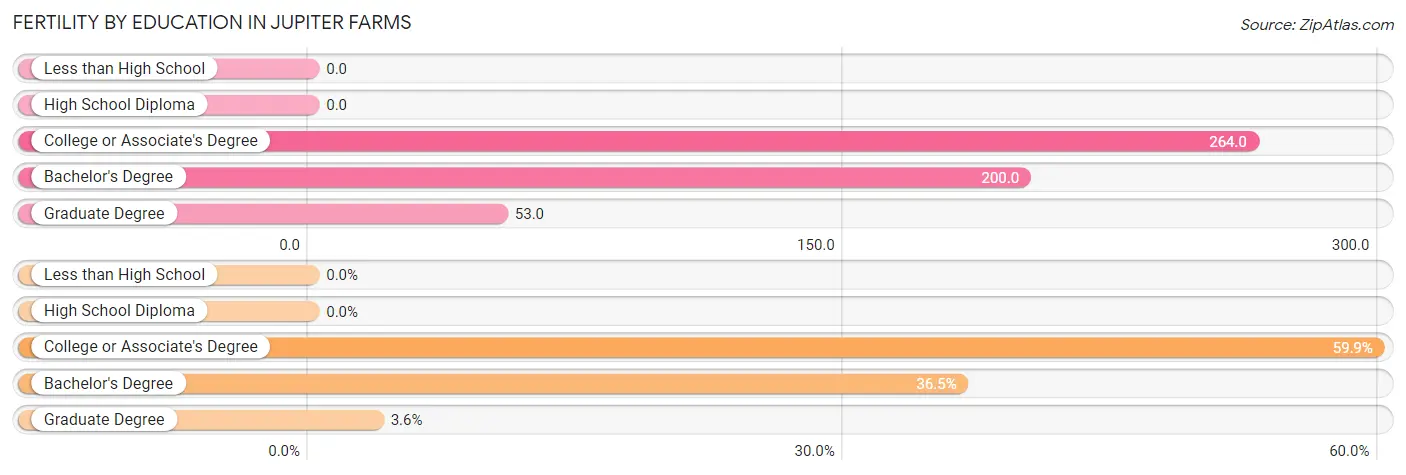
| Educational Attainment | Women with Births | Births / 1,000 Women |
| Less than High School | 0 (0.0%) | 0.0 |
| High School Diploma | 0 (0.0%) | 0.0 |
| College or Associate's Degree | 215 (59.9%) | 264.0 |
| Bachelor's Degree | 131 (36.5%) | 200.0 |
| Graduate Degree | 13 (3.6%) | 53.0 |
| Total | 359 (100.0%) | 152.0 |
Fertility by Education by Marriage Status in Jupiter Farms
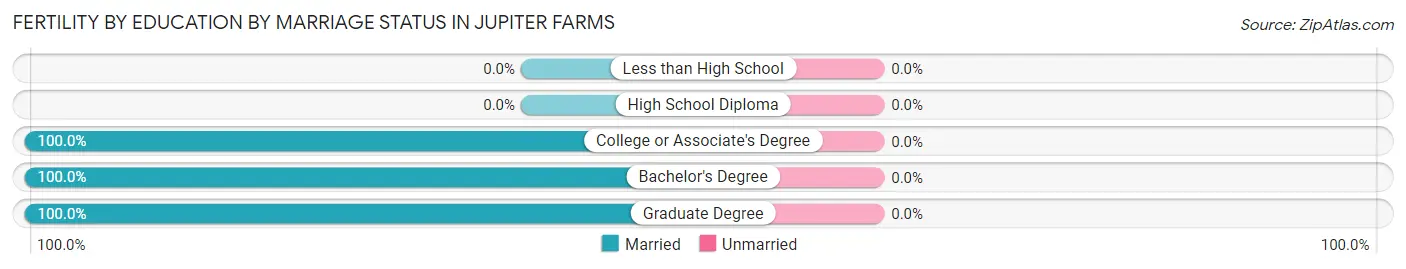
| Educational Attainment | Married | Unmarried |
| Less than High School | 0 (0.0%) | 0 (0.0%) |
| High School Diploma | 0 (0.0%) | 0 (0.0%) |
| College or Associate's Degree | 215 (100.0%) | 0 (0.0%) |
| Bachelor's Degree | 131 (100.0%) | 0 (0.0%) |
| Graduate Degree | 13 (100.0%) | 0 (0.0%) |
| Total | 359 (100.0%) | 0 (0.0%) |
Employment Characteristics in Jupiter Farms
Employment by Class of Employer in Jupiter Farms
Among the 6,579 employed individuals in Jupiter Farms, private company employees (4,193 | 63.7%), self-employed (incorporated) (1,037 | 15.8%), and local government employees (640 | 9.7%) make up the most common classes of employment.
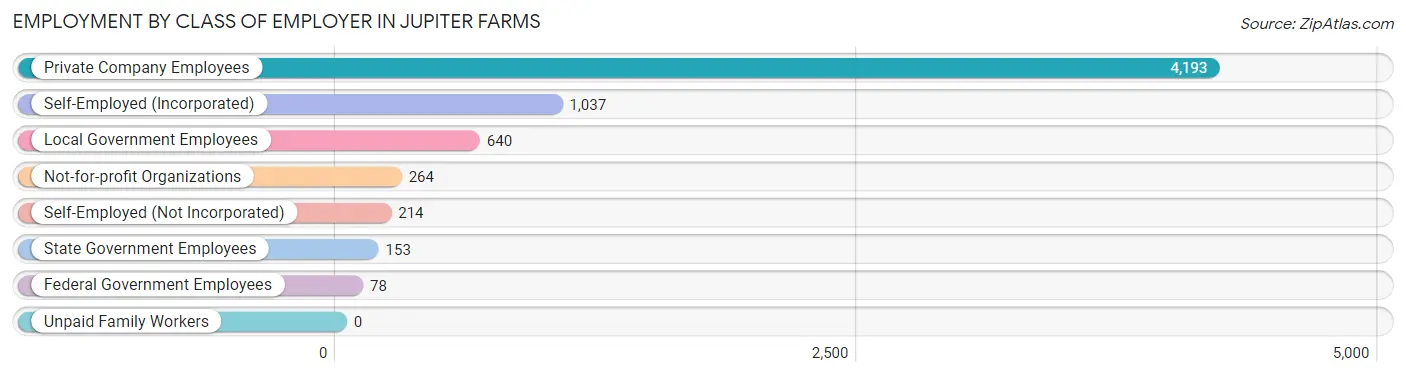
| Employer Class | # Employees | % Employees |
| Private Company Employees | 4,193 | 63.7% |
| Self-Employed (Incorporated) | 1,037 | 15.8% |
| Self-Employed (Not Incorporated) | 214 | 3.3% |
| Not-for-profit Organizations | 264 | 4.0% |
| Local Government Employees | 640 | 9.7% |
| State Government Employees | 153 | 2.3% |
| Federal Government Employees | 78 | 1.2% |
| Unpaid Family Workers | 0 | 0.0% |
| Total | 6,579 | 100.0% |
Employment Status by Age in Jupiter Farms
According to the labor force statistics for Jupiter Farms, out of the total population over 16 years of age (10,656), 64.9% or 6,916 individuals are in the labor force, with 2.8% or 194 of them unemployed. The age group with the highest labor force participation rate is 45 to 54 years, with 88.1% or 1,576 individuals in the labor force. Within the labor force, the 16 to 19 years age range has the highest percentage of unemployed individuals, with 24.9% or 44 of them being unemployed.
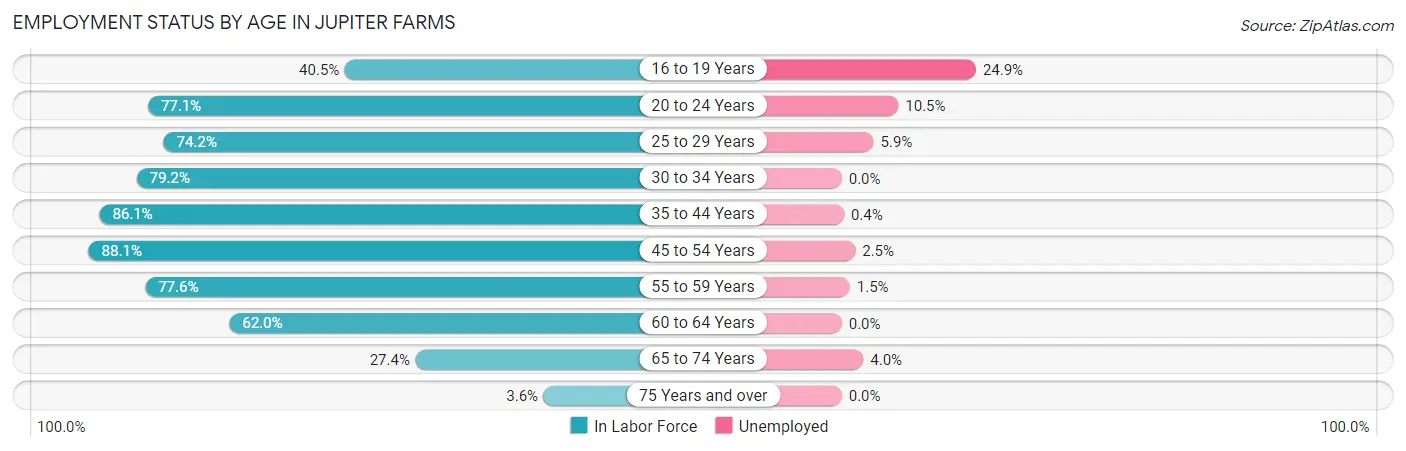
| Age Bracket | In Labor Force | Unemployed |
| 16 to 19 Years | 177 (40.5%) | 44 (24.9%) |
| 20 to 24 Years | 476 (77.1%) | 50 (10.5%) |
| 25 to 29 Years | 423 (74.2%) | 25 (5.9%) |
| 30 to 34 Years | 423 (79.2%) | 0 (0.0%) |
| 35 to 44 Years | 1,752 (86.1%) | 7 (0.4%) |
| 45 to 54 Years | 1,576 (88.1%) | 39 (2.5%) |
| 55 to 59 Years | 853 (77.6%) | 13 (1.5%) |
| 60 to 64 Years | 774 (62.0%) | 0 (0.0%) |
| 65 to 74 Years | 426 (27.4%) | 17 (4.0%) |
| 75 Years and over | 28 (3.6%) | 0 (0.0%) |
| Total | 6,916 (64.9%) | 194 (2.8%) |
Employment Status by Educational Attainment in Jupiter Farms
According to labor force statistics for Jupiter Farms, 79.8% of individuals (5,806) out of the total population between 25 and 64 years of age (7,276) are in the labor force, with 1.4% or 81 of them being unemployed. The group with the highest labor force participation rate are those with the educational attainment of bachelor's degree or higher, with 85.7% or 2,509 individuals in the labor force. Within the labor force, individuals with less than high school education have the highest percentage of unemployment, with 5.3% or 8 of them being unemployed.
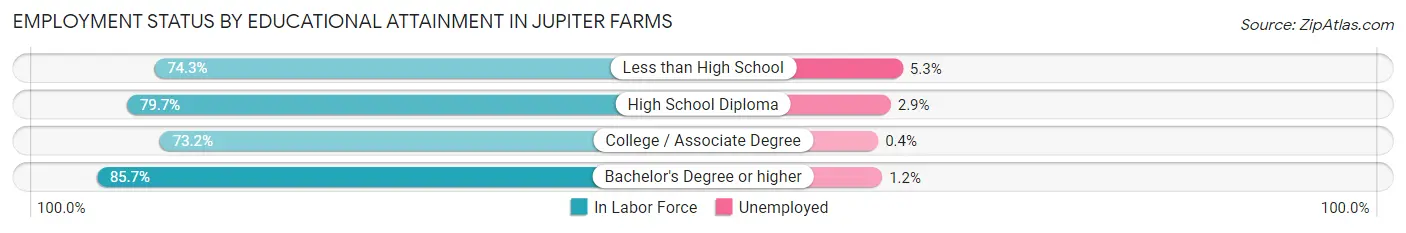
| Educational Attainment | In Labor Force | Unemployed |
| Less than High School | 150 (74.3%) | 11 (5.3%) |
| High School Diploma | 1,348 (79.7%) | 49 (2.9%) |
| College / Associate Degree | 1,797 (73.2%) | 10 (0.4%) |
| Bachelor's Degree or higher | 2,509 (85.7%) | 35 (1.2%) |
| Total | 5,806 (79.8%) | 102 (1.4%) |
Employment Occupations by Sex in Jupiter Farms
Management, Business, Science and Arts Occupations
The most common Management, Business, Science and Arts occupations in Jupiter Farms are Management (884 | 13.2%), Community & Social Service (775 | 11.5%), Business & Financial (550 | 8.2%), Health Diagnosing & Treating (484 | 7.2%), and Computers, Engineering & Science (476 | 7.1%).
Management, Business, Science and Arts Occupations by Sex
Within the Management, Business, Science and Arts occupations in Jupiter Farms, the most male-oriented occupations are Architecture & Engineering (94.5%), Arts, Media & Entertainment (86.1%), and Computers, Engineering & Science (83.2%), while the most female-oriented occupations are Health Diagnosing & Treating (87.6%), Health Technologists (80.6%), and Education, Arts & Media (74.1%).
| Occupation | Male | Female |
| Management | 470 (53.2%) | 414 (46.8%) |
| Business & Financial | 377 (68.5%) | 173 (31.5%) |
| Computers, Engineering & Science | 396 (83.2%) | 80 (16.8%) |
| Computers & Mathematics | 171 (74.0%) | 60 (26.0%) |
| Architecture & Engineering | 206 (94.5%) | 12 (5.5%) |
| Life, Physical & Social Science | 19 (70.4%) | 8 (29.6%) |
| Community & Social Service | 310 (40.0%) | 465 (60.0%) |
| Education, Arts & Media | 15 (25.9%) | 43 (74.1%) |
| Legal Services & Support | 36 (34.6%) | 68 (65.4%) |
| Education Instruction & Library | 129 (27.9%) | 333 (72.1%) |
| Arts, Media & Entertainment | 130 (86.1%) | 21 (13.9%) |
| Health Diagnosing & Treating | 60 (12.4%) | 424 (87.6%) |
| Health Technologists | 60 (19.4%) | 249 (80.6%) |
| Total (Category) | 1,613 (50.9%) | 1,556 (49.1%) |
| Total (Overall) | 3,811 (56.8%) | 2,905 (43.2%) |
Services Occupations
The most common Services occupations in Jupiter Farms are Personal Care & Service (278 | 4.1%), Food Preparation & Serving (232 | 3.5%), Security & Protection (196 | 2.9%), Firefighting & Prevention (144 | 2.1%), and Cleaning & Maintenance (79 | 1.2%).
Services Occupations by Sex
Within the Services occupations in Jupiter Farms, the most male-oriented occupations are Security & Protection (100.0%), Firefighting & Prevention (100.0%), and Law Enforcement (100.0%), while the most female-oriented occupations are Healthcare Support (100.0%), Personal Care & Service (68.7%), and Cleaning & Maintenance (36.7%).
| Occupation | Male | Female |
| Healthcare Support | 0 (0.0%) | 45 (100.0%) |
| Security & Protection | 196 (100.0%) | 0 (0.0%) |
| Firefighting & Prevention | 144 (100.0%) | 0 (0.0%) |
| Law Enforcement | 52 (100.0%) | 0 (0.0%) |
| Food Preparation & Serving | 151 (65.1%) | 81 (34.9%) |
| Cleaning & Maintenance | 50 (63.3%) | 29 (36.7%) |
| Personal Care & Service | 87 (31.3%) | 191 (68.7%) |
| Total (Category) | 484 (58.3%) | 346 (41.7%) |
| Total (Overall) | 3,811 (56.8%) | 2,905 (43.2%) |
Sales and Office Occupations
The most common Sales and Office occupations in Jupiter Farms are Sales & Related (913 | 13.6%), and Office & Administration (803 | 12.0%).

Sales and Office Occupations by Sex
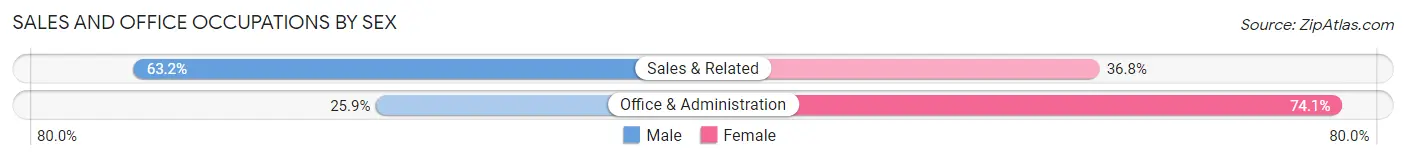
| Occupation | Male | Female |
| Sales & Related | 577 (63.2%) | 336 (36.8%) |
| Office & Administration | 208 (25.9%) | 595 (74.1%) |
| Total (Category) | 785 (45.8%) | 931 (54.2%) |
| Total (Overall) | 3,811 (56.8%) | 2,905 (43.2%) |
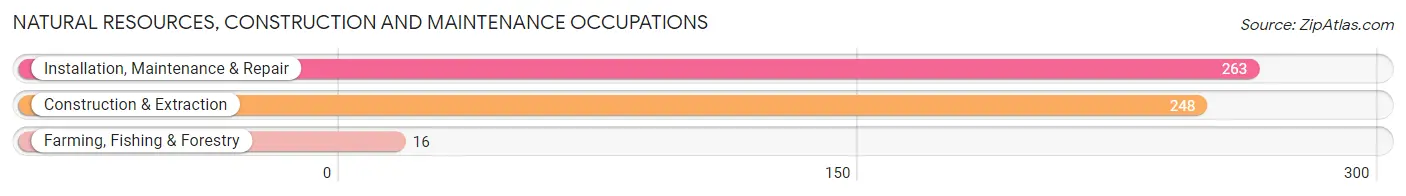
Natural Resources, Construction and Maintenance Occupations
The most common Natural Resources, Construction and Maintenance occupations in Jupiter Farms are Installation, Maintenance & Repair (263 | 3.9%), Construction & Extraction (248 | 3.7%), and Farming, Fishing & Forestry (16 | 0.2%).
Natural Resources, Construction and Maintenance Occupations by Sex
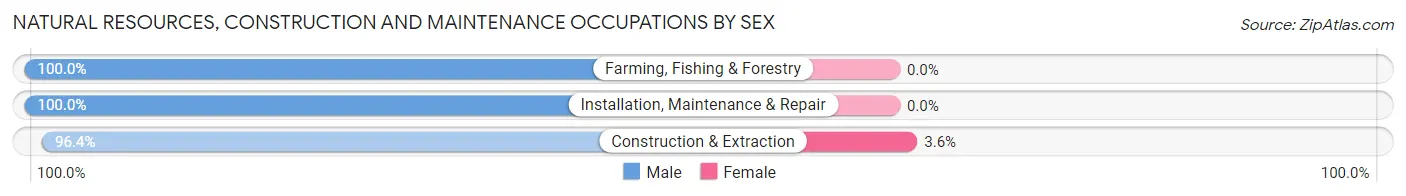
| Occupation | Male | Female |
| Farming, Fishing & Forestry | 16 (100.0%) | 0 (0.0%) |
| Construction & Extraction | 239 (96.4%) | 9 (3.6%) |
| Installation, Maintenance & Repair | 263 (100.0%) | 0 (0.0%) |
| Total (Category) | 518 (98.3%) | 9 (1.7%) |
| Total (Overall) | 3,811 (56.8%) | 2,905 (43.2%) |
Production, Transportation and Moving Occupations
The most common Production, Transportation and Moving occupations in Jupiter Farms are Production (187 | 2.8%), Material Moving (166 | 2.5%), and Transportation (121 | 1.8%).
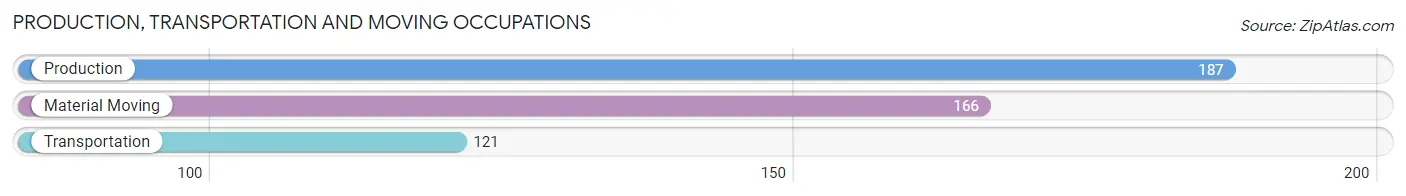
Production, Transportation and Moving Occupations by Sex
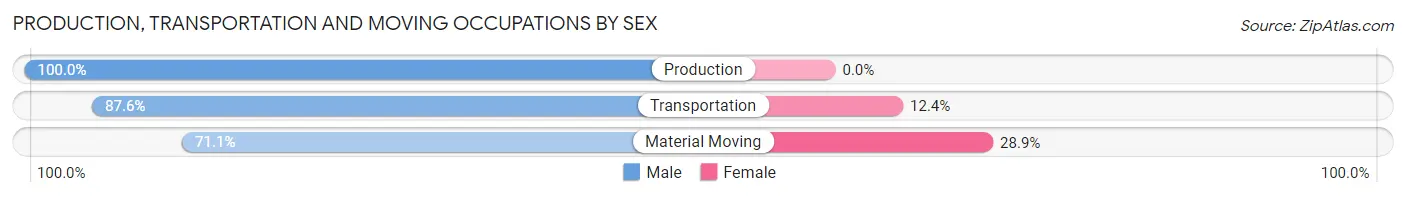
| Occupation | Male | Female |
| Production | 187 (100.0%) | 0 (0.0%) |
| Transportation | 106 (87.6%) | 15 (12.4%) |
| Material Moving | 118 (71.1%) | 48 (28.9%) |
| Total (Category) | 411 (86.7%) | 63 (13.3%) |
| Total (Overall) | 3,811 (56.8%) | 2,905 (43.2%) |
Employment Industries by Sex in Jupiter Farms
Employment Industries in Jupiter Farms
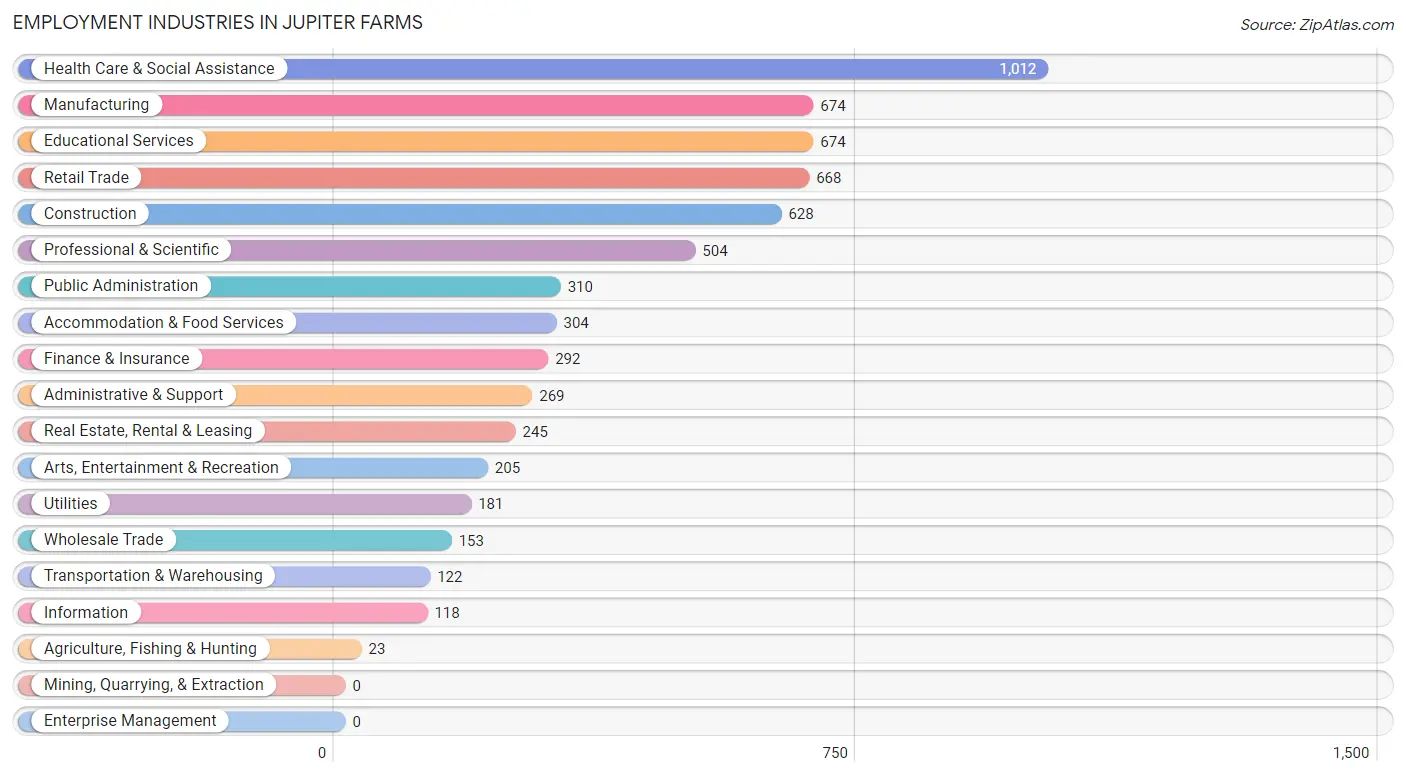
The major employment industries in Jupiter Farms include Health Care & Social Assistance (1,012 | 15.1%), Manufacturing (674 | 10.0%), Educational Services (674 | 10.0%), Retail Trade (668 | 10.0%), and Construction (628 | 9.3%).
Employment Industries by Sex in Jupiter Farms
The Jupiter Farms industries that see more men than women are Agriculture, Fishing & Hunting (100.0%), Wholesale Trade (100.0%), and Public Administration (91.6%), whereas the industries that tend to have a higher number of women are Health Care & Social Assistance (78.7%), Educational Services (60.2%), and Retail Trade (50.6%).
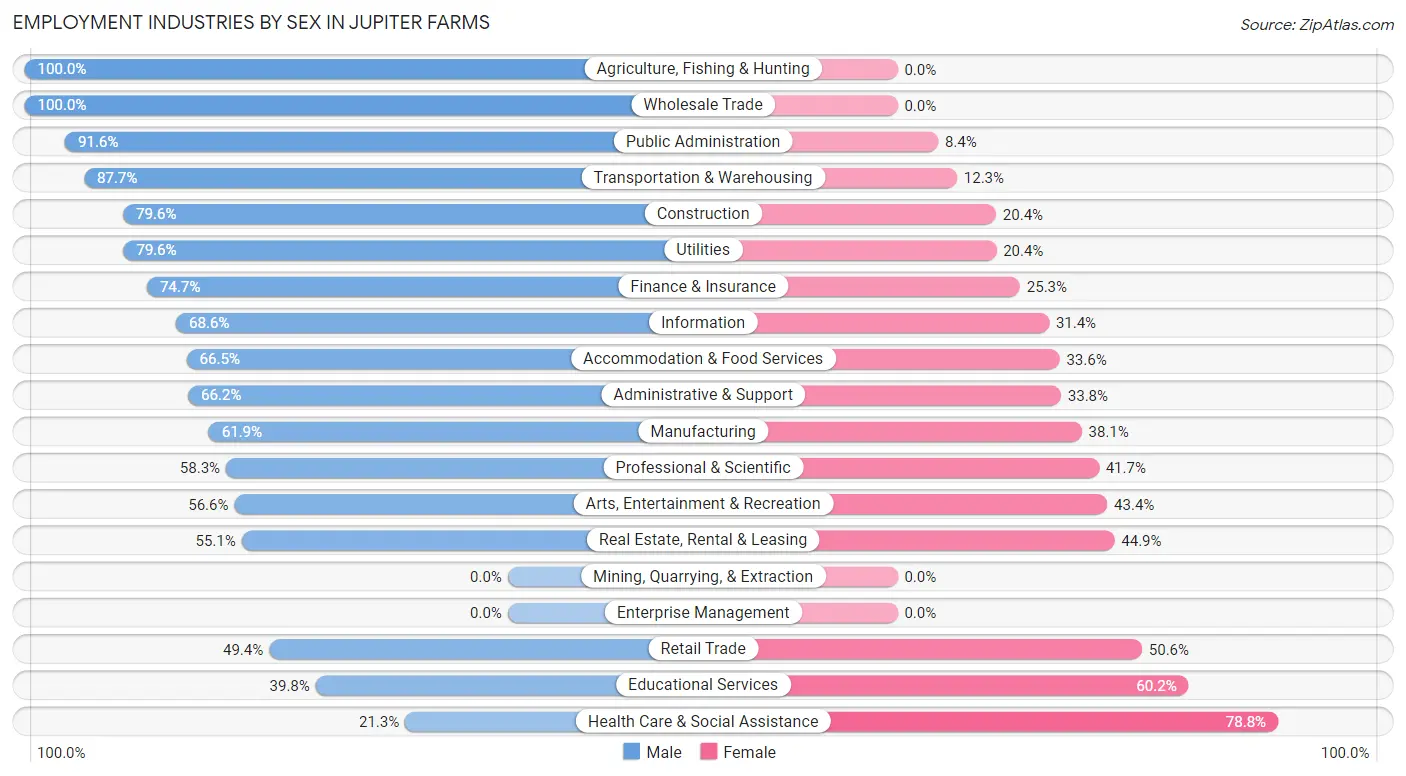
| Industry | Male | Female |
| Agriculture, Fishing & Hunting | 23 (100.0%) | 0 (0.0%) |
| Mining, Quarrying, & Extraction | 0 (0.0%) | 0 (0.0%) |
| Construction | 500 (79.6%) | 128 (20.4%) |
| Manufacturing | 417 (61.9%) | 257 (38.1%) |
| Wholesale Trade | 153 (100.0%) | 0 (0.0%) |
| Retail Trade | 330 (49.4%) | 338 (50.6%) |
| Transportation & Warehousing | 107 (87.7%) | 15 (12.3%) |
| Utilities | 144 (79.6%) | 37 (20.4%) |
| Information | 81 (68.6%) | 37 (31.4%) |
| Finance & Insurance | 218 (74.7%) | 74 (25.3%) |
| Real Estate, Rental & Leasing | 135 (55.1%) | 110 (44.9%) |
| Professional & Scientific | 294 (58.3%) | 210 (41.7%) |
| Enterprise Management | 0 (0.0%) | 0 (0.0%) |
| Administrative & Support | 178 (66.2%) | 91 (33.8%) |
| Educational Services | 268 (39.8%) | 406 (60.2%) |
| Health Care & Social Assistance | 215 (21.2%) | 797 (78.7%) |
| Arts, Entertainment & Recreation | 116 (56.6%) | 89 (43.4%) |
| Accommodation & Food Services | 202 (66.4%) | 102 (33.6%) |
| Public Administration | 284 (91.6%) | 26 (8.4%) |
| Total | 3,811 (56.8%) | 2,905 (43.2%) |
Education in Jupiter Farms
School Enrollment in Jupiter Farms
The most common levels of schooling among the 2,738 students in Jupiter Farms are college / undergraduate (666 | 24.3%), elementary school (637 | 23.3%), and high school (586 | 21.4%).
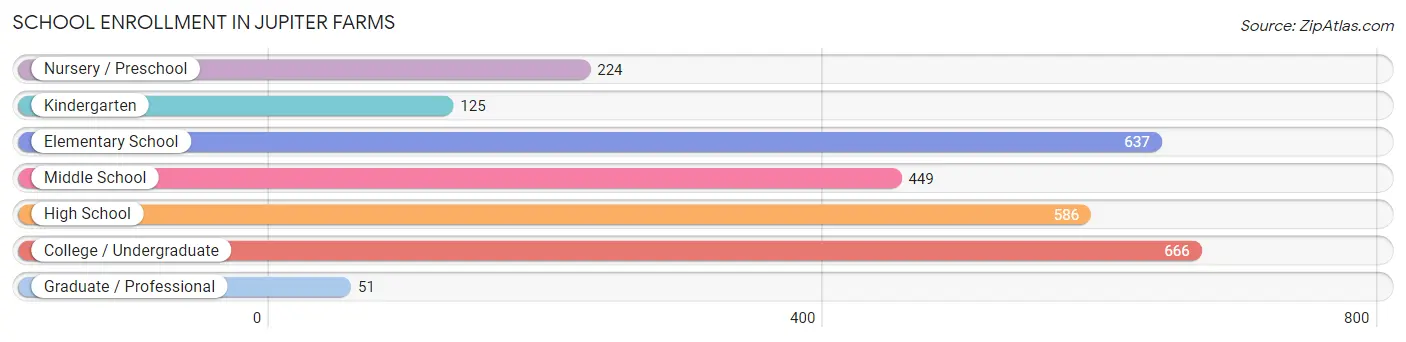
| School Level | # Students | % Students |
| Nursery / Preschool | 224 | 8.2% |
| Kindergarten | 125 | 4.6% |
| Elementary School | 637 | 23.3% |
| Middle School | 449 | 16.4% |
| High School | 586 | 21.4% |
| College / Undergraduate | 666 | 24.3% |
| Graduate / Professional | 51 | 1.9% |
| Total | 2,738 | 100.0% |
School Enrollment by Age by Funding Source in Jupiter Farms
Out of a total of 2,738 students who are enrolled in schools in Jupiter Farms, 657 (24.0%) attend a private institution, while the remaining 2,081 (76.0%) are enrolled in public schools. The age group of 3 to 4 year olds has the highest likelihood of being enrolled in private schools, with 79 (49.1% in the age bracket) enrolled. Conversely, the age group of 15 to 17 year olds has the lowest likelihood of being enrolled in a private school, with 271 (84.2% in the age bracket) attending a public institution.
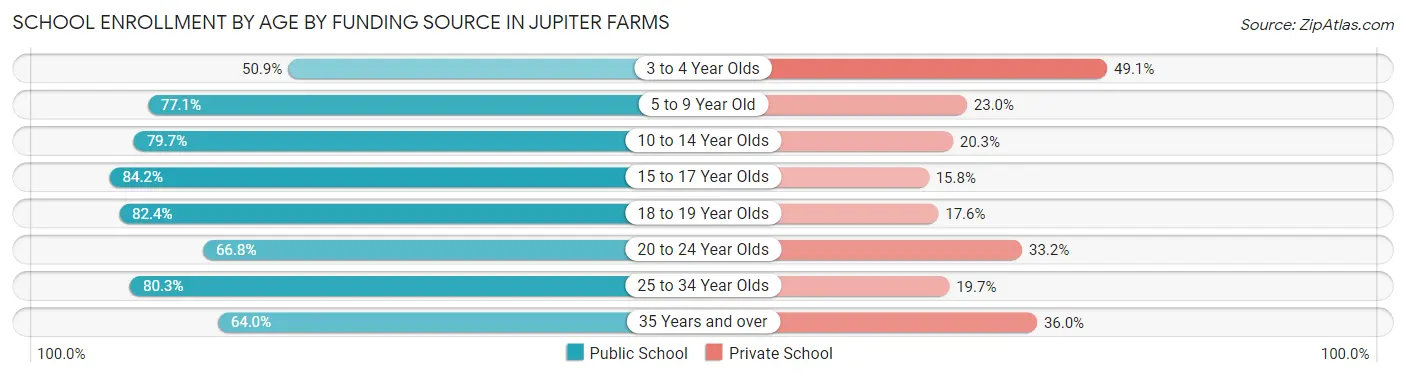
| Age Bracket | Public School | Private School |
| 3 to 4 Year Olds | 82 (50.9%) | 79 (49.1%) |
| 5 to 9 Year Old | 591 (77.0%) | 176 (23.0%) |
| 10 to 14 Year Olds | 490 (79.7%) | 125 (20.3%) |
| 15 to 17 Year Olds | 271 (84.2%) | 51 (15.8%) |
| 18 to 19 Year Olds | 187 (82.4%) | 40 (17.6%) |
| 20 to 24 Year Olds | 225 (66.8%) | 112 (33.2%) |
| 25 to 34 Year Olds | 188 (80.3%) | 46 (19.7%) |
| 35 Years and over | 48 (64.0%) | 27 (36.0%) |
| Total | 2,081 (76.0%) | 657 (24.0%) |
Educational Attainment by Field of Study in Jupiter Farms
Business (1,038 | 25.0%), education (559 | 13.5%), science & technology (509 | 12.3%), engineering (372 | 9.0%), and arts & humanities (284 | 6.8%) are the most common fields of study among 4,151 individuals in Jupiter Farms who have obtained a bachelor's degree or higher.
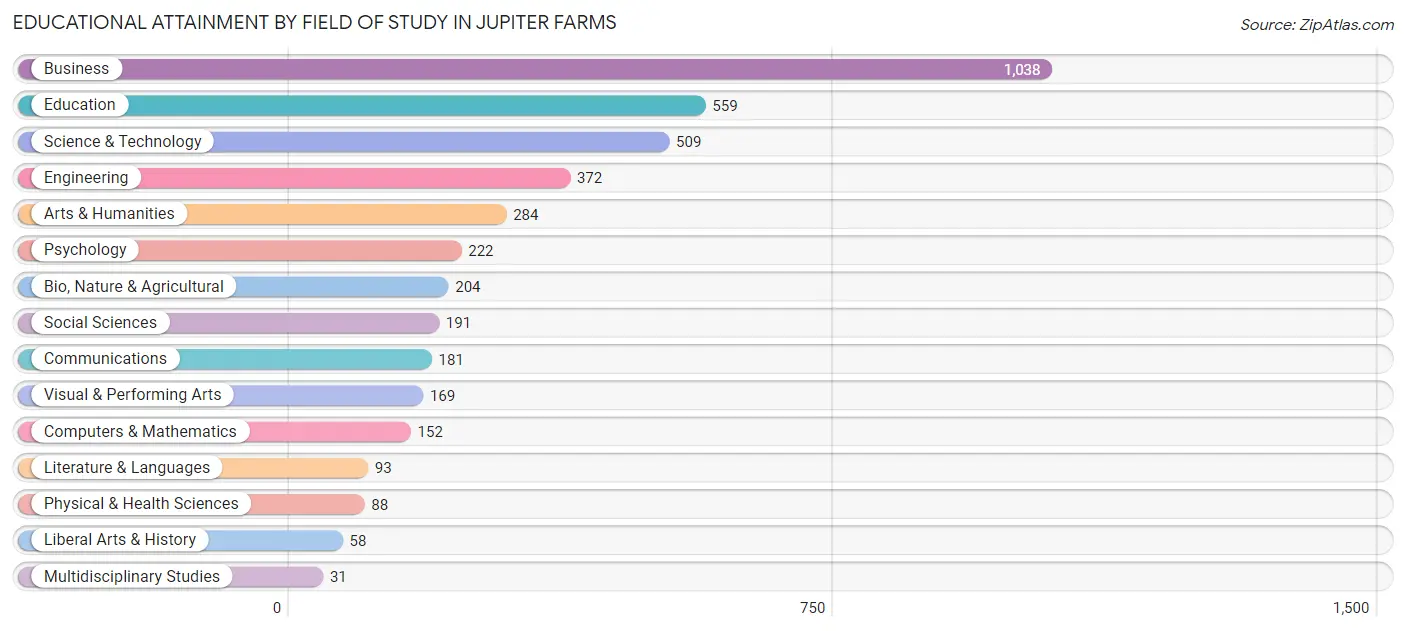
| Field of Study | # Graduates | % Graduates |
| Computers & Mathematics | 152 | 3.7% |
| Bio, Nature & Agricultural | 204 | 4.9% |
| Physical & Health Sciences | 88 | 2.1% |
| Psychology | 222 | 5.3% |
| Social Sciences | 191 | 4.6% |
| Engineering | 372 | 9.0% |
| Multidisciplinary Studies | 31 | 0.7% |
| Science & Technology | 509 | 12.3% |
| Business | 1,038 | 25.0% |
| Education | 559 | 13.5% |
| Literature & Languages | 93 | 2.2% |
| Liberal Arts & History | 58 | 1.4% |
| Visual & Performing Arts | 169 | 4.1% |
| Communications | 181 | 4.4% |
| Arts & Humanities | 284 | 6.8% |
| Total | 4,151 | 100.0% |
Transportation & Commute in Jupiter Farms
Vehicle Availability by Sex in Jupiter Farms
The most prevalent vehicle ownership categories in Jupiter Farms are males with 3 vehicles (1,556, accounting for 41.9%) and females with 3 vehicles (1,028, making up 54.3%).
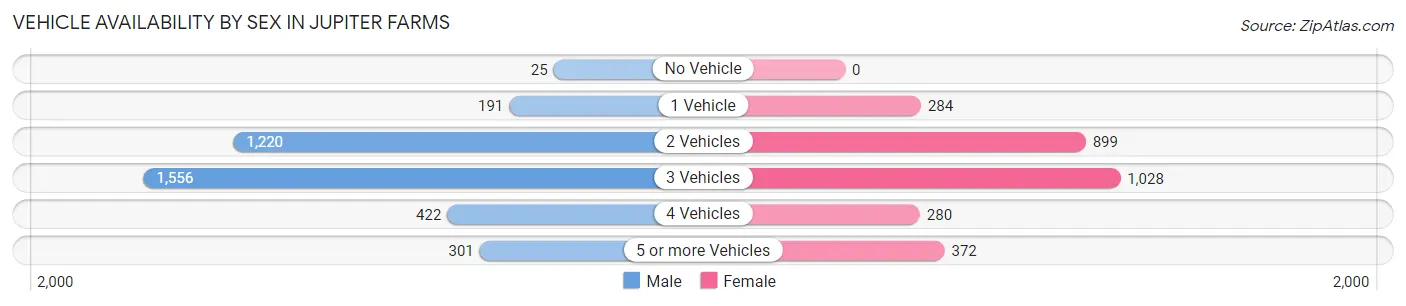
| Vehicles Available | Male | Female |
| No Vehicle | 25 (0.7%) | 0 (0.0%) |
| 1 Vehicle | 191 (5.1%) | 284 (9.9%) |
| 2 Vehicles | 1,220 (32.8%) | 899 (31.4%) |
| 3 Vehicles | 1,556 (41.9%) | 1,028 (35.9%) |
| 4 Vehicles | 422 (11.4%) | 280 (9.8%) |
| 5 or more Vehicles | 301 (8.1%) | 372 (13.0%) |
| Total | 3,715 (100.0%) | 2,863 (100.0%) |
Commute Time in Jupiter Farms
The most frequently occuring commute durations in Jupiter Farms are 30 to 34 minutes (1,379 commuters, 25.2%), 20 to 24 minutes (1,071 commuters, 19.5%), and 15 to 19 minutes (663 commuters, 12.1%).
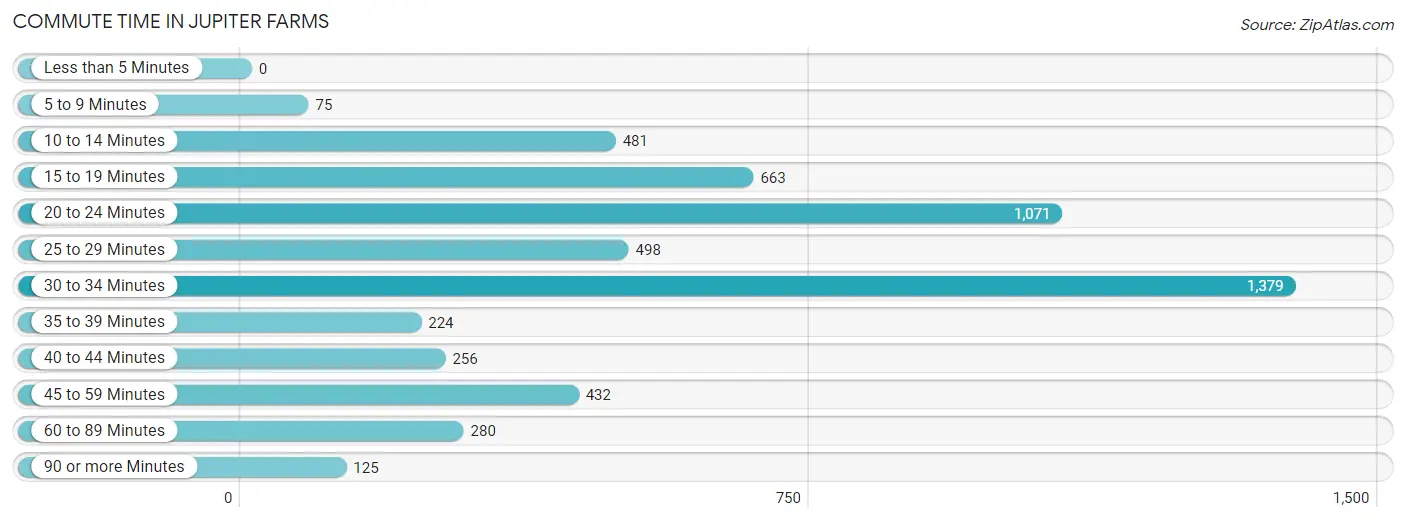
| Commute Time | # Commuters | % Commuters |
| Less than 5 Minutes | 0 | 0.0% |
| 5 to 9 Minutes | 75 | 1.4% |
| 10 to 14 Minutes | 481 | 8.8% |
| 15 to 19 Minutes | 663 | 12.1% |
| 20 to 24 Minutes | 1,071 | 19.5% |
| 25 to 29 Minutes | 498 | 9.1% |
| 30 to 34 Minutes | 1,379 | 25.2% |
| 35 to 39 Minutes | 224 | 4.1% |
| 40 to 44 Minutes | 256 | 4.7% |
| 45 to 59 Minutes | 432 | 7.9% |
| 60 to 89 Minutes | 280 | 5.1% |
| 90 or more Minutes | 125 | 2.3% |
Commute Time by Sex in Jupiter Farms
The most common commute times in Jupiter Farms are 30 to 34 minutes (846 commuters, 25.8%) for males and 30 to 34 minutes (533 commuters, 24.2%) for females.
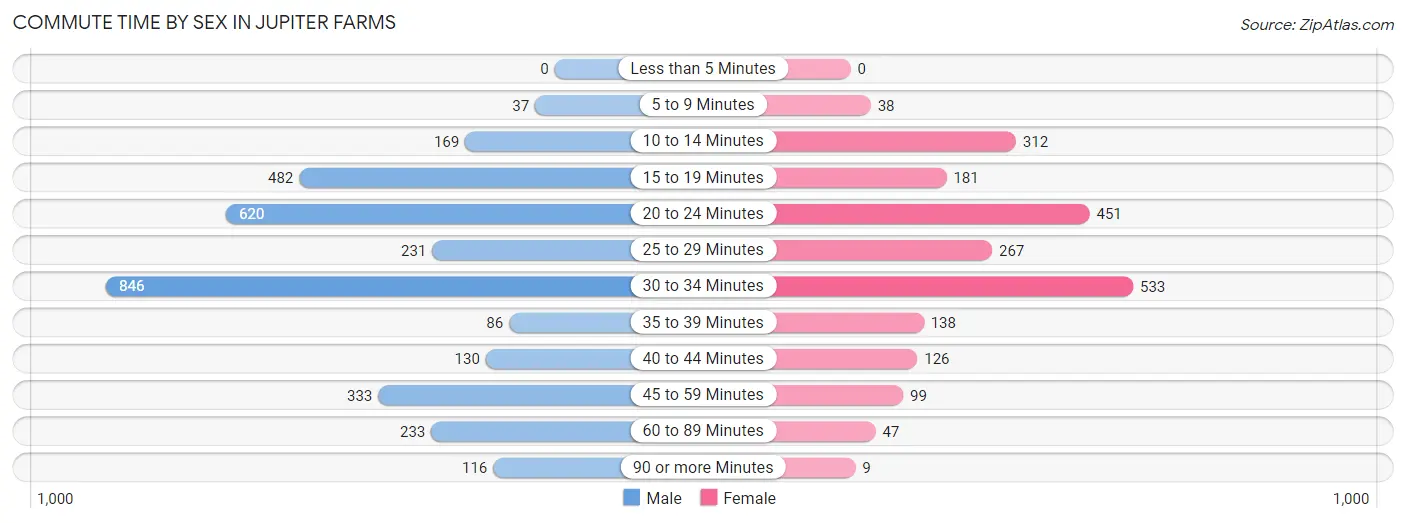
| Commute Time | Male | Female |
| Less than 5 Minutes | 0 (0.0%) | 0 (0.0%) |
| 5 to 9 Minutes | 37 (1.1%) | 38 (1.7%) |
| 10 to 14 Minutes | 169 (5.1%) | 312 (14.2%) |
| 15 to 19 Minutes | 482 (14.7%) | 181 (8.2%) |
| 20 to 24 Minutes | 620 (18.9%) | 451 (20.5%) |
| 25 to 29 Minutes | 231 (7.0%) | 267 (12.1%) |
| 30 to 34 Minutes | 846 (25.8%) | 533 (24.2%) |
| 35 to 39 Minutes | 86 (2.6%) | 138 (6.3%) |
| 40 to 44 Minutes | 130 (4.0%) | 126 (5.7%) |
| 45 to 59 Minutes | 333 (10.1%) | 99 (4.5%) |
| 60 to 89 Minutes | 233 (7.1%) | 47 (2.1%) |
| 90 or more Minutes | 116 (3.5%) | 9 (0.4%) |
Time of Departure to Work by Sex in Jupiter Farms
The most frequent times of departure to work in Jupiter Farms are 7:00 AM to 7:29 AM (596, 18.1%) for males and 7:30 AM to 7:59 AM (471, 21.4%) for females.
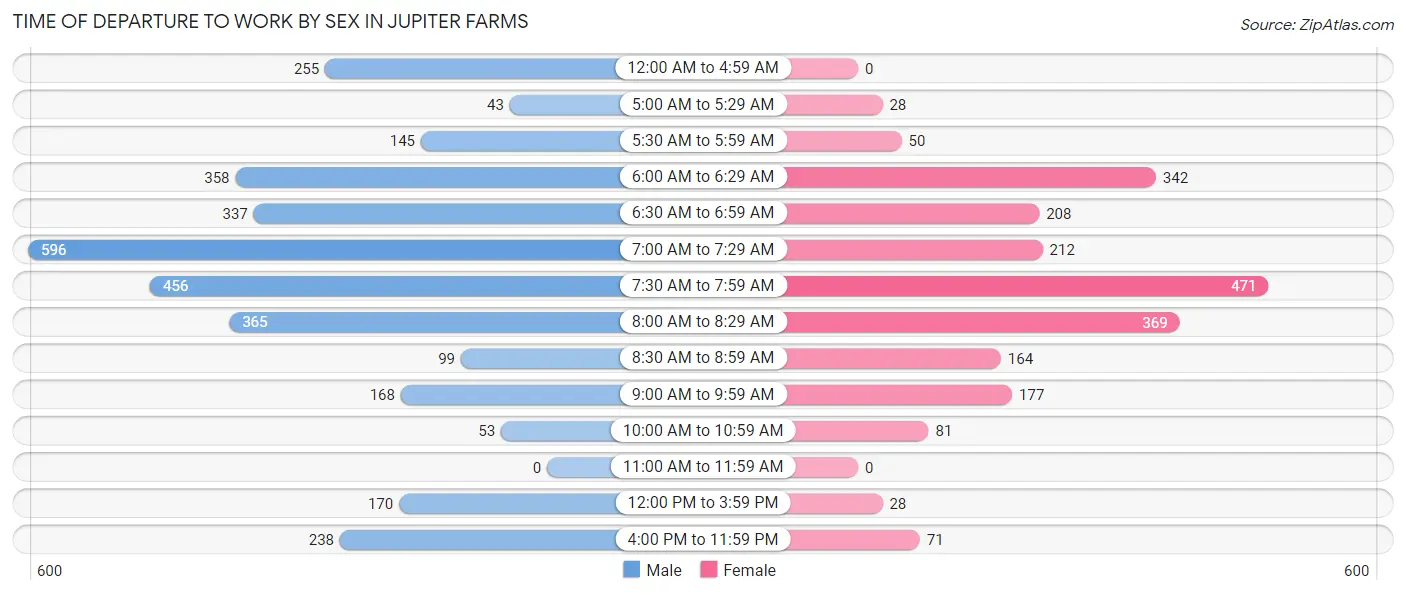
| Time of Departure | Male | Female |
| 12:00 AM to 4:59 AM | 255 (7.8%) | 0 (0.0%) |
| 5:00 AM to 5:29 AM | 43 (1.3%) | 28 (1.3%) |
| 5:30 AM to 5:59 AM | 145 (4.4%) | 50 (2.3%) |
| 6:00 AM to 6:29 AM | 358 (10.9%) | 342 (15.5%) |
| 6:30 AM to 6:59 AM | 337 (10.3%) | 208 (9.5%) |
| 7:00 AM to 7:29 AM | 596 (18.1%) | 212 (9.6%) |
| 7:30 AM to 7:59 AM | 456 (13.9%) | 471 (21.4%) |
| 8:00 AM to 8:29 AM | 365 (11.1%) | 369 (16.8%) |
| 8:30 AM to 8:59 AM | 99 (3.0%) | 164 (7.4%) |
| 9:00 AM to 9:59 AM | 168 (5.1%) | 177 (8.0%) |
| 10:00 AM to 10:59 AM | 53 (1.6%) | 81 (3.7%) |
| 11:00 AM to 11:59 AM | 0 (0.0%) | 0 (0.0%) |
| 12:00 PM to 3:59 PM | 170 (5.2%) | 28 (1.3%) |
| 4:00 PM to 11:59 PM | 238 (7.2%) | 71 (3.2%) |
| Total | 3,283 (100.0%) | 2,201 (100.0%) |
Housing Occupancy in Jupiter Farms
Occupancy by Ownership in Jupiter Farms
Of the total 4,379 dwellings in Jupiter Farms, owner-occupied units account for 4,232 (96.6%), while renter-occupied units make up 147 (3.4%).
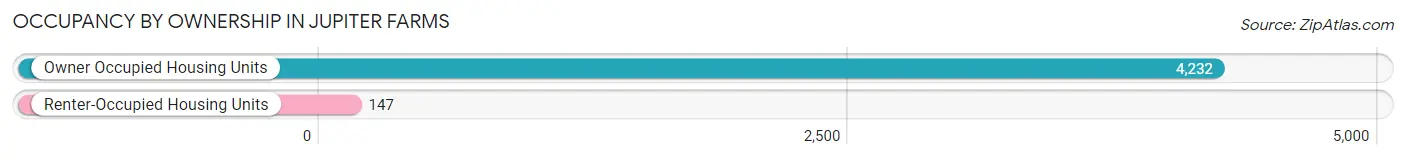
| Occupancy | # Housing Units | % Housing Units |
| Owner Occupied Housing Units | 4,232 | 96.6% |
| Renter-Occupied Housing Units | 147 | 3.4% |
| Total Occupied Housing Units | 4,379 | 100.0% |
Occupancy by Household Size in Jupiter Farms
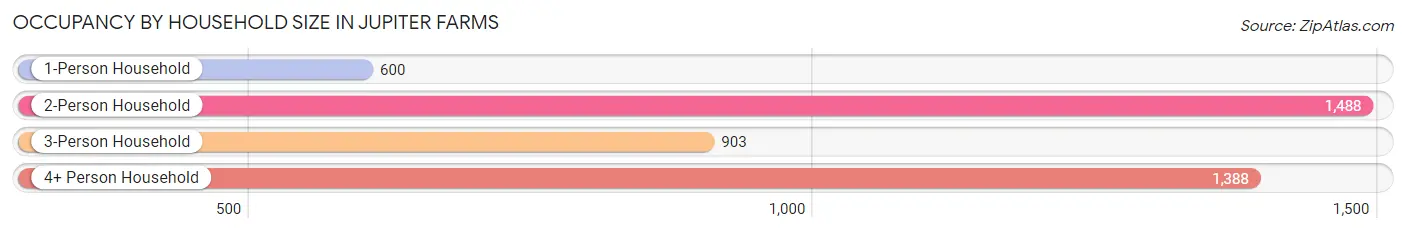
| Household Size | # Housing Units | % Housing Units |
| 1-Person Household | 600 | 13.7% |
| 2-Person Household | 1,488 | 34.0% |
| 3-Person Household | 903 | 20.6% |
| 4+ Person Household | 1,388 | 31.7% |
| Total Housing Units | 4,379 | 100.0% |
Occupancy by Ownership by Household Size in Jupiter Farms
| Household Size | Owner-occupied | Renter-occupied |
| 1-Person Household | 524 (87.3%) | 76 (12.7%) |
| 2-Person Household | 1,417 (95.2%) | 71 (4.8%) |
| 3-Person Household | 903 (100.0%) | 0 (0.0%) |
| 4+ Person Household | 1,388 (100.0%) | 0 (0.0%) |
| Total Housing Units | 4,232 (96.6%) | 147 (3.4%) |
Occupancy by Educational Attainment in Jupiter Farms
| Household Size | Owner-occupied | Renter-occupied |
| Less than High School | 161 (100.0%) | 0 (0.0%) |
| High School Diploma | 691 (90.1%) | 76 (9.9%) |
| College/Associate Degree | 1,381 (97.2%) | 40 (2.8%) |
| Bachelor's Degree or higher | 1,999 (98.5%) | 31 (1.5%) |
Occupancy by Age of Householder in Jupiter Farms
| Age Bracket | # Households | % Households |
| Under 35 Years | 296 | 6.8% |
| 35 to 44 Years | 859 | 19.6% |
| 45 to 54 Years | 939 | 21.4% |
| 55 to 64 Years | 1,265 | 28.9% |
| 65 to 74 Years | 771 | 17.6% |
| 75 to 84 Years | 224 | 5.1% |
| 85 Years and Over | 25 | 0.6% |
| Total | 4,379 | 100.0% |
Housing Finances in Jupiter Farms
Median Income by Occupancy in Jupiter Farms
| Occupancy Type | # Households | Median Income |
| Owner-Occupied | 4,232 (96.6%) | $136,570 |
| Renter-Occupied | 147 (3.4%) | $0 |
| Average | 4,379 (100.0%) | $135,334 |
Occupancy by Householder Income Bracket in Jupiter Farms
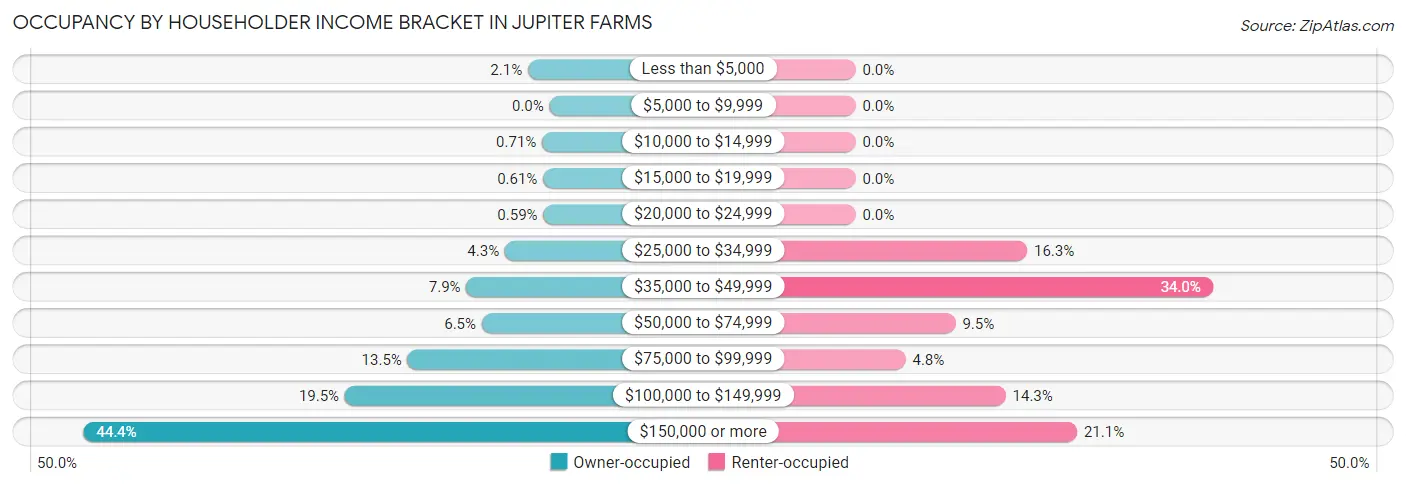
| Income Bracket | Owner-occupied | Renter-occupied |
| Less than $5,000 | 87 (2.1%) | 0 (0.0%) |
| $5,000 to $9,999 | 0 (0.0%) | 0 (0.0%) |
| $10,000 to $14,999 | 30 (0.7%) | 0 (0.0%) |
| $15,000 to $19,999 | 26 (0.6%) | 0 (0.0%) |
| $20,000 to $24,999 | 25 (0.6%) | 0 (0.0%) |
| $25,000 to $34,999 | 180 (4.3%) | 24 (16.3%) |
| $35,000 to $49,999 | 335 (7.9%) | 50 (34.0%) |
| $50,000 to $74,999 | 273 (6.5%) | 14 (9.5%) |
| $75,000 to $99,999 | 572 (13.5%) | 7 (4.8%) |
| $100,000 to $149,999 | 825 (19.5%) | 21 (14.3%) |
| $150,000 or more | 1,879 (44.4%) | 31 (21.1%) |
| Total | 4,232 (100.0%) | 147 (100.0%) |
Monthly Housing Cost Tiers in Jupiter Farms
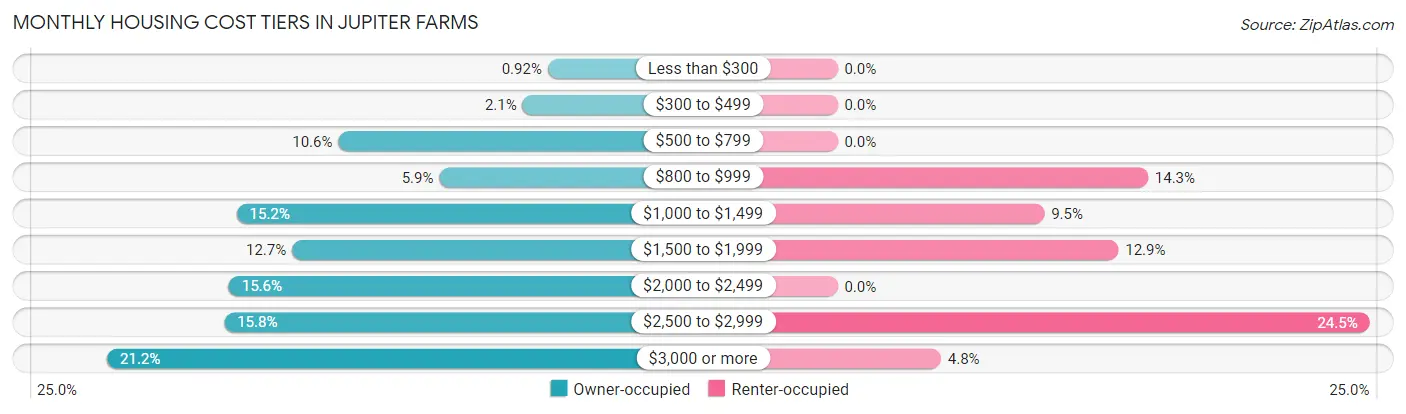
| Monthly Cost | Owner-occupied | Renter-occupied |
| Less than $300 | 39 (0.9%) | 0 (0.0%) |
| $300 to $499 | 88 (2.1%) | 0 (0.0%) |
| $500 to $799 | 447 (10.6%) | 0 (0.0%) |
| $800 to $999 | 250 (5.9%) | 21 (14.3%) |
| $1,000 to $1,499 | 645 (15.2%) | 14 (9.5%) |
| $1,500 to $1,999 | 537 (12.7%) | 19 (12.9%) |
| $2,000 to $2,499 | 660 (15.6%) | 0 (0.0%) |
| $2,500 to $2,999 | 669 (15.8%) | 36 (24.5%) |
| $3,000 or more | 897 (21.2%) | 7 (4.8%) |
| Total | 4,232 (100.0%) | 147 (100.0%) |
Physical Housing Characteristics in Jupiter Farms
Housing Structures in Jupiter Farms
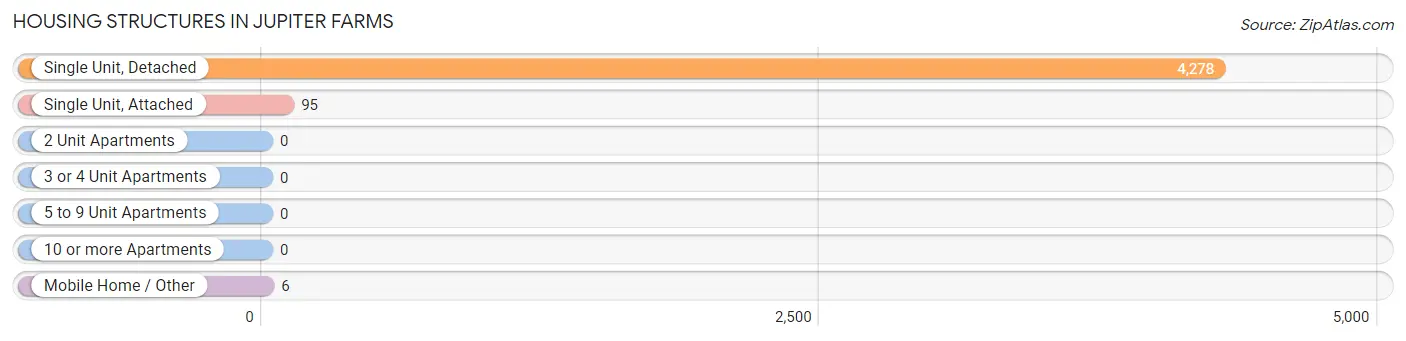
| Structure Type | # Housing Units | % Housing Units |
| Single Unit, Detached | 4,278 | 97.7% |
| Single Unit, Attached | 95 | 2.2% |
| 2 Unit Apartments | 0 | 0.0% |
| 3 or 4 Unit Apartments | 0 | 0.0% |
| 5 to 9 Unit Apartments | 0 | 0.0% |
| 10 or more Apartments | 0 | 0.0% |
| Mobile Home / Other | 6 | 0.1% |
| Total | 4,379 | 100.0% |
Housing Structures by Occupancy in Jupiter Farms
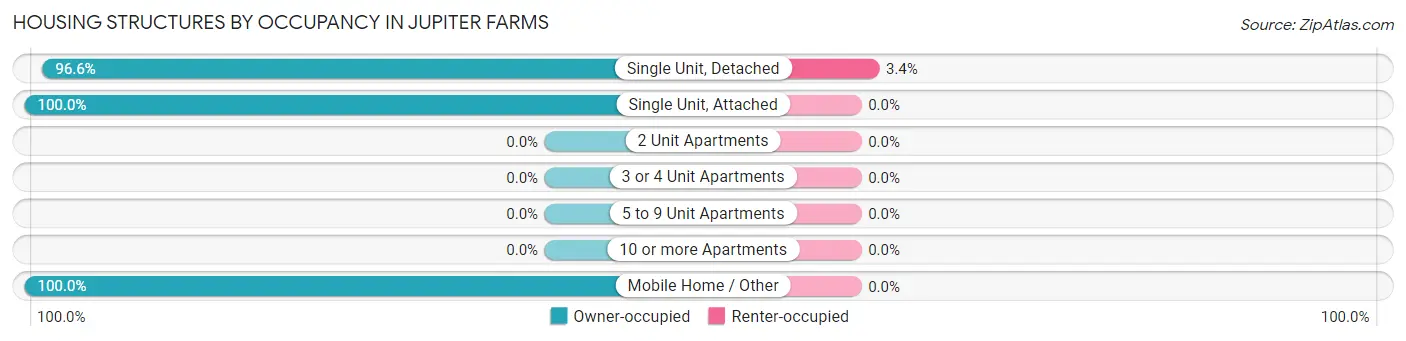
| Structure Type | Owner-occupied | Renter-occupied |
| Single Unit, Detached | 4,131 (96.6%) | 147 (3.4%) |
| Single Unit, Attached | 95 (100.0%) | 0 (0.0%) |
| 2 Unit Apartments | 0 (0.0%) | 0 (0.0%) |
| 3 or 4 Unit Apartments | 0 (0.0%) | 0 (0.0%) |
| 5 to 9 Unit Apartments | 0 (0.0%) | 0 (0.0%) |
| 10 or more Apartments | 0 (0.0%) | 0 (0.0%) |
| Mobile Home / Other | 6 (100.0%) | 0 (0.0%) |
| Total | 4,232 (96.6%) | 147 (3.4%) |
Housing Structures by Number of Rooms in Jupiter Farms
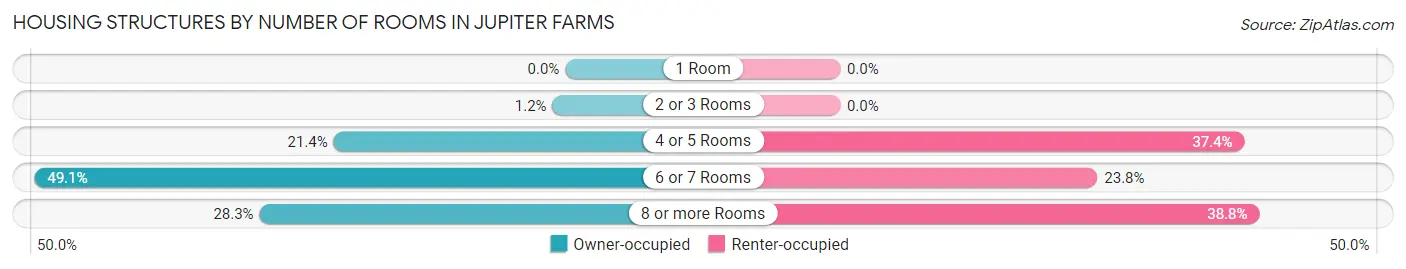
| Number of Rooms | Owner-occupied | Renter-occupied |
| 1 Room | 0 (0.0%) | 0 (0.0%) |
| 2 or 3 Rooms | 50 (1.2%) | 0 (0.0%) |
| 4 or 5 Rooms | 907 (21.4%) | 55 (37.4%) |
| 6 or 7 Rooms | 2,078 (49.1%) | 35 (23.8%) |
| 8 or more Rooms | 1,197 (28.3%) | 57 (38.8%) |
| Total | 4,232 (100.0%) | 147 (100.0%) |
Housing Structure by Heating Type in Jupiter Farms
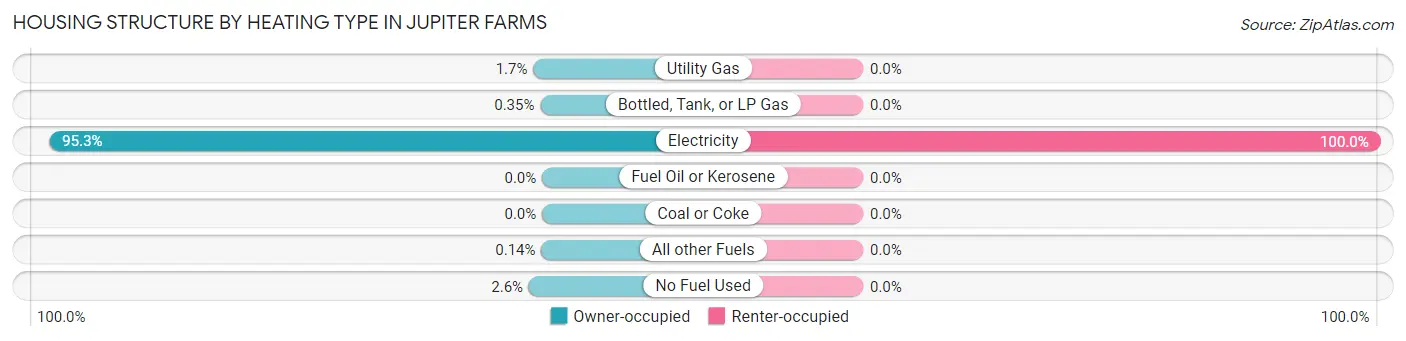
| Heating Type | Owner-occupied | Renter-occupied |
| Utility Gas | 72 (1.7%) | 0 (0.0%) |
| Bottled, Tank, or LP Gas | 15 (0.4%) | 0 (0.0%) |
| Electricity | 4,031 (95.3%) | 147 (100.0%) |
| Fuel Oil or Kerosene | 0 (0.0%) | 0 (0.0%) |
| Coal or Coke | 0 (0.0%) | 0 (0.0%) |
| All other Fuels | 6 (0.1%) | 0 (0.0%) |
| No Fuel Used | 108 (2.5%) | 0 (0.0%) |
| Total | 4,232 (100.0%) | 147 (100.0%) |
Household Vehicle Usage in Jupiter Farms
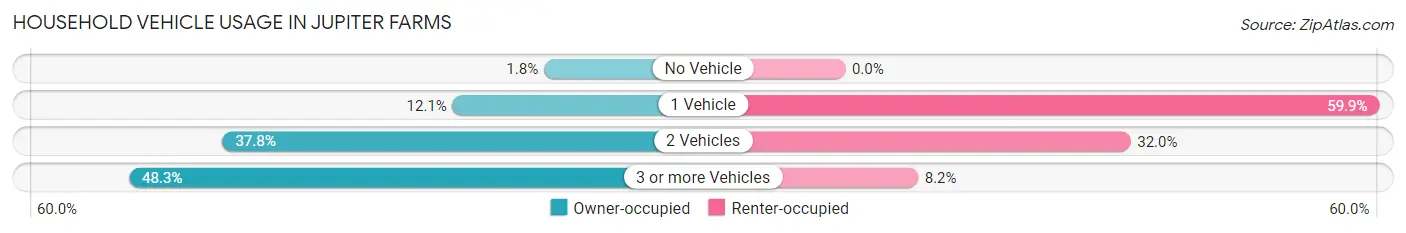
| Vehicles per Household | Owner-occupied | Renter-occupied |
| No Vehicle | 77 (1.8%) | 0 (0.0%) |
| 1 Vehicle | 510 (12.0%) | 88 (59.9%) |
| 2 Vehicles | 1,601 (37.8%) | 47 (32.0%) |
| 3 or more Vehicles | 2,044 (48.3%) | 12 (8.2%) |
| Total | 4,232 (100.0%) | 147 (100.0%) |
Real Estate & Mortgages in Jupiter Farms
Real Estate and Mortgage Overview in Jupiter Farms
| Characteristic | Without Mortgage | With Mortgage |
| Housing Units | 1,331 | 2,901 |
| Median Property Value | $470,500 | $563,400 |
| Median Household Income | $129,158 | $1,417 |
| Monthly Housing Costs | $852 | $865 |
| Real Estate Taxes | $4,579 | $25 |
Property Value by Mortgage Status in Jupiter Farms
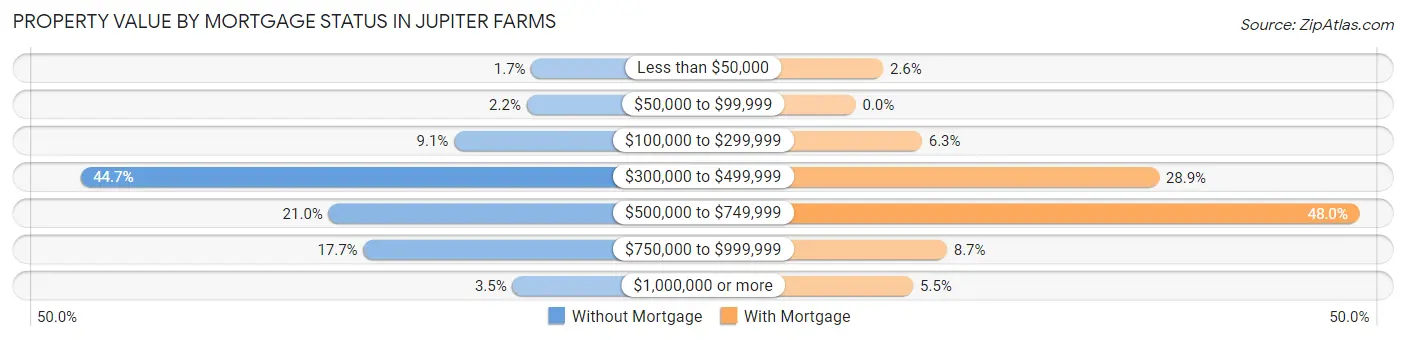
| Property Value | Without Mortgage | With Mortgage |
| Less than $50,000 | 23 (1.7%) | 76 (2.6%) |
| $50,000 to $99,999 | 29 (2.2%) | 0 (0.0%) |
| $100,000 to $299,999 | 121 (9.1%) | 183 (6.3%) |
| $300,000 to $499,999 | 595 (44.7%) | 838 (28.9%) |
| $500,000 to $749,999 | 280 (21.0%) | 1,393 (48.0%) |
| $750,000 to $999,999 | 236 (17.7%) | 252 (8.7%) |
| $1,000,000 or more | 47 (3.5%) | 159 (5.5%) |
| Total | 1,331 (100.0%) | 2,901 (100.0%) |
Household Income by Mortgage Status in Jupiter Farms
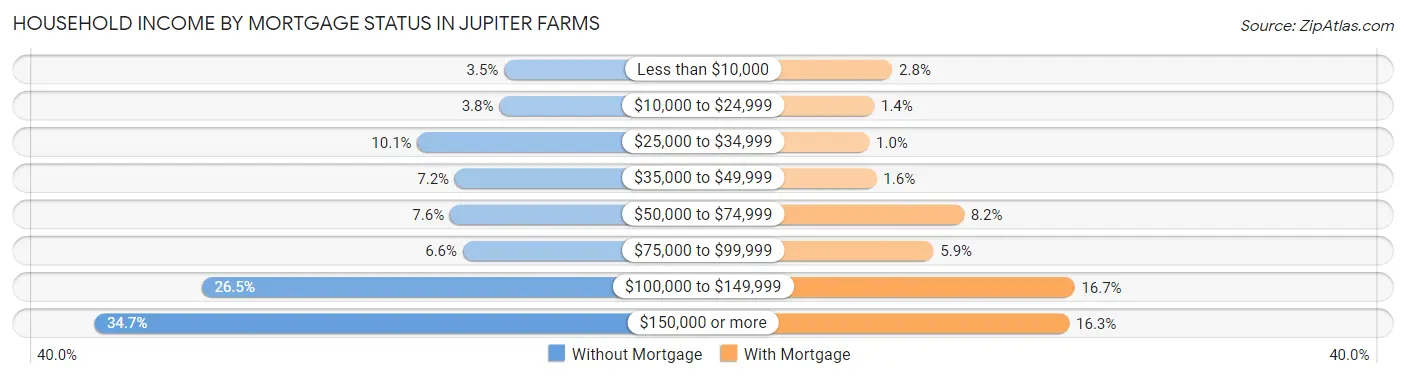
| Household Income | Without Mortgage | With Mortgage |
| Less than $10,000 | 46 (3.5%) | 81 (2.8%) |
| $10,000 to $24,999 | 51 (3.8%) | 41 (1.4%) |
| $25,000 to $34,999 | 134 (10.1%) | 30 (1.0%) |
| $35,000 to $49,999 | 96 (7.2%) | 46 (1.6%) |
| $50,000 to $74,999 | 101 (7.6%) | 239 (8.2%) |
| $75,000 to $99,999 | 88 (6.6%) | 172 (5.9%) |
| $100,000 to $149,999 | 353 (26.5%) | 484 (16.7%) |
| $150,000 or more | 462 (34.7%) | 472 (16.3%) |
| Total | 1,331 (100.0%) | 2,901 (100.0%) |
Property Value to Household Income Ratio in Jupiter Farms
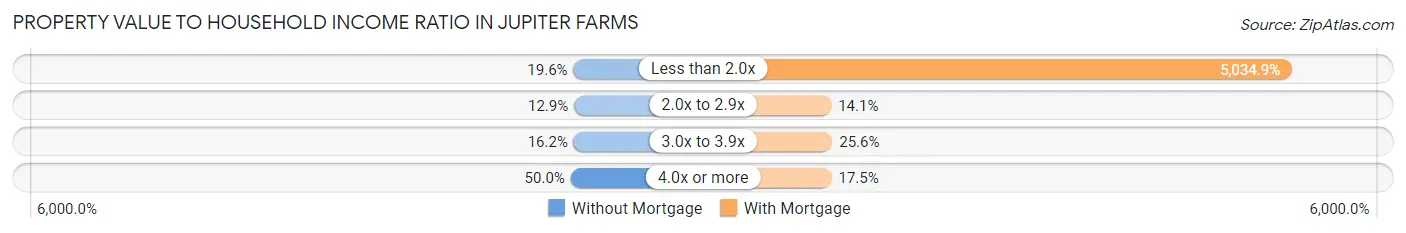
| Value-to-Income Ratio | Without Mortgage | With Mortgage |
| Less than 2.0x | 261 (19.6%) | 146,063 (5,034.9%) |
| 2.0x to 2.9x | 171 (12.9%) | 410 (14.1%) |
| 3.0x to 3.9x | 215 (16.2%) | 743 (25.6%) |
| 4.0x or more | 665 (50.0%) | 508 (17.5%) |
| Total | 1,331 (100.0%) | 2,901 (100.0%) |
Real Estate Taxes by Mortgage Status in Jupiter Farms
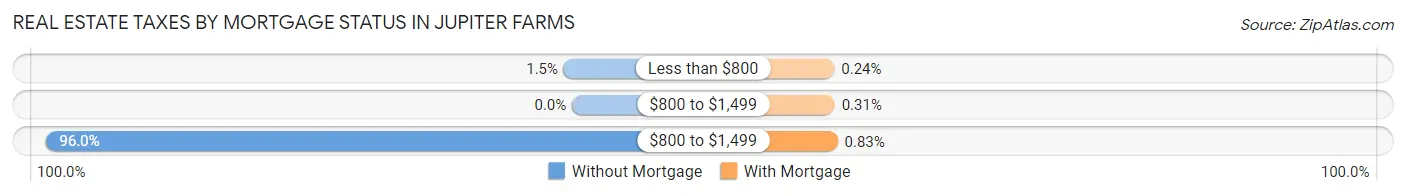
| Property Taxes | Without Mortgage | With Mortgage |
| Less than $800 | 20 (1.5%) | 7 (0.2%) |
| $800 to $1,499 | 0 (0.0%) | 9 (0.3%) |
| $800 to $1,499 | 1,278 (96.0%) | 24 (0.8%) |
| Total | 1,331 (100.0%) | 2,901 (100.0%) |
Health & Disability in Jupiter Farms
Health Insurance Coverage by Age in Jupiter Farms
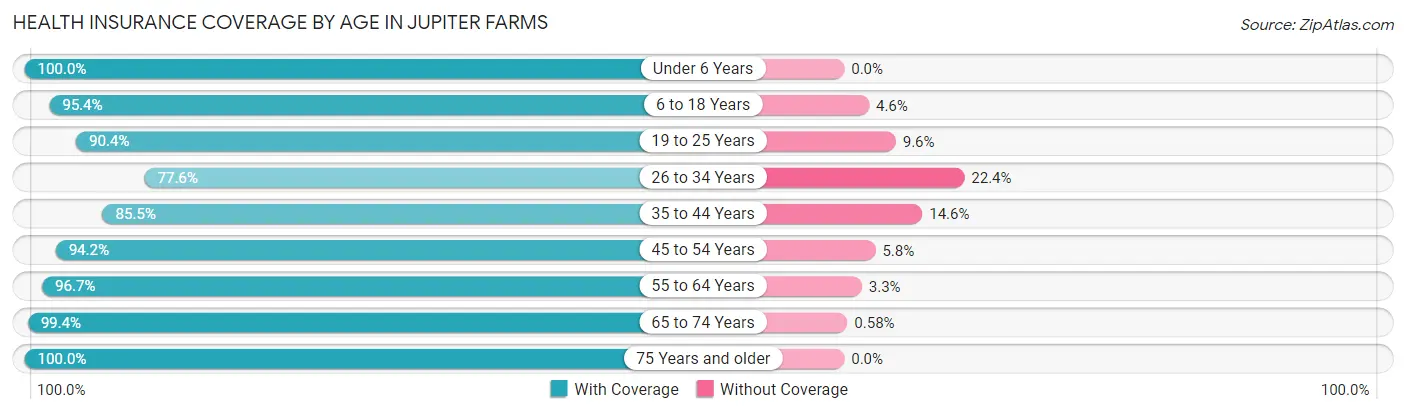
| Age Bracket | With Coverage | Without Coverage |
| Under 6 Years | 1,143 (100.0%) | 0 (0.0%) |
| 6 to 18 Years | 1,822 (95.4%) | 88 (4.6%) |
| 19 to 25 Years | 697 (90.4%) | 74 (9.6%) |
| 26 to 34 Years | 804 (77.6%) | 232 (22.4%) |
| 35 to 44 Years | 1,739 (85.5%) | 296 (14.5%) |
| 45 to 54 Years | 1,685 (94.2%) | 104 (5.8%) |
| 55 to 64 Years | 2,271 (96.7%) | 77 (3.3%) |
| 65 to 74 Years | 1,544 (99.4%) | 9 (0.6%) |
| 75 Years and older | 773 (100.0%) | 0 (0.0%) |
| Total | 12,478 (93.4%) | 880 (6.6%) |
Health Insurance Coverage by Citizenship Status in Jupiter Farms
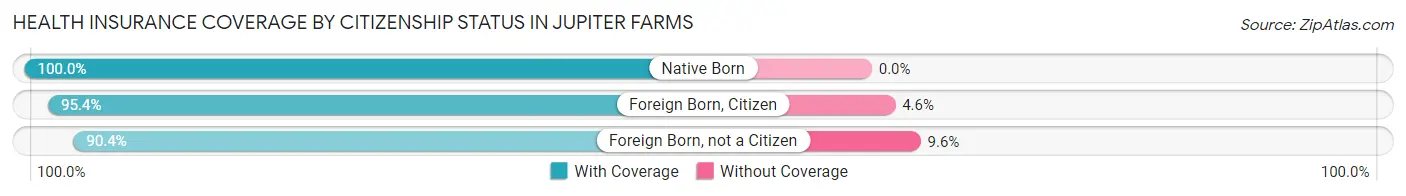
| Citizenship Status | With Coverage | Without Coverage |
| Native Born | 1,143 (100.0%) | 0 (0.0%) |
| Foreign Born, Citizen | 1,822 (95.4%) | 88 (4.6%) |
| Foreign Born, not a Citizen | 697 (90.4%) | 74 (9.6%) |
Health Insurance Coverage by Household Income in Jupiter Farms
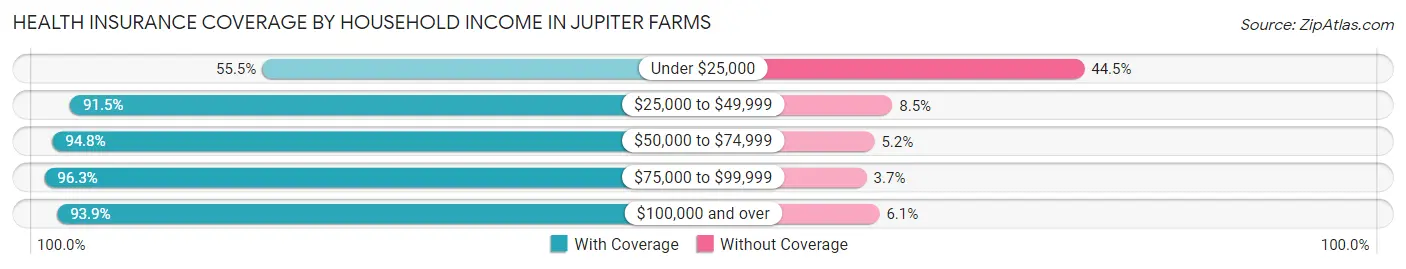
| Household Income | With Coverage | Without Coverage |
| Under $25,000 | 121 (55.5%) | 97 (44.5%) |
| $25,000 to $49,999 | 986 (91.5%) | 92 (8.5%) |
| $50,000 to $74,999 | 841 (94.8%) | 46 (5.2%) |
| $75,000 to $99,999 | 1,551 (96.3%) | 60 (3.7%) |
| $100,000 and over | 8,978 (93.9%) | 585 (6.1%) |
Public vs Private Health Insurance Coverage by Age in Jupiter Farms
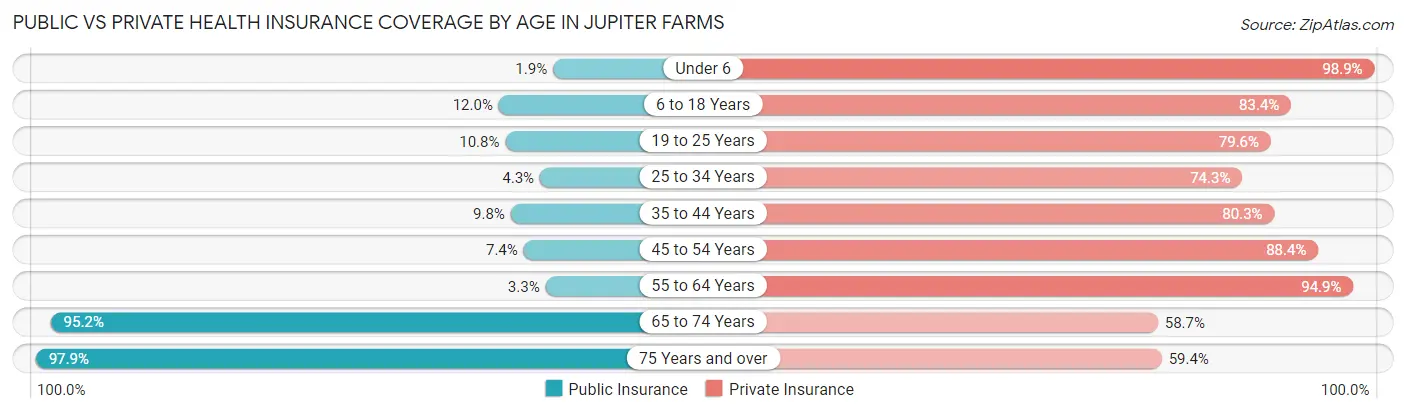
| Age Bracket | Public Insurance | Private Insurance |
| Under 6 | 22 (1.9%) | 1,130 (98.9%) |
| 6 to 18 Years | 229 (12.0%) | 1,593 (83.4%) |
| 19 to 25 Years | 83 (10.8%) | 614 (79.6%) |
| 25 to 34 Years | 45 (4.3%) | 770 (74.3%) |
| 35 to 44 Years | 199 (9.8%) | 1,634 (80.3%) |
| 45 to 54 Years | 132 (7.4%) | 1,582 (88.4%) |
| 55 to 64 Years | 78 (3.3%) | 2,229 (94.9%) |
| 65 to 74 Years | 1,478 (95.2%) | 911 (58.7%) |
| 75 Years and over | 757 (97.9%) | 459 (59.4%) |
| Total | 3,023 (22.6%) | 10,922 (81.8%) |
Disability Status by Sex by Age in Jupiter Farms
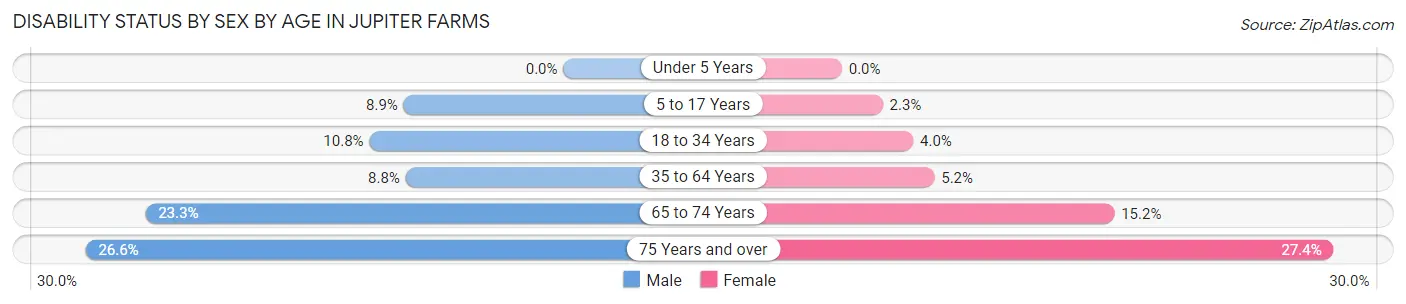
| Age Bracket | Male | Female |
| Under 5 Years | 0 (0.0%) | 0 (0.0%) |
| 5 to 17 Years | 92 (8.9%) | 19 (2.3%) |
| 18 to 34 Years | 124 (10.8%) | 33 (4.0%) |
| 35 to 64 Years | 286 (8.8%) | 150 (5.1%) |
| 65 to 74 Years | 162 (23.3%) | 130 (15.2%) |
| 75 Years and over | 91 (26.6%) | 118 (27.4%) |
Disability Class by Sex by Age in Jupiter Farms
Disability Class: Hearing Difficulty
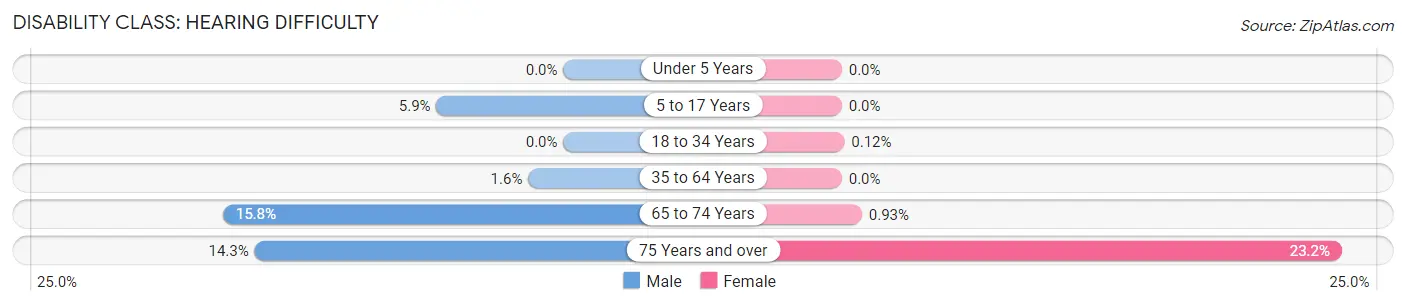
| Age Bracket | Male | Female |
| Under 5 Years | 0 (0.0%) | 0 (0.0%) |
| 5 to 17 Years | 61 (5.9%) | 0 (0.0%) |
| 18 to 34 Years | 0 (0.0%) | 1 (0.1%) |
| 35 to 64 Years | 53 (1.6%) | 0 (0.0%) |
| 65 to 74 Years | 110 (15.8%) | 8 (0.9%) |
| 75 Years and over | 49 (14.3%) | 100 (23.2%) |
Disability Class: Vision Difficulty
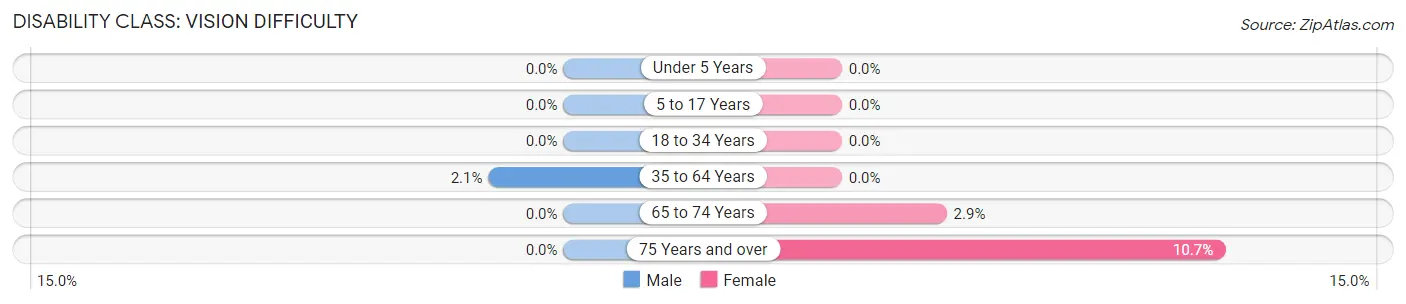
| Age Bracket | Male | Female |
| Under 5 Years | 0 (0.0%) | 0 (0.0%) |
| 5 to 17 Years | 0 (0.0%) | 0 (0.0%) |
| 18 to 34 Years | 0 (0.0%) | 0 (0.0%) |
| 35 to 64 Years | 68 (2.1%) | 0 (0.0%) |
| 65 to 74 Years | 0 (0.0%) | 25 (2.9%) |
| 75 Years and over | 0 (0.0%) | 46 (10.7%) |
Disability Class: Cognitive Difficulty
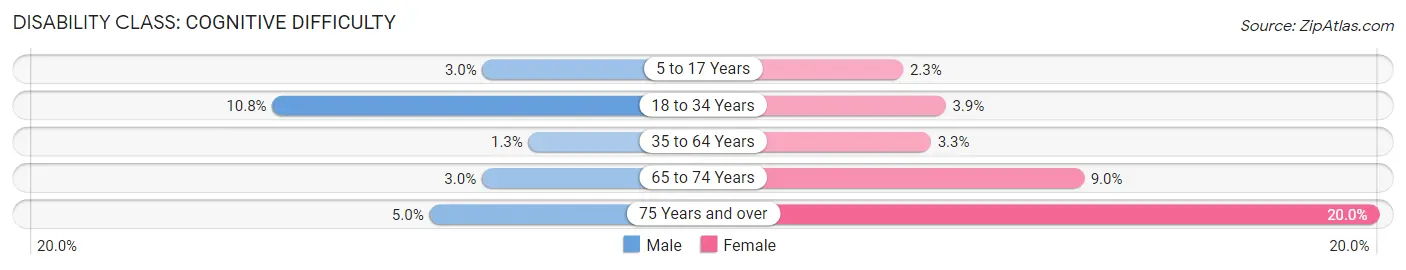
| Age Bracket | Male | Female |
| 5 to 17 Years | 31 (3.0%) | 19 (2.3%) |
| 18 to 34 Years | 124 (10.8%) | 32 (3.8%) |
| 35 to 64 Years | 42 (1.3%) | 96 (3.3%) |
| 65 to 74 Years | 21 (3.0%) | 77 (9.0%) |
| 75 Years and over | 17 (5.0%) | 86 (20.0%) |
Disability Class: Ambulatory Difficulty
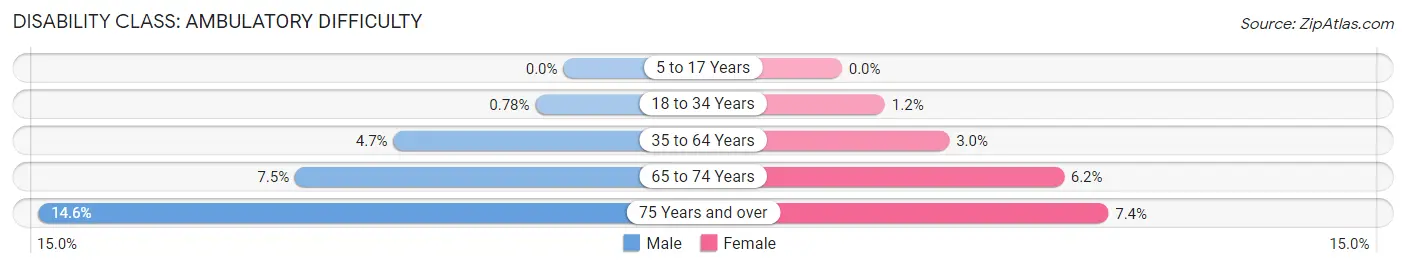
| Age Bracket | Male | Female |
| 5 to 17 Years | 0 (0.0%) | 0 (0.0%) |
| 18 to 34 Years | 9 (0.8%) | 10 (1.2%) |
| 35 to 64 Years | 154 (4.7%) | 87 (3.0%) |
| 65 to 74 Years | 52 (7.5%) | 53 (6.2%) |
| 75 Years and over | 50 (14.6%) | 32 (7.4%) |
Disability Class: Self-Care Difficulty
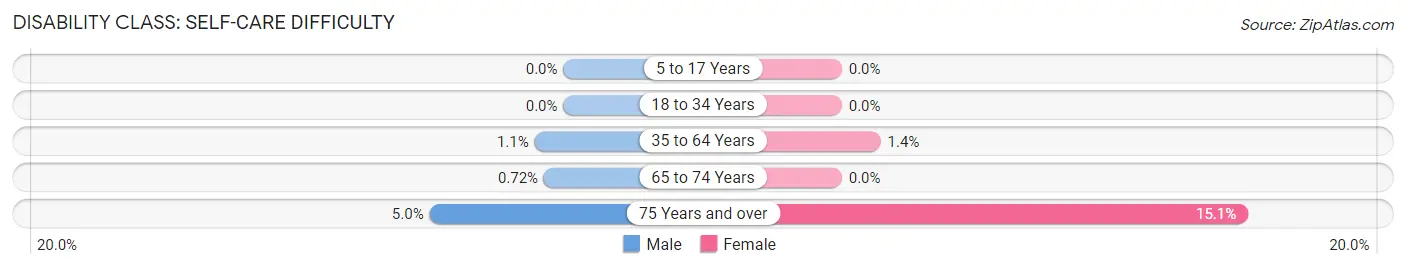
| Age Bracket | Male | Female |
| 5 to 17 Years | 0 (0.0%) | 0 (0.0%) |
| 18 to 34 Years | 0 (0.0%) | 0 (0.0%) |
| 35 to 64 Years | 35 (1.1%) | 42 (1.4%) |
| 65 to 74 Years | 5 (0.7%) | 0 (0.0%) |
| 75 Years and over | 17 (5.0%) | 65 (15.1%) |
Technology Access in Jupiter Farms
Computing Device Access in Jupiter Farms
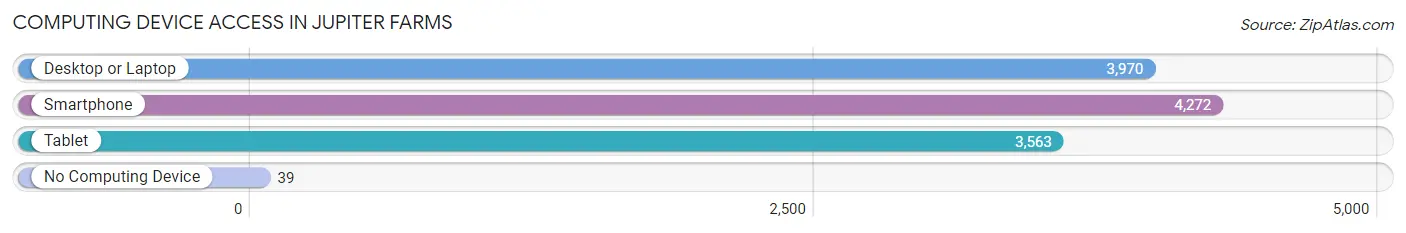
| Device Type | # Households | % Households |
| Desktop or Laptop | 3,970 | 90.7% |
| Smartphone | 4,272 | 97.6% |
| Tablet | 3,563 | 81.4% |
| No Computing Device | 39 | 0.9% |
| Total | 4,379 | 100.0% |
Internet Access in Jupiter Farms
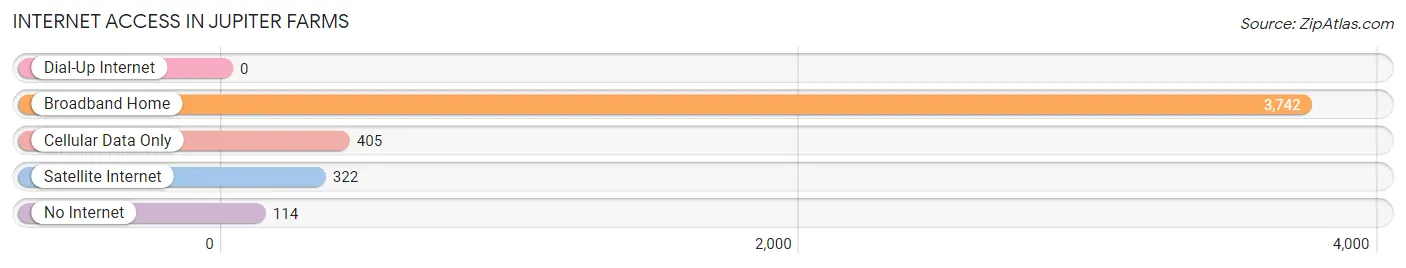
| Internet Type | # Households | % Households |
| Dial-Up Internet | 0 | 0.0% |
| Broadband Home | 3,742 | 85.5% |
| Cellular Data Only | 405 | 9.2% |
| Satellite Internet | 322 | 7.3% |
| No Internet | 114 | 2.6% |
| Total | 4,379 | 100.0% |
Jupiter Farms Summary
Jupiter Farms is an unincorporated community located in Palm Beach County, Florida. It is located in the western part of the county, just west of the city of Jupiter. The community is bordered by the Loxahatchee National Wildlife Refuge to the north, the Jonathan Dickinson State Park to the east, and the Indian Trail Improvement District to the south. The community is home to approximately 8,000 people and covers an area of approximately 20 square miles.
History
Jupiter Farms was originally inhabited by the Tequesta Indians, who were the first known inhabitants of the area. The Tequesta Indians were a peaceful tribe that lived in the area for thousands of years before the arrival of Europeans. The first Europeans to settle in the area were the Spanish, who arrived in the late 1500s. The Spanish established a mission in the area, which was later abandoned.
In the late 1800s, the area was settled by homesteaders, who established farms and ranches in the area. The area was known as the "Farms" and was home to a variety of crops, including citrus, sugar cane, and vegetables. The area was also home to a variety of livestock, including cattle, horses, and hogs.
In the early 1900s, the area began to be developed as a residential community. The first subdivision in the area was established in the 1920s and was known as the Jupiter Farms Subdivision. The area continued to grow and develop throughout the 20th century, and by the late 1990s, the area had become a popular residential community.
Geography
Jupiter Farms is located in western Palm Beach County, Florida. It is bordered by the Loxahatchee National Wildlife Refuge to the north, the Jonathan Dickinson State Park to the east, and the Indian Trail Improvement District to the south. The community covers an area of approximately 20 square miles and is home to approximately 8,000 people.
The area is mostly flat and is characterized by sandy soils and pine flatwoods. The area is home to a variety of wildlife, including deer, bobcats, and a variety of birds. The area is also home to a variety of plants, including saw palmetto, slash pine, and live oak.
Economy
Jupiter Farms is primarily a residential community, and the majority of the population is employed in the service sector. The area is home to a variety of businesses, including restaurants, retail stores, and professional services. The area is also home to a variety of agricultural businesses, including nurseries, farms, and ranches.
The area is also home to a variety of recreational activities, including fishing, boating, and camping. The area is also home to a variety of parks, including the Jonathan Dickinson State Park and the Loxahatchee National Wildlife Refuge.
Demographics
As of the 2010 census, the population of Jupiter Farms was 8,000. The population is primarily white (90.2%), with a small percentage of African Americans (3.2%), Hispanics (2.7%), and Asians (1.9%). The median household income in the area is $63,000, and the median home value is $250,000. The area is home to a variety of religious denominations, including Catholic, Protestant, and Jewish.
Common Questions
What is Per Capita Income in Jupiter Farms?
Per Capita income in Jupiter Farms is $50,290.
What is the Median Family Income in Jupiter Farms?
Median Family Income in Jupiter Farms is $144,063.
What is the Median Household income in Jupiter Farms?
Median Household Income in Jupiter Farms is $135,334.
What is Income or Wage Gap in Jupiter Farms?
Income or Wage Gap in Jupiter Farms is 48.6%.
Women in Jupiter Farms earn 51.4 cents for every dollar earned by a man.
What is Inequality or Gini Index in Jupiter Farms?
Inequality or Gini Index in Jupiter Farms is 0.37.
What is the Total Population of Jupiter Farms?
Total Population of Jupiter Farms is 13,358.
What is the Total Male Population of Jupiter Farms?
Total Male Population of Jupiter Farms is 6,959.
What is the Total Female Population of Jupiter Farms?
Total Female Population of Jupiter Farms is 6,399.
What is the Ratio of Males per 100 Females in Jupiter Farms?
There are 108.75 Males per 100 Females in Jupiter Farms.
What is the Ratio of Females per 100 Males in Jupiter Farms?
There are 91.95 Females per 100 Males in Jupiter Farms.
What is the Median Population Age in Jupiter Farms?
Median Population Age in Jupiter Farms is 43.1 Years.
What is the Average Family Size in Jupiter Farms
Average Family Size in Jupiter Farms is 3.4 People.
What is the Average Household Size in Jupiter Farms
Average Household Size in Jupiter Farms is 3.0 People.
How Large is the Labor Force in Jupiter Farms?
There are 6,916 People in the Labor Forcein in Jupiter Farms.
What is the Percentage of People in the Labor Force in Jupiter Farms?
64.9% of People are in the Labor Force in Jupiter Farms.
What is the Unemployment Rate in Jupiter Farms?
Unemployment Rate in Jupiter Farms is 2.8%.