Fortuna Foothills, AZ Map & Demographics
Fortuna Foothills Map
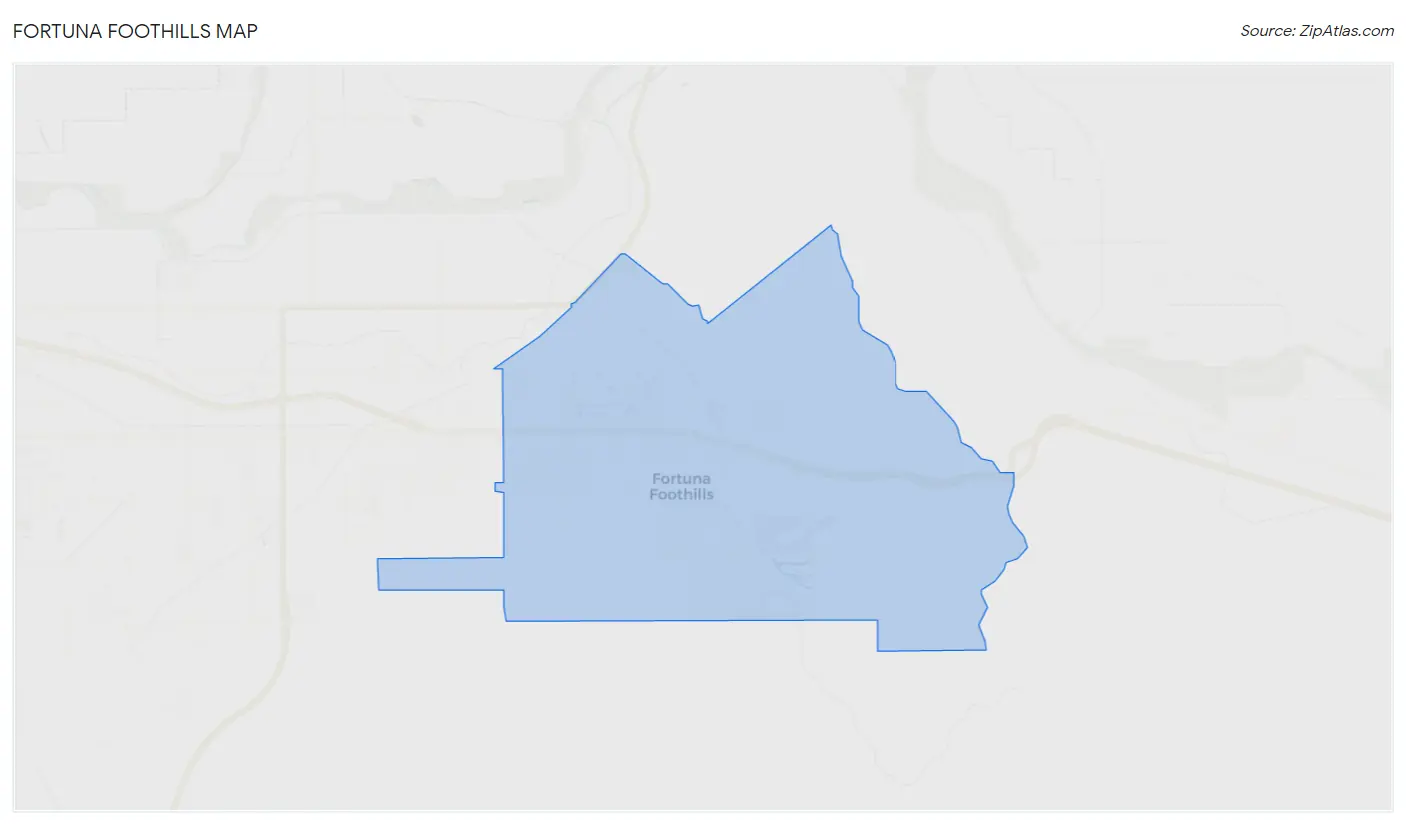
Fortuna Foothills Overview
$33,372
PER CAPITA INCOME
$67,083
AVG FAMILY INCOME
$55,347
AVG HOUSEHOLD INCOME
40.8%
WAGE / INCOME GAP [ % ]
59.2¢/ $1
WAGE / INCOME GAP [ $ ]
$12,644
FAMILY INCOME DEFICIT
0.43
INEQUALITY / GINI INDEX
27,552
TOTAL POPULATION
13,689
MALE POPULATION
13,863
FEMALE POPULATION
98.74
MALES / 100 FEMALES
101.27
FEMALES / 100 MALES
61.9
MEDIAN AGE
2.5
AVG FAMILY SIZE
2.1
AVG HOUSEHOLD SIZE
8,535
LABOR FORCE [ PEOPLE ]
36.1%
PERCENT IN LABOR FORCE
7.7%
UNEMPLOYMENT RATE
Income in Fortuna Foothills
Income Overview in Fortuna Foothills
Per Capita Income in Fortuna Foothills is $33,372, while median incomes of families and households are $67,083 and $55,347 respectively.
| Characteristic | Number | Measure |
| Per Capita Income | 27,552 | $33,372 |
| Median Family Income | 8,430 | $67,083 |
| Mean Family Income | 8,430 | $83,150 |
| Median Household Income | 13,265 | $55,347 |
| Mean Household Income | 13,265 | $70,186 |
| Income Deficit | 8,430 | $12,644 |
| Wage / Income Gap (%) | 27,552 | 40.77% |
| Wage / Income Gap ($) | 27,552 | 59.23¢ per $1 |
| Gini / Inequality Index | 27,552 | 0.43 |
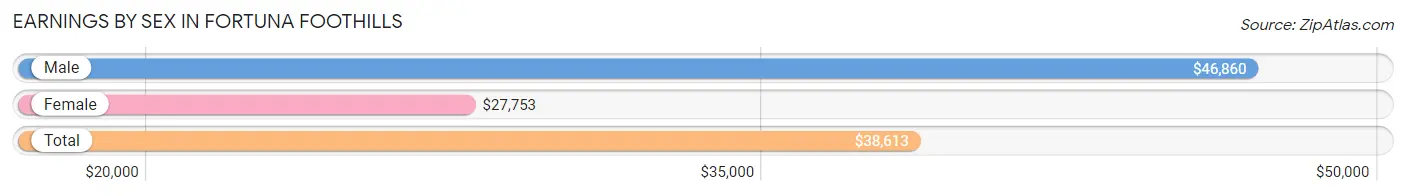
Earnings by Sex in Fortuna Foothills
Average Earnings in Fortuna Foothills are $38,613, $46,860 for men and $27,753 for women, a difference of 40.8%.
| Sex | Number | Average Earnings |
| Male | 5,197 (56.8%) | $46,860 |
| Female | 3,961 (43.2%) | $27,753 |
| Total | 9,158 (100.0%) | $38,613 |
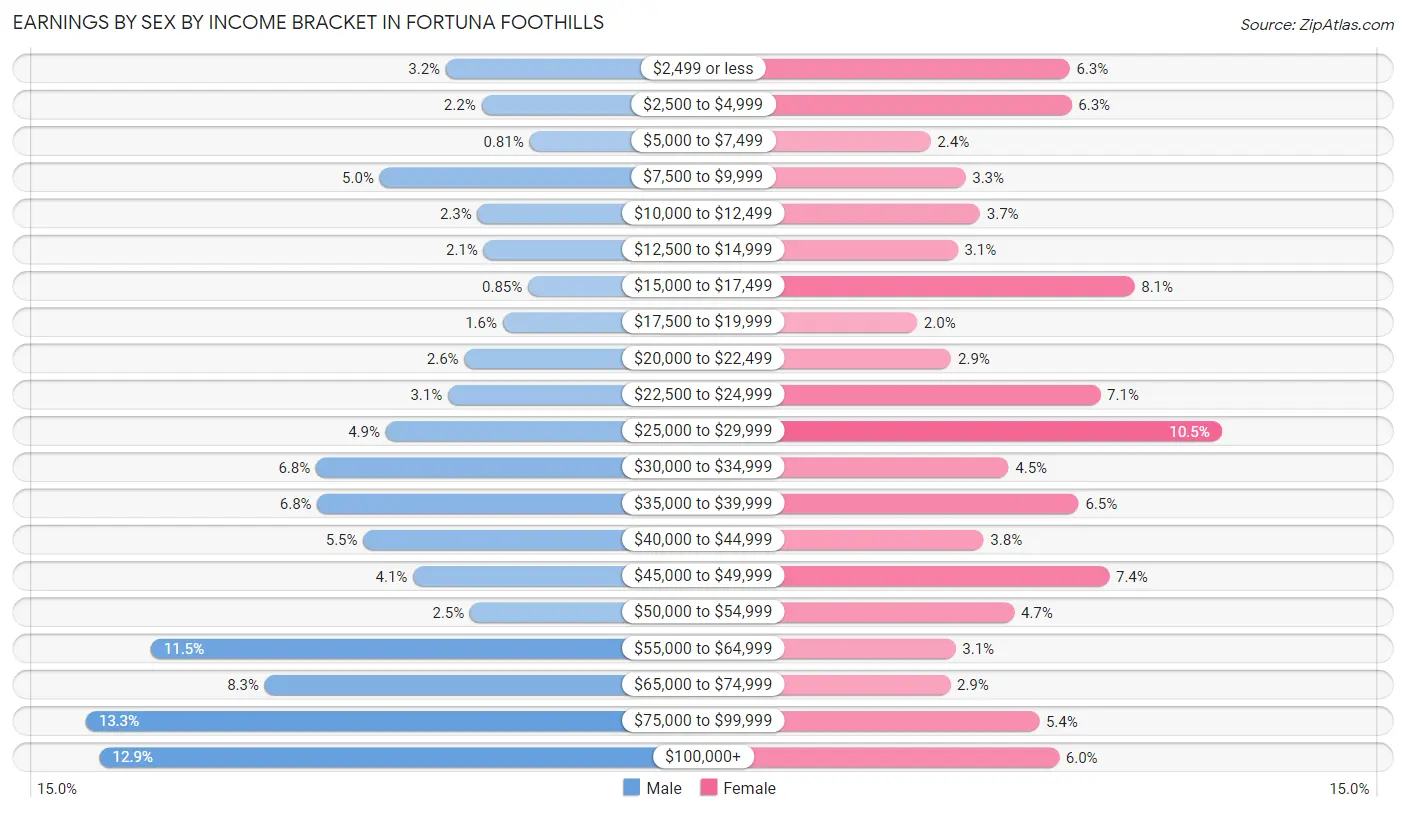
Earnings by Sex by Income Bracket in Fortuna Foothills
The most common earnings brackets in Fortuna Foothills are $75,000 to $99,999 for men (690 | 13.3%) and $25,000 to $29,999 for women (417 | 10.5%).
| Income | Male | Female |
| $2,499 or less | 164 (3.2%) | 248 (6.3%) |
| $2,500 to $4,999 | 112 (2.2%) | 250 (6.3%) |
| $5,000 to $7,499 | 42 (0.8%) | 93 (2.4%) |
| $7,500 to $9,999 | 261 (5.0%) | 132 (3.3%) |
| $10,000 to $12,499 | 118 (2.3%) | 148 (3.7%) |
| $12,500 to $14,999 | 109 (2.1%) | 123 (3.1%) |
| $15,000 to $17,499 | 44 (0.9%) | 320 (8.1%) |
| $17,500 to $19,999 | 81 (1.6%) | 78 (2.0%) |
| $20,000 to $22,499 | 137 (2.6%) | 116 (2.9%) |
| $22,500 to $24,999 | 161 (3.1%) | 282 (7.1%) |
| $25,000 to $29,999 | 252 (4.9%) | 417 (10.5%) |
| $30,000 to $34,999 | 354 (6.8%) | 180 (4.5%) |
| $35,000 to $39,999 | 352 (6.8%) | 258 (6.5%) |
| $40,000 to $44,999 | 285 (5.5%) | 152 (3.8%) |
| $45,000 to $49,999 | 212 (4.1%) | 292 (7.4%) |
| $50,000 to $54,999 | 129 (2.5%) | 186 (4.7%) |
| $55,000 to $64,999 | 595 (11.5%) | 121 (3.0%) |
| $65,000 to $74,999 | 429 (8.3%) | 115 (2.9%) |
| $75,000 to $99,999 | 690 (13.3%) | 214 (5.4%) |
| $100,000+ | 670 (12.9%) | 236 (6.0%) |
| Total | 5,197 (100.0%) | 3,961 (100.0%) |
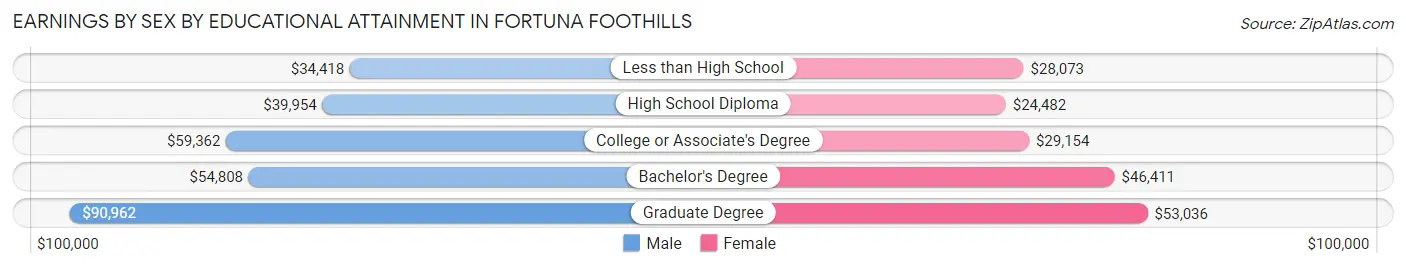
Earnings by Sex by Educational Attainment in Fortuna Foothills
Average earnings in Fortuna Foothills are $51,894 for men and $29,648 for women, a difference of 42.9%. Men with an educational attainment of graduate degree enjoy the highest average annual earnings of $90,962, while those with less than high school education earn the least with $34,418. Women with an educational attainment of graduate degree earn the most with the average annual earnings of $53,036, while those with high school diploma education have the smallest earnings of $24,482.
| Educational Attainment | Male Income | Female Income |
| Less than High School | $34,418 | $28,073 |
| High School Diploma | $39,954 | $24,482 |
| College or Associate's Degree | $59,362 | $29,154 |
| Bachelor's Degree | $54,808 | $46,411 |
| Graduate Degree | $90,962 | $53,036 |
| Total | $51,894 | $29,648 |
Family Income in Fortuna Foothills
Family Income Brackets in Fortuna Foothills
According to the Fortuna Foothills family income data, there are 1,914 families falling into the $50,000 to $74,999 income range, which is the most common income bracket and makes up 22.7% of all families. Conversely, the $10,000 to $14,999 income bracket is the least frequent group with only 110 families (1.3%) belonging to this category.
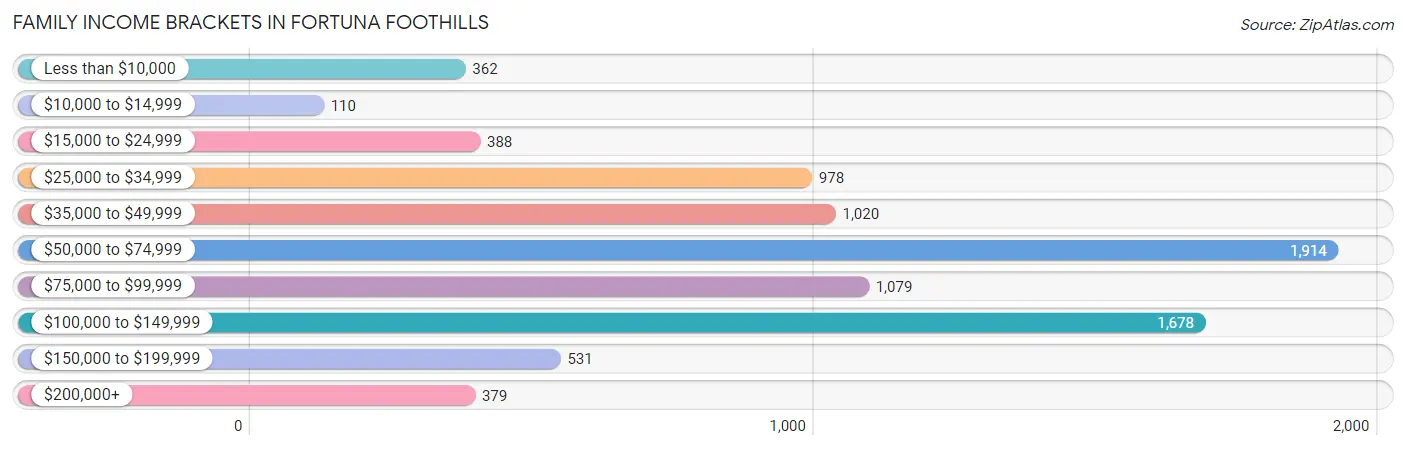
| Income Bracket | # Families | % Families |
| Less than $10,000 | 362 | 4.3% |
| $10,000 to $14,999 | 110 | 1.3% |
| $15,000 to $24,999 | 388 | 4.6% |
| $25,000 to $34,999 | 978 | 11.6% |
| $35,000 to $49,999 | 1,020 | 12.1% |
| $50,000 to $74,999 | 1,914 | 22.7% |
| $75,000 to $99,999 | 1,079 | 12.8% |
| $100,000 to $149,999 | 1,678 | 19.9% |
| $150,000 to $199,999 | 531 | 6.3% |
| $200,000+ | 379 | 4.5% |
Family Income by Famaliy Size in Fortuna Foothills
6-person families (325 | 3.9%) account for the highest median family income in Fortuna Foothills with $123,092 per family, while 2-person families (5,967 | 70.8%) have the highest median income of $29,228 per family member.
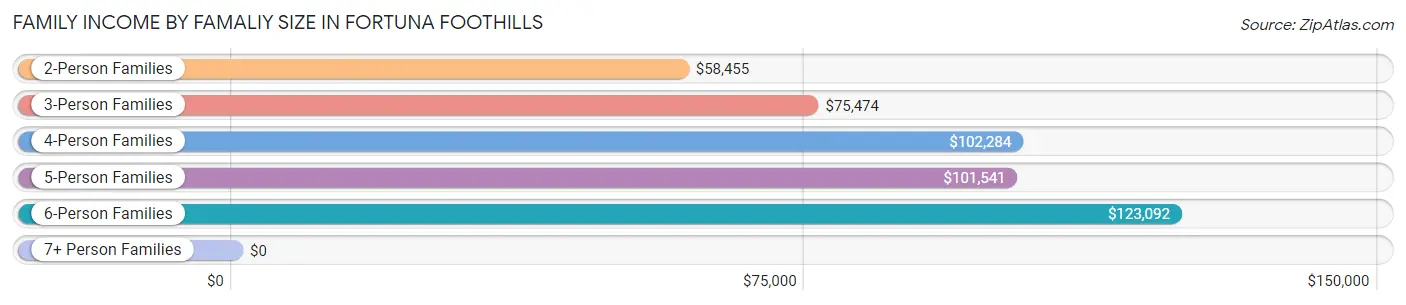
| Income Bracket | # Families | Median Income |
| 2-Person Families | 5,967 (70.8%) | $58,455 |
| 3-Person Families | 849 (10.1%) | $75,474 |
| 4-Person Families | 776 (9.2%) | $102,284 |
| 5-Person Families | 492 (5.8%) | $101,541 |
| 6-Person Families | 325 (3.9%) | $123,092 |
| 7+ Person Families | 21 (0.3%) | $0 |
| Total | 8,430 (100.0%) | $67,083 |
Family Income by Number of Earners in Fortuna Foothills
The median family income in Fortuna Foothills is $67,083, with families comprising 3+ earners (512) having the highest median family income of $114,142, while families with no earners (4,142) have the lowest median family income of $51,634, accounting for 6.1% and 49.1% of families, respectively.
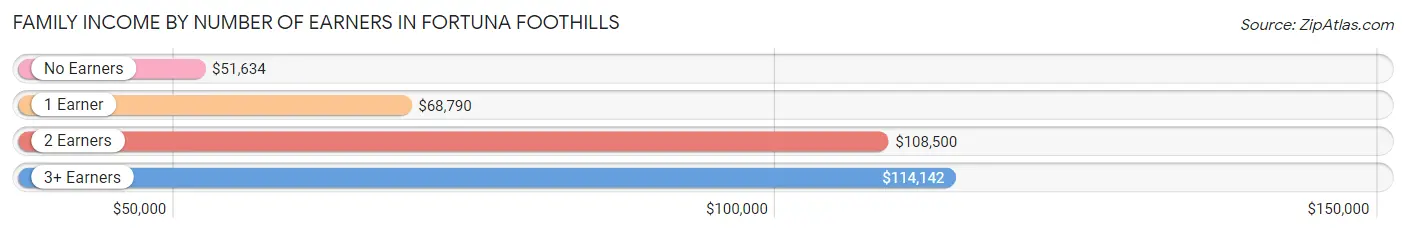
| Number of Earners | # Families | Median Income |
| No Earners | 4,142 (49.1%) | $51,634 |
| 1 Earner | 2,036 (24.1%) | $68,790 |
| 2 Earners | 1,740 (20.6%) | $108,500 |
| 3+ Earners | 512 (6.1%) | $114,142 |
| Total | 8,430 (100.0%) | $67,083 |
Household Income in Fortuna Foothills
Household Income Brackets in Fortuna Foothills
With 2,733 households falling in the category, the $50,000 to $74,999 income range is the most frequent in Fortuna Foothills, accounting for 20.6% of all households. In contrast, only 411 households (3.1%) fall into the $10,000 to $14,999 income bracket, making it the least populous group.
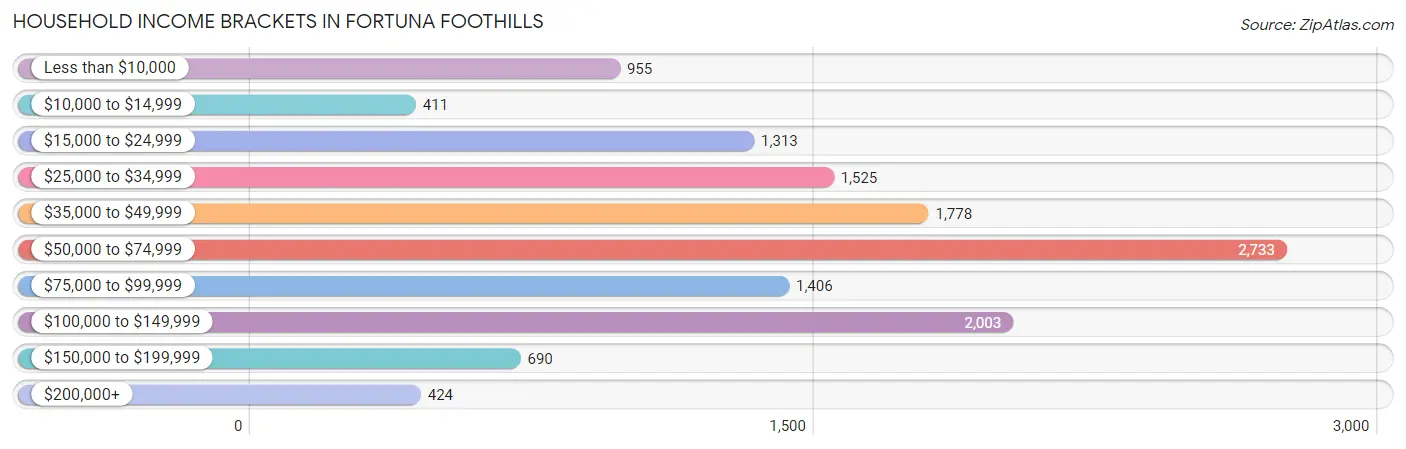
| Income Bracket | # Households | % Households |
| Less than $10,000 | 955 | 7.2% |
| $10,000 to $14,999 | 411 | 3.1% |
| $15,000 to $24,999 | 1,313 | 9.9% |
| $25,000 to $34,999 | 1,525 | 11.5% |
| $35,000 to $49,999 | 1,778 | 13.4% |
| $50,000 to $74,999 | 2,733 | 20.6% |
| $75,000 to $99,999 | 1,406 | 10.6% |
| $100,000 to $149,999 | 2,003 | 15.1% |
| $150,000 to $199,999 | 690 | 5.2% |
| $200,000+ | 424 | 3.2% |
Household Income by Householder Age in Fortuna Foothills
The median household income in Fortuna Foothills is $55,347, with the highest median household income of $85,824 found in the 45 to 64 years age bracket for the primary householder. A total of 2,845 households (21.4%) fall into this category. Meanwhile, the 15 to 24 years age bracket for the primary householder has the lowest median household income of $22,580, with 153 households (1.1%) in this group.
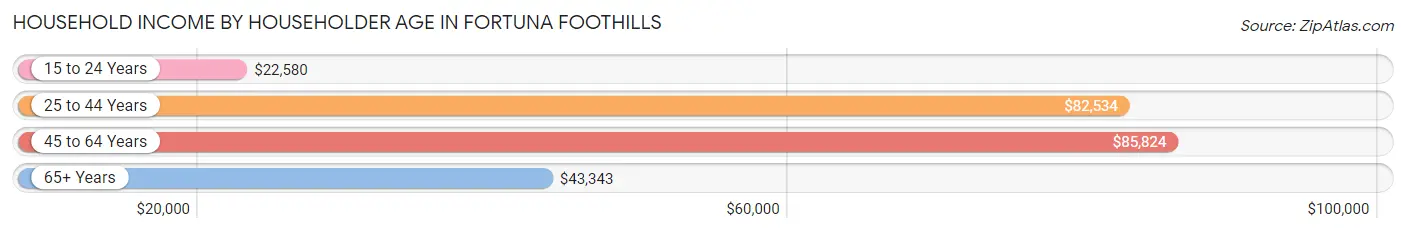
| Income Bracket | # Households | Median Income |
| 15 to 24 Years | 153 (1.1%) | $22,580 |
| 25 to 44 Years | 2,362 (17.8%) | $82,534 |
| 45 to 64 Years | 2,845 (21.4%) | $85,824 |
| 65+ Years | 7,905 (59.6%) | $43,343 |
| Total | 13,265 (100.0%) | $55,347 |
Poverty in Fortuna Foothills
Income Below Poverty by Sex and Age in Fortuna Foothills
With 10.3% poverty level for males and 11.3% for females among the residents of Fortuna Foothills, 15 year old males and 18 to 24 year old females are the most vulnerable to poverty, with 58 males (36.2%) and 139 females (32.6%) in their respective age groups living below the poverty level.
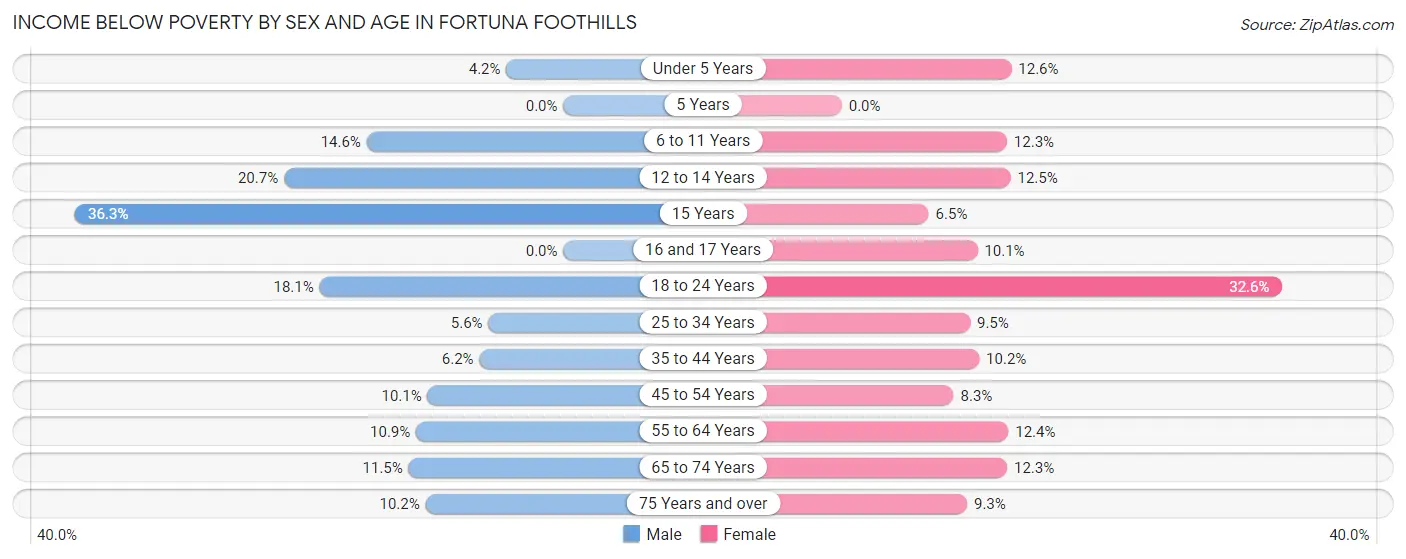
| Age Bracket | Male | Female |
| Under 5 Years | 25 (4.2%) | 68 (12.6%) |
| 5 Years | 0 (0.0%) | 0 (0.0%) |
| 6 to 11 Years | 107 (14.6%) | 78 (12.3%) |
| 12 to 14 Years | 78 (20.7%) | 49 (12.5%) |
| 15 Years | 58 (36.2%) | 8 (6.5%) |
| 16 and 17 Years | 0 (0.0%) | 28 (10.1%) |
| 18 to 24 Years | 82 (18.1%) | 139 (32.6%) |
| 25 to 34 Years | 80 (5.6%) | 110 (9.5%) |
| 35 to 44 Years | 78 (6.2%) | 85 (10.2%) |
| 45 to 54 Years | 102 (10.1%) | 91 (8.3%) |
| 55 to 64 Years | 155 (10.9%) | 186 (12.4%) |
| 65 to 74 Years | 290 (11.5%) | 380 (12.3%) |
| 75 Years and over | 355 (10.2%) | 335 (9.3%) |
| Total | 1,410 (10.3%) | 1,557 (11.3%) |
Income Above Poverty by Sex and Age in Fortuna Foothills
According to the poverty statistics in Fortuna Foothills, males aged 5 years and females aged 5 years are the age groups that are most secure financially, with 100.0% of males and 100.0% of females in these age groups living above the poverty line.
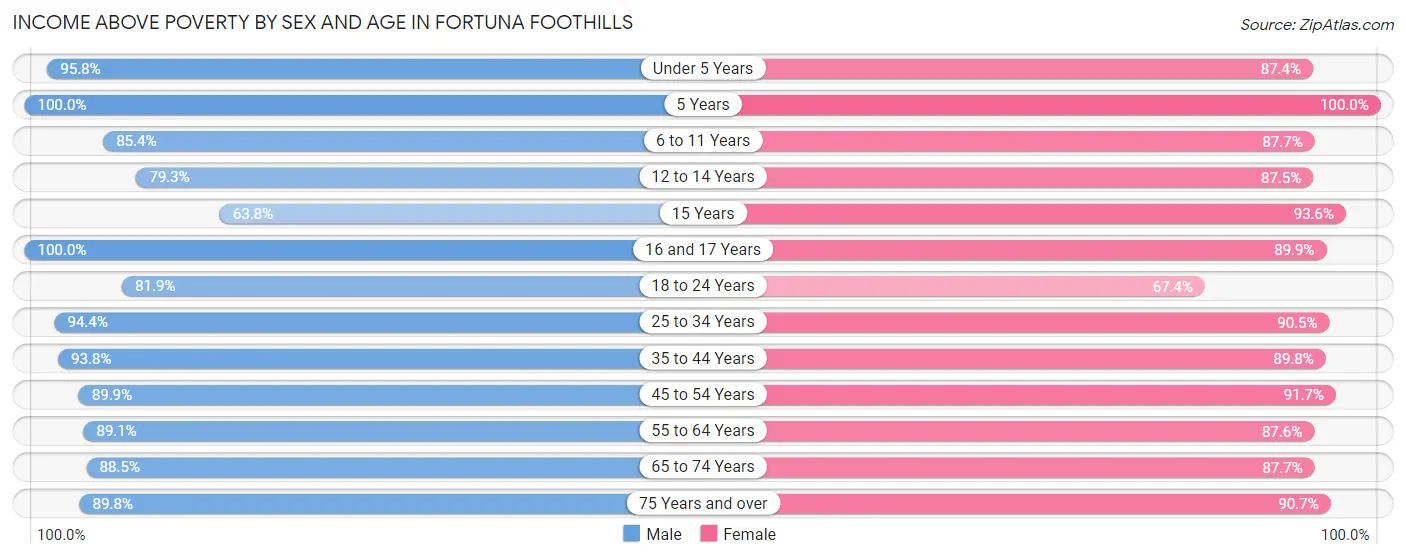
| Age Bracket | Male | Female |
| Under 5 Years | 566 (95.8%) | 472 (87.4%) |
| 5 Years | 178 (100.0%) | 56 (100.0%) |
| 6 to 11 Years | 626 (85.4%) | 558 (87.7%) |
| 12 to 14 Years | 298 (79.3%) | 342 (87.5%) |
| 15 Years | 102 (63.7%) | 116 (93.5%) |
| 16 and 17 Years | 75 (100.0%) | 250 (89.9%) |
| 18 to 24 Years | 371 (81.9%) | 287 (67.4%) |
| 25 to 34 Years | 1,360 (94.4%) | 1,046 (90.5%) |
| 35 to 44 Years | 1,174 (93.8%) | 748 (89.8%) |
| 45 to 54 Years | 910 (89.9%) | 1,006 (91.7%) |
| 55 to 64 Years | 1,263 (89.1%) | 1,319 (87.6%) |
| 65 to 74 Years | 2,233 (88.5%) | 2,717 (87.7%) |
| 75 Years and over | 3,115 (89.8%) | 3,269 (90.7%) |
| Total | 12,271 (89.7%) | 12,186 (88.7%) |
Income Below Poverty Among Married-Couple Families in Fortuna Foothills
The poverty statistics for married-couple families in Fortuna Foothills show that 5.7% or 411 of the total 7,188 families live below the poverty line. Families with no children have the highest poverty rate of 6.9%, comprising of 390 families. On the other hand, families with 1 or 2 children have the lowest poverty rate of 1.3%, which includes 12 families.
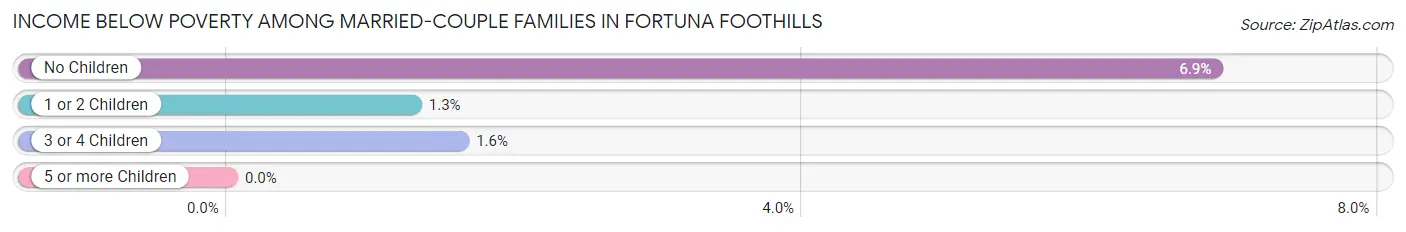
| Children | Above Poverty | Below Poverty |
| No Children | 5,299 (93.1%) | 390 (6.9%) |
| 1 or 2 Children | 927 (98.7%) | 12 (1.3%) |
| 3 or 4 Children | 551 (98.4%) | 9 (1.6%) |
| 5 or more Children | 0 (0.0%) | 0 (0.0%) |
| Total | 6,777 (94.3%) | 411 (5.7%) |
Income Below Poverty Among Single-Parent Households in Fortuna Foothills
According to the poverty data in Fortuna Foothills, 19.0% or 94 single-father households and 14.3% or 107 single-mother households are living below the poverty line. Among single-father households, those with 1 or 2 children have the highest poverty rate, with 85 households (34.0%) experiencing poverty. Likewise, among single-mother households, those with 5 or more children have the highest poverty rate, with 21 households (100.0%) falling below the poverty line.
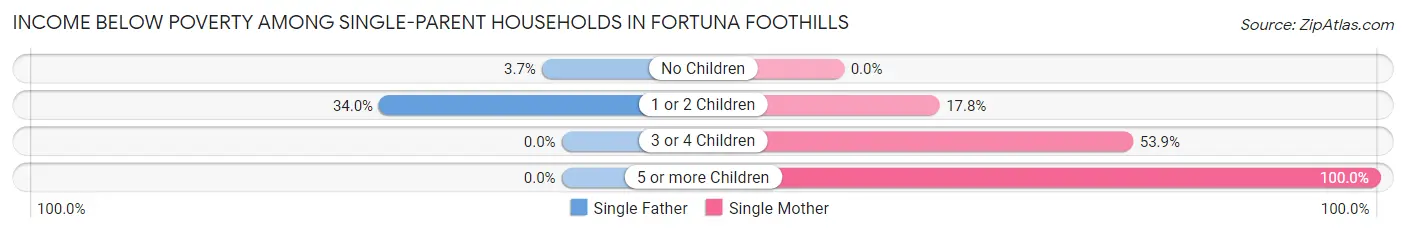
| Children | Single Father | Single Mother |
| No Children | 9 (3.7%) | 0 (0.0%) |
| 1 or 2 Children | 85 (34.0%) | 58 (17.8%) |
| 3 or 4 Children | 0 (0.0%) | 28 (53.8%) |
| 5 or more Children | 0 (0.0%) | 21 (100.0%) |
| Total | 94 (19.0%) | 107 (14.3%) |
Income Below Poverty Among Married-Couple vs Single-Parent Households in Fortuna Foothills
The poverty data for Fortuna Foothills shows that 411 of the married-couple family households (5.7%) and 201 of the single-parent households (16.2%) are living below the poverty level. Within the married-couple family households, those with no children have the highest poverty rate, with 390 households (6.9%) falling below the poverty line. Among the single-parent households, those with 5 or more children have the highest poverty rate, with 21 household (100.0%) living below poverty.
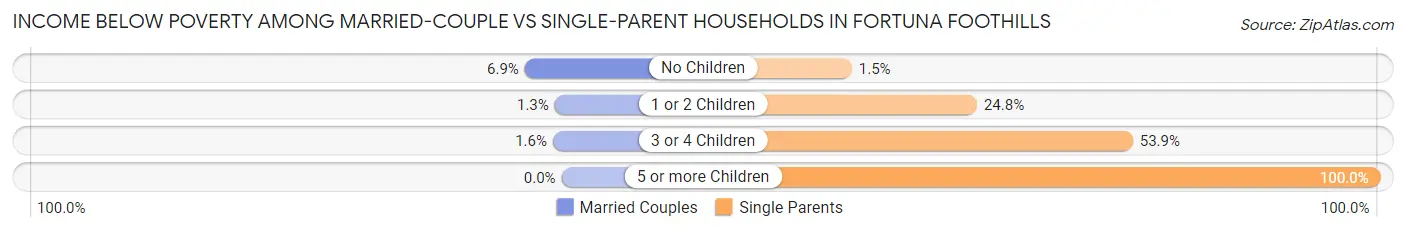
| Children | Married-Couple Families | Single-Parent Households |
| No Children | 390 (6.9%) | 9 (1.5%) |
| 1 or 2 Children | 12 (1.3%) | 143 (24.8%) |
| 3 or 4 Children | 9 (1.6%) | 28 (53.8%) |
| 5 or more Children | 0 (0.0%) | 21 (100.0%) |
| Total | 411 (5.7%) | 201 (16.2%) |
Race in Fortuna Foothills
The most populous races in Fortuna Foothills are White / Caucasian (21,352 | 77.5%), Hispanic or Latino (7,458 | 27.1%), and Two or more Races (3,060 | 11.1%).
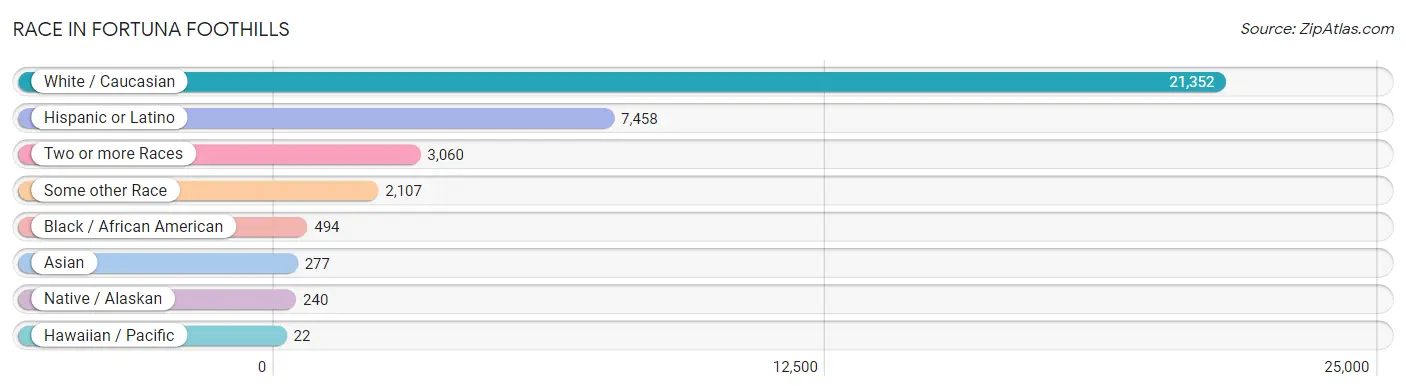
| Race | # Population | % Population |
| Asian | 277 | 1.0% |
| Black / African American | 494 | 1.8% |
| Hawaiian / Pacific | 22 | 0.1% |
| Hispanic or Latino | 7,458 | 27.1% |
| Native / Alaskan | 240 | 0.9% |
| White / Caucasian | 21,352 | 77.5% |
| Two or more Races | 3,060 | 11.1% |
| Some other Race | 2,107 | 7.6% |
| Total | 27,552 | 100.0% |
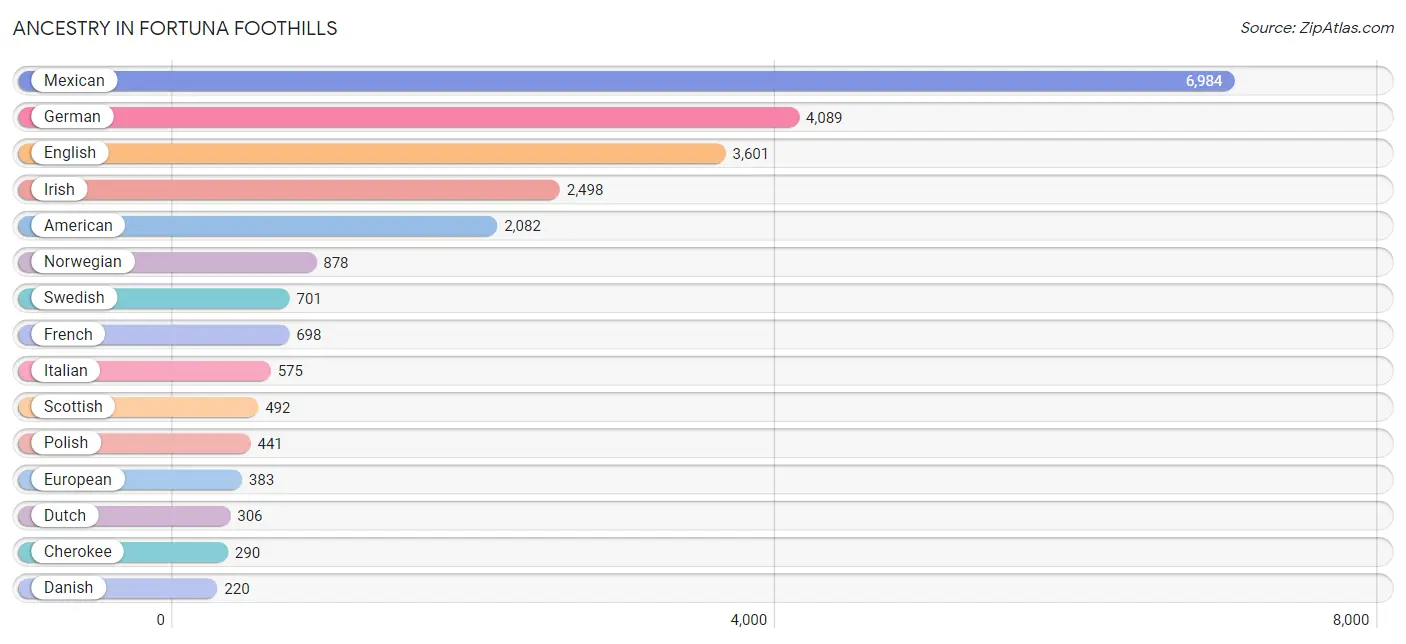
Ancestry in Fortuna Foothills
The most populous ancestries reported in Fortuna Foothills are Mexican (6,984 | 25.4%), German (4,089 | 14.8%), English (3,601 | 13.1%), Irish (2,498 | 9.1%), and American (2,082 | 7.6%), together accounting for 69.9% of all Fortuna Foothills residents.
| Ancestry | # Population | % Population |
| African | 51 | 0.2% |
| American | 2,082 | 7.6% |
| Apache | 32 | 0.1% |
| Arab | 58 | 0.2% |
| Australian | 6 | 0.0% |
| Austrian | 85 | 0.3% |
| Basque | 46 | 0.2% |
| Belgian | 14 | 0.1% |
| Bhutanese | 86 | 0.3% |
| Blackfeet | 6 | 0.0% |
| Bolivian | 10 | 0.0% |
| Brazilian | 29 | 0.1% |
| British | 203 | 0.7% |
| Burmese | 59 | 0.2% |
| Canadian | 183 | 0.7% |
| Central American | 46 | 0.2% |
| Central American Indian | 26 | 0.1% |
| Cherokee | 290 | 1.1% |
| Choctaw | 6 | 0.0% |
| Croatian | 34 | 0.1% |
| Cuban | 23 | 0.1% |
| Czech | 38 | 0.1% |
| Czechoslovakian | 11 | 0.0% |
| Danish | 220 | 0.8% |
| Dutch | 306 | 1.1% |
| Eastern European | 27 | 0.1% |
| Ecuadorian | 15 | 0.1% |
| English | 3,601 | 13.1% |
| European | 383 | 1.4% |
| Finnish | 166 | 0.6% |
| French | 698 | 2.5% |
| French American Indian | 15 | 0.1% |
| French Canadian | 151 | 0.5% |
| German | 4,089 | 14.8% |
| Greek | 185 | 0.7% |
| Guamanian / Chamorro | 6 | 0.0% |
| Guatemalan | 13 | 0.1% |
| Hungarian | 63 | 0.2% |
| Indian (Asian) | 36 | 0.1% |
| Irish | 2,498 | 9.1% |
| Italian | 575 | 2.1% |
| Korean | 81 | 0.3% |
| Lebanese | 19 | 0.1% |
| Lithuanian | 34 | 0.1% |
| Luxembourger | 7 | 0.0% |
| Mexican | 6,984 | 25.4% |
| Mexican American Indian | 29 | 0.1% |
| Moroccan | 15 | 0.1% |
| Native Hawaiian | 5 | 0.0% |
| Navajo | 31 | 0.1% |
| New Zealander | 25 | 0.1% |
| Northern European | 28 | 0.1% |
| Norwegian | 878 | 3.2% |
| Ottawa | 5 | 0.0% |
| Palestinian | 24 | 0.1% |
| Pennsylvania German | 21 | 0.1% |
| Peruvian | 8 | 0.0% |
| Polish | 441 | 1.6% |
| Portuguese | 177 | 0.6% |
| Puerto Rican | 104 | 0.4% |
| Puget Sound Salish | 4 | 0.0% |
| Romanian | 53 | 0.2% |
| Russian | 55 | 0.2% |
| Salvadoran | 33 | 0.1% |
| Samoan | 25 | 0.1% |
| Scandinavian | 163 | 0.6% |
| Scotch-Irish | 184 | 0.7% |
| Scottish | 492 | 1.8% |
| Shoshone | 16 | 0.1% |
| Sioux | 13 | 0.1% |
| Slavic | 6 | 0.0% |
| Slovak | 26 | 0.1% |
| South American | 33 | 0.1% |
| South American Indian | 15 | 0.1% |
| Spaniard | 82 | 0.3% |
| Spanish | 38 | 0.1% |
| Sri Lankan | 15 | 0.1% |
| Subsaharan African | 60 | 0.2% |
| Sudanese | 9 | 0.0% |
| Swedish | 701 | 2.5% |
| Swiss | 77 | 0.3% |
| Taiwanese | 98 | 0.4% |
| Thai | 35 | 0.1% |
| Trinidadian and Tobagonian | 102 | 0.4% |
| Ukrainian | 153 | 0.6% |
| Welsh | 175 | 0.6% |
| West Indian | 6 | 0.0% |
| Yakama | 20 | 0.1% |
| Yaqui | 10 | 0.0% |
| Yugoslavian | 40 | 0.2% |
| Yuman | 7 | 0.0% | View All 91 Rows |
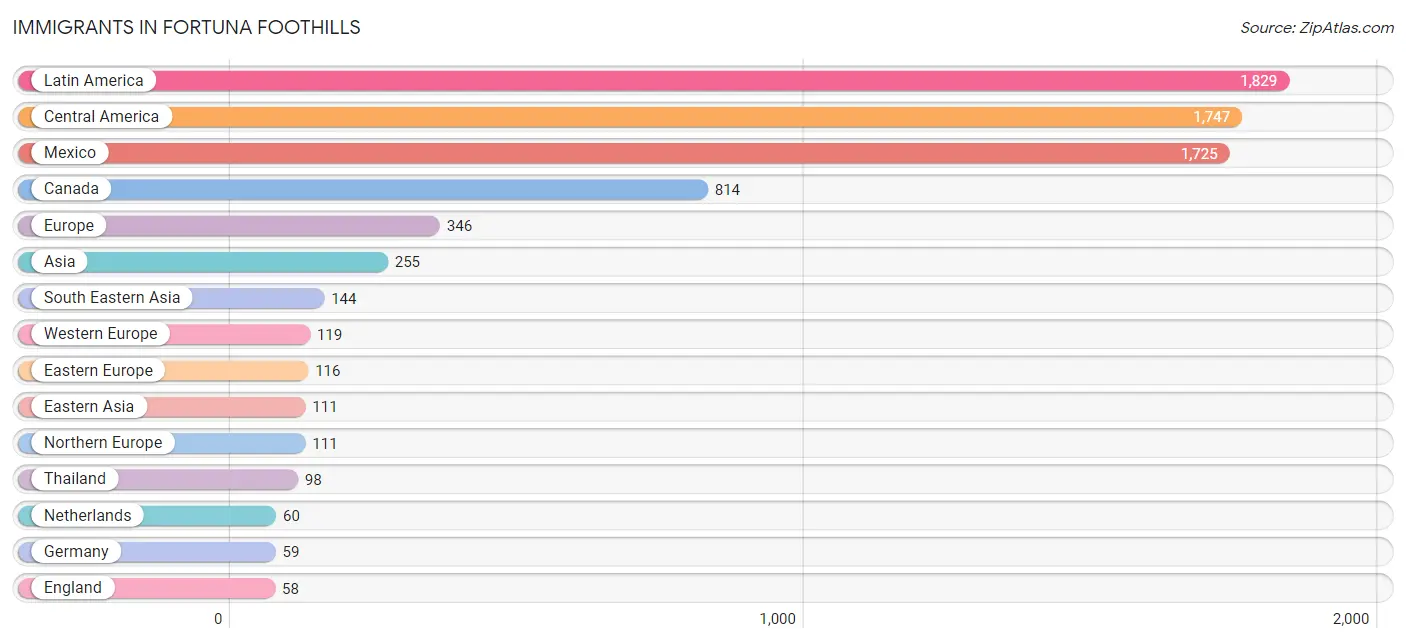
Immigrants in Fortuna Foothills
The most numerous immigrant groups reported in Fortuna Foothills came from Latin America (1,829 | 6.6%), Central America (1,747 | 6.3%), Mexico (1,725 | 6.3%), Canada (814 | 2.9%), and Europe (346 | 1.3%), together accounting for 23.5% of all Fortuna Foothills residents.
| Immigration Origin | # Population | % Population |
| Africa | 28 | 0.1% |
| Asia | 255 | 0.9% |
| Bolivia | 10 | 0.0% |
| Brazil | 29 | 0.1% |
| Canada | 814 | 2.9% |
| Caribbean | 28 | 0.1% |
| Central America | 1,747 | 6.3% |
| China | 36 | 0.1% |
| Cuba | 6 | 0.0% |
| Denmark | 6 | 0.0% |
| Eastern Asia | 111 | 0.4% |
| Eastern Europe | 116 | 0.4% |
| Ecuador | 15 | 0.1% |
| El Salvador | 9 | 0.0% |
| England | 58 | 0.2% |
| Europe | 346 | 1.3% |
| Germany | 59 | 0.2% |
| Guatemala | 13 | 0.1% |
| Hong Kong | 8 | 0.0% |
| Ireland | 10 | 0.0% |
| Japan | 56 | 0.2% |
| Korea | 19 | 0.1% |
| Latin America | 1,829 | 6.6% |
| Mexico | 1,725 | 6.3% |
| Netherlands | 60 | 0.2% |
| Northern Africa | 15 | 0.1% |
| Northern Europe | 111 | 0.4% |
| Oceania | 25 | 0.1% |
| Philippines | 41 | 0.2% |
| Poland | 15 | 0.1% |
| Romania | 13 | 0.1% |
| South America | 54 | 0.2% |
| South Eastern Asia | 144 | 0.5% |
| Sweden | 14 | 0.1% |
| Thailand | 98 | 0.4% |
| Trinidad and Tobago | 22 | 0.1% |
| Ukraine | 48 | 0.2% |
| Vietnam | 5 | 0.0% |
| Western Africa | 13 | 0.1% |
| Western Europe | 119 | 0.4% | View All 40 Rows |
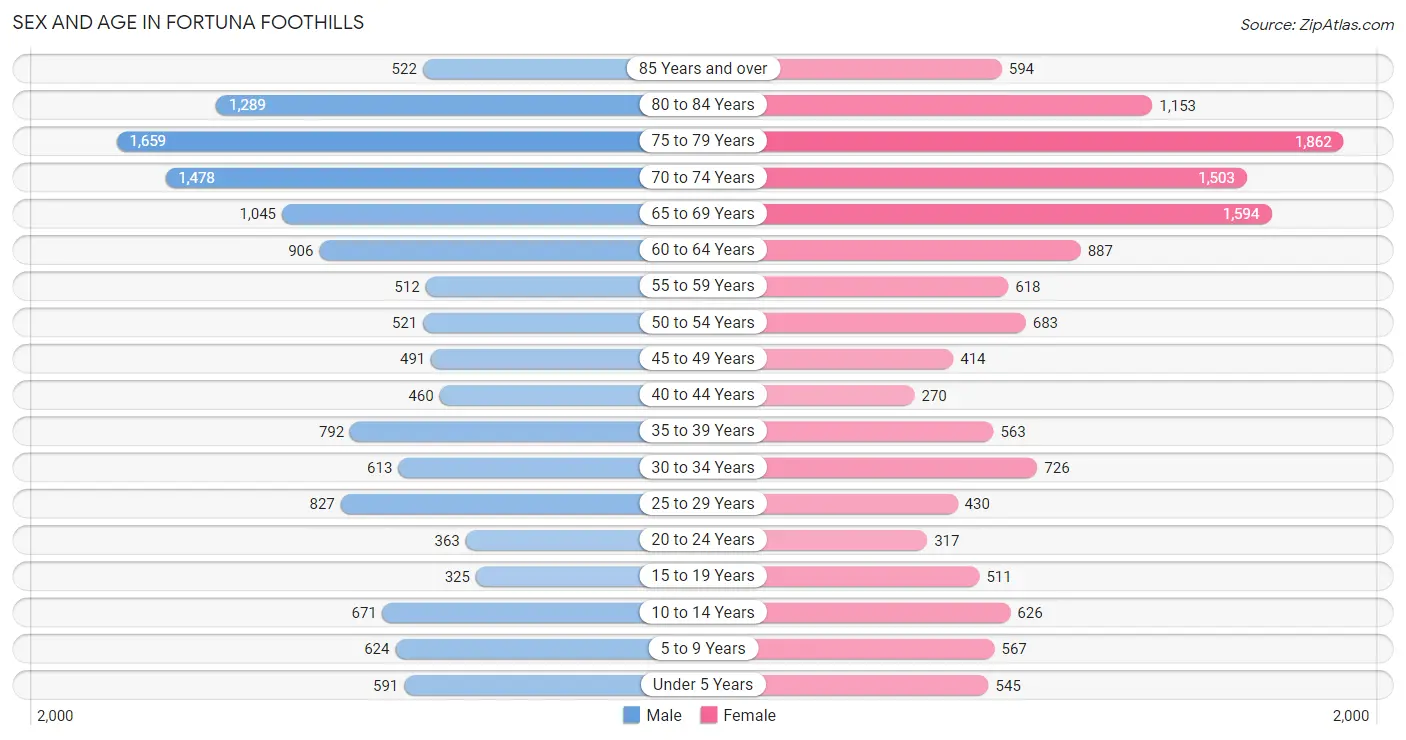
Sex and Age in Fortuna Foothills
Sex and Age in Fortuna Foothills
The most populous age groups in Fortuna Foothills are 75 to 79 Years (1,659 | 12.1%) for men and 75 to 79 Years (1,862 | 13.4%) for women.
| Age Bracket | Male | Female |
| Under 5 Years | 591 (4.3%) | 545 (3.9%) |
| 5 to 9 Years | 624 (4.6%) | 567 (4.1%) |
| 10 to 14 Years | 671 (4.9%) | 626 (4.5%) |
| 15 to 19 Years | 325 (2.4%) | 511 (3.7%) |
| 20 to 24 Years | 363 (2.6%) | 317 (2.3%) |
| 25 to 29 Years | 827 (6.0%) | 430 (3.1%) |
| 30 to 34 Years | 613 (4.5%) | 726 (5.2%) |
| 35 to 39 Years | 792 (5.8%) | 563 (4.1%) |
| 40 to 44 Years | 460 (3.4%) | 270 (1.9%) |
| 45 to 49 Years | 491 (3.6%) | 414 (3.0%) |
| 50 to 54 Years | 521 (3.8%) | 683 (4.9%) |
| 55 to 59 Years | 512 (3.7%) | 618 (4.5%) |
| 60 to 64 Years | 906 (6.6%) | 887 (6.4%) |
| 65 to 69 Years | 1,045 (7.6%) | 1,594 (11.5%) |
| 70 to 74 Years | 1,478 (10.8%) | 1,503 (10.8%) |
| 75 to 79 Years | 1,659 (12.1%) | 1,862 (13.4%) |
| 80 to 84 Years | 1,289 (9.4%) | 1,153 (8.3%) |
| 85 Years and over | 522 (3.8%) | 594 (4.3%) |
| Total | 13,689 (100.0%) | 13,863 (100.0%) |
Families and Households in Fortuna Foothills
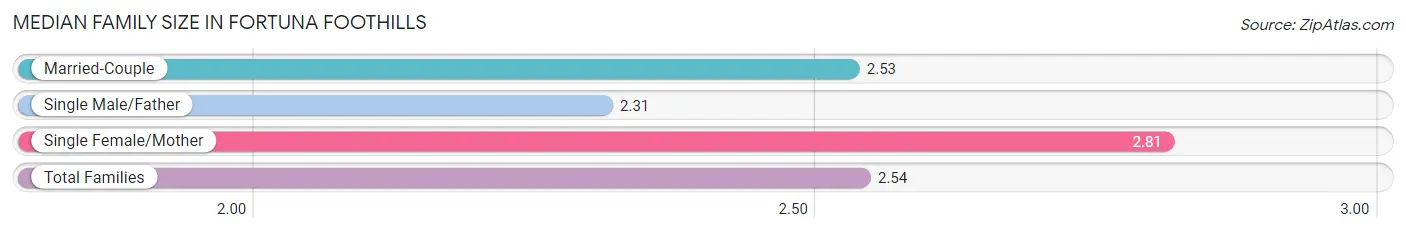
Median Family Size in Fortuna Foothills
The median family size in Fortuna Foothills is 2.54 persons per family, with single female/mother families (748 | 8.9%) accounting for the largest median family size of 2.81 persons per family. On the other hand, single male/father families (494 | 5.9%) represent the smallest median family size with 2.31 persons per family.
| Family Type | # Families | Family Size |
| Married-Couple | 7,188 (85.3%) | 2.53 |
| Single Male/Father | 494 (5.9%) | 2.31 |
| Single Female/Mother | 748 (8.9%) | 2.81 |
| Total Families | 8,430 (100.0%) | 2.54 |
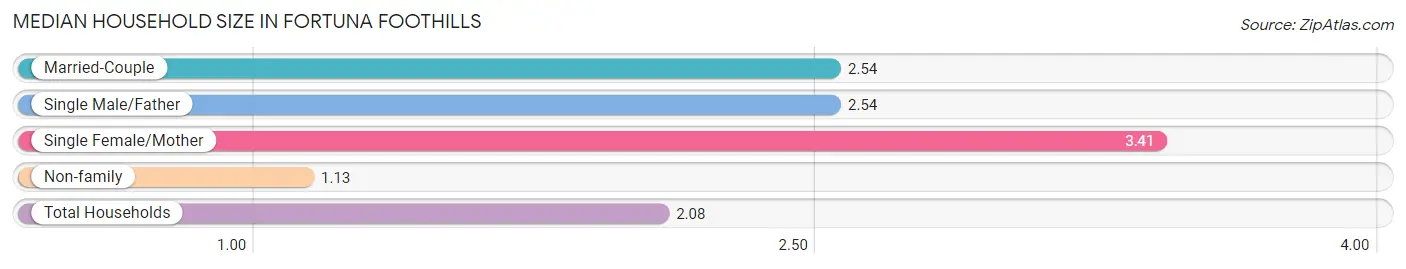
Median Household Size in Fortuna Foothills
The median household size in Fortuna Foothills is 2.08 persons per household, with single female/mother households (748 | 5.6%) accounting for the largest median household size of 3.41 persons per household. non-family households (4,835 | 36.4%) represent the smallest median household size with 1.13 persons per household.
| Household Type | # Households | Household Size |
| Married-Couple | 7,188 (54.2%) | 2.54 |
| Single Male/Father | 494 (3.7%) | 2.54 |
| Single Female/Mother | 748 (5.6%) | 3.41 |
| Non-family | 4,835 (36.4%) | 1.13 |
| Total Households | 13,265 (100.0%) | 2.08 |
Household Size by Marriage Status in Fortuna Foothills
Out of a total of 13,265 households in Fortuna Foothills, 8,430 (63.5%) are family households, while 4,835 (36.4%) are nonfamily households. The most numerous type of family households are 2-person households, comprising 5,745, and the most common type of nonfamily households are 1-person households, comprising 4,105.
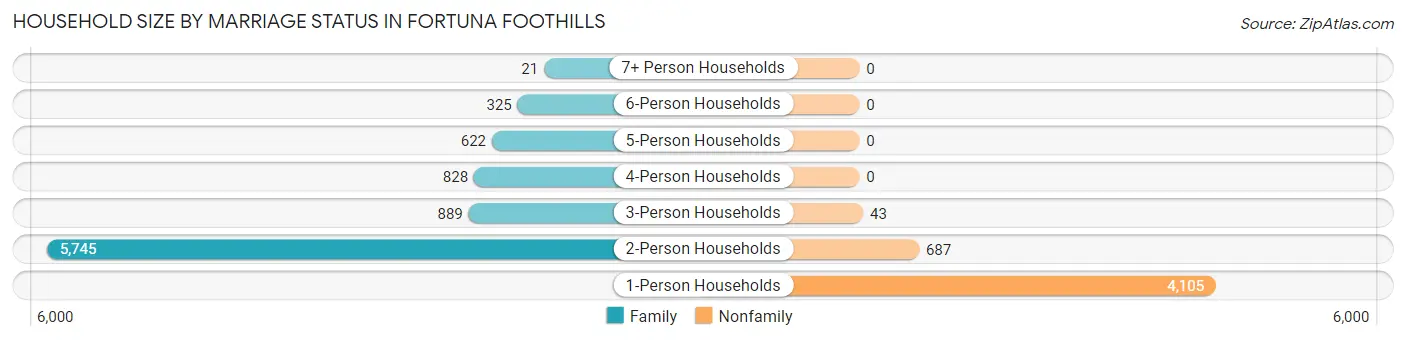
| Household Size | Family Households | Nonfamily Households |
| 1-Person Households | - | 4,105 (30.9%) |
| 2-Person Households | 5,745 (43.3%) | 687 (5.2%) |
| 3-Person Households | 889 (6.7%) | 43 (0.3%) |
| 4-Person Households | 828 (6.2%) | 0 (0.0%) |
| 5-Person Households | 622 (4.7%) | 0 (0.0%) |
| 6-Person Households | 325 (2.5%) | 0 (0.0%) |
| 7+ Person Households | 21 (0.2%) | 0 (0.0%) |
| Total | 8,430 (63.5%) | 4,835 (36.4%) |
Female Fertility in Fortuna Foothills
Fertility by Age in Fortuna Foothills
Average fertility rate in Fortuna Foothills is 37.0 births per 1,000 women. Women in the age bracket of 20 to 34 years have the highest fertility rate with 84.0 births per 1,000 women. Women in the age bracket of 20 to 34 years acount for 100.0% of all women with births.
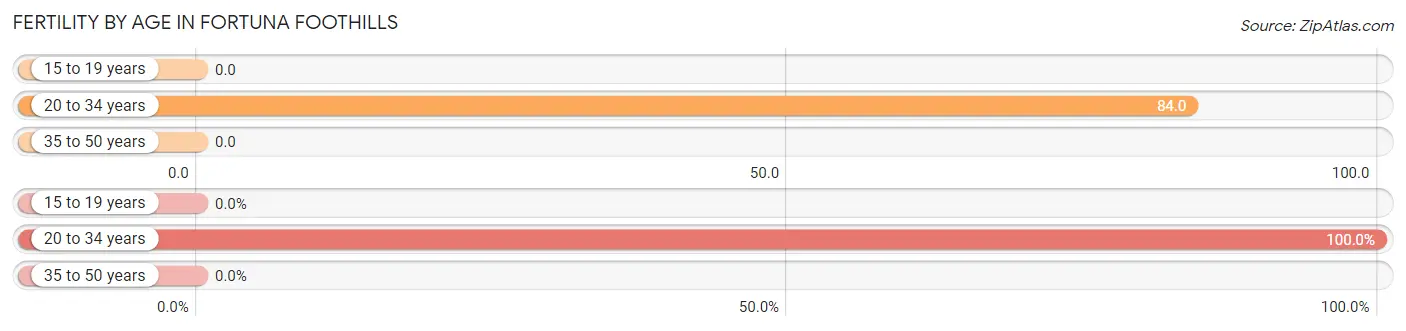
| Age Bracket | Women with Births | Births / 1,000 Women |
| 15 to 19 years | 0 (0.0%) | 0.0 |
| 20 to 34 years | 124 (100.0%) | 84.0 |
| 35 to 50 years | 0 (0.0%) | 0.0 |
| Total | 124 (100.0%) | 37.0 |
Fertility by Age by Marriage Status in Fortuna Foothills
74.2% of women with births (124) in Fortuna Foothills are married. The highest percentage of unmarried women with births falls into 20 to 34 years age bracket with 25.8% of them unmarried at the time of birth, while the lowest percentage of unmarried women with births belong to 20 to 34 years age bracket with 25.8% of them unmarried.
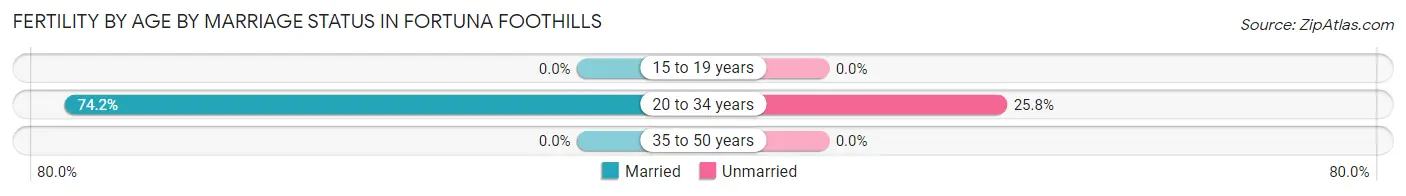
| Age Bracket | Married | Unmarried |
| 15 to 19 years | 0 (0.0%) | 0 (0.0%) |
| 20 to 34 years | 92 (74.2%) | 32 (25.8%) |
| 35 to 50 years | 0 (0.0%) | 0 (0.0%) |
| Total | 92 (74.2%) | 32 (25.8%) |
Fertility by Education in Fortuna Foothills
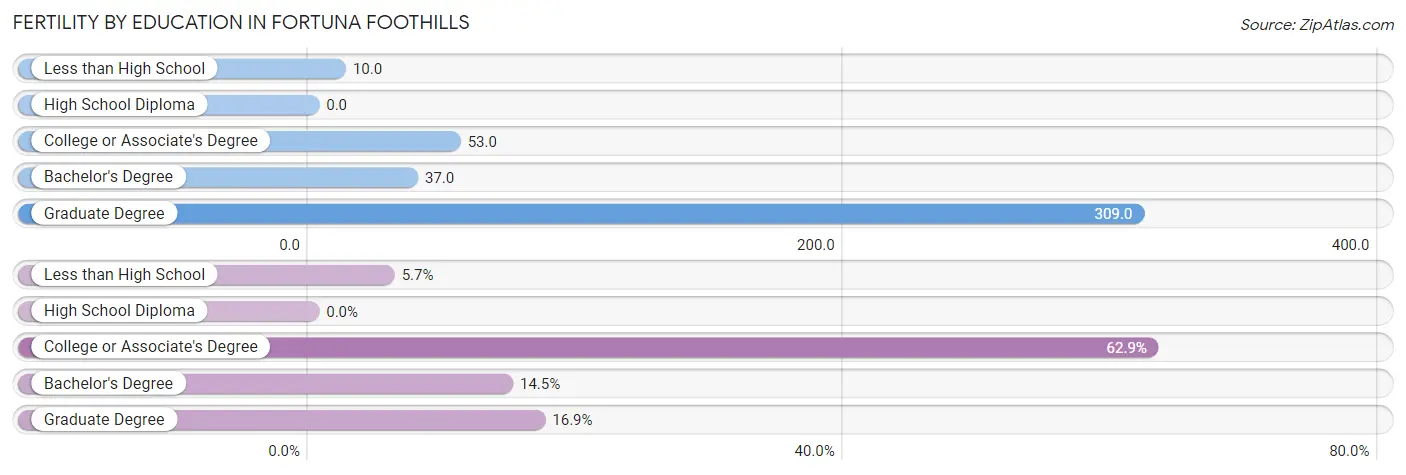
| Educational Attainment | Women with Births | Births / 1,000 Women |
| Less than High School | 7 (5.7%) | 10.0 |
| High School Diploma | 0 (0.0%) | 0.0 |
| College or Associate's Degree | 78 (62.9%) | 53.0 |
| Bachelor's Degree | 18 (14.5%) | 37.0 |
| Graduate Degree | 21 (16.9%) | 309.0 |
| Total | 124 (100.0%) | 37.0 |
Fertility by Education by Marriage Status in Fortuna Foothills
25.8% of women with births in Fortuna Foothills are unmarried. Women with the educational attainment of less than high school are most likely to be married with 100.0% of them married at childbirth, while women with the educational attainment of graduate degree are least likely to be married with 71.4% of them unmarried at childbirth.
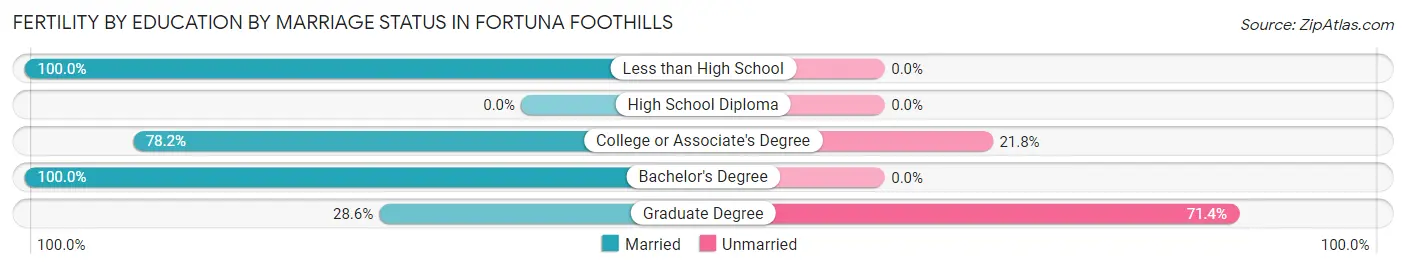
| Educational Attainment | Married | Unmarried |
| Less than High School | 7 (100.0%) | 0 (0.0%) |
| High School Diploma | 0 (0.0%) | 0 (0.0%) |
| College or Associate's Degree | 61 (78.2%) | 17 (21.8%) |
| Bachelor's Degree | 18 (100.0%) | 0 (0.0%) |
| Graduate Degree | 6 (28.6%) | 15 (71.4%) |
| Total | 92 (74.2%) | 32 (25.8%) |
Employment Characteristics in Fortuna Foothills
Employment by Class of Employer in Fortuna Foothills
Among the 7,734 employed individuals in Fortuna Foothills, private company employees (4,583 | 59.3%), federal government employees (1,166 | 15.1%), and not-for-profit organizations (595 | 7.7%) make up the most common classes of employment.
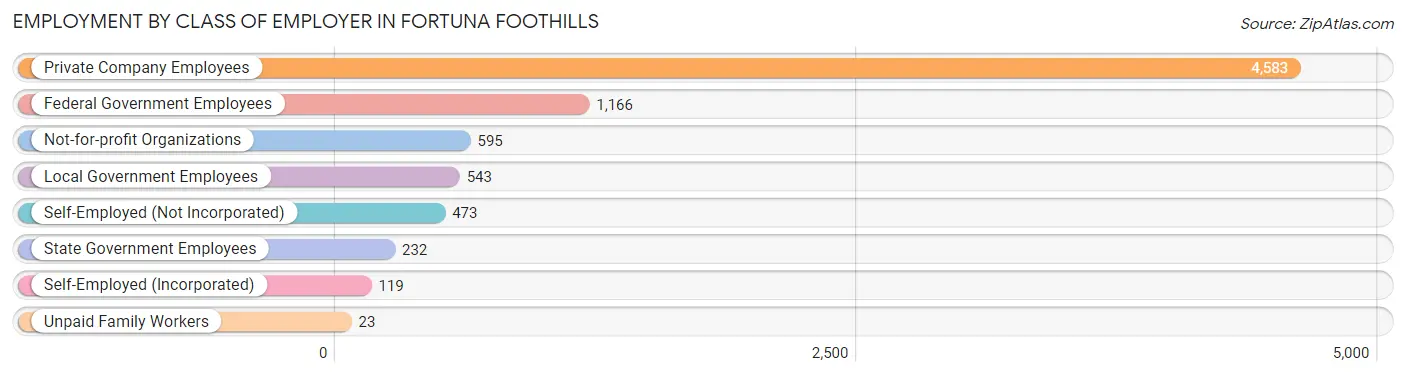
| Employer Class | # Employees | % Employees |
| Private Company Employees | 4,583 | 59.3% |
| Self-Employed (Incorporated) | 119 | 1.5% |
| Self-Employed (Not Incorporated) | 473 | 6.1% |
| Not-for-profit Organizations | 595 | 7.7% |
| Local Government Employees | 543 | 7.0% |
| State Government Employees | 232 | 3.0% |
| Federal Government Employees | 1,166 | 15.1% |
| Unpaid Family Workers | 23 | 0.3% |
| Total | 7,734 | 100.0% |
Employment Status by Age in Fortuna Foothills
According to the labor force statistics for Fortuna Foothills, out of the total population over 16 years of age (23,644), 36.1% or 8,535 individuals are in the labor force, with 7.7% or 657 of them unemployed. The age group with the highest labor force participation rate is 25 to 29 years, with 90.4% or 1,136 individuals in the labor force. Within the labor force, the 16 to 19 years age range has the highest percentage of unemployed individuals, with 39.7% or 77 of them being unemployed.
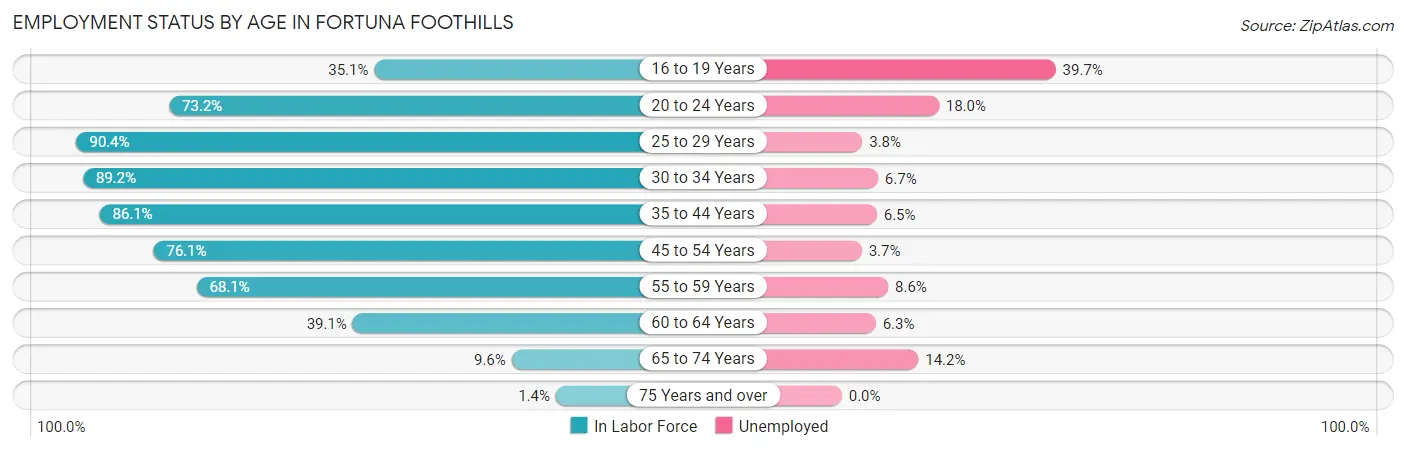
| Age Bracket | In Labor Force | Unemployed |
| 16 to 19 Years | 194 (35.1%) | 77 (39.7%) |
| 20 to 24 Years | 498 (73.2%) | 90 (18.0%) |
| 25 to 29 Years | 1,136 (90.4%) | 43 (3.8%) |
| 30 to 34 Years | 1,194 (89.2%) | 80 (6.7%) |
| 35 to 44 Years | 1,795 (86.1%) | 117 (6.5%) |
| 45 to 54 Years | 1,605 (76.1%) | 59 (3.7%) |
| 55 to 59 Years | 770 (68.1%) | 66 (8.6%) |
| 60 to 64 Years | 701 (39.1%) | 44 (6.3%) |
| 65 to 74 Years | 540 (9.6%) | 77 (14.2%) |
| 75 Years and over | 99 (1.4%) | 0 (0.0%) |
| Total | 8,535 (36.1%) | 657 (7.7%) |
Employment Status by Educational Attainment in Fortuna Foothills
According to labor force statistics for Fortuna Foothills, 74.1% of individuals (7,197) out of the total population between 25 and 64 years of age (9,713) are in the labor force, with 5.7% or 410 of them being unemployed. The group with the highest labor force participation rate are those with the educational attainment of bachelor's degree or higher, with 81.2% or 1,534 individuals in the labor force. Within the labor force, individuals with high school diploma education have the highest percentage of unemployment, with 7.3% or 120 of them being unemployed.
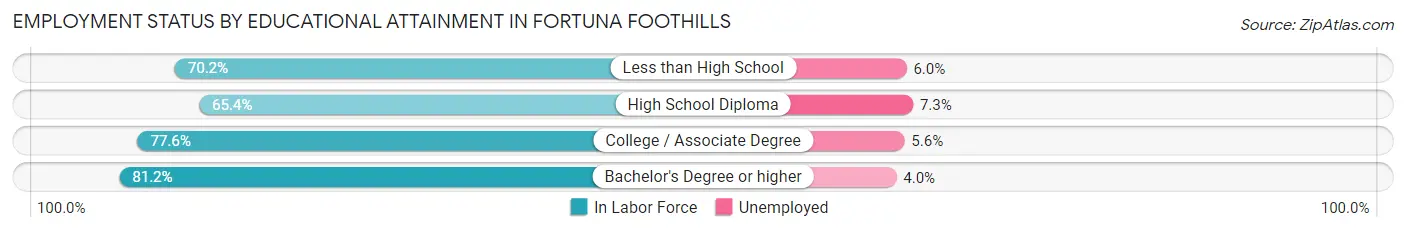
| Educational Attainment | In Labor Force | Unemployed |
| Less than High School | 929 (70.2%) | 79 (6.0%) |
| High School Diploma | 1,649 (65.4%) | 184 (7.3%) |
| College / Associate Degree | 3,088 (77.6%) | 223 (5.6%) |
| Bachelor's Degree or higher | 1,534 (81.2%) | 76 (4.0%) |
| Total | 7,197 (74.1%) | 554 (5.7%) |
Employment Occupations by Sex in Fortuna Foothills
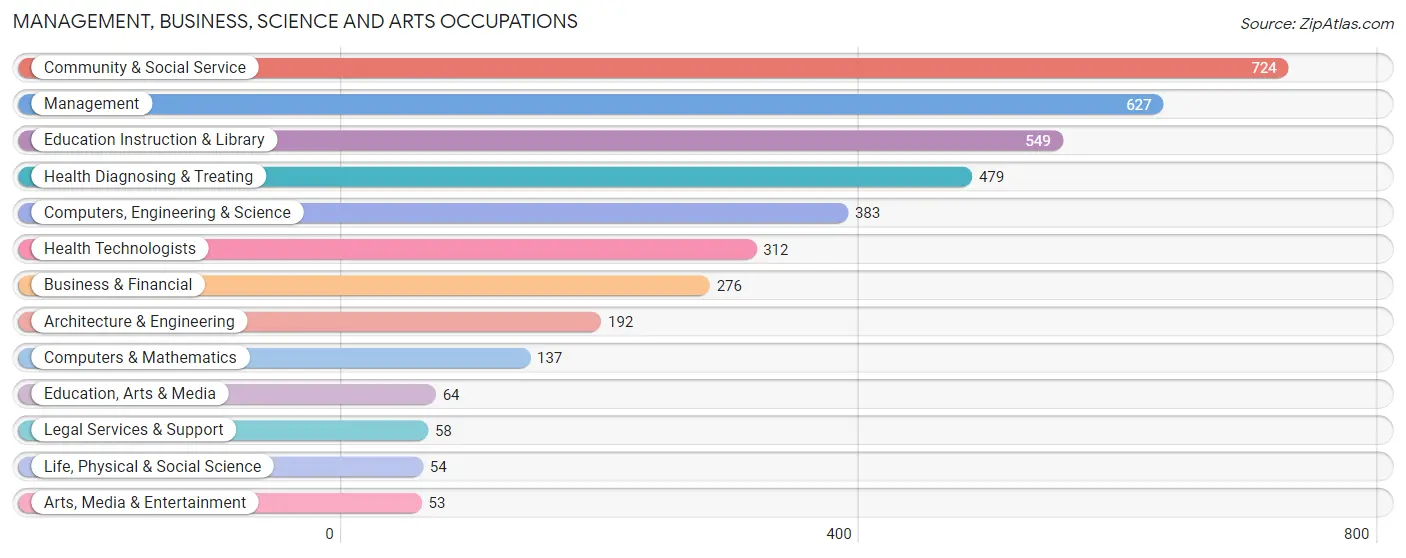
Management, Business, Science and Arts Occupations
The most common Management, Business, Science and Arts occupations in Fortuna Foothills are Community & Social Service (724 | 9.6%), Management (627 | 8.3%), Education Instruction & Library (549 | 7.2%), Health Diagnosing & Treating (479 | 6.3%), and Computers, Engineering & Science (383 | 5.1%).
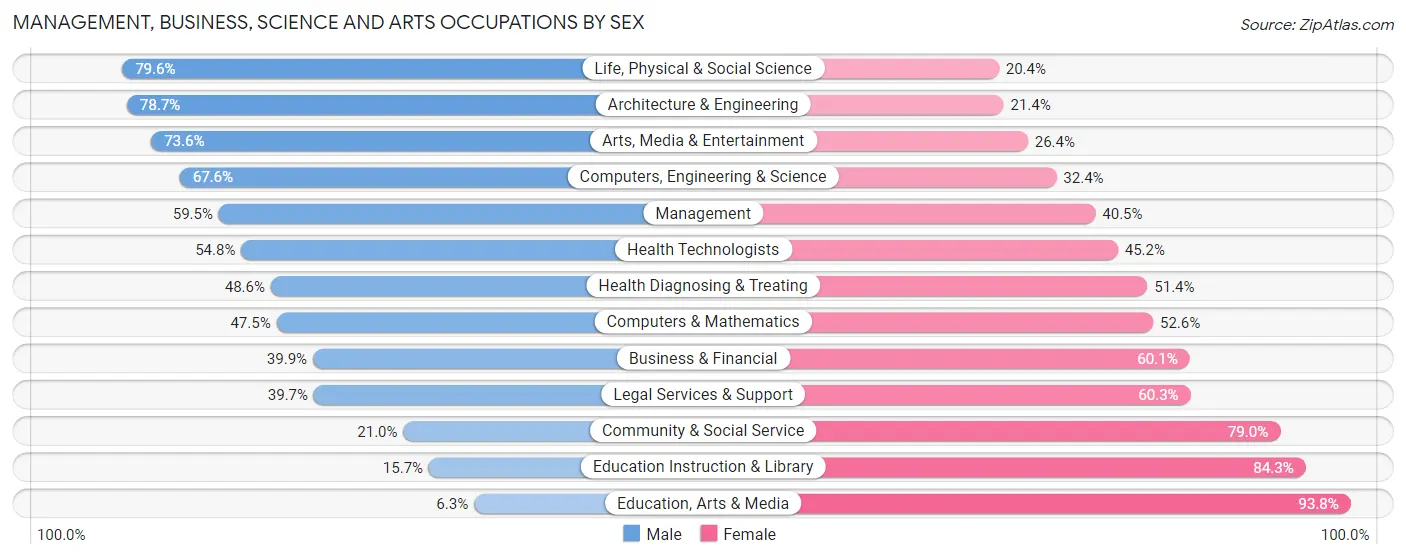
Management, Business, Science and Arts Occupations by Sex
Within the Management, Business, Science and Arts occupations in Fortuna Foothills, the most male-oriented occupations are Life, Physical & Social Science (79.6%), Architecture & Engineering (78.6%), and Arts, Media & Entertainment (73.6%), while the most female-oriented occupations are Education, Arts & Media (93.8%), Education Instruction & Library (84.3%), and Community & Social Service (79.0%).
| Occupation | Male | Female |
| Management | 373 (59.5%) | 254 (40.5%) |
| Business & Financial | 110 (39.9%) | 166 (60.1%) |
| Computers, Engineering & Science | 259 (67.6%) | 124 (32.4%) |
| Computers & Mathematics | 65 (47.4%) | 72 (52.5%) |
| Architecture & Engineering | 151 (78.6%) | 41 (21.3%) |
| Life, Physical & Social Science | 43 (79.6%) | 11 (20.4%) |
| Community & Social Service | 152 (21.0%) | 572 (79.0%) |
| Education, Arts & Media | 4 (6.2%) | 60 (93.8%) |
| Legal Services & Support | 23 (39.7%) | 35 (60.3%) |
| Education Instruction & Library | 86 (15.7%) | 463 (84.3%) |
| Arts, Media & Entertainment | 39 (73.6%) | 14 (26.4%) |
| Health Diagnosing & Treating | 233 (48.6%) | 246 (51.4%) |
| Health Technologists | 171 (54.8%) | 141 (45.2%) |
| Total (Category) | 1,127 (45.3%) | 1,362 (54.7%) |
| Total (Overall) | 4,251 (56.0%) | 3,334 (44.0%) |
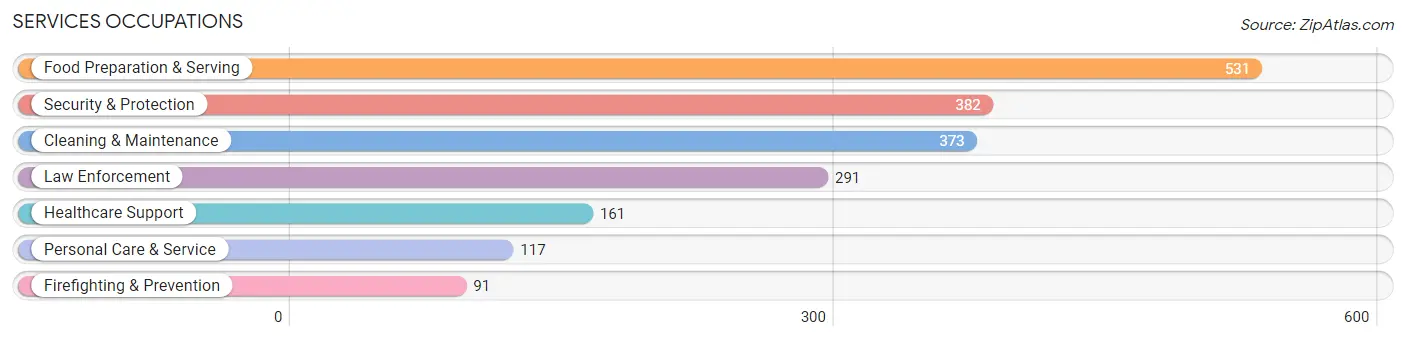
Services Occupations
The most common Services occupations in Fortuna Foothills are Food Preparation & Serving (531 | 7.0%), Security & Protection (382 | 5.0%), Cleaning & Maintenance (373 | 4.9%), Law Enforcement (291 | 3.8%), and Healthcare Support (161 | 2.1%).
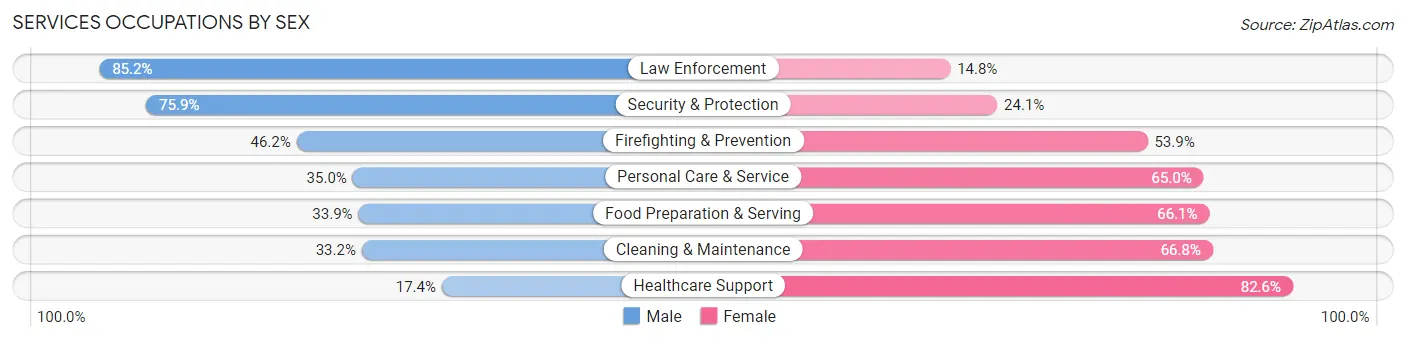
Services Occupations by Sex
Within the Services occupations in Fortuna Foothills, the most male-oriented occupations are Law Enforcement (85.2%), Security & Protection (75.9%), and Firefighting & Prevention (46.2%), while the most female-oriented occupations are Healthcare Support (82.6%), Cleaning & Maintenance (66.8%), and Food Preparation & Serving (66.1%).
| Occupation | Male | Female |
| Healthcare Support | 28 (17.4%) | 133 (82.6%) |
| Security & Protection | 290 (75.9%) | 92 (24.1%) |
| Firefighting & Prevention | 42 (46.2%) | 49 (53.8%) |
| Law Enforcement | 248 (85.2%) | 43 (14.8%) |
| Food Preparation & Serving | 180 (33.9%) | 351 (66.1%) |
| Cleaning & Maintenance | 124 (33.2%) | 249 (66.8%) |
| Personal Care & Service | 41 (35.0%) | 76 (65.0%) |
| Total (Category) | 663 (42.4%) | 901 (57.6%) |
| Total (Overall) | 4,251 (56.0%) | 3,334 (44.0%) |
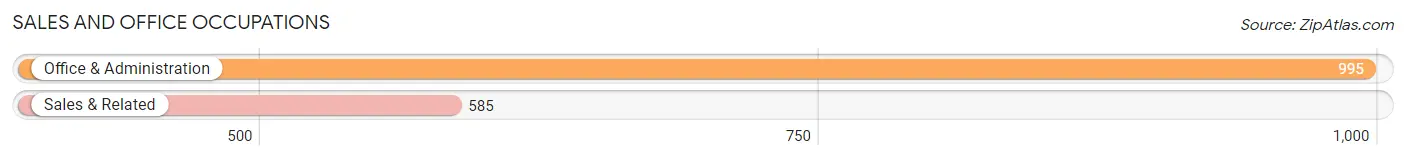
Sales and Office Occupations
The most common Sales and Office occupations in Fortuna Foothills are Office & Administration (995 | 13.1%), and Sales & Related (585 | 7.7%).
Sales and Office Occupations by Sex
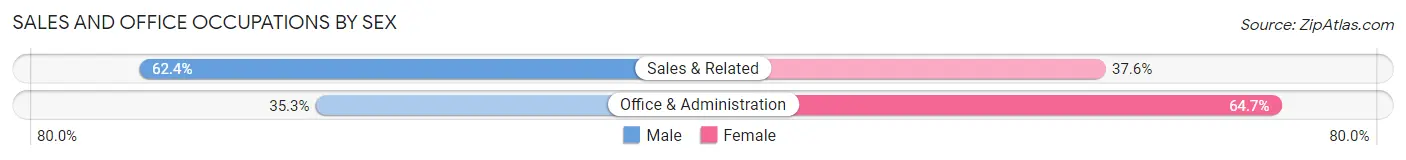
| Occupation | Male | Female |
| Sales & Related | 365 (62.4%) | 220 (37.6%) |
| Office & Administration | 351 (35.3%) | 644 (64.7%) |
| Total (Category) | 716 (45.3%) | 864 (54.7%) |
| Total (Overall) | 4,251 (56.0%) | 3,334 (44.0%) |
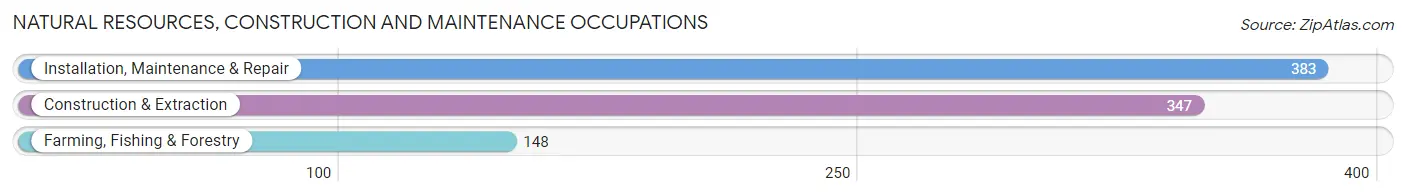
Natural Resources, Construction and Maintenance Occupations
The most common Natural Resources, Construction and Maintenance occupations in Fortuna Foothills are Installation, Maintenance & Repair (383 | 5.1%), Construction & Extraction (347 | 4.6%), and Farming, Fishing & Forestry (148 | 1.9%).
Natural Resources, Construction and Maintenance Occupations by Sex
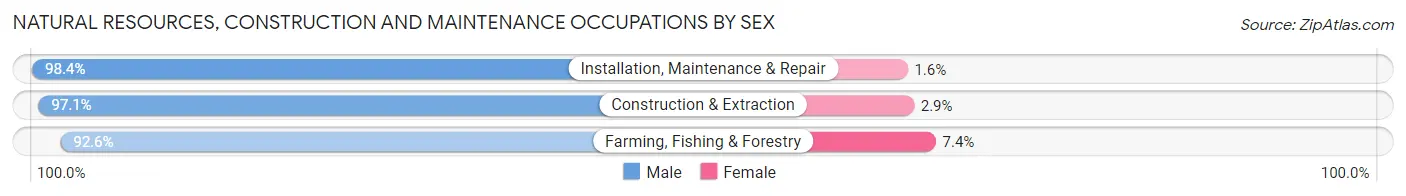
| Occupation | Male | Female |
| Farming, Fishing & Forestry | 137 (92.6%) | 11 (7.4%) |
| Construction & Extraction | 337 (97.1%) | 10 (2.9%) |
| Installation, Maintenance & Repair | 377 (98.4%) | 6 (1.6%) |
| Total (Category) | 851 (96.9%) | 27 (3.1%) |
| Total (Overall) | 4,251 (56.0%) | 3,334 (44.0%) |
Production, Transportation and Moving Occupations
The most common Production, Transportation and Moving occupations in Fortuna Foothills are Production (555 | 7.3%), Transportation (406 | 5.3%), and Material Moving (113 | 1.5%).
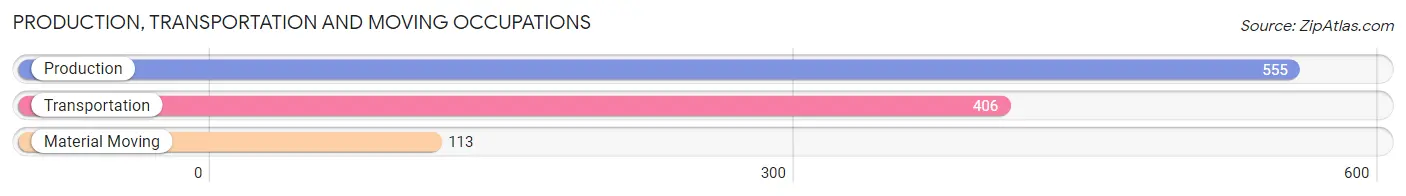
Production, Transportation and Moving Occupations by Sex
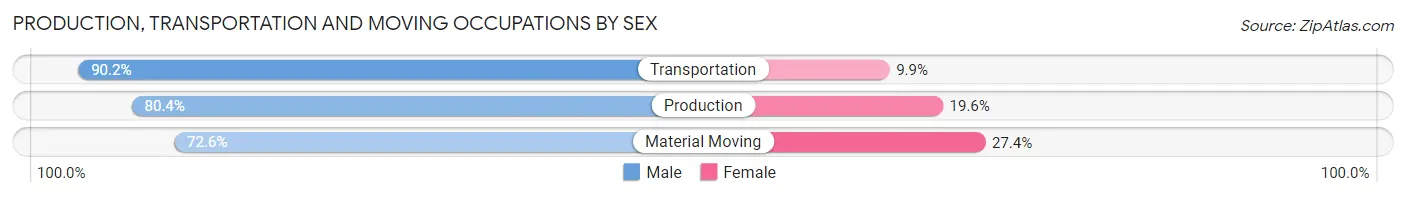
| Occupation | Male | Female |
| Production | 446 (80.4%) | 109 (19.6%) |
| Transportation | 366 (90.1%) | 40 (9.9%) |
| Material Moving | 82 (72.6%) | 31 (27.4%) |
| Total (Category) | 894 (83.2%) | 180 (16.8%) |
| Total (Overall) | 4,251 (56.0%) | 3,334 (44.0%) |
Employment Industries by Sex in Fortuna Foothills
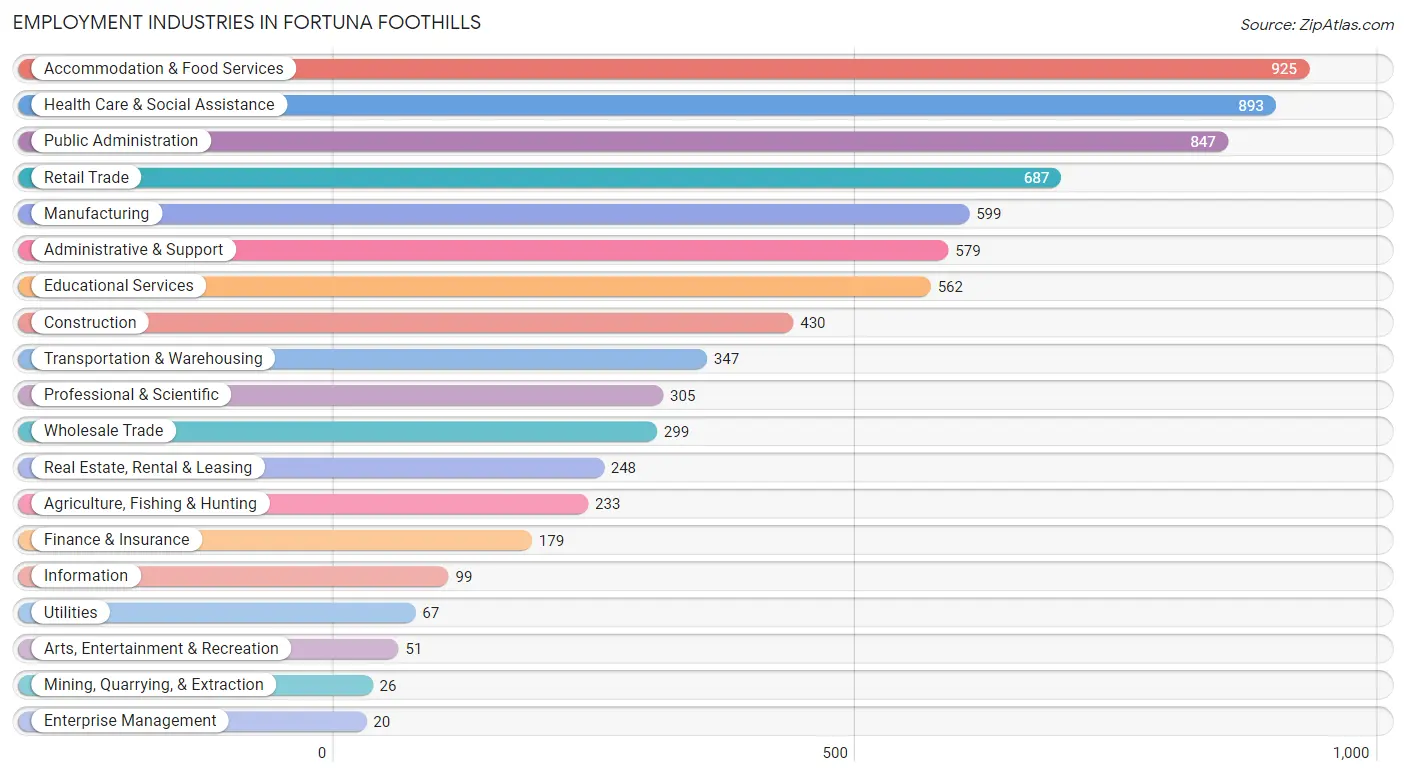
Employment Industries in Fortuna Foothills
The major employment industries in Fortuna Foothills include Accommodation & Food Services (925 | 12.2%), Health Care & Social Assistance (893 | 11.8%), Public Administration (847 | 11.2%), Retail Trade (687 | 9.1%), and Manufacturing (599 | 7.9%).
Employment Industries by Sex in Fortuna Foothills
The Fortuna Foothills industries that see more men than women are Mining, Quarrying, & Extraction (100.0%), Utilities (100.0%), and Enterprise Management (100.0%), whereas the industries that tend to have a higher number of women are Finance & Insurance (92.2%), Educational Services (81.0%), and Health Care & Social Assistance (69.7%).
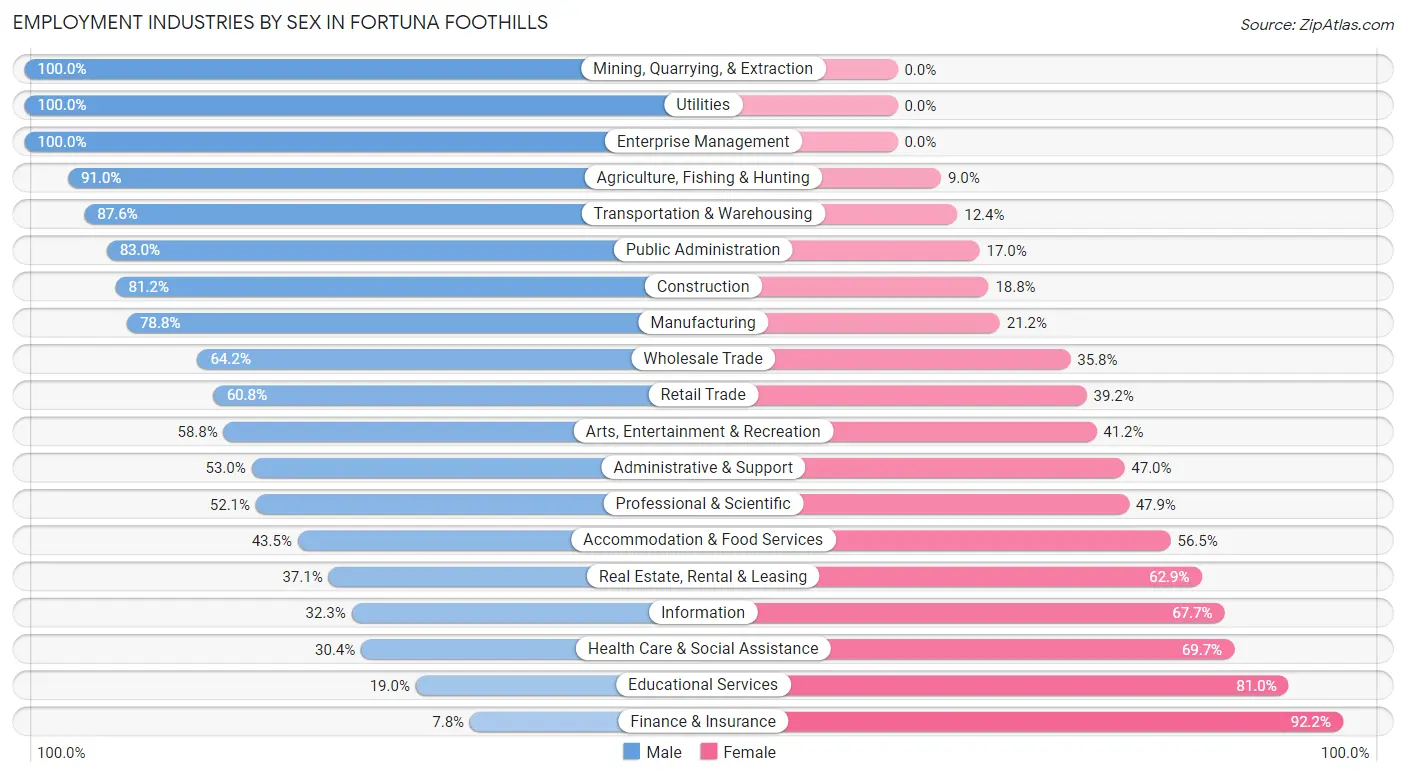
| Industry | Male | Female |
| Agriculture, Fishing & Hunting | 212 (91.0%) | 21 (9.0%) |
| Mining, Quarrying, & Extraction | 26 (100.0%) | 0 (0.0%) |
| Construction | 349 (81.2%) | 81 (18.8%) |
| Manufacturing | 472 (78.8%) | 127 (21.2%) |
| Wholesale Trade | 192 (64.2%) | 107 (35.8%) |
| Retail Trade | 418 (60.8%) | 269 (39.2%) |
| Transportation & Warehousing | 304 (87.6%) | 43 (12.4%) |
| Utilities | 67 (100.0%) | 0 (0.0%) |
| Information | 32 (32.3%) | 67 (67.7%) |
| Finance & Insurance | 14 (7.8%) | 165 (92.2%) |
| Real Estate, Rental & Leasing | 92 (37.1%) | 156 (62.9%) |
| Professional & Scientific | 159 (52.1%) | 146 (47.9%) |
| Enterprise Management | 20 (100.0%) | 0 (0.0%) |
| Administrative & Support | 307 (53.0%) | 272 (47.0%) |
| Educational Services | 107 (19.0%) | 455 (81.0%) |
| Health Care & Social Assistance | 271 (30.3%) | 622 (69.7%) |
| Arts, Entertainment & Recreation | 30 (58.8%) | 21 (41.2%) |
| Accommodation & Food Services | 402 (43.5%) | 523 (56.5%) |
| Public Administration | 703 (83.0%) | 144 (17.0%) |
| Total | 4,251 (56.0%) | 3,334 (44.0%) |
Education in Fortuna Foothills
School Enrollment in Fortuna Foothills
The most common levels of schooling among the 4,049 students in Fortuna Foothills are middle school (1,130 | 27.9%), elementary school (889 | 22.0%), and high school (761 | 18.8%).
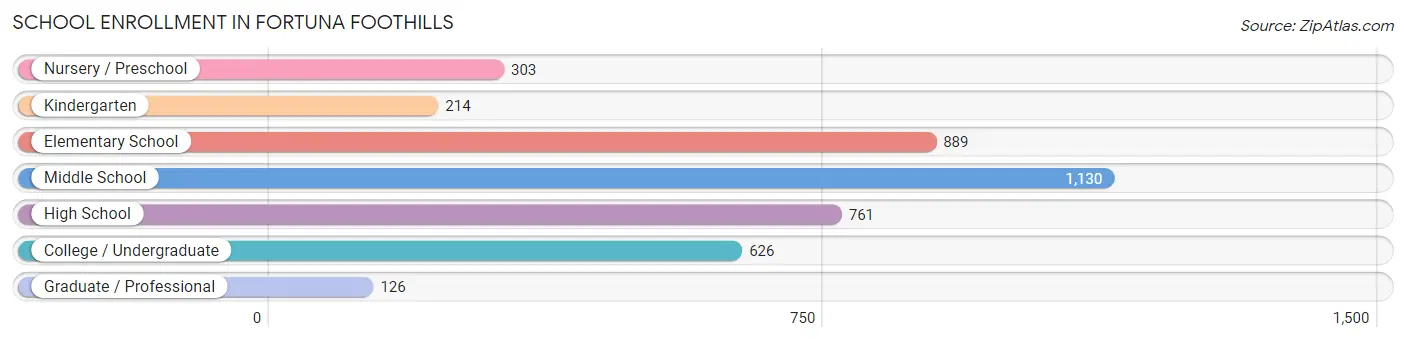
| School Level | # Students | % Students |
| Nursery / Preschool | 303 | 7.5% |
| Kindergarten | 214 | 5.3% |
| Elementary School | 889 | 22.0% |
| Middle School | 1,130 | 27.9% |
| High School | 761 | 18.8% |
| College / Undergraduate | 626 | 15.5% |
| Graduate / Professional | 126 | 3.1% |
| Total | 4,049 | 100.0% |
School Enrollment by Age by Funding Source in Fortuna Foothills
Out of a total of 4,049 students who are enrolled in schools in Fortuna Foothills, 340 (8.4%) attend a private institution, while the remaining 3,709 (91.6%) are enrolled in public schools. The age group of 35 years and over has the highest likelihood of being enrolled in private schools, with 50 (30.9% in the age bracket) enrolled. Conversely, the age group of 18 to 19 year olds has the lowest likelihood of being enrolled in a private school, with 118 (100.0% in the age bracket) attending a public institution.
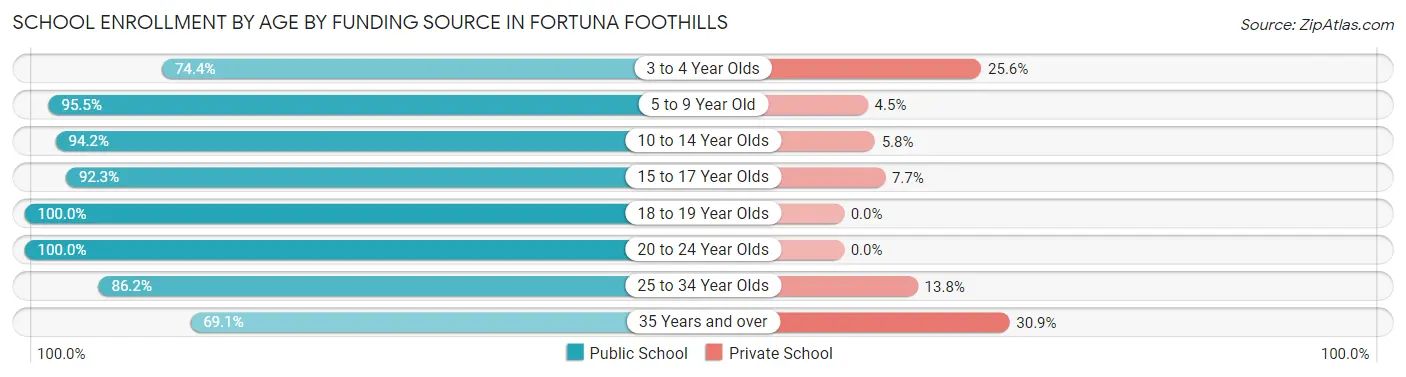
| Age Bracket | Public School | Private School |
| 3 to 4 Year Olds | 218 (74.4%) | 75 (25.6%) |
| 5 to 9 Year Old | 983 (95.5%) | 46 (4.5%) |
| 10 to 14 Year Olds | 1,222 (94.2%) | 75 (5.8%) |
| 15 to 17 Year Olds | 588 (92.3%) | 49 (7.7%) |
| 18 to 19 Year Olds | 118 (100.0%) | 0 (0.0%) |
| 20 to 24 Year Olds | 172 (100.0%) | 0 (0.0%) |
| 25 to 34 Year Olds | 294 (86.2%) | 47 (13.8%) |
| 35 Years and over | 112 (69.1%) | 50 (30.9%) |
| Total | 3,709 (91.6%) | 340 (8.4%) |
Educational Attainment by Field of Study in Fortuna Foothills
Education (917 | 23.2%), business (572 | 14.5%), bio, nature & agricultural (479 | 12.1%), science & technology (307 | 7.8%), and engineering (292 | 7.4%) are the most common fields of study among 3,951 individuals in Fortuna Foothills who have obtained a bachelor's degree or higher.
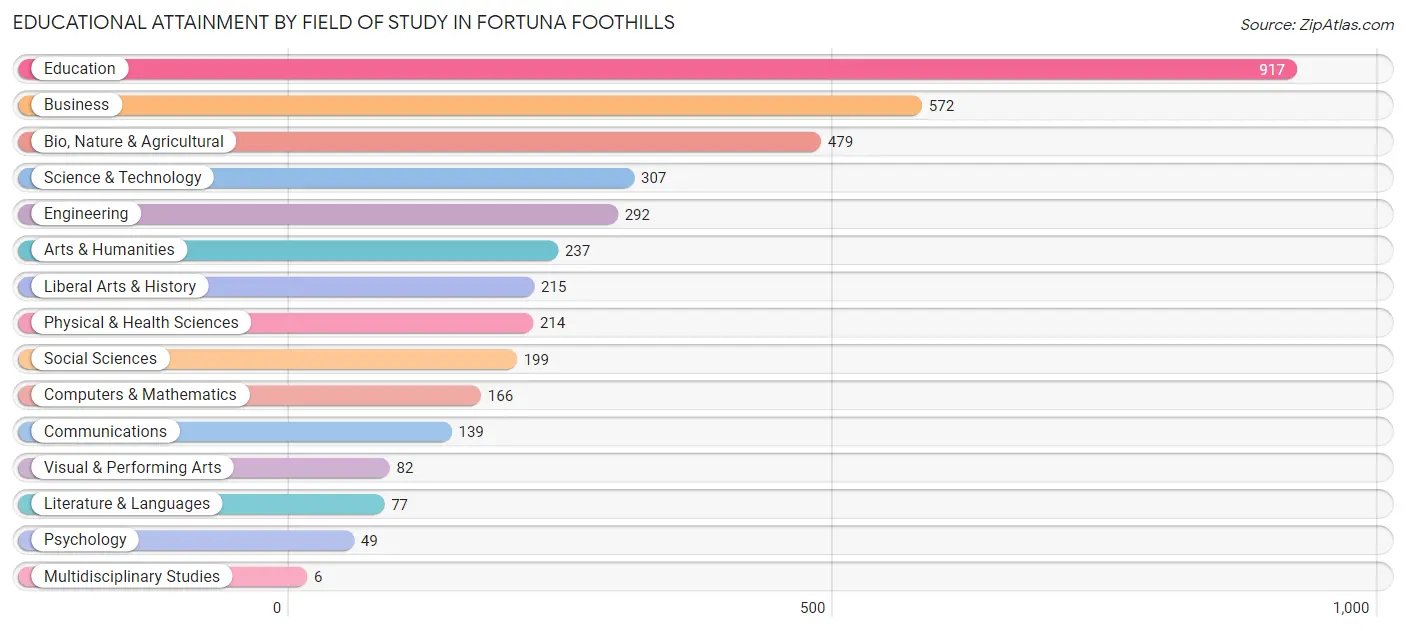
| Field of Study | # Graduates | % Graduates |
| Computers & Mathematics | 166 | 4.2% |
| Bio, Nature & Agricultural | 479 | 12.1% |
| Physical & Health Sciences | 214 | 5.4% |
| Psychology | 49 | 1.2% |
| Social Sciences | 199 | 5.0% |
| Engineering | 292 | 7.4% |
| Multidisciplinary Studies | 6 | 0.2% |
| Science & Technology | 307 | 7.8% |
| Business | 572 | 14.5% |
| Education | 917 | 23.2% |
| Literature & Languages | 77 | 1.9% |
| Liberal Arts & History | 215 | 5.4% |
| Visual & Performing Arts | 82 | 2.1% |
| Communications | 139 | 3.5% |
| Arts & Humanities | 237 | 6.0% |
| Total | 3,951 | 100.0% |
Transportation & Commute in Fortuna Foothills
Vehicle Availability by Sex in Fortuna Foothills
The most prevalent vehicle ownership categories in Fortuna Foothills are males with 2 vehicles (1,852, accounting for 41.4%) and females with 2 vehicles (1,166, making up 56.9%).
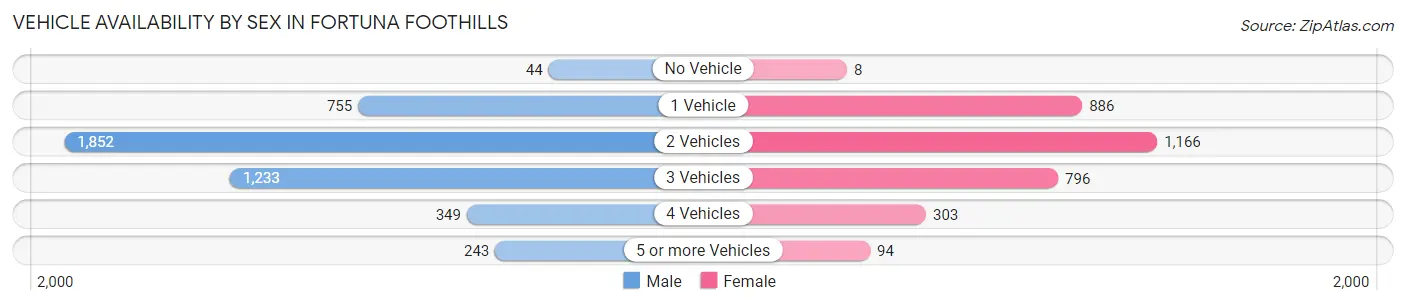
| Vehicles Available | Male | Female |
| No Vehicle | 44 (1.0%) | 8 (0.3%) |
| 1 Vehicle | 755 (16.9%) | 886 (27.2%) |
| 2 Vehicles | 1,852 (41.4%) | 1,166 (35.8%) |
| 3 Vehicles | 1,233 (27.6%) | 796 (24.5%) |
| 4 Vehicles | 349 (7.8%) | 303 (9.3%) |
| 5 or more Vehicles | 243 (5.4%) | 94 (2.9%) |
| Total | 4,476 (100.0%) | 3,253 (100.0%) |
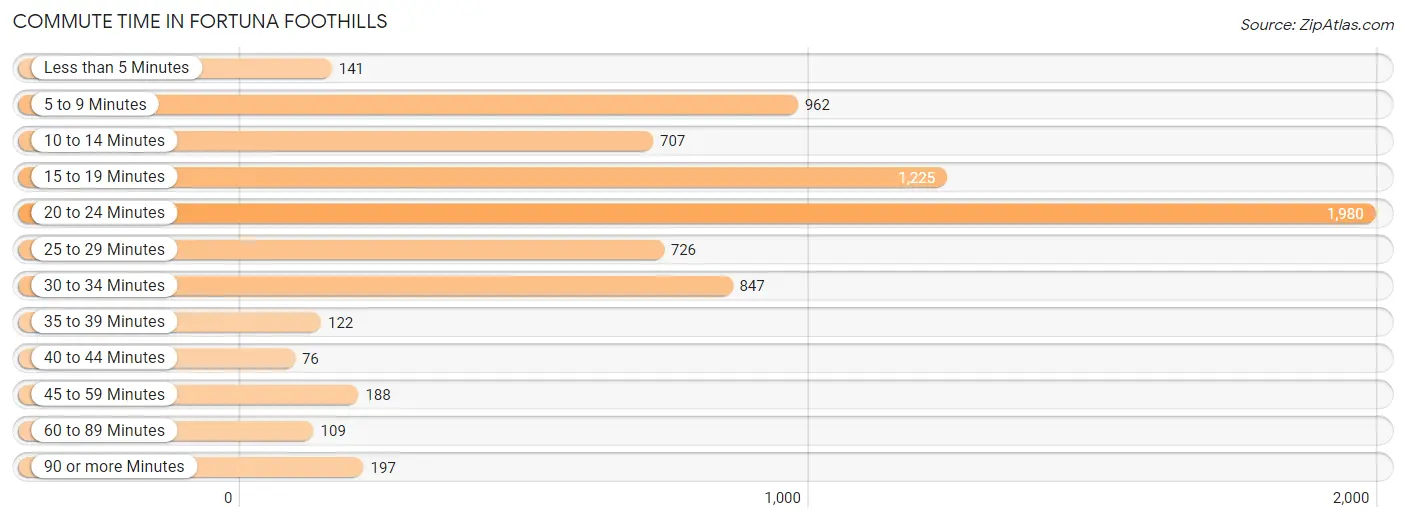
Commute Time in Fortuna Foothills
The most frequently occuring commute durations in Fortuna Foothills are 20 to 24 minutes (1,980 commuters, 27.2%), 15 to 19 minutes (1,225 commuters, 16.8%), and 5 to 9 minutes (962 commuters, 13.2%).
| Commute Time | # Commuters | % Commuters |
| Less than 5 Minutes | 141 | 1.9% |
| 5 to 9 Minutes | 962 | 13.2% |
| 10 to 14 Minutes | 707 | 9.7% |
| 15 to 19 Minutes | 1,225 | 16.8% |
| 20 to 24 Minutes | 1,980 | 27.2% |
| 25 to 29 Minutes | 726 | 10.0% |
| 30 to 34 Minutes | 847 | 11.6% |
| 35 to 39 Minutes | 122 | 1.7% |
| 40 to 44 Minutes | 76 | 1.0% |
| 45 to 59 Minutes | 188 | 2.6% |
| 60 to 89 Minutes | 109 | 1.5% |
| 90 or more Minutes | 197 | 2.7% |
Commute Time by Sex in Fortuna Foothills
The most common commute times in Fortuna Foothills are 20 to 24 minutes (1,065 commuters, 25.0%) for males and 20 to 24 minutes (915 commuters, 30.3%) for females.
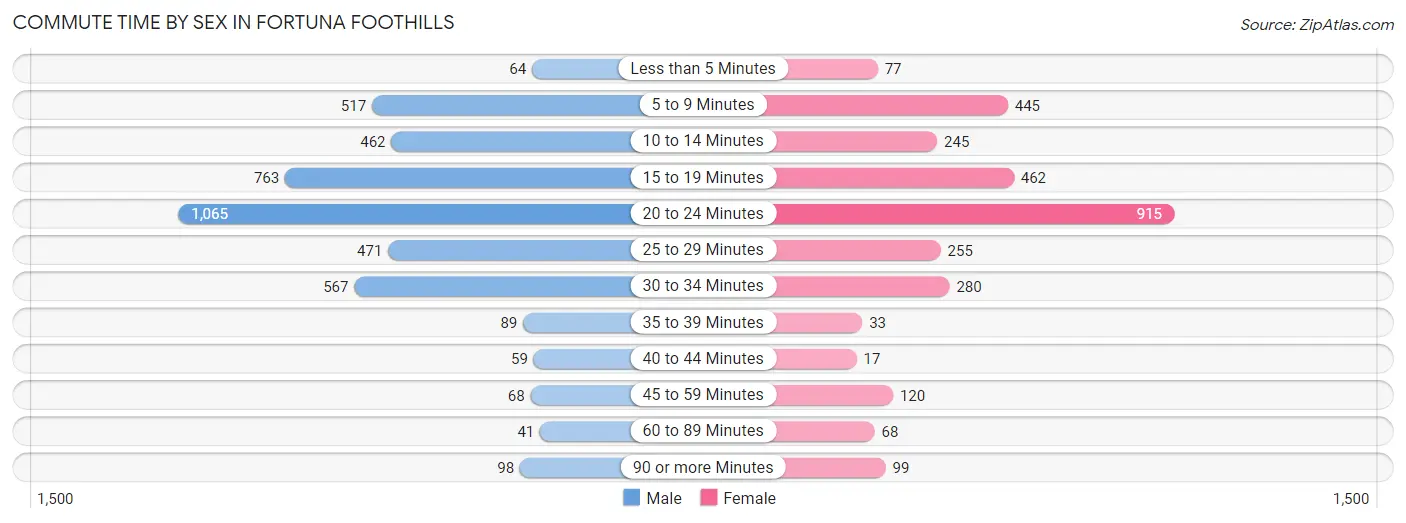
| Commute Time | Male | Female |
| Less than 5 Minutes | 64 (1.5%) | 77 (2.5%) |
| 5 to 9 Minutes | 517 (12.1%) | 445 (14.7%) |
| 10 to 14 Minutes | 462 (10.8%) | 245 (8.1%) |
| 15 to 19 Minutes | 763 (17.9%) | 462 (15.3%) |
| 20 to 24 Minutes | 1,065 (25.0%) | 915 (30.3%) |
| 25 to 29 Minutes | 471 (11.1%) | 255 (8.5%) |
| 30 to 34 Minutes | 567 (13.3%) | 280 (9.3%) |
| 35 to 39 Minutes | 89 (2.1%) | 33 (1.1%) |
| 40 to 44 Minutes | 59 (1.4%) | 17 (0.6%) |
| 45 to 59 Minutes | 68 (1.6%) | 120 (4.0%) |
| 60 to 89 Minutes | 41 (1.0%) | 68 (2.2%) |
| 90 or more Minutes | 98 (2.3%) | 99 (3.3%) |
Time of Departure to Work by Sex in Fortuna Foothills
The most frequent times of departure to work in Fortuna Foothills are 12:00 AM to 4:59 AM (619, 14.5%) for males and 7:30 AM to 7:59 AM (469, 15.5%) for females.
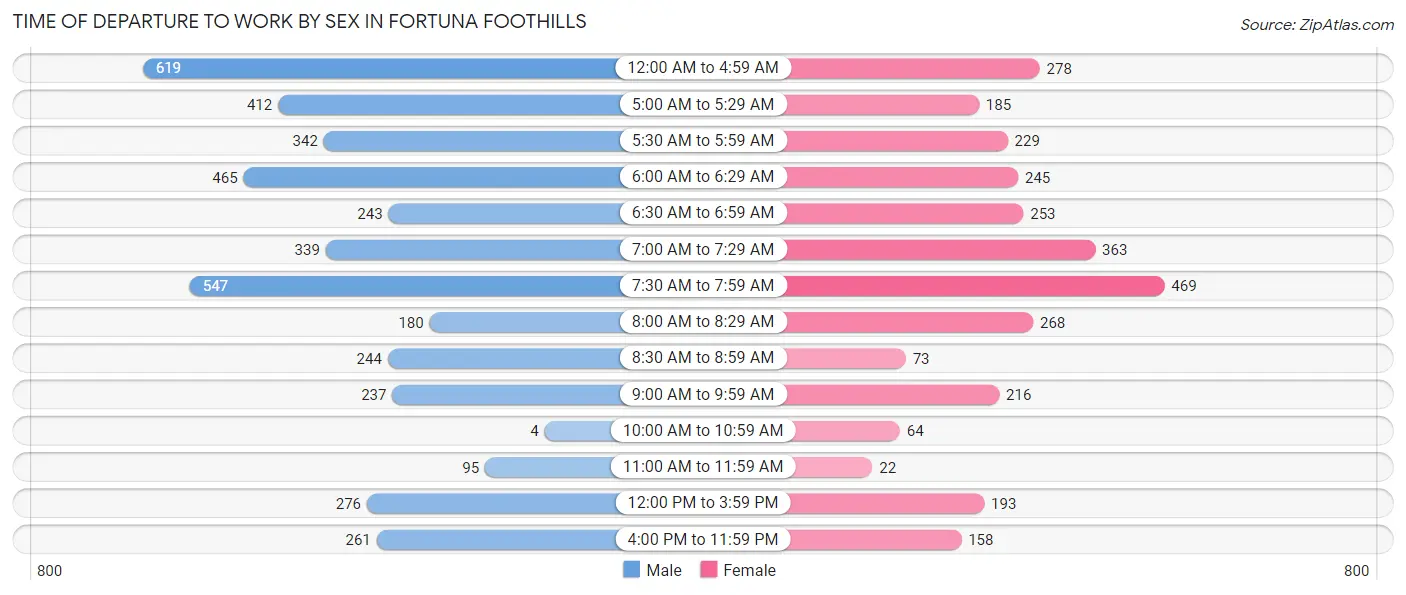
| Time of Departure | Male | Female |
| 12:00 AM to 4:59 AM | 619 (14.5%) | 278 (9.2%) |
| 5:00 AM to 5:29 AM | 412 (9.7%) | 185 (6.1%) |
| 5:30 AM to 5:59 AM | 342 (8.0%) | 229 (7.6%) |
| 6:00 AM to 6:29 AM | 465 (10.9%) | 245 (8.1%) |
| 6:30 AM to 6:59 AM | 243 (5.7%) | 253 (8.4%) |
| 7:00 AM to 7:29 AM | 339 (8.0%) | 363 (12.0%) |
| 7:30 AM to 7:59 AM | 547 (12.8%) | 469 (15.5%) |
| 8:00 AM to 8:29 AM | 180 (4.2%) | 268 (8.9%) |
| 8:30 AM to 8:59 AM | 244 (5.7%) | 73 (2.4%) |
| 9:00 AM to 9:59 AM | 237 (5.6%) | 216 (7.2%) |
| 10:00 AM to 10:59 AM | 4 (0.1%) | 64 (2.1%) |
| 11:00 AM to 11:59 AM | 95 (2.2%) | 22 (0.7%) |
| 12:00 PM to 3:59 PM | 276 (6.5%) | 193 (6.4%) |
| 4:00 PM to 11:59 PM | 261 (6.1%) | 158 (5.2%) |
| Total | 4,264 (100.0%) | 3,016 (100.0%) |
Housing Occupancy in Fortuna Foothills
Occupancy by Ownership in Fortuna Foothills
Of the total 13,265 dwellings in Fortuna Foothills, owner-occupied units account for 10,976 (82.7%), while renter-occupied units make up 2,289 (17.3%).
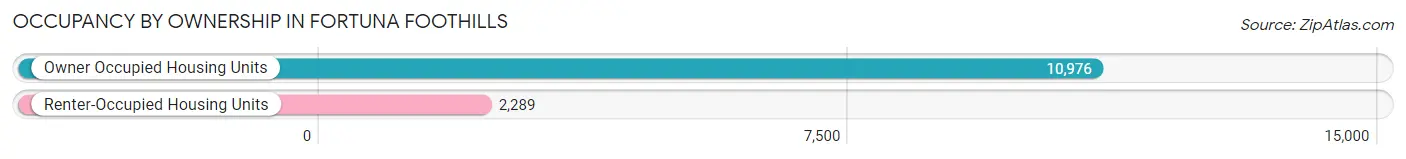
| Occupancy | # Housing Units | % Housing Units |
| Owner Occupied Housing Units | 10,976 | 82.7% |
| Renter-Occupied Housing Units | 2,289 | 17.3% |
| Total Occupied Housing Units | 13,265 | 100.0% |
Occupancy by Household Size in Fortuna Foothills
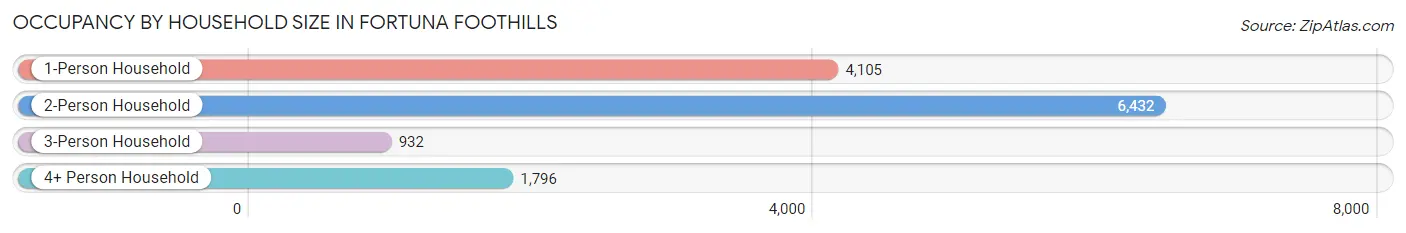
| Household Size | # Housing Units | % Housing Units |
| 1-Person Household | 4,105 | 30.9% |
| 2-Person Household | 6,432 | 48.5% |
| 3-Person Household | 932 | 7.0% |
| 4+ Person Household | 1,796 | 13.5% |
| Total Housing Units | 13,265 | 100.0% |
Occupancy by Ownership by Household Size in Fortuna Foothills
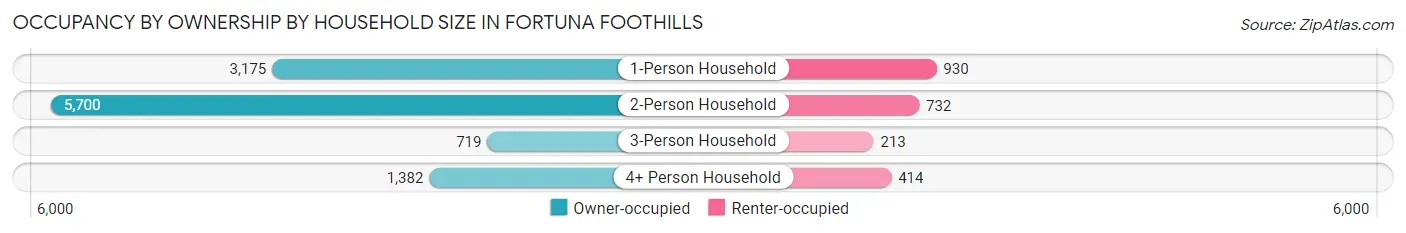
| Household Size | Owner-occupied | Renter-occupied |
| 1-Person Household | 3,175 (77.3%) | 930 (22.7%) |
| 2-Person Household | 5,700 (88.6%) | 732 (11.4%) |
| 3-Person Household | 719 (77.1%) | 213 (22.9%) |
| 4+ Person Household | 1,382 (76.9%) | 414 (23.1%) |
| Total Housing Units | 10,976 (82.7%) | 2,289 (17.3%) |
Occupancy by Educational Attainment in Fortuna Foothills
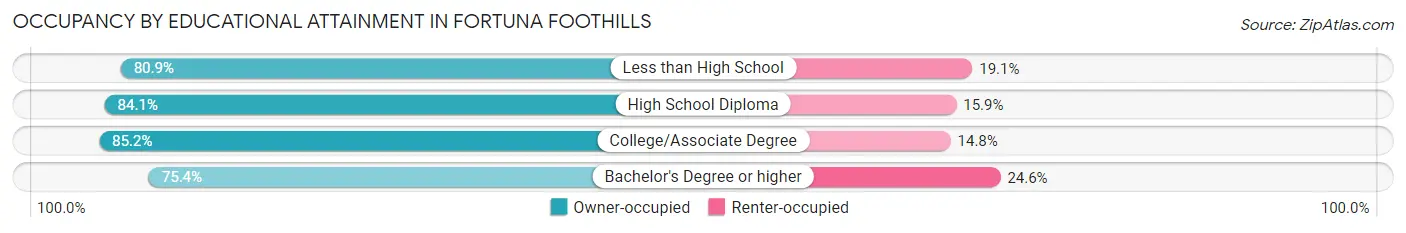
| Household Size | Owner-occupied | Renter-occupied |
| Less than High School | 1,125 (80.9%) | 265 (19.1%) |
| High School Diploma | 3,083 (84.1%) | 582 (15.9%) |
| College/Associate Degree | 5,012 (85.2%) | 868 (14.8%) |
| Bachelor's Degree or higher | 1,756 (75.4%) | 574 (24.6%) |
Occupancy by Age of Householder in Fortuna Foothills
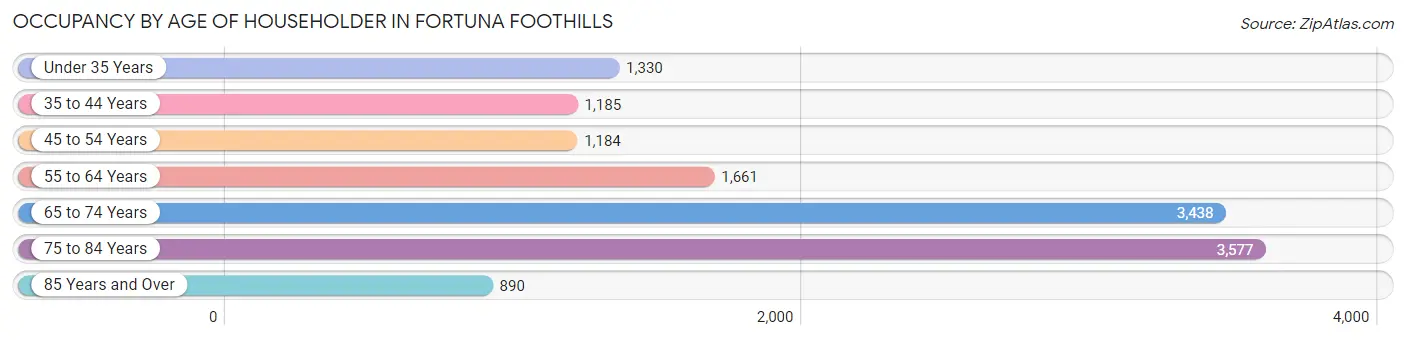
| Age Bracket | # Households | % Households |
| Under 35 Years | 1,330 | 10.0% |
| 35 to 44 Years | 1,185 | 8.9% |
| 45 to 54 Years | 1,184 | 8.9% |
| 55 to 64 Years | 1,661 | 12.5% |
| 65 to 74 Years | 3,438 | 25.9% |
| 75 to 84 Years | 3,577 | 27.0% |
| 85 Years and Over | 890 | 6.7% |
| Total | 13,265 | 100.0% |
Housing Finances in Fortuna Foothills
Median Income by Occupancy in Fortuna Foothills
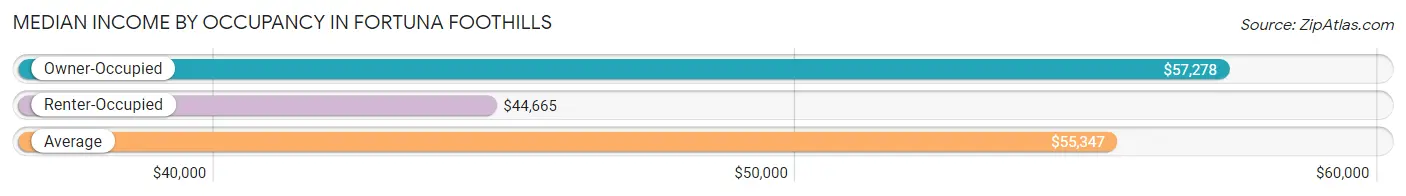
| Occupancy Type | # Households | Median Income |
| Owner-Occupied | 10,976 (82.7%) | $57,278 |
| Renter-Occupied | 2,289 (17.3%) | $44,665 |
| Average | 13,265 (100.0%) | $55,347 |
Occupancy by Householder Income Bracket in Fortuna Foothills
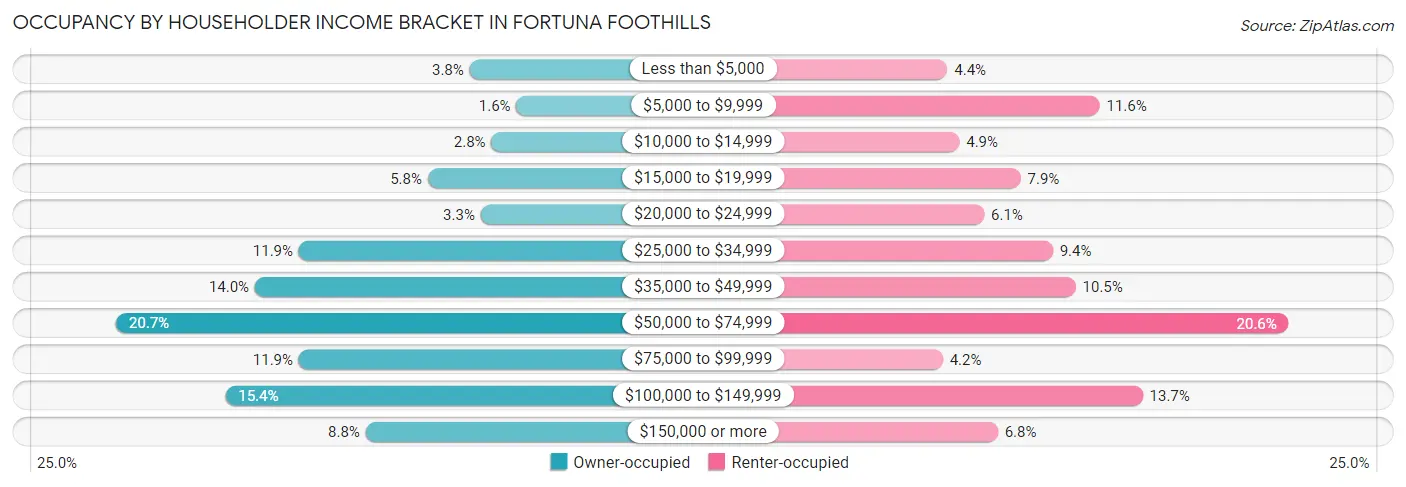
| Income Bracket | Owner-occupied | Renter-occupied |
| Less than $5,000 | 418 (3.8%) | 100 (4.4%) |
| $5,000 to $9,999 | 173 (1.6%) | 266 (11.6%) |
| $10,000 to $14,999 | 304 (2.8%) | 113 (4.9%) |
| $15,000 to $19,999 | 637 (5.8%) | 180 (7.9%) |
| $20,000 to $24,999 | 360 (3.3%) | 140 (6.1%) |
| $25,000 to $34,999 | 1,311 (11.9%) | 215 (9.4%) |
| $35,000 to $49,999 | 1,540 (14.0%) | 240 (10.5%) |
| $50,000 to $74,999 | 2,266 (20.6%) | 472 (20.6%) |
| $75,000 to $99,999 | 1,310 (11.9%) | 95 (4.2%) |
| $100,000 to $149,999 | 1,695 (15.4%) | 313 (13.7%) |
| $150,000 or more | 962 (8.8%) | 155 (6.8%) |
| Total | 10,976 (100.0%) | 2,289 (100.0%) |
Monthly Housing Cost Tiers in Fortuna Foothills
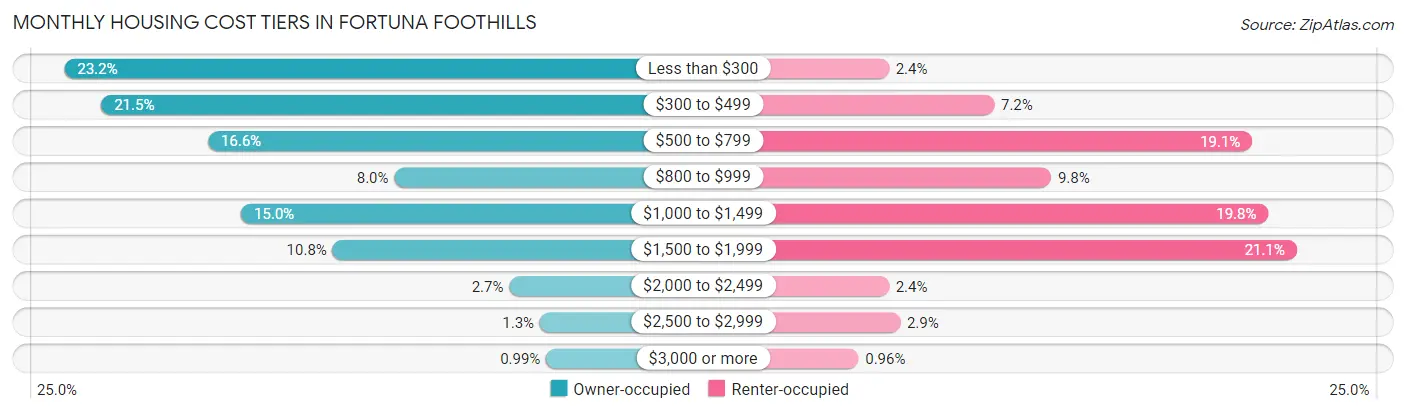
| Monthly Cost | Owner-occupied | Renter-occupied |
| Less than $300 | 2,543 (23.2%) | 54 (2.4%) |
| $300 to $499 | 2,356 (21.5%) | 165 (7.2%) |
| $500 to $799 | 1,818 (16.6%) | 437 (19.1%) |
| $800 to $999 | 876 (8.0%) | 225 (9.8%) |
| $1,000 to $1,499 | 1,651 (15.0%) | 454 (19.8%) |
| $1,500 to $1,999 | 1,188 (10.8%) | 484 (21.1%) |
| $2,000 to $2,499 | 295 (2.7%) | 54 (2.4%) |
| $2,500 to $2,999 | 140 (1.3%) | 66 (2.9%) |
| $3,000 or more | 109 (1.0%) | 22 (1.0%) |
| Total | 10,976 (100.0%) | 2,289 (100.0%) |
Physical Housing Characteristics in Fortuna Foothills
Housing Structures in Fortuna Foothills
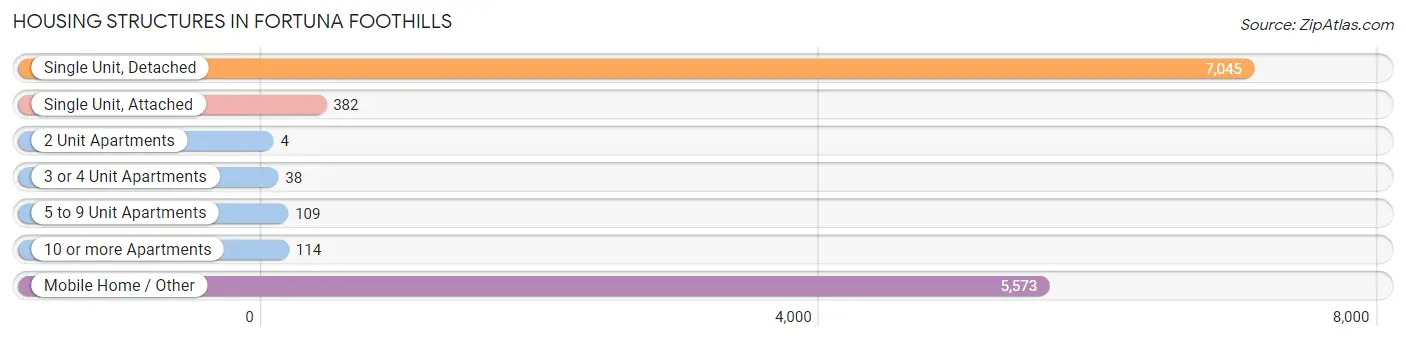
| Structure Type | # Housing Units | % Housing Units |
| Single Unit, Detached | 7,045 | 53.1% |
| Single Unit, Attached | 382 | 2.9% |
| 2 Unit Apartments | 4 | 0.0% |
| 3 or 4 Unit Apartments | 38 | 0.3% |
| 5 to 9 Unit Apartments | 109 | 0.8% |
| 10 or more Apartments | 114 | 0.9% |
| Mobile Home / Other | 5,573 | 42.0% |
| Total | 13,265 | 100.0% |
Housing Structures by Occupancy in Fortuna Foothills
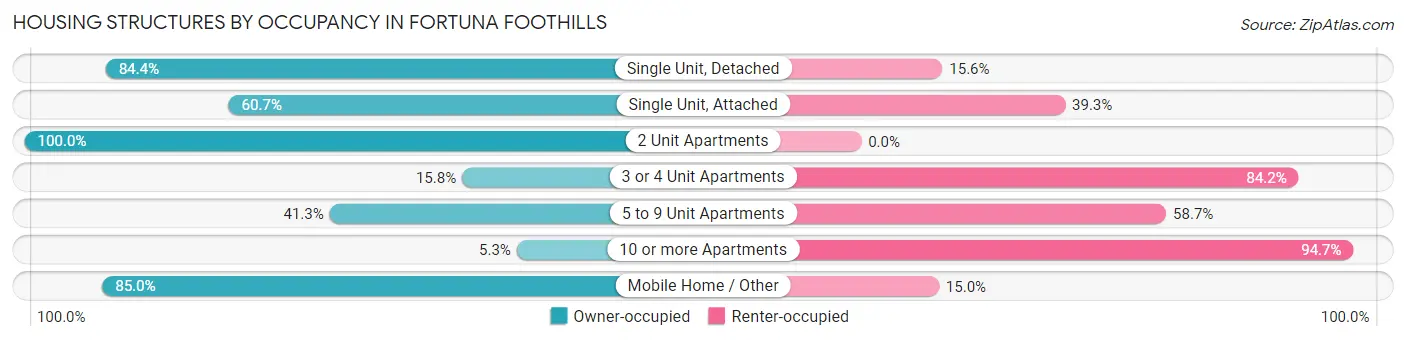
| Structure Type | Owner-occupied | Renter-occupied |
| Single Unit, Detached | 5,944 (84.4%) | 1,101 (15.6%) |
| Single Unit, Attached | 232 (60.7%) | 150 (39.3%) |
| 2 Unit Apartments | 4 (100.0%) | 0 (0.0%) |
| 3 or 4 Unit Apartments | 6 (15.8%) | 32 (84.2%) |
| 5 to 9 Unit Apartments | 45 (41.3%) | 64 (58.7%) |
| 10 or more Apartments | 6 (5.3%) | 108 (94.7%) |
| Mobile Home / Other | 4,739 (85.0%) | 834 (15.0%) |
| Total | 10,976 (82.7%) | 2,289 (17.3%) |
Housing Structures by Number of Rooms in Fortuna Foothills
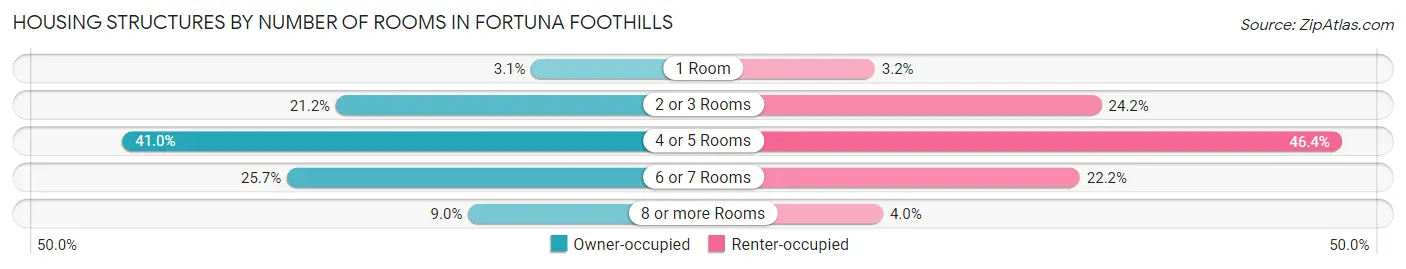
| Number of Rooms | Owner-occupied | Renter-occupied |
| 1 Room | 344 (3.1%) | 74 (3.2%) |
| 2 or 3 Rooms | 2,328 (21.2%) | 554 (24.2%) |
| 4 or 5 Rooms | 4,496 (41.0%) | 1,062 (46.4%) |
| 6 or 7 Rooms | 2,824 (25.7%) | 508 (22.2%) |
| 8 or more Rooms | 984 (9.0%) | 91 (4.0%) |
| Total | 10,976 (100.0%) | 2,289 (100.0%) |
Housing Structure by Heating Type in Fortuna Foothills
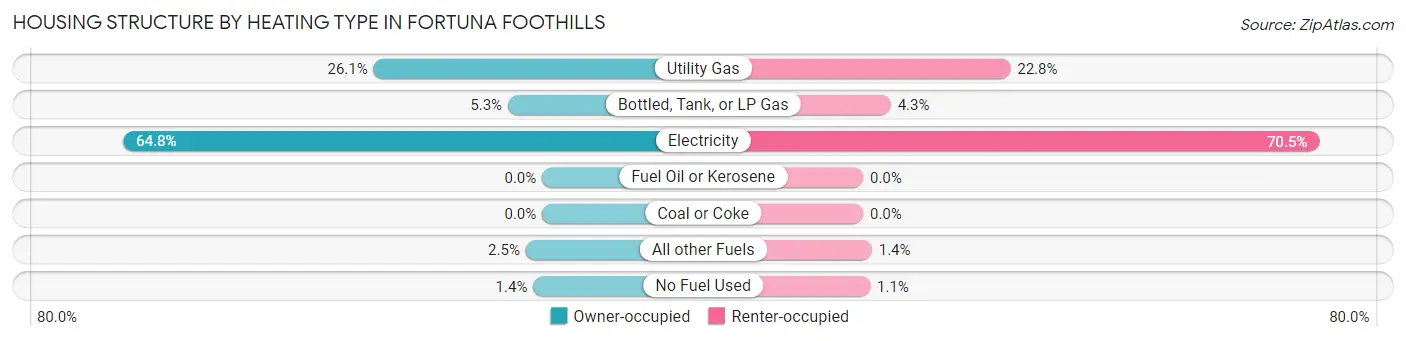
| Heating Type | Owner-occupied | Renter-occupied |
| Utility Gas | 2,860 (26.1%) | 521 (22.8%) |
| Bottled, Tank, or LP Gas | 580 (5.3%) | 98 (4.3%) |
| Electricity | 7,108 (64.8%) | 1,614 (70.5%) |
| Fuel Oil or Kerosene | 0 (0.0%) | 0 (0.0%) |
| Coal or Coke | 0 (0.0%) | 0 (0.0%) |
| All other Fuels | 278 (2.5%) | 31 (1.3%) |
| No Fuel Used | 150 (1.4%) | 25 (1.1%) |
| Total | 10,976 (100.0%) | 2,289 (100.0%) |
Household Vehicle Usage in Fortuna Foothills
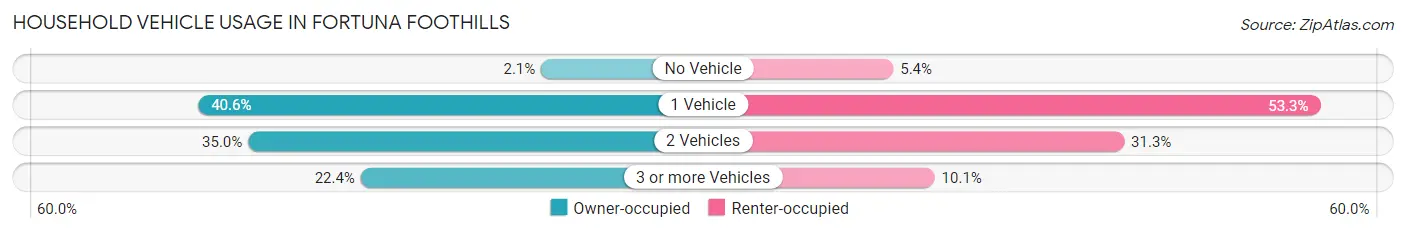
| Vehicles per Household | Owner-occupied | Renter-occupied |
| No Vehicle | 235 (2.1%) | 124 (5.4%) |
| 1 Vehicle | 4,451 (40.6%) | 1,219 (53.2%) |
| 2 Vehicles | 3,837 (35.0%) | 716 (31.3%) |
| 3 or more Vehicles | 2,453 (22.4%) | 230 (10.1%) |
| Total | 10,976 (100.0%) | 2,289 (100.0%) |
Real Estate & Mortgages in Fortuna Foothills
Real Estate and Mortgage Overview in Fortuna Foothills
| Characteristic | Without Mortgage | With Mortgage |
| Housing Units | 6,188 | 4,788 |
| Median Property Value | $123,600 | $202,600 |
| Median Household Income | $47,674 | $548 |
| Monthly Housing Costs | $335 | $101 |
| Real Estate Taxes | $967 | $216 |
Property Value by Mortgage Status in Fortuna Foothills
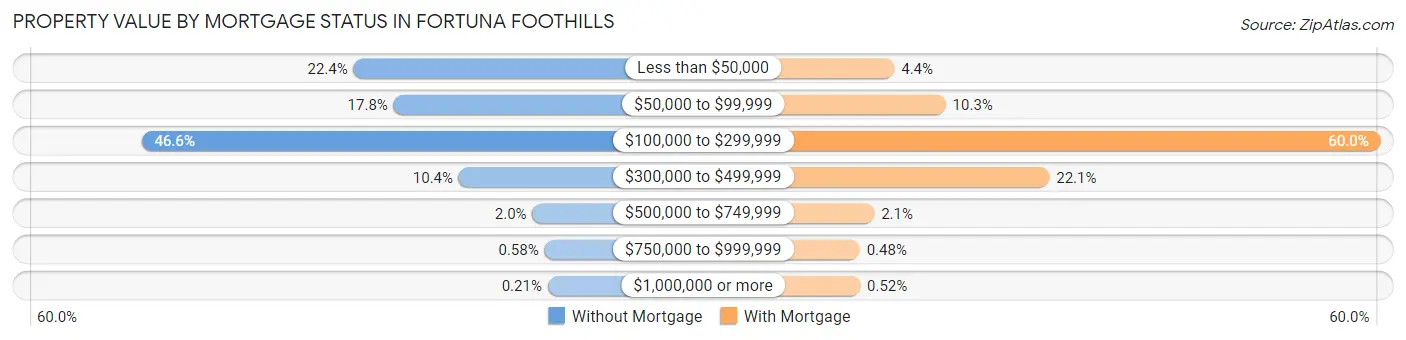
| Property Value | Without Mortgage | With Mortgage |
| Less than $50,000 | 1,387 (22.4%) | 212 (4.4%) |
| $50,000 to $99,999 | 1,103 (17.8%) | 493 (10.3%) |
| $100,000 to $299,999 | 2,886 (46.6%) | 2,873 (60.0%) |
| $300,000 to $499,999 | 642 (10.4%) | 1,060 (22.1%) |
| $500,000 to $749,999 | 121 (2.0%) | 102 (2.1%) |
| $750,000 to $999,999 | 36 (0.6%) | 23 (0.5%) |
| $1,000,000 or more | 13 (0.2%) | 25 (0.5%) |
| Total | 6,188 (100.0%) | 4,788 (100.0%) |
Household Income by Mortgage Status in Fortuna Foothills
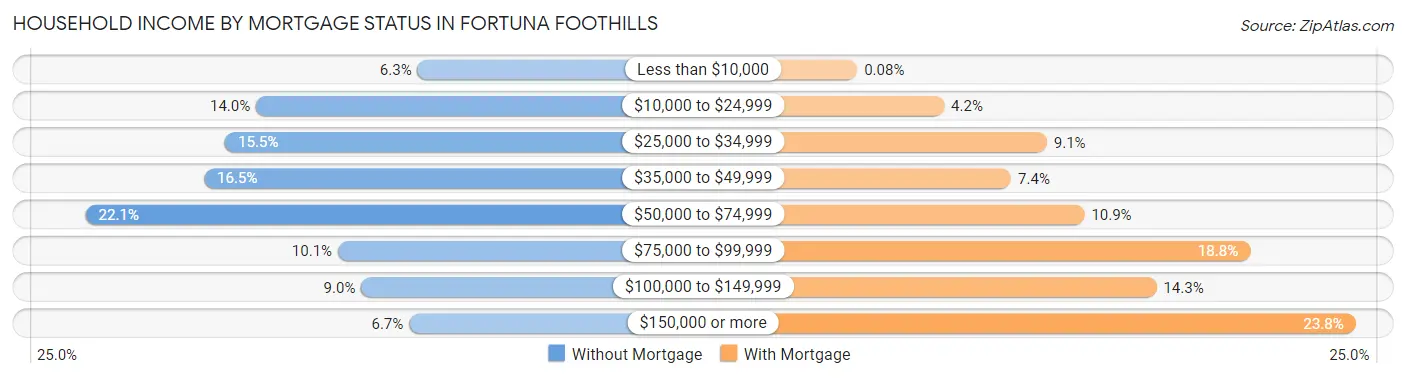
| Household Income | Without Mortgage | With Mortgage |
| Less than $10,000 | 389 (6.3%) | 4 (0.1%) |
| $10,000 to $24,999 | 865 (14.0%) | 202 (4.2%) |
| $25,000 to $34,999 | 956 (15.4%) | 436 (9.1%) |
| $35,000 to $49,999 | 1,018 (16.5%) | 355 (7.4%) |
| $50,000 to $74,999 | 1,367 (22.1%) | 522 (10.9%) |
| $75,000 to $99,999 | 624 (10.1%) | 899 (18.8%) |
| $100,000 to $149,999 | 555 (9.0%) | 686 (14.3%) |
| $150,000 or more | 414 (6.7%) | 1,140 (23.8%) |
| Total | 6,188 (100.0%) | 4,788 (100.0%) |
Property Value to Household Income Ratio in Fortuna Foothills
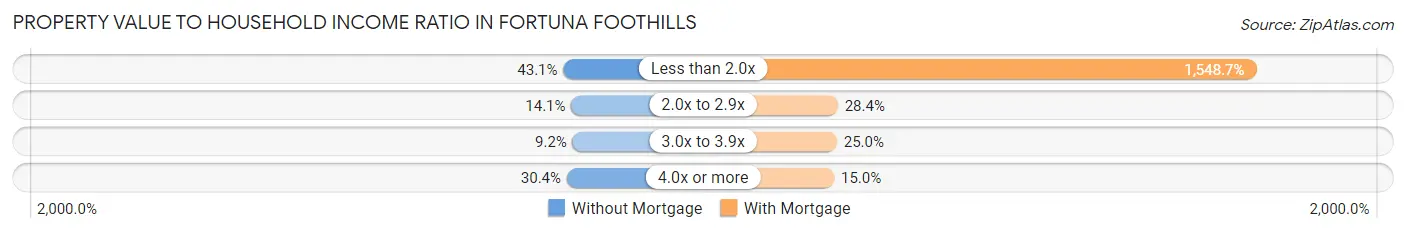
| Value-to-Income Ratio | Without Mortgage | With Mortgage |
| Less than 2.0x | 2,666 (43.1%) | 74,153 (1,548.7%) |
| 2.0x to 2.9x | 871 (14.1%) | 1,358 (28.4%) |
| 3.0x to 3.9x | 568 (9.2%) | 1,199 (25.0%) |
| 4.0x or more | 1,878 (30.3%) | 719 (15.0%) |
| Total | 6,188 (100.0%) | 4,788 (100.0%) |
Real Estate Taxes by Mortgage Status in Fortuna Foothills
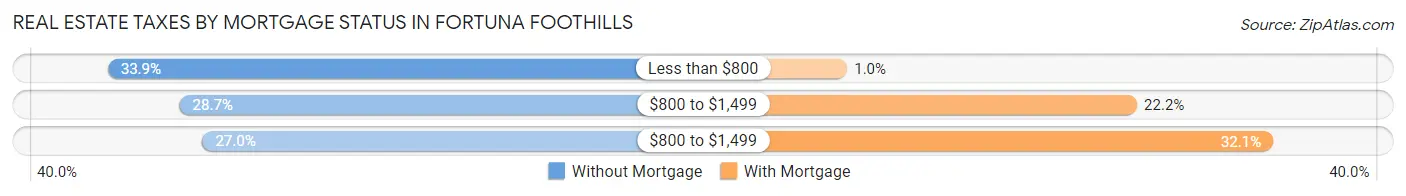
| Property Taxes | Without Mortgage | With Mortgage |
| Less than $800 | 2,099 (33.9%) | 50 (1.0%) |
| $800 to $1,499 | 1,774 (28.7%) | 1,064 (22.2%) |
| $800 to $1,499 | 1,671 (27.0%) | 1,539 (32.1%) |
| Total | 6,188 (100.0%) | 4,788 (100.0%) |
Health & Disability in Fortuna Foothills
Health Insurance Coverage by Age in Fortuna Foothills
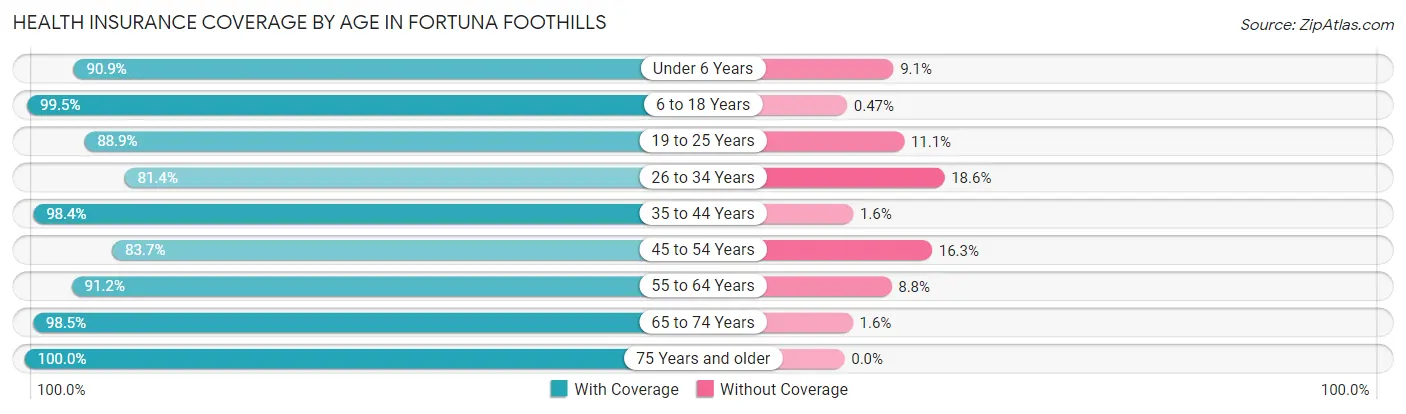
| Age Bracket | With Coverage | Without Coverage |
| Under 6 Years | 1,245 (90.9%) | 125 (9.1%) |
| 6 to 18 Years | 2,955 (99.5%) | 14 (0.5%) |
| 19 to 25 Years | 943 (88.9%) | 118 (11.1%) |
| 26 to 34 Years | 1,742 (81.4%) | 399 (18.6%) |
| 35 to 44 Years | 1,952 (98.4%) | 32 (1.6%) |
| 45 to 54 Years | 1,748 (83.7%) | 341 (16.3%) |
| 55 to 64 Years | 2,667 (91.2%) | 256 (8.8%) |
| 65 to 74 Years | 5,533 (98.5%) | 87 (1.5%) |
| 75 Years and older | 7,074 (100.0%) | 0 (0.0%) |
| Total | 25,859 (95.0%) | 1,372 (5.0%) |
Health Insurance Coverage by Citizenship Status in Fortuna Foothills
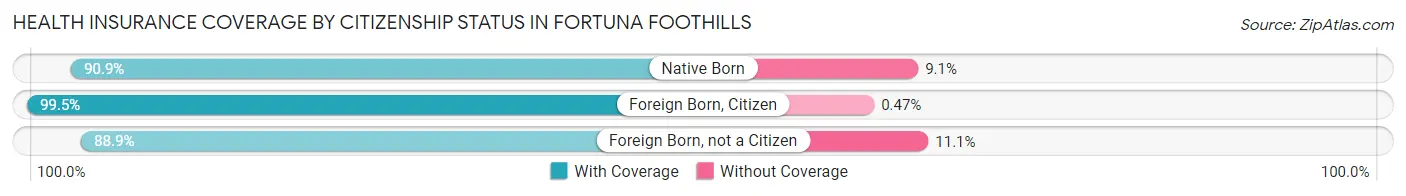
| Citizenship Status | With Coverage | Without Coverage |
| Native Born | 1,245 (90.9%) | 125 (9.1%) |
| Foreign Born, Citizen | 2,955 (99.5%) | 14 (0.5%) |
| Foreign Born, not a Citizen | 943 (88.9%) | 118 (11.1%) |
Health Insurance Coverage by Household Income in Fortuna Foothills
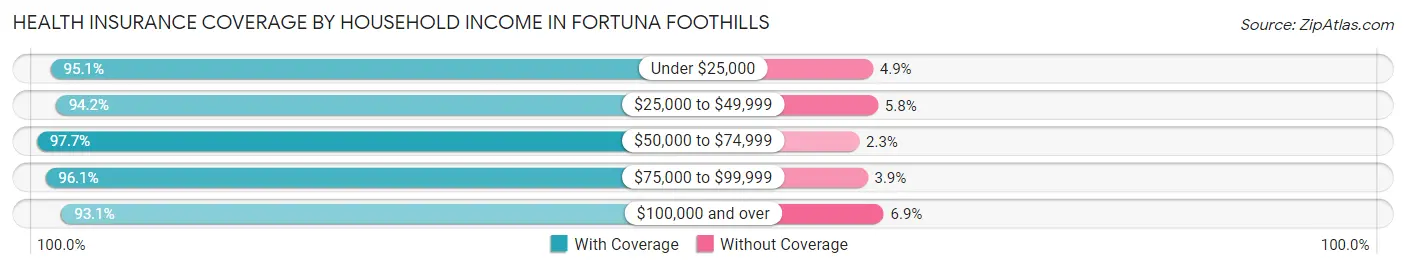
| Household Income | With Coverage | Without Coverage |
| Under $25,000 | 3,604 (95.1%) | 185 (4.9%) |
| $25,000 to $49,999 | 5,478 (94.2%) | 339 (5.8%) |
| $50,000 to $74,999 | 5,825 (97.7%) | 138 (2.3%) |
| $75,000 to $99,999 | 2,971 (96.1%) | 120 (3.9%) |
| $100,000 and over | 7,968 (93.1%) | 590 (6.9%) |
Public vs Private Health Insurance Coverage by Age in Fortuna Foothills
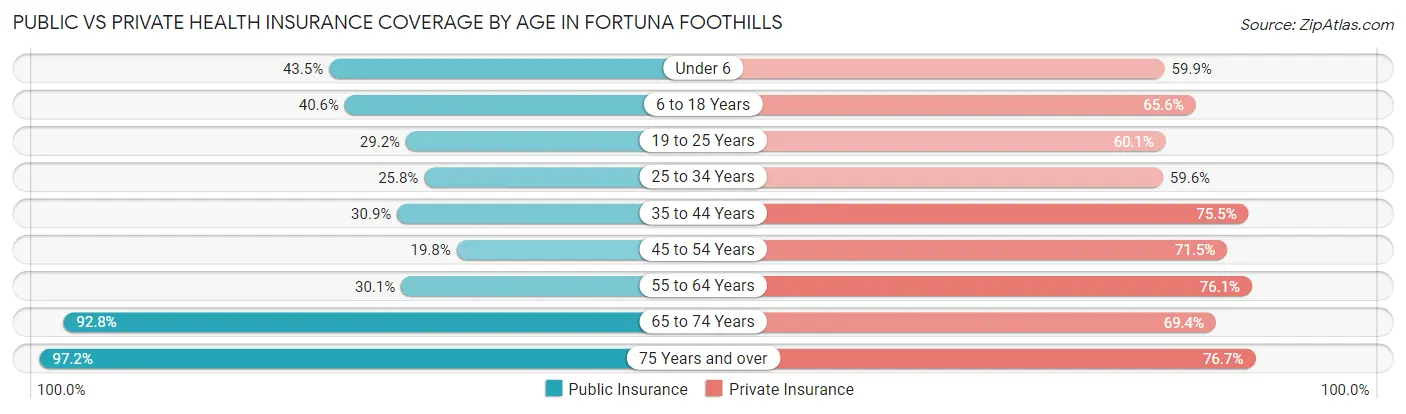
| Age Bracket | Public Insurance | Private Insurance |
| Under 6 | 596 (43.5%) | 821 (59.9%) |
| 6 to 18 Years | 1,204 (40.6%) | 1,949 (65.6%) |
| 19 to 25 Years | 310 (29.2%) | 638 (60.1%) |
| 25 to 34 Years | 553 (25.8%) | 1,276 (59.6%) |
| 35 to 44 Years | 612 (30.8%) | 1,498 (75.5%) |
| 45 to 54 Years | 414 (19.8%) | 1,494 (71.5%) |
| 55 to 64 Years | 880 (30.1%) | 2,225 (76.1%) |
| 65 to 74 Years | 5,215 (92.8%) | 3,901 (69.4%) |
| 75 Years and over | 6,877 (97.2%) | 5,428 (76.7%) |
| Total | 16,661 (61.2%) | 19,230 (70.6%) |
Disability Status by Sex by Age in Fortuna Foothills
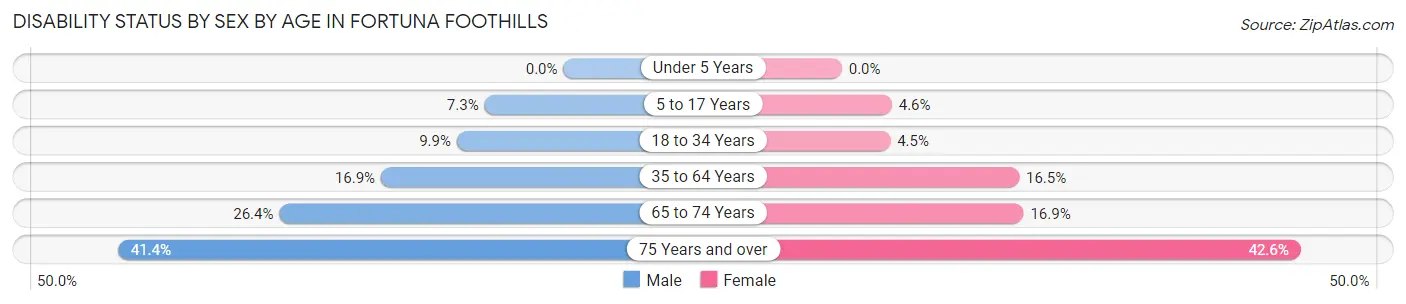
| Age Bracket | Male | Female |
| Under 5 Years | 0 (0.0%) | 0 (0.0%) |
| 5 to 17 Years | 112 (7.3%) | 74 (4.6%) |
| 18 to 34 Years | 168 (9.9%) | 71 (4.5%) |
| 35 to 64 Years | 607 (16.9%) | 561 (16.5%) |
| 65 to 74 Years | 665 (26.4%) | 522 (16.9%) |
| 75 Years and over | 1,435 (41.3%) | 1,535 (42.6%) |
Disability Class by Sex by Age in Fortuna Foothills
Disability Class: Hearing Difficulty
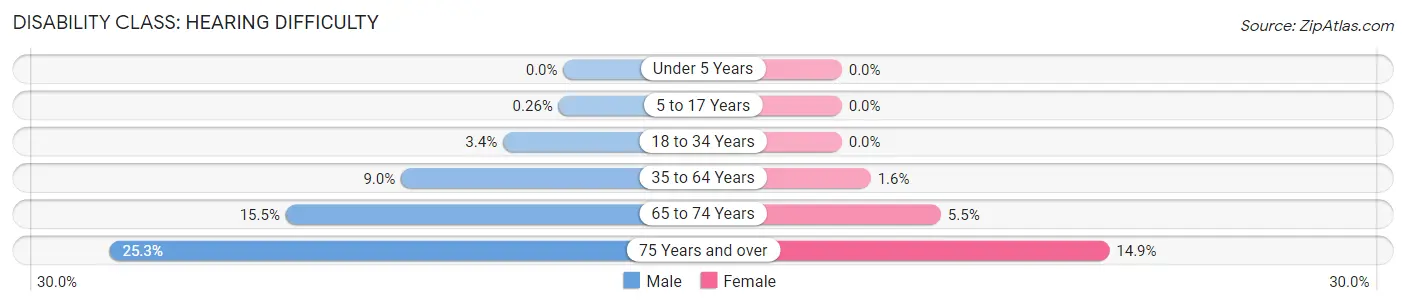
| Age Bracket | Male | Female |
| Under 5 Years | 0 (0.0%) | 0 (0.0%) |
| 5 to 17 Years | 4 (0.3%) | 0 (0.0%) |
| 18 to 34 Years | 57 (3.4%) | 0 (0.0%) |
| 35 to 64 Years | 324 (9.0%) | 55 (1.6%) |
| 65 to 74 Years | 390 (15.5%) | 171 (5.5%) |
| 75 Years and over | 877 (25.3%) | 537 (14.9%) |
Disability Class: Vision Difficulty
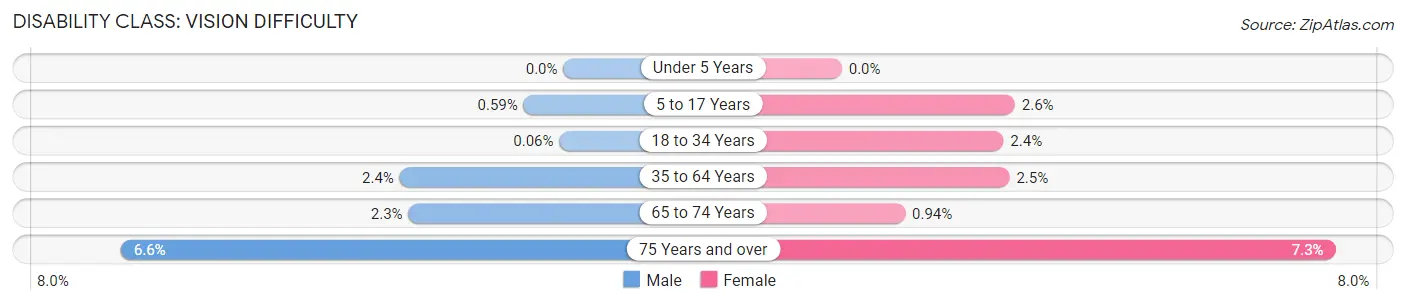
| Age Bracket | Male | Female |
| Under 5 Years | 0 (0.0%) | 0 (0.0%) |
| 5 to 17 Years | 9 (0.6%) | 41 (2.6%) |
| 18 to 34 Years | 1 (0.1%) | 38 (2.4%) |
| 35 to 64 Years | 87 (2.4%) | 85 (2.5%) |
| 65 to 74 Years | 58 (2.3%) | 29 (0.9%) |
| 75 Years and over | 228 (6.6%) | 264 (7.3%) |
Disability Class: Cognitive Difficulty
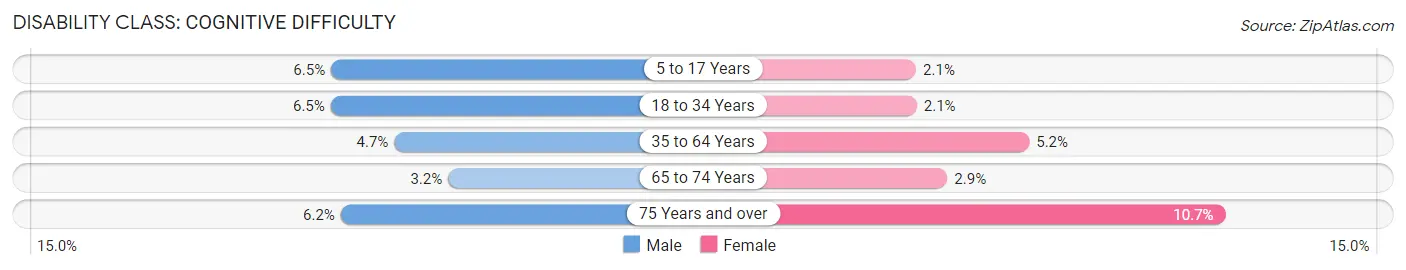
| Age Bracket | Male | Female |
| 5 to 17 Years | 99 (6.5%) | 33 (2.1%) |
| 18 to 34 Years | 110 (6.5%) | 33 (2.1%) |
| 35 to 64 Years | 169 (4.7%) | 178 (5.2%) |
| 65 to 74 Years | 81 (3.2%) | 91 (2.9%) |
| 75 Years and over | 215 (6.2%) | 385 (10.7%) |
Disability Class: Ambulatory Difficulty
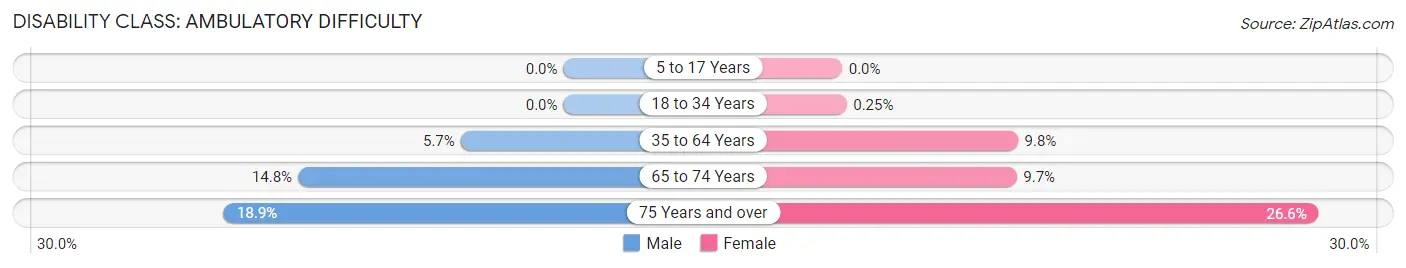
| Age Bracket | Male | Female |
| 5 to 17 Years | 0 (0.0%) | 0 (0.0%) |
| 18 to 34 Years | 0 (0.0%) | 4 (0.3%) |
| 35 to 64 Years | 205 (5.7%) | 334 (9.8%) |
| 65 to 74 Years | 373 (14.8%) | 301 (9.7%) |
| 75 Years and over | 656 (18.9%) | 957 (26.6%) |
Disability Class: Self-Care Difficulty
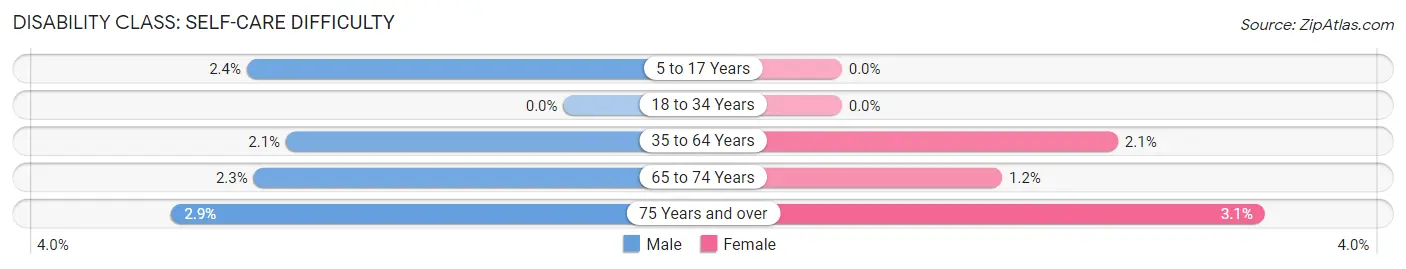
| Age Bracket | Male | Female |
| 5 to 17 Years | 36 (2.4%) | 0 (0.0%) |
| 18 to 34 Years | 0 (0.0%) | 0 (0.0%) |
| 35 to 64 Years | 74 (2.1%) | 70 (2.1%) |
| 65 to 74 Years | 58 (2.3%) | 37 (1.2%) |
| 75 Years and over | 101 (2.9%) | 113 (3.1%) |
Technology Access in Fortuna Foothills
Computing Device Access in Fortuna Foothills
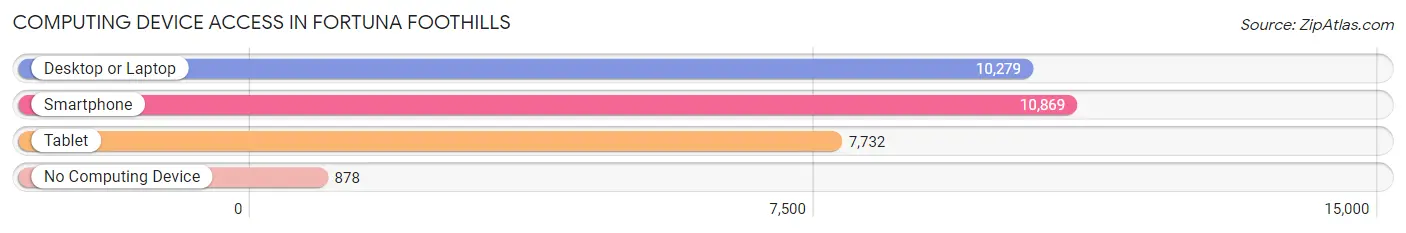
| Device Type | # Households | % Households |
| Desktop or Laptop | 10,279 | 77.5% |
| Smartphone | 10,869 | 81.9% |
| Tablet | 7,732 | 58.3% |
| No Computing Device | 878 | 6.6% |
| Total | 13,265 | 100.0% |
Internet Access in Fortuna Foothills
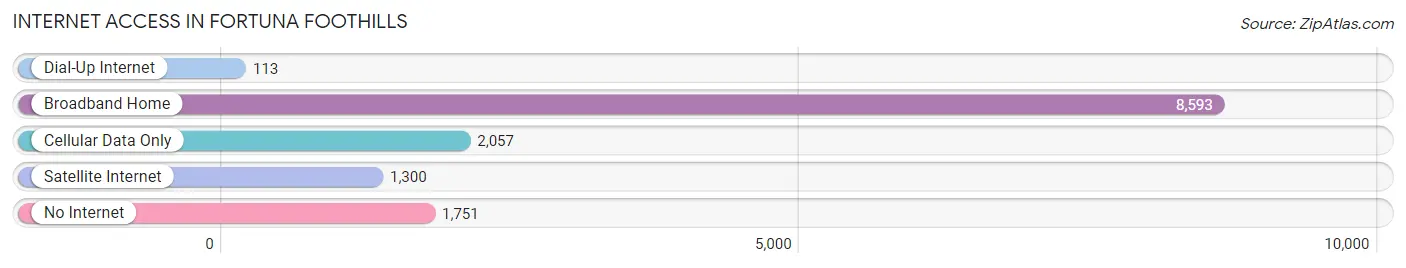
| Internet Type | # Households | % Households |
| Dial-Up Internet | 113 | 0.9% |
| Broadband Home | 8,593 | 64.8% |
| Cellular Data Only | 2,057 | 15.5% |
| Satellite Internet | 1,300 | 9.8% |
| No Internet | 1,751 | 13.2% |
| Total | 13,265 | 100.0% |
Fortuna Foothills Summary
Fortuna Foothills is a census-designated place (CDP) located in Yuma County, Arizona. It is situated in the southwestern corner of the state, approximately 20 miles east of Yuma and the Colorado River. The population of Fortuna Foothills was 8,945 at the 2010 census.
Geography
Fortuna Foothills is located at 32°45'25" North, 114°30'25" West (32.756944, -114.506944). It is situated in the southwestern corner of Arizona, approximately 20 miles east of Yuma and the Colorado River. The CDP has a total area of 8.3 square miles, all of which is land.
History
Fortuna Foothills was first settled in the late 19th century by ranchers and farmers. The area was originally known as Fortuna, and the name was changed to Fortuna Foothills in the early 20th century. The area was annexed by Yuma County in the 1950s.
Economy
Fortuna Foothills is primarily a residential community, with most of its residents commuting to Yuma for work. The area is also home to several small businesses, including a few restaurants, convenience stores, and auto repair shops.
Demographics
As of the 2010 census, there were 8,945 people, 3,093 households, and 2,521 families residing in Fortuna Foothills. The population density was 1,076.2 people per square mile. The racial makeup of the CDP was 75.2% White, 0.7% African American, 1.2% Native American, 0.7% Asian, 0.1% Pacific Islander, 19.2% from other races, and 3.1% from two or more races. Hispanic or Latino of any race were 37.2% of the population.
The median income for a household in Fortuna Foothills was $37,917, and the median income for a family was $41,917. Males had a median income of $30,917 versus $25,917 for females. The per capita income for the CDP was $15,917. About 14.2% of families and 17.2% of the population were below the poverty line, including 24.2% of those under age 18 and 8.2% of those age 65 or over.
Common Questions
What is Per Capita Income in Fortuna Foothills?
Per Capita income in Fortuna Foothills is $33,372.
What is the Median Family Income in Fortuna Foothills?
Median Family Income in Fortuna Foothills is $67,083.
What is the Median Household income in Fortuna Foothills?
Median Household Income in Fortuna Foothills is $55,347.
What is Income or Wage Gap in Fortuna Foothills?
Income or Wage Gap in Fortuna Foothills is 40.8%.
Women in Fortuna Foothills earn 59.2 cents for every dollar earned by a man.
What is Family Income Deficit in Fortuna Foothills?
Family Income Deficit in Fortuna Foothills is $12,644.
Families that are below poverty line in Fortuna Foothills earn $12,644 less on average than the poverty threshold level.
What is Inequality or Gini Index in Fortuna Foothills?
Inequality or Gini Index in Fortuna Foothills is 0.43.
What is the Total Population of Fortuna Foothills?
Total Population of Fortuna Foothills is 27,552.
What is the Total Male Population of Fortuna Foothills?
Total Male Population of Fortuna Foothills is 13,689.
What is the Total Female Population of Fortuna Foothills?
Total Female Population of Fortuna Foothills is 13,863.
What is the Ratio of Males per 100 Females in Fortuna Foothills?
There are 98.74 Males per 100 Females in Fortuna Foothills.
What is the Ratio of Females per 100 Males in Fortuna Foothills?
There are 101.27 Females per 100 Males in Fortuna Foothills.
What is the Median Population Age in Fortuna Foothills?
Median Population Age in Fortuna Foothills is 61.9 Years.
What is the Average Family Size in Fortuna Foothills
Average Family Size in Fortuna Foothills is 2.5 People.
What is the Average Household Size in Fortuna Foothills
Average Household Size in Fortuna Foothills is 2.1 People.
How Large is the Labor Force in Fortuna Foothills?
There are 8,535 People in the Labor Forcein in Fortuna Foothills.
What is the Percentage of People in the Labor Force in Fortuna Foothills?
36.1% of People are in the Labor Force in Fortuna Foothills.
What is the Unemployment Rate in Fortuna Foothills?
Unemployment Rate in Fortuna Foothills is 7.7%.