South Weber, UT Map & Demographics
South Weber Map
South Weber Overview
$41,468
PER CAPITA INCOME
$140,186
AVG FAMILY INCOME
$130,769
AVG HOUSEHOLD INCOME
46.8%
WAGE / INCOME GAP [ % ]
53.2¢/ $1
WAGE / INCOME GAP [ $ ]
$7,298
FAMILY INCOME DEFICIT
0.31
INEQUALITY / GINI INDEX
7,939
TOTAL POPULATION
4,091
MALE POPULATION
3,848
FEMALE POPULATION
106.31
MALES / 100 FEMALES
94.06
FEMALES / 100 MALES
34.9
MEDIAN AGE
3.6
AVG FAMILY SIZE
3.5
AVG HOUSEHOLD SIZE
4,188
LABOR FORCE [ PEOPLE ]
71.6%
PERCENT IN LABOR FORCE
2.7%
UNEMPLOYMENT RATE
Income in South Weber
Income Overview in South Weber
Per Capita Income in South Weber is $41,468, while median incomes of families and households are $140,186 and $130,769 respectively.
| Characteristic | Number | Measure |
| Per Capita Income | 7,939 | $41,468 |
| Median Family Income | 2,085 | $140,186 |
| Mean Family Income | 2,085 | $144,976 |
| Median Household Income | 2,302 | $130,769 |
| Mean Household Income | 2,302 | $138,899 |
| Income Deficit | 2,085 | $7,298 |
| Wage / Income Gap (%) | 7,939 | 46.78% |
| Wage / Income Gap ($) | 7,939 | 53.22¢ per $1 |
| Gini / Inequality Index | 7,939 | 0.31 |
Earnings by Sex in South Weber
Average Earnings in South Weber are $55,675, $73,848 for men and $39,299 for women, a difference of 46.8%.
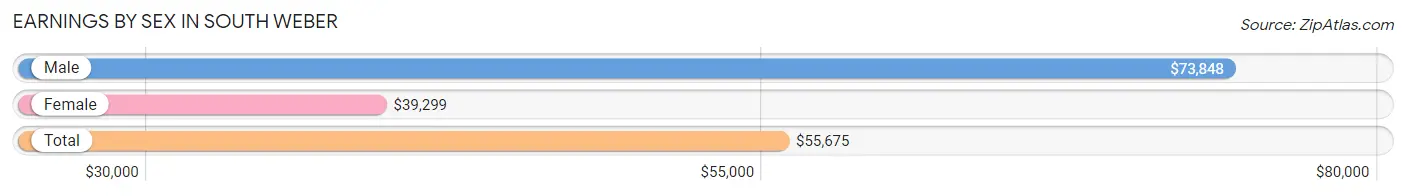
| Sex | Number | Average Earnings |
| Male | 2,375 (55.2%) | $73,848 |
| Female | 1,929 (44.8%) | $39,299 |
| Total | 4,304 (100.0%) | $55,675 |
Earnings by Sex by Income Bracket in South Weber
The most common earnings brackets in South Weber are $100,000+ for men (662 | 27.9%) and $75,000 to $99,999 for women (287 | 14.9%).
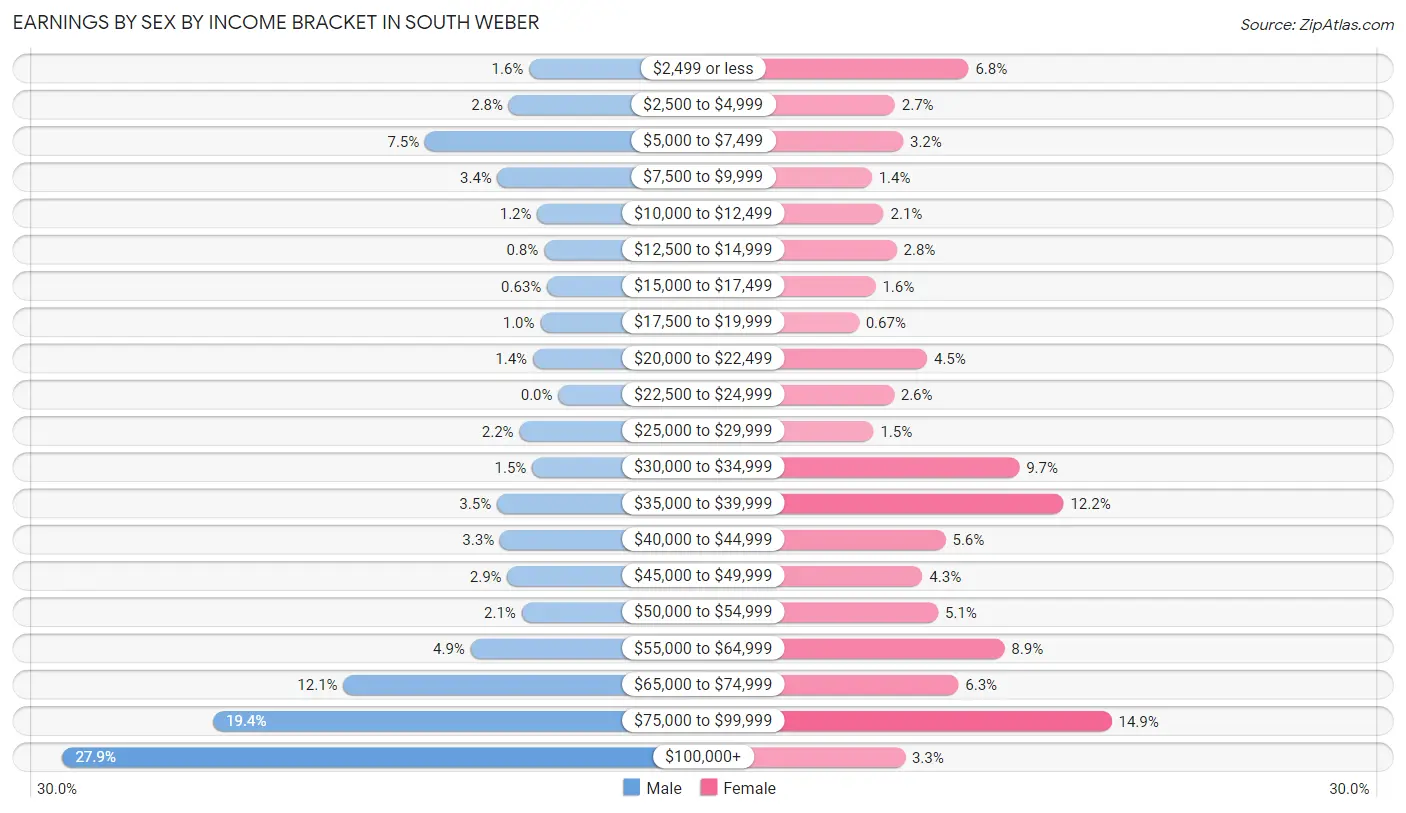
| Income | Male | Female |
| $2,499 or less | 39 (1.6%) | 132 (6.8%) |
| $2,500 to $4,999 | 66 (2.8%) | 52 (2.7%) |
| $5,000 to $7,499 | 178 (7.5%) | 61 (3.2%) |
| $7,500 to $9,999 | 81 (3.4%) | 27 (1.4%) |
| $10,000 to $12,499 | 28 (1.2%) | 40 (2.1%) |
| $12,500 to $14,999 | 19 (0.8%) | 54 (2.8%) |
| $15,000 to $17,499 | 15 (0.6%) | 31 (1.6%) |
| $17,500 to $19,999 | 24 (1.0%) | 13 (0.7%) |
| $20,000 to $22,499 | 34 (1.4%) | 87 (4.5%) |
| $22,500 to $24,999 | 0 (0.0%) | 51 (2.6%) |
| $25,000 to $29,999 | 52 (2.2%) | 29 (1.5%) |
| $30,000 to $34,999 | 35 (1.5%) | 187 (9.7%) |
| $35,000 to $39,999 | 82 (3.5%) | 235 (12.2%) |
| $40,000 to $44,999 | 78 (3.3%) | 107 (5.6%) |
| $45,000 to $49,999 | 68 (2.9%) | 82 (4.3%) |
| $50,000 to $54,999 | 49 (2.1%) | 99 (5.1%) |
| $55,000 to $64,999 | 117 (4.9%) | 171 (8.9%) |
| $65,000 to $74,999 | 287 (12.1%) | 121 (6.3%) |
| $75,000 to $99,999 | 461 (19.4%) | 287 (14.9%) |
| $100,000+ | 662 (27.9%) | 63 (3.3%) |
| Total | 2,375 (100.0%) | 1,929 (100.0%) |
Earnings by Sex by Educational Attainment in South Weber
Average earnings in South Weber are $81,005 for men and $44,853 for women, a difference of 44.6%. Men with an educational attainment of graduate degree enjoy the highest average annual earnings of $105,938, while those with college or associate's degree education earn the least with $62,163. Women with an educational attainment of graduate degree earn the most with the average annual earnings of $78,681, while those with high school diploma education have the smallest earnings of $37,426.
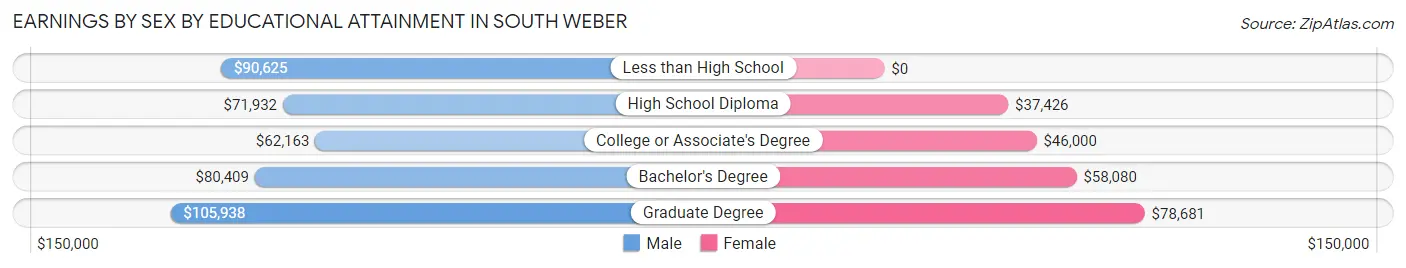
| Educational Attainment | Male Income | Female Income |
| Less than High School | $90,625 | $0 |
| High School Diploma | $71,932 | $37,426 |
| College or Associate's Degree | $62,163 | $46,000 |
| Bachelor's Degree | $80,409 | $58,080 |
| Graduate Degree | $105,938 | $78,681 |
| Total | $81,005 | $44,853 |
Family Income in South Weber
Family Income Brackets in South Weber
According to the South Weber family income data, there are 573 families falling into the $150,000 to $199,999 income range, which is the most common income bracket and makes up 27.5% of all families.
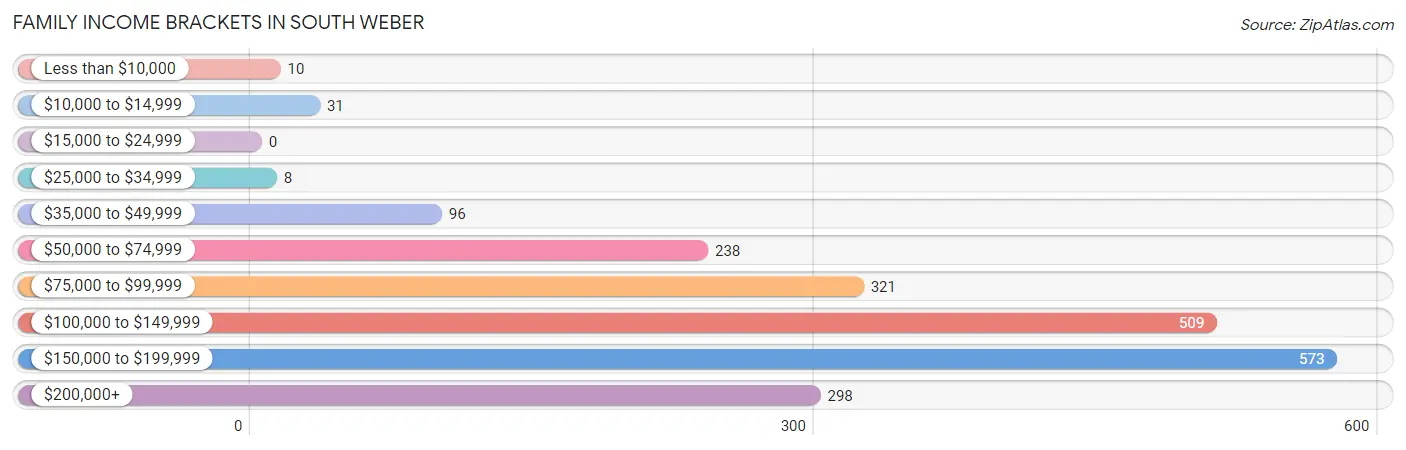
| Income Bracket | # Families | % Families |
| Less than $10,000 | 10 | 0.5% |
| $10,000 to $14,999 | 31 | 1.5% |
| $15,000 to $24,999 | 0 | 0.0% |
| $25,000 to $34,999 | 8 | 0.4% |
| $35,000 to $49,999 | 96 | 4.6% |
| $50,000 to $74,999 | 238 | 11.4% |
| $75,000 to $99,999 | 321 | 15.4% |
| $100,000 to $149,999 | 509 | 24.4% |
| $150,000 to $199,999 | 573 | 27.5% |
| $200,000+ | 298 | 14.3% |
Family Income by Famaliy Size in South Weber
4-person families (414 | 19.9%) account for the highest median family income in South Weber with $182,886 per family, while 2-person families (684 | 32.8%) have the highest median income of $68,572 per family member.
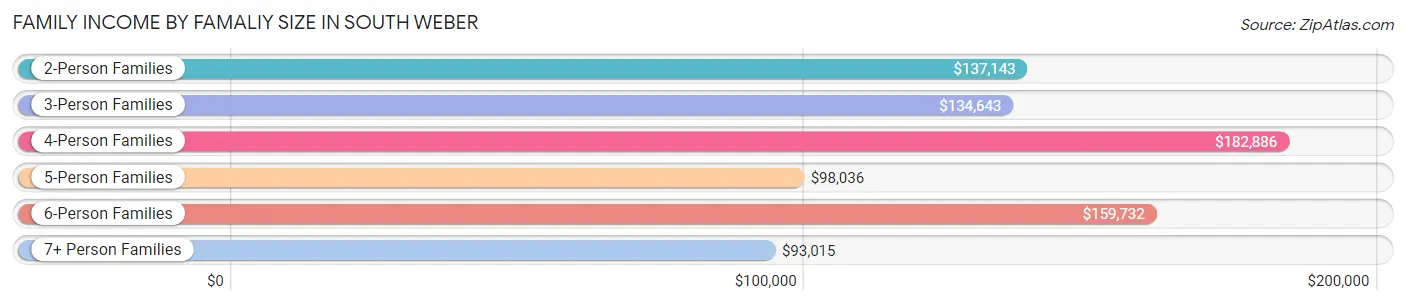
| Income Bracket | # Families | Median Income |
| 2-Person Families | 684 (32.8%) | $137,143 |
| 3-Person Families | 490 (23.5%) | $134,643 |
| 4-Person Families | 414 (19.9%) | $182,886 |
| 5-Person Families | 267 (12.8%) | $98,036 |
| 6-Person Families | 101 (4.8%) | $159,732 |
| 7+ Person Families | 129 (6.2%) | $93,015 |
| Total | 2,085 (100.0%) | $140,186 |
Family Income by Number of Earners in South Weber
The median family income in South Weber is $140,186, with families comprising 3+ earners (456) having the highest median family income of $184,430, while families with no earners (150) have the lowest median family income of $73,250, accounting for 21.9% and 7.2% of families, respectively.
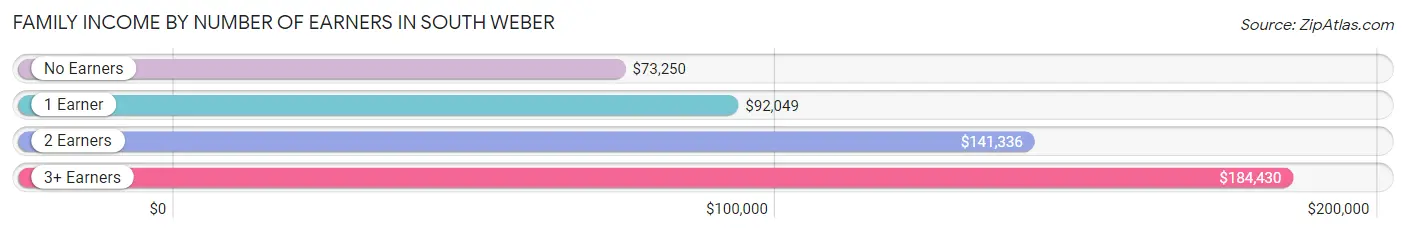
| Number of Earners | # Families | Median Income |
| No Earners | 150 (7.2%) | $73,250 |
| 1 Earner | 666 (31.9%) | $92,049 |
| 2 Earners | 813 (39.0%) | $141,336 |
| 3+ Earners | 456 (21.9%) | $184,430 |
| Total | 2,085 (100.0%) | $140,186 |
Household Income in South Weber
Household Income Brackets in South Weber
With 610 households falling in the category, the $150,000 to $199,999 income range is the most frequent in South Weber, accounting for 26.5% of all households. In contrast, only 9 households (0.4%) fall into the less than $10,000 income bracket, making it the least populous group.
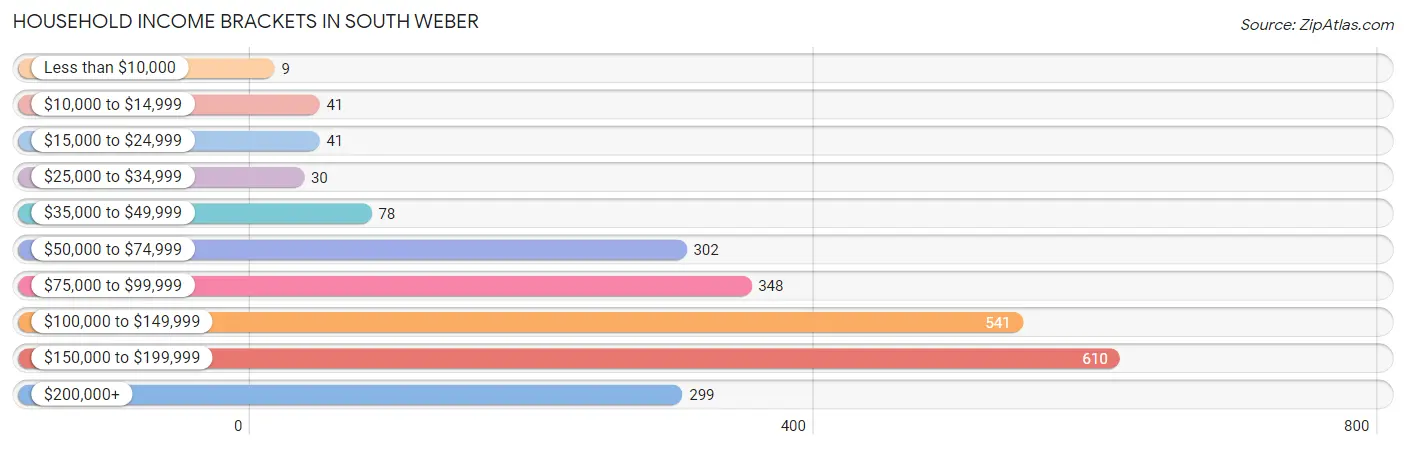
| Income Bracket | # Households | % Households |
| Less than $10,000 | 9 | 0.4% |
| $10,000 to $14,999 | 41 | 1.8% |
| $15,000 to $24,999 | 41 | 1.8% |
| $25,000 to $34,999 | 30 | 1.3% |
| $35,000 to $49,999 | 78 | 3.4% |
| $50,000 to $74,999 | 302 | 13.1% |
| $75,000 to $99,999 | 348 | 15.1% |
| $100,000 to $149,999 | 541 | 23.5% |
| $150,000 to $199,999 | 610 | 26.5% |
| $200,000+ | 299 | 13.0% |
Household Income by Householder Age in South Weber
The median household income in South Weber is $130,769, with the highest median household income of $159,266 found in the 45 to 64 years age bracket for the primary householder. A total of 1,041 households (45.2%) fall into this category. Meanwhile, the 15 to 24 years age bracket for the primary householder has the lowest median household income of $0, with 36 households (1.6%) in this group.
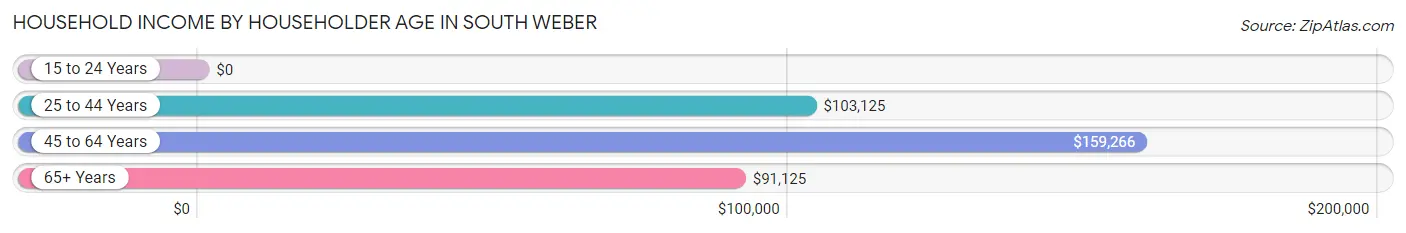
| Income Bracket | # Households | Median Income |
| 15 to 24 Years | 36 (1.6%) | $0 |
| 25 to 44 Years | 824 (35.8%) | $103,125 |
| 45 to 64 Years | 1,041 (45.2%) | $159,266 |
| 65+ Years | 401 (17.4%) | $91,125 |
| Total | 2,302 (100.0%) | $130,769 |
Poverty in South Weber
Income Below Poverty by Sex and Age in South Weber
With 1.1% poverty level for males and 1.6% for females among the residents of South Weber, 65 to 74 year old males and 75 year old and over females are the most vulnerable to poverty, with 20 males (8.7%) and 10 females (9.4%) in their respective age groups living below the poverty level.
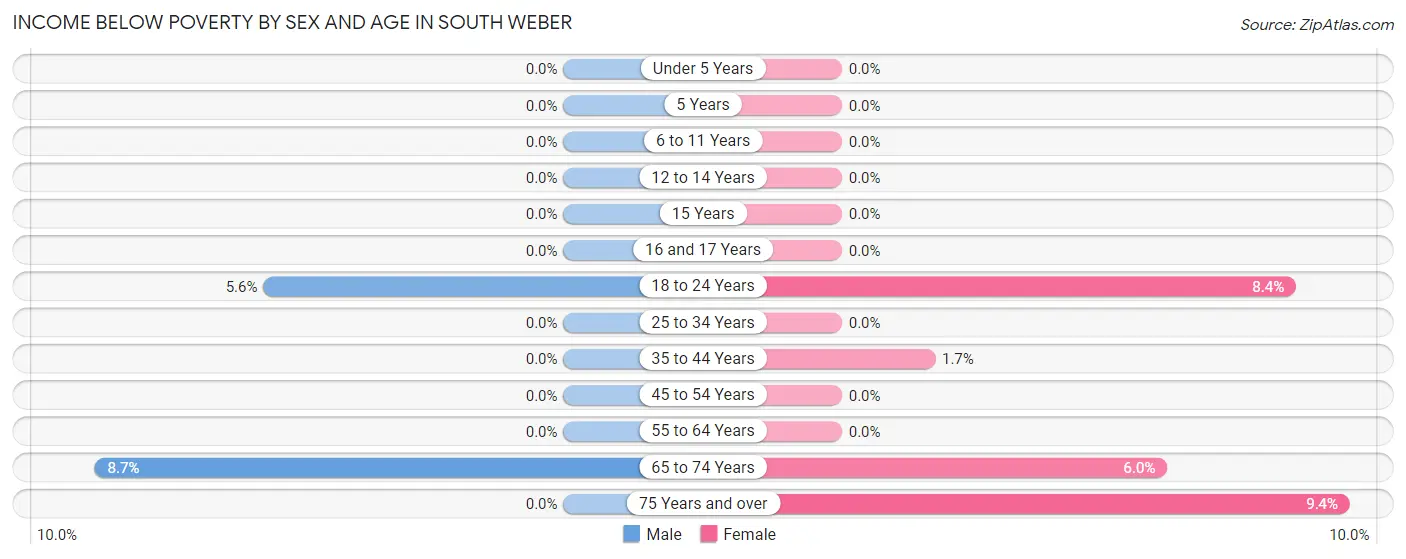
| Age Bracket | Male | Female |
| Under 5 Years | 0 (0.0%) | 0 (0.0%) |
| 5 Years | 0 (0.0%) | 0 (0.0%) |
| 6 to 11 Years | 0 (0.0%) | 0 (0.0%) |
| 12 to 14 Years | 0 (0.0%) | 0 (0.0%) |
| 15 Years | 0 (0.0%) | 0 (0.0%) |
| 16 and 17 Years | 0 (0.0%) | 0 (0.0%) |
| 18 to 24 Years | 27 (5.6%) | 22 (8.4%) |
| 25 to 34 Years | 0 (0.0%) | 0 (0.0%) |
| 35 to 44 Years | 0 (0.0%) | 10 (1.7%) |
| 45 to 54 Years | 0 (0.0%) | 0 (0.0%) |
| 55 to 64 Years | 0 (0.0%) | 0 (0.0%) |
| 65 to 74 Years | 20 (8.7%) | 18 (6.0%) |
| 75 Years and over | 0 (0.0%) | 10 (9.4%) |
| Total | 47 (1.1%) | 60 (1.6%) |
Income Above Poverty by Sex and Age in South Weber
According to the poverty statistics in South Weber, males aged under 5 years and females aged under 5 years are the age groups that are most secure financially, with 100.0% of males and 100.0% of females in these age groups living above the poverty line.
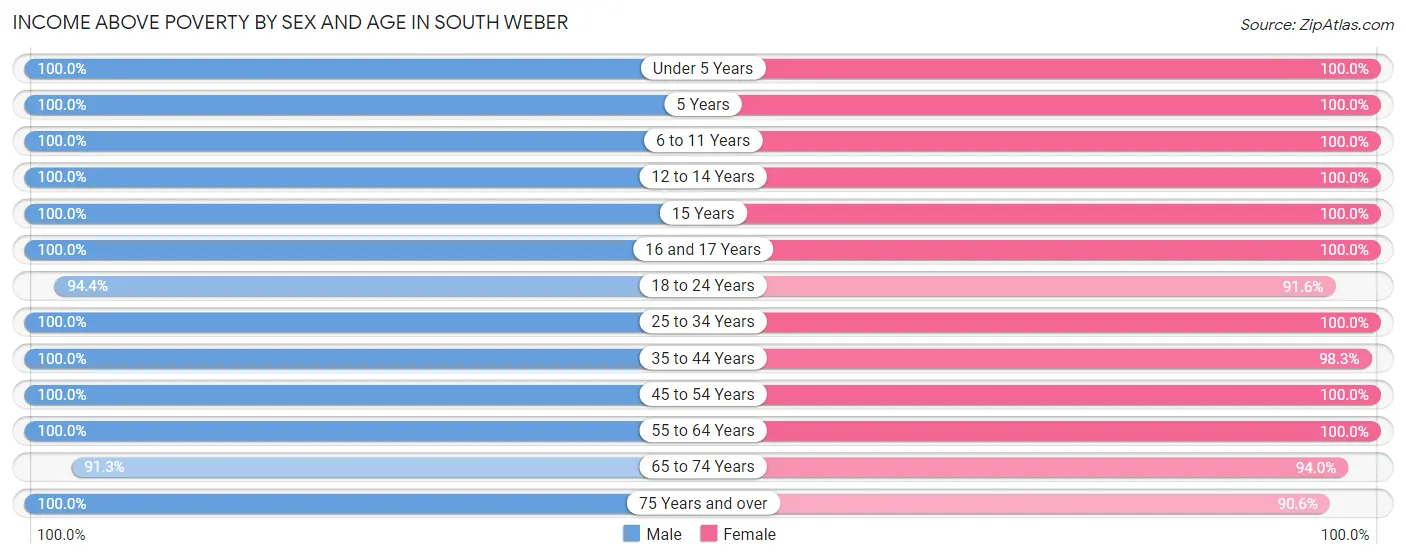
| Age Bracket | Male | Female |
| Under 5 Years | 315 (100.0%) | 286 (100.0%) |
| 5 Years | 62 (100.0%) | 34 (100.0%) |
| 6 to 11 Years | 423 (100.0%) | 437 (100.0%) |
| 12 to 14 Years | 222 (100.0%) | 178 (100.0%) |
| 15 Years | 47 (100.0%) | 77 (100.0%) |
| 16 and 17 Years | 145 (100.0%) | 103 (100.0%) |
| 18 to 24 Years | 458 (94.4%) | 239 (91.6%) |
| 25 to 34 Years | 453 (100.0%) | 448 (100.0%) |
| 35 to 44 Years | 569 (100.0%) | 568 (98.3%) |
| 45 to 54 Years | 605 (100.0%) | 598 (100.0%) |
| 55 to 64 Years | 438 (100.0%) | 435 (100.0%) |
| 65 to 74 Years | 210 (91.3%) | 280 (94.0%) |
| 75 Years and over | 97 (100.0%) | 96 (90.6%) |
| Total | 4,044 (98.9%) | 3,779 (98.4%) |
Income Below Poverty Among Married-Couple Families in South Weber
The poverty statistics for married-couple families in South Weber show that 2.4% or 42 of the total 1,772 families live below the poverty line. Families with no children have the highest poverty rate of 4.6%, comprising of 42 families. On the other hand, families with 1 or 2 children have the lowest poverty rate of 0.0%, which includes 0 families.
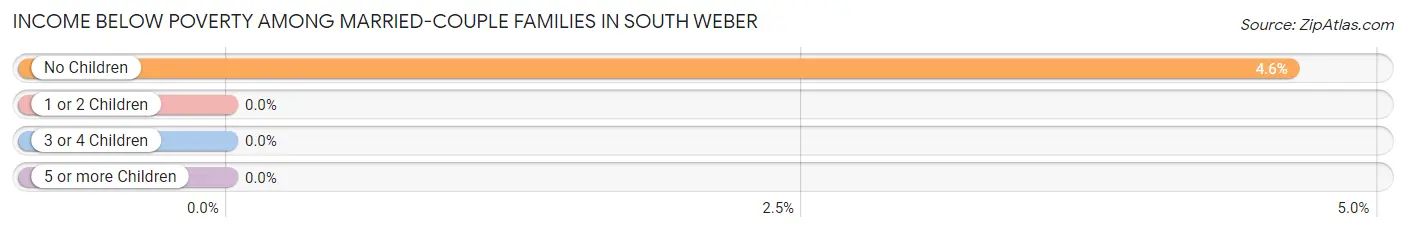
| Children | Above Poverty | Below Poverty |
| No Children | 868 (95.4%) | 42 (4.6%) |
| 1 or 2 Children | 500 (100.0%) | 0 (0.0%) |
| 3 or 4 Children | 278 (100.0%) | 0 (0.0%) |
| 5 or more Children | 84 (100.0%) | 0 (0.0%) |
| Total | 1,730 (97.6%) | 42 (2.4%) |
Income Below Poverty Among Single-Parent Households in South Weber
| Children | Single Father | Single Mother |
| No Children | 0 (0.0%) | 0 (0.0%) |
| 1 or 2 Children | 0 (0.0%) | 0 (0.0%) |
| 3 or 4 Children | 0 (0.0%) | 0 (0.0%) |
| 5 or more Children | 0 (0.0%) | 0 (0.0%) |
| Total | 0 (0.0%) | 0 (0.0%) |
Income Below Poverty Among Married-Couple vs Single-Parent Households in South Weber
| Children | Married-Couple Families | Single-Parent Households |
| No Children | 42 (4.6%) | 0 (0.0%) |
| 1 or 2 Children | 0 (0.0%) | 0 (0.0%) |
| 3 or 4 Children | 0 (0.0%) | 0 (0.0%) |
| 5 or more Children | 0 (0.0%) | 0 (0.0%) |
| Total | 42 (2.4%) | 0 (0.0%) |
Race in South Weber
The most populous races in South Weber are White / Caucasian (6,896 | 86.9%), Hispanic or Latino (726 | 9.1%), and Some other Race (600 | 7.6%).
| Race | # Population | % Population |
| Asian | 61 | 0.8% |
| Black / African American | 0 | 0.0% |
| Hawaiian / Pacific | 0 | 0.0% |
| Hispanic or Latino | 726 | 9.1% |
| Native / Alaskan | 14 | 0.2% |
| White / Caucasian | 6,896 | 86.9% |
| Two or more Races | 368 | 4.6% |
| Some other Race | 600 | 7.6% |
| Total | 7,939 | 100.0% |
Ancestry in South Weber
The most populous ancestries reported in South Weber are English (1,748 | 22.0%), American (1,050 | 13.2%), German (583 | 7.3%), Mexican (480 | 6.0%), and European (394 | 5.0%), together accounting for 53.6% of all South Weber residents.
| Ancestry | # Population | % Population |
| American | 1,050 | 13.2% |
| Arab | 54 | 0.7% |
| Bhutanese | 38 | 0.5% |
| Brazilian | 26 | 0.3% |
| British | 49 | 0.6% |
| Burmese | 12 | 0.2% |
| Canadian | 44 | 0.5% |
| Central American | 28 | 0.4% |
| Czech | 8 | 0.1% |
| Danish | 292 | 3.7% |
| Dutch | 271 | 3.4% |
| English | 1,748 | 22.0% |
| European | 394 | 5.0% |
| French | 98 | 1.2% |
| German | 583 | 7.3% |
| Greek | 12 | 0.2% |
| Guatemalan | 28 | 0.4% |
| Icelander | 19 | 0.2% |
| Irish | 232 | 2.9% |
| Italian | 102 | 1.3% |
| Jordanian | 34 | 0.4% |
| Korean | 28 | 0.4% |
| Lebanese | 20 | 0.3% |
| Mexican | 480 | 6.0% |
| Navajo | 14 | 0.2% |
| Northern European | 9 | 0.1% |
| Norwegian | 169 | 2.1% |
| Pakistani | 6 | 0.1% |
| Peruvian | 32 | 0.4% |
| Polish | 26 | 0.3% |
| Portuguese | 20 | 0.3% |
| Russian | 57 | 0.7% |
| Scandinavian | 64 | 0.8% |
| Scotch-Irish | 9 | 0.1% |
| Scottish | 234 | 2.9% |
| South American | 66 | 0.8% |
| Spanish | 56 | 0.7% |
| Sri Lankan | 27 | 0.3% |
| Swedish | 197 | 2.5% |
| Swiss | 14 | 0.2% |
| Taiwanese | 18 | 0.2% |
| Venezuelan | 34 | 0.4% |
| Welsh | 29 | 0.4% | View All 43 Rows |
Immigrants in South Weber
The most numerous immigrant groups reported in South Weber came from Latin America (186 | 2.3%), Central America (157 | 2.0%), Mexico (138 | 1.7%), Asia (83 | 1.1%), and Jordan (34 | 0.4%), together accounting for 7.5% of all South Weber residents.
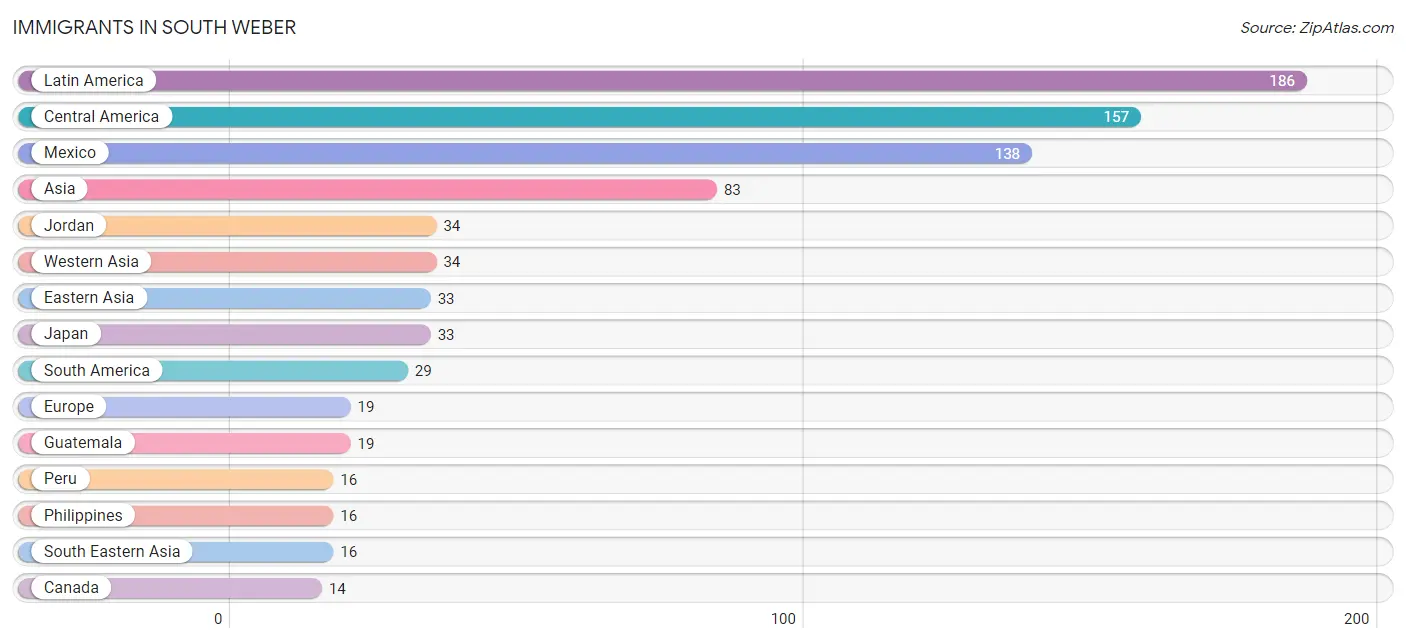
| Immigration Origin | # Population | % Population |
| Asia | 83 | 1.1% |
| Brazil | 13 | 0.2% |
| Canada | 14 | 0.2% |
| Central America | 157 | 2.0% |
| Eastern Asia | 33 | 0.4% |
| England | 9 | 0.1% |
| Europe | 19 | 0.2% |
| Guatemala | 19 | 0.2% |
| Japan | 33 | 0.4% |
| Jordan | 34 | 0.4% |
| Latin America | 186 | 2.3% |
| Mexico | 138 | 1.7% |
| Netherlands | 10 | 0.1% |
| Northern Europe | 9 | 0.1% |
| Peru | 16 | 0.2% |
| Philippines | 16 | 0.2% |
| South America | 29 | 0.4% |
| South Eastern Asia | 16 | 0.2% |
| Western Asia | 34 | 0.4% |
| Western Europe | 10 | 0.1% | View All 20 Rows |
Sex and Age in South Weber
Sex and Age in South Weber
The most populous age groups in South Weber are 15 to 19 Years (447 | 10.9%) for men and 10 to 14 Years (405 | 10.5%) for women.
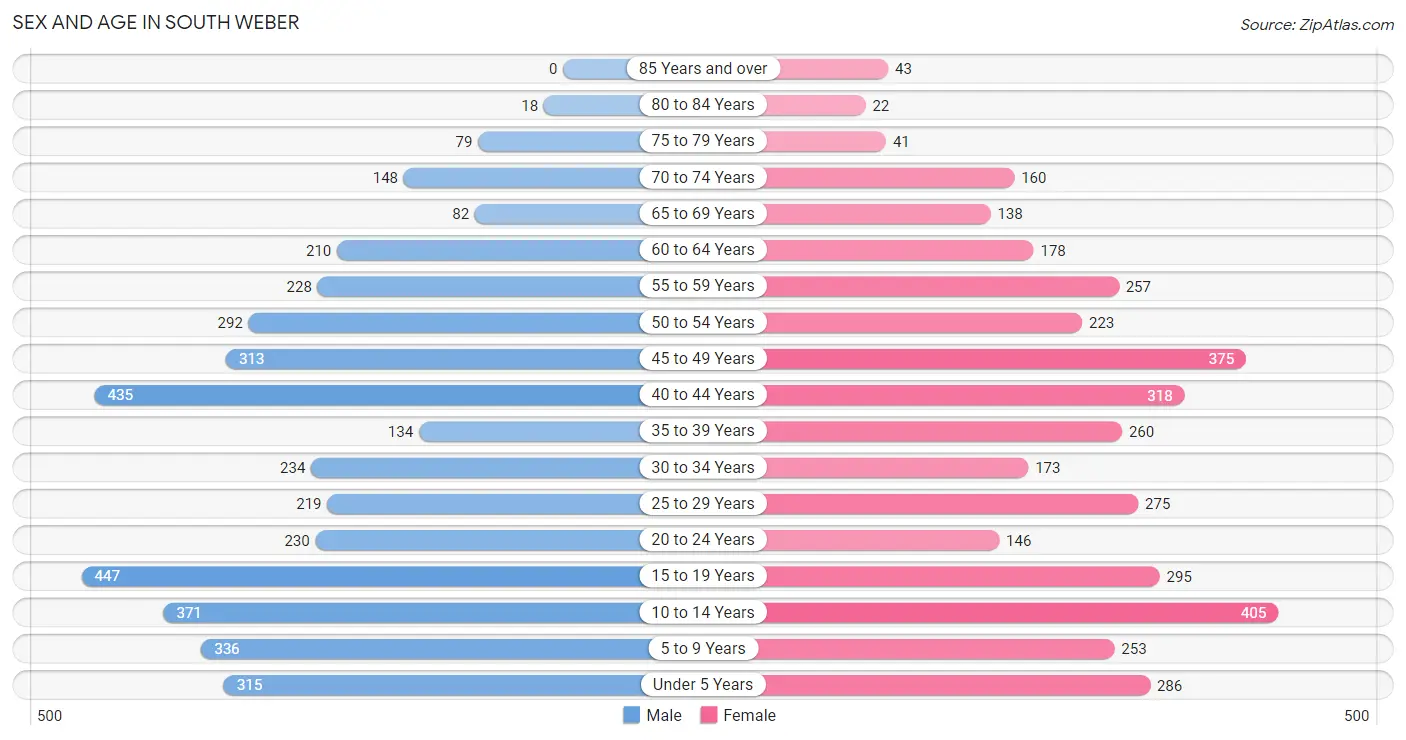
| Age Bracket | Male | Female |
| Under 5 Years | 315 (7.7%) | 286 (7.4%) |
| 5 to 9 Years | 336 (8.2%) | 253 (6.6%) |
| 10 to 14 Years | 371 (9.1%) | 405 (10.5%) |
| 15 to 19 Years | 447 (10.9%) | 295 (7.7%) |
| 20 to 24 Years | 230 (5.6%) | 146 (3.8%) |
| 25 to 29 Years | 219 (5.3%) | 275 (7.1%) |
| 30 to 34 Years | 234 (5.7%) | 173 (4.5%) |
| 35 to 39 Years | 134 (3.3%) | 260 (6.8%) |
| 40 to 44 Years | 435 (10.6%) | 318 (8.3%) |
| 45 to 49 Years | 313 (7.6%) | 375 (9.8%) |
| 50 to 54 Years | 292 (7.1%) | 223 (5.8%) |
| 55 to 59 Years | 228 (5.6%) | 257 (6.7%) |
| 60 to 64 Years | 210 (5.1%) | 178 (4.6%) |
| 65 to 69 Years | 82 (2.0%) | 138 (3.6%) |
| 70 to 74 Years | 148 (3.6%) | 160 (4.2%) |
| 75 to 79 Years | 79 (1.9%) | 41 (1.1%) |
| 80 to 84 Years | 18 (0.4%) | 22 (0.6%) |
| 85 Years and over | 0 (0.0%) | 43 (1.1%) |
| Total | 4,091 (100.0%) | 3,848 (100.0%) |
Families and Households in South Weber
Median Family Size in South Weber
The median family size in South Weber is 3.65 persons per family, with married-couple families (1,772 | 85.0%) accounting for the largest median family size of 3.71 persons per family. On the other hand, single male/father families (111 | 5.3%) represent the smallest median family size with 2.77 persons per family.
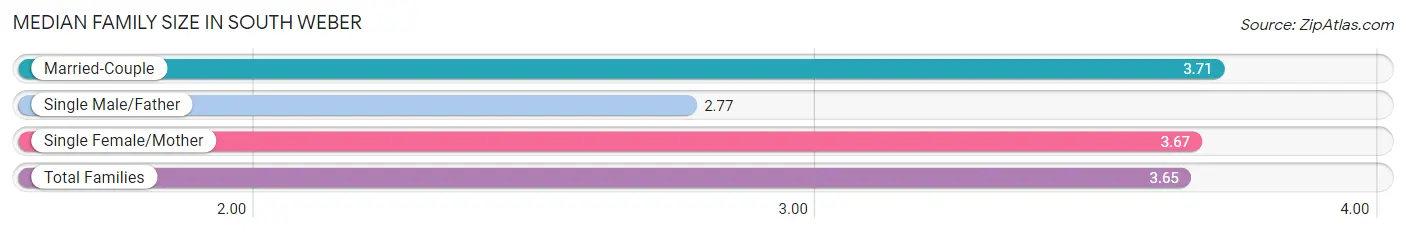
| Family Type | # Families | Family Size |
| Married-Couple | 1,772 (85.0%) | 3.71 |
| Single Male/Father | 111 (5.3%) | 2.77 |
| Single Female/Mother | 202 (9.7%) | 3.67 |
| Total Families | 2,085 (100.0%) | 3.65 |
Median Household Size in South Weber
The median household size in South Weber is 3.45 persons per household, with single female/mother households (202 | 8.8%) accounting for the largest median household size of 3.8 persons per household. non-family households (217 | 9.4%) represent the smallest median household size with 1.27 persons per household.
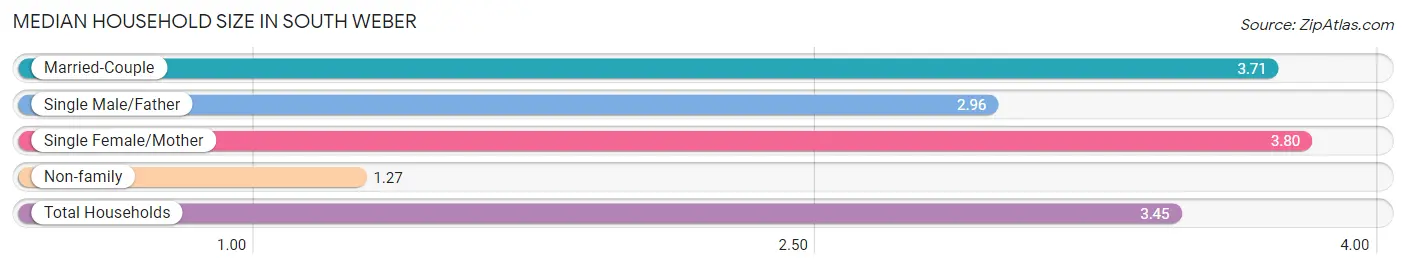
| Household Type | # Households | Household Size |
| Married-Couple | 1,772 (77.0%) | 3.71 |
| Single Male/Father | 111 (4.8%) | 2.96 |
| Single Female/Mother | 202 (8.8%) | 3.80 |
| Non-family | 217 (9.4%) | 1.27 |
| Total Households | 2,302 (100.0%) | 3.45 |
Household Size by Marriage Status in South Weber
Out of a total of 2,302 households in South Weber, 2,085 (90.6%) are family households, while 217 (9.4%) are nonfamily households. The most numerous type of family households are 2-person households, comprising 684, and the most common type of nonfamily households are 1-person households, comprising 192.
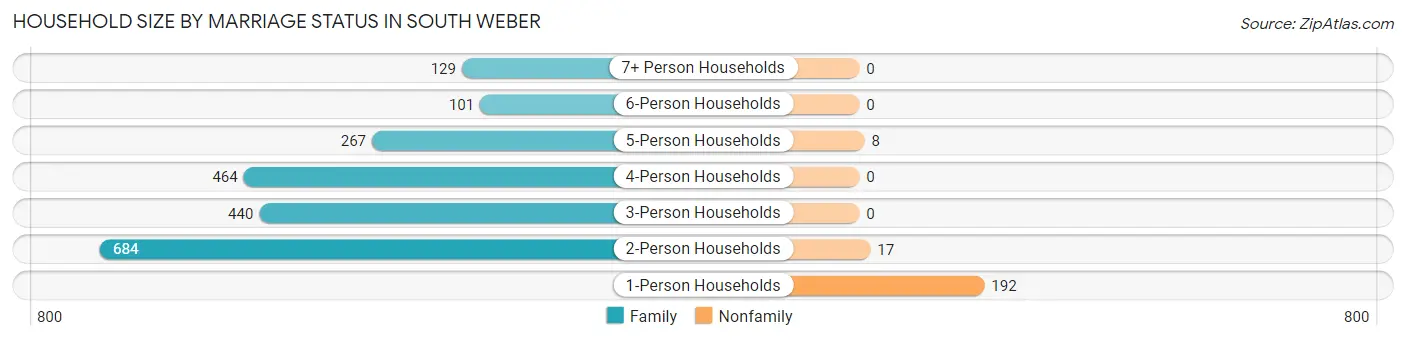
| Household Size | Family Households | Nonfamily Households |
| 1-Person Households | - | 192 (8.3%) |
| 2-Person Households | 684 (29.7%) | 17 (0.7%) |
| 3-Person Households | 440 (19.1%) | 0 (0.0%) |
| 4-Person Households | 464 (20.2%) | 0 (0.0%) |
| 5-Person Households | 267 (11.6%) | 8 (0.4%) |
| 6-Person Households | 101 (4.4%) | 0 (0.0%) |
| 7+ Person Households | 129 (5.6%) | 0 (0.0%) |
| Total | 2,085 (90.6%) | 217 (9.4%) |
Female Fertility in South Weber
Fertility by Age in South Weber
Average fertility rate in South Weber is 56.0 births per 1,000 women. Women in the age bracket of 35 to 50 years have the highest fertility rate with 82.0 births per 1,000 women. Women in the age bracket of 35 to 50 years acount for 77.8% of all women with births.
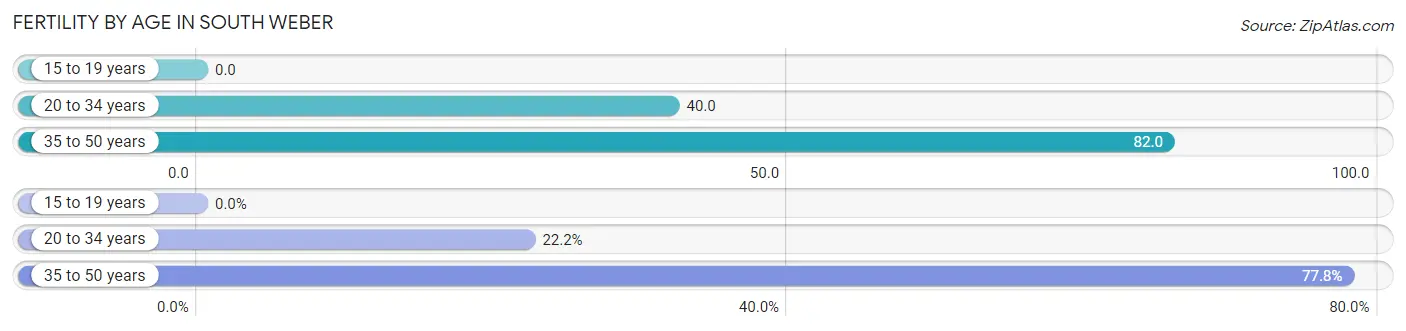
| Age Bracket | Women with Births | Births / 1,000 Women |
| 15 to 19 years | 0 (0.0%) | 0.0 |
| 20 to 34 years | 24 (22.2%) | 40.0 |
| 35 to 50 years | 84 (77.8%) | 82.0 |
| Total | 108 (100.0%) | 56.0 |
Fertility by Age by Marriage Status in South Weber
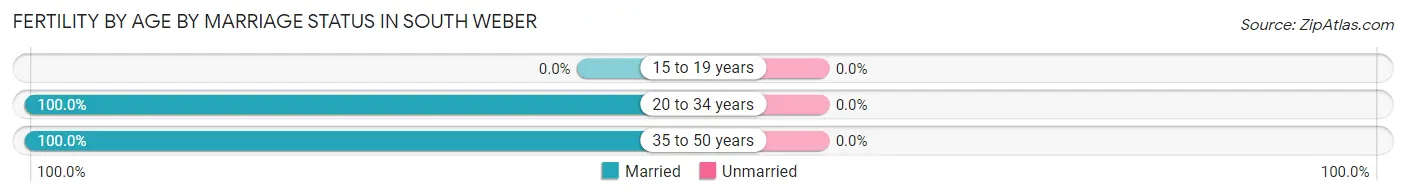
| Age Bracket | Married | Unmarried |
| 15 to 19 years | 0 (0.0%) | 0 (0.0%) |
| 20 to 34 years | 24 (100.0%) | 0 (0.0%) |
| 35 to 50 years | 84 (100.0%) | 0 (0.0%) |
| Total | 108 (100.0%) | 0 (0.0%) |
Fertility by Education in South Weber
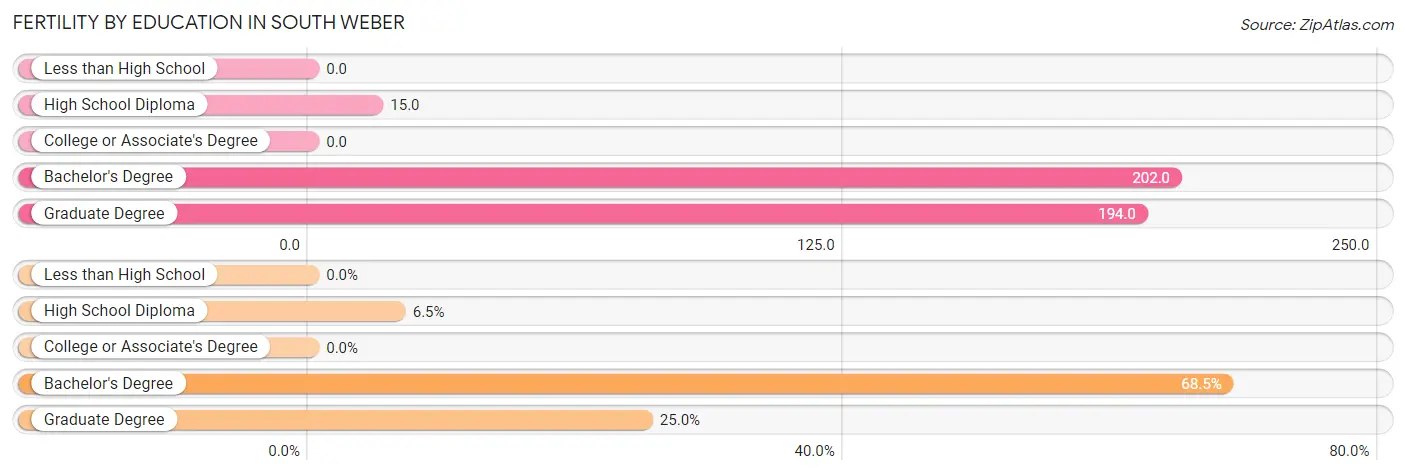
| Educational Attainment | Women with Births | Births / 1,000 Women |
| Less than High School | 0 (0.0%) | 0.0 |
| High School Diploma | 7 (6.5%) | 15.0 |
| College or Associate's Degree | 0 (0.0%) | 0.0 |
| Bachelor's Degree | 74 (68.5%) | 202.0 |
| Graduate Degree | 27 (25.0%) | 194.0 |
| Total | 108 (100.0%) | 56.0 |
Fertility by Education by Marriage Status in South Weber
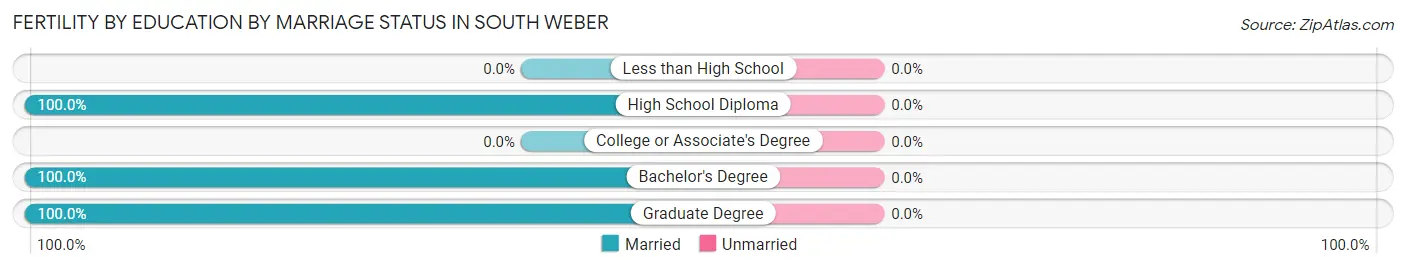
| Educational Attainment | Married | Unmarried |
| Less than High School | 0 (0.0%) | 0 (0.0%) |
| High School Diploma | 7 (100.0%) | 0 (0.0%) |
| College or Associate's Degree | 0 (0.0%) | 0 (0.0%) |
| Bachelor's Degree | 74 (100.0%) | 0 (0.0%) |
| Graduate Degree | 27 (100.0%) | 0 (0.0%) |
| Total | 108 (100.0%) | 0 (0.0%) |
Employment Characteristics in South Weber
Employment by Class of Employer in South Weber
Among the 4,054 employed individuals in South Weber, private company employees (2,579 | 63.6%), local government employees (373 | 9.2%), and federal government employees (370 | 9.1%) make up the most common classes of employment.
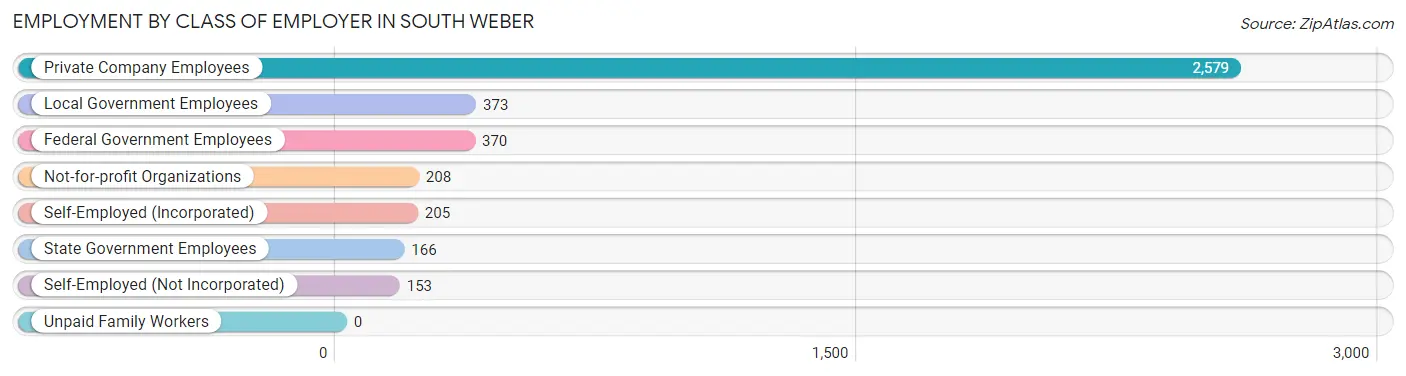
| Employer Class | # Employees | % Employees |
| Private Company Employees | 2,579 | 63.6% |
| Self-Employed (Incorporated) | 205 | 5.1% |
| Self-Employed (Not Incorporated) | 153 | 3.8% |
| Not-for-profit Organizations | 208 | 5.1% |
| Local Government Employees | 373 | 9.2% |
| State Government Employees | 166 | 4.1% |
| Federal Government Employees | 370 | 9.1% |
| Unpaid Family Workers | 0 | 0.0% |
| Total | 4,054 | 100.0% |
Employment Status by Age in South Weber
According to the labor force statistics for South Weber, out of the total population over 16 years of age (5,849), 71.6% or 4,188 individuals are in the labor force, with 2.7% or 113 of them unemployed. The age group with the highest labor force participation rate is 45 to 54 years, with 97.7% or 1,175 individuals in the labor force. Within the labor force, the 20 to 24 years age range has the highest percentage of unemployed individuals, with 13.8% or 36 of them being unemployed.
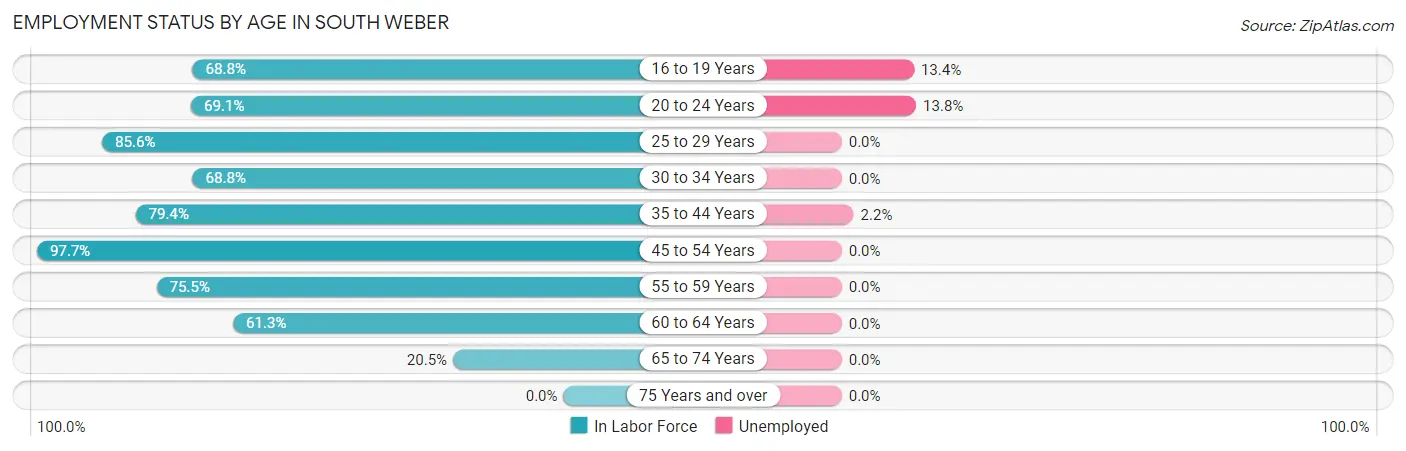
| Age Bracket | In Labor Force | Unemployed |
| 16 to 19 Years | 425 (68.8%) | 57 (13.4%) |
| 20 to 24 Years | 260 (69.1%) | 36 (13.8%) |
| 25 to 29 Years | 423 (85.6%) | 0 (0.0%) |
| 30 to 34 Years | 280 (68.8%) | 0 (0.0%) |
| 35 to 44 Years | 911 (79.4%) | 20 (2.2%) |
| 45 to 54 Years | 1,175 (97.7%) | 0 (0.0%) |
| 55 to 59 Years | 366 (75.5%) | 0 (0.0%) |
| 60 to 64 Years | 238 (61.3%) | 0 (0.0%) |
| 65 to 74 Years | 108 (20.5%) | 0 (0.0%) |
| 75 Years and over | 0 (0.0%) | 0 (0.0%) |
| Total | 4,188 (71.6%) | 113 (2.7%) |
Employment Status by Educational Attainment in South Weber
According to labor force statistics for South Weber, 82.3% of individuals (3,394) out of the total population between 25 and 64 years of age (4,124) are in the labor force, with 0.6% or 20 of them being unemployed. The group with the highest labor force participation rate are those with the educational attainment of high school diploma, with 91.6% or 839 individuals in the labor force. Within the labor force, individuals with college / associate degree education have the highest percentage of unemployment, with 1.0% or 10 of them being unemployed.
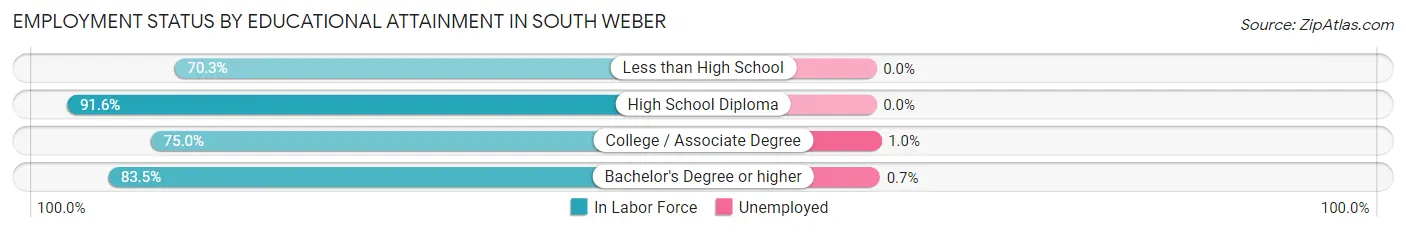
| Educational Attainment | In Labor Force | Unemployed |
| Less than High School | 52 (70.3%) | 0 (0.0%) |
| High School Diploma | 839 (91.6%) | 0 (0.0%) |
| College / Associate Degree | 1,007 (75.0%) | 13 (1.0%) |
| Bachelor's Degree or higher | 1,495 (83.5%) | 13 (0.7%) |
| Total | 3,394 (82.3%) | 25 (0.6%) |
Employment Occupations by Sex in South Weber
Management, Business, Science and Arts Occupations
The most common Management, Business, Science and Arts occupations in South Weber are Management (465 | 11.4%), Community & Social Service (417 | 10.2%), Business & Financial (362 | 8.9%), Computers, Engineering & Science (323 | 7.9%), and Education Instruction & Library (250 | 6.1%).
Management, Business, Science and Arts Occupations by Sex
Within the Management, Business, Science and Arts occupations in South Weber, the most male-oriented occupations are Life, Physical & Social Science (100.0%), Architecture & Engineering (89.5%), and Computers, Engineering & Science (89.2%), while the most female-oriented occupations are Health Diagnosing & Treating (65.4%), Health Technologists (64.6%), and Education Instruction & Library (64.4%).
| Occupation | Male | Female |
| Management | 281 (60.4%) | 184 (39.6%) |
| Business & Financial | 289 (79.8%) | 73 (20.2%) |
| Computers, Engineering & Science | 288 (89.2%) | 35 (10.8%) |
| Computers & Mathematics | 151 (88.3%) | 20 (11.7%) |
| Architecture & Engineering | 128 (89.5%) | 15 (10.5%) |
| Life, Physical & Social Science | 9 (100.0%) | 0 (0.0%) |
| Community & Social Service | 173 (41.5%) | 244 (58.5%) |
| Education, Arts & Media | 10 (71.4%) | 4 (28.6%) |
| Legal Services & Support | 9 (52.9%) | 8 (47.1%) |
| Education Instruction & Library | 89 (35.6%) | 161 (64.4%) |
| Arts, Media & Entertainment | 65 (47.8%) | 71 (52.2%) |
| Health Diagnosing & Treating | 84 (34.6%) | 159 (65.4%) |
| Health Technologists | 75 (35.4%) | 137 (64.6%) |
| Total (Category) | 1,115 (61.6%) | 695 (38.4%) |
| Total (Overall) | 2,261 (55.5%) | 1,812 (44.5%) |
Services Occupations
The most common Services occupations in South Weber are Cleaning & Maintenance (170 | 4.2%), Food Preparation & Serving (142 | 3.5%), Personal Care & Service (95 | 2.3%), Healthcare Support (69 | 1.7%), and Security & Protection (22 | 0.5%).
Services Occupations by Sex
Within the Services occupations in South Weber, the most male-oriented occupations are Security & Protection (100.0%), Firefighting & Prevention (100.0%), and Law Enforcement (100.0%), while the most female-oriented occupations are Personal Care & Service (89.5%), Healthcare Support (66.7%), and Food Preparation & Serving (63.4%).
| Occupation | Male | Female |
| Healthcare Support | 23 (33.3%) | 46 (66.7%) |
| Security & Protection | 22 (100.0%) | 0 (0.0%) |
| Firefighting & Prevention | 15 (100.0%) | 0 (0.0%) |
| Law Enforcement | 7 (100.0%) | 0 (0.0%) |
| Food Preparation & Serving | 52 (36.6%) | 90 (63.4%) |
| Cleaning & Maintenance | 170 (100.0%) | 0 (0.0%) |
| Personal Care & Service | 10 (10.5%) | 85 (89.5%) |
| Total (Category) | 277 (55.6%) | 221 (44.4%) |
| Total (Overall) | 2,261 (55.5%) | 1,812 (44.5%) |
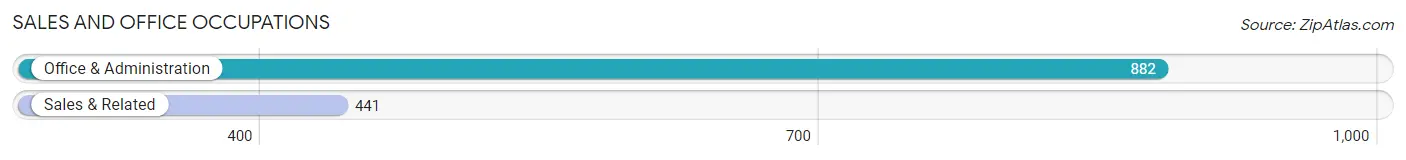
Sales and Office Occupations
The most common Sales and Office occupations in South Weber are Office & Administration (882 | 21.6%), and Sales & Related (441 | 10.8%).
Sales and Office Occupations by Sex
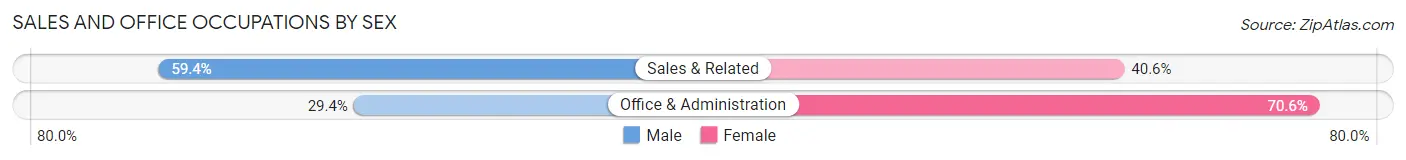
| Occupation | Male | Female |
| Sales & Related | 262 (59.4%) | 179 (40.6%) |
| Office & Administration | 259 (29.4%) | 623 (70.6%) |
| Total (Category) | 521 (39.4%) | 802 (60.6%) |
| Total (Overall) | 2,261 (55.5%) | 1,812 (44.5%) |
Natural Resources, Construction and Maintenance Occupations
The most common Natural Resources, Construction and Maintenance occupations in South Weber are Construction & Extraction (111 | 2.7%), and Installation, Maintenance & Repair (68 | 1.7%).
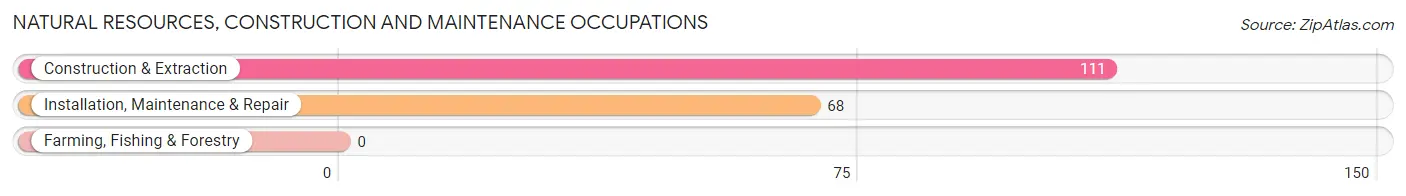
Natural Resources, Construction and Maintenance Occupations by Sex
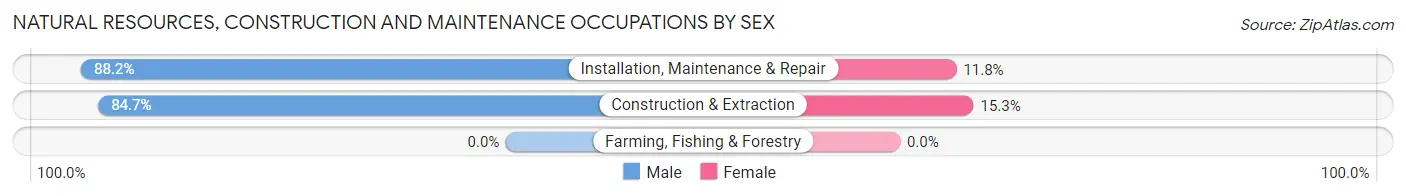
| Occupation | Male | Female |
| Farming, Fishing & Forestry | 0 (0.0%) | 0 (0.0%) |
| Construction & Extraction | 94 (84.7%) | 17 (15.3%) |
| Installation, Maintenance & Repair | 60 (88.2%) | 8 (11.8%) |
| Total (Category) | 154 (86.0%) | 25 (14.0%) |
| Total (Overall) | 2,261 (55.5%) | 1,812 (44.5%) |
Production, Transportation and Moving Occupations
The most common Production, Transportation and Moving occupations in South Weber are Production (144 | 3.5%), Transportation (71 | 1.7%), and Material Moving (48 | 1.2%).
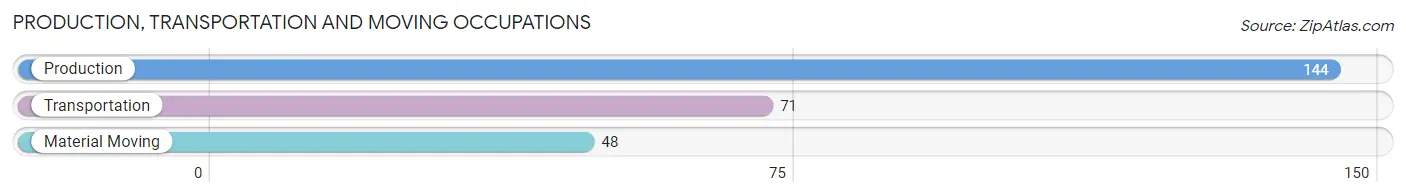
Production, Transportation and Moving Occupations by Sex
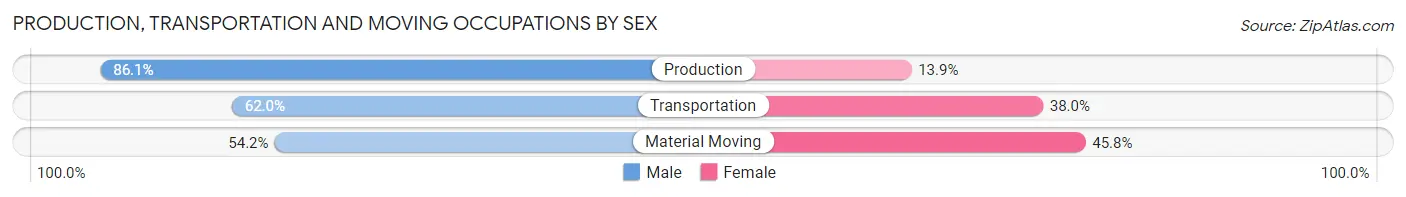
| Occupation | Male | Female |
| Production | 124 (86.1%) | 20 (13.9%) |
| Transportation | 44 (62.0%) | 27 (38.0%) |
| Material Moving | 26 (54.2%) | 22 (45.8%) |
| Total (Category) | 194 (73.8%) | 69 (26.2%) |
| Total (Overall) | 2,261 (55.5%) | 1,812 (44.5%) |
Employment Industries by Sex in South Weber
Employment Industries in South Weber
The major employment industries in South Weber include Health Care & Social Assistance (481 | 11.8%), Retail Trade (450 | 11.1%), Construction (438 | 10.7%), Public Administration (430 | 10.6%), and Educational Services (423 | 10.4%).
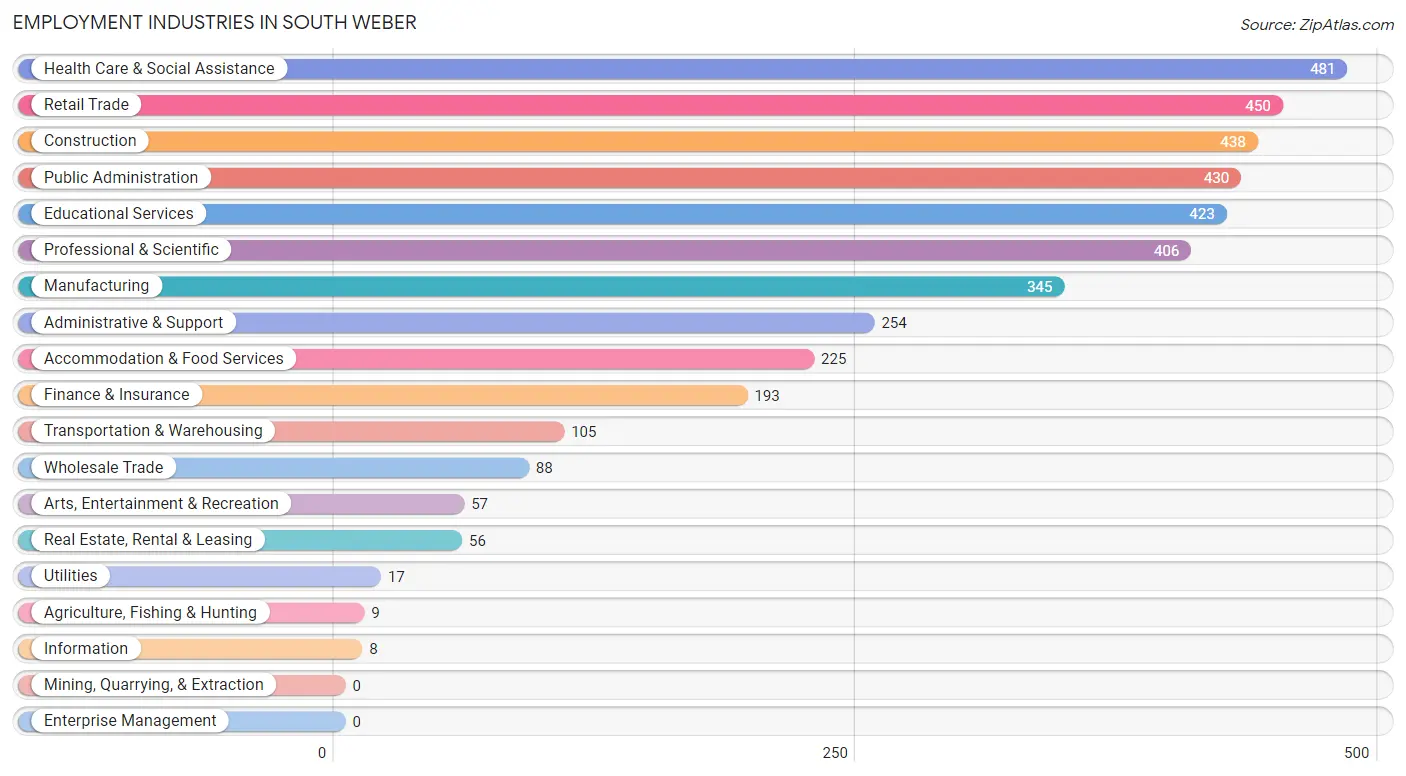
Employment Industries by Sex in South Weber
The South Weber industries that see more men than women are Agriculture, Fishing & Hunting (100.0%), Utilities (100.0%), and Wholesale Trade (89.8%), whereas the industries that tend to have a higher number of women are Information (100.0%), Health Care & Social Assistance (71.7%), and Educational Services (69.0%).
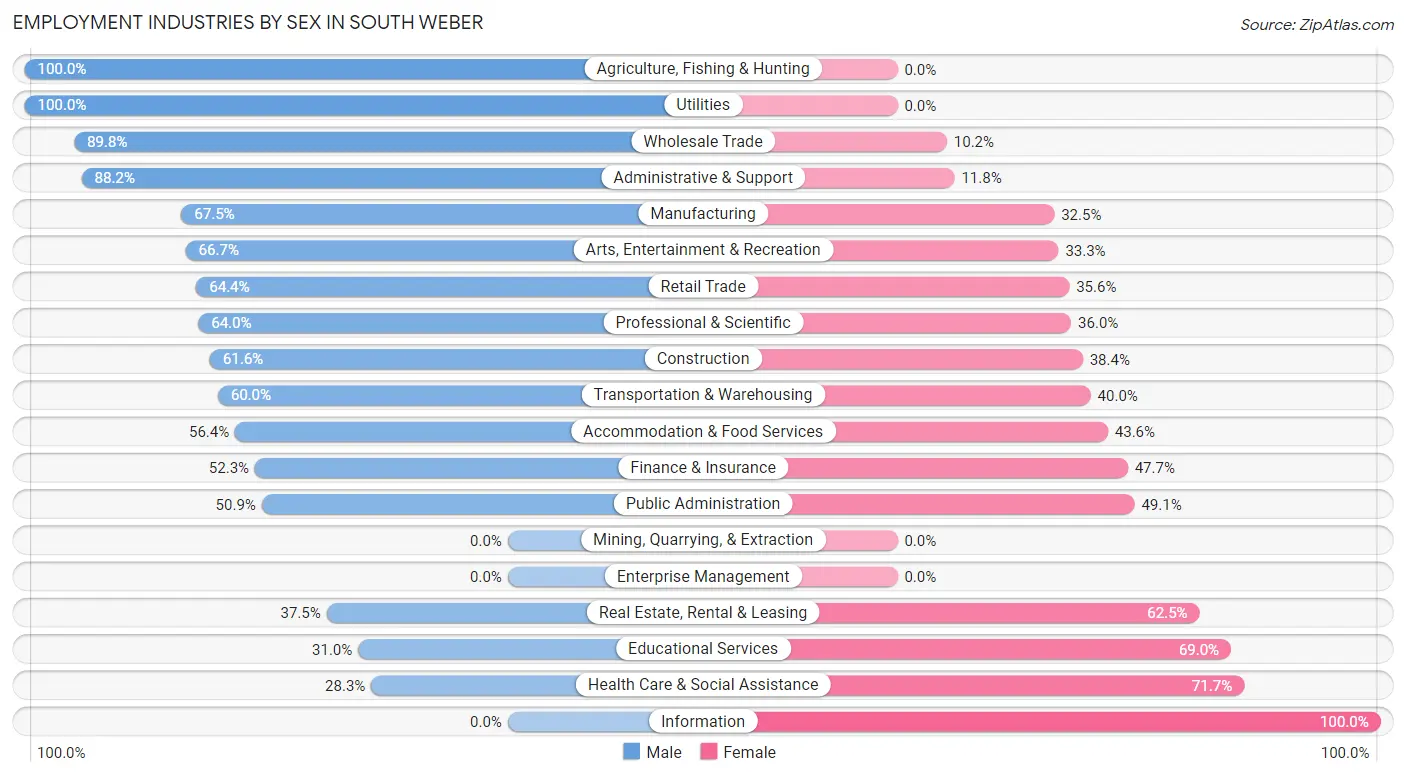
| Industry | Male | Female |
| Agriculture, Fishing & Hunting | 9 (100.0%) | 0 (0.0%) |
| Mining, Quarrying, & Extraction | 0 (0.0%) | 0 (0.0%) |
| Construction | 270 (61.6%) | 168 (38.4%) |
| Manufacturing | 233 (67.5%) | 112 (32.5%) |
| Wholesale Trade | 79 (89.8%) | 9 (10.2%) |
| Retail Trade | 290 (64.4%) | 160 (35.6%) |
| Transportation & Warehousing | 63 (60.0%) | 42 (40.0%) |
| Utilities | 17 (100.0%) | 0 (0.0%) |
| Information | 0 (0.0%) | 8 (100.0%) |
| Finance & Insurance | 101 (52.3%) | 92 (47.7%) |
| Real Estate, Rental & Leasing | 21 (37.5%) | 35 (62.5%) |
| Professional & Scientific | 260 (64.0%) | 146 (36.0%) |
| Enterprise Management | 0 (0.0%) | 0 (0.0%) |
| Administrative & Support | 224 (88.2%) | 30 (11.8%) |
| Educational Services | 131 (31.0%) | 292 (69.0%) |
| Health Care & Social Assistance | 136 (28.3%) | 345 (71.7%) |
| Arts, Entertainment & Recreation | 38 (66.7%) | 19 (33.3%) |
| Accommodation & Food Services | 127 (56.4%) | 98 (43.6%) |
| Public Administration | 219 (50.9%) | 211 (49.1%) |
| Total | 2,261 (55.5%) | 1,812 (44.5%) |
Education in South Weber
School Enrollment in South Weber
The most common levels of schooling among the 2,249 students in South Weber are middle school (612 | 27.2%), high school (501 | 22.3%), and elementary school (404 | 18.0%).
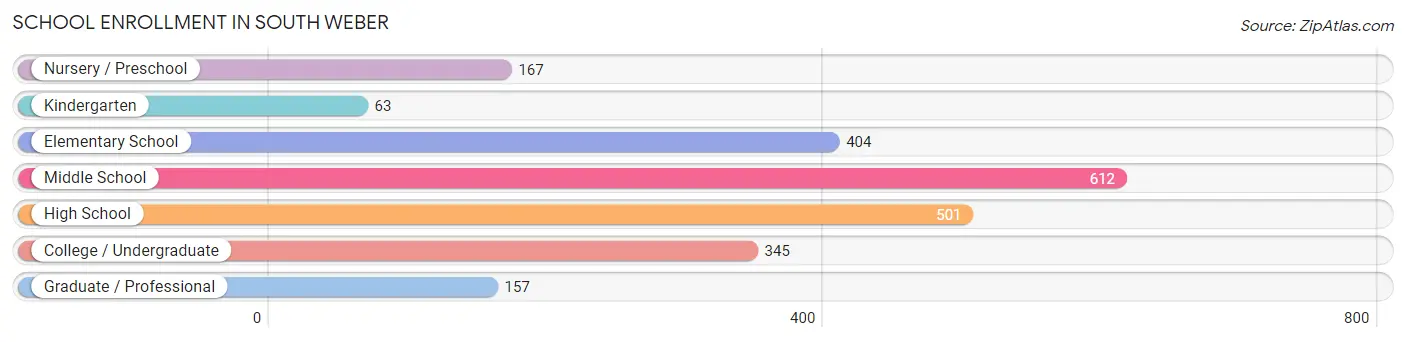
| School Level | # Students | % Students |
| Nursery / Preschool | 167 | 7.4% |
| Kindergarten | 63 | 2.8% |
| Elementary School | 404 | 18.0% |
| Middle School | 612 | 27.2% |
| High School | 501 | 22.3% |
| College / Undergraduate | 345 | 15.3% |
| Graduate / Professional | 157 | 7.0% |
| Total | 2,249 | 100.0% |
School Enrollment by Age by Funding Source in South Weber
Out of a total of 2,249 students who are enrolled in schools in South Weber, 243 (10.8%) attend a private institution, while the remaining 2,006 (89.2%) are enrolled in public schools. The age group of 3 to 4 year olds has the highest likelihood of being enrolled in private schools, with 99 (70.7% in the age bracket) enrolled. Conversely, the age group of 18 to 19 year olds has the lowest likelihood of being enrolled in a private school, with 124 (100.0% in the age bracket) attending a public institution.
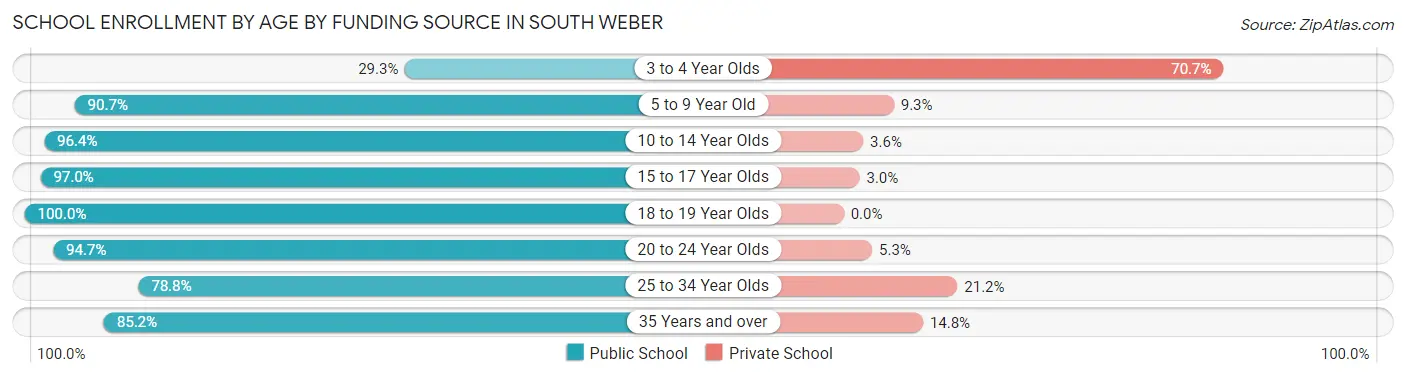
| Age Bracket | Public School | Private School |
| 3 to 4 Year Olds | 41 (29.3%) | 99 (70.7%) |
| 5 to 9 Year Old | 379 (90.7%) | 39 (9.3%) |
| 10 to 14 Year Olds | 691 (96.4%) | 26 (3.6%) |
| 15 to 17 Year Olds | 361 (97.0%) | 11 (3.0%) |
| 18 to 19 Year Olds | 124 (100.0%) | 0 (0.0%) |
| 20 to 24 Year Olds | 125 (94.7%) | 7 (5.3%) |
| 25 to 34 Year Olds | 134 (78.8%) | 36 (21.2%) |
| 35 Years and over | 150 (85.2%) | 26 (14.8%) |
| Total | 2,006 (89.2%) | 243 (10.8%) |
Educational Attainment by Field of Study in South Weber
Business (447 | 21.6%), education (352 | 17.0%), arts & humanities (250 | 12.1%), science & technology (236 | 11.4%), and bio, nature & agricultural (126 | 6.1%) are the most common fields of study among 2,073 individuals in South Weber who have obtained a bachelor's degree or higher.
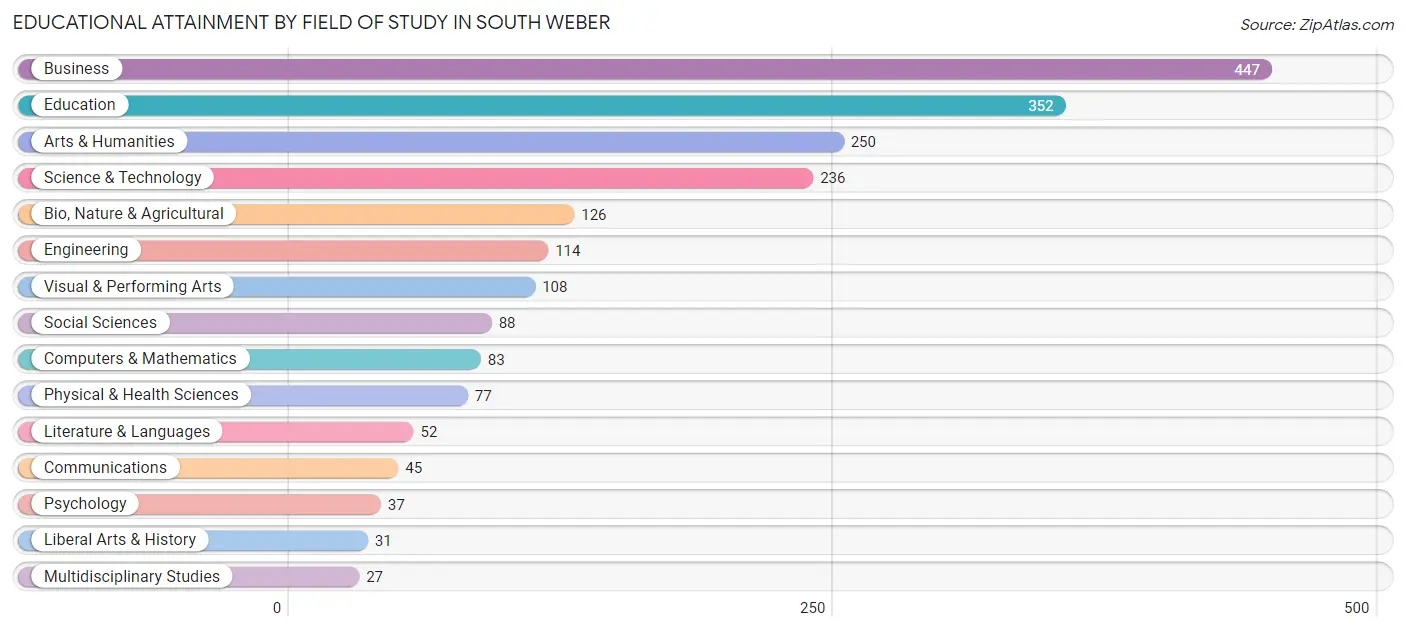
| Field of Study | # Graduates | % Graduates |
| Computers & Mathematics | 83 | 4.0% |
| Bio, Nature & Agricultural | 126 | 6.1% |
| Physical & Health Sciences | 77 | 3.7% |
| Psychology | 37 | 1.8% |
| Social Sciences | 88 | 4.3% |
| Engineering | 114 | 5.5% |
| Multidisciplinary Studies | 27 | 1.3% |
| Science & Technology | 236 | 11.4% |
| Business | 447 | 21.6% |
| Education | 352 | 17.0% |
| Literature & Languages | 52 | 2.5% |
| Liberal Arts & History | 31 | 1.5% |
| Visual & Performing Arts | 108 | 5.2% |
| Communications | 45 | 2.2% |
| Arts & Humanities | 250 | 12.1% |
| Total | 2,073 | 100.0% |
Transportation & Commute in South Weber
Vehicle Availability by Sex in South Weber
The most prevalent vehicle ownership categories in South Weber are males with 2 vehicles (746, accounting for 33.3%) and females with 2 vehicles (596, making up 41.2%).
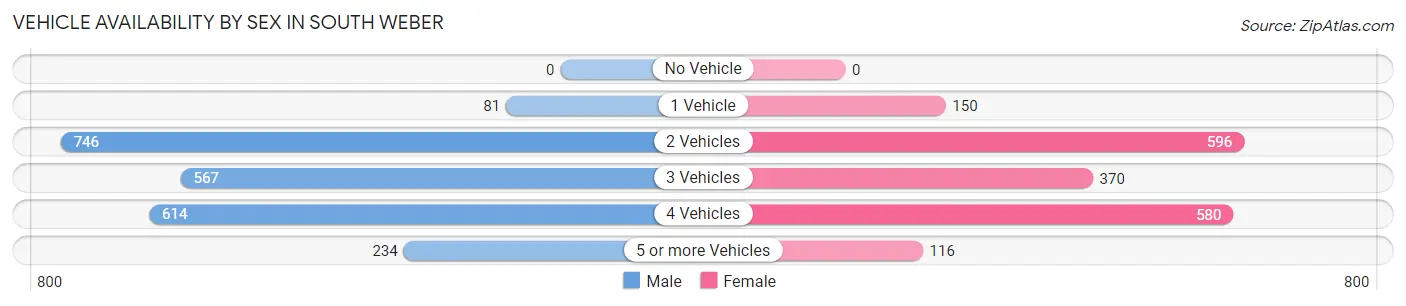
| Vehicles Available | Male | Female |
| No Vehicle | 0 (0.0%) | 0 (0.0%) |
| 1 Vehicle | 81 (3.6%) | 150 (8.3%) |
| 2 Vehicles | 746 (33.3%) | 596 (32.9%) |
| 3 Vehicles | 567 (25.3%) | 370 (20.4%) |
| 4 Vehicles | 614 (27.4%) | 580 (32.0%) |
| 5 or more Vehicles | 234 (10.4%) | 116 (6.4%) |
| Total | 2,242 (100.0%) | 1,812 (100.0%) |
Commute Time in South Weber
The most frequently occuring commute durations in South Weber are 15 to 19 minutes (759 commuters, 21.7%), 10 to 14 minutes (499 commuters, 14.3%), and 45 to 59 minutes (453 commuters, 13.0%).
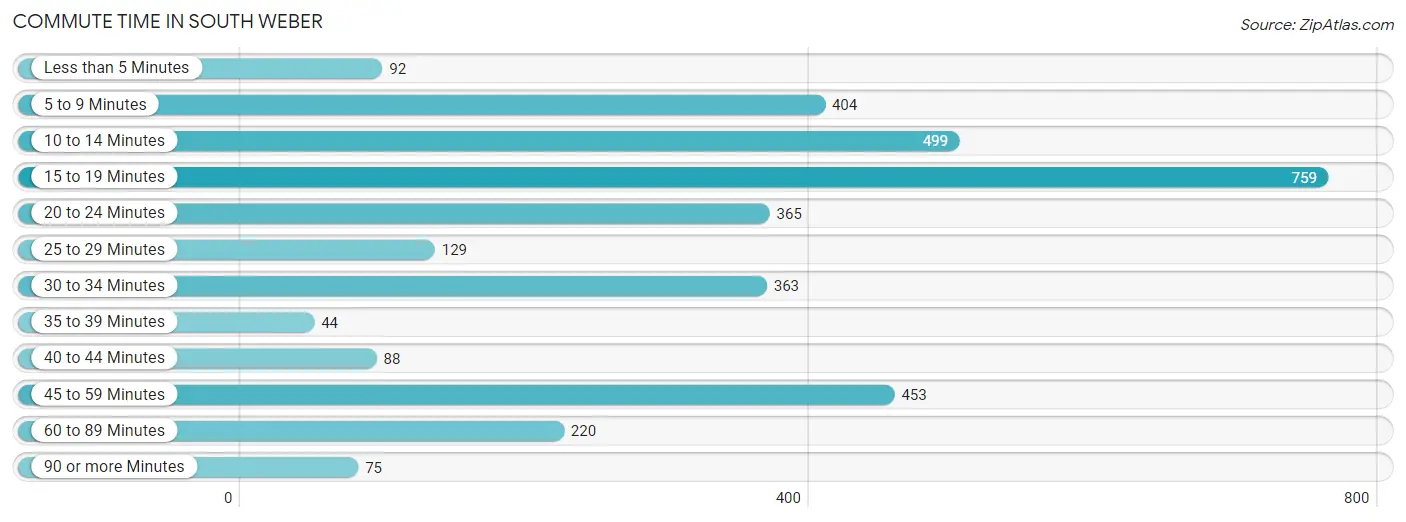
| Commute Time | # Commuters | % Commuters |
| Less than 5 Minutes | 92 | 2.6% |
| 5 to 9 Minutes | 404 | 11.6% |
| 10 to 14 Minutes | 499 | 14.3% |
| 15 to 19 Minutes | 759 | 21.7% |
| 20 to 24 Minutes | 365 | 10.5% |
| 25 to 29 Minutes | 129 | 3.7% |
| 30 to 34 Minutes | 363 | 10.4% |
| 35 to 39 Minutes | 44 | 1.3% |
| 40 to 44 Minutes | 88 | 2.5% |
| 45 to 59 Minutes | 453 | 13.0% |
| 60 to 89 Minutes | 220 | 6.3% |
| 90 or more Minutes | 75 | 2.1% |
Commute Time by Sex in South Weber
The most common commute times in South Weber are 15 to 19 minutes (478 commuters, 24.7%) for males and 15 to 19 minutes (281 commuters, 18.1%) for females.
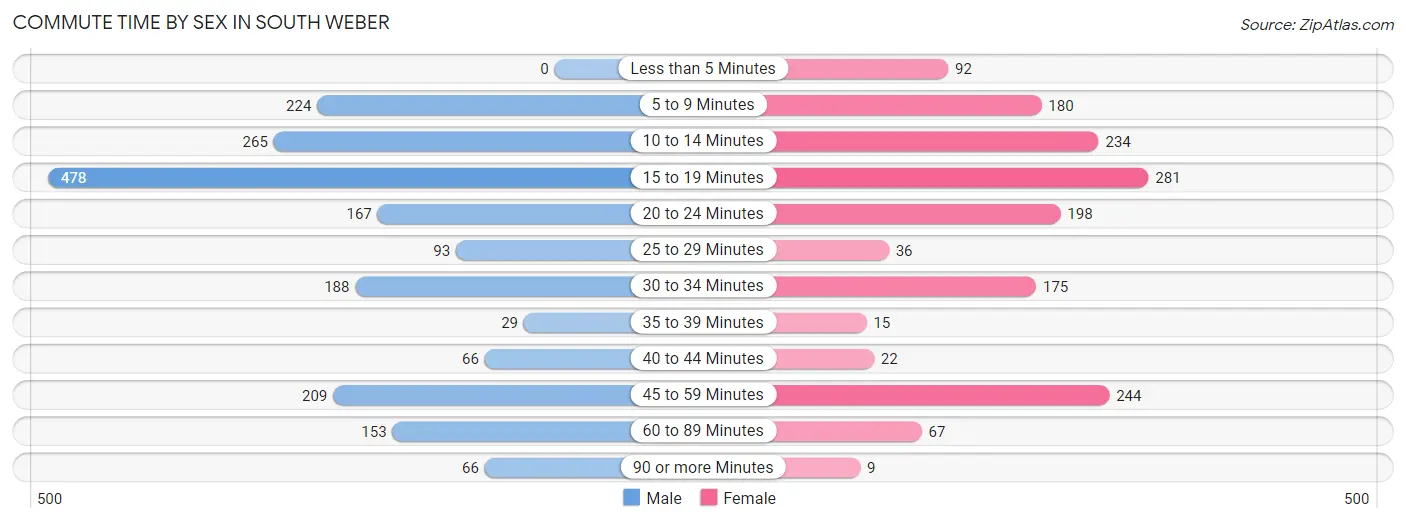
| Commute Time | Male | Female |
| Less than 5 Minutes | 0 (0.0%) | 92 (5.9%) |
| 5 to 9 Minutes | 224 (11.6%) | 180 (11.6%) |
| 10 to 14 Minutes | 265 (13.7%) | 234 (15.1%) |
| 15 to 19 Minutes | 478 (24.7%) | 281 (18.1%) |
| 20 to 24 Minutes | 167 (8.6%) | 198 (12.8%) |
| 25 to 29 Minutes | 93 (4.8%) | 36 (2.3%) |
| 30 to 34 Minutes | 188 (9.7%) | 175 (11.3%) |
| 35 to 39 Minutes | 29 (1.5%) | 15 (1.0%) |
| 40 to 44 Minutes | 66 (3.4%) | 22 (1.4%) |
| 45 to 59 Minutes | 209 (10.8%) | 244 (15.7%) |
| 60 to 89 Minutes | 153 (7.9%) | 67 (4.3%) |
| 90 or more Minutes | 66 (3.4%) | 9 (0.6%) |
Time of Departure to Work by Sex in South Weber
The most frequent times of departure to work in South Weber are 7:00 AM to 7:29 AM (392, 20.2%) for males and 8:00 AM to 8:29 AM (251, 16.2%) for females.
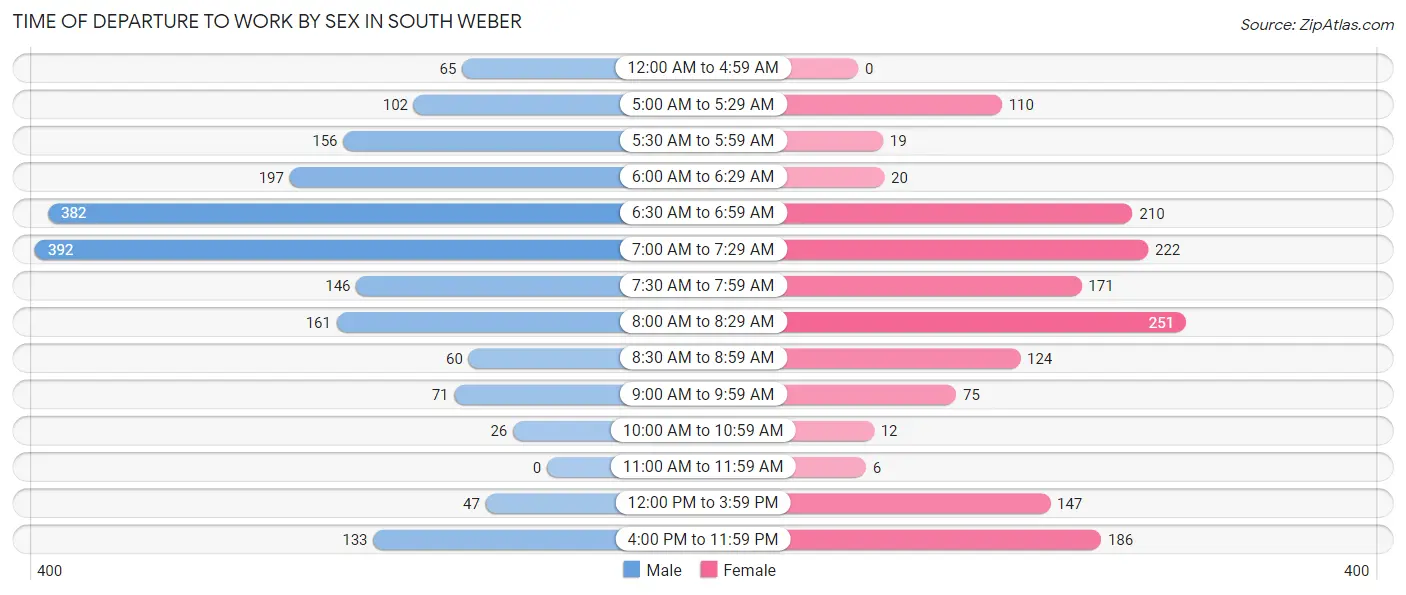
| Time of Departure | Male | Female |
| 12:00 AM to 4:59 AM | 65 (3.4%) | 0 (0.0%) |
| 5:00 AM to 5:29 AM | 102 (5.3%) | 110 (7.1%) |
| 5:30 AM to 5:59 AM | 156 (8.1%) | 19 (1.2%) |
| 6:00 AM to 6:29 AM | 197 (10.2%) | 20 (1.3%) |
| 6:30 AM to 6:59 AM | 382 (19.7%) | 210 (13.5%) |
| 7:00 AM to 7:29 AM | 392 (20.2%) | 222 (14.3%) |
| 7:30 AM to 7:59 AM | 146 (7.5%) | 171 (11.0%) |
| 8:00 AM to 8:29 AM | 161 (8.3%) | 251 (16.2%) |
| 8:30 AM to 8:59 AM | 60 (3.1%) | 124 (8.0%) |
| 9:00 AM to 9:59 AM | 71 (3.7%) | 75 (4.8%) |
| 10:00 AM to 10:59 AM | 26 (1.3%) | 12 (0.8%) |
| 11:00 AM to 11:59 AM | 0 (0.0%) | 6 (0.4%) |
| 12:00 PM to 3:59 PM | 47 (2.4%) | 147 (9.5%) |
| 4:00 PM to 11:59 PM | 133 (6.9%) | 186 (12.0%) |
| Total | 1,938 (100.0%) | 1,553 (100.0%) |
Housing Occupancy in South Weber
Occupancy by Ownership in South Weber
Of the total 2,302 dwellings in South Weber, owner-occupied units account for 2,191 (95.2%), while renter-occupied units make up 111 (4.8%).
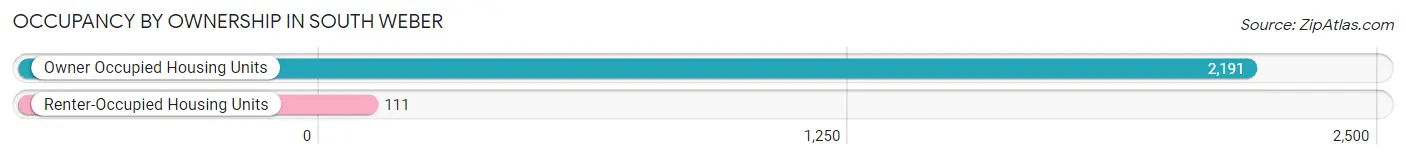
| Occupancy | # Housing Units | % Housing Units |
| Owner Occupied Housing Units | 2,191 | 95.2% |
| Renter-Occupied Housing Units | 111 | 4.8% |
| Total Occupied Housing Units | 2,302 | 100.0% |
Occupancy by Household Size in South Weber
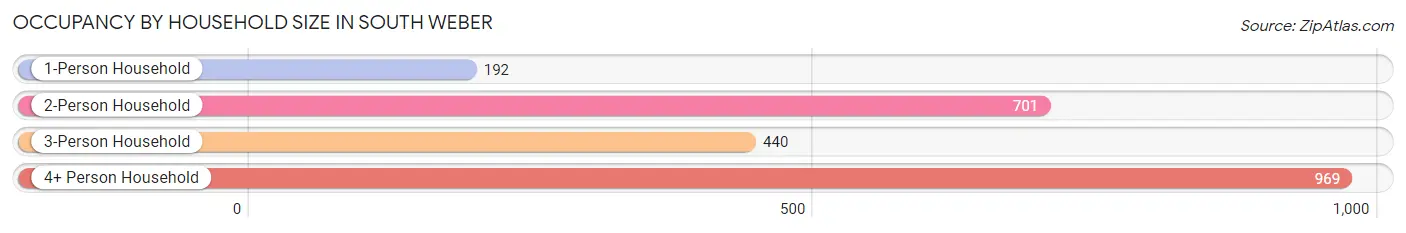
| Household Size | # Housing Units | % Housing Units |
| 1-Person Household | 192 | 8.3% |
| 2-Person Household | 701 | 30.4% |
| 3-Person Household | 440 | 19.1% |
| 4+ Person Household | 969 | 42.1% |
| Total Housing Units | 2,302 | 100.0% |
Occupancy by Ownership by Household Size in South Weber
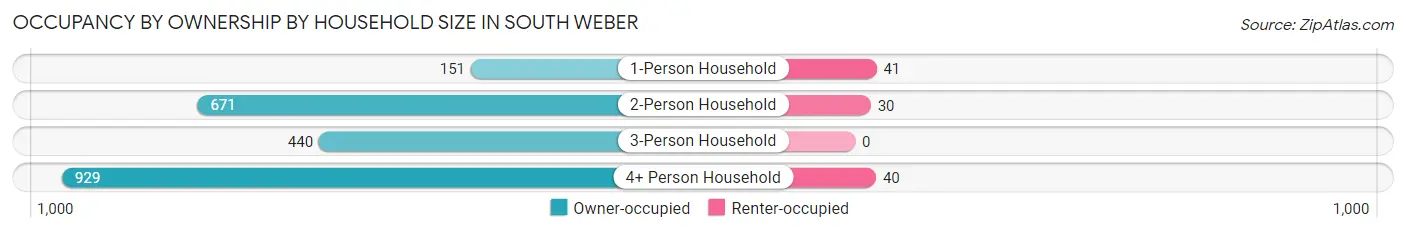
| Household Size | Owner-occupied | Renter-occupied |
| 1-Person Household | 151 (78.6%) | 41 (21.3%) |
| 2-Person Household | 671 (95.7%) | 30 (4.3%) |
| 3-Person Household | 440 (100.0%) | 0 (0.0%) |
| 4+ Person Household | 929 (95.9%) | 40 (4.1%) |
| Total Housing Units | 2,191 (95.2%) | 111 (4.8%) |
Occupancy by Educational Attainment in South Weber
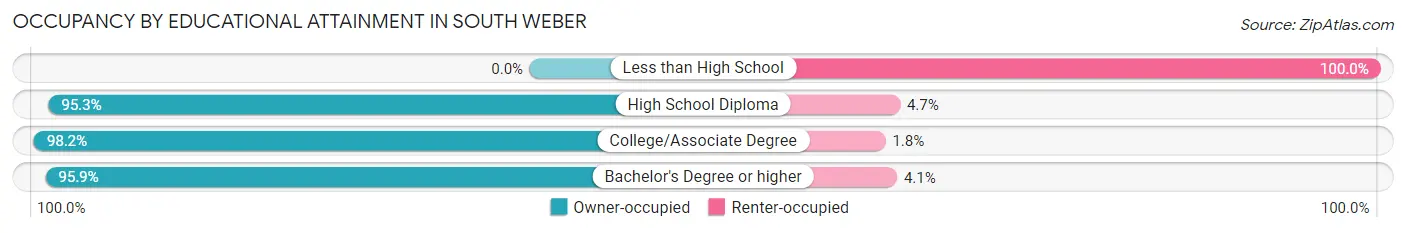
| Household Size | Owner-occupied | Renter-occupied |
| Less than High School | 0 (0.0%) | 33 (100.0%) |
| High School Diploma | 283 (95.3%) | 14 (4.7%) |
| College/Associate Degree | 745 (98.2%) | 14 (1.8%) |
| Bachelor's Degree or higher | 1,163 (95.9%) | 50 (4.1%) |
Occupancy by Age of Householder in South Weber
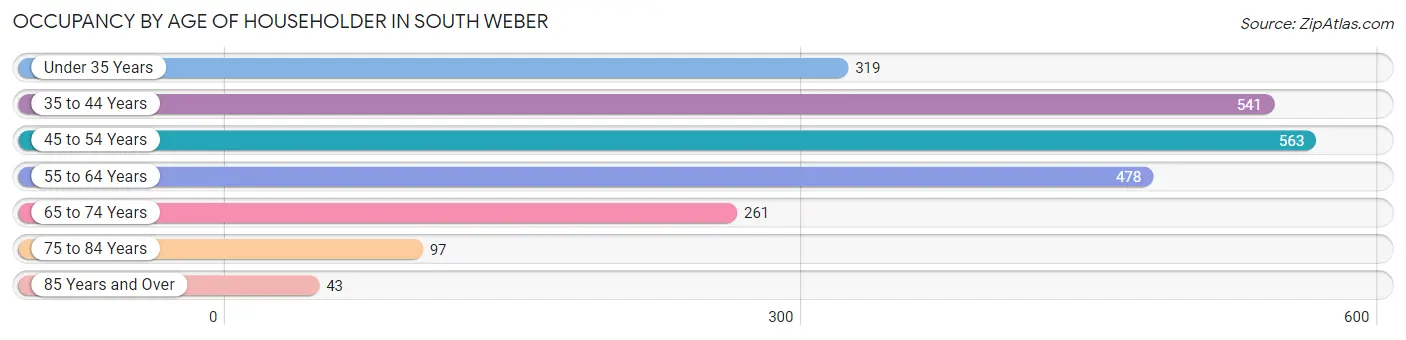
| Age Bracket | # Households | % Households |
| Under 35 Years | 319 | 13.9% |
| 35 to 44 Years | 541 | 23.5% |
| 45 to 54 Years | 563 | 24.5% |
| 55 to 64 Years | 478 | 20.8% |
| 65 to 74 Years | 261 | 11.3% |
| 75 to 84 Years | 97 | 4.2% |
| 85 Years and Over | 43 | 1.9% |
| Total | 2,302 | 100.0% |
Housing Finances in South Weber
Median Income by Occupancy in South Weber
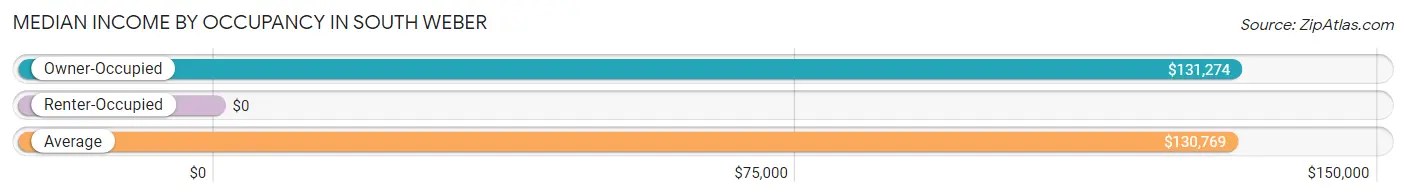
| Occupancy Type | # Households | Median Income |
| Owner-Occupied | 2,191 (95.2%) | $131,274 |
| Renter-Occupied | 111 (4.8%) | $0 |
| Average | 2,302 (100.0%) | $130,769 |
Occupancy by Householder Income Bracket in South Weber
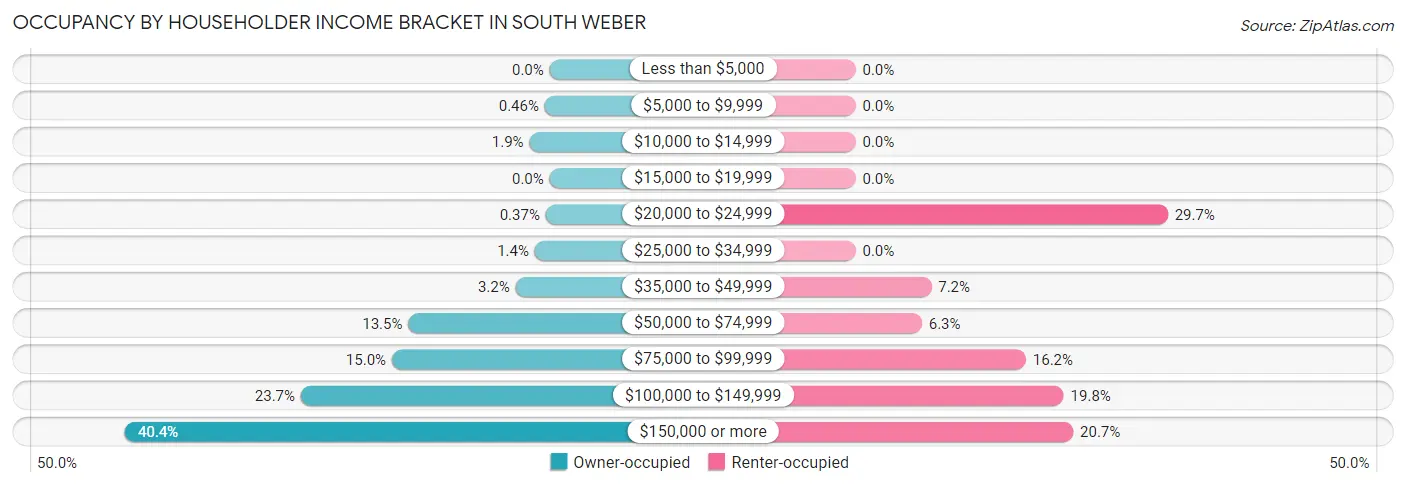
| Income Bracket | Owner-occupied | Renter-occupied |
| Less than $5,000 | 0 (0.0%) | 0 (0.0%) |
| $5,000 to $9,999 | 10 (0.5%) | 0 (0.0%) |
| $10,000 to $14,999 | 42 (1.9%) | 0 (0.0%) |
| $15,000 to $19,999 | 0 (0.0%) | 0 (0.0%) |
| $20,000 to $24,999 | 8 (0.4%) | 33 (29.7%) |
| $25,000 to $34,999 | 31 (1.4%) | 0 (0.0%) |
| $35,000 to $49,999 | 71 (3.2%) | 8 (7.2%) |
| $50,000 to $74,999 | 295 (13.5%) | 7 (6.3%) |
| $75,000 to $99,999 | 329 (15.0%) | 18 (16.2%) |
| $100,000 to $149,999 | 519 (23.7%) | 22 (19.8%) |
| $150,000 or more | 886 (40.4%) | 23 (20.7%) |
| Total | 2,191 (100.0%) | 111 (100.0%) |
Monthly Housing Cost Tiers in South Weber
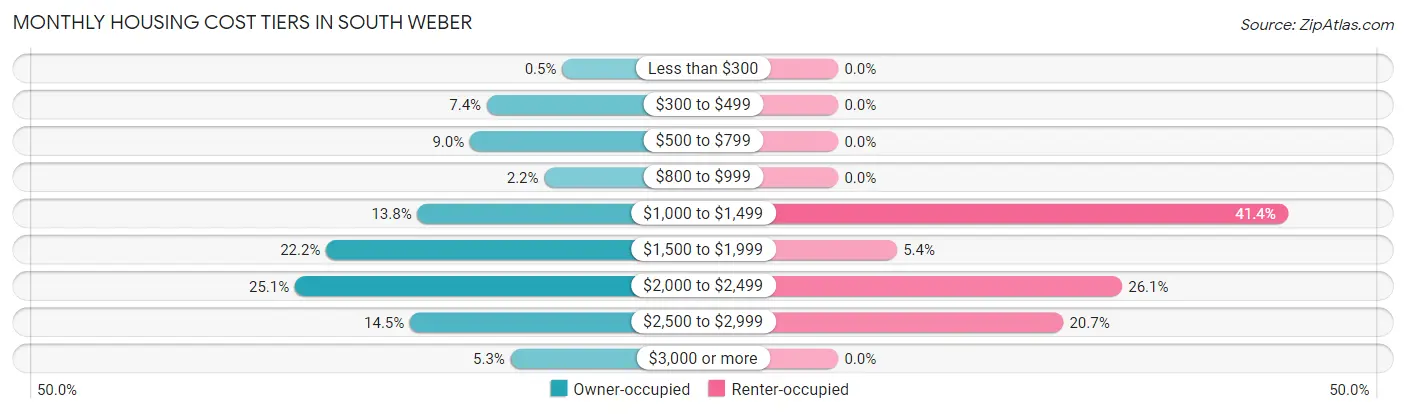
| Monthly Cost | Owner-occupied | Renter-occupied |
| Less than $300 | 11 (0.5%) | 0 (0.0%) |
| $300 to $499 | 163 (7.4%) | 0 (0.0%) |
| $500 to $799 | 197 (9.0%) | 0 (0.0%) |
| $800 to $999 | 47 (2.1%) | 0 (0.0%) |
| $1,000 to $1,499 | 303 (13.8%) | 46 (41.4%) |
| $1,500 to $1,999 | 487 (22.2%) | 6 (5.4%) |
| $2,000 to $2,499 | 550 (25.1%) | 29 (26.1%) |
| $2,500 to $2,999 | 318 (14.5%) | 23 (20.7%) |
| $3,000 or more | 115 (5.2%) | 0 (0.0%) |
| Total | 2,191 (100.0%) | 111 (100.0%) |
Physical Housing Characteristics in South Weber
Housing Structures in South Weber
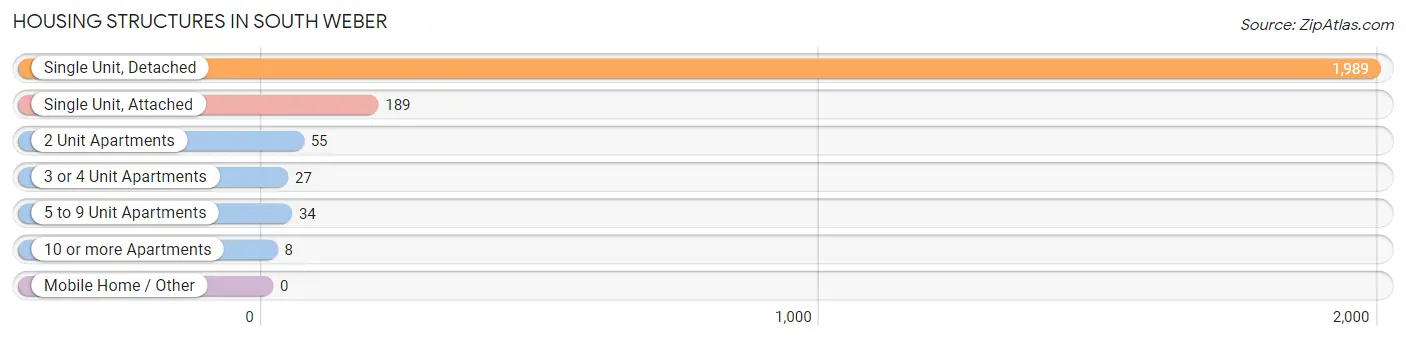
| Structure Type | # Housing Units | % Housing Units |
| Single Unit, Detached | 1,989 | 86.4% |
| Single Unit, Attached | 189 | 8.2% |
| 2 Unit Apartments | 55 | 2.4% |
| 3 or 4 Unit Apartments | 27 | 1.2% |
| 5 to 9 Unit Apartments | 34 | 1.5% |
| 10 or more Apartments | 8 | 0.4% |
| Mobile Home / Other | 0 | 0.0% |
| Total | 2,302 | 100.0% |
Housing Structures by Occupancy in South Weber
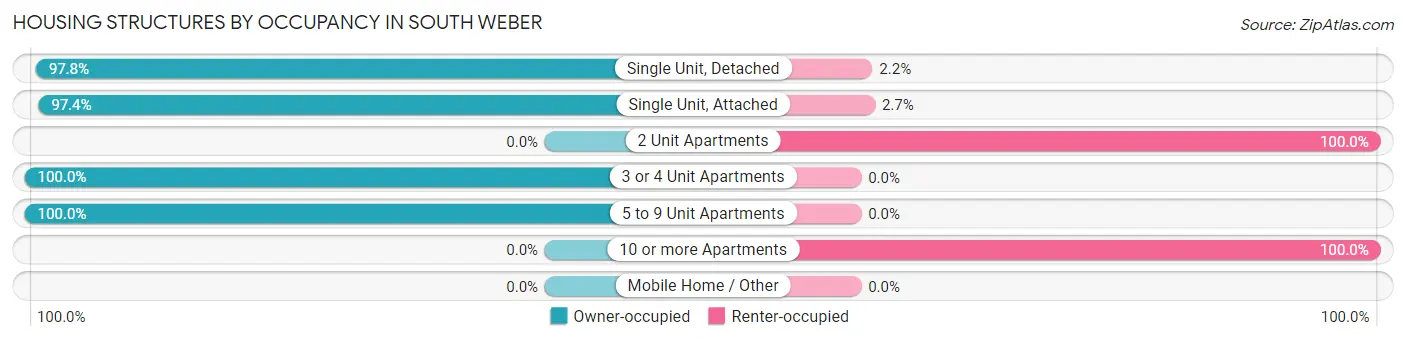
| Structure Type | Owner-occupied | Renter-occupied |
| Single Unit, Detached | 1,946 (97.8%) | 43 (2.2%) |
| Single Unit, Attached | 184 (97.4%) | 5 (2.6%) |
| 2 Unit Apartments | 0 (0.0%) | 55 (100.0%) |
| 3 or 4 Unit Apartments | 27 (100.0%) | 0 (0.0%) |
| 5 to 9 Unit Apartments | 34 (100.0%) | 0 (0.0%) |
| 10 or more Apartments | 0 (0.0%) | 8 (100.0%) |
| Mobile Home / Other | 0 (0.0%) | 0 (0.0%) |
| Total | 2,191 (95.2%) | 111 (4.8%) |
Housing Structures by Number of Rooms in South Weber
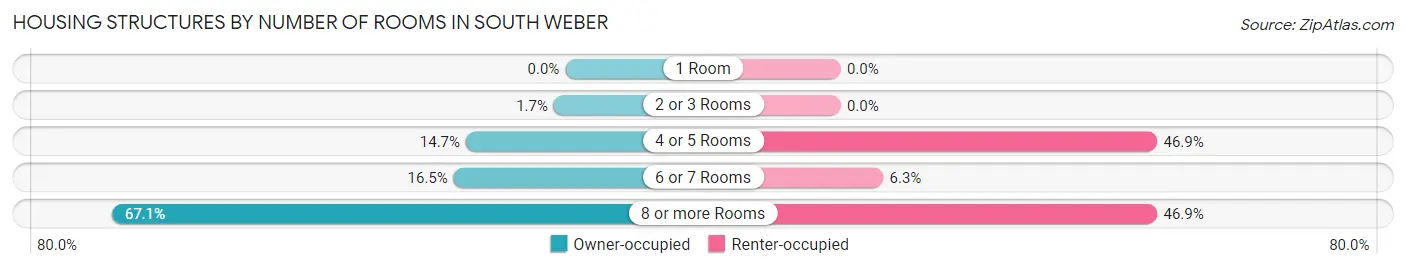
| Number of Rooms | Owner-occupied | Renter-occupied |
| 1 Room | 0 (0.0%) | 0 (0.0%) |
| 2 or 3 Rooms | 37 (1.7%) | 0 (0.0%) |
| 4 or 5 Rooms | 322 (14.7%) | 52 (46.9%) |
| 6 or 7 Rooms | 362 (16.5%) | 7 (6.3%) |
| 8 or more Rooms | 1,470 (67.1%) | 52 (46.9%) |
| Total | 2,191 (100.0%) | 111 (100.0%) |
Housing Structure by Heating Type in South Weber
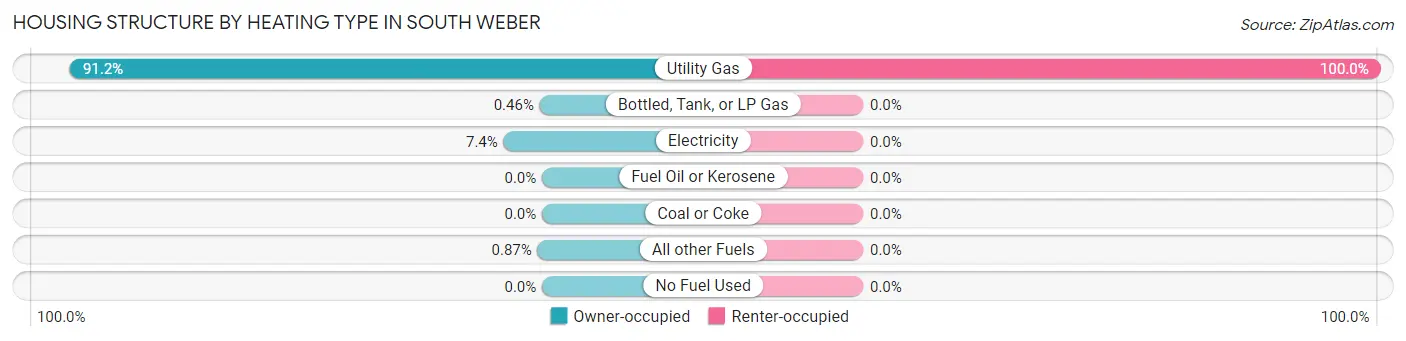
| Heating Type | Owner-occupied | Renter-occupied |
| Utility Gas | 1,999 (91.2%) | 111 (100.0%) |
| Bottled, Tank, or LP Gas | 10 (0.5%) | 0 (0.0%) |
| Electricity | 163 (7.4%) | 0 (0.0%) |
| Fuel Oil or Kerosene | 0 (0.0%) | 0 (0.0%) |
| Coal or Coke | 0 (0.0%) | 0 (0.0%) |
| All other Fuels | 19 (0.9%) | 0 (0.0%) |
| No Fuel Used | 0 (0.0%) | 0 (0.0%) |
| Total | 2,191 (100.0%) | 111 (100.0%) |
Household Vehicle Usage in South Weber
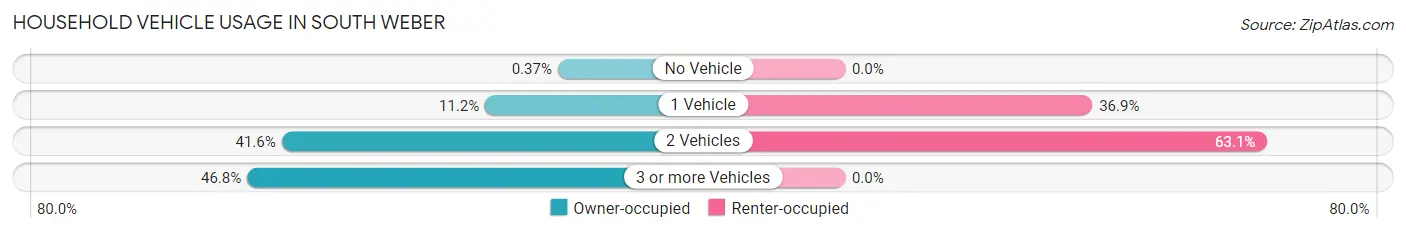
| Vehicles per Household | Owner-occupied | Renter-occupied |
| No Vehicle | 8 (0.4%) | 0 (0.0%) |
| 1 Vehicle | 246 (11.2%) | 41 (36.9%) |
| 2 Vehicles | 912 (41.6%) | 70 (63.1%) |
| 3 or more Vehicles | 1,025 (46.8%) | 0 (0.0%) |
| Total | 2,191 (100.0%) | 111 (100.0%) |
Real Estate & Mortgages in South Weber
Real Estate and Mortgage Overview in South Weber
| Characteristic | Without Mortgage | With Mortgage |
| Housing Units | 418 | 1,773 |
| Median Property Value | $492,900 | $453,600 |
| Median Household Income | $116,447 | $755 |
| Monthly Housing Costs | $554 | $115 |
| Real Estate Taxes | $2,581 | $41 |
Property Value by Mortgage Status in South Weber
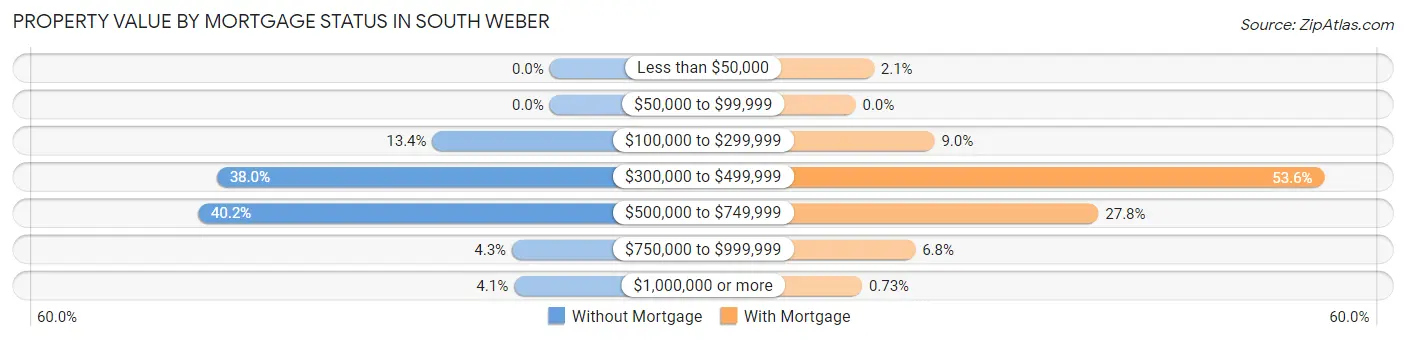
| Property Value | Without Mortgage | With Mortgage |
| Less than $50,000 | 0 (0.0%) | 37 (2.1%) |
| $50,000 to $99,999 | 0 (0.0%) | 0 (0.0%) |
| $100,000 to $299,999 | 56 (13.4%) | 160 (9.0%) |
| $300,000 to $499,999 | 159 (38.0%) | 950 (53.6%) |
| $500,000 to $749,999 | 168 (40.2%) | 492 (27.8%) |
| $750,000 to $999,999 | 18 (4.3%) | 121 (6.8%) |
| $1,000,000 or more | 17 (4.1%) | 13 (0.7%) |
| Total | 418 (100.0%) | 1,773 (100.0%) |
Household Income by Mortgage Status in South Weber
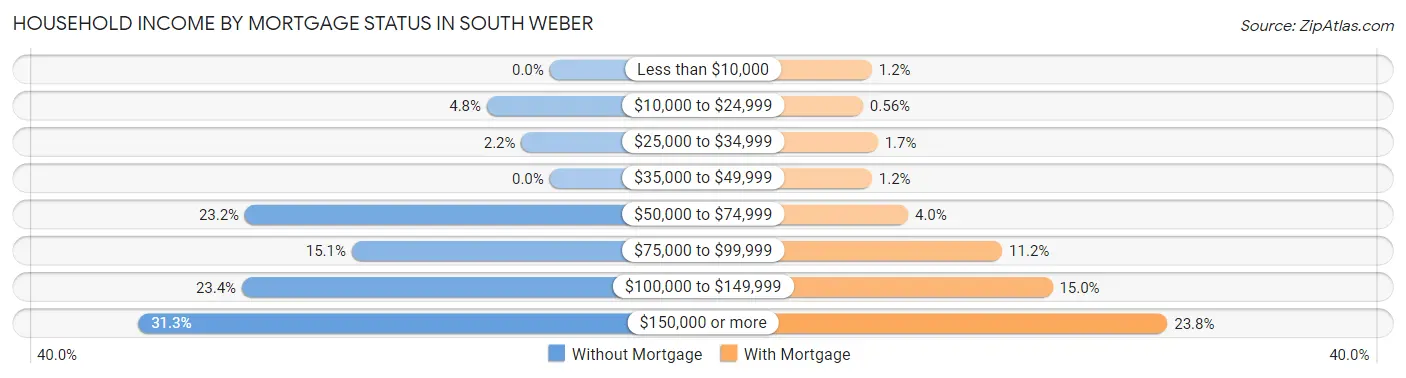
| Household Income | Without Mortgage | With Mortgage |
| Less than $10,000 | 0 (0.0%) | 22 (1.2%) |
| $10,000 to $24,999 | 20 (4.8%) | 10 (0.6%) |
| $25,000 to $34,999 | 9 (2.1%) | 30 (1.7%) |
| $35,000 to $49,999 | 0 (0.0%) | 22 (1.2%) |
| $50,000 to $74,999 | 97 (23.2%) | 71 (4.0%) |
| $75,000 to $99,999 | 63 (15.1%) | 198 (11.2%) |
| $100,000 to $149,999 | 98 (23.4%) | 266 (15.0%) |
| $150,000 or more | 131 (31.3%) | 421 (23.7%) |
| Total | 418 (100.0%) | 1,773 (100.0%) |
Property Value to Household Income Ratio in South Weber
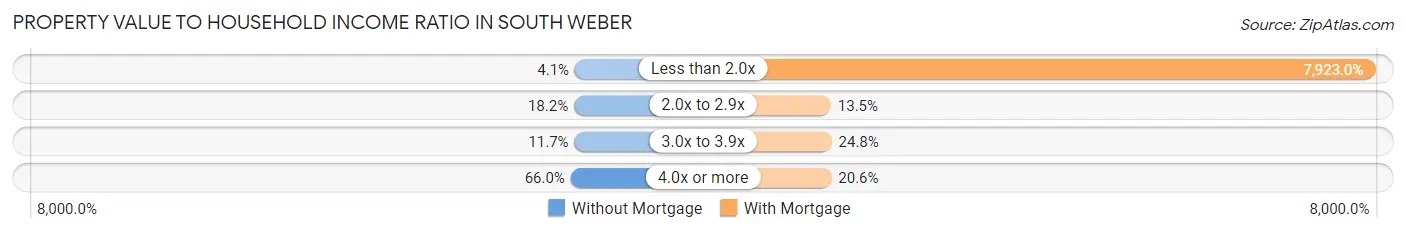
| Value-to-Income Ratio | Without Mortgage | With Mortgage |
| Less than 2.0x | 17 (4.1%) | 140,474 (7,923.0%) |
| 2.0x to 2.9x | 76 (18.2%) | 240 (13.5%) |
| 3.0x to 3.9x | 49 (11.7%) | 440 (24.8%) |
| 4.0x or more | 276 (66.0%) | 365 (20.6%) |
| Total | 418 (100.0%) | 1,773 (100.0%) |
Real Estate Taxes by Mortgage Status in South Weber
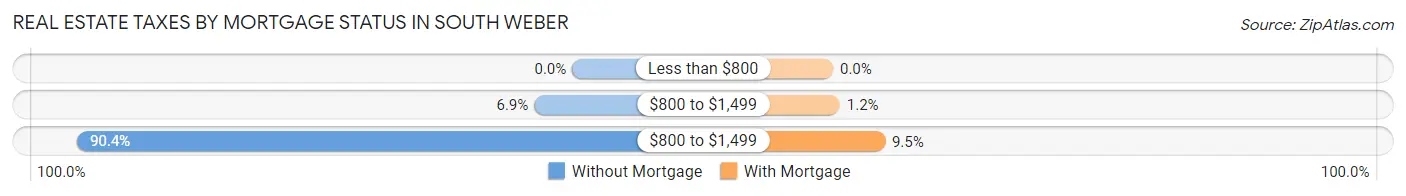
| Property Taxes | Without Mortgage | With Mortgage |
| Less than $800 | 0 (0.0%) | 0 (0.0%) |
| $800 to $1,499 | 29 (6.9%) | 22 (1.2%) |
| $800 to $1,499 | 378 (90.4%) | 168 (9.5%) |
| Total | 418 (100.0%) | 1,773 (100.0%) |
Health & Disability in South Weber
Health Insurance Coverage by Age in South Weber
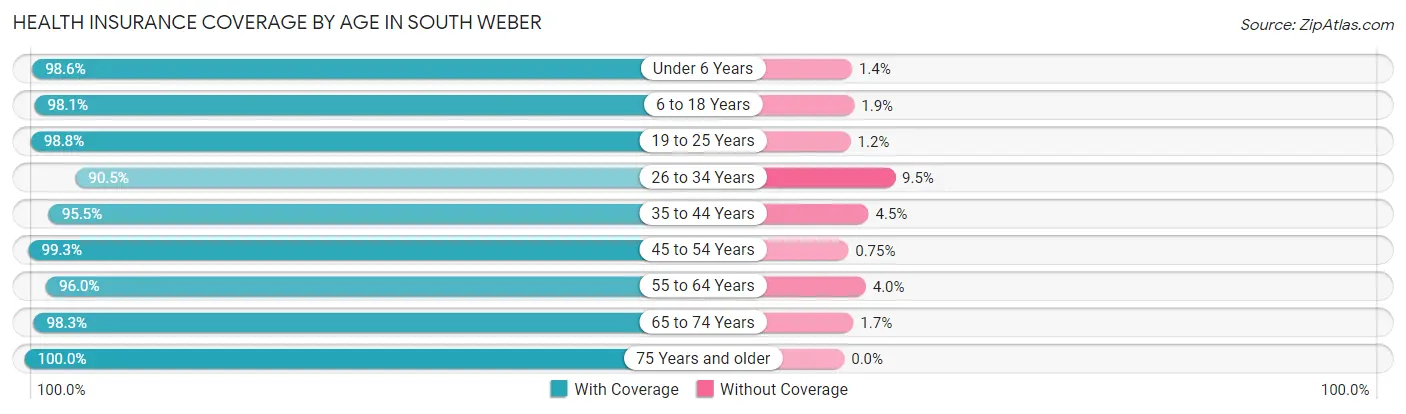
| Age Bracket | With Coverage | Without Coverage |
| Under 6 Years | 687 (98.6%) | 10 (1.4%) |
| 6 to 18 Years | 1,773 (98.1%) | 34 (1.9%) |
| 19 to 25 Years | 671 (98.8%) | 8 (1.2%) |
| 26 to 34 Years | 726 (90.5%) | 76 (9.5%) |
| 35 to 44 Years | 1,095 (95.5%) | 52 (4.5%) |
| 45 to 54 Years | 1,194 (99.3%) | 9 (0.7%) |
| 55 to 64 Years | 838 (96.0%) | 35 (4.0%) |
| 65 to 74 Years | 519 (98.3%) | 9 (1.7%) |
| 75 Years and older | 203 (100.0%) | 0 (0.0%) |
| Total | 7,706 (97.1%) | 233 (2.9%) |
Health Insurance Coverage by Citizenship Status in South Weber
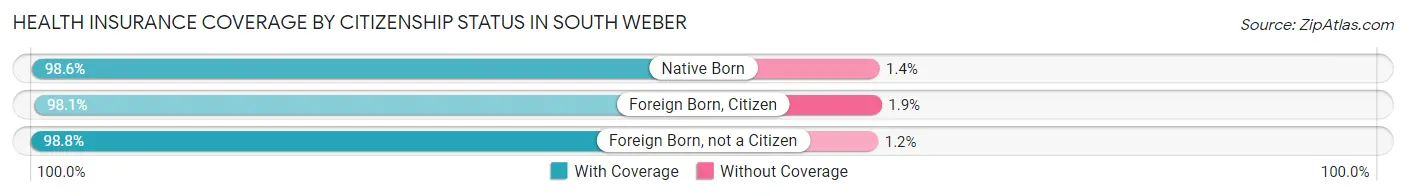
| Citizenship Status | With Coverage | Without Coverage |
| Native Born | 687 (98.6%) | 10 (1.4%) |
| Foreign Born, Citizen | 1,773 (98.1%) | 34 (1.9%) |
| Foreign Born, not a Citizen | 671 (98.8%) | 8 (1.2%) |
Health Insurance Coverage by Household Income in South Weber
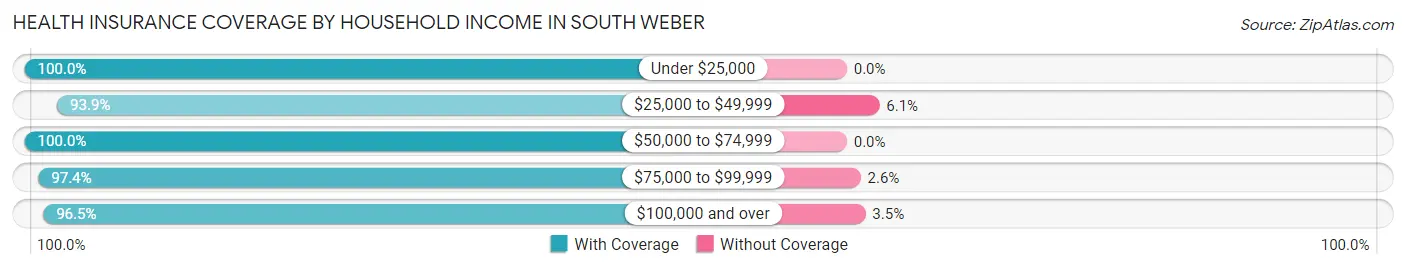
| Household Income | With Coverage | Without Coverage |
| Under $25,000 | 130 (100.0%) | 0 (0.0%) |
| $25,000 to $49,999 | 277 (93.9%) | 18 (6.1%) |
| $50,000 to $74,999 | 972 (100.0%) | 0 (0.0%) |
| $75,000 to $99,999 | 1,431 (97.4%) | 38 (2.6%) |
| $100,000 and over | 4,896 (96.5%) | 177 (3.5%) |
Public vs Private Health Insurance Coverage by Age in South Weber
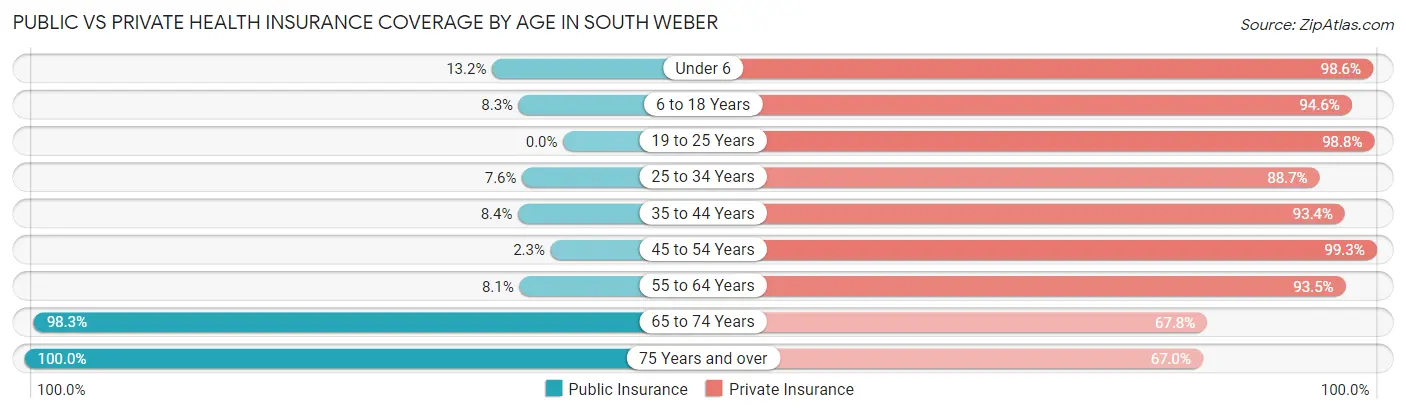
| Age Bracket | Public Insurance | Private Insurance |
| Under 6 | 92 (13.2%) | 687 (98.6%) |
| 6 to 18 Years | 149 (8.3%) | 1,710 (94.6%) |
| 19 to 25 Years | 0 (0.0%) | 671 (98.8%) |
| 25 to 34 Years | 61 (7.6%) | 711 (88.6%) |
| 35 to 44 Years | 96 (8.4%) | 1,071 (93.4%) |
| 45 to 54 Years | 28 (2.3%) | 1,194 (99.3%) |
| 55 to 64 Years | 71 (8.1%) | 816 (93.5%) |
| 65 to 74 Years | 519 (98.3%) | 358 (67.8%) |
| 75 Years and over | 203 (100.0%) | 136 (67.0%) |
| Total | 1,219 (15.3%) | 7,354 (92.6%) |
Disability Status by Sex by Age in South Weber
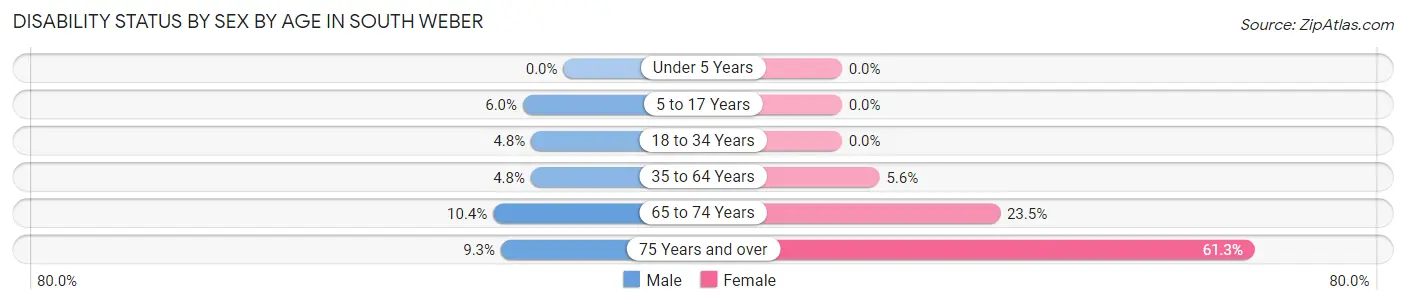
| Age Bracket | Male | Female |
| Under 5 Years | 0 (0.0%) | 0 (0.0%) |
| 5 to 17 Years | 54 (6.0%) | 0 (0.0%) |
| 18 to 34 Years | 45 (4.8%) | 0 (0.0%) |
| 35 to 64 Years | 78 (4.8%) | 90 (5.6%) |
| 65 to 74 Years | 24 (10.4%) | 70 (23.5%) |
| 75 Years and over | 9 (9.3%) | 65 (61.3%) |
Disability Class by Sex by Age in South Weber
Disability Class: Hearing Difficulty
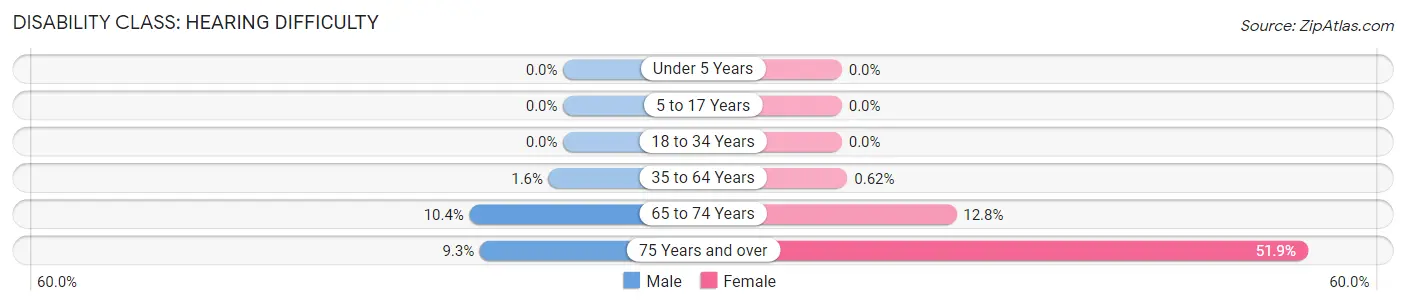
| Age Bracket | Male | Female |
| Under 5 Years | 0 (0.0%) | 0 (0.0%) |
| 5 to 17 Years | 0 (0.0%) | 0 (0.0%) |
| 18 to 34 Years | 0 (0.0%) | 0 (0.0%) |
| 35 to 64 Years | 26 (1.6%) | 10 (0.6%) |
| 65 to 74 Years | 24 (10.4%) | 38 (12.8%) |
| 75 Years and over | 9 (9.3%) | 55 (51.9%) |
Disability Class: Vision Difficulty
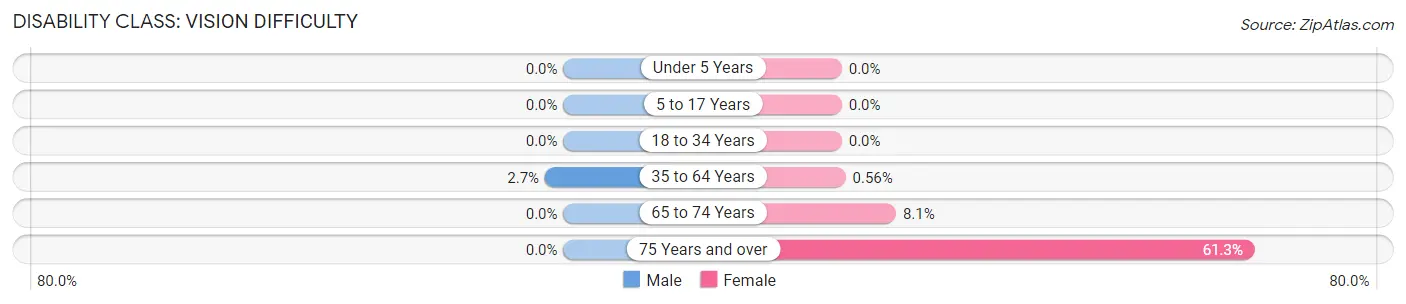
| Age Bracket | Male | Female |
| Under 5 Years | 0 (0.0%) | 0 (0.0%) |
| 5 to 17 Years | 0 (0.0%) | 0 (0.0%) |
| 18 to 34 Years | 0 (0.0%) | 0 (0.0%) |
| 35 to 64 Years | 44 (2.7%) | 9 (0.6%) |
| 65 to 74 Years | 0 (0.0%) | 24 (8.1%) |
| 75 Years and over | 0 (0.0%) | 65 (61.3%) |
Disability Class: Cognitive Difficulty
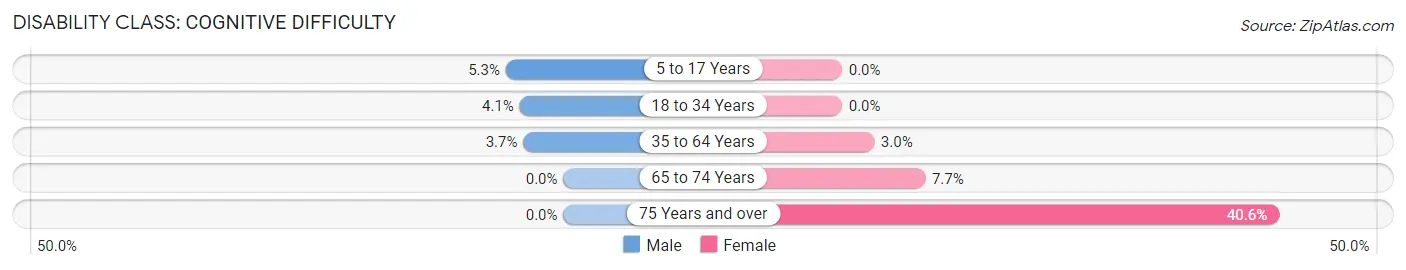
| Age Bracket | Male | Female |
| 5 to 17 Years | 48 (5.3%) | 0 (0.0%) |
| 18 to 34 Years | 38 (4.1%) | 0 (0.0%) |
| 35 to 64 Years | 60 (3.7%) | 48 (3.0%) |
| 65 to 74 Years | 0 (0.0%) | 23 (7.7%) |
| 75 Years and over | 0 (0.0%) | 43 (40.6%) |
Disability Class: Ambulatory Difficulty
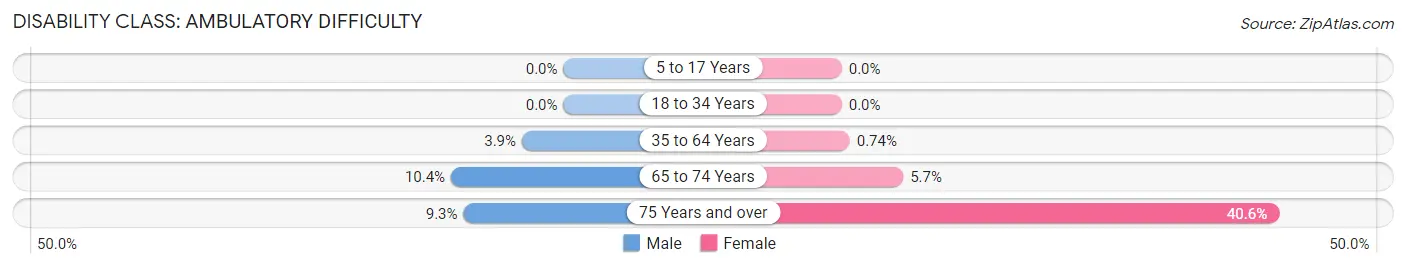
| Age Bracket | Male | Female |
| 5 to 17 Years | 0 (0.0%) | 0 (0.0%) |
| 18 to 34 Years | 0 (0.0%) | 0 (0.0%) |
| 35 to 64 Years | 62 (3.8%) | 12 (0.7%) |
| 65 to 74 Years | 24 (10.4%) | 17 (5.7%) |
| 75 Years and over | 9 (9.3%) | 43 (40.6%) |
Disability Class: Self-Care Difficulty
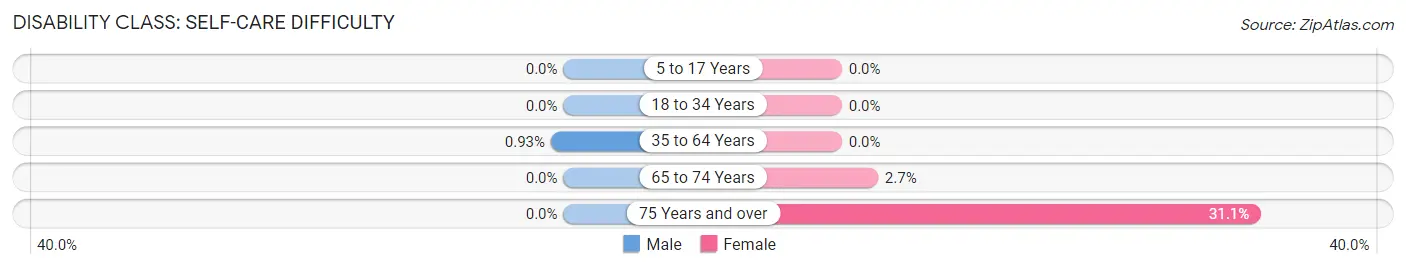
| Age Bracket | Male | Female |
| 5 to 17 Years | 0 (0.0%) | 0 (0.0%) |
| 18 to 34 Years | 0 (0.0%) | 0 (0.0%) |
| 35 to 64 Years | 15 (0.9%) | 0 (0.0%) |
| 65 to 74 Years | 0 (0.0%) | 8 (2.7%) |
| 75 Years and over | 0 (0.0%) | 33 (31.1%) |
Technology Access in South Weber
Computing Device Access in South Weber
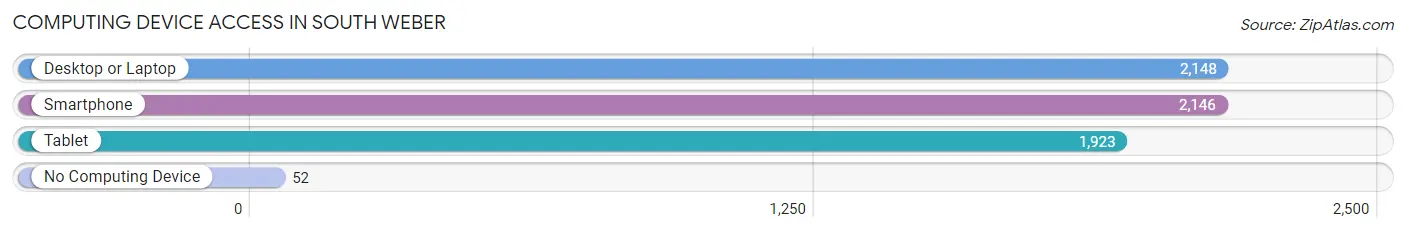
| Device Type | # Households | % Households |
| Desktop or Laptop | 2,148 | 93.3% |
| Smartphone | 2,146 | 93.2% |
| Tablet | 1,923 | 83.5% |
| No Computing Device | 52 | 2.3% |
| Total | 2,302 | 100.0% |
Internet Access in South Weber
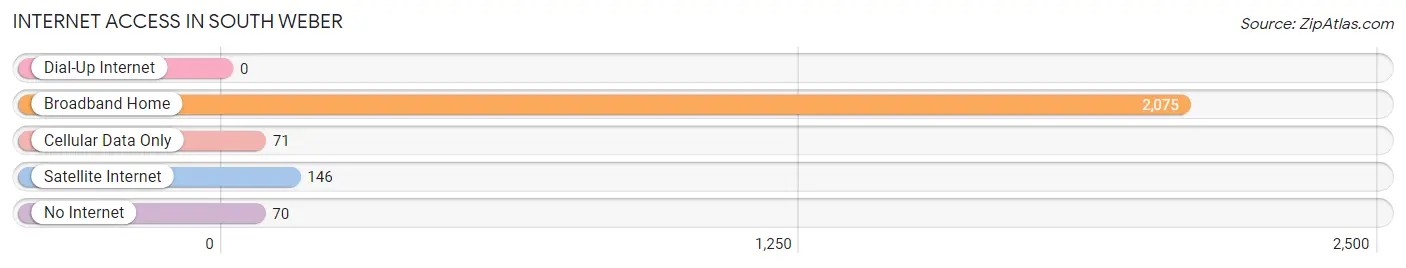
| Internet Type | # Households | % Households |
| Dial-Up Internet | 0 | 0.0% |
| Broadband Home | 2,075 | 90.1% |
| Cellular Data Only | 71 | 3.1% |
| Satellite Internet | 146 | 6.3% |
| No Internet | 70 | 3.0% |
| Total | 2,302 | 100.0% |
South Weber Summary
History
South Weber is a small city located in Davis County, Utah. It is situated in the northern part of the county, just south of the city of Ogden. The city was first settled in 1847 by a group of Mormon pioneers led by John Taylor, who was later to become the third president of The Church of Jesus Christ of Latter-day Saints. The pioneers named the area South Weber, after the Weber River, which runs through the city.
The city was incorporated in 1891 and has since grown to a population of over 5,000 people. The city is home to several businesses, including a large industrial park, and is a popular destination for outdoor recreation.
Geography
South Weber is located in the northern part of Davis County, Utah. It is situated at an elevation of 4,717 feet above sea level. The city is bordered by the cities of Ogden to the north, Layton to the east, and Clearfield to the south. The city is located in the Wasatch Front region of Utah, which is known for its beautiful mountain scenery and outdoor recreation opportunities.
The city is situated in a valley surrounded by the Wasatch Mountains to the east and the Great Salt Lake to the west. The city is located near several major highways, including Interstate 15, which runs through the city.
Economy
South Weber is home to several businesses, including a large industrial park. The city is also home to several retail stores, restaurants, and other businesses. The city is also home to several educational institutions, including Weber State University and Davis Applied Technology College.
The city is also home to several manufacturing companies, including a large paper mill and a large food processing plant. The city is also home to several technology companies, including a software development company and a medical device manufacturer.
Demographics
As of the 2010 census, South Weber had a population of 5,068 people. The racial makeup of the city was 91.3% White, 0.7% African American, 0.7% Native American, 1.2% Asian, 0.2% Pacific Islander, 3.3% from other races, and 2.8% from two or more races. Hispanic or Latino of any race were 8.2% of the population.
The median income for a household in the city was $50,945, and the median income for a family was $60,945. The per capita income for the city was $22,945. About 5.3% of families and 7.2% of the population were below the poverty line, including 8.3% of those under age 18 and 4.2% of those age 65 or over.
Common Questions
What is Per Capita Income in South Weber?
Per Capita income in South Weber is $41,468.
What is the Median Family Income in South Weber?
Median Family Income in South Weber is $140,186.
What is the Median Household income in South Weber?
Median Household Income in South Weber is $130,769.
What is Income or Wage Gap in South Weber?
Income or Wage Gap in South Weber is 46.8%.
Women in South Weber earn 53.2 cents for every dollar earned by a man.
What is Family Income Deficit in South Weber?
Family Income Deficit in South Weber is $7,298.
Families that are below poverty line in South Weber earn $7,298 less on average than the poverty threshold level.
What is Inequality or Gini Index in South Weber?
Inequality or Gini Index in South Weber is 0.31.
What is the Total Population of South Weber?
Total Population of South Weber is 7,939.
What is the Total Male Population of South Weber?
Total Male Population of South Weber is 4,091.
What is the Total Female Population of South Weber?
Total Female Population of South Weber is 3,848.
What is the Ratio of Males per 100 Females in South Weber?
There are 106.31 Males per 100 Females in South Weber.
What is the Ratio of Females per 100 Males in South Weber?
There are 94.06 Females per 100 Males in South Weber.
What is the Median Population Age in South Weber?
Median Population Age in South Weber is 34.9 Years.
What is the Average Family Size in South Weber
Average Family Size in South Weber is 3.6 People.
What is the Average Household Size in South Weber
Average Household Size in South Weber is 3.5 People.
How Large is the Labor Force in South Weber?
There are 4,188 People in the Labor Forcein in South Weber.
What is the Percentage of People in the Labor Force in South Weber?
71.6% of People are in the Labor Force in South Weber.
What is the Unemployment Rate in South Weber?
Unemployment Rate in South Weber is 2.7%.