Zip Codes with the Highest Percentage of Population Employed in Farming, Fishing & Forestry in Sterling Heights, MI
RELATED REPORTS & OPTIONS
Farming, Fishing & Forestry
Sterling Heights
Compare Zip Codes
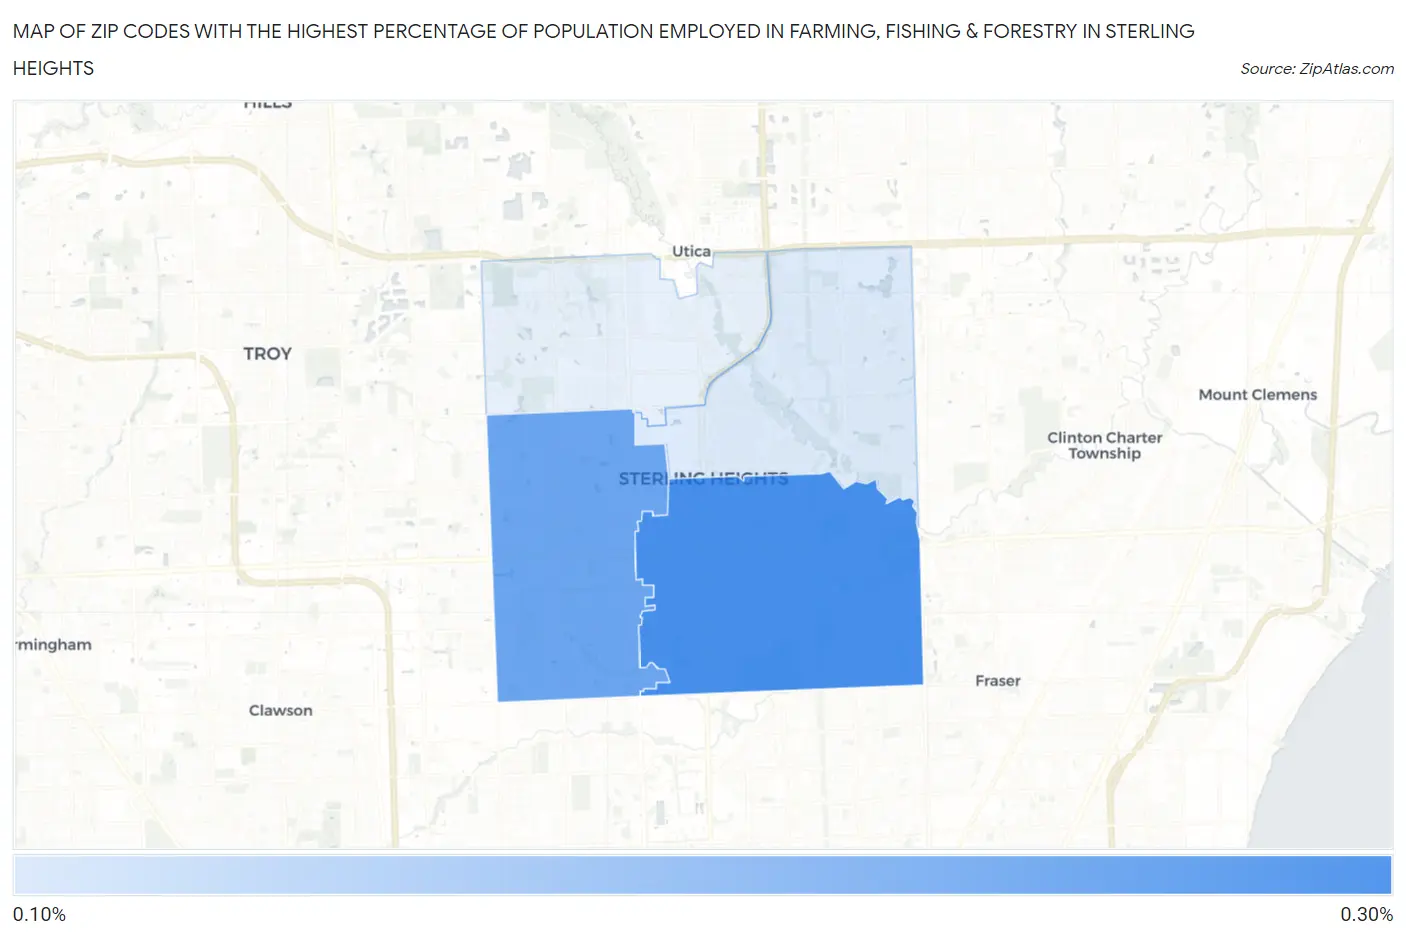
Map of Zip Codes with the Highest Percentage of Population Employed in Farming, Fishing & Forestry in Sterling Heights
0.11%
0.27%
Zip Codes with the Highest Percentage of Population Employed in Farming, Fishing & Forestry in Sterling Heights, MI
| Zip Code | % Employed | vs State | vs National | |
| 1. | 48312 | 0.27% | 0.47%(-0.198)#525 | 0.61%(-0.337)#15,181 |
| 2. | 48310 | 0.23% | 0.47%(-0.235)#543 | 0.61%(-0.374)#15,674 |
| 3. | 48313 | 0.11% | 0.47%(-0.352)#620 | 0.61%(-0.491)#17,514 |
1
Common Questions
What are the Top 3 Zip Codes with the Highest Percentage of Population Employed in Farming, Fishing & Forestry in Sterling Heights, MI?
Top 3 Zip Codes with the Highest Percentage of Population Employed in Farming, Fishing & Forestry in Sterling Heights, MI are:
What zip code has the Highest Percentage of Population Employed in Farming, Fishing & Forestry in Sterling Heights, MI?
48312 has the Highest Percentage of Population Employed in Farming, Fishing & Forestry in Sterling Heights, MI with 0.27%.
What is the Percentage of Population Employed in Farming, Fishing & Forestry in Sterling Heights, MI?
Percentage of Population Employed in Farming, Fishing & Forestry in Sterling Heights is 0.17%.
What is the Percentage of Population Employed in Farming, Fishing & Forestry in Michigan?
Percentage of Population Employed in Farming, Fishing & Forestry in Michigan is 0.47%.
What is the Percentage of Population Employed in Farming, Fishing & Forestry in the United States?
Percentage of Population Employed in Farming, Fishing & Forestry in the United States is 0.61%.