Zip Codes with the Highest Percentage of Population Employed in Farming, Fishing & Forestry in Dearborn Heights, MI
RELATED REPORTS & OPTIONS
Farming, Fishing & Forestry
Dearborn Heights
Compare Zip Codes
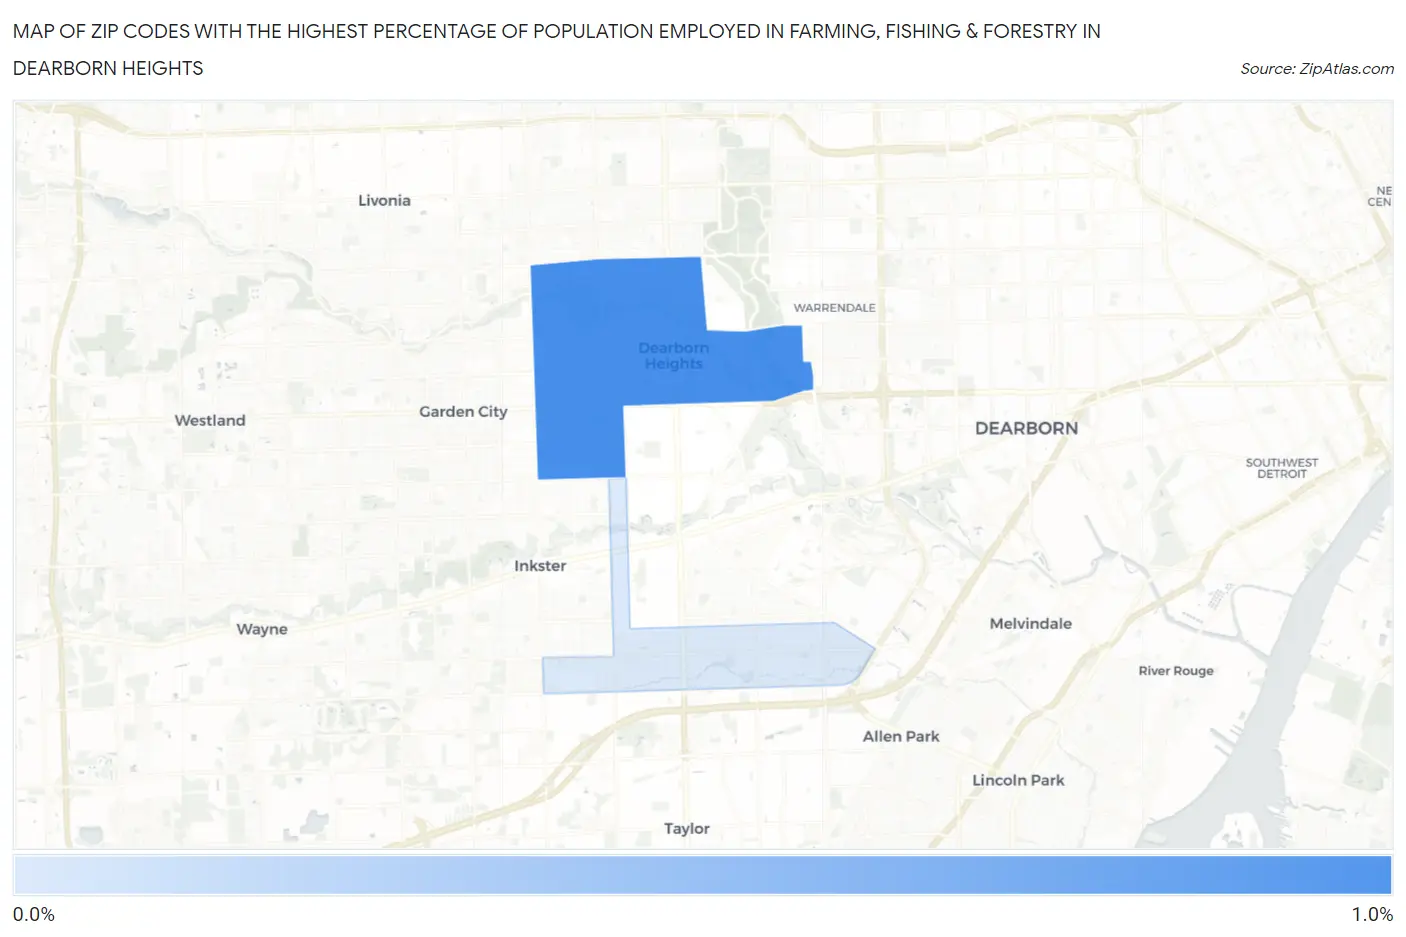
Map of Zip Codes with the Highest Percentage of Population Employed in Farming, Fishing & Forestry in Dearborn Heights
0.17%
0.98%
Zip Codes with the Highest Percentage of Population Employed in Farming, Fishing & Forestry in Dearborn Heights, MI
| Zip Code | % Employed | vs State | vs National | |
| 1. | 48127 | 0.98% | 0.47%(+0.512)#292 | 0.61%(+0.373)#9,849 |
| 2. | 48125 | 0.17% | 0.47%(-0.300)#586 | 0.61%(-0.439)#16,636 |
1
Common Questions
What are the Top Zip Codes with the Highest Percentage of Population Employed in Farming, Fishing & Forestry in Dearborn Heights, MI?
Top Zip Codes with the Highest Percentage of Population Employed in Farming, Fishing & Forestry in Dearborn Heights, MI are:
What zip code has the Highest Percentage of Population Employed in Farming, Fishing & Forestry in Dearborn Heights, MI?
48127 has the Highest Percentage of Population Employed in Farming, Fishing & Forestry in Dearborn Heights, MI with 0.98%.
What is the Percentage of Population Employed in Farming, Fishing & Forestry in Dearborn Heights, MI?
Percentage of Population Employed in Farming, Fishing & Forestry in Dearborn Heights is 0.69%.
What is the Percentage of Population Employed in Farming, Fishing & Forestry in Michigan?
Percentage of Population Employed in Farming, Fishing & Forestry in Michigan is 0.47%.
What is the Percentage of Population Employed in Farming, Fishing & Forestry in the United States?
Percentage of Population Employed in Farming, Fishing & Forestry in the United States is 0.61%.