Poole, KY Map & Demographics
Poole Map
Poole Overview
$49,569
PER CAPITA INCOME
$93,125
AVG HOUSEHOLD INCOME
81.8%
WAGE / INCOME GAP [ % ]
18.2¢/ $1
WAGE / INCOME GAP [ $ ]
0.21
INEQUALITY / GINI INDEX
108
TOTAL POPULATION
44
MALE POPULATION
64
FEMALE POPULATION
68.75
MALES / 100 FEMALES
145.45
FEMALES / 100 MALES
39.0
MEDIAN AGE
2.6
AVG FAMILY SIZE
2.4
AVG HOUSEHOLD SIZE
95
LABOR FORCE [ PEOPLE ]
88.0%
PERCENT IN LABOR FORCE
Poole Area Codes
Income in Poole
Income Overview in Poole
| Characteristic | Number | Measure |
| Per Capita Income | 108 | $49,569 |
| Median Family Income | 36 | $0 |
| Mean Family Income | 36 | $129,164 |
| Median Household Income | 45 | $93,125 |
| Mean Household Income | 45 | $120,400 |
| Income Deficit | 36 | $0 |
| Wage / Income Gap (%) | 108 | 81.82% |
| Wage / Income Gap ($) | 108 | 18.18¢ per $1 |
| Gini / Inequality Index | 108 | 0.21 |
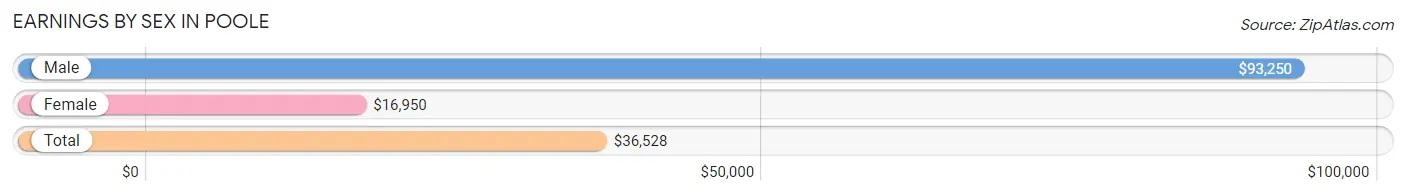
Earnings by Sex in Poole
Average Earnings in Poole are $36,528, $93,250 for men and $16,950 for women, a difference of 81.8%.
| Sex | Number | Average Earnings |
| Male | 44 (46.3%) | $93,250 |
| Female | 51 (53.7%) | $16,950 |
| Total | 95 (100.0%) | $36,528 |
Earnings by Sex by Income Bracket in Poole
The most common earnings brackets in Poole are $75,000 to $99,999 for men (19 | 43.2%) and $15,000 to $17,499 for women (25 | 49.0%).
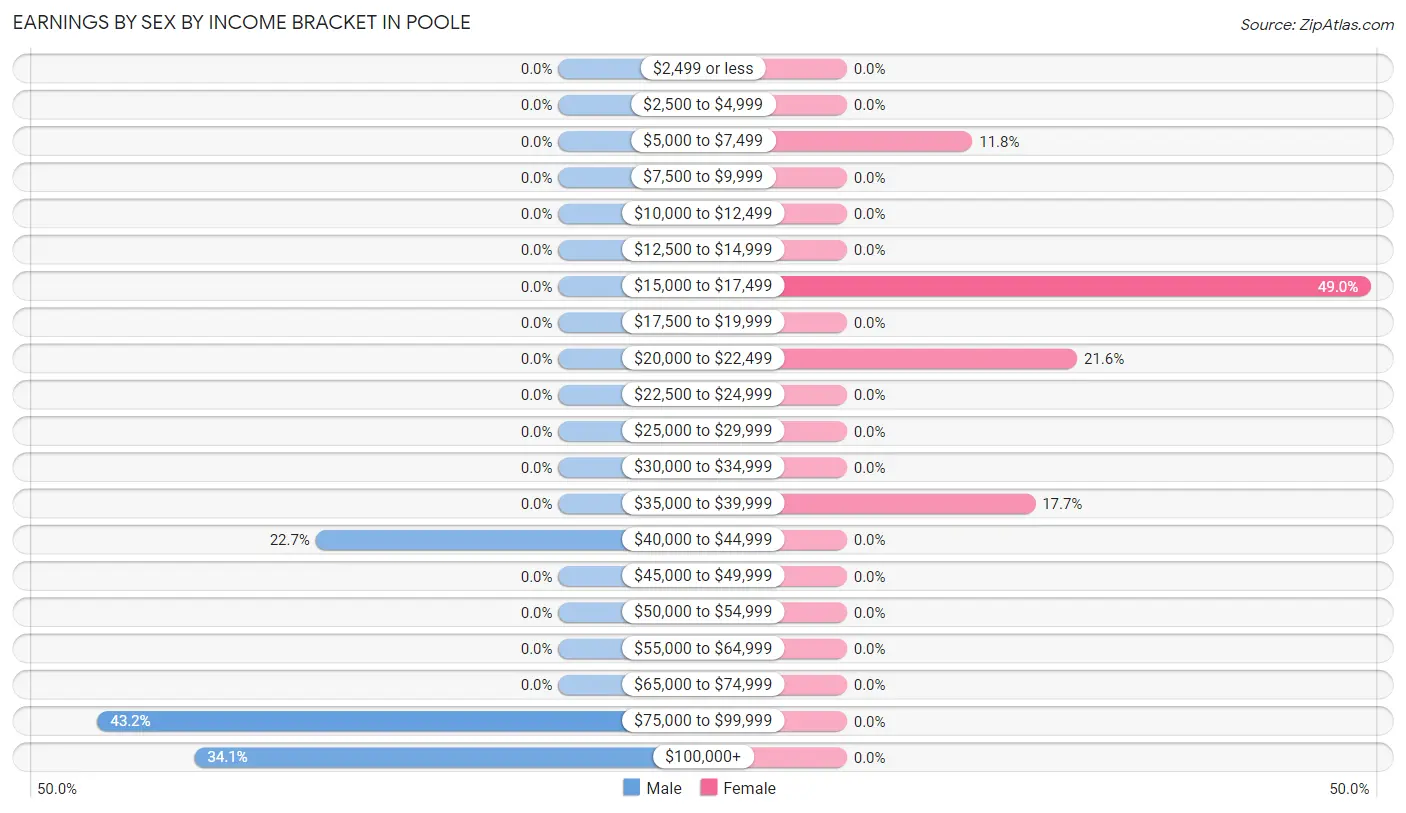
| Income | Male | Female |
| $2,499 or less | 0 (0.0%) | 0 (0.0%) |
| $2,500 to $4,999 | 0 (0.0%) | 0 (0.0%) |
| $5,000 to $7,499 | 0 (0.0%) | 6 (11.8%) |
| $7,500 to $9,999 | 0 (0.0%) | 0 (0.0%) |
| $10,000 to $12,499 | 0 (0.0%) | 0 (0.0%) |
| $12,500 to $14,999 | 0 (0.0%) | 0 (0.0%) |
| $15,000 to $17,499 | 0 (0.0%) | 25 (49.0%) |
| $17,500 to $19,999 | 0 (0.0%) | 0 (0.0%) |
| $20,000 to $22,499 | 0 (0.0%) | 11 (21.6%) |
| $22,500 to $24,999 | 0 (0.0%) | 0 (0.0%) |
| $25,000 to $29,999 | 0 (0.0%) | 0 (0.0%) |
| $30,000 to $34,999 | 0 (0.0%) | 0 (0.0%) |
| $35,000 to $39,999 | 0 (0.0%) | 9 (17.6%) |
| $40,000 to $44,999 | 10 (22.7%) | 0 (0.0%) |
| $45,000 to $49,999 | 0 (0.0%) | 0 (0.0%) |
| $50,000 to $54,999 | 0 (0.0%) | 0 (0.0%) |
| $55,000 to $64,999 | 0 (0.0%) | 0 (0.0%) |
| $65,000 to $74,999 | 0 (0.0%) | 0 (0.0%) |
| $75,000 to $99,999 | 19 (43.2%) | 0 (0.0%) |
| $100,000+ | 15 (34.1%) | 0 (0.0%) |
| Total | 44 (100.0%) | 51 (100.0%) |
Earnings by Sex by Educational Attainment in Poole
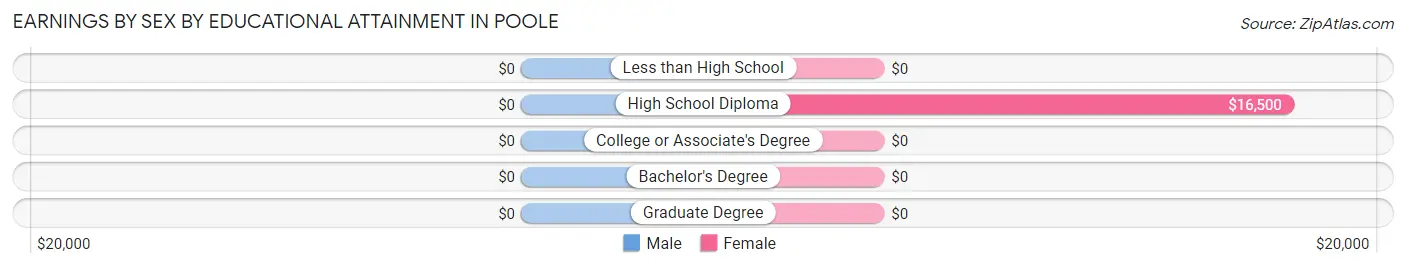
| Educational Attainment | Male Income | Female Income |
| Less than High School | - | - |
| High School Diploma | - | - |
| College or Associate's Degree | - | - |
| Bachelor's Degree | - | - |
| Graduate Degree | - | - |
| Total | $93,250 | $16,950 |
Family Income in Poole
Family Income Brackets in Poole
According to the Poole family income data, there are 21 families falling into the $75,000 to $99,999 income range, which is the most common income bracket and makes up 58.3% of all families.
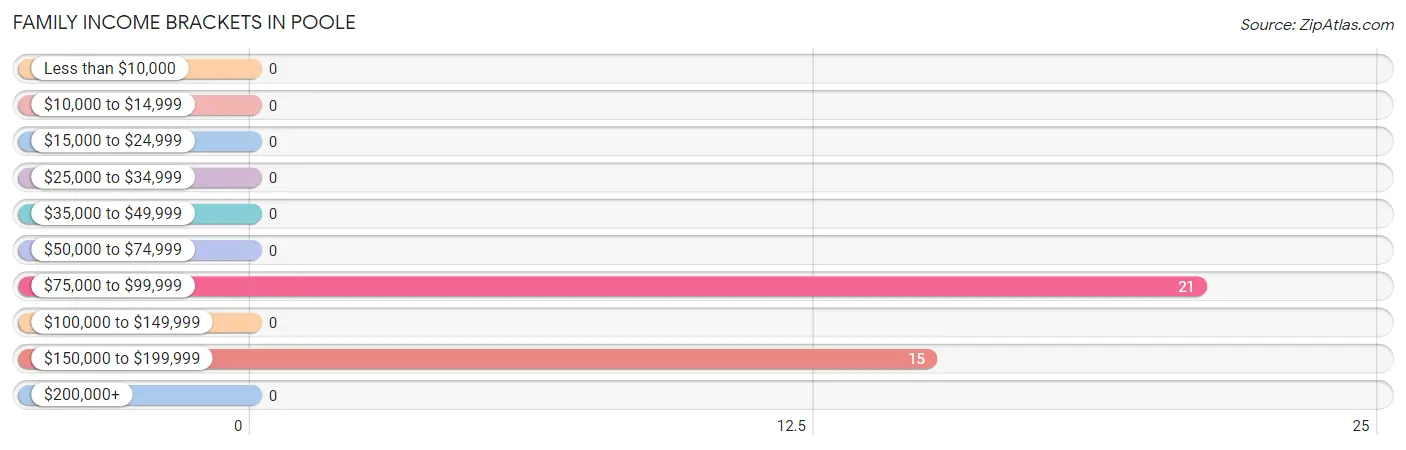
| Income Bracket | # Families | % Families |
| Less than $10,000 | 0 | 0.0% |
| $10,000 to $14,999 | 0 | 0.0% |
| $15,000 to $24,999 | 0 | 0.0% |
| $25,000 to $34,999 | 0 | 0.0% |
| $35,000 to $49,999 | 0 | 0.0% |
| $50,000 to $74,999 | 0 | 0.0% |
| $75,000 to $99,999 | 21 | 58.3% |
| $100,000 to $149,999 | 0 | 0.0% |
| $150,000 to $199,999 | 15 | 41.7% |
| $200,000+ | 0 | 0.0% |
Family Income by Famaliy Size in Poole
| Income Bracket | # Families | Median Income |
| 2-Person Families | 25 (69.4%) | $0 |
| 3-Person Families | 11 (30.6%) | $0 |
| 4-Person Families | 0 (0.0%) | $0 |
| 5-Person Families | 0 (0.0%) | $0 |
| 6-Person Families | 0 (0.0%) | $0 |
| 7+ Person Families | 0 (0.0%) | $0 |
| Total | 36 (100.0%) | $0 |
Family Income by Number of Earners in Poole
| Number of Earners | # Families | Median Income |
| No Earners | 0 (0.0%) | $0 |
| 1 Earner | 10 (27.8%) | $0 |
| 2 Earners | 15 (41.7%) | $0 |
| 3+ Earners | 11 (30.6%) | $0 |
| Total | 36 (100.0%) | $0 |
Household Income in Poole
Household Income Brackets in Poole
With 30 households falling in the category, the $75,000 to $99,999 income range is the most frequent in Poole, accounting for 66.7% of all households.
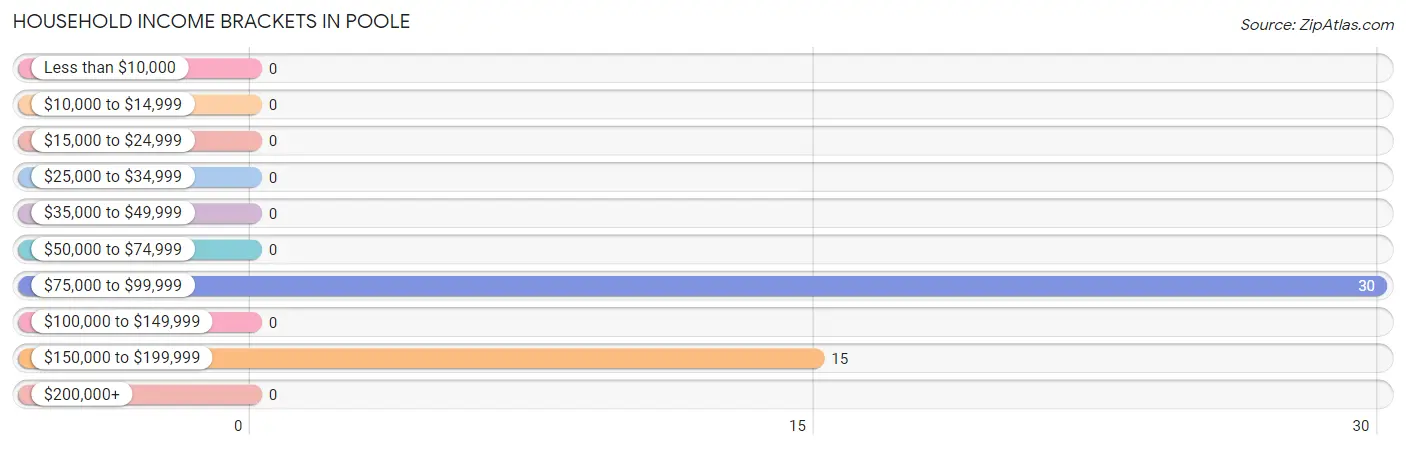
| Income Bracket | # Households | % Households |
| Less than $10,000 | 0 | 0.0% |
| $10,000 to $14,999 | 0 | 0.0% |
| $15,000 to $24,999 | 0 | 0.0% |
| $25,000 to $34,999 | 0 | 0.0% |
| $35,000 to $49,999 | 0 | 0.0% |
| $50,000 to $74,999 | 0 | 0.0% |
| $75,000 to $99,999 | 30 | 66.7% |
| $100,000 to $149,999 | 0 | 0.0% |
| $150,000 to $199,999 | 15 | 33.3% |
| $200,000+ | 0 | 0.0% |
Household Income by Householder Age in Poole
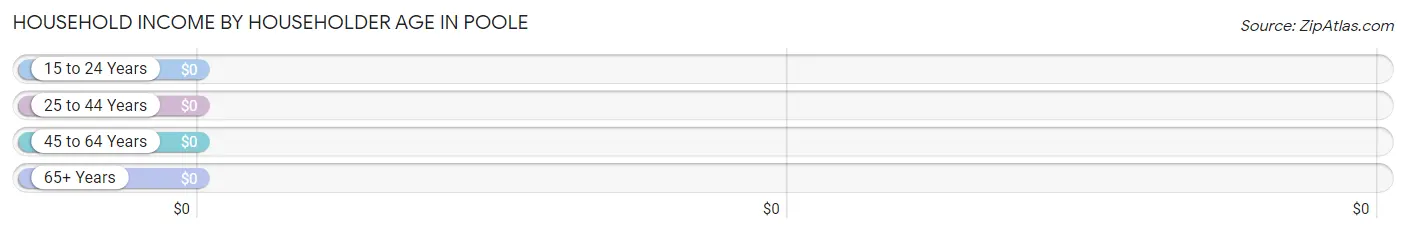
| Income Bracket | # Households | Median Income |
| 15 to 24 Years | 0 (0.0%) | $0 |
| 25 to 44 Years | 19 (42.2%) | $0 |
| 45 to 64 Years | 26 (57.8%) | $0 |
| 65+ Years | 0 (0.0%) | $0 |
| Total | 45 (100.0%) | $93,125 |
Poverty in Poole
Income Below Poverty by Sex and Age in Poole
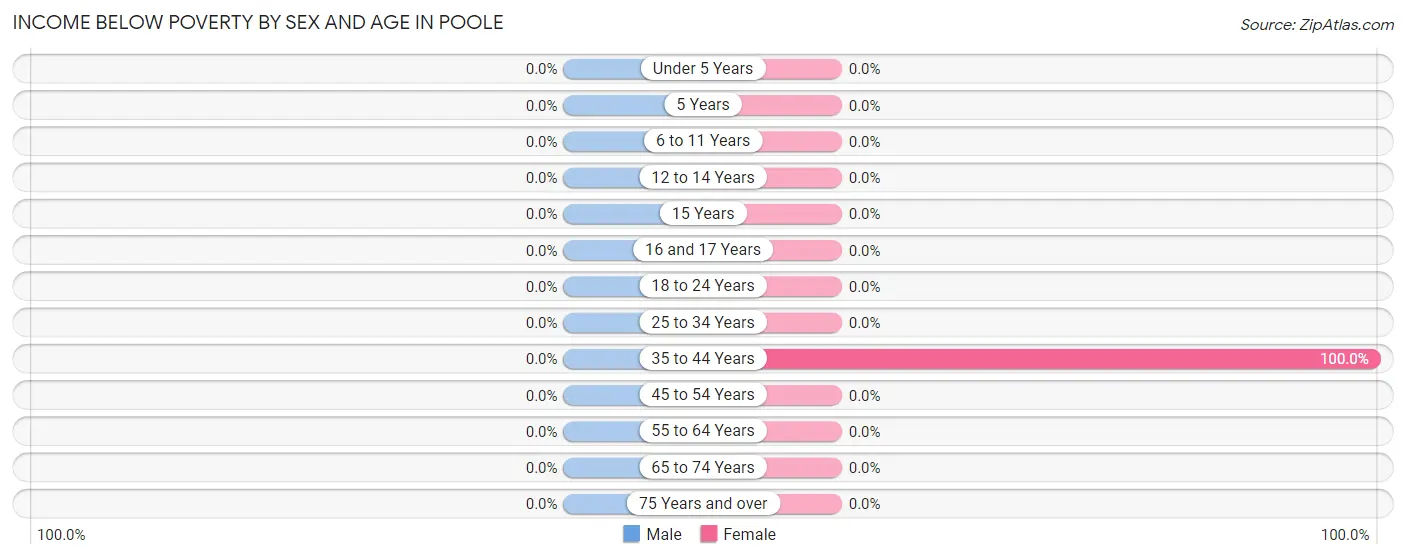
| Age Bracket | Male | Female |
| Under 5 Years | 0 (0.0%) | 0 (0.0%) |
| 5 Years | 0 (0.0%) | 0 (0.0%) |
| 6 to 11 Years | 0 (0.0%) | 0 (0.0%) |
| 12 to 14 Years | 0 (0.0%) | 0 (0.0%) |
| 15 Years | 0 (0.0%) | 0 (0.0%) |
| 16 and 17 Years | 0 (0.0%) | 0 (0.0%) |
| 18 to 24 Years | 0 (0.0%) | 0 (0.0%) |
| 25 to 34 Years | 0 (0.0%) | 0 (0.0%) |
| 35 to 44 Years | 0 (0.0%) | 6 (100.0%) |
| 45 to 54 Years | 0 (0.0%) | 0 (0.0%) |
| 55 to 64 Years | 0 (0.0%) | 0 (0.0%) |
| 65 to 74 Years | 0 (0.0%) | 0 (0.0%) |
| 75 Years and over | 0 (0.0%) | 0 (0.0%) |
| Total | 0 (0.0%) | 6 (9.4%) |
Income Above Poverty by Sex and Age in Poole
According to the poverty statistics in Poole, males aged 25 to 34 years and females aged 25 to 34 years are the age groups that are most secure financially, with 100.0% of males and 100.0% of females in these age groups living above the poverty line.
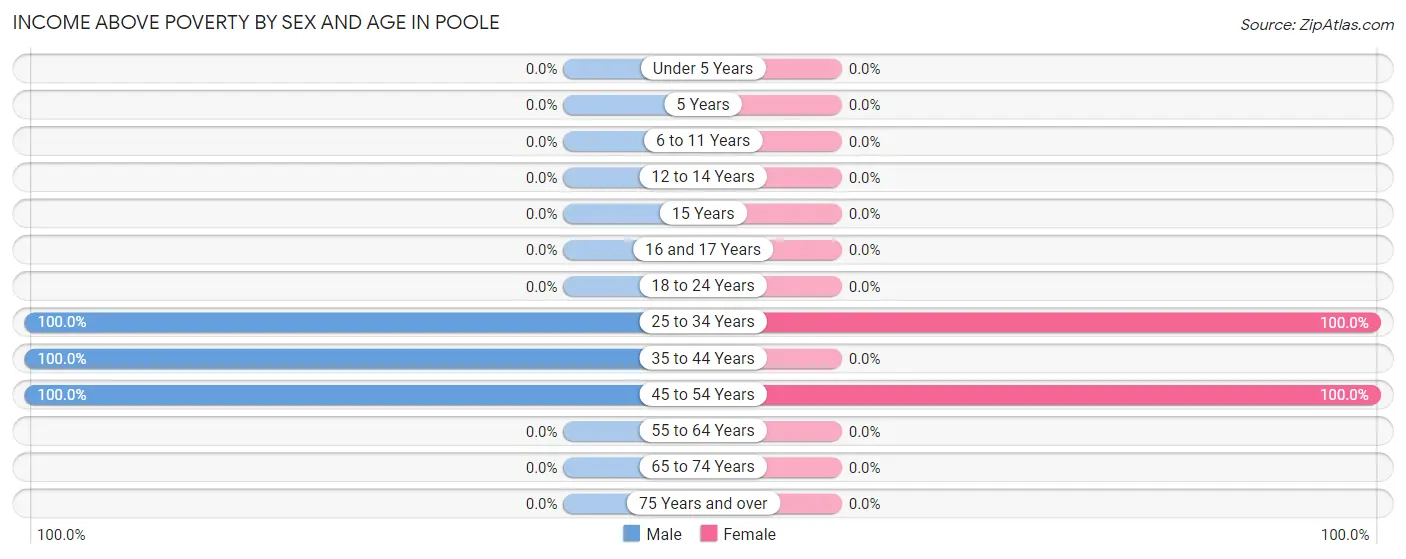
| Age Bracket | Male | Female |
| Under 5 Years | 0 (0.0%) | 0 (0.0%) |
| 5 Years | 0 (0.0%) | 0 (0.0%) |
| 6 to 11 Years | 0 (0.0%) | 0 (0.0%) |
| 12 to 14 Years | 0 (0.0%) | 0 (0.0%) |
| 15 Years | 0 (0.0%) | 0 (0.0%) |
| 16 and 17 Years | 0 (0.0%) | 0 (0.0%) |
| 18 to 24 Years | 0 (0.0%) | 0 (0.0%) |
| 25 to 34 Years | 10 (100.0%) | 38 (100.0%) |
| 35 to 44 Years | 9 (100.0%) | 0 (0.0%) |
| 45 to 54 Years | 25 (100.0%) | 20 (100.0%) |
| 55 to 64 Years | 0 (0.0%) | 0 (0.0%) |
| 65 to 74 Years | 0 (0.0%) | 0 (0.0%) |
| 75 Years and over | 0 (0.0%) | 0 (0.0%) |
| Total | 44 (100.0%) | 58 (90.6%) |
Income Below Poverty Among Married-Couple Families in Poole
| Children | Above Poverty | Below Poverty |
| No Children | 36 (100.0%) | 0 (0.0%) |
| 1 or 2 Children | 0 (0.0%) | 0 (0.0%) |
| 3 or 4 Children | 0 (0.0%) | 0 (0.0%) |
| 5 or more Children | 0 (0.0%) | 0 (0.0%) |
| Total | 36 (100.0%) | 0 (0.0%) |
Income Below Poverty Among Single-Parent Households in Poole
| Children | Single Father | Single Mother |
| No Children | 0 (0.0%) | 0 (0.0%) |
| 1 or 2 Children | 0 (0.0%) | 0 (0.0%) |
| 3 or 4 Children | 0 (0.0%) | 0 (0.0%) |
| 5 or more Children | 0 (0.0%) | 0 (0.0%) |
| Total | 0 (0.0%) | 0 (0.0%) |
Income Below Poverty Among Married-Couple vs Single-Parent Households in Poole
| Children | Married-Couple Families | Single-Parent Households |
| No Children | 0 (0.0%) | 0 (0.0%) |
| 1 or 2 Children | 0 (0.0%) | 0 (0.0%) |
| 3 or 4 Children | 0 (0.0%) | 0 (0.0%) |
| 5 or more Children | 0 (0.0%) | 0 (0.0%) |
| Total | 0 (0.0%) | 0 (0.0%) |
Race in Poole
The most populous races in Poole are White / Caucasian (93 | 86.1%), and Two or more Races (15 | 13.9%).
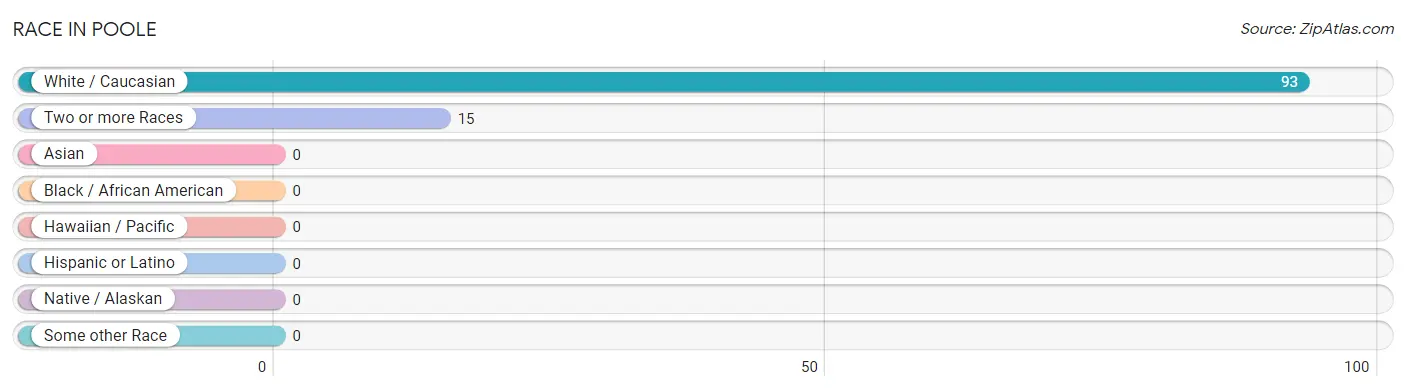
| Race | # Population | % Population |
| Asian | 0 | 0.0% |
| Black / African American | 0 | 0.0% |
| Hawaiian / Pacific | 0 | 0.0% |
| Hispanic or Latino | 0 | 0.0% |
| Native / Alaskan | 0 | 0.0% |
| White / Caucasian | 93 | 86.1% |
| Two or more Races | 15 | 13.9% |
| Some other Race | 0 | 0.0% |
| Total | 108 | 100.0% |
Ancestry in Poole
The most populous ancestries reported in Poole are Blackfeet (15 | 13.9%), Cherokee (15 | 13.9%), American (13 | 12.0%), Irish (6 | 5.6%), and Polish (6 | 5.6%), together accounting for 50.9% of all Poole residents.
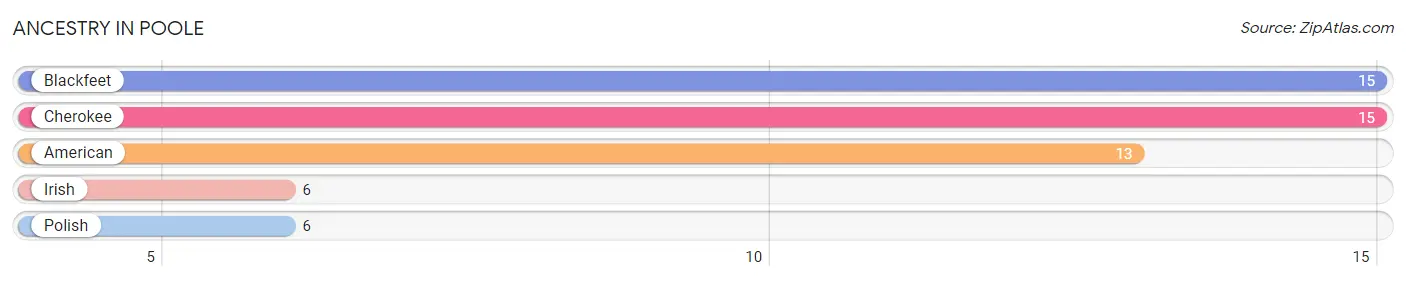
| Ancestry | # Population | % Population |
| American | 13 | 12.0% |
| Blackfeet | 15 | 13.9% |
| Cherokee | 15 | 13.9% |
| Irish | 6 | 5.6% |
| Polish | 6 | 5.6% | View All 5 Rows |
Immigrants in Poole

| Immigration Origin | # Population | % Population | View All 0 Rows |
Sex and Age in Poole
Sex and Age in Poole
The most populous age groups in Poole are 50 to 54 Years (15 | 34.1%) for men and 25 to 29 Years (25 | 39.1%) for women.
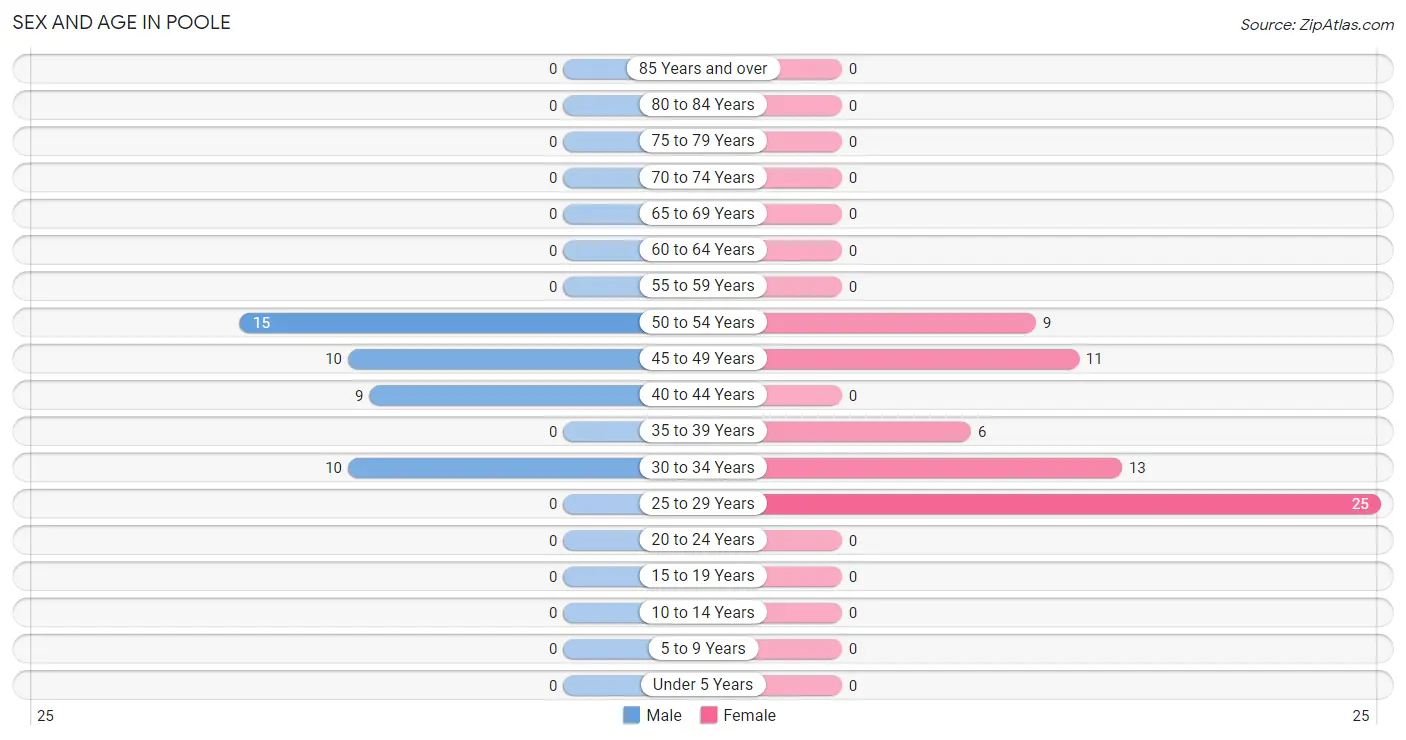
| Age Bracket | Male | Female |
| Under 5 Years | 0 (0.0%) | 0 (0.0%) |
| 5 to 9 Years | 0 (0.0%) | 0 (0.0%) |
| 10 to 14 Years | 0 (0.0%) | 0 (0.0%) |
| 15 to 19 Years | 0 (0.0%) | 0 (0.0%) |
| 20 to 24 Years | 0 (0.0%) | 0 (0.0%) |
| 25 to 29 Years | 0 (0.0%) | 25 (39.1%) |
| 30 to 34 Years | 10 (22.7%) | 13 (20.3%) |
| 35 to 39 Years | 0 (0.0%) | 6 (9.4%) |
| 40 to 44 Years | 9 (20.4%) | 0 (0.0%) |
| 45 to 49 Years | 10 (22.7%) | 11 (17.2%) |
| 50 to 54 Years | 15 (34.1%) | 9 (14.1%) |
| 55 to 59 Years | 0 (0.0%) | 0 (0.0%) |
| 60 to 64 Years | 0 (0.0%) | 0 (0.0%) |
| 65 to 69 Years | 0 (0.0%) | 0 (0.0%) |
| 70 to 74 Years | 0 (0.0%) | 0 (0.0%) |
| 75 to 79 Years | 0 (0.0%) | 0 (0.0%) |
| 80 to 84 Years | 0 (0.0%) | 0 (0.0%) |
| 85 Years and over | 0 (0.0%) | 0 (0.0%) |
| Total | 44 (100.0%) | 64 (100.0%) |
Families and Households in Poole
Median Family Size in Poole
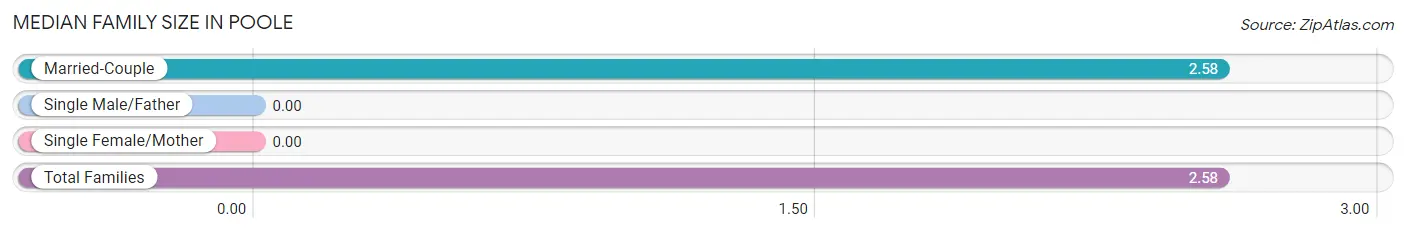
| Family Type | # Families | Family Size |
| Married-Couple | 36 (100.0%) | 2.58 |
| Single Male/Father | 0 (0.0%) | - |
| Single Female/Mother | 0 (0.0%) | - |
| Total Families | 36 (100.0%) | 2.58 |
Median Household Size in Poole
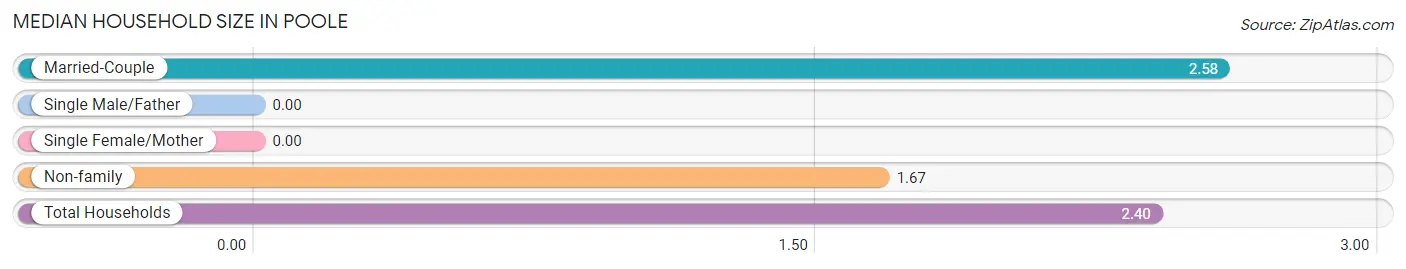
| Household Type | # Households | Household Size |
| Married-Couple | 36 (80.0%) | 2.58 |
| Single Male/Father | 0 (0.0%) | - |
| Single Female/Mother | 0 (0.0%) | - |
| Non-family | 9 (20.0%) | 1.67 |
| Total Households | 45 (100.0%) | 2.40 |
Household Size by Marriage Status in Poole
Out of a total of 45 households in Poole, 36 (80.0%) are family households, while 9 (20.0%) are nonfamily households. The most numerous type of family households are 2-person households, comprising 25, and the most common type of nonfamily households are 2-person households, comprising 9.
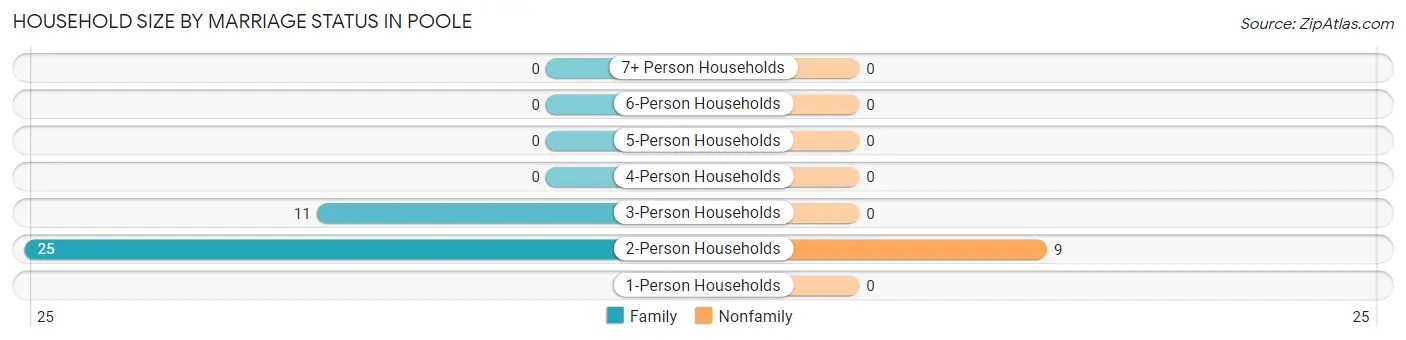
| Household Size | Family Households | Nonfamily Households |
| 1-Person Households | - | 0 (0.0%) |
| 2-Person Households | 25 (55.6%) | 9 (20.0%) |
| 3-Person Households | 11 (24.4%) | 0 (0.0%) |
| 4-Person Households | 0 (0.0%) | 0 (0.0%) |
| 5-Person Households | 0 (0.0%) | 0 (0.0%) |
| 6-Person Households | 0 (0.0%) | 0 (0.0%) |
| 7+ Person Households | 0 (0.0%) | 0 (0.0%) |
| Total | 36 (80.0%) | 9 (20.0%) |
Female Fertility in Poole
Fertility by Age in Poole
Average fertility rate in Poole is 200.0 births per 1,000 women. Women in the age bracket of 35 to 50 years have the highest fertility rate with 647.0 births per 1,000 women. Women in the age bracket of 35 to 50 years acount for 100.0% of all women with births.
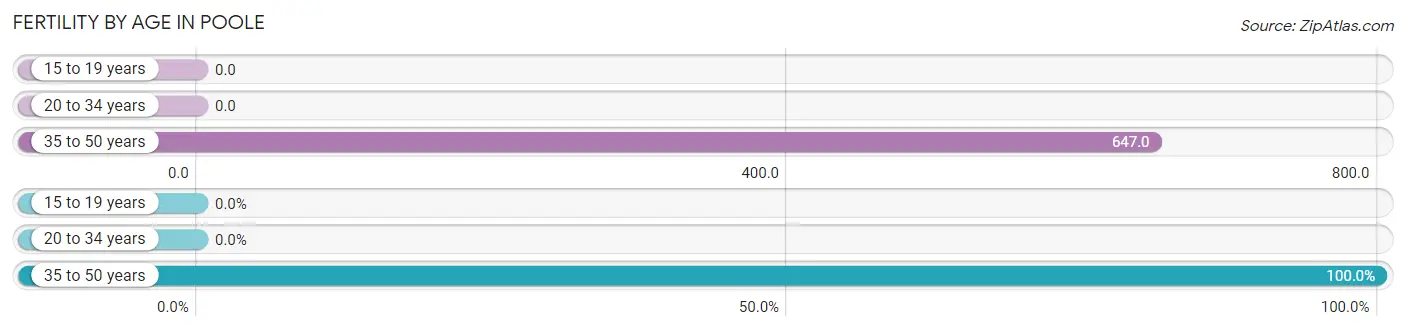
| Age Bracket | Women with Births | Births / 1,000 Women |
| 15 to 19 years | 0 (0.0%) | 0.0 |
| 20 to 34 years | 0 (0.0%) | 0.0 |
| 35 to 50 years | 11 (100.0%) | 647.0 |
| Total | 11 (100.0%) | 200.0 |
Fertility by Age by Marriage Status in Poole
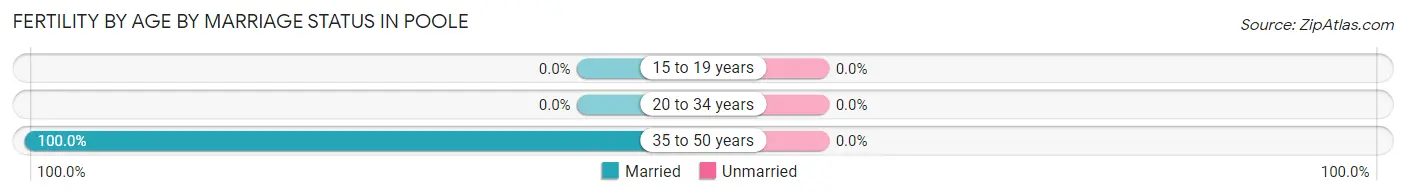
| Age Bracket | Married | Unmarried |
| 15 to 19 years | 0 (0.0%) | 0 (0.0%) |
| 20 to 34 years | 0 (0.0%) | 0 (0.0%) |
| 35 to 50 years | 11 (100.0%) | 0 (0.0%) |
| Total | 11 (100.0%) | 0 (0.0%) |
Fertility by Education in Poole
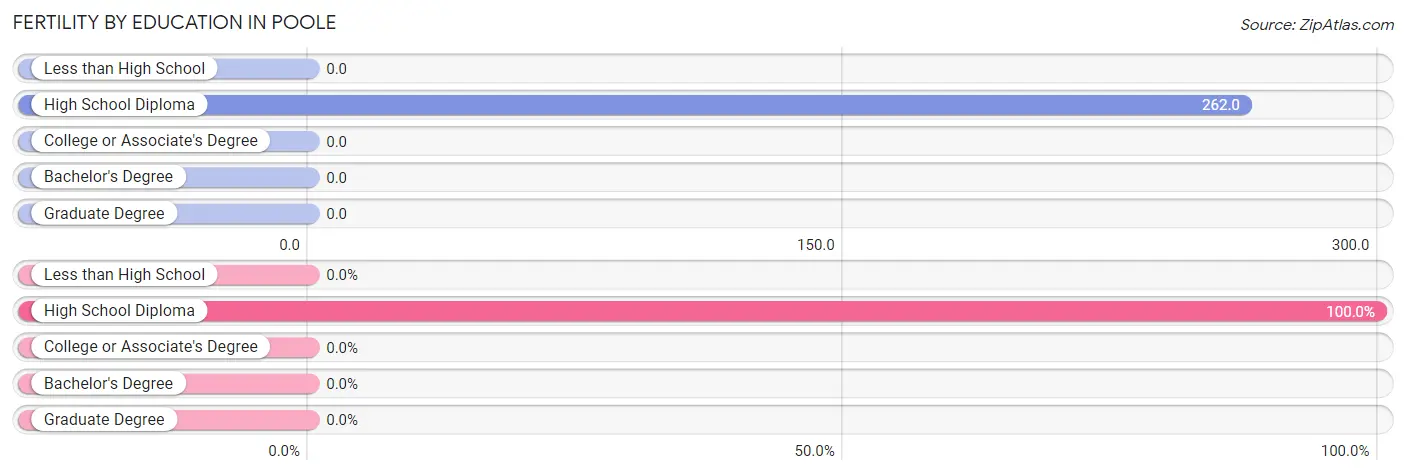
| Educational Attainment | Women with Births | Births / 1,000 Women |
| Less than High School | 0 (0.0%) | 0.0 |
| High School Diploma | 11 (100.0%) | 262.0 |
| College or Associate's Degree | 0 (0.0%) | 0.0 |
| Bachelor's Degree | 0 (0.0%) | 0.0 |
| Graduate Degree | 0 (0.0%) | 0.0 |
| Total | 11 (100.0%) | 200.0 |
Fertility by Education by Marriage Status in Poole
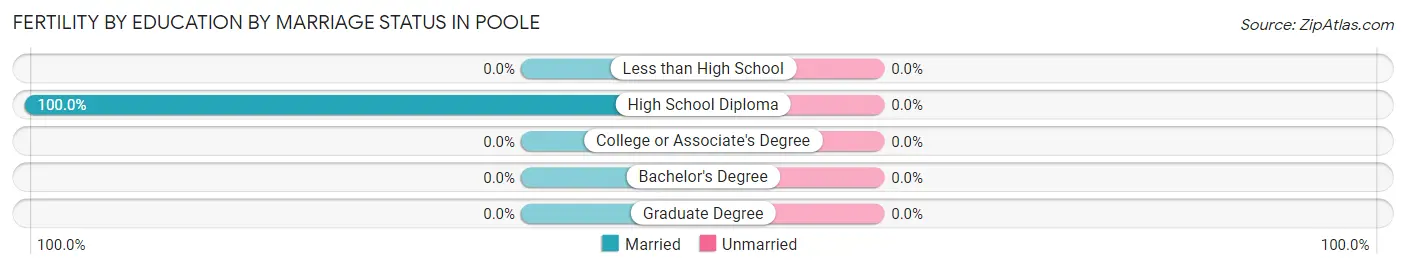
| Educational Attainment | Married | Unmarried |
| Less than High School | 0 (0.0%) | 0 (0.0%) |
| High School Diploma | 11 (100.0%) | 0 (0.0%) |
| College or Associate's Degree | 0 (0.0%) | 0 (0.0%) |
| Bachelor's Degree | 0 (0.0%) | 0 (0.0%) |
| Graduate Degree | 0 (0.0%) | 0 (0.0%) |
| Total | 11 (100.0%) | 0 (0.0%) |
Employment Characteristics in Poole
Employment by Class of Employer in Poole
Among the 95 employed individuals in Poole, private company employees (75 | 78.9%), local government employees (11 | 11.6%), and self-employed (not incorporated) (9 | 9.5%) make up the most common classes of employment.
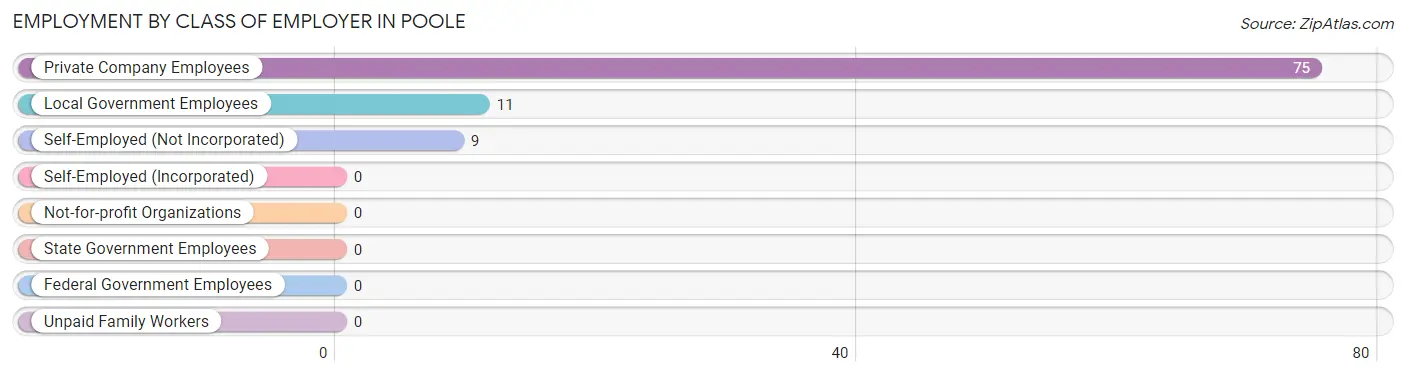
| Employer Class | # Employees | % Employees |
| Private Company Employees | 75 | 78.9% |
| Self-Employed (Incorporated) | 0 | 0.0% |
| Self-Employed (Not Incorporated) | 9 | 9.5% |
| Not-for-profit Organizations | 0 | 0.0% |
| Local Government Employees | 11 | 11.6% |
| State Government Employees | 0 | 0.0% |
| Federal Government Employees | 0 | 0.0% |
| Unpaid Family Workers | 0 | 0.0% |
| Total | 95 | 100.0% |
Employment Status by Age in Poole
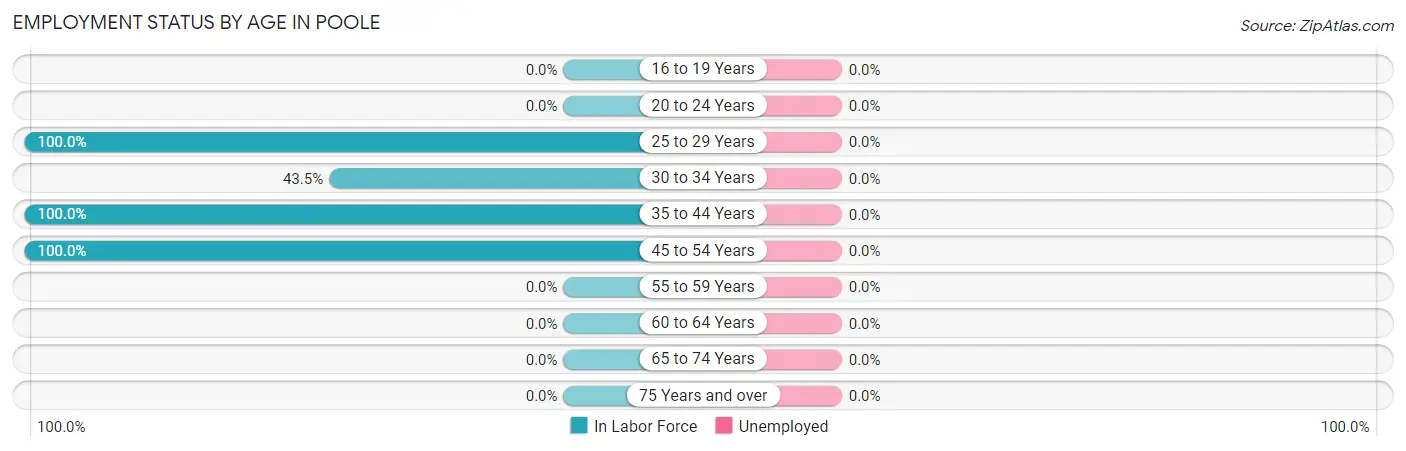
| Age Bracket | In Labor Force | Unemployed |
| 16 to 19 Years | 0 (0.0%) | 0 (0.0%) |
| 20 to 24 Years | 0 (0.0%) | 0 (0.0%) |
| 25 to 29 Years | 25 (100.0%) | 0 (0.0%) |
| 30 to 34 Years | 10 (43.5%) | 0 (0.0%) |
| 35 to 44 Years | 15 (100.0%) | 0 (0.0%) |
| 45 to 54 Years | 45 (100.0%) | 0 (0.0%) |
| 55 to 59 Years | 0 (0.0%) | 0 (0.0%) |
| 60 to 64 Years | 0 (0.0%) | 0 (0.0%) |
| 65 to 74 Years | 0 (0.0%) | 0 (0.0%) |
| 75 Years and over | 0 (0.0%) | 0 (0.0%) |
| Total | 95 (88.0%) | 0 (0.0%) |
Employment Status by Educational Attainment in Poole
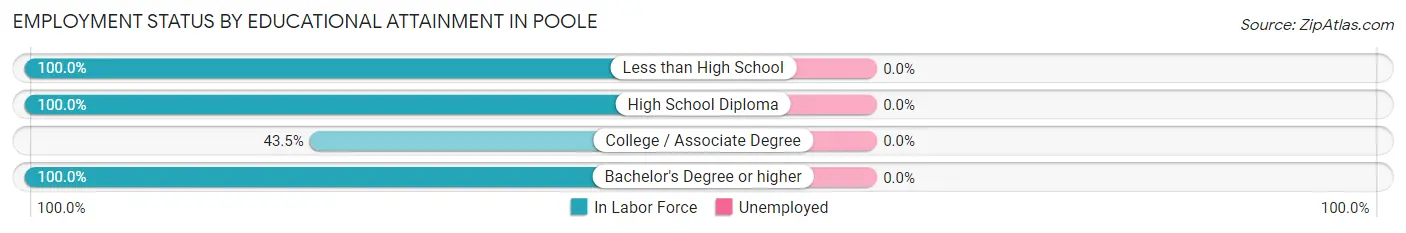
| Educational Attainment | In Labor Force | Unemployed |
| Less than High School | 9 (100.0%) | 0 (0.0%) |
| High School Diploma | 67 (100.0%) | 0 (0.0%) |
| College / Associate Degree | 10 (43.5%) | 0 (0.0%) |
| Bachelor's Degree or higher | 9 (100.0%) | 0 (0.0%) |
| Total | 95 (88.0%) | 0 (0.0%) |
Employment Occupations by Sex in Poole
Management, Business, Science and Arts Occupations
The most common Management, Business, Science and Arts occupations in Poole are , and Management (24 | 25.3%).
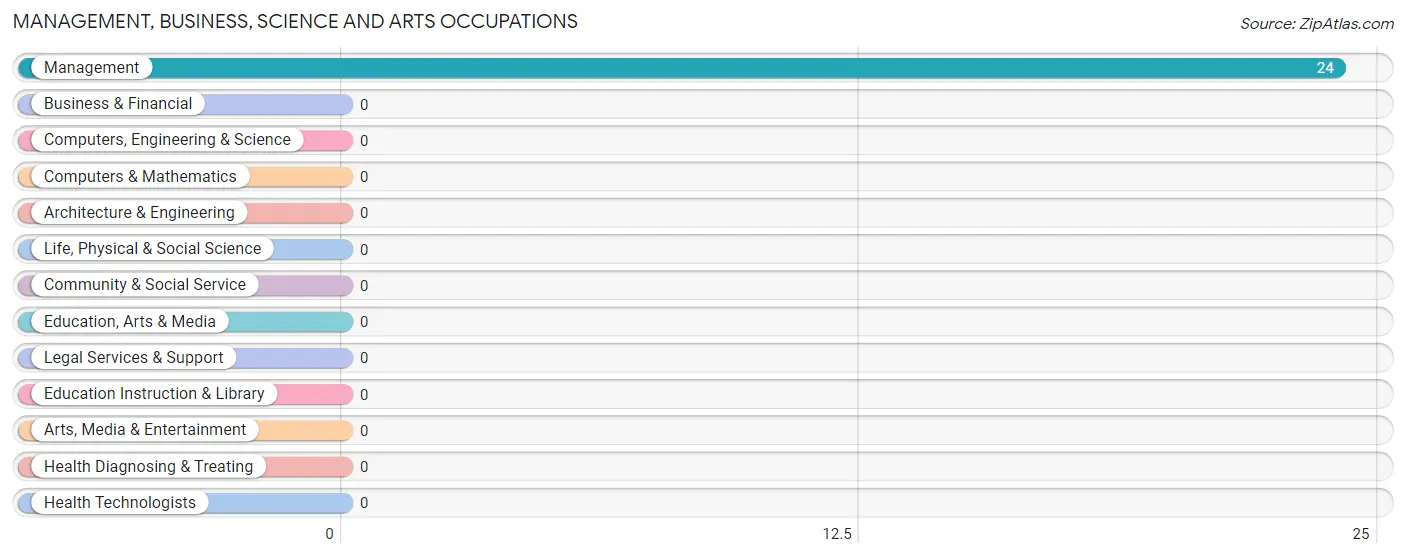
Management, Business, Science and Arts Occupations by Sex
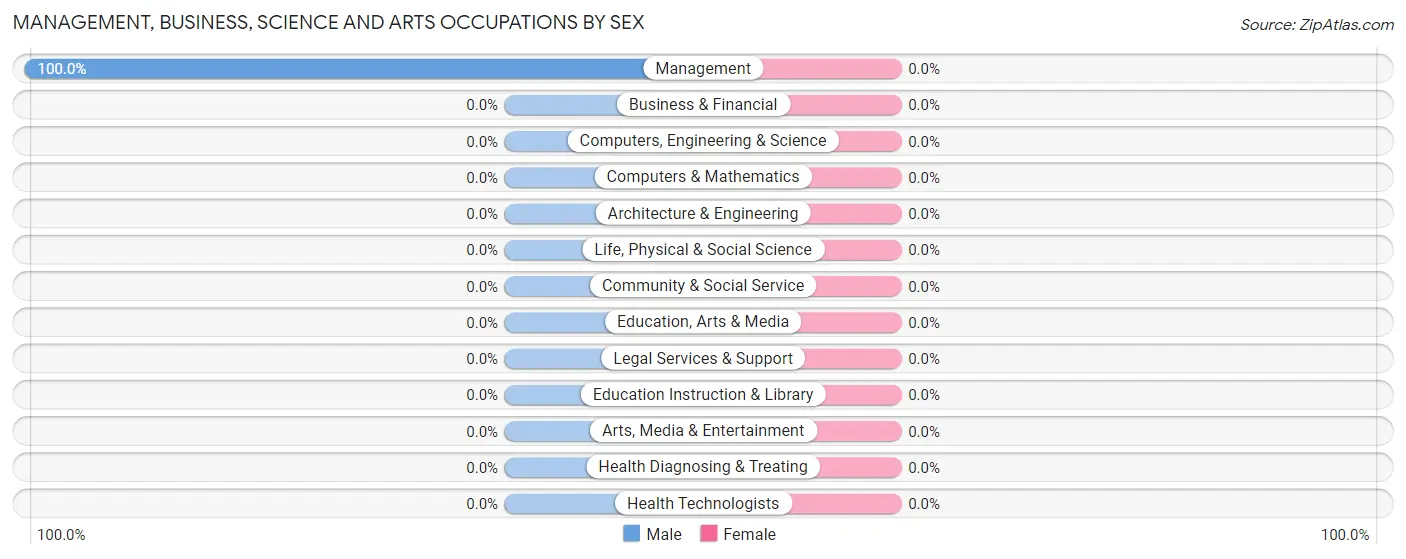
| Occupation | Male | Female |
| Management | 24 (100.0%) | 0 (0.0%) |
| Business & Financial | 0 (0.0%) | 0 (0.0%) |
| Computers, Engineering & Science | 0 (0.0%) | 0 (0.0%) |
| Computers & Mathematics | 0 (0.0%) | 0 (0.0%) |
| Architecture & Engineering | 0 (0.0%) | 0 (0.0%) |
| Life, Physical & Social Science | 0 (0.0%) | 0 (0.0%) |
| Community & Social Service | 0 (0.0%) | 0 (0.0%) |
| Education, Arts & Media | 0 (0.0%) | 0 (0.0%) |
| Legal Services & Support | 0 (0.0%) | 0 (0.0%) |
| Education Instruction & Library | 0 (0.0%) | 0 (0.0%) |
| Arts, Media & Entertainment | 0 (0.0%) | 0 (0.0%) |
| Health Diagnosing & Treating | 0 (0.0%) | 0 (0.0%) |
| Health Technologists | 0 (0.0%) | 0 (0.0%) |
| Total (Category) | 24 (100.0%) | 0 (0.0%) |
| Total (Overall) | 44 (46.3%) | 51 (53.7%) |
Services Occupations
The most common Services occupations in Poole are , and Cleaning & Maintenance (11 | 11.6%).
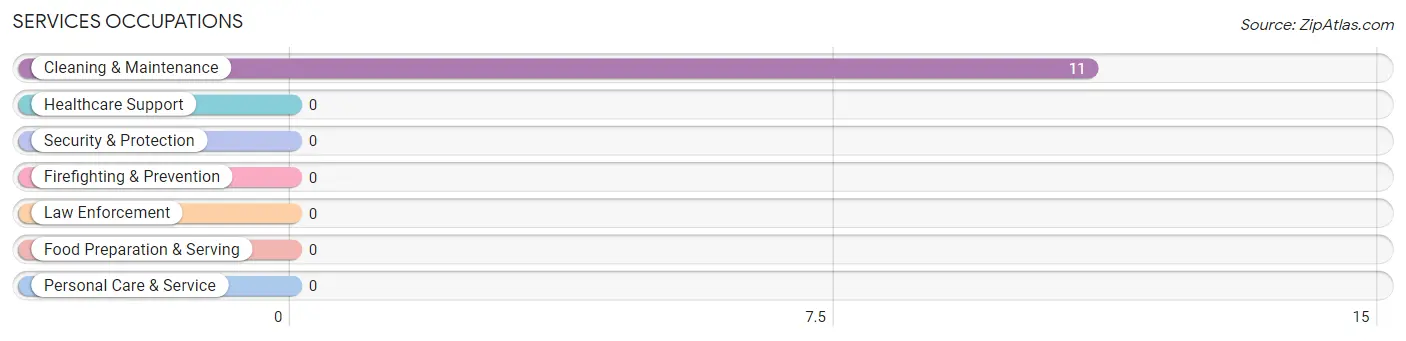
Services Occupations by Sex
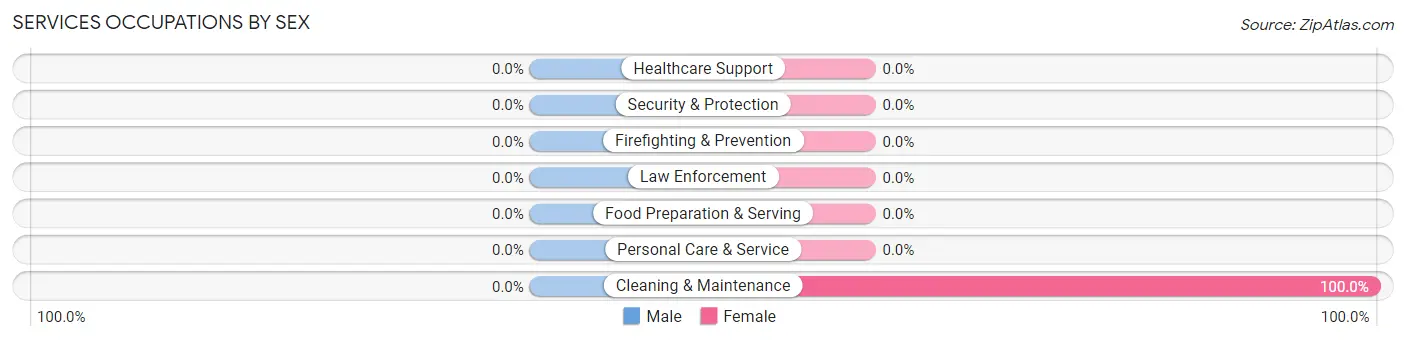
| Occupation | Male | Female |
| Healthcare Support | 0 (0.0%) | 0 (0.0%) |
| Security & Protection | 0 (0.0%) | 0 (0.0%) |
| Firefighting & Prevention | 0 (0.0%) | 0 (0.0%) |
| Law Enforcement | 0 (0.0%) | 0 (0.0%) |
| Food Preparation & Serving | 0 (0.0%) | 0 (0.0%) |
| Cleaning & Maintenance | 0 (0.0%) | 11 (100.0%) |
| Personal Care & Service | 0 (0.0%) | 0 (0.0%) |
| Total (Category) | 0 (0.0%) | 11 (100.0%) |
| Total (Overall) | 44 (46.3%) | 51 (53.7%) |
Sales and Office Occupations
The most common Sales and Office occupations in Poole are , and Sales & Related (9 | 9.5%).
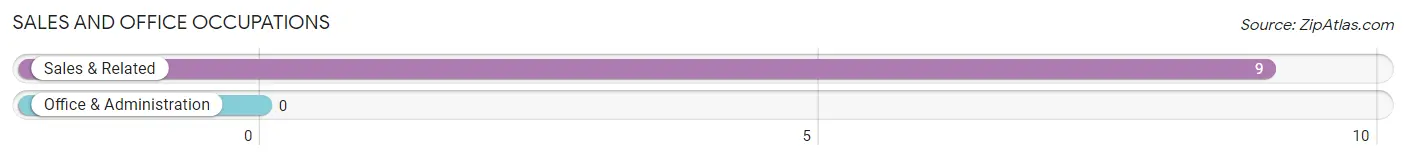
Sales and Office Occupations by Sex
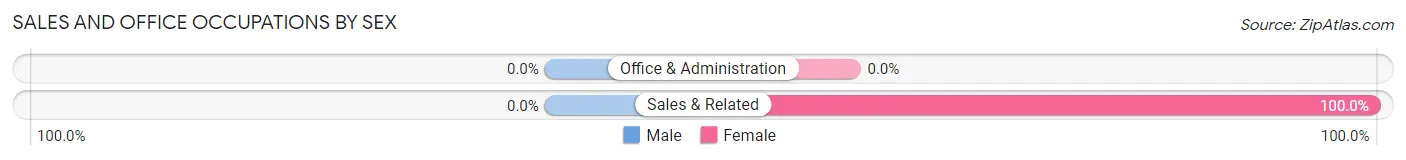
| Occupation | Male | Female |
| Sales & Related | 0 (0.0%) | 9 (100.0%) |
| Office & Administration | 0 (0.0%) | 0 (0.0%) |
| Total (Category) | 0 (0.0%) | 9 (100.0%) |
| Total (Overall) | 44 (46.3%) | 51 (53.7%) |
Natural Resources, Construction and Maintenance Occupations
The most common Natural Resources, Construction and Maintenance occupations in Poole are , and Construction & Extraction (6 | 6.3%).
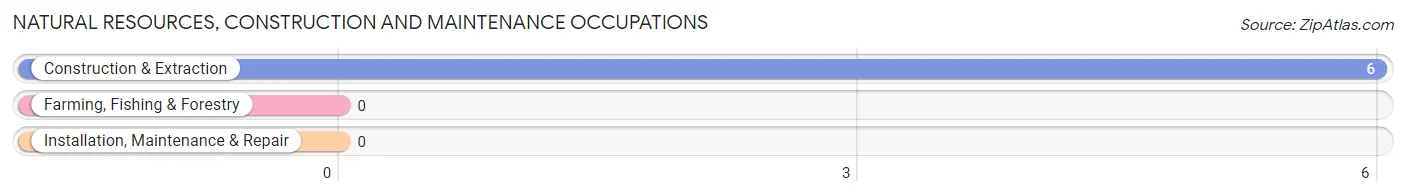
Natural Resources, Construction and Maintenance Occupations by Sex
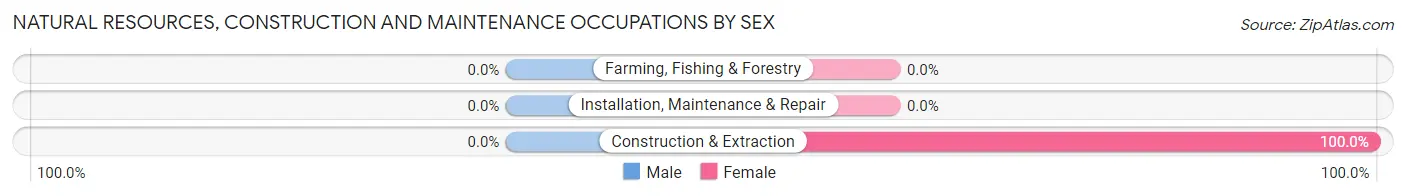
| Occupation | Male | Female |
| Farming, Fishing & Forestry | 0 (0.0%) | 0 (0.0%) |
| Construction & Extraction | 0 (0.0%) | 6 (100.0%) |
| Installation, Maintenance & Repair | 0 (0.0%) | 0 (0.0%) |
| Total (Category) | 0 (0.0%) | 6 (100.0%) |
| Total (Overall) | 44 (46.3%) | 51 (53.7%) |
Production, Transportation and Moving Occupations
The most common Production, Transportation and Moving occupations in Poole are Material Moving (25 | 26.3%), and Transportation (20 | 21.0%).
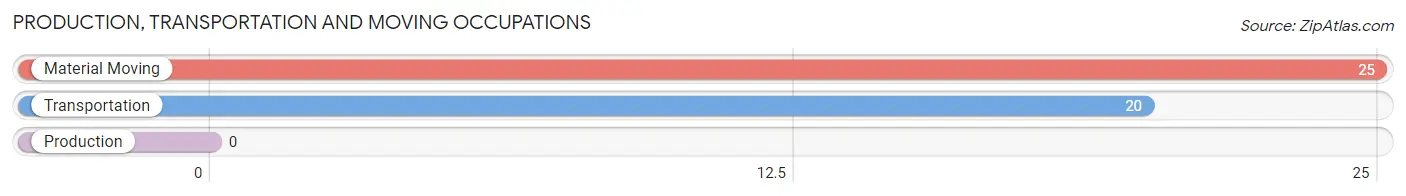
Production, Transportation and Moving Occupations by Sex
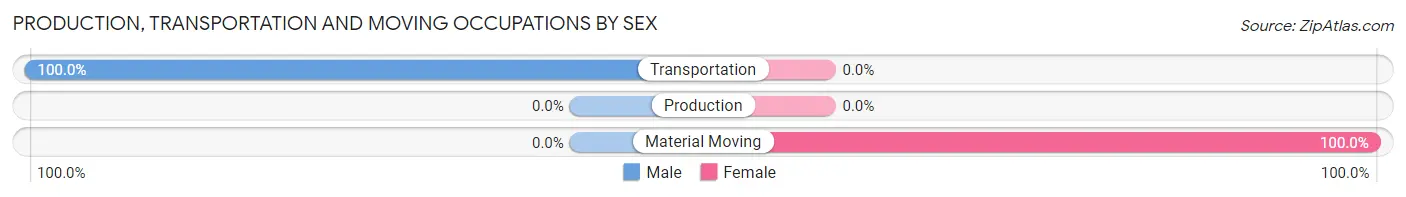
| Occupation | Male | Female |
| Production | 0 (0.0%) | 0 (0.0%) |
| Transportation | 20 (100.0%) | 0 (0.0%) |
| Material Moving | 0 (0.0%) | 25 (100.0%) |
| Total (Category) | 20 (44.4%) | 25 (55.6%) |
| Total (Overall) | 44 (46.3%) | 51 (53.7%) |
Employment Industries by Sex in Poole
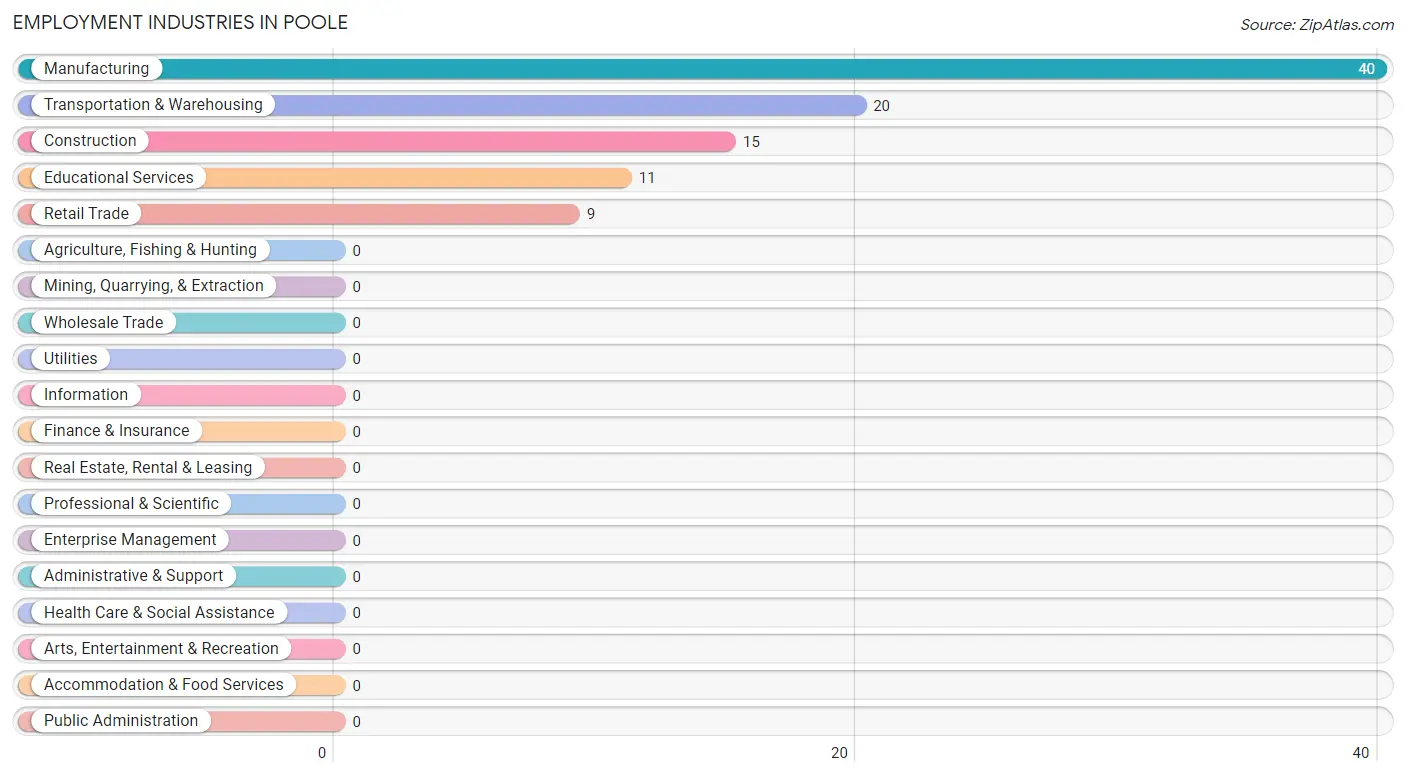
Employment Industries in Poole
The major employment industries in Poole include Manufacturing (40 | 42.1%), Transportation & Warehousing (20 | 21.0%), Construction (15 | 15.8%), Educational Services (11 | 11.6%), and Retail Trade (9 | 9.5%).
Employment Industries by Sex in Poole
The Poole industries that see more men than women are Transportation & Warehousing (100.0%), Construction (60.0%), and Manufacturing (37.5%), whereas the industries that tend to have a higher number of women are Retail Trade (100.0%), Educational Services (100.0%), and Manufacturing (62.5%).
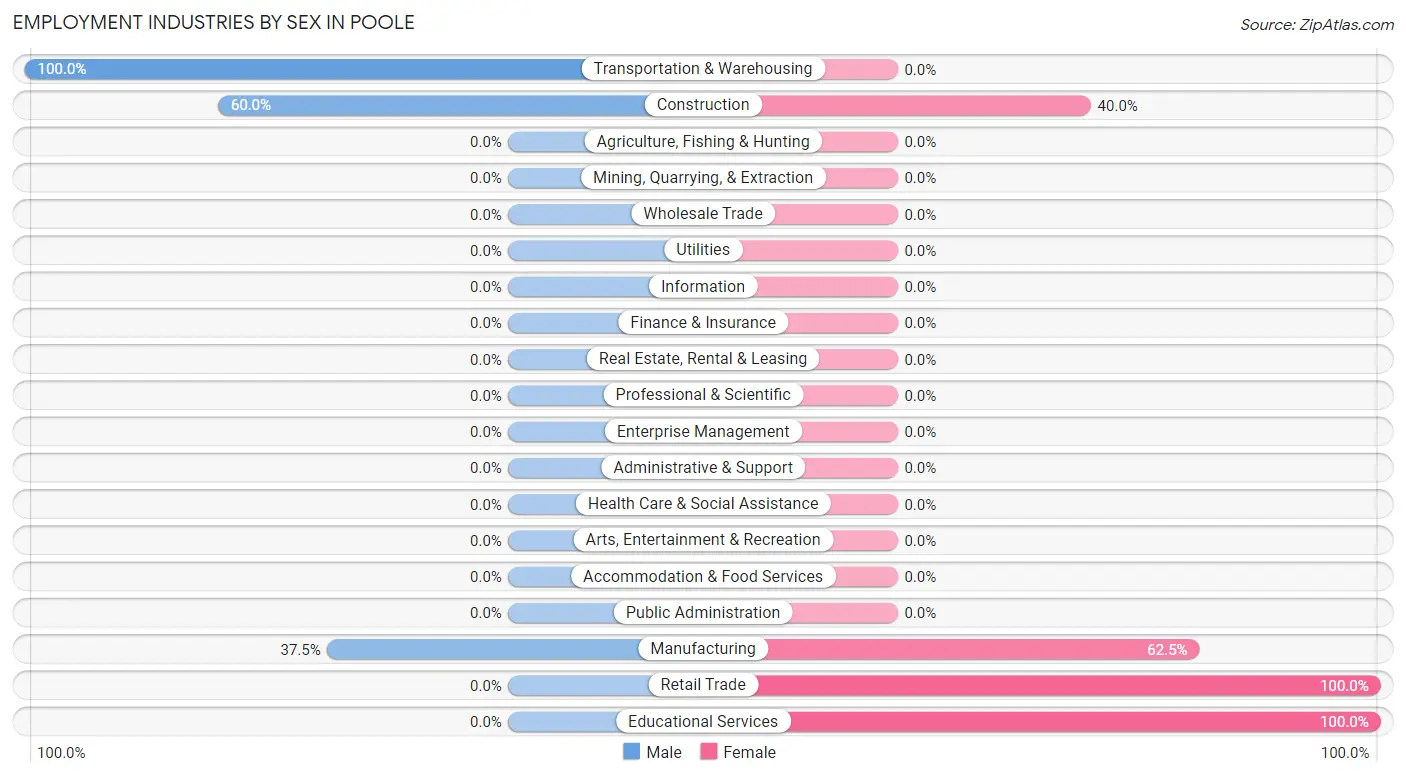
| Industry | Male | Female |
| Agriculture, Fishing & Hunting | 0 (0.0%) | 0 (0.0%) |
| Mining, Quarrying, & Extraction | 0 (0.0%) | 0 (0.0%) |
| Construction | 9 (60.0%) | 6 (40.0%) |
| Manufacturing | 15 (37.5%) | 25 (62.5%) |
| Wholesale Trade | 0 (0.0%) | 0 (0.0%) |
| Retail Trade | 0 (0.0%) | 9 (100.0%) |
| Transportation & Warehousing | 20 (100.0%) | 0 (0.0%) |
| Utilities | 0 (0.0%) | 0 (0.0%) |
| Information | 0 (0.0%) | 0 (0.0%) |
| Finance & Insurance | 0 (0.0%) | 0 (0.0%) |
| Real Estate, Rental & Leasing | 0 (0.0%) | 0 (0.0%) |
| Professional & Scientific | 0 (0.0%) | 0 (0.0%) |
| Enterprise Management | 0 (0.0%) | 0 (0.0%) |
| Administrative & Support | 0 (0.0%) | 0 (0.0%) |
| Educational Services | 0 (0.0%) | 11 (100.0%) |
| Health Care & Social Assistance | 0 (0.0%) | 0 (0.0%) |
| Arts, Entertainment & Recreation | 0 (0.0%) | 0 (0.0%) |
| Accommodation & Food Services | 0 (0.0%) | 0 (0.0%) |
| Public Administration | 0 (0.0%) | 0 (0.0%) |
| Total | 44 (46.3%) | 51 (53.7%) |
Education in Poole
School Enrollment in Poole
| School Level | # Students | % Students |
| Nursery / Preschool | 0 | 0.0% |
| Kindergarten | 0 | 0.0% |
| Elementary School | 0 | 0.0% |
| Middle School | 0 | 0.0% |
| High School | 0 | 0.0% |
| College / Undergraduate | 0 | 0.0% |
| Graduate / Professional | 0 | 0.0% |
| Total | 0 | 0.0% |
School Enrollment by Age by Funding Source in Poole
| Age Bracket | Public School | Private School |
| 3 to 4 Year Olds | 0 (0.0%) | 0 (0.0%) |
| 5 to 9 Year Old | 0 (0.0%) | 0 (0.0%) |
| 10 to 14 Year Olds | 0 (0.0%) | 0 (0.0%) |
| 15 to 17 Year Olds | 0 (0.0%) | 0 (0.0%) |
| 18 to 19 Year Olds | 0 (0.0%) | 0 (0.0%) |
| 20 to 24 Year Olds | 0 (0.0%) | 0 (0.0%) |
| 25 to 34 Year Olds | 0 (0.0%) | 0 (0.0%) |
| 35 Years and over | 0 (0.0%) | 0 (0.0%) |
| Total | 0 (0.0%) | 0 (0.0%) |
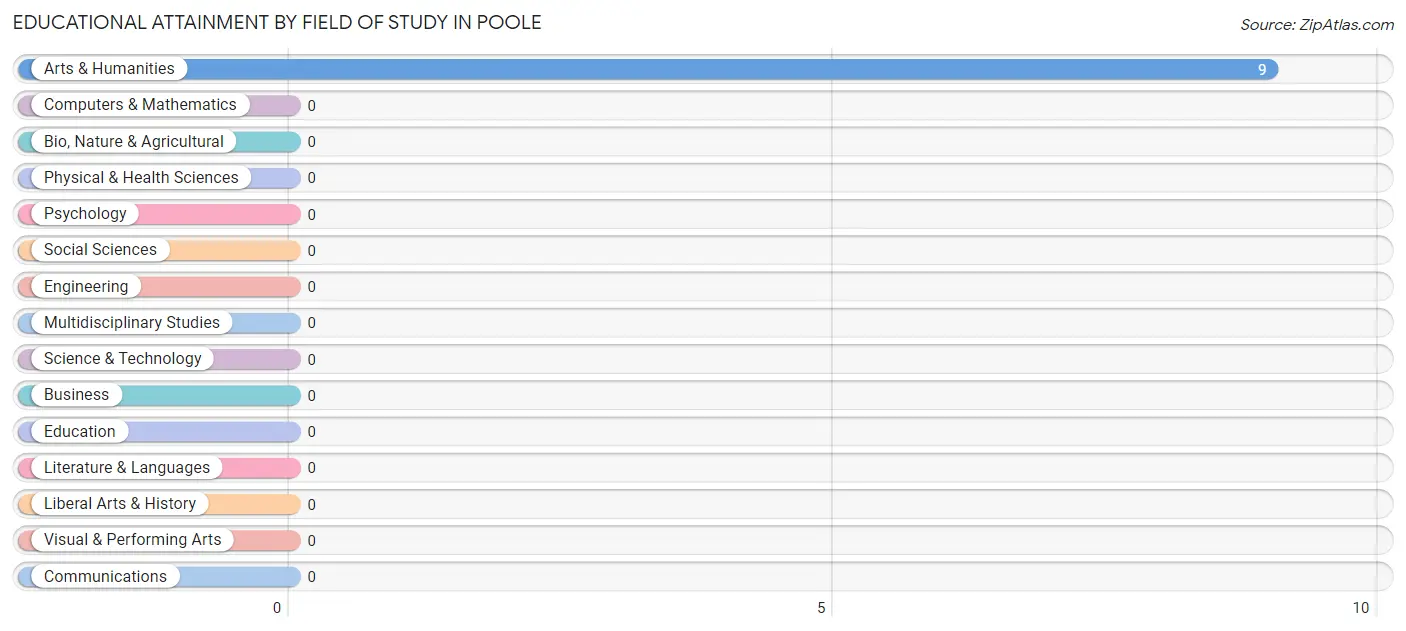
Educational Attainment by Field of Study in Poole
, and arts & humanities (9 | 100.0%) are the most common fields of study among 9 individuals in Poole who have obtained a bachelor's degree or higher.
| Field of Study | # Graduates | % Graduates |
| Computers & Mathematics | 0 | 0.0% |
| Bio, Nature & Agricultural | 0 | 0.0% |
| Physical & Health Sciences | 0 | 0.0% |
| Psychology | 0 | 0.0% |
| Social Sciences | 0 | 0.0% |
| Engineering | 0 | 0.0% |
| Multidisciplinary Studies | 0 | 0.0% |
| Science & Technology | 0 | 0.0% |
| Business | 0 | 0.0% |
| Education | 0 | 0.0% |
| Literature & Languages | 0 | 0.0% |
| Liberal Arts & History | 0 | 0.0% |
| Visual & Performing Arts | 0 | 0.0% |
| Communications | 0 | 0.0% |
| Arts & Humanities | 9 | 100.0% |
| Total | 9 | 100.0% |
Transportation & Commute in Poole
Vehicle Availability by Sex in Poole
The most prevalent vehicle ownership categories in Poole are males with 3 vehicles (25, accounting for 56.8%) and females with 3 vehicles (9, making up 49.0%).
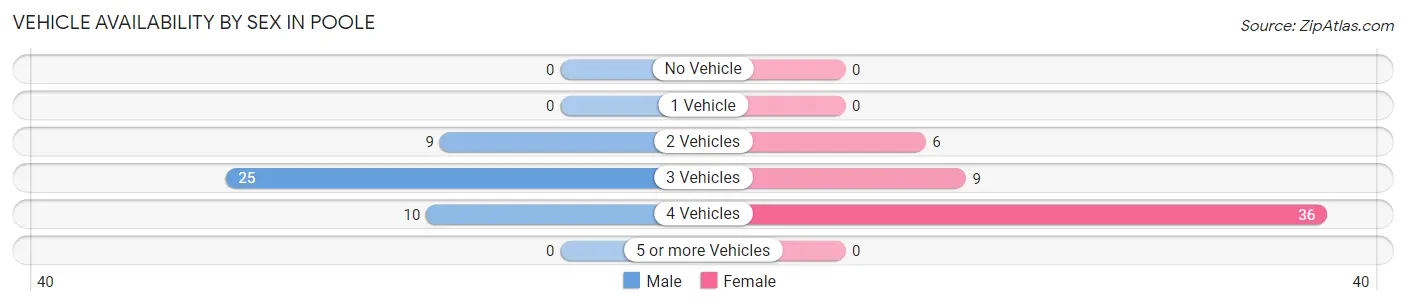
| Vehicles Available | Male | Female |
| No Vehicle | 0 (0.0%) | 0 (0.0%) |
| 1 Vehicle | 0 (0.0%) | 0 (0.0%) |
| 2 Vehicles | 9 (20.4%) | 6 (11.8%) |
| 3 Vehicles | 25 (56.8%) | 9 (17.6%) |
| 4 Vehicles | 10 (22.7%) | 36 (70.6%) |
| 5 or more Vehicles | 0 (0.0%) | 0 (0.0%) |
| Total | 44 (100.0%) | 51 (100.0%) |
Commute Time in Poole
The most frequently occuring commute durations in Poole are 5 to 9 minutes (25 commuters, 29.1%), 20 to 24 minutes (21 commuters, 24.4%), and 45 to 59 minutes (15 commuters, 17.4%).
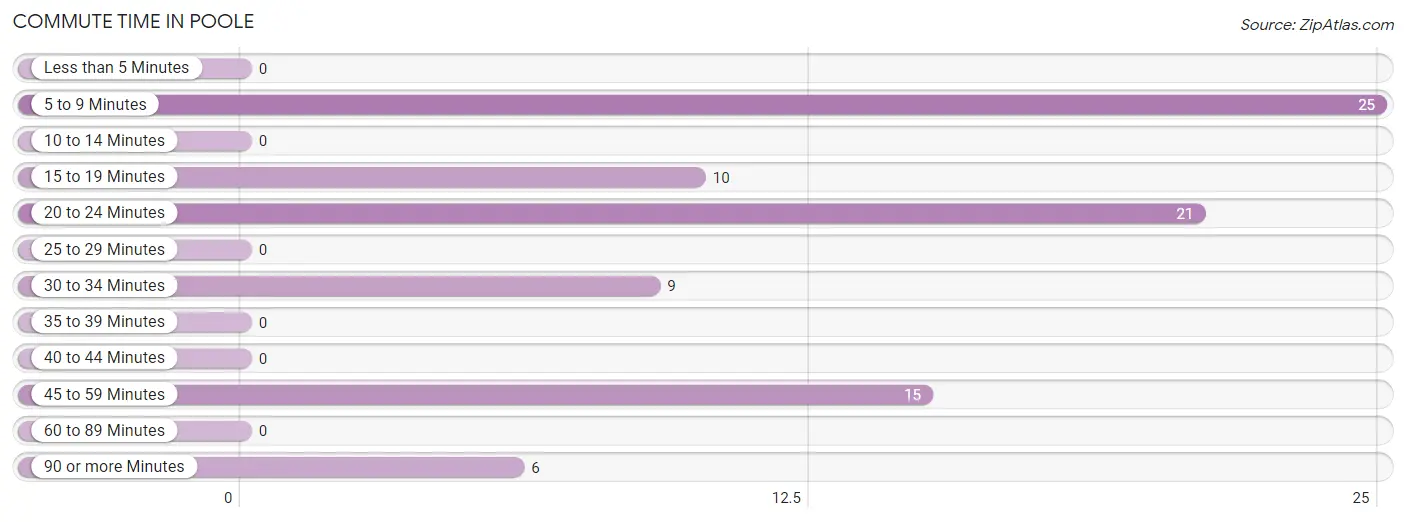
| Commute Time | # Commuters | % Commuters |
| Less than 5 Minutes | 0 | 0.0% |
| 5 to 9 Minutes | 25 | 29.1% |
| 10 to 14 Minutes | 0 | 0.0% |
| 15 to 19 Minutes | 10 | 11.6% |
| 20 to 24 Minutes | 21 | 24.4% |
| 25 to 29 Minutes | 0 | 0.0% |
| 30 to 34 Minutes | 9 | 10.5% |
| 35 to 39 Minutes | 0 | 0.0% |
| 40 to 44 Minutes | 0 | 0.0% |
| 45 to 59 Minutes | 15 | 17.4% |
| 60 to 89 Minutes | 0 | 0.0% |
| 90 or more Minutes | 6 | 7.0% |
Commute Time by Sex in Poole
The most common commute times in Poole are 45 to 59 minutes (15 commuters, 42.9%) for males and 5 to 9 minutes (25 commuters, 49.0%) for females.
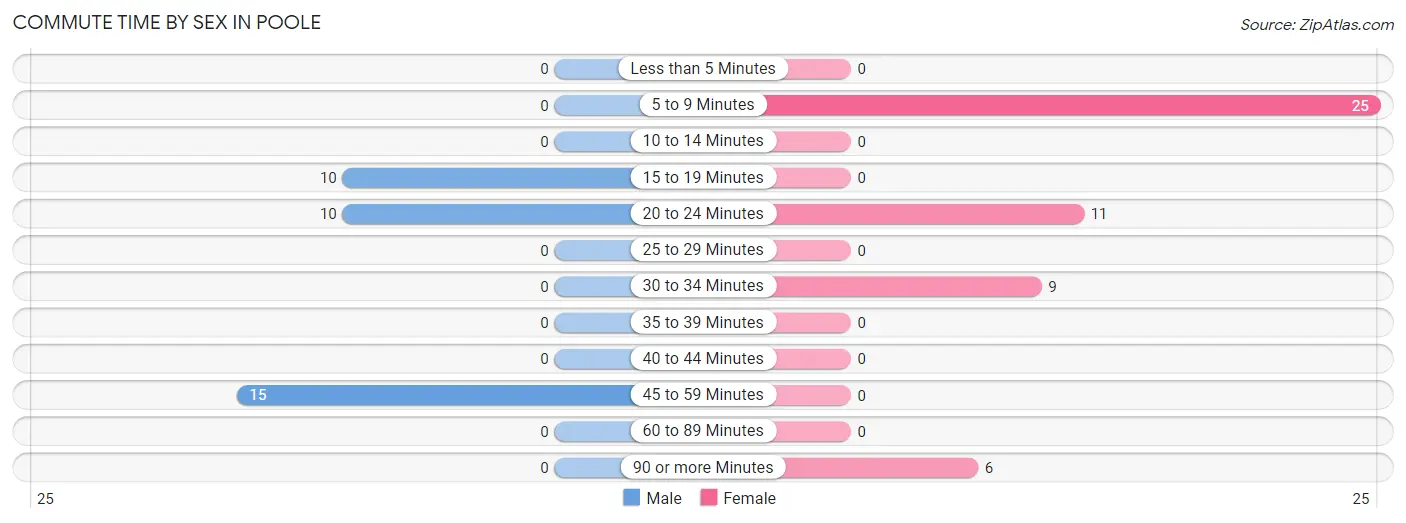
| Commute Time | Male | Female |
| Less than 5 Minutes | 0 (0.0%) | 0 (0.0%) |
| 5 to 9 Minutes | 0 (0.0%) | 25 (49.0%) |
| 10 to 14 Minutes | 0 (0.0%) | 0 (0.0%) |
| 15 to 19 Minutes | 10 (28.6%) | 0 (0.0%) |
| 20 to 24 Minutes | 10 (28.6%) | 11 (21.6%) |
| 25 to 29 Minutes | 0 (0.0%) | 0 (0.0%) |
| 30 to 34 Minutes | 0 (0.0%) | 9 (17.6%) |
| 35 to 39 Minutes | 0 (0.0%) | 0 (0.0%) |
| 40 to 44 Minutes | 0 (0.0%) | 0 (0.0%) |
| 45 to 59 Minutes | 15 (42.9%) | 0 (0.0%) |
| 60 to 89 Minutes | 0 (0.0%) | 0 (0.0%) |
| 90 or more Minutes | 0 (0.0%) | 6 (11.8%) |
Time of Departure to Work by Sex in Poole
The most frequent times of departure to work in Poole are 6:30 AM to 6:59 AM (15, 42.9%) for males and 5:30 AM to 5:59 AM (36, 70.6%) for females.
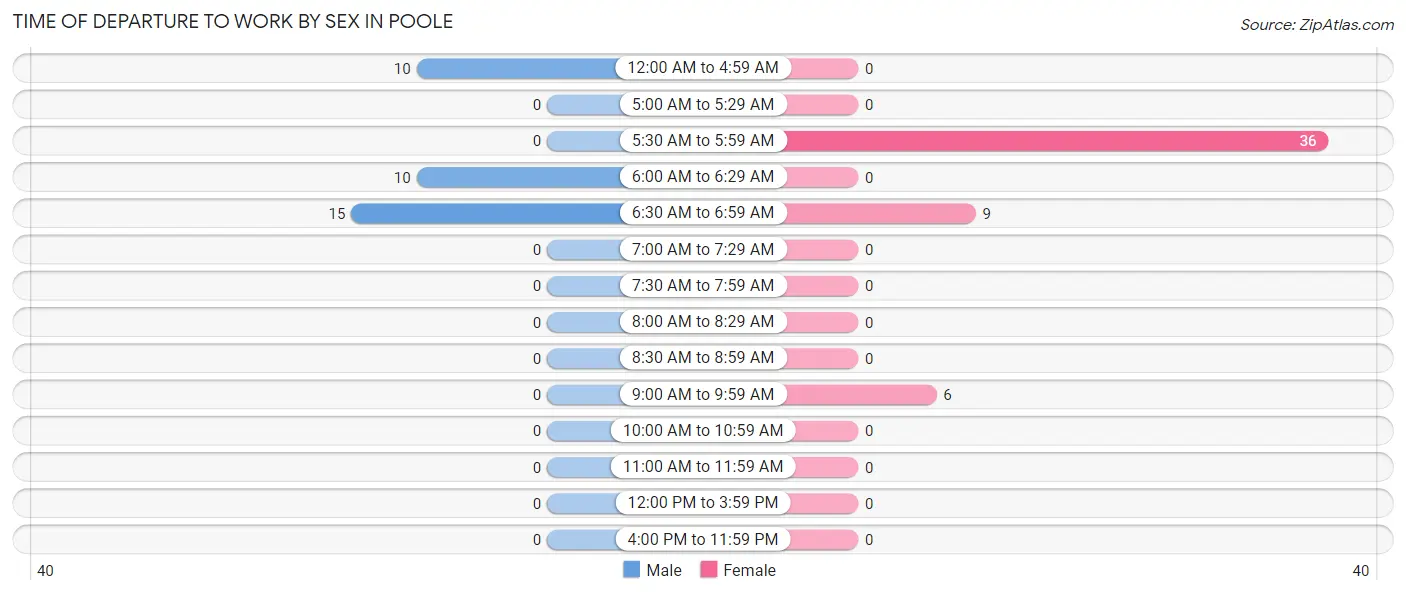
| Time of Departure | Male | Female |
| 12:00 AM to 4:59 AM | 10 (28.6%) | 0 (0.0%) |
| 5:00 AM to 5:29 AM | 0 (0.0%) | 0 (0.0%) |
| 5:30 AM to 5:59 AM | 0 (0.0%) | 36 (70.6%) |
| 6:00 AM to 6:29 AM | 10 (28.6%) | 0 (0.0%) |
| 6:30 AM to 6:59 AM | 15 (42.9%) | 9 (17.6%) |
| 7:00 AM to 7:29 AM | 0 (0.0%) | 0 (0.0%) |
| 7:30 AM to 7:59 AM | 0 (0.0%) | 0 (0.0%) |
| 8:00 AM to 8:29 AM | 0 (0.0%) | 0 (0.0%) |
| 8:30 AM to 8:59 AM | 0 (0.0%) | 0 (0.0%) |
| 9:00 AM to 9:59 AM | 0 (0.0%) | 6 (11.8%) |
| 10:00 AM to 10:59 AM | 0 (0.0%) | 0 (0.0%) |
| 11:00 AM to 11:59 AM | 0 (0.0%) | 0 (0.0%) |
| 12:00 PM to 3:59 PM | 0 (0.0%) | 0 (0.0%) |
| 4:00 PM to 11:59 PM | 0 (0.0%) | 0 (0.0%) |
| Total | 35 (100.0%) | 51 (100.0%) |
Housing Occupancy in Poole
Occupancy by Ownership in Poole
Of the total 45 dwellings in Poole, owner-occupied units account for 35 (77.8%), while renter-occupied units make up 10 (22.2%).
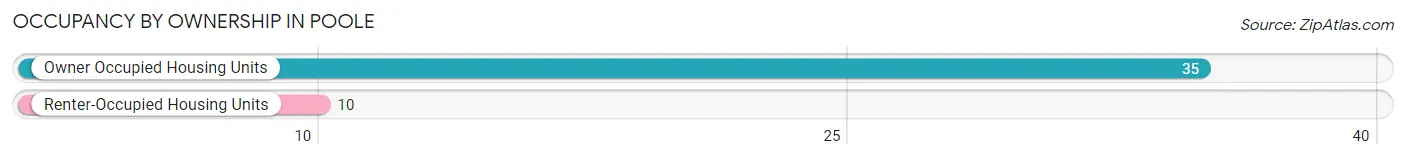
| Occupancy | # Housing Units | % Housing Units |
| Owner Occupied Housing Units | 35 | 77.8% |
| Renter-Occupied Housing Units | 10 | 22.2% |
| Total Occupied Housing Units | 45 | 100.0% |
Occupancy by Household Size in Poole
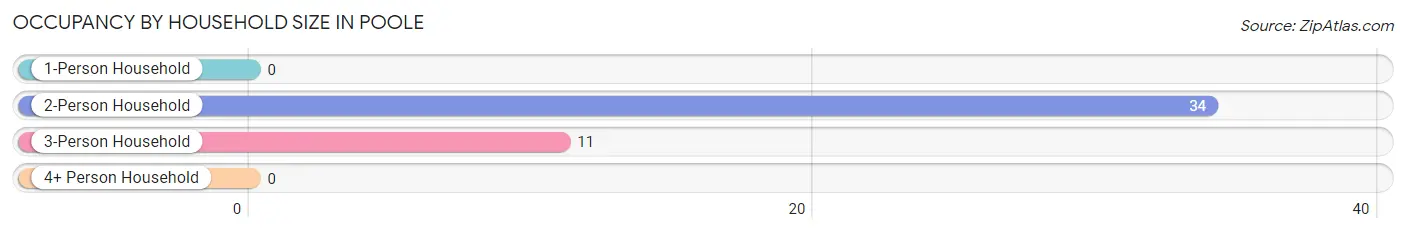
| Household Size | # Housing Units | % Housing Units |
| 1-Person Household | 0 | 0.0% |
| 2-Person Household | 34 | 75.6% |
| 3-Person Household | 11 | 24.4% |
| 4+ Person Household | 0 | 0.0% |
| Total Housing Units | 45 | 100.0% |
Occupancy by Ownership by Household Size in Poole
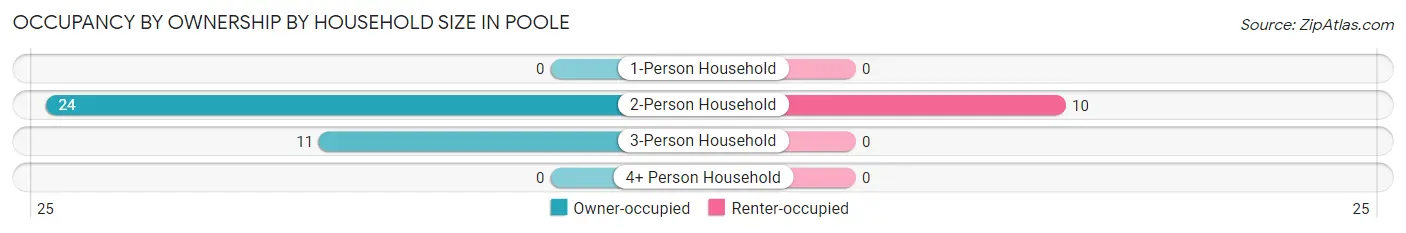
| Household Size | Owner-occupied | Renter-occupied |
| 1-Person Household | 0 (0.0%) | 0 (0.0%) |
| 2-Person Household | 24 (70.6%) | 10 (29.4%) |
| 3-Person Household | 11 (100.0%) | 0 (0.0%) |
| 4+ Person Household | 0 (0.0%) | 0 (0.0%) |
| Total Housing Units | 35 (77.8%) | 10 (22.2%) |
Occupancy by Educational Attainment in Poole
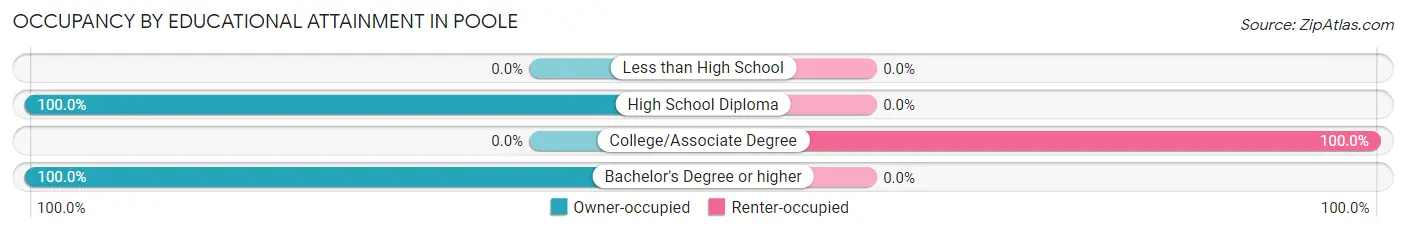
| Household Size | Owner-occupied | Renter-occupied |
| Less than High School | 0 (0.0%) | 0 (0.0%) |
| High School Diploma | 26 (100.0%) | 0 (0.0%) |
| College/Associate Degree | 0 (0.0%) | 10 (100.0%) |
| Bachelor's Degree or higher | 9 (100.0%) | 0 (0.0%) |
Occupancy by Age of Householder in Poole
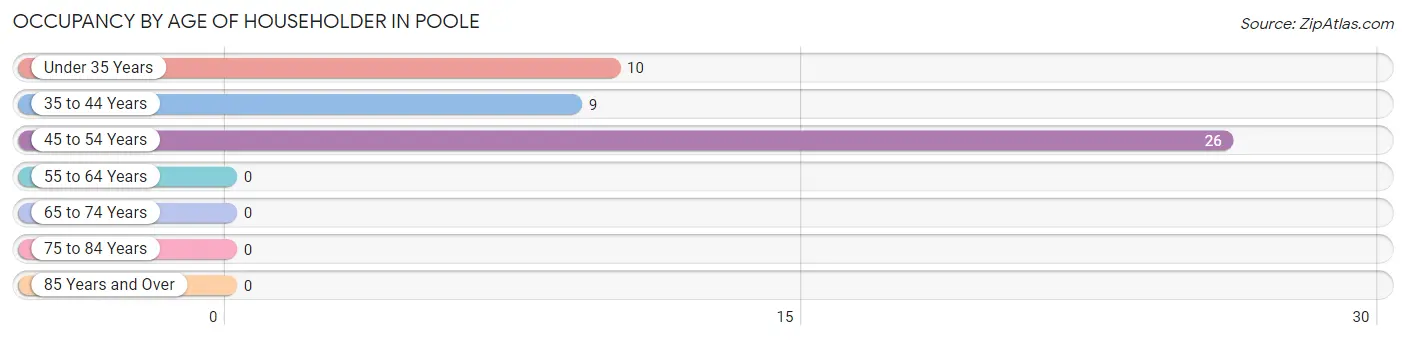
| Age Bracket | # Households | % Households |
| Under 35 Years | 10 | 22.2% |
| 35 to 44 Years | 9 | 20.0% |
| 45 to 54 Years | 26 | 57.8% |
| 55 to 64 Years | 0 | 0.0% |
| 65 to 74 Years | 0 | 0.0% |
| 75 to 84 Years | 0 | 0.0% |
| 85 Years and Over | 0 | 0.0% |
| Total | 45 | 100.0% |
Housing Finances in Poole
Median Income by Occupancy in Poole
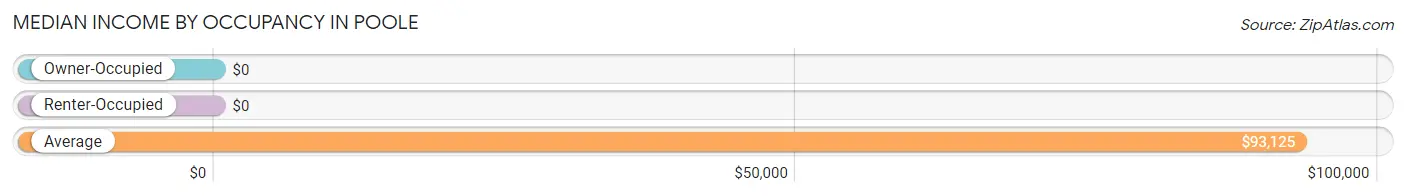
| Occupancy Type | # Households | Median Income |
| Owner-Occupied | 35 (77.8%) | $0 |
| Renter-Occupied | 10 (22.2%) | $0 |
| Average | 45 (100.0%) | $93,125 |
Occupancy by Householder Income Bracket in Poole
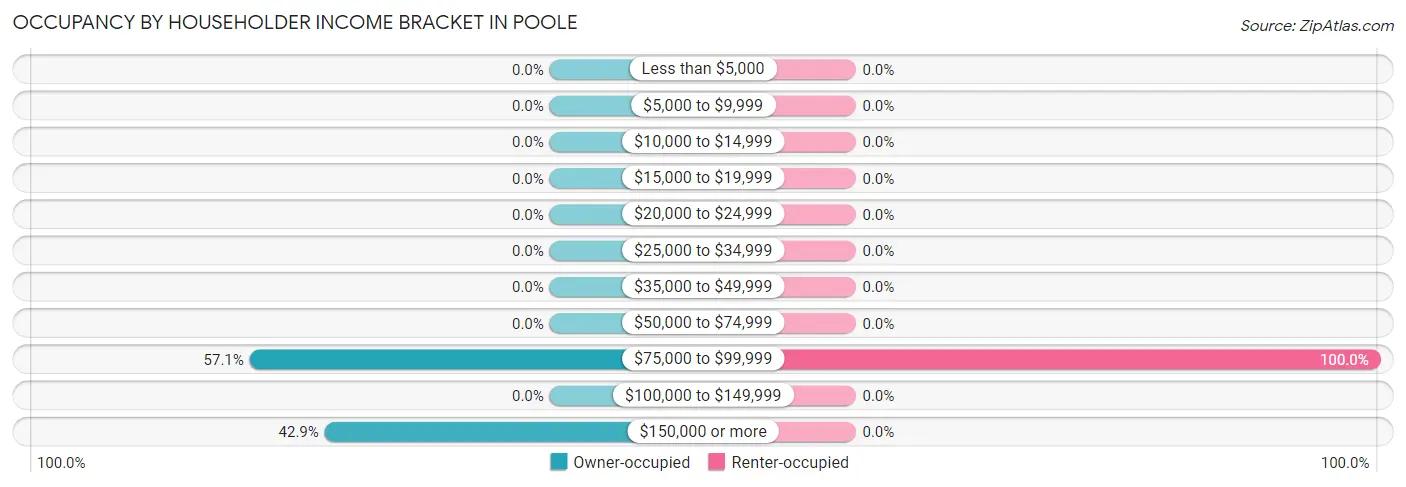
| Income Bracket | Owner-occupied | Renter-occupied |
| Less than $5,000 | 0 (0.0%) | 0 (0.0%) |
| $5,000 to $9,999 | 0 (0.0%) | 0 (0.0%) |
| $10,000 to $14,999 | 0 (0.0%) | 0 (0.0%) |
| $15,000 to $19,999 | 0 (0.0%) | 0 (0.0%) |
| $20,000 to $24,999 | 0 (0.0%) | 0 (0.0%) |
| $25,000 to $34,999 | 0 (0.0%) | 0 (0.0%) |
| $35,000 to $49,999 | 0 (0.0%) | 0 (0.0%) |
| $50,000 to $74,999 | 0 (0.0%) | 0 (0.0%) |
| $75,000 to $99,999 | 20 (57.1%) | 10 (100.0%) |
| $100,000 to $149,999 | 0 (0.0%) | 0 (0.0%) |
| $150,000 or more | 15 (42.9%) | 0 (0.0%) |
| Total | 35 (100.0%) | 10 (100.0%) |
Monthly Housing Cost Tiers in Poole
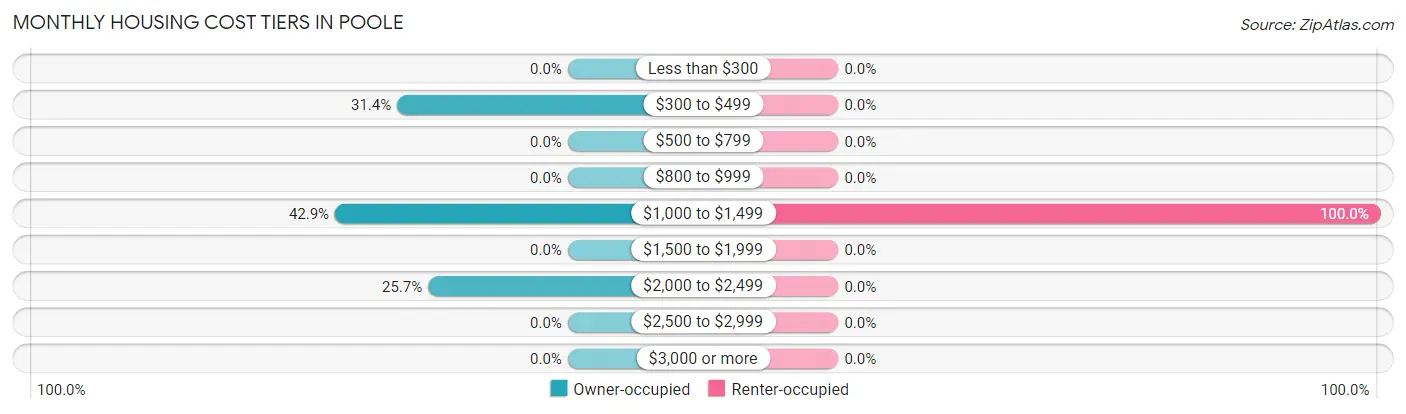
| Monthly Cost | Owner-occupied | Renter-occupied |
| Less than $300 | 0 (0.0%) | 0 (0.0%) |
| $300 to $499 | 11 (31.4%) | 0 (0.0%) |
| $500 to $799 | 0 (0.0%) | 0 (0.0%) |
| $800 to $999 | 0 (0.0%) | 0 (0.0%) |
| $1,000 to $1,499 | 15 (42.9%) | 10 (100.0%) |
| $1,500 to $1,999 | 0 (0.0%) | 0 (0.0%) |
| $2,000 to $2,499 | 9 (25.7%) | 0 (0.0%) |
| $2,500 to $2,999 | 0 (0.0%) | 0 (0.0%) |
| $3,000 or more | 0 (0.0%) | 0 (0.0%) |
| Total | 35 (100.0%) | 10 (100.0%) |
Physical Housing Characteristics in Poole
Housing Structures in Poole
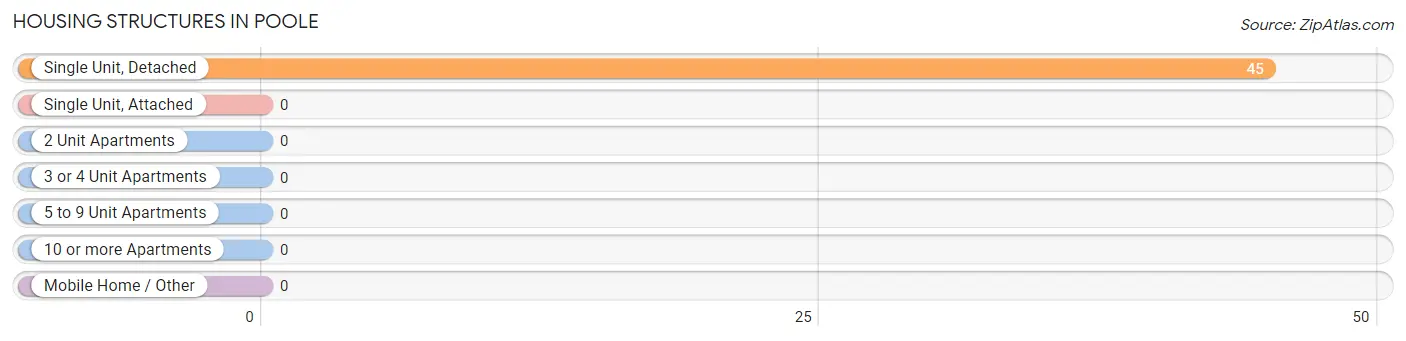
| Structure Type | # Housing Units | % Housing Units |
| Single Unit, Detached | 45 | 100.0% |
| Single Unit, Attached | 0 | 0.0% |
| 2 Unit Apartments | 0 | 0.0% |
| 3 or 4 Unit Apartments | 0 | 0.0% |
| 5 to 9 Unit Apartments | 0 | 0.0% |
| 10 or more Apartments | 0 | 0.0% |
| Mobile Home / Other | 0 | 0.0% |
| Total | 45 | 100.0% |
Housing Structures by Occupancy in Poole
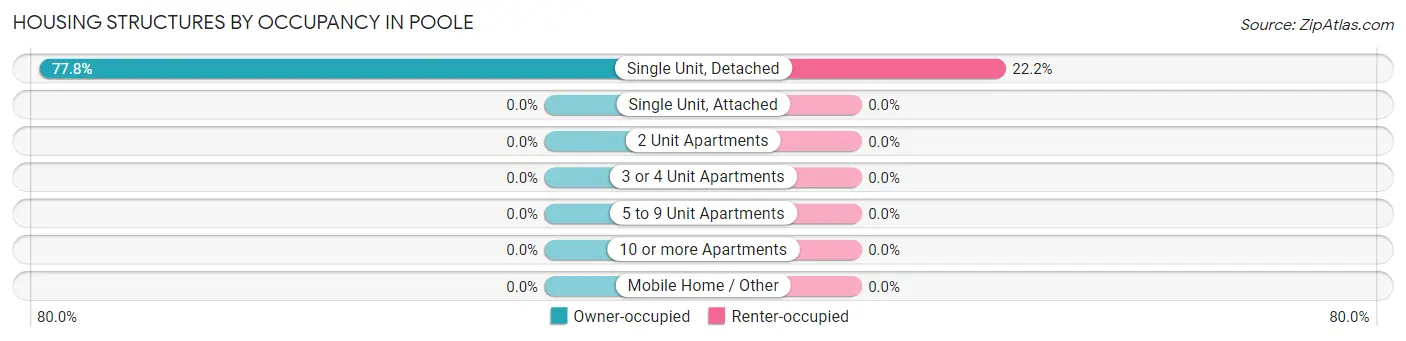
| Structure Type | Owner-occupied | Renter-occupied |
| Single Unit, Detached | 35 (77.8%) | 10 (22.2%) |
| Single Unit, Attached | 0 (0.0%) | 0 (0.0%) |
| 2 Unit Apartments | 0 (0.0%) | 0 (0.0%) |
| 3 or 4 Unit Apartments | 0 (0.0%) | 0 (0.0%) |
| 5 to 9 Unit Apartments | 0 (0.0%) | 0 (0.0%) |
| 10 or more Apartments | 0 (0.0%) | 0 (0.0%) |
| Mobile Home / Other | 0 (0.0%) | 0 (0.0%) |
| Total | 35 (77.8%) | 10 (22.2%) |
Housing Structures by Number of Rooms in Poole
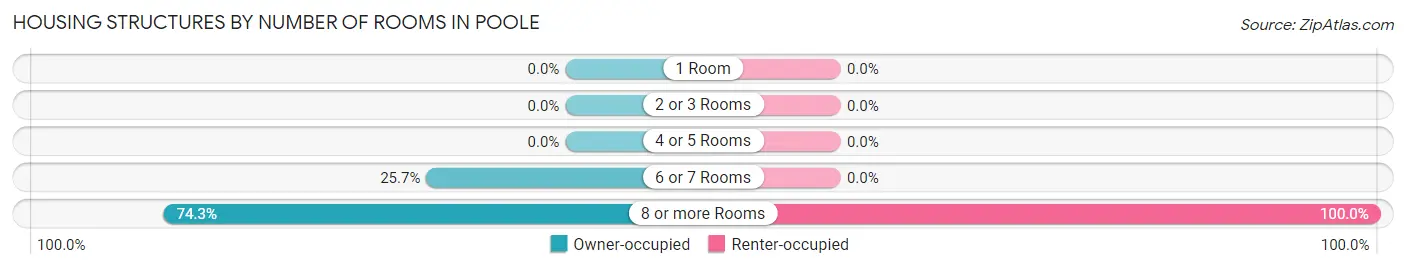
| Number of Rooms | Owner-occupied | Renter-occupied |
| 1 Room | 0 (0.0%) | 0 (0.0%) |
| 2 or 3 Rooms | 0 (0.0%) | 0 (0.0%) |
| 4 or 5 Rooms | 0 (0.0%) | 0 (0.0%) |
| 6 or 7 Rooms | 9 (25.7%) | 0 (0.0%) |
| 8 or more Rooms | 26 (74.3%) | 10 (100.0%) |
| Total | 35 (100.0%) | 10 (100.0%) |
Housing Structure by Heating Type in Poole
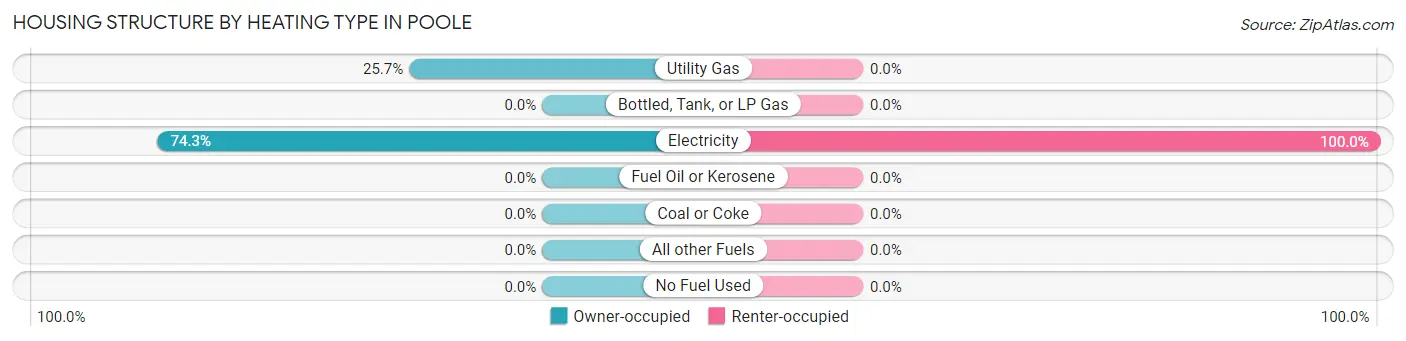
| Heating Type | Owner-occupied | Renter-occupied |
| Utility Gas | 9 (25.7%) | 0 (0.0%) |
| Bottled, Tank, or LP Gas | 0 (0.0%) | 0 (0.0%) |
| Electricity | 26 (74.3%) | 10 (100.0%) |
| Fuel Oil or Kerosene | 0 (0.0%) | 0 (0.0%) |
| Coal or Coke | 0 (0.0%) | 0 (0.0%) |
| All other Fuels | 0 (0.0%) | 0 (0.0%) |
| No Fuel Used | 0 (0.0%) | 0 (0.0%) |
| Total | 35 (100.0%) | 10 (100.0%) |
Household Vehicle Usage in Poole
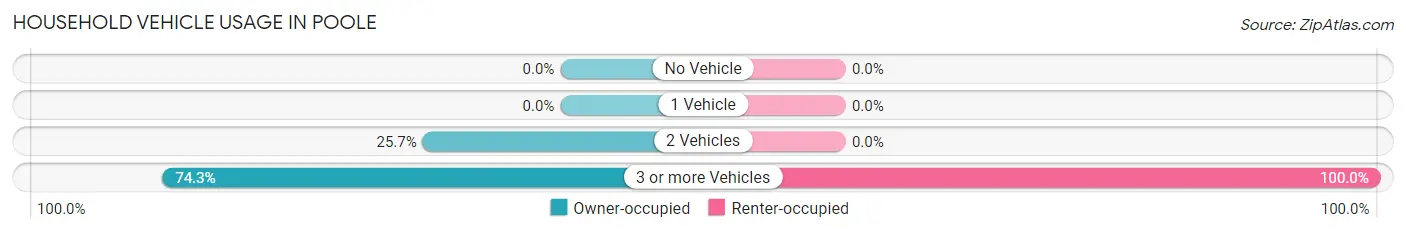
| Vehicles per Household | Owner-occupied | Renter-occupied |
| No Vehicle | 0 (0.0%) | 0 (0.0%) |
| 1 Vehicle | 0 (0.0%) | 0 (0.0%) |
| 2 Vehicles | 9 (25.7%) | 0 (0.0%) |
| 3 or more Vehicles | 26 (74.3%) | 10 (100.0%) |
| Total | 35 (100.0%) | 10 (100.0%) |
Real Estate & Mortgages in Poole
Real Estate and Mortgage Overview in Poole
| Characteristic | Without Mortgage | With Mortgage |
| Housing Units | 11 | 24 |
| Median Property Value | - | - |
| Median Household Income | - | - |
| Monthly Housing Costs | - | - |
| Real Estate Taxes | - | - |
Property Value by Mortgage Status in Poole
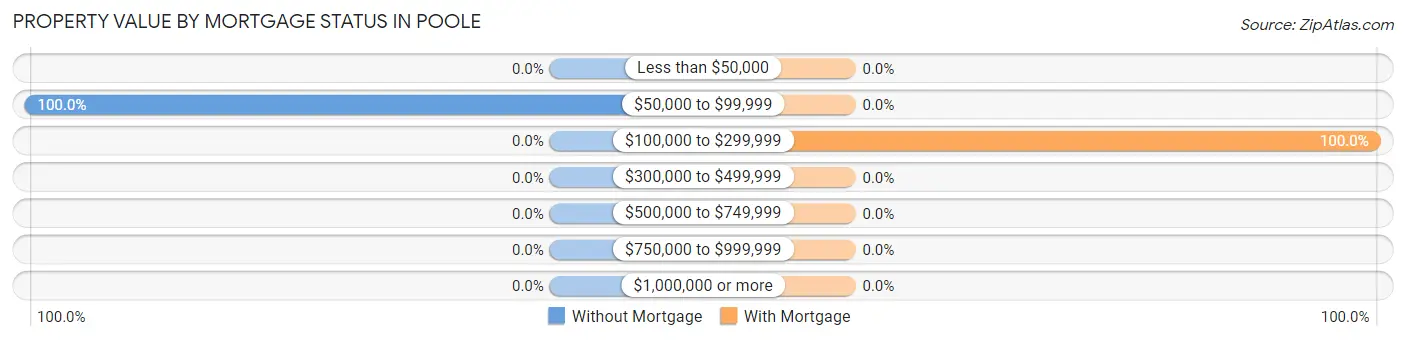
| Property Value | Without Mortgage | With Mortgage |
| Less than $50,000 | 0 (0.0%) | 0 (0.0%) |
| $50,000 to $99,999 | 11 (100.0%) | 0 (0.0%) |
| $100,000 to $299,999 | 0 (0.0%) | 24 (100.0%) |
| $300,000 to $499,999 | 0 (0.0%) | 0 (0.0%) |
| $500,000 to $749,999 | 0 (0.0%) | 0 (0.0%) |
| $750,000 to $999,999 | 0 (0.0%) | 0 (0.0%) |
| $1,000,000 or more | 0 (0.0%) | 0 (0.0%) |
| Total | 11 (100.0%) | 24 (100.0%) |
Household Income by Mortgage Status in Poole
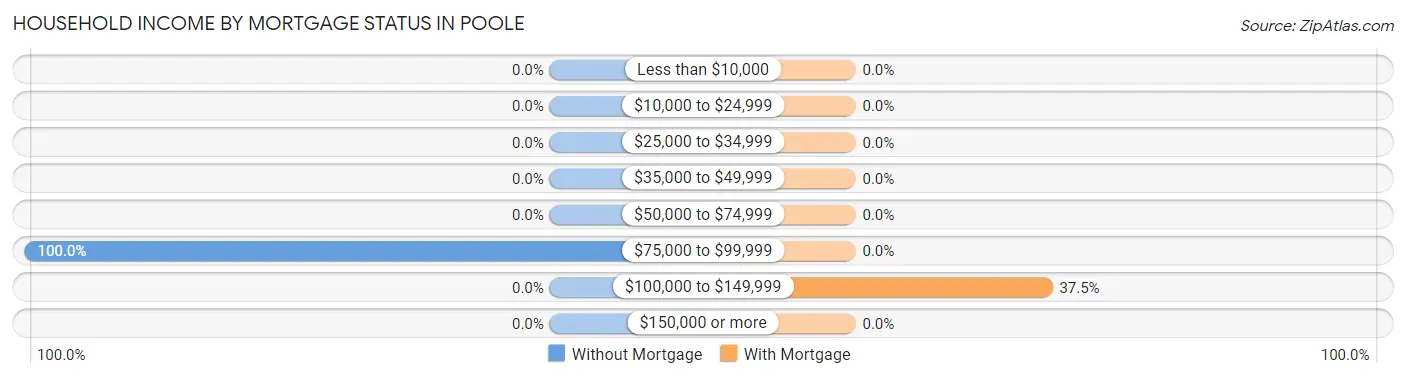
| Household Income | Without Mortgage | With Mortgage |
| Less than $10,000 | 0 (0.0%) | 0 (0.0%) |
| $10,000 to $24,999 | 0 (0.0%) | 0 (0.0%) |
| $25,000 to $34,999 | 0 (0.0%) | 0 (0.0%) |
| $35,000 to $49,999 | 0 (0.0%) | 0 (0.0%) |
| $50,000 to $74,999 | 0 (0.0%) | 0 (0.0%) |
| $75,000 to $99,999 | 11 (100.0%) | 0 (0.0%) |
| $100,000 to $149,999 | 0 (0.0%) | 9 (37.5%) |
| $150,000 or more | 0 (0.0%) | 0 (0.0%) |
| Total | 11 (100.0%) | 24 (100.0%) |
Property Value to Household Income Ratio in Poole
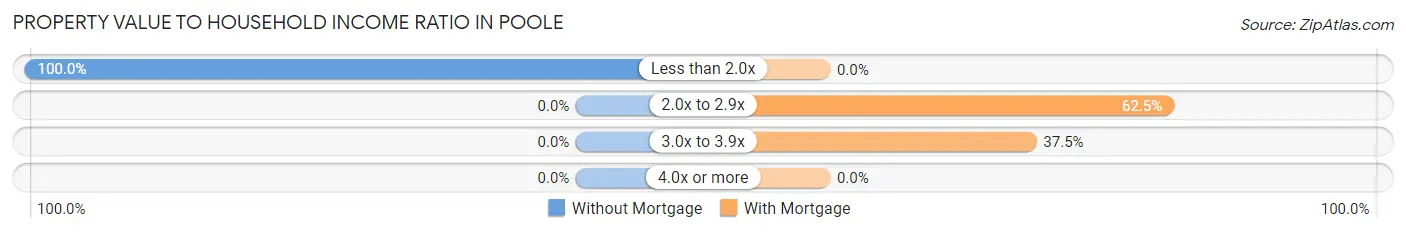
| Value-to-Income Ratio | Without Mortgage | With Mortgage |
| Less than 2.0x | 11 (100.0%) | 0 (0.0%) |
| 2.0x to 2.9x | 0 (0.0%) | 15 (62.5%) |
| 3.0x to 3.9x | 0 (0.0%) | 9 (37.5%) |
| 4.0x or more | 0 (0.0%) | 0 (0.0%) |
| Total | 11 (100.0%) | 24 (100.0%) |
Real Estate Taxes by Mortgage Status in Poole
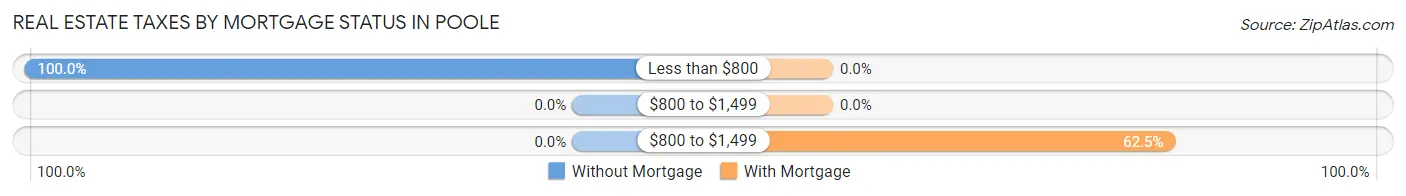
| Property Taxes | Without Mortgage | With Mortgage |
| Less than $800 | 11 (100.0%) | 0 (0.0%) |
| $800 to $1,499 | 0 (0.0%) | 0 (0.0%) |
| $800 to $1,499 | 0 (0.0%) | 15 (62.5%) |
| Total | 11 (100.0%) | 24 (100.0%) |
Health & Disability in Poole
Health Insurance Coverage by Age in Poole
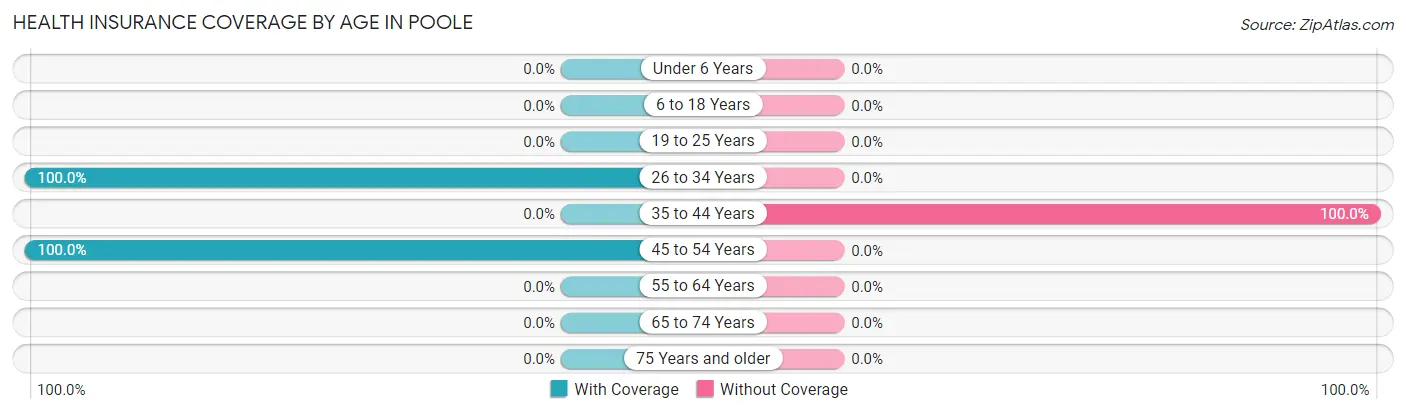
| Age Bracket | With Coverage | Without Coverage |
| Under 6 Years | 0 (0.0%) | 0 (0.0%) |
| 6 to 18 Years | 0 (0.0%) | 0 (0.0%) |
| 19 to 25 Years | 0 (0.0%) | 0 (0.0%) |
| 26 to 34 Years | 48 (100.0%) | 0 (0.0%) |
| 35 to 44 Years | 0 (0.0%) | 15 (100.0%) |
| 45 to 54 Years | 45 (100.0%) | 0 (0.0%) |
| 55 to 64 Years | 0 (0.0%) | 0 (0.0%) |
| 65 to 74 Years | 0 (0.0%) | 0 (0.0%) |
| 75 Years and older | 0 (0.0%) | 0 (0.0%) |
| Total | 93 (86.1%) | 15 (13.9%) |
Health Insurance Coverage by Citizenship Status in Poole
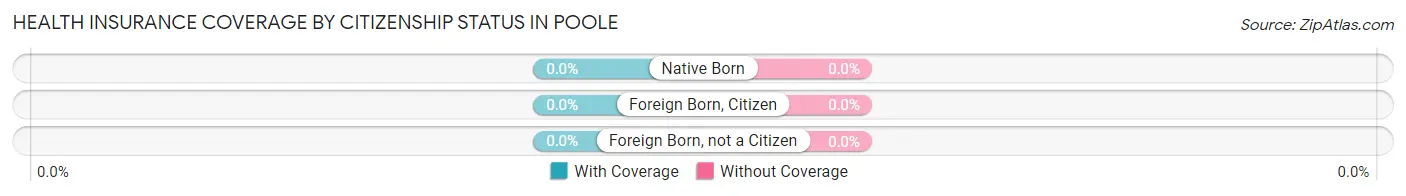
| Citizenship Status | With Coverage | Without Coverage |
| Native Born | 0 (0.0%) | 0 (0.0%) |
| Foreign Born, Citizen | 0 (0.0%) | 0 (0.0%) |
| Foreign Born, not a Citizen | 0 (0.0%) | 0 (0.0%) |
Health Insurance Coverage by Household Income in Poole
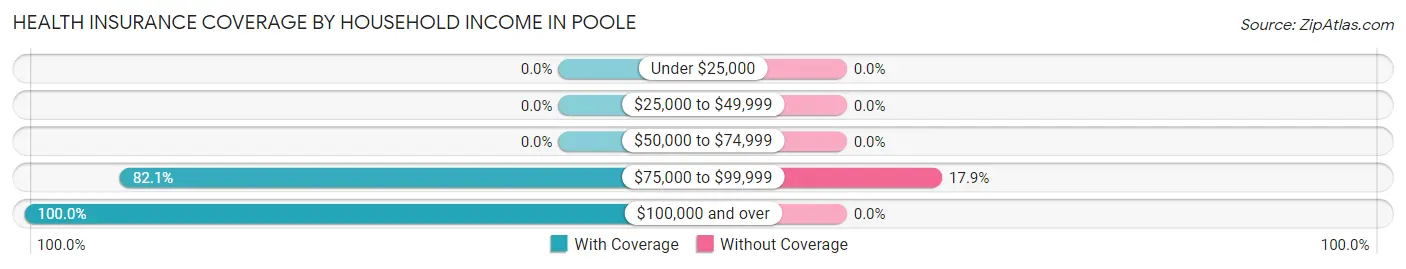
| Household Income | With Coverage | Without Coverage |
| Under $25,000 | 0 (0.0%) | 0 (0.0%) |
| $25,000 to $49,999 | 0 (0.0%) | 0 (0.0%) |
| $50,000 to $74,999 | 0 (0.0%) | 0 (0.0%) |
| $75,000 to $99,999 | 69 (82.1%) | 15 (17.9%) |
| $100,000 and over | 24 (100.0%) | 0 (0.0%) |
Public vs Private Health Insurance Coverage by Age in Poole
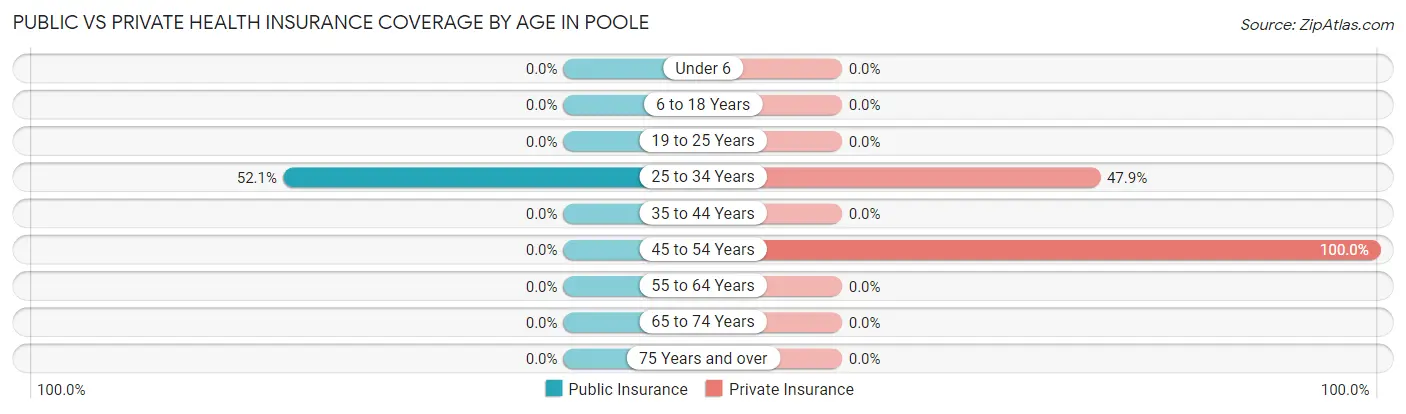
| Age Bracket | Public Insurance | Private Insurance |
| Under 6 | 0 (0.0%) | 0 (0.0%) |
| 6 to 18 Years | 0 (0.0%) | 0 (0.0%) |
| 19 to 25 Years | 0 (0.0%) | 0 (0.0%) |
| 25 to 34 Years | 25 (52.1%) | 23 (47.9%) |
| 35 to 44 Years | 0 (0.0%) | 0 (0.0%) |
| 45 to 54 Years | 0 (0.0%) | 45 (100.0%) |
| 55 to 64 Years | 0 (0.0%) | 0 (0.0%) |
| 65 to 74 Years | 0 (0.0%) | 0 (0.0%) |
| 75 Years and over | 0 (0.0%) | 0 (0.0%) |
| Total | 25 (23.2%) | 68 (63.0%) |
Disability Status by Sex by Age in Poole
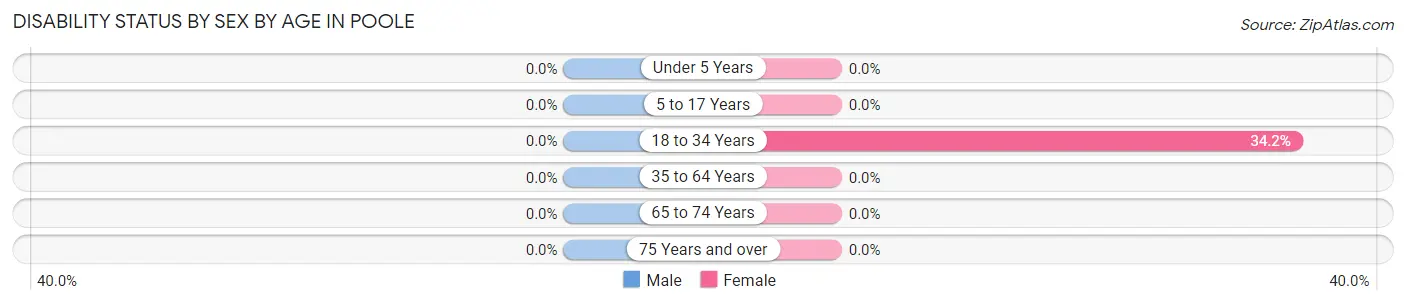
| Age Bracket | Male | Female |
| Under 5 Years | 0 (0.0%) | 0 (0.0%) |
| 5 to 17 Years | 0 (0.0%) | 0 (0.0%) |
| 18 to 34 Years | 0 (0.0%) | 13 (34.2%) |
| 35 to 64 Years | 0 (0.0%) | 0 (0.0%) |
| 65 to 74 Years | 0 (0.0%) | 0 (0.0%) |
| 75 Years and over | 0 (0.0%) | 0 (0.0%) |
Disability Class by Sex by Age in Poole
Disability Class: Hearing Difficulty
| Age Bracket | Male | Female |
| Under 5 Years | 0 (0.0%) | 0 (0.0%) |
| 5 to 17 Years | 0 (0.0%) | 0 (0.0%) |
| 18 to 34 Years | 0 (0.0%) | 0 (0.0%) |
| 35 to 64 Years | 0 (0.0%) | 0 (0.0%) |
| 65 to 74 Years | 0 (0.0%) | 0 (0.0%) |
| 75 Years and over | 0 (0.0%) | 0 (0.0%) |
Disability Class: Vision Difficulty
| Age Bracket | Male | Female |
| Under 5 Years | 0 (0.0%) | 0 (0.0%) |
| 5 to 17 Years | 0 (0.0%) | 0 (0.0%) |
| 18 to 34 Years | 0 (0.0%) | 0 (0.0%) |
| 35 to 64 Years | 0 (0.0%) | 0 (0.0%) |
| 65 to 74 Years | 0 (0.0%) | 0 (0.0%) |
| 75 Years and over | 0 (0.0%) | 0 (0.0%) |
Disability Class: Cognitive Difficulty
| Age Bracket | Male | Female |
| 5 to 17 Years | 0 (0.0%) | 0 (0.0%) |
| 18 to 34 Years | 0 (0.0%) | 0 (0.0%) |
| 35 to 64 Years | 0 (0.0%) | 0 (0.0%) |
| 65 to 74 Years | 0 (0.0%) | 0 (0.0%) |
| 75 Years and over | 0 (0.0%) | 0 (0.0%) |
Disability Class: Ambulatory Difficulty
| Age Bracket | Male | Female |
| 5 to 17 Years | 0 (0.0%) | 0 (0.0%) |
| 18 to 34 Years | 0 (0.0%) | 0 (0.0%) |
| 35 to 64 Years | 0 (0.0%) | 0 (0.0%) |
| 65 to 74 Years | 0 (0.0%) | 0 (0.0%) |
| 75 Years and over | 0 (0.0%) | 0 (0.0%) |
Disability Class: Self-Care Difficulty
| Age Bracket | Male | Female |
| 5 to 17 Years | 0 (0.0%) | 0 (0.0%) |
| 18 to 34 Years | 0 (0.0%) | 0 (0.0%) |
| 35 to 64 Years | 0 (0.0%) | 0 (0.0%) |
| 65 to 74 Years | 0 (0.0%) | 0 (0.0%) |
| 75 Years and over | 0 (0.0%) | 0 (0.0%) |
Technology Access in Poole
Computing Device Access in Poole
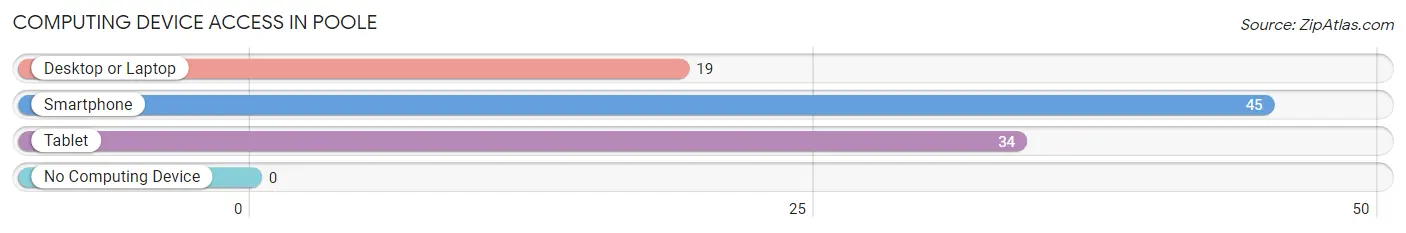
| Device Type | # Households | % Households |
| Desktop or Laptop | 19 | 42.2% |
| Smartphone | 45 | 100.0% |
| Tablet | 34 | 75.6% |
| No Computing Device | 0 | 0.0% |
| Total | 45 | 100.0% |
Internet Access in Poole
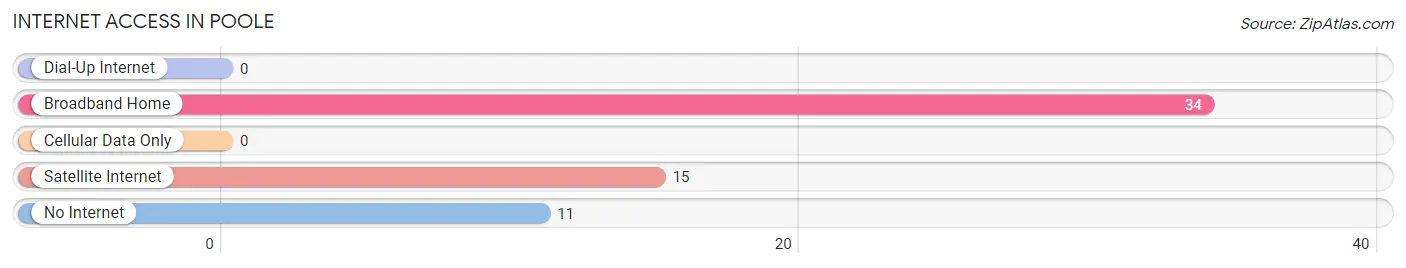
| Internet Type | # Households | % Households |
| Dial-Up Internet | 0 | 0.0% |
| Broadband Home | 34 | 75.6% |
| Cellular Data Only | 0 | 0.0% |
| Satellite Internet | 15 | 33.3% |
| No Internet | 11 | 24.4% |
| Total | 45 | 100.0% |
Poole Summary
Poole is a small unincorporated community located in the western part of Ballard County, Kentucky. It is situated on the banks of the Mississippi River, just south of the Kentucky-Illinois border. The community is named after the nearby town of Poole, Illinois, which is located across the river.
History
Poole was first settled in the early 1800s by a group of settlers from the nearby town of Poole, Illinois. The settlers were attracted to the area due to its proximity to the Mississippi River, which provided them with access to the markets of the Midwest. The community was officially established in 1820 and was named after the nearby town of Poole, Illinois.
In the late 1800s, Poole became a popular destination for steamboat travelers. The steamboats would stop at the community to pick up passengers and goods, as well as to drop off mail. The steamboats also provided a means of transportation for the residents of Poole to travel to other parts of the country.
In the early 1900s, the community began to decline due to the decline of the steamboat industry. The decline of the steamboat industry was due to the introduction of the railroad, which provided a faster and more efficient means of transportation. As a result, the population of Poole began to decline and the community eventually became a ghost town.
Geography
Poole is located in the western part of Ballard County, Kentucky. It is situated on the banks of the Mississippi River, just south of the Kentucky-Illinois border. The community is located approximately 25 miles south of Paducah, Kentucky and approximately 40 miles north of Cairo, Illinois.
The terrain of the area is mostly flat, with some rolling hills. The climate is humid subtropical, with hot summers and mild winters. The average annual temperature is around 60 degrees Fahrenheit.
Economy
The economy of Poole is largely based on agriculture. The area is home to several farms, which produce a variety of crops, including corn, soybeans, wheat, and hay. The area is also home to several livestock farms, which produce beef, pork, and poultry.
In addition to agriculture, the area is also home to several small businesses, including restaurants, convenience stores, and gas stations. The area is also home to several tourist attractions, including the nearby Kentucky Lake and the nearby Kentucky Dam.
Demographics
As of the 2010 census, the population of Poole was estimated to be around 200 people. The racial makeup of the community was 97.5% White, 0.5% African American, 0.5% Native American, and 1.5% from other races. The median household income was estimated to be around $30,000.
Conclusion
Poole is a small unincorporated community located in the western part of Ballard County, Kentucky. It is situated on the banks of the Mississippi River, just south of the Kentucky-Illinois border. The community was first settled in the early 1800s and was officially established in 1820. The economy of Poole is largely based on agriculture, with several farms producing a variety of crops and livestock. As of the 2010 census, the population of Poole was estimated to be around 200 people.
Common Questions
What is Per Capita Income in Poole?
Per Capita income in Poole is $49,569.
What is the Median Household income in Poole?
Median Household Income in Poole is $93,125.
What is Income or Wage Gap in Poole?
Income or Wage Gap in Poole is 81.8%.
Women in Poole earn 18.2 cents for every dollar earned by a man.
What is Inequality or Gini Index in Poole?
Inequality or Gini Index in Poole is 0.21.
What is the Total Population of Poole?
Total Population of Poole is 108.
What is the Total Male Population of Poole?
Total Male Population of Poole is 44.
What is the Total Female Population of Poole?
Total Female Population of Poole is 64.
What is the Ratio of Males per 100 Females in Poole?
There are 68.75 Males per 100 Females in Poole.
What is the Ratio of Females per 100 Males in Poole?
There are 145.45 Females per 100 Males in Poole.
What is the Median Population Age in Poole?
Median Population Age in Poole is 39.0 Years.
What is the Average Family Size in Poole
Average Family Size in Poole is 2.6 People.
What is the Average Household Size in Poole
Average Household Size in Poole is 2.4 People.
How Large is the Labor Force in Poole?
There are 95 People in the Labor Forcein in Poole.
What is the Percentage of People in the Labor Force in Poole?
88.0% of People are in the Labor Force in Poole.