Shorewood Forest, IN Map & Demographics
Shorewood Forest Map
Shorewood Forest Overview
$89,843
PER CAPITA INCOME
$165,781
AVG FAMILY INCOME
$166,563
AVG HOUSEHOLD INCOME
61.5%
WAGE / INCOME GAP [ % ]
38.5¢/ $1
WAGE / INCOME GAP [ $ ]
$9,025
FAMILY INCOME DEFICIT
0.52
INEQUALITY / GINI INDEX
3,215
TOTAL POPULATION
1,704
MALE POPULATION
1,511
FEMALE POPULATION
112.77
MALES / 100 FEMALES
88.67
FEMALES / 100 MALES
46.4
MEDIAN AGE
3.2
AVG FAMILY SIZE
3.0
AVG HOUSEHOLD SIZE
1,582
LABOR FORCE [ PEOPLE ]
62.9%
PERCENT IN LABOR FORCE
1.4%
UNEMPLOYMENT RATE
Income in Shorewood Forest
Income Overview in Shorewood Forest
Per Capita Income in Shorewood Forest is $89,843, while median incomes of families and households are $165,781 and $166,563 respectively.
| Characteristic | Number | Measure |
| Per Capita Income | 3,215 | $89,843 |
| Median Family Income | 954 | $165,781 |
| Mean Family Income | 954 | $267,578 |
| Median Household Income | 1,060 | $166,563 |
| Mean Household Income | 1,060 | $264,243 |
| Income Deficit | 954 | $9,025 |
| Wage / Income Gap (%) | 3,215 | 61.51% |
| Wage / Income Gap ($) | 3,215 | 38.49¢ per $1 |
| Gini / Inequality Index | 3,215 | 0.52 |
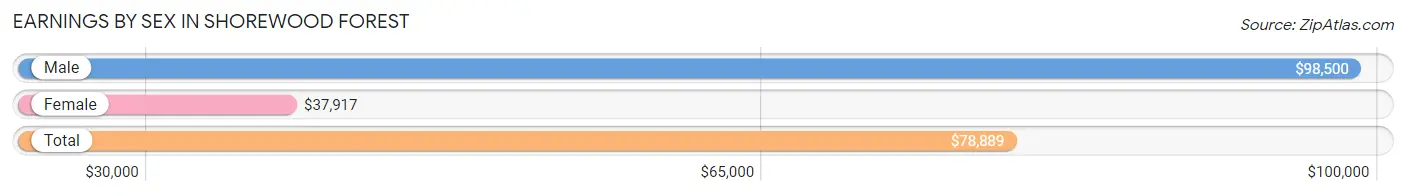
Earnings by Sex in Shorewood Forest
Average Earnings in Shorewood Forest are $78,889, $98,500 for men and $37,917 for women, a difference of 61.5%.
| Sex | Number | Average Earnings |
| Male | 1,058 (61.2%) | $98,500 |
| Female | 670 (38.8%) | $37,917 |
| Total | 1,728 (100.0%) | $78,889 |
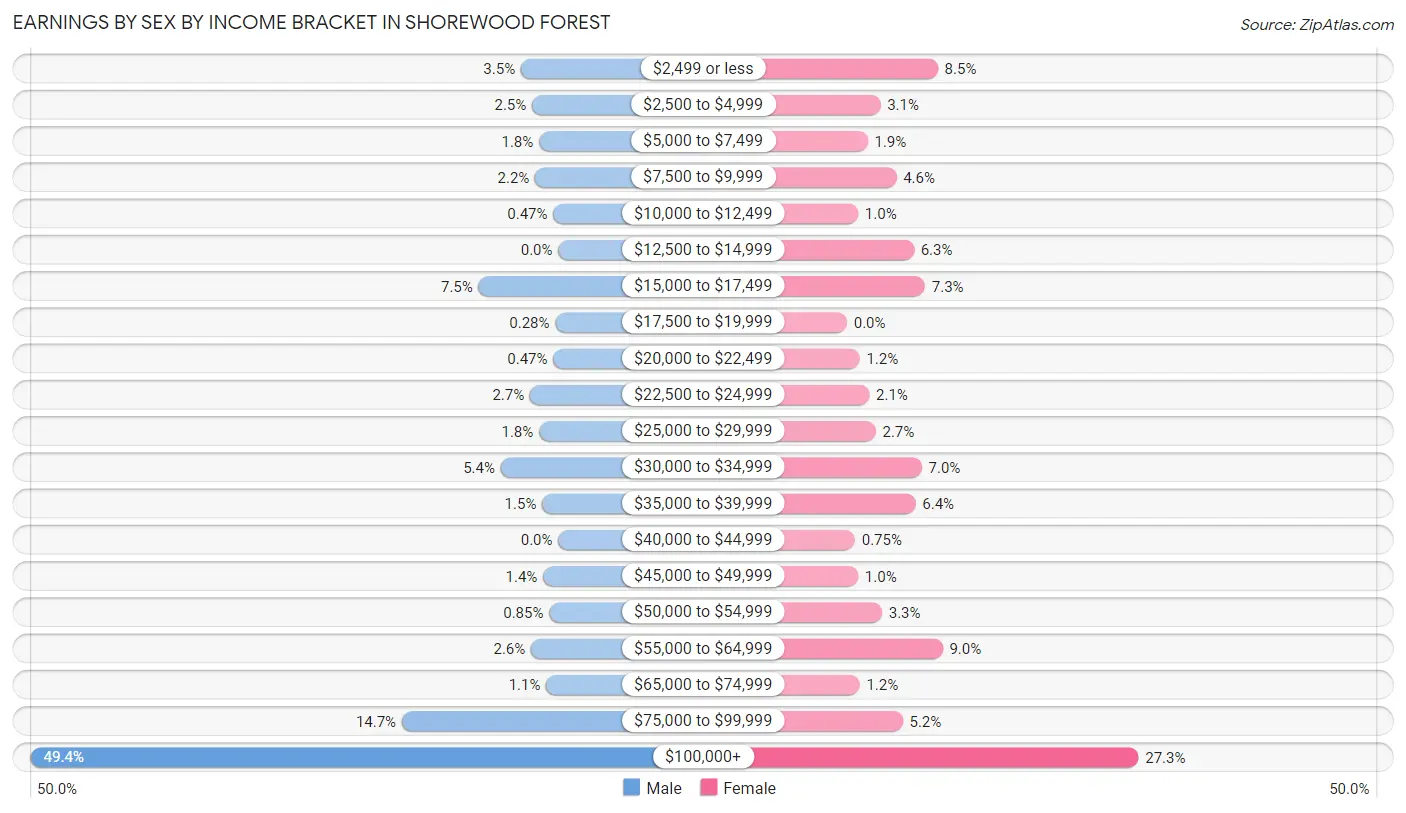
Earnings by Sex by Income Bracket in Shorewood Forest
The most common earnings brackets in Shorewood Forest are $100,000+ for men (523 | 49.4%) and $100,000+ for women (183 | 27.3%).
| Income | Male | Female |
| $2,499 or less | 37 (3.5%) | 57 (8.5%) |
| $2,500 to $4,999 | 26 (2.5%) | 21 (3.1%) |
| $5,000 to $7,499 | 19 (1.8%) | 13 (1.9%) |
| $7,500 to $9,999 | 23 (2.2%) | 31 (4.6%) |
| $10,000 to $12,499 | 5 (0.5%) | 7 (1.0%) |
| $12,500 to $14,999 | 0 (0.0%) | 42 (6.3%) |
| $15,000 to $17,499 | 79 (7.5%) | 49 (7.3%) |
| $17,500 to $19,999 | 3 (0.3%) | 0 (0.0%) |
| $20,000 to $22,499 | 5 (0.5%) | 8 (1.2%) |
| $22,500 to $24,999 | 28 (2.6%) | 14 (2.1%) |
| $25,000 to $29,999 | 19 (1.8%) | 18 (2.7%) |
| $30,000 to $34,999 | 57 (5.4%) | 47 (7.0%) |
| $35,000 to $39,999 | 16 (1.5%) | 43 (6.4%) |
| $40,000 to $44,999 | 0 (0.0%) | 5 (0.7%) |
| $45,000 to $49,999 | 15 (1.4%) | 7 (1.0%) |
| $50,000 to $54,999 | 9 (0.9%) | 22 (3.3%) |
| $55,000 to $64,999 | 27 (2.5%) | 60 (9.0%) |
| $65,000 to $74,999 | 12 (1.1%) | 8 (1.2%) |
| $75,000 to $99,999 | 155 (14.6%) | 35 (5.2%) |
| $100,000+ | 523 (49.4%) | 183 (27.3%) |
| Total | 1,058 (100.0%) | 670 (100.0%) |
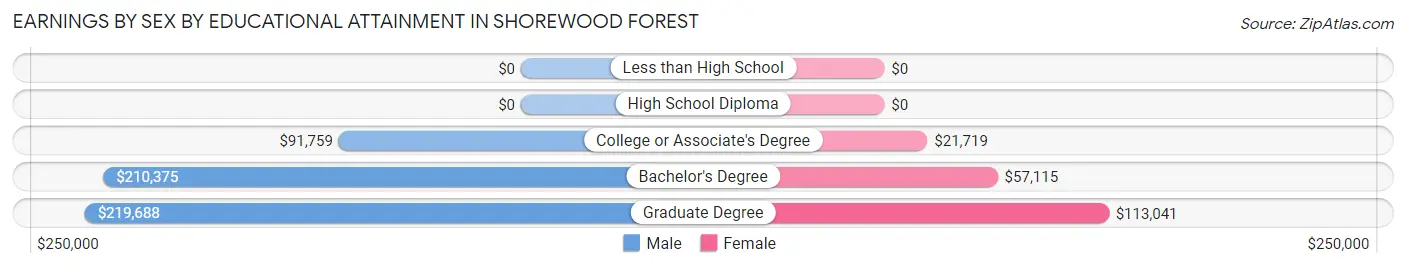
Earnings by Sex by Educational Attainment in Shorewood Forest
Average earnings in Shorewood Forest are $135,139 for men and $54,306 for women, a difference of 59.8%. Men with an educational attainment of graduate degree enjoy the highest average annual earnings of $219,688, while those with college or associate's degree education earn the least with $91,759. Women with an educational attainment of graduate degree earn the most with the average annual earnings of $113,041, while those with college or associate's degree education have the smallest earnings of $21,719.
| Educational Attainment | Male Income | Female Income |
| Less than High School | - | - |
| High School Diploma | - | - |
| College or Associate's Degree | $91,759 | $21,719 |
| Bachelor's Degree | $210,375 | $57,115 |
| Graduate Degree | $219,688 | $113,041 |
| Total | $135,139 | $54,306 |
Family Income in Shorewood Forest
Family Income Brackets in Shorewood Forest
According to the Shorewood Forest family income data, there are 421 families falling into the $200,000+ income range, which is the most common income bracket and makes up 44.1% of all families.
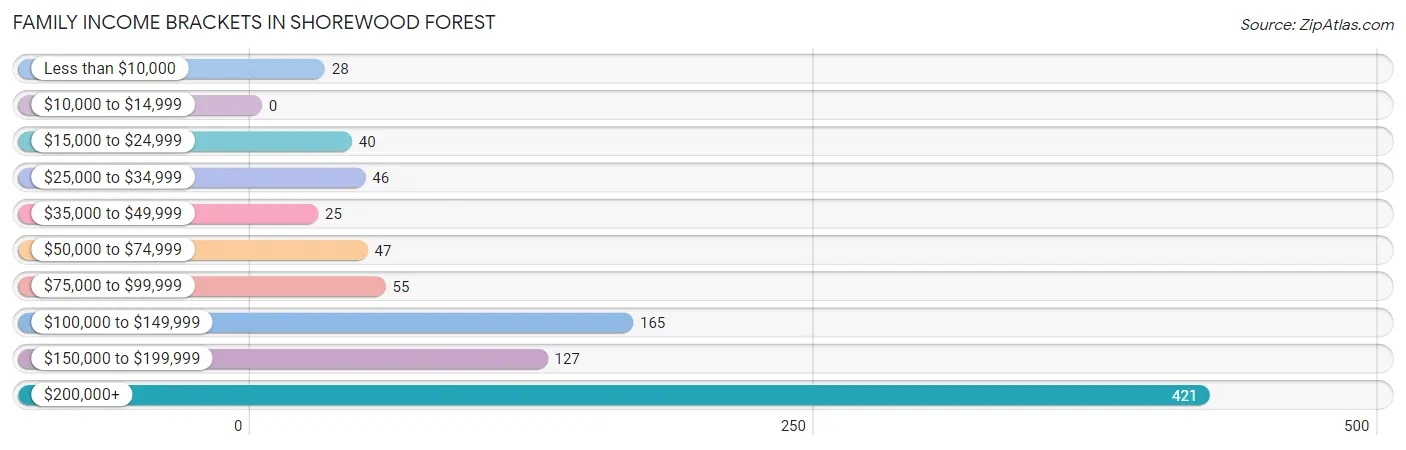
| Income Bracket | # Families | % Families |
| Less than $10,000 | 28 | 2.9% |
| $10,000 to $14,999 | 0 | 0.0% |
| $15,000 to $24,999 | 40 | 4.2% |
| $25,000 to $34,999 | 46 | 4.8% |
| $35,000 to $49,999 | 25 | 2.6% |
| $50,000 to $74,999 | 47 | 4.9% |
| $75,000 to $99,999 | 55 | 5.8% |
| $100,000 to $149,999 | 165 | 17.3% |
| $150,000 to $199,999 | 127 | 13.3% |
| $200,000+ | 421 | 44.1% |
Family Income by Famaliy Size in Shorewood Forest
4-person families (178 | 18.7%) account for the highest median family income in Shorewood Forest with $250,001 per family, while 2-person families (403 | 42.2%) have the highest median income of $73,984 per family member.
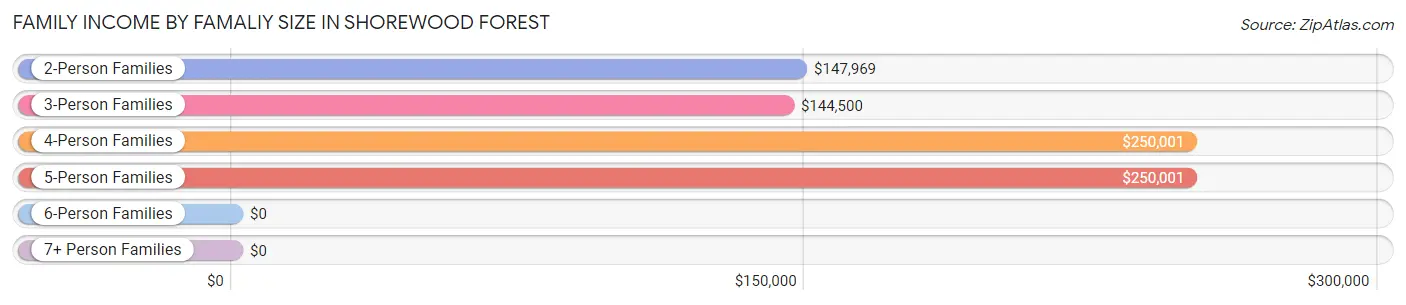
| Income Bracket | # Families | Median Income |
| 2-Person Families | 403 (42.2%) | $147,969 |
| 3-Person Families | 194 (20.3%) | $144,500 |
| 4-Person Families | 178 (18.7%) | $250,001 |
| 5-Person Families | 116 (12.2%) | $250,001 |
| 6-Person Families | 38 (4.0%) | $0 |
| 7+ Person Families | 25 (2.6%) | $0 |
| Total | 954 (100.0%) | $165,781 |
Family Income by Number of Earners in Shorewood Forest
The median family income in Shorewood Forest is $165,781, with families comprising 3+ earners (134) having the highest median family income of $250,001, while families with no earners (134) have the lowest median family income of $33,629, accounting for 14.1% and 14.1% of families, respectively.
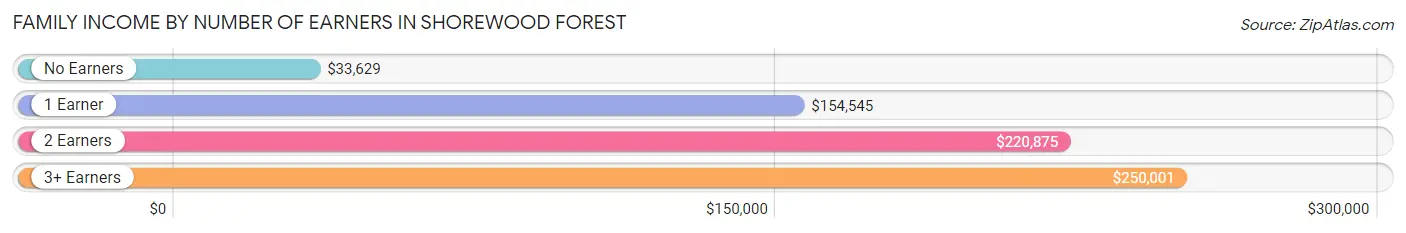
| Number of Earners | # Families | Median Income |
| No Earners | 134 (14.1%) | $33,629 |
| 1 Earner | 226 (23.7%) | $154,545 |
| 2 Earners | 460 (48.2%) | $220,875 |
| 3+ Earners | 134 (14.1%) | $250,001 |
| Total | 954 (100.0%) | $165,781 |
Household Income in Shorewood Forest
Household Income Brackets in Shorewood Forest
With 458 households falling in the category, the $200,000+ income range is the most frequent in Shorewood Forest, accounting for 43.2% of all households.
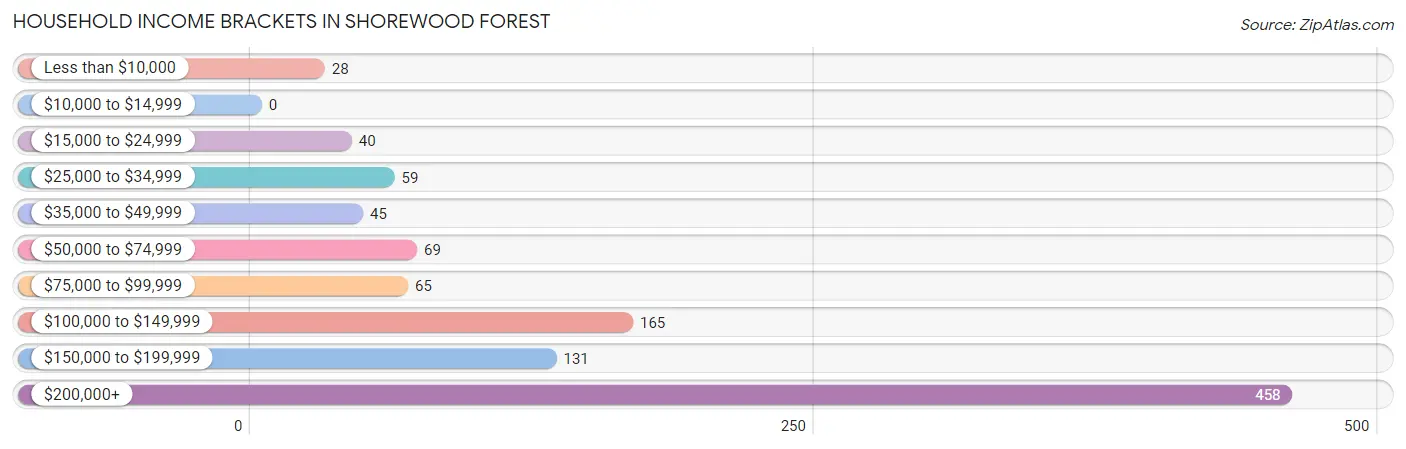
| Income Bracket | # Households | % Households |
| Less than $10,000 | 28 | 2.6% |
| $10,000 to $14,999 | 0 | 0.0% |
| $15,000 to $24,999 | 40 | 3.8% |
| $25,000 to $34,999 | 59 | 5.6% |
| $35,000 to $49,999 | 45 | 4.2% |
| $50,000 to $74,999 | 69 | 6.5% |
| $75,000 to $99,999 | 65 | 6.1% |
| $100,000 to $149,999 | 165 | 15.6% |
| $150,000 to $199,999 | 131 | 12.4% |
| $200,000+ | 458 | 43.2% |
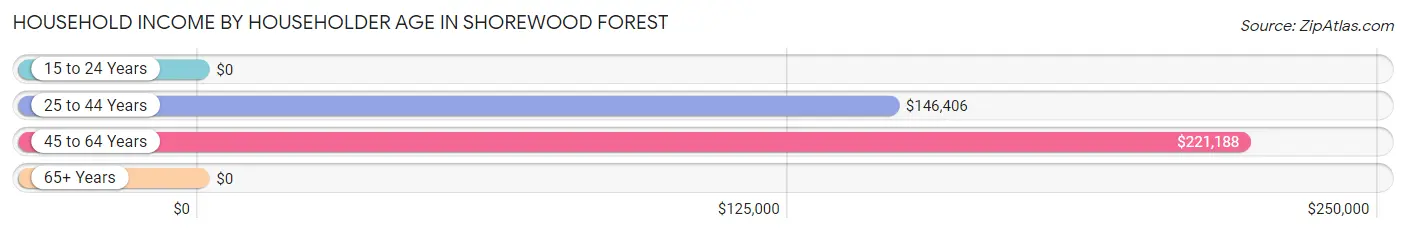
Household Income by Householder Age in Shorewood Forest
The median household income in Shorewood Forest is $166,563, with the highest median household income of $221,188 found in the 45 to 64 years age bracket for the primary householder. A total of 610 households (57.6%) fall into this category.
| Income Bracket | # Households | Median Income |
| 15 to 24 Years | 0 (0.0%) | $0 |
| 25 to 44 Years | 151 (14.2%) | $146,406 |
| 45 to 64 Years | 610 (57.6%) | $221,188 |
| 65+ Years | 299 (28.2%) | $0 |
| Total | 1,060 (100.0%) | $166,563 |
Poverty in Shorewood Forest
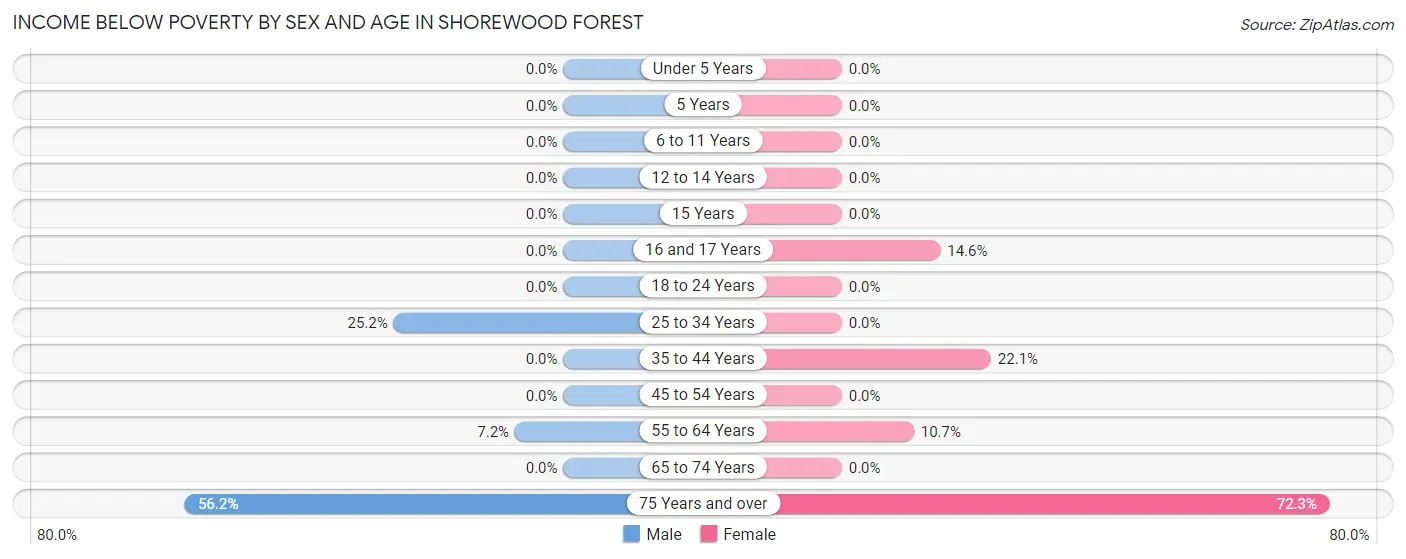
Income Below Poverty by Sex and Age in Shorewood Forest
With 6.0% poverty level for males and 7.5% for females among the residents of Shorewood Forest, 75 year old and over males and 75 year old and over females are the most vulnerable to poverty, with 50 males (56.2%) and 47 females (72.3%) in their respective age groups living below the poverty level.
| Age Bracket | Male | Female |
| Under 5 Years | 0 (0.0%) | 0 (0.0%) |
| 5 Years | 0 (0.0%) | 0 (0.0%) |
| 6 to 11 Years | 0 (0.0%) | 0 (0.0%) |
| 12 to 14 Years | 0 (0.0%) | 0 (0.0%) |
| 15 Years | 0 (0.0%) | 0 (0.0%) |
| 16 and 17 Years | 0 (0.0%) | 6 (14.6%) |
| 18 to 24 Years | 0 (0.0%) | 0 (0.0%) |
| 25 to 34 Years | 30 (25.2%) | 0 (0.0%) |
| 35 to 44 Years | 0 (0.0%) | 29 (22.1%) |
| 45 to 54 Years | 0 (0.0%) | 0 (0.0%) |
| 55 to 64 Years | 22 (7.2%) | 31 (10.7%) |
| 65 to 74 Years | 0 (0.0%) | 0 (0.0%) |
| 75 Years and over | 50 (56.2%) | 47 (72.3%) |
| Total | 102 (6.0%) | 113 (7.5%) |
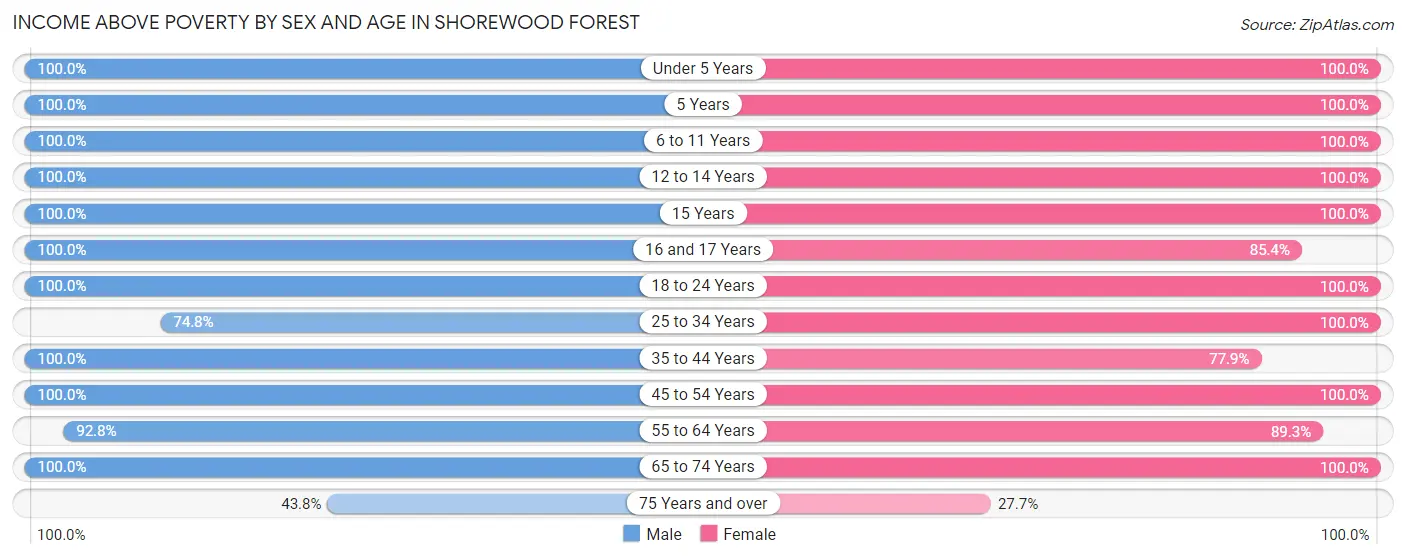
Income Above Poverty by Sex and Age in Shorewood Forest
According to the poverty statistics in Shorewood Forest, males aged under 5 years and females aged under 5 years are the age groups that are most secure financially, with 100.0% of males and 100.0% of females in these age groups living above the poverty line.
| Age Bracket | Male | Female |
| Under 5 Years | 76 (100.0%) | 168 (100.0%) |
| 5 Years | 36 (100.0%) | 18 (100.0%) |
| 6 to 11 Years | 129 (100.0%) | 66 (100.0%) |
| 12 to 14 Years | 79 (100.0%) | 80 (100.0%) |
| 15 Years | 19 (100.0%) | 29 (100.0%) |
| 16 and 17 Years | 64 (100.0%) | 35 (85.4%) |
| 18 to 24 Years | 153 (100.0%) | 106 (100.0%) |
| 25 to 34 Years | 89 (74.8%) | 84 (100.0%) |
| 35 to 44 Years | 132 (100.0%) | 102 (77.9%) |
| 45 to 54 Years | 321 (100.0%) | 272 (100.0%) |
| 55 to 64 Years | 284 (92.8%) | 259 (89.3%) |
| 65 to 74 Years | 181 (100.0%) | 161 (100.0%) |
| 75 Years and over | 39 (43.8%) | 18 (27.7%) |
| Total | 1,602 (94.0%) | 1,398 (92.5%) |
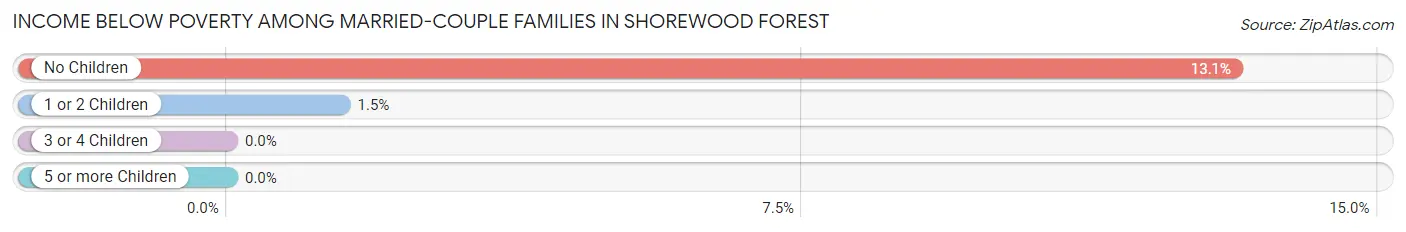
Income Below Poverty Among Married-Couple Families in Shorewood Forest
The poverty statistics for married-couple families in Shorewood Forest show that 7.6% or 68 of the total 896 families live below the poverty line. Families with no children have the highest poverty rate of 13.1%, comprising of 63 families. On the other hand, families with 3 or 4 children have the lowest poverty rate of 0.0%, which includes 0 families.
| Children | Above Poverty | Below Poverty |
| No Children | 417 (86.9%) | 63 (13.1%) |
| 1 or 2 Children | 335 (98.5%) | 5 (1.5%) |
| 3 or 4 Children | 60 (100.0%) | 0 (0.0%) |
| 5 or more Children | 16 (100.0%) | 0 (0.0%) |
| Total | 828 (92.4%) | 68 (7.6%) |
Income Below Poverty Among Single-Parent Households in Shorewood Forest
| Children | Single Father | Single Mother |
| No Children | 0 (0.0%) | 0 (0.0%) |
| 1 or 2 Children | 0 (0.0%) | 0 (0.0%) |
| 3 or 4 Children | 0 (0.0%) | 0 (0.0%) |
| 5 or more Children | 0 (0.0%) | 0 (0.0%) |
| Total | 0 (0.0%) | 0 (0.0%) |
Income Below Poverty Among Married-Couple vs Single-Parent Households in Shorewood Forest
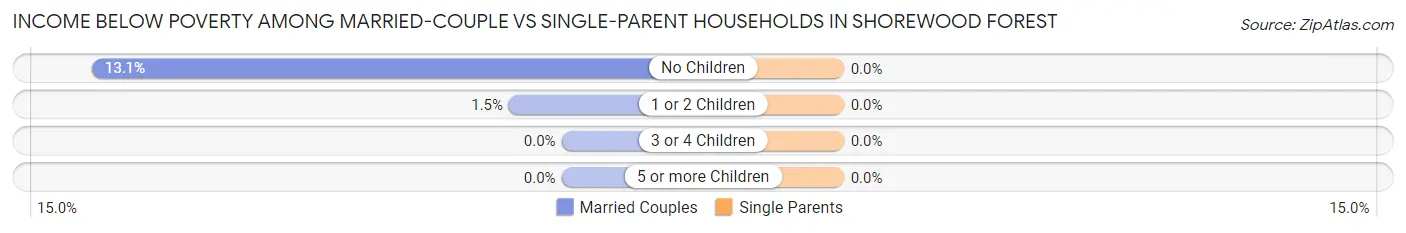
| Children | Married-Couple Families | Single-Parent Households |
| No Children | 63 (13.1%) | 0 (0.0%) |
| 1 or 2 Children | 5 (1.5%) | 0 (0.0%) |
| 3 or 4 Children | 0 (0.0%) | 0 (0.0%) |
| 5 or more Children | 0 (0.0%) | 0 (0.0%) |
| Total | 68 (7.6%) | 0 (0.0%) |
Race in Shorewood Forest
The most populous races in Shorewood Forest are White / Caucasian (2,802 | 87.2%), Hispanic or Latino (460 | 14.3%), and Some other Race (217 | 6.8%).
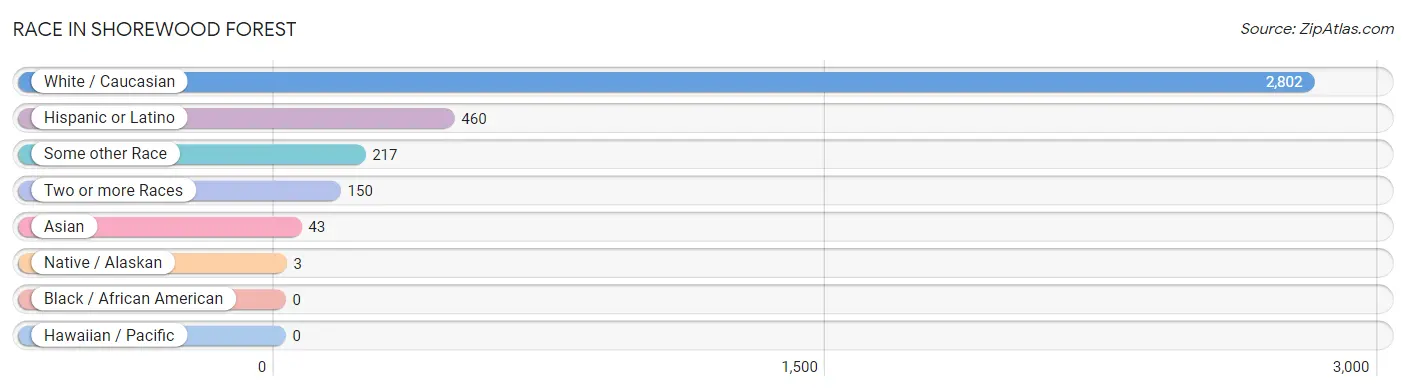
| Race | # Population | % Population |
| Asian | 43 | 1.3% |
| Black / African American | 0 | 0.0% |
| Hawaiian / Pacific | 0 | 0.0% |
| Hispanic or Latino | 460 | 14.3% |
| Native / Alaskan | 3 | 0.1% |
| White / Caucasian | 2,802 | 87.2% |
| Two or more Races | 150 | 4.7% |
| Some other Race | 217 | 6.8% |
| Total | 3,215 | 100.0% |
Ancestry in Shorewood Forest
The most populous ancestries reported in Shorewood Forest are German (648 | 20.2%), Irish (581 | 18.1%), Mexican (358 | 11.1%), Polish (242 | 7.5%), and Italian (210 | 6.5%), together accounting for 63.4% of all Shorewood Forest residents.
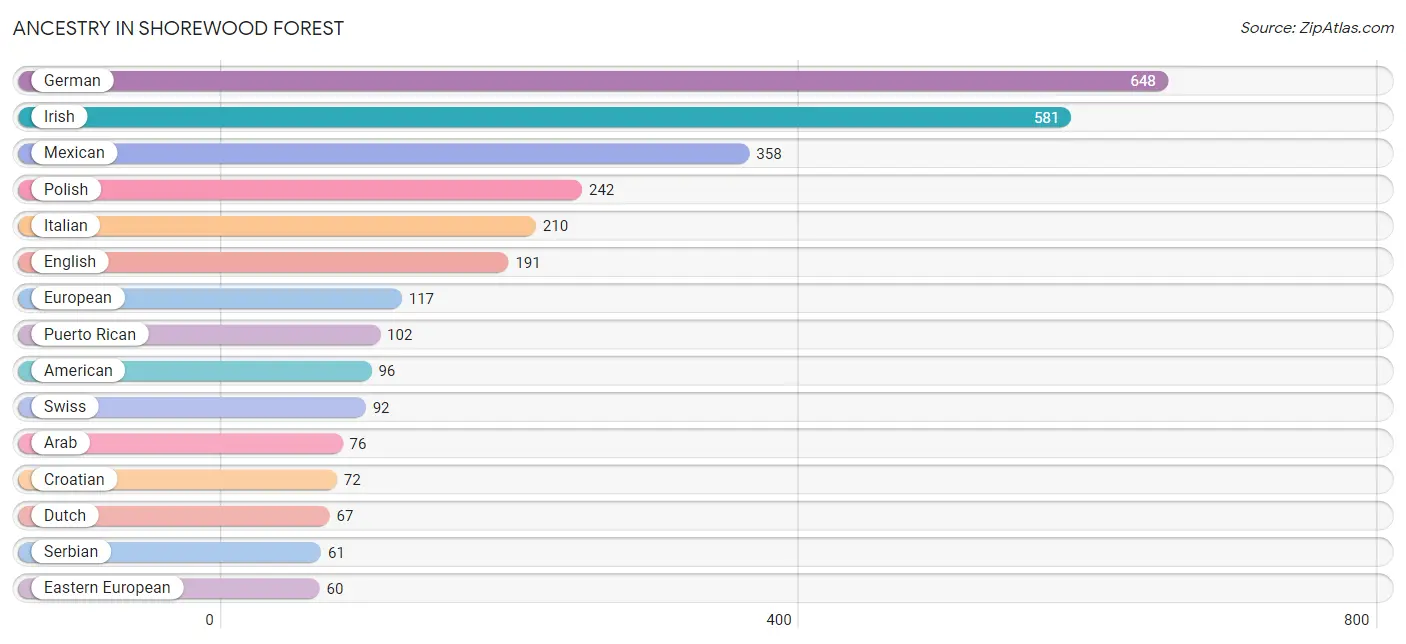
| Ancestry | # Population | % Population |
| American | 96 | 3.0% |
| Arab | 76 | 2.4% |
| Burmese | 13 | 0.4% |
| Croatian | 72 | 2.2% |
| Czech | 7 | 0.2% |
| Czechoslovakian | 20 | 0.6% |
| Danish | 9 | 0.3% |
| Dutch | 67 | 2.1% |
| Eastern European | 60 | 1.9% |
| English | 191 | 5.9% |
| European | 117 | 3.6% |
| French Canadian | 39 | 1.2% |
| German | 648 | 20.2% |
| Greek | 6 | 0.2% |
| Hungarian | 36 | 1.1% |
| Indian (Asian) | 2 | 0.1% |
| Irish | 581 | 18.1% |
| Italian | 210 | 6.5% |
| Jordanian | 48 | 1.5% |
| Mexican | 358 | 11.1% |
| Norwegian | 22 | 0.7% |
| Polish | 242 | 7.5% |
| Puerto Rican | 102 | 3.2% |
| Russian | 26 | 0.8% |
| Scotch-Irish | 28 | 0.9% |
| Scottish | 56 | 1.7% |
| Serbian | 61 | 1.9% |
| Slavic | 10 | 0.3% |
| Slovak | 32 | 1.0% |
| Swedish | 18 | 0.6% |
| Swiss | 92 | 2.9% |
| Syrian | 8 | 0.3% |
| Thai | 28 | 0.9% |
| Welsh | 7 | 0.2% | View All 34 Rows |
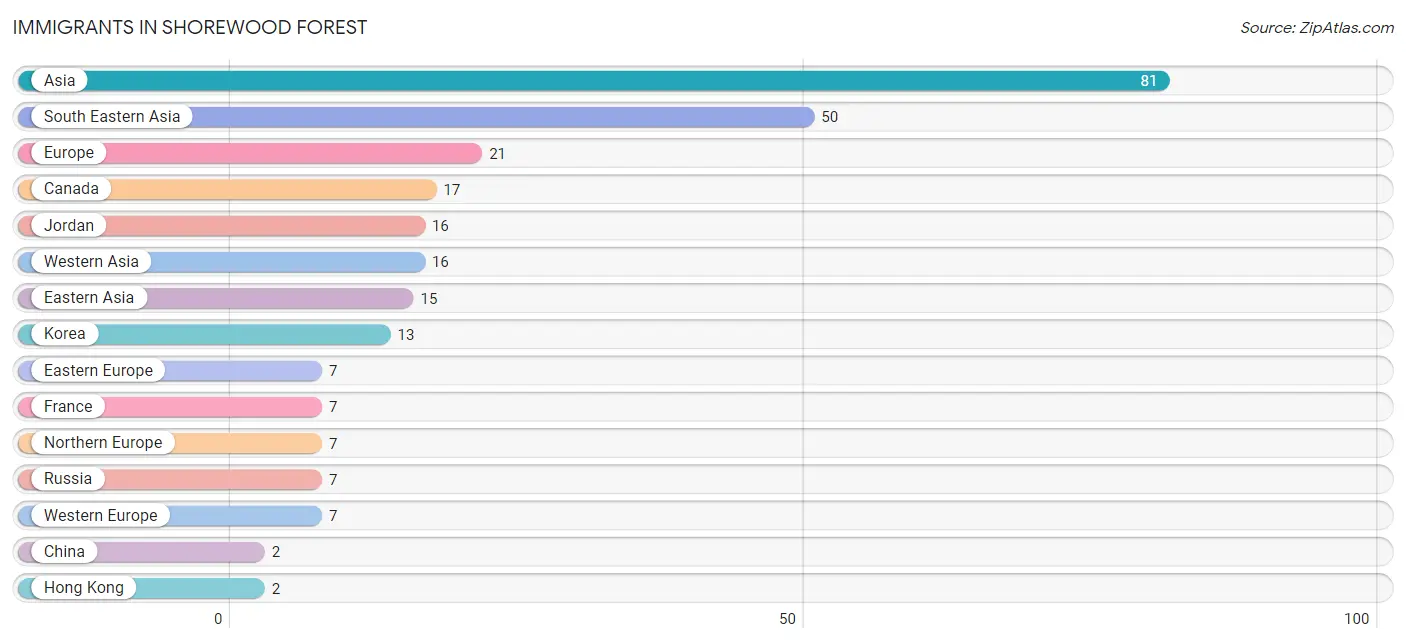
Immigrants in Shorewood Forest
The most numerous immigrant groups reported in Shorewood Forest came from Asia (81 | 2.5%), South Eastern Asia (50 | 1.6%), Europe (21 | 0.6%), Canada (17 | 0.5%), and Jordan (16 | 0.5%), together accounting for 5.8% of all Shorewood Forest residents.
| Immigration Origin | # Population | % Population |
| Asia | 81 | 2.5% |
| Canada | 17 | 0.5% |
| China | 2 | 0.1% |
| Eastern Asia | 15 | 0.5% |
| Eastern Europe | 7 | 0.2% |
| Europe | 21 | 0.6% |
| France | 7 | 0.2% |
| Hong Kong | 2 | 0.1% |
| Jordan | 16 | 0.5% |
| Korea | 13 | 0.4% |
| Northern Europe | 7 | 0.2% |
| Russia | 7 | 0.2% |
| South Eastern Asia | 50 | 1.6% |
| Western Asia | 16 | 0.5% |
| Western Europe | 7 | 0.2% | View All 15 Rows |
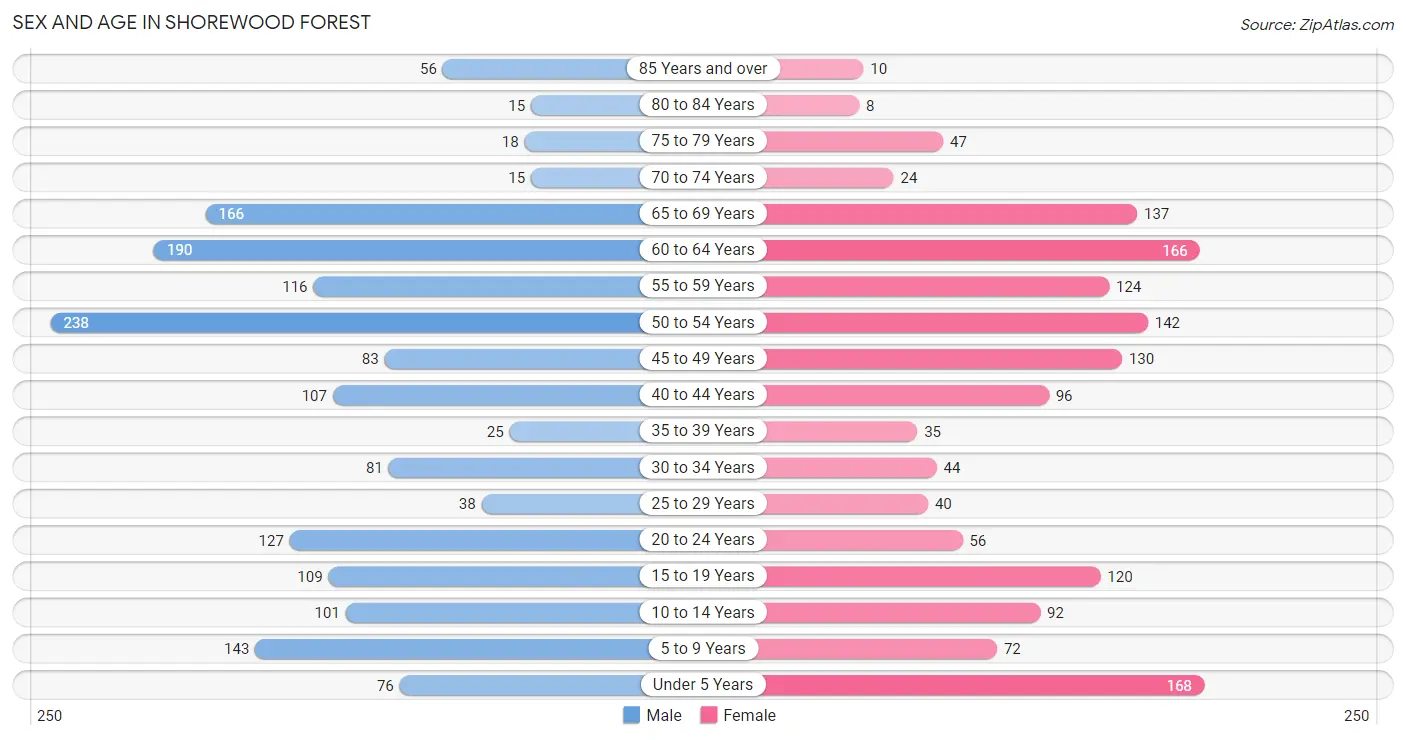
Sex and Age in Shorewood Forest
Sex and Age in Shorewood Forest
The most populous age groups in Shorewood Forest are 50 to 54 Years (238 | 14.0%) for men and Under 5 Years (168 | 11.1%) for women.
| Age Bracket | Male | Female |
| Under 5 Years | 76 (4.5%) | 168 (11.1%) |
| 5 to 9 Years | 143 (8.4%) | 72 (4.8%) |
| 10 to 14 Years | 101 (5.9%) | 92 (6.1%) |
| 15 to 19 Years | 109 (6.4%) | 120 (7.9%) |
| 20 to 24 Years | 127 (7.4%) | 56 (3.7%) |
| 25 to 29 Years | 38 (2.2%) | 40 (2.6%) |
| 30 to 34 Years | 81 (4.8%) | 44 (2.9%) |
| 35 to 39 Years | 25 (1.5%) | 35 (2.3%) |
| 40 to 44 Years | 107 (6.3%) | 96 (6.4%) |
| 45 to 49 Years | 83 (4.9%) | 130 (8.6%) |
| 50 to 54 Years | 238 (14.0%) | 142 (9.4%) |
| 55 to 59 Years | 116 (6.8%) | 124 (8.2%) |
| 60 to 64 Years | 190 (11.2%) | 166 (11.0%) |
| 65 to 69 Years | 166 (9.7%) | 137 (9.1%) |
| 70 to 74 Years | 15 (0.9%) | 24 (1.6%) |
| 75 to 79 Years | 18 (1.1%) | 47 (3.1%) |
| 80 to 84 Years | 15 (0.9%) | 8 (0.5%) |
| 85 Years and over | 56 (3.3%) | 10 (0.7%) |
| Total | 1,704 (100.0%) | 1,511 (100.0%) |
Families and Households in Shorewood Forest
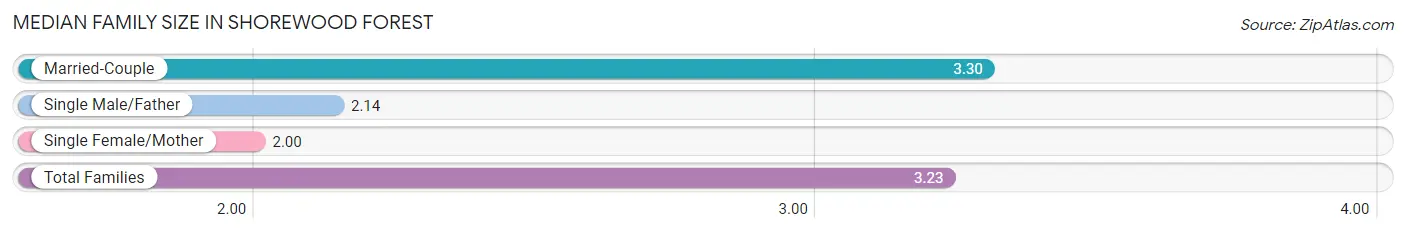
Median Family Size in Shorewood Forest
The median family size in Shorewood Forest is 3.23 persons per family, with married-couple families (896 | 93.9%) accounting for the largest median family size of 3.3 persons per family. On the other hand, single female/mother families (9 | 0.9%) represent the smallest median family size with 2.00 persons per family.
| Family Type | # Families | Family Size |
| Married-Couple | 896 (93.9%) | 3.30 |
| Single Male/Father | 49 (5.1%) | 2.14 |
| Single Female/Mother | 9 (0.9%) | 2.00 |
| Total Families | 954 (100.0%) | 3.23 |
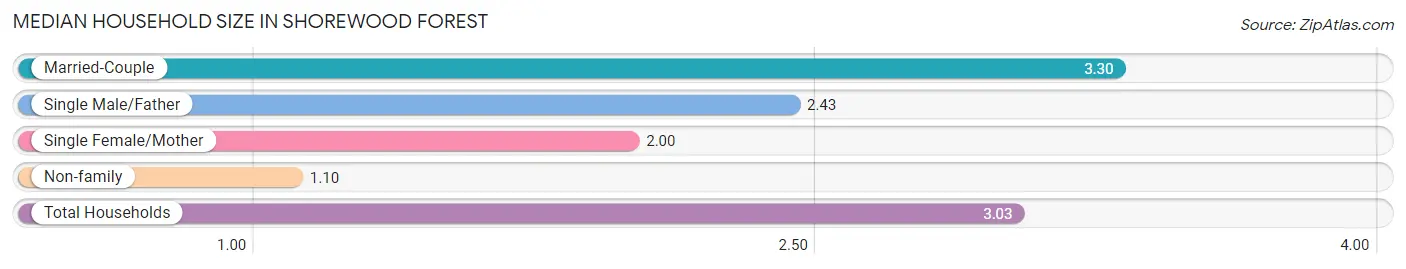
Median Household Size in Shorewood Forest
The median household size in Shorewood Forest is 3.03 persons per household, with married-couple households (896 | 84.5%) accounting for the largest median household size of 3.3 persons per household. non-family households (106 | 10.0%) represent the smallest median household size with 1.10 persons per household.
| Household Type | # Households | Household Size |
| Married-Couple | 896 (84.5%) | 3.30 |
| Single Male/Father | 49 (4.6%) | 2.43 |
| Single Female/Mother | 9 (0.9%) | 2.00 |
| Non-family | 106 (10.0%) | 1.10 |
| Total Households | 1,060 (100.0%) | 3.03 |
Household Size by Marriage Status in Shorewood Forest
Out of a total of 1,060 households in Shorewood Forest, 954 (90.0%) are family households, while 106 (10.0%) are nonfamily households. The most numerous type of family households are 2-person households, comprising 403, and the most common type of nonfamily households are 1-person households, comprising 102.
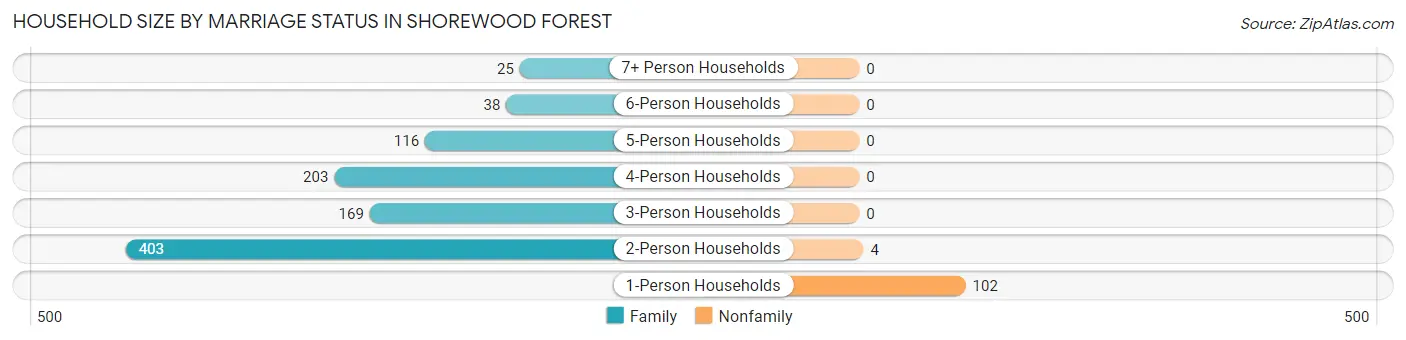
| Household Size | Family Households | Nonfamily Households |
| 1-Person Households | - | 102 (9.6%) |
| 2-Person Households | 403 (38.0%) | 4 (0.4%) |
| 3-Person Households | 169 (15.9%) | 0 (0.0%) |
| 4-Person Households | 203 (19.2%) | 0 (0.0%) |
| 5-Person Households | 116 (10.9%) | 0 (0.0%) |
| 6-Person Households | 38 (3.6%) | 0 (0.0%) |
| 7+ Person Households | 25 (2.4%) | 0 (0.0%) |
| Total | 954 (90.0%) | 106 (10.0%) |
Female Fertility in Shorewood Forest
Fertility by Age in Shorewood Forest
| Age Bracket | Women with Births | Births / 1,000 Women |
| 15 to 19 years | 0 (0.0%) | 0.0 |
| 20 to 34 years | 0 (0.0%) | 0.0 |
| 35 to 50 years | 0 (0.0%) | 0.0 |
| Total | 0 (0.0%) | 0.0 |
Fertility by Age by Marriage Status in Shorewood Forest
| Age Bracket | Married | Unmarried |
| 15 to 19 years | 0 (0.0%) | 0 (0.0%) |
| 20 to 34 years | 0 (0.0%) | 0 (0.0%) |
| 35 to 50 years | 0 (0.0%) | 0 (0.0%) |
| Total | 0 (0.0%) | 0 (0.0%) |
Fertility by Education in Shorewood Forest
| Educational Attainment | Women with Births | Births / 1,000 Women |
| Less than High School | 0 (0.0%) | 0.0 |
| High School Diploma | 0 (0.0%) | 0.0 |
| College or Associate's Degree | 0 (0.0%) | 0.0 |
| Bachelor's Degree | 0 (0.0%) | 0.0 |
| Graduate Degree | 0 (0.0%) | 0.0 |
| Total | 0 (0.0%) | 0.0 |
Fertility by Education by Marriage Status in Shorewood Forest
| Educational Attainment | Married | Unmarried |
| Less than High School | 0 (0.0%) | 0 (0.0%) |
| High School Diploma | 0 (0.0%) | 0 (0.0%) |
| College or Associate's Degree | 0 (0.0%) | 0 (0.0%) |
| Bachelor's Degree | 0 (0.0%) | 0 (0.0%) |
| Graduate Degree | 0 (0.0%) | 0 (0.0%) |
| Total | 0 (0.0%) | 0 (0.0%) |
Employment Characteristics in Shorewood Forest
Employment by Class of Employer in Shorewood Forest
Among the 1,527 employed individuals in Shorewood Forest, private company employees (949 | 62.2%), self-employed (incorporated) (184 | 12.0%), and self-employed (not incorporated) (148 | 9.7%) make up the most common classes of employment.
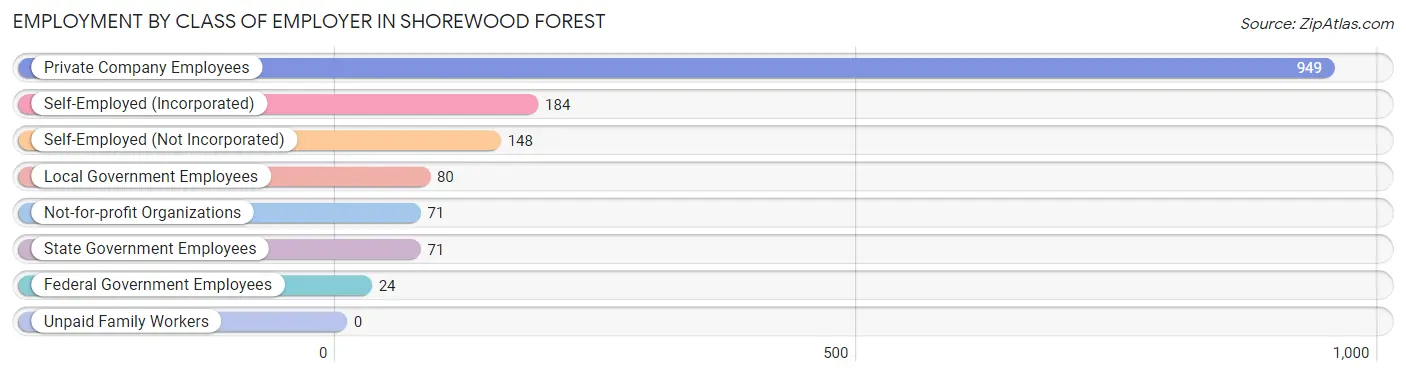
| Employer Class | # Employees | % Employees |
| Private Company Employees | 949 | 62.2% |
| Self-Employed (Incorporated) | 184 | 12.0% |
| Self-Employed (Not Incorporated) | 148 | 9.7% |
| Not-for-profit Organizations | 71 | 4.6% |
| Local Government Employees | 80 | 5.2% |
| State Government Employees | 71 | 4.6% |
| Federal Government Employees | 24 | 1.6% |
| Unpaid Family Workers | 0 | 0.0% |
| Total | 1,527 | 100.0% |
Employment Status by Age in Shorewood Forest
According to the labor force statistics for Shorewood Forest, out of the total population over 16 years of age (2,515), 62.9% or 1,582 individuals are in the labor force, with 1.4% or 22 of them unemployed. The age group with the highest labor force participation rate is 25 to 29 years, with 100.0% or 78 individuals in the labor force. Within the labor force, the 55 to 59 years age range has the highest percentage of unemployed individuals, with 11.4% or 22 of them being unemployed.
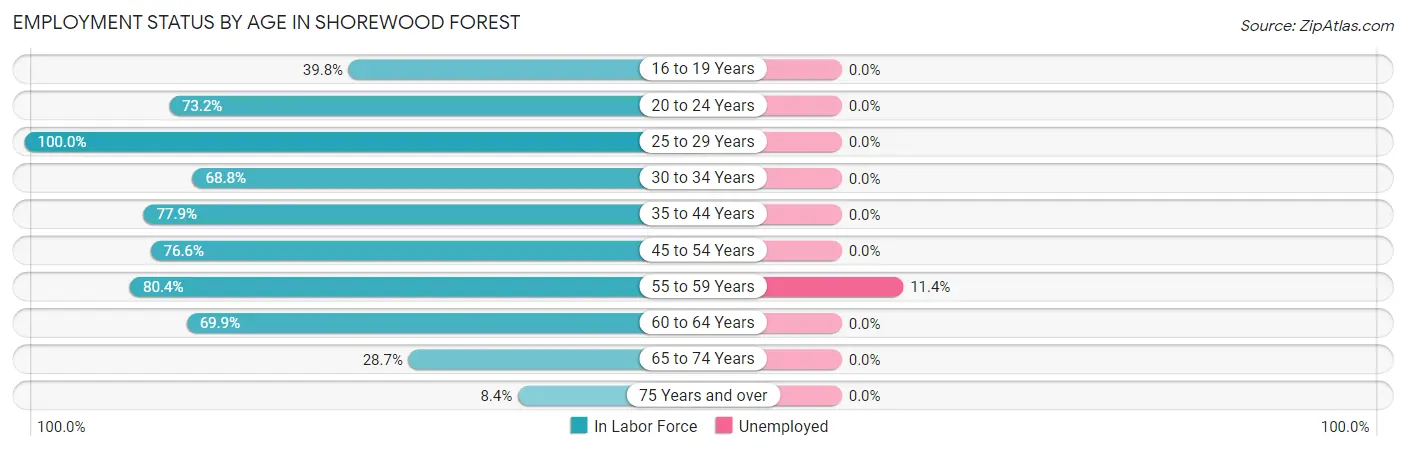
| Age Bracket | In Labor Force | Unemployed |
| 16 to 19 Years | 72 (39.8%) | 0 (0.0%) |
| 20 to 24 Years | 134 (73.2%) | 0 (0.0%) |
| 25 to 29 Years | 78 (100.0%) | 0 (0.0%) |
| 30 to 34 Years | 86 (68.8%) | 0 (0.0%) |
| 35 to 44 Years | 205 (77.9%) | 0 (0.0%) |
| 45 to 54 Years | 454 (76.6%) | 0 (0.0%) |
| 55 to 59 Years | 193 (80.4%) | 22 (11.4%) |
| 60 to 64 Years | 249 (69.9%) | 0 (0.0%) |
| 65 to 74 Years | 98 (28.7%) | 0 (0.0%) |
| 75 Years and over | 13 (8.4%) | 0 (0.0%) |
| Total | 1,582 (62.9%) | 22 (1.4%) |
Employment Status by Educational Attainment in Shorewood Forest
According to labor force statistics for Shorewood Forest, 76.4% of individuals (1,264) out of the total population between 25 and 64 years of age (1,655) are in the labor force, with 1.7% or 21 of them being unemployed. The group with the highest labor force participation rate are those with the educational attainment of bachelor's degree or higher, with 84.3% or 773 individuals in the labor force. Within the labor force, individuals with high school diploma education have the highest percentage of unemployment, with 11.3% or 22 of them being unemployed.
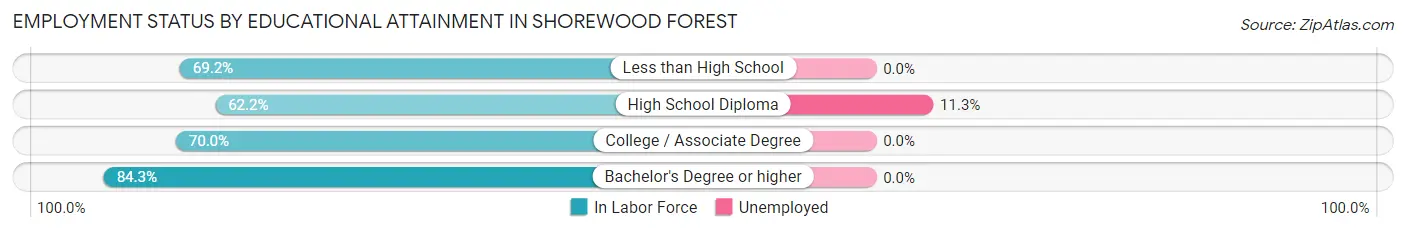
| Educational Attainment | In Labor Force | Unemployed |
| Less than High School | 9 (69.2%) | 0 (0.0%) |
| High School Diploma | 194 (62.2%) | 35 (11.3%) |
| College / Associate Degree | 289 (70.0%) | 0 (0.0%) |
| Bachelor's Degree or higher | 773 (84.3%) | 0 (0.0%) |
| Total | 1,264 (76.4%) | 28 (1.7%) |
Employment Occupations by Sex in Shorewood Forest
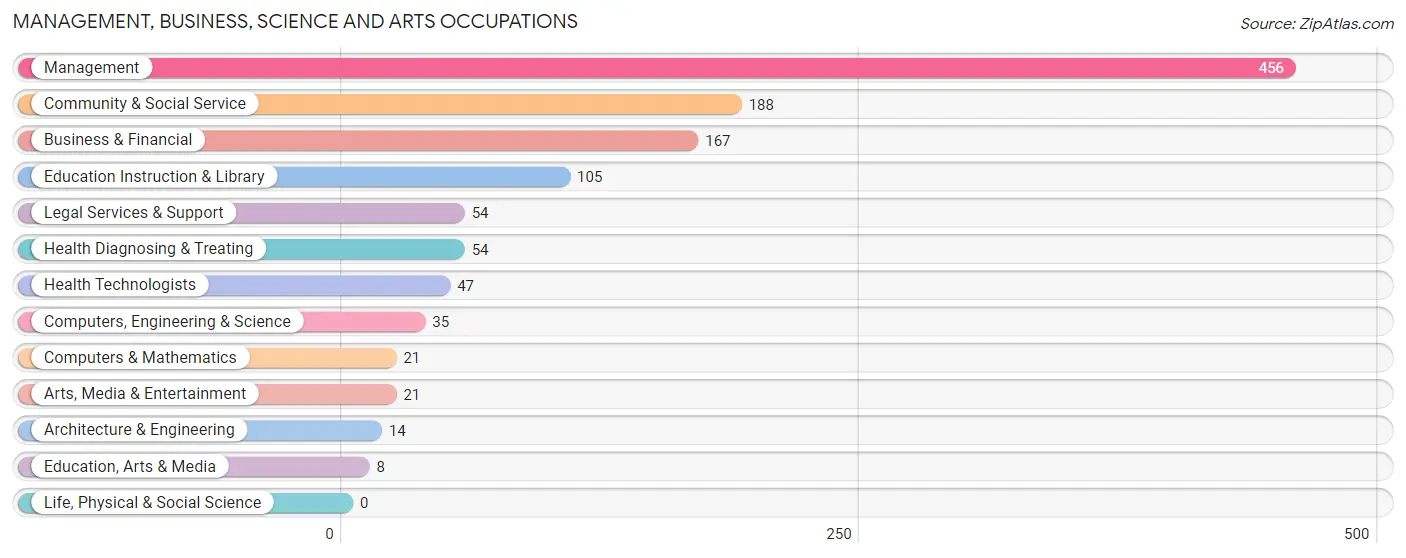
Management, Business, Science and Arts Occupations
The most common Management, Business, Science and Arts occupations in Shorewood Forest are Management (456 | 29.2%), Community & Social Service (188 | 12.0%), Business & Financial (167 | 10.7%), Education Instruction & Library (105 | 6.7%), and Legal Services & Support (54 | 3.5%).
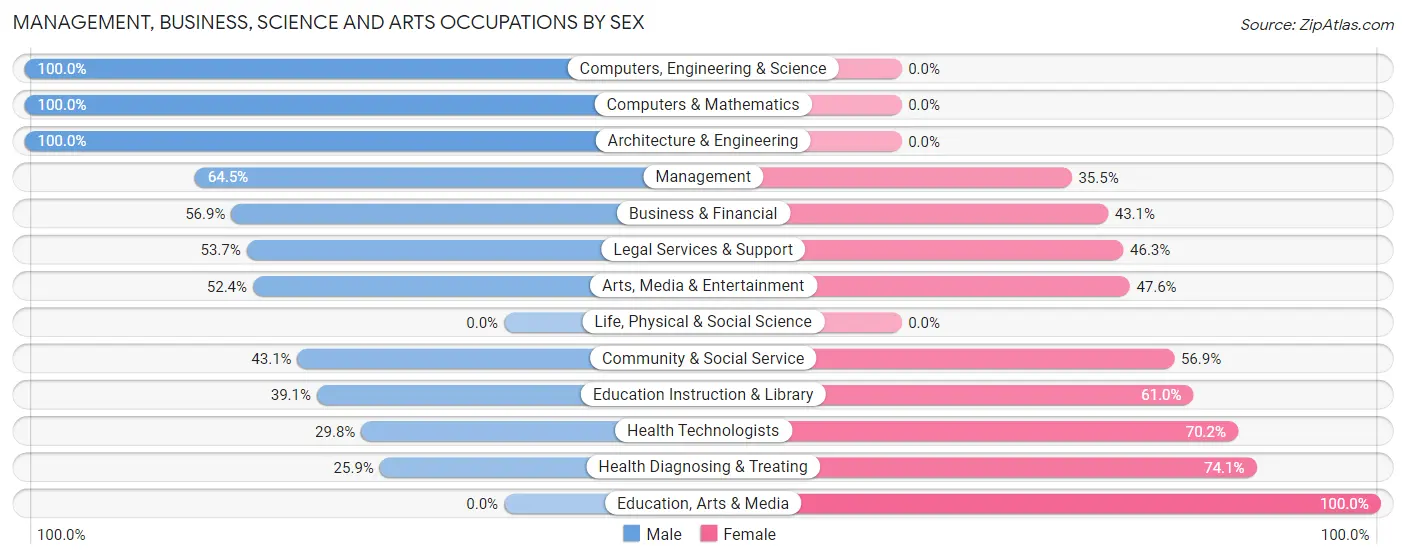
Management, Business, Science and Arts Occupations by Sex
Within the Management, Business, Science and Arts occupations in Shorewood Forest, the most male-oriented occupations are Computers, Engineering & Science (100.0%), Computers & Mathematics (100.0%), and Architecture & Engineering (100.0%), while the most female-oriented occupations are Education, Arts & Media (100.0%), Health Diagnosing & Treating (74.1%), and Health Technologists (70.2%).
| Occupation | Male | Female |
| Management | 294 (64.5%) | 162 (35.5%) |
| Business & Financial | 95 (56.9%) | 72 (43.1%) |
| Computers, Engineering & Science | 35 (100.0%) | 0 (0.0%) |
| Computers & Mathematics | 21 (100.0%) | 0 (0.0%) |
| Architecture & Engineering | 14 (100.0%) | 0 (0.0%) |
| Life, Physical & Social Science | 0 (0.0%) | 0 (0.0%) |
| Community & Social Service | 81 (43.1%) | 107 (56.9%) |
| Education, Arts & Media | 0 (0.0%) | 8 (100.0%) |
| Legal Services & Support | 29 (53.7%) | 25 (46.3%) |
| Education Instruction & Library | 41 (39.1%) | 64 (61.0%) |
| Arts, Media & Entertainment | 11 (52.4%) | 10 (47.6%) |
| Health Diagnosing & Treating | 14 (25.9%) | 40 (74.1%) |
| Health Technologists | 14 (29.8%) | 33 (70.2%) |
| Total (Category) | 519 (57.7%) | 381 (42.3%) |
| Total (Overall) | 963 (61.7%) | 597 (38.3%) |
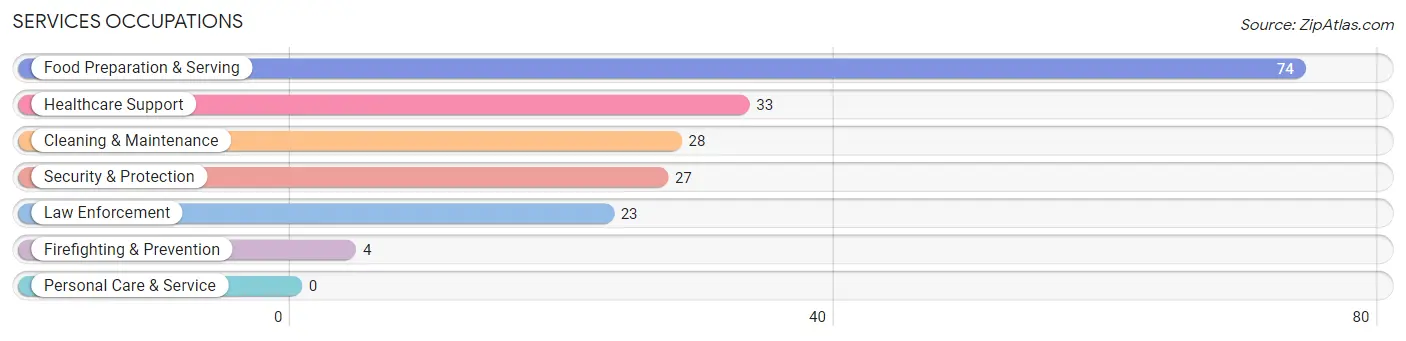
Services Occupations
The most common Services occupations in Shorewood Forest are Food Preparation & Serving (74 | 4.7%), Healthcare Support (33 | 2.1%), Cleaning & Maintenance (28 | 1.8%), Security & Protection (27 | 1.7%), and Law Enforcement (23 | 1.5%).
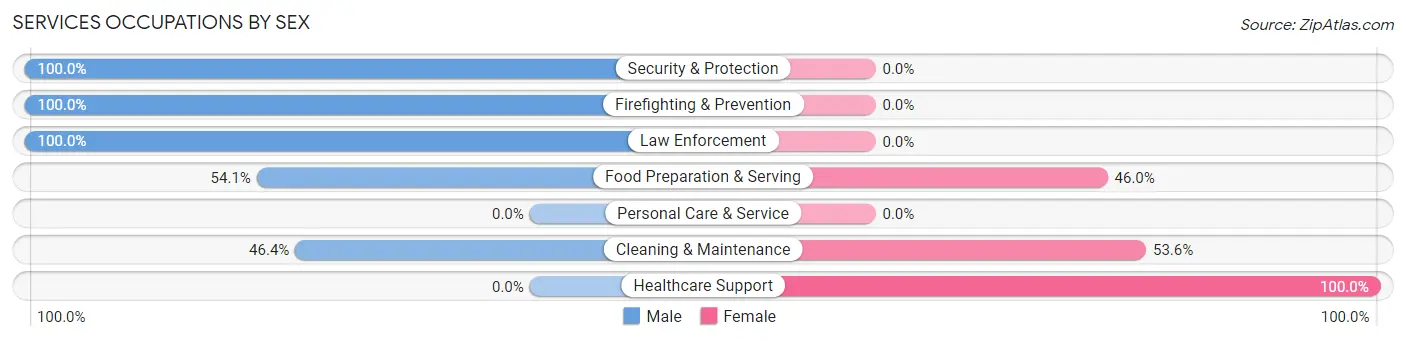
Services Occupations by Sex
Within the Services occupations in Shorewood Forest, the most male-oriented occupations are Security & Protection (100.0%), Firefighting & Prevention (100.0%), and Law Enforcement (100.0%), while the most female-oriented occupations are Healthcare Support (100.0%), Cleaning & Maintenance (53.6%), and Food Preparation & Serving (46.0%).
| Occupation | Male | Female |
| Healthcare Support | 0 (0.0%) | 33 (100.0%) |
| Security & Protection | 27 (100.0%) | 0 (0.0%) |
| Firefighting & Prevention | 4 (100.0%) | 0 (0.0%) |
| Law Enforcement | 23 (100.0%) | 0 (0.0%) |
| Food Preparation & Serving | 40 (54.0%) | 34 (46.0%) |
| Cleaning & Maintenance | 13 (46.4%) | 15 (53.6%) |
| Personal Care & Service | 0 (0.0%) | 0 (0.0%) |
| Total (Category) | 80 (49.4%) | 82 (50.6%) |
| Total (Overall) | 963 (61.7%) | 597 (38.3%) |
Sales and Office Occupations
The most common Sales and Office occupations in Shorewood Forest are Sales & Related (128 | 8.2%), and Office & Administration (95 | 6.1%).
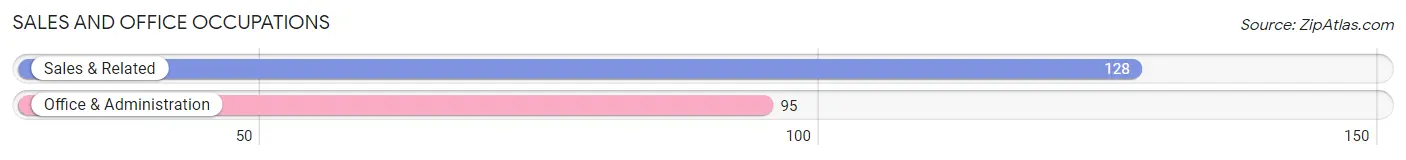
Sales and Office Occupations by Sex
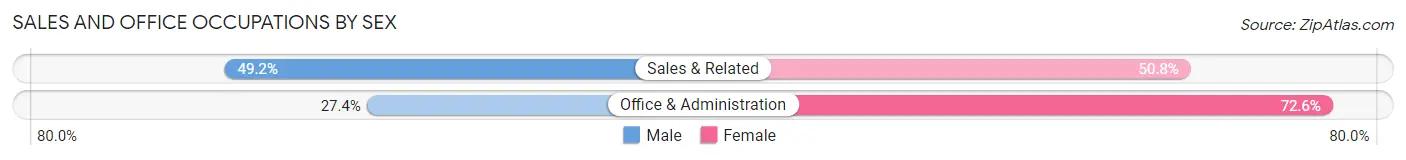
| Occupation | Male | Female |
| Sales & Related | 63 (49.2%) | 65 (50.8%) |
| Office & Administration | 26 (27.4%) | 69 (72.6%) |
| Total (Category) | 89 (39.9%) | 134 (60.1%) |
| Total (Overall) | 963 (61.7%) | 597 (38.3%) |
Natural Resources, Construction and Maintenance Occupations
The most common Natural Resources, Construction and Maintenance occupations in Shorewood Forest are Installation, Maintenance & Repair (96 | 6.1%), and Construction & Extraction (64 | 4.1%).
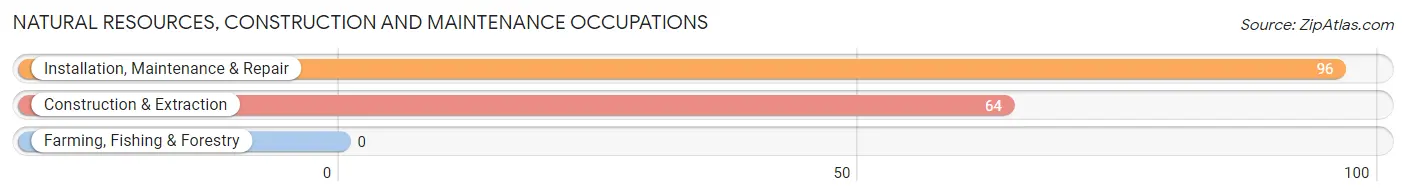
Natural Resources, Construction and Maintenance Occupations by Sex
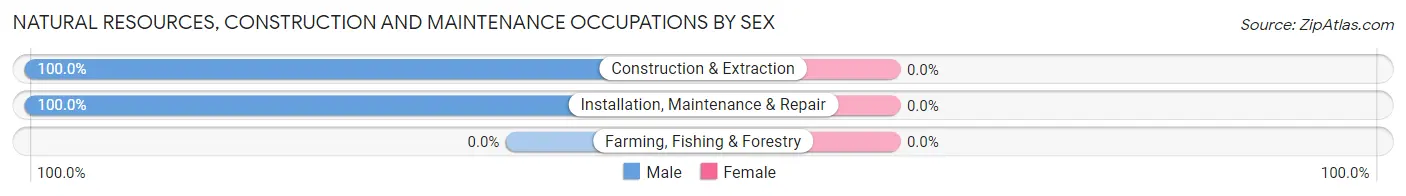
| Occupation | Male | Female |
| Farming, Fishing & Forestry | 0 (0.0%) | 0 (0.0%) |
| Construction & Extraction | 64 (100.0%) | 0 (0.0%) |
| Installation, Maintenance & Repair | 96 (100.0%) | 0 (0.0%) |
| Total (Category) | 160 (100.0%) | 0 (0.0%) |
| Total (Overall) | 963 (61.7%) | 597 (38.3%) |
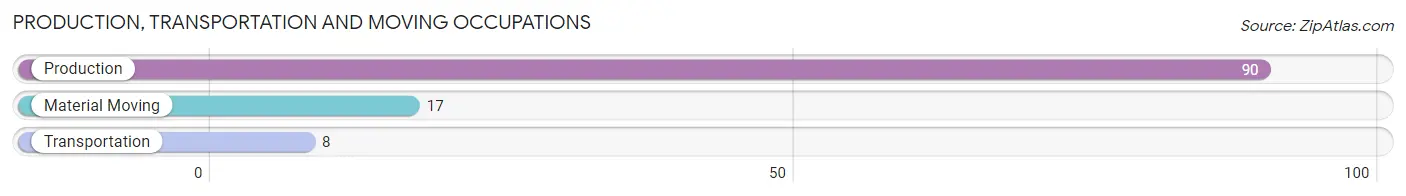
Production, Transportation and Moving Occupations
The most common Production, Transportation and Moving occupations in Shorewood Forest are Production (90 | 5.8%), Material Moving (17 | 1.1%), and Transportation (8 | 0.5%).
Production, Transportation and Moving Occupations by Sex
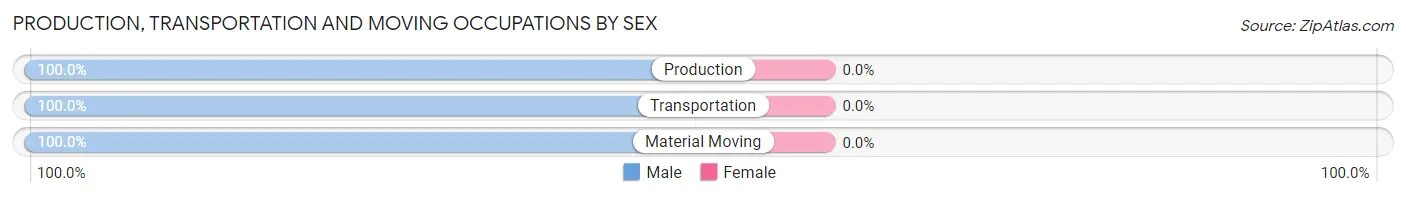
| Occupation | Male | Female |
| Production | 90 (100.0%) | 0 (0.0%) |
| Transportation | 8 (100.0%) | 0 (0.0%) |
| Material Moving | 17 (100.0%) | 0 (0.0%) |
| Total (Category) | 115 (100.0%) | 0 (0.0%) |
| Total (Overall) | 963 (61.7%) | 597 (38.3%) |
Employment Industries by Sex in Shorewood Forest
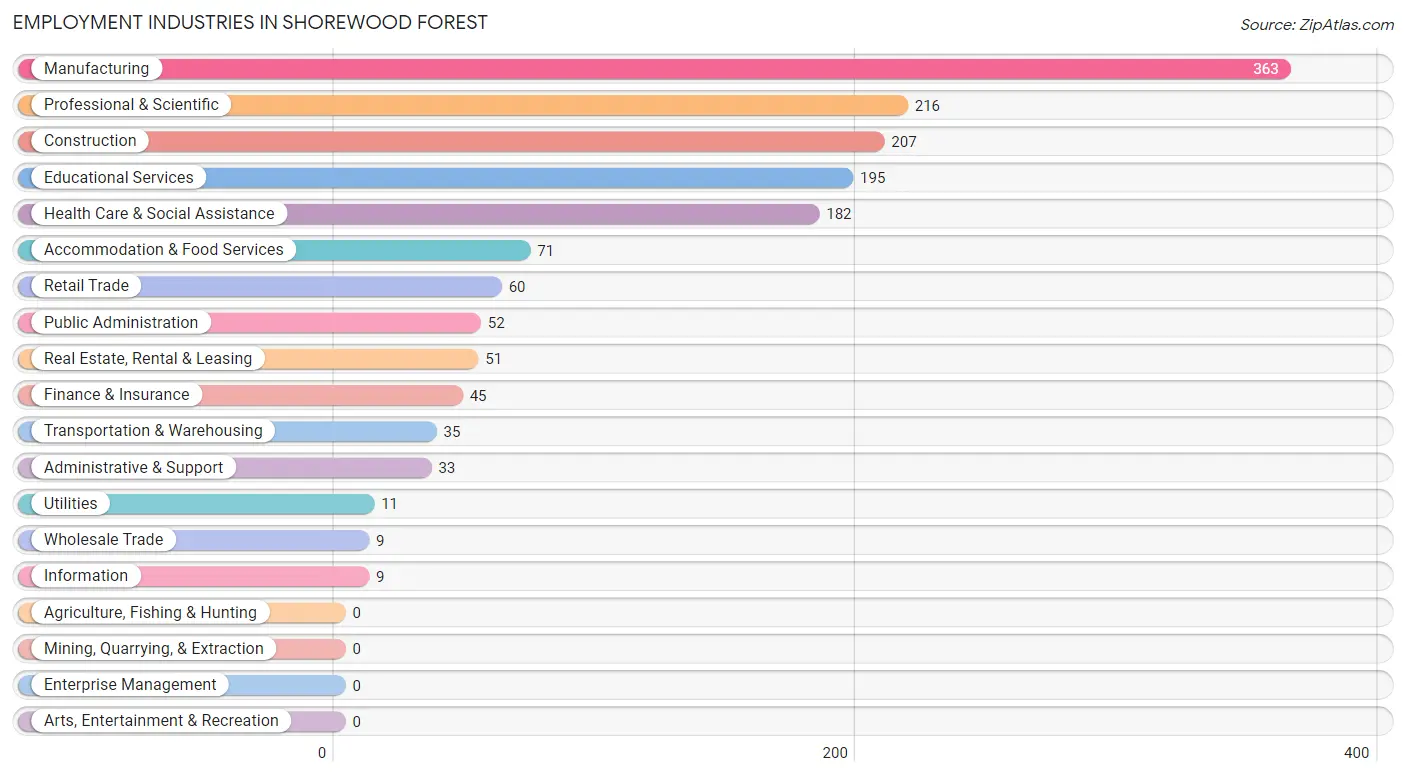
Employment Industries in Shorewood Forest
The major employment industries in Shorewood Forest include Manufacturing (363 | 23.3%), Professional & Scientific (216 | 13.9%), Construction (207 | 13.3%), Educational Services (195 | 12.5%), and Health Care & Social Assistance (182 | 11.7%).
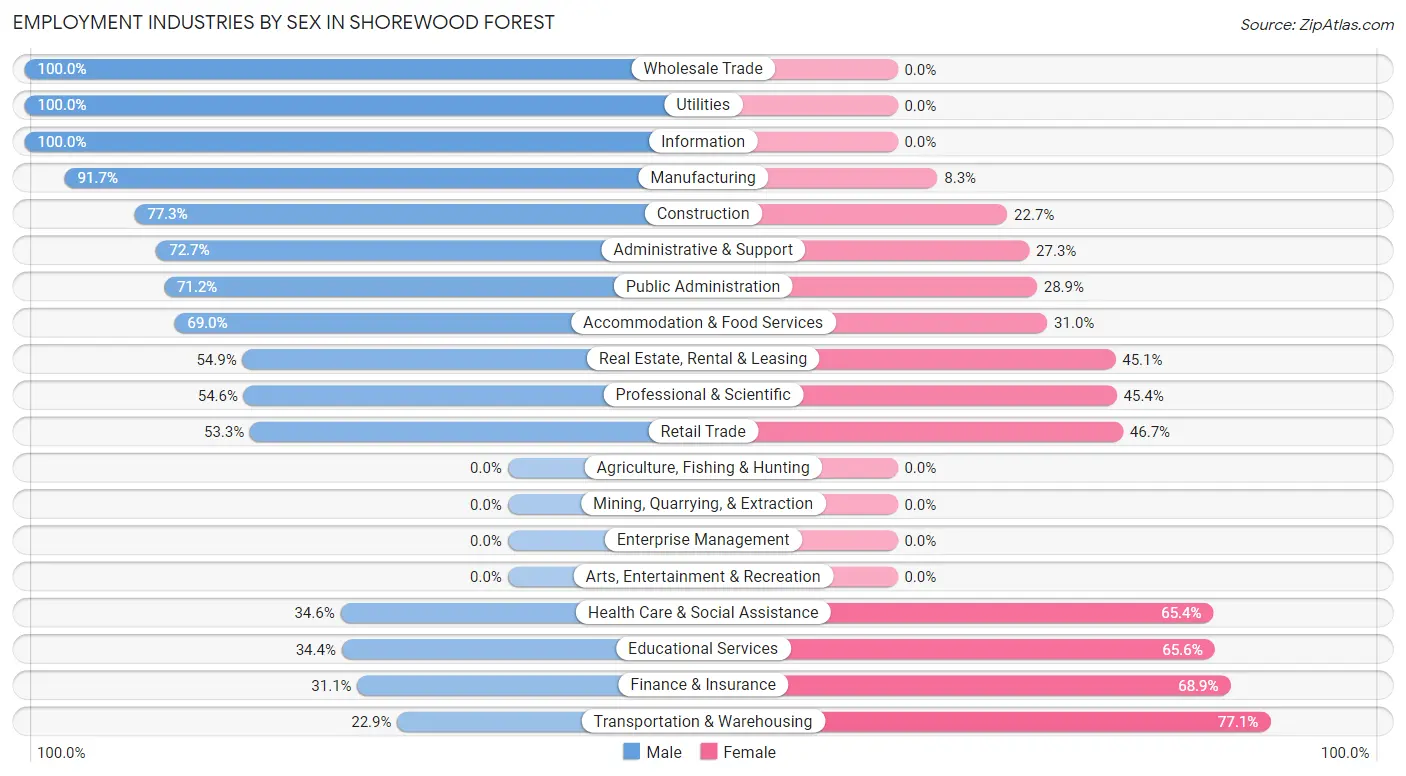
Employment Industries by Sex in Shorewood Forest
The Shorewood Forest industries that see more men than women are Wholesale Trade (100.0%), Utilities (100.0%), and Information (100.0%), whereas the industries that tend to have a higher number of women are Transportation & Warehousing (77.1%), Finance & Insurance (68.9%), and Educational Services (65.6%).
| Industry | Male | Female |
| Agriculture, Fishing & Hunting | 0 (0.0%) | 0 (0.0%) |
| Mining, Quarrying, & Extraction | 0 (0.0%) | 0 (0.0%) |
| Construction | 160 (77.3%) | 47 (22.7%) |
| Manufacturing | 333 (91.7%) | 30 (8.3%) |
| Wholesale Trade | 9 (100.0%) | 0 (0.0%) |
| Retail Trade | 32 (53.3%) | 28 (46.7%) |
| Transportation & Warehousing | 8 (22.9%) | 27 (77.1%) |
| Utilities | 11 (100.0%) | 0 (0.0%) |
| Information | 9 (100.0%) | 0 (0.0%) |
| Finance & Insurance | 14 (31.1%) | 31 (68.9%) |
| Real Estate, Rental & Leasing | 28 (54.9%) | 23 (45.1%) |
| Professional & Scientific | 118 (54.6%) | 98 (45.4%) |
| Enterprise Management | 0 (0.0%) | 0 (0.0%) |
| Administrative & Support | 24 (72.7%) | 9 (27.3%) |
| Educational Services | 67 (34.4%) | 128 (65.6%) |
| Health Care & Social Assistance | 63 (34.6%) | 119 (65.4%) |
| Arts, Entertainment & Recreation | 0 (0.0%) | 0 (0.0%) |
| Accommodation & Food Services | 49 (69.0%) | 22 (31.0%) |
| Public Administration | 37 (71.2%) | 15 (28.8%) |
| Total | 963 (61.7%) | 597 (38.3%) |
Education in Shorewood Forest
School Enrollment in Shorewood Forest
The most common levels of schooling among the 827 students in Shorewood Forest are high school (195 | 23.6%), middle school (166 | 20.1%), and nursery / preschool (162 | 19.6%).
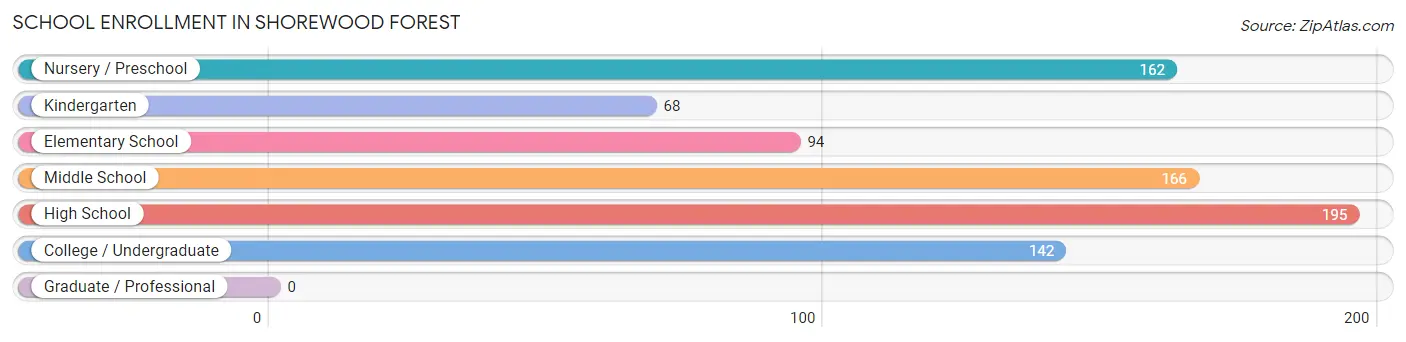
| School Level | # Students | % Students |
| Nursery / Preschool | 162 | 19.6% |
| Kindergarten | 68 | 8.2% |
| Elementary School | 94 | 11.4% |
| Middle School | 166 | 20.1% |
| High School | 195 | 23.6% |
| College / Undergraduate | 142 | 17.2% |
| Graduate / Professional | 0 | 0.0% |
| Total | 827 | 100.0% |
School Enrollment by Age by Funding Source in Shorewood Forest
Out of a total of 827 students who are enrolled in schools in Shorewood Forest, 198 (23.9%) attend a private institution, while the remaining 629 (76.1%) are enrolled in public schools. The age group of 3 to 4 year olds has the highest likelihood of being enrolled in private schools, with 113 (83.7% in the age bracket) enrolled. Conversely, the age group of 18 to 19 year olds has the lowest likelihood of being enrolled in a private school, with 76 (100.0% in the age bracket) attending a public institution.
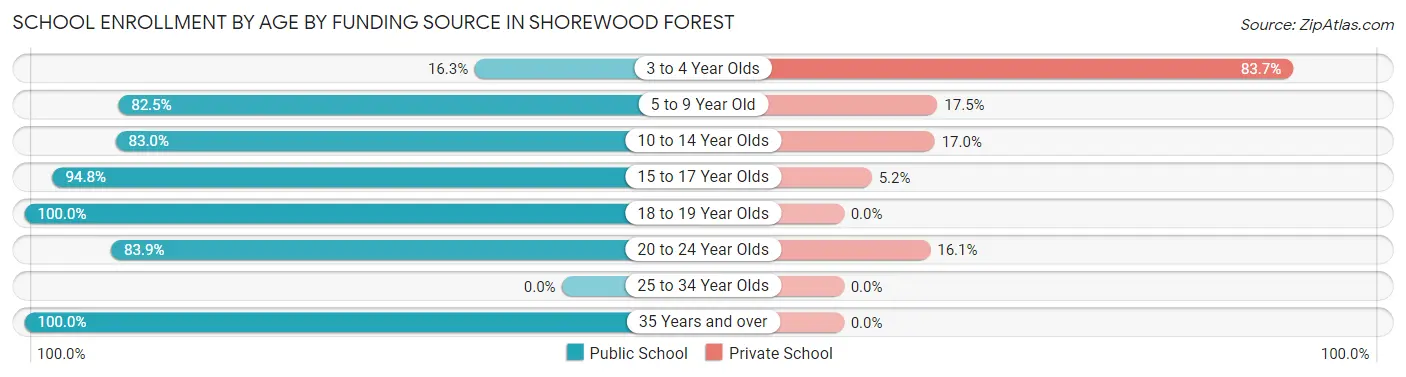
| Age Bracket | Public School | Private School |
| 3 to 4 Year Olds | 22 (16.3%) | 113 (83.7%) |
| 5 to 9 Year Old | 156 (82.5%) | 33 (17.5%) |
| 10 to 14 Year Olds | 142 (83.0%) | 29 (17.0%) |
| 15 to 17 Year Olds | 145 (94.8%) | 8 (5.2%) |
| 18 to 19 Year Olds | 76 (100.0%) | 0 (0.0%) |
| 20 to 24 Year Olds | 78 (83.9%) | 15 (16.1%) |
| 25 to 34 Year Olds | 0 (0.0%) | 0 (0.0%) |
| 35 Years and over | 10 (100.0%) | 0 (0.0%) |
| Total | 629 (76.1%) | 198 (23.9%) |
Educational Attainment by Field of Study in Shorewood Forest
Business (237 | 19.4%), education (154 | 12.6%), science & technology (136 | 11.1%), liberal arts & history (120 | 9.8%), and social sciences (117 | 9.6%) are the most common fields of study among 1,223 individuals in Shorewood Forest who have obtained a bachelor's degree or higher.
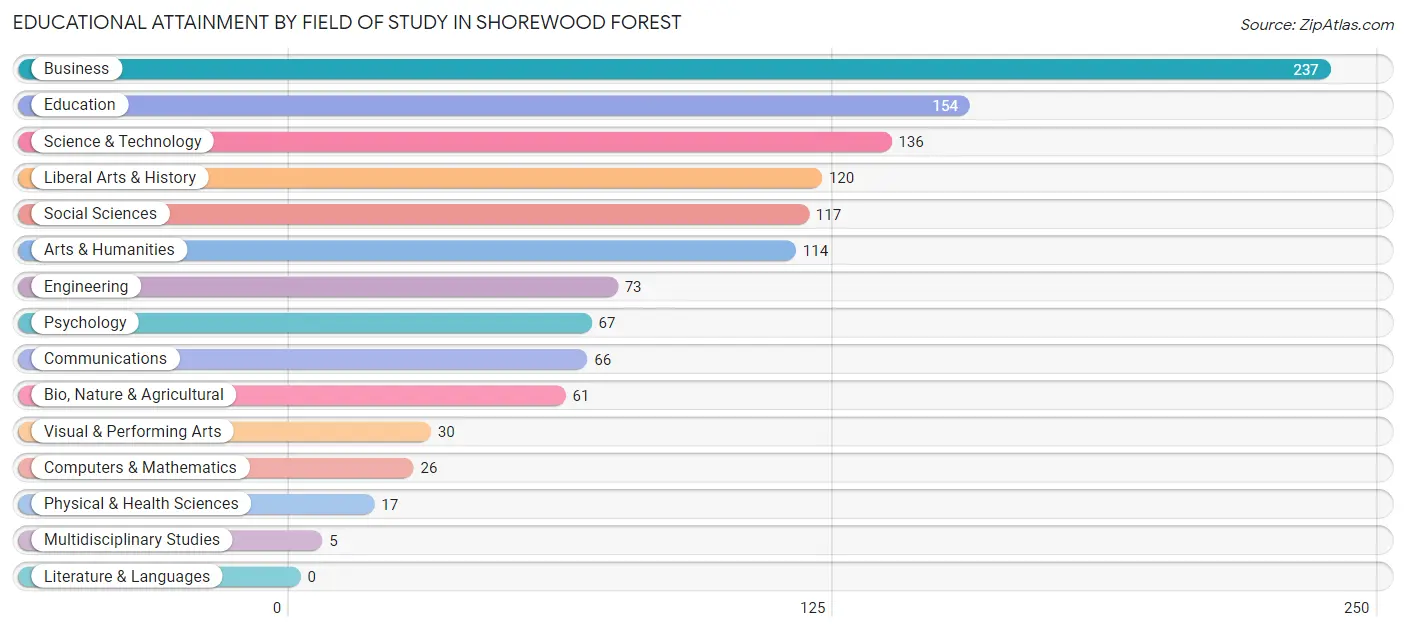
| Field of Study | # Graduates | % Graduates |
| Computers & Mathematics | 26 | 2.1% |
| Bio, Nature & Agricultural | 61 | 5.0% |
| Physical & Health Sciences | 17 | 1.4% |
| Psychology | 67 | 5.5% |
| Social Sciences | 117 | 9.6% |
| Engineering | 73 | 6.0% |
| Multidisciplinary Studies | 5 | 0.4% |
| Science & Technology | 136 | 11.1% |
| Business | 237 | 19.4% |
| Education | 154 | 12.6% |
| Literature & Languages | 0 | 0.0% |
| Liberal Arts & History | 120 | 9.8% |
| Visual & Performing Arts | 30 | 2.5% |
| Communications | 66 | 5.4% |
| Arts & Humanities | 114 | 9.3% |
| Total | 1,223 | 100.0% |
Transportation & Commute in Shorewood Forest
Vehicle Availability by Sex in Shorewood Forest
The most prevalent vehicle ownership categories in Shorewood Forest are males with 3 vehicles (351, accounting for 36.4%) and females with 3 vehicles (238, making up 62.2%).
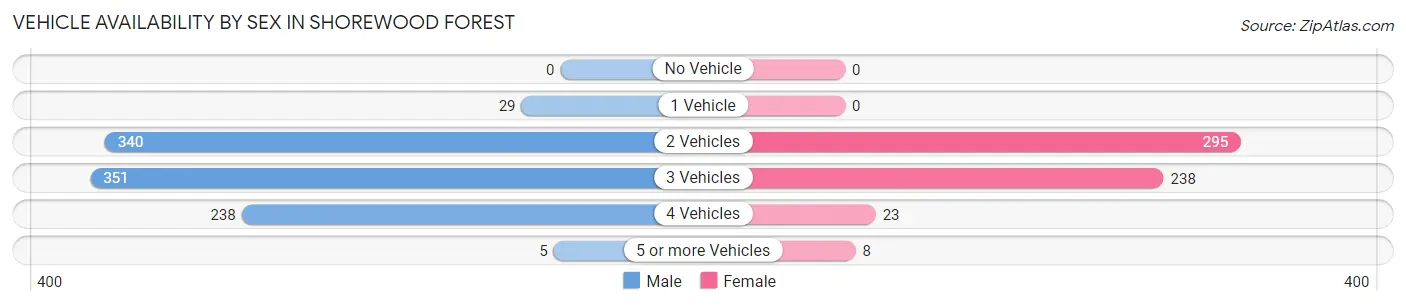
| Vehicles Available | Male | Female |
| No Vehicle | 0 (0.0%) | 0 (0.0%) |
| 1 Vehicle | 29 (3.0%) | 0 (0.0%) |
| 2 Vehicles | 340 (35.3%) | 295 (52.3%) |
| 3 Vehicles | 351 (36.4%) | 238 (42.2%) |
| 4 Vehicles | 238 (24.7%) | 23 (4.1%) |
| 5 or more Vehicles | 5 (0.5%) | 8 (1.4%) |
| Total | 963 (100.0%) | 564 (100.0%) |
Commute Time in Shorewood Forest
The most frequently occuring commute durations in Shorewood Forest are 15 to 19 minutes (290 commuters, 21.0%), 30 to 34 minutes (208 commuters, 15.0%), and 10 to 14 minutes (152 commuters, 11.0%).
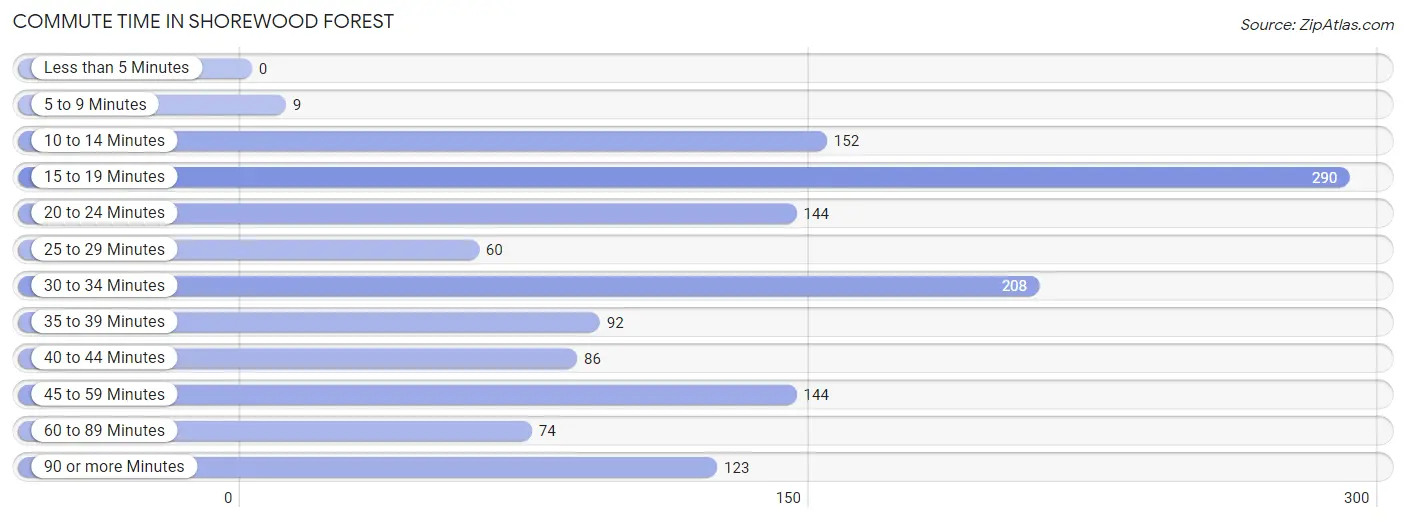
| Commute Time | # Commuters | % Commuters |
| Less than 5 Minutes | 0 | 0.0% |
| 5 to 9 Minutes | 9 | 0.6% |
| 10 to 14 Minutes | 152 | 11.0% |
| 15 to 19 Minutes | 290 | 21.0% |
| 20 to 24 Minutes | 144 | 10.4% |
| 25 to 29 Minutes | 60 | 4.3% |
| 30 to 34 Minutes | 208 | 15.0% |
| 35 to 39 Minutes | 92 | 6.7% |
| 40 to 44 Minutes | 86 | 6.2% |
| 45 to 59 Minutes | 144 | 10.4% |
| 60 to 89 Minutes | 74 | 5.3% |
| 90 or more Minutes | 123 | 8.9% |
Commute Time by Sex in Shorewood Forest
The most common commute times in Shorewood Forest are 15 to 19 minutes (225 commuters, 24.1%) for males and 30 to 34 minutes (102 commuters, 22.7%) for females.
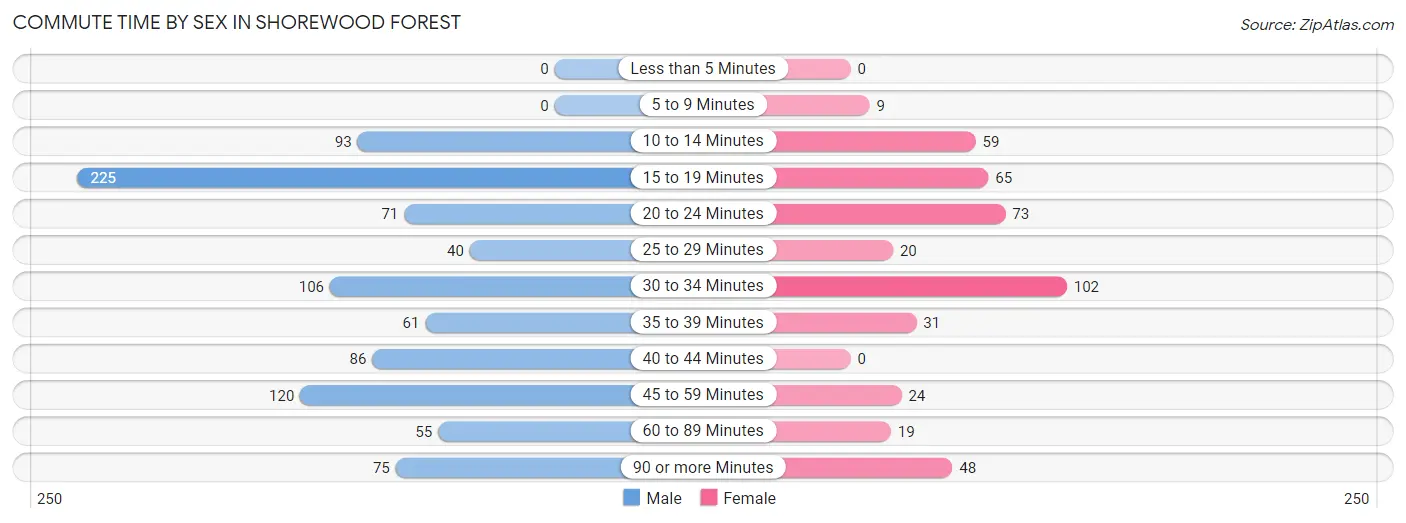
| Commute Time | Male | Female |
| Less than 5 Minutes | 0 (0.0%) | 0 (0.0%) |
| 5 to 9 Minutes | 0 (0.0%) | 9 (2.0%) |
| 10 to 14 Minutes | 93 (10.0%) | 59 (13.1%) |
| 15 to 19 Minutes | 225 (24.1%) | 65 (14.4%) |
| 20 to 24 Minutes | 71 (7.6%) | 73 (16.2%) |
| 25 to 29 Minutes | 40 (4.3%) | 20 (4.4%) |
| 30 to 34 Minutes | 106 (11.4%) | 102 (22.7%) |
| 35 to 39 Minutes | 61 (6.6%) | 31 (6.9%) |
| 40 to 44 Minutes | 86 (9.2%) | 0 (0.0%) |
| 45 to 59 Minutes | 120 (12.9%) | 24 (5.3%) |
| 60 to 89 Minutes | 55 (5.9%) | 19 (4.2%) |
| 90 or more Minutes | 75 (8.1%) | 48 (10.7%) |
Time of Departure to Work by Sex in Shorewood Forest
The most frequent times of departure to work in Shorewood Forest are 7:00 AM to 7:29 AM (152, 16.3%) for males and 7:00 AM to 7:29 AM (140, 31.1%) for females.
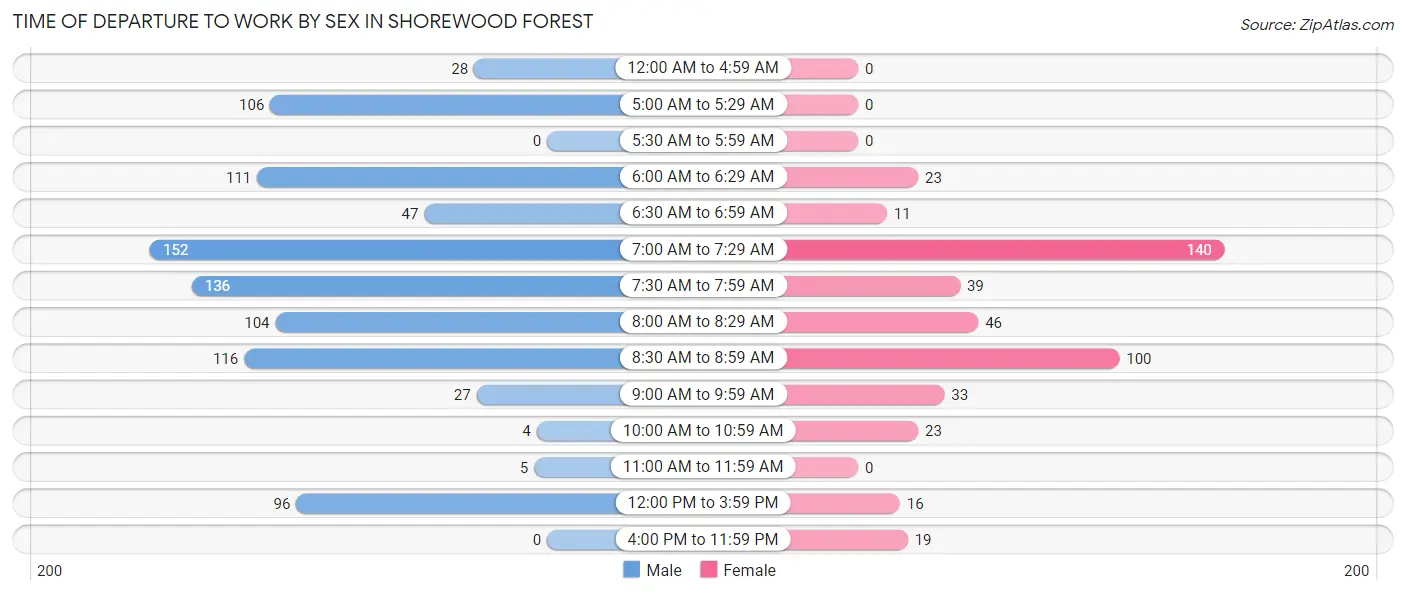
| Time of Departure | Male | Female |
| 12:00 AM to 4:59 AM | 28 (3.0%) | 0 (0.0%) |
| 5:00 AM to 5:29 AM | 106 (11.4%) | 0 (0.0%) |
| 5:30 AM to 5:59 AM | 0 (0.0%) | 0 (0.0%) |
| 6:00 AM to 6:29 AM | 111 (11.9%) | 23 (5.1%) |
| 6:30 AM to 6:59 AM | 47 (5.0%) | 11 (2.4%) |
| 7:00 AM to 7:29 AM | 152 (16.3%) | 140 (31.1%) |
| 7:30 AM to 7:59 AM | 136 (14.6%) | 39 (8.7%) |
| 8:00 AM to 8:29 AM | 104 (11.2%) | 46 (10.2%) |
| 8:30 AM to 8:59 AM | 116 (12.4%) | 100 (22.2%) |
| 9:00 AM to 9:59 AM | 27 (2.9%) | 33 (7.3%) |
| 10:00 AM to 10:59 AM | 4 (0.4%) | 23 (5.1%) |
| 11:00 AM to 11:59 AM | 5 (0.5%) | 0 (0.0%) |
| 12:00 PM to 3:59 PM | 96 (10.3%) | 16 (3.6%) |
| 4:00 PM to 11:59 PM | 0 (0.0%) | 19 (4.2%) |
| Total | 932 (100.0%) | 450 (100.0%) |
Housing Occupancy in Shorewood Forest
Occupancy by Ownership in Shorewood Forest
Of the total 1,060 dwellings in Shorewood Forest, owner-occupied units account for 1,060 (100.0%), while renter-occupied units make up 0 (0.0%).
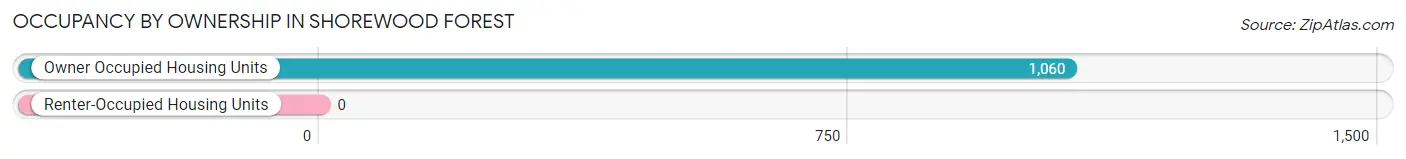
| Occupancy | # Housing Units | % Housing Units |
| Owner Occupied Housing Units | 1,060 | 100.0% |
| Renter-Occupied Housing Units | 0 | 0.0% |
| Total Occupied Housing Units | 1,060 | 100.0% |
Occupancy by Household Size in Shorewood Forest
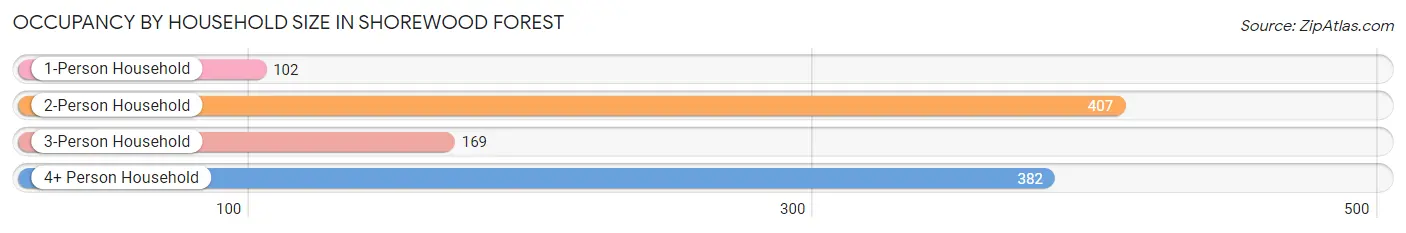
| Household Size | # Housing Units | % Housing Units |
| 1-Person Household | 102 | 9.6% |
| 2-Person Household | 407 | 38.4% |
| 3-Person Household | 169 | 15.9% |
| 4+ Person Household | 382 | 36.0% |
| Total Housing Units | 1,060 | 100.0% |
Occupancy by Ownership by Household Size in Shorewood Forest
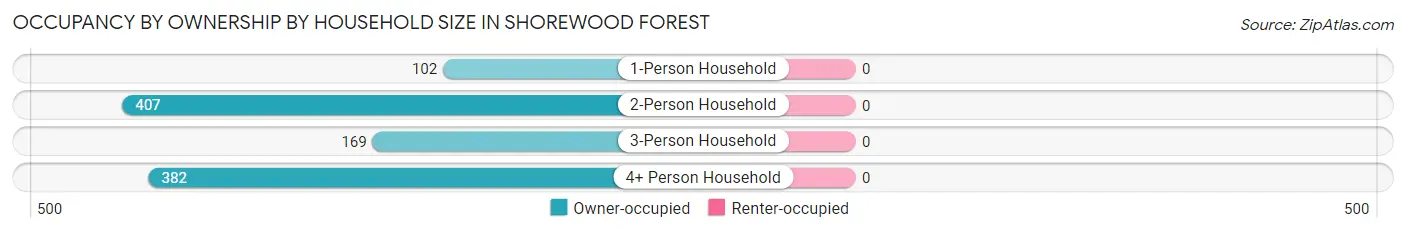
| Household Size | Owner-occupied | Renter-occupied |
| 1-Person Household | 102 (100.0%) | 0 (0.0%) |
| 2-Person Household | 407 (100.0%) | 0 (0.0%) |
| 3-Person Household | 169 (100.0%) | 0 (0.0%) |
| 4+ Person Household | 382 (100.0%) | 0 (0.0%) |
| Total Housing Units | 1,060 (100.0%) | 0 (0.0%) |
Occupancy by Educational Attainment in Shorewood Forest
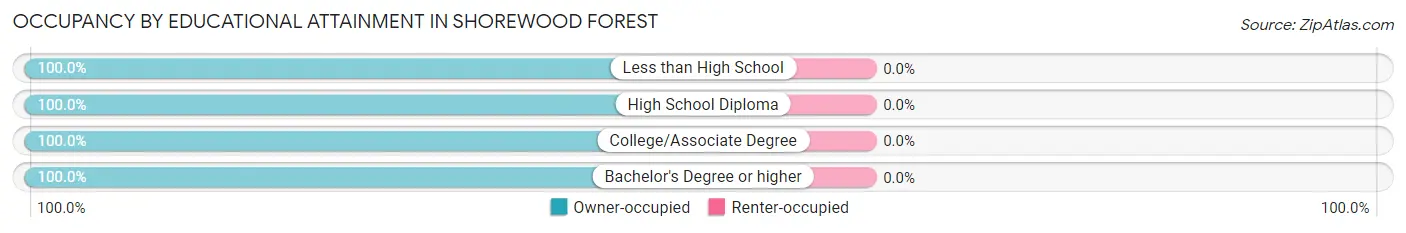
| Household Size | Owner-occupied | Renter-occupied |
| Less than High School | 3 (100.0%) | 0 (0.0%) |
| High School Diploma | 191 (100.0%) | 0 (0.0%) |
| College/Associate Degree | 273 (100.0%) | 0 (0.0%) |
| Bachelor's Degree or higher | 593 (100.0%) | 0 (0.0%) |
Occupancy by Age of Householder in Shorewood Forest
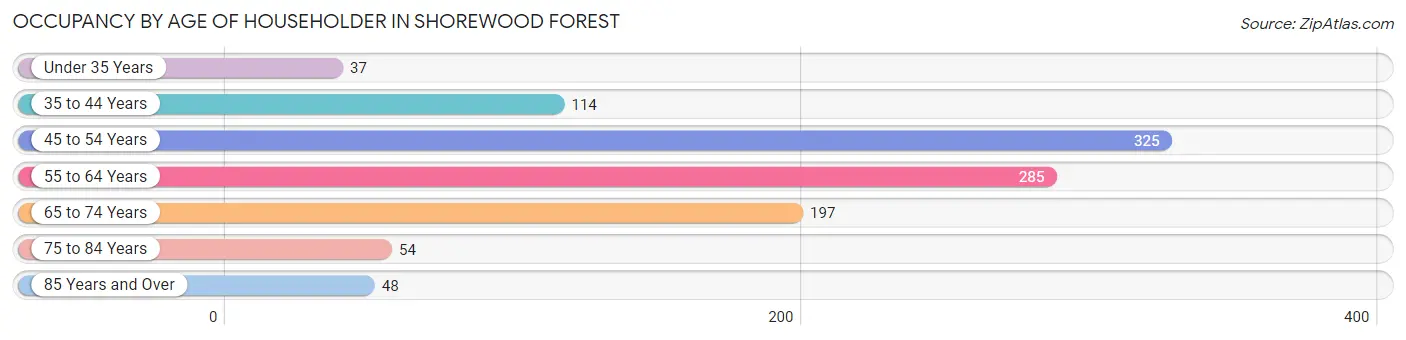
| Age Bracket | # Households | % Households |
| Under 35 Years | 37 | 3.5% |
| 35 to 44 Years | 114 | 10.7% |
| 45 to 54 Years | 325 | 30.7% |
| 55 to 64 Years | 285 | 26.9% |
| 65 to 74 Years | 197 | 18.6% |
| 75 to 84 Years | 54 | 5.1% |
| 85 Years and Over | 48 | 4.5% |
| Total | 1,060 | 100.0% |
Housing Finances in Shorewood Forest
Median Income by Occupancy in Shorewood Forest
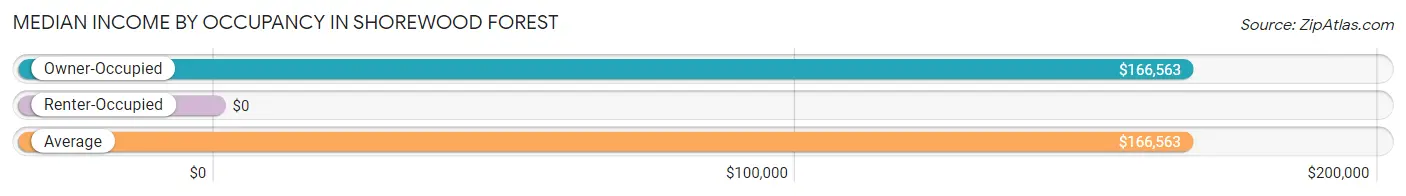
| Occupancy Type | # Households | Median Income |
| Owner-Occupied | 1,060 (100.0%) | $166,563 |
| Renter-Occupied | 0 (0.0%) | $0 |
| Average | 1,060 (100.0%) | $166,563 |
Occupancy by Householder Income Bracket in Shorewood Forest
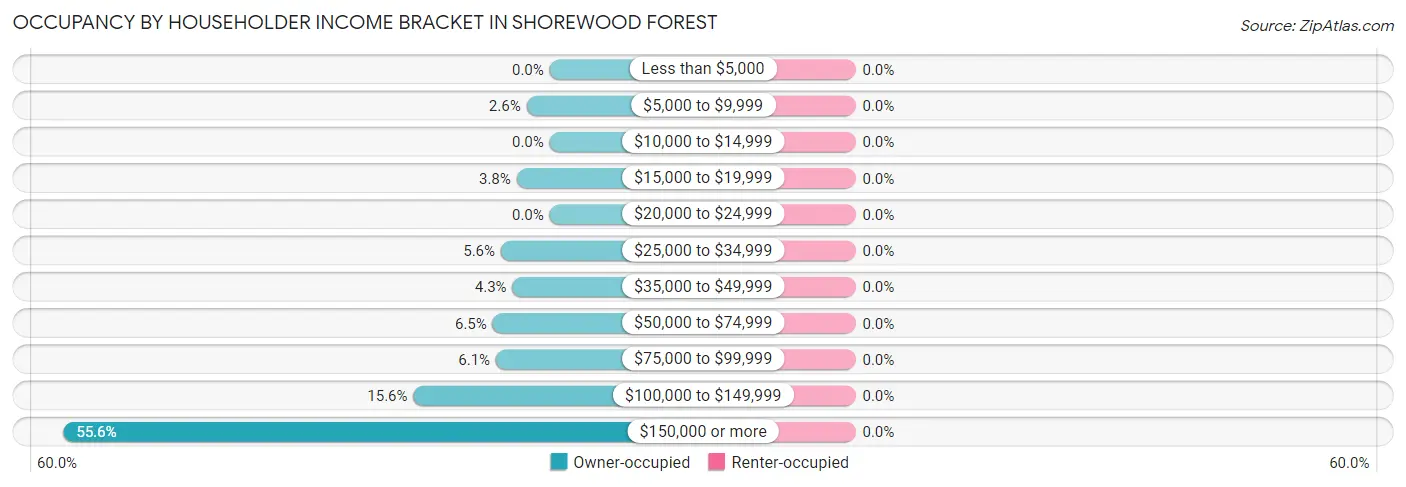
| Income Bracket | Owner-occupied | Renter-occupied |
| Less than $5,000 | 0 (0.0%) | 0 (0.0%) |
| $5,000 to $9,999 | 28 (2.6%) | 0 (0.0%) |
| $10,000 to $14,999 | 0 (0.0%) | 0 (0.0%) |
| $15,000 to $19,999 | 40 (3.8%) | 0 (0.0%) |
| $20,000 to $24,999 | 0 (0.0%) | 0 (0.0%) |
| $25,000 to $34,999 | 59 (5.6%) | 0 (0.0%) |
| $35,000 to $49,999 | 45 (4.3%) | 0 (0.0%) |
| $50,000 to $74,999 | 69 (6.5%) | 0 (0.0%) |
| $75,000 to $99,999 | 65 (6.1%) | 0 (0.0%) |
| $100,000 to $149,999 | 165 (15.6%) | 0 (0.0%) |
| $150,000 or more | 589 (55.6%) | 0 (0.0%) |
| Total | 1,060 (100.0%) | 0 (0.0%) |
Monthly Housing Cost Tiers in Shorewood Forest
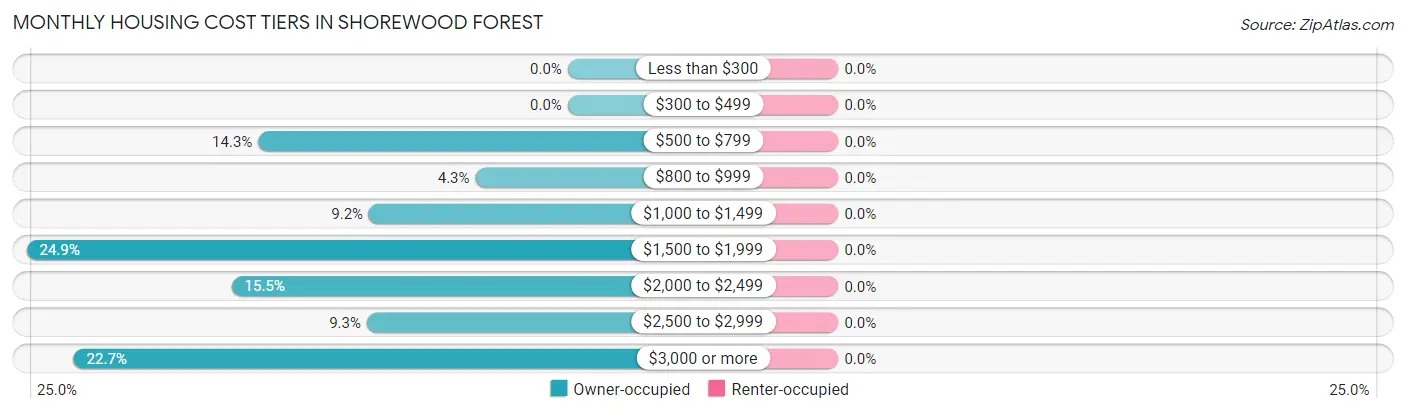
| Monthly Cost | Owner-occupied | Renter-occupied |
| Less than $300 | 0 (0.0%) | 0 (0.0%) |
| $300 to $499 | 0 (0.0%) | 0 (0.0%) |
| $500 to $799 | 151 (14.2%) | 0 (0.0%) |
| $800 to $999 | 45 (4.3%) | 0 (0.0%) |
| $1,000 to $1,499 | 97 (9.1%) | 0 (0.0%) |
| $1,500 to $1,999 | 264 (24.9%) | 0 (0.0%) |
| $2,000 to $2,499 | 164 (15.5%) | 0 (0.0%) |
| $2,500 to $2,999 | 98 (9.2%) | 0 (0.0%) |
| $3,000 or more | 241 (22.7%) | 0 (0.0%) |
| Total | 1,060 (100.0%) | 0 (0.0%) |
Physical Housing Characteristics in Shorewood Forest
Housing Structures in Shorewood Forest
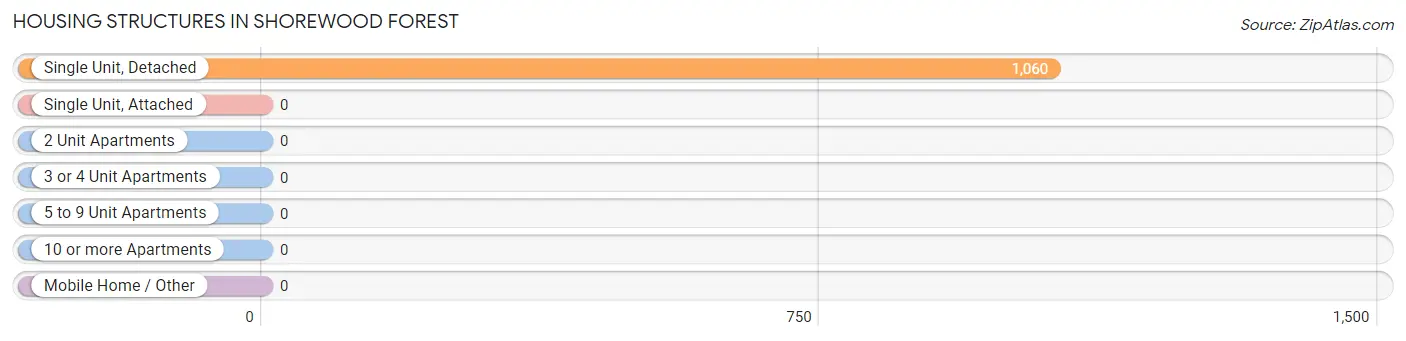
| Structure Type | # Housing Units | % Housing Units |
| Single Unit, Detached | 1,060 | 100.0% |
| Single Unit, Attached | 0 | 0.0% |
| 2 Unit Apartments | 0 | 0.0% |
| 3 or 4 Unit Apartments | 0 | 0.0% |
| 5 to 9 Unit Apartments | 0 | 0.0% |
| 10 or more Apartments | 0 | 0.0% |
| Mobile Home / Other | 0 | 0.0% |
| Total | 1,060 | 100.0% |
Housing Structures by Occupancy in Shorewood Forest
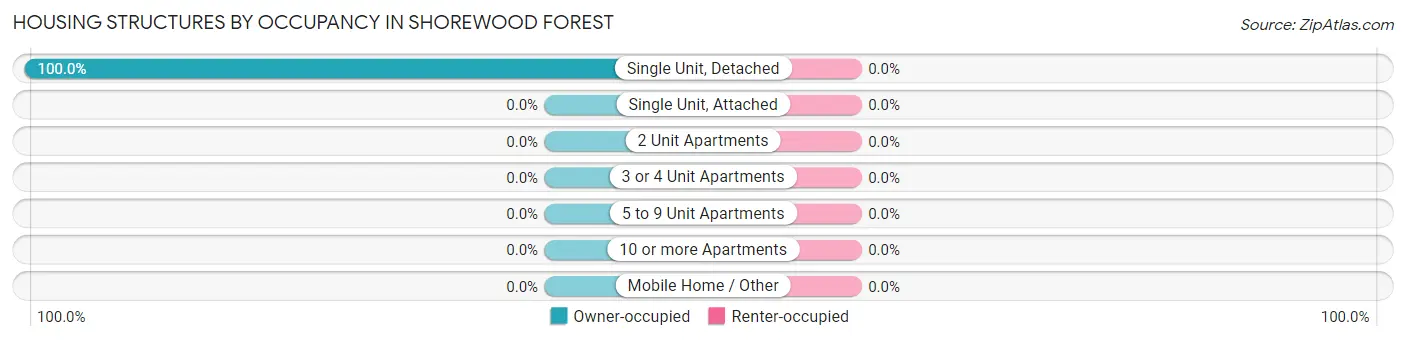
| Structure Type | Owner-occupied | Renter-occupied |
| Single Unit, Detached | 1,060 (100.0%) | 0 (0.0%) |
| Single Unit, Attached | 0 (0.0%) | 0 (0.0%) |
| 2 Unit Apartments | 0 (0.0%) | 0 (0.0%) |
| 3 or 4 Unit Apartments | 0 (0.0%) | 0 (0.0%) |
| 5 to 9 Unit Apartments | 0 (0.0%) | 0 (0.0%) |
| 10 or more Apartments | 0 (0.0%) | 0 (0.0%) |
| Mobile Home / Other | 0 (0.0%) | 0 (0.0%) |
| Total | 1,060 (100.0%) | 0 (0.0%) |
Housing Structures by Number of Rooms in Shorewood Forest
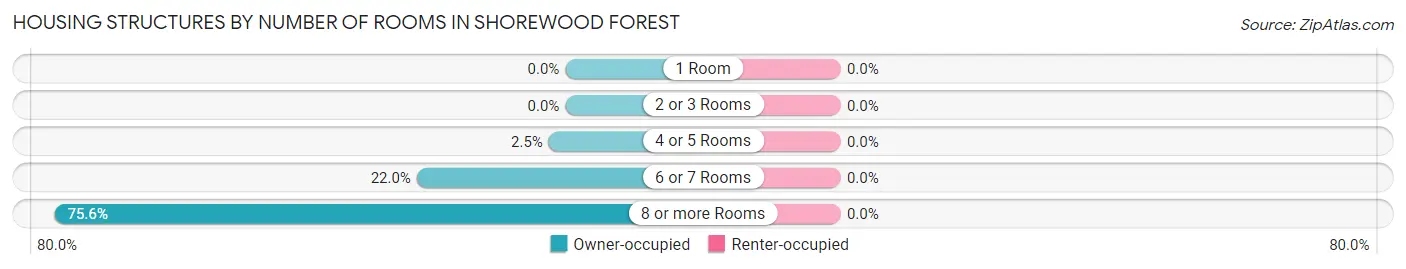
| Number of Rooms | Owner-occupied | Renter-occupied |
| 1 Room | 0 (0.0%) | 0 (0.0%) |
| 2 or 3 Rooms | 0 (0.0%) | 0 (0.0%) |
| 4 or 5 Rooms | 26 (2.5%) | 0 (0.0%) |
| 6 or 7 Rooms | 233 (22.0%) | 0 (0.0%) |
| 8 or more Rooms | 801 (75.6%) | 0 (0.0%) |
| Total | 1,060 (100.0%) | 0 (0.0%) |
Housing Structure by Heating Type in Shorewood Forest
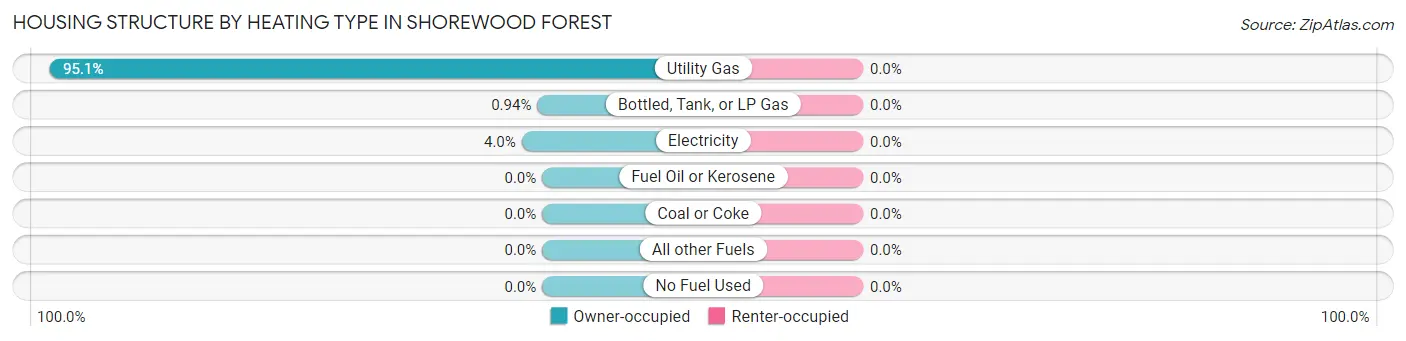
| Heating Type | Owner-occupied | Renter-occupied |
| Utility Gas | 1,008 (95.1%) | 0 (0.0%) |
| Bottled, Tank, or LP Gas | 10 (0.9%) | 0 (0.0%) |
| Electricity | 42 (4.0%) | 0 (0.0%) |
| Fuel Oil or Kerosene | 0 (0.0%) | 0 (0.0%) |
| Coal or Coke | 0 (0.0%) | 0 (0.0%) |
| All other Fuels | 0 (0.0%) | 0 (0.0%) |
| No Fuel Used | 0 (0.0%) | 0 (0.0%) |
| Total | 1,060 (100.0%) | 0 (0.0%) |
Household Vehicle Usage in Shorewood Forest
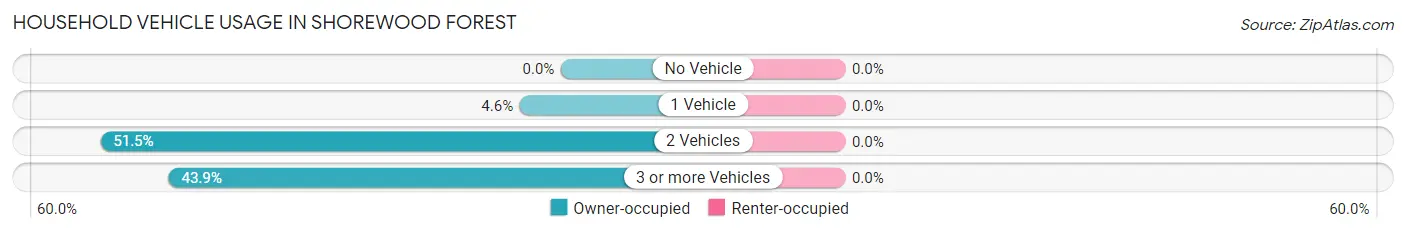
| Vehicles per Household | Owner-occupied | Renter-occupied |
| No Vehicle | 0 (0.0%) | 0 (0.0%) |
| 1 Vehicle | 49 (4.6%) | 0 (0.0%) |
| 2 Vehicles | 546 (51.5%) | 0 (0.0%) |
| 3 or more Vehicles | 465 (43.9%) | 0 (0.0%) |
| Total | 1,060 (100.0%) | 0 (0.0%) |
Real Estate & Mortgages in Shorewood Forest
Real Estate and Mortgage Overview in Shorewood Forest
| Characteristic | Without Mortgage | With Mortgage |
| Housing Units | 282 | 778 |
| Median Property Value | $488,900 | $429,700 |
| Median Household Income | $180,357 | $411 |
| Monthly Housing Costs | $777 | $241 |
| Real Estate Taxes | $3,189 | $0 |
Property Value by Mortgage Status in Shorewood Forest
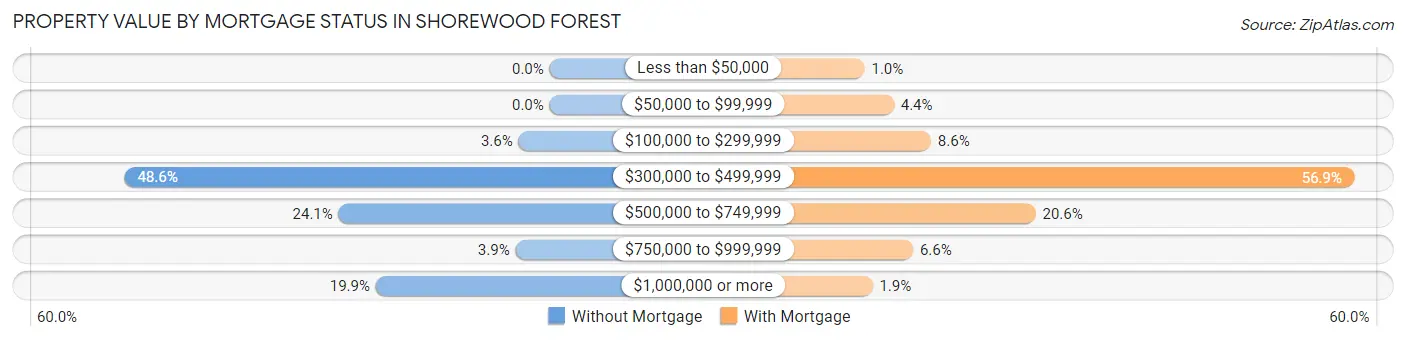
| Property Value | Without Mortgage | With Mortgage |
| Less than $50,000 | 0 (0.0%) | 8 (1.0%) |
| $50,000 to $99,999 | 0 (0.0%) | 34 (4.4%) |
| $100,000 to $299,999 | 10 (3.5%) | 67 (8.6%) |
| $300,000 to $499,999 | 137 (48.6%) | 443 (56.9%) |
| $500,000 to $749,999 | 68 (24.1%) | 160 (20.6%) |
| $750,000 to $999,999 | 11 (3.9%) | 51 (6.6%) |
| $1,000,000 or more | 56 (19.9%) | 15 (1.9%) |
| Total | 282 (100.0%) | 778 (100.0%) |
Household Income by Mortgage Status in Shorewood Forest
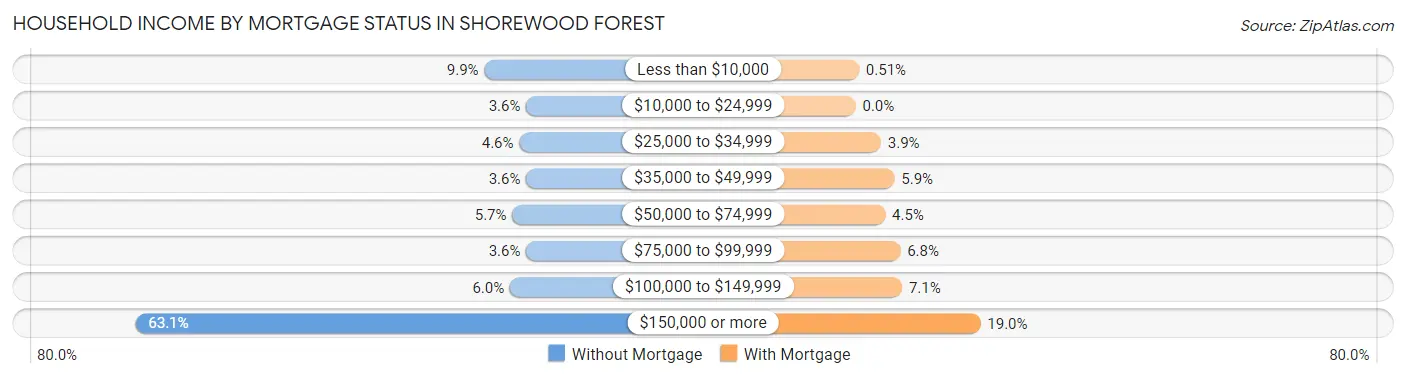
| Household Income | Without Mortgage | With Mortgage |
| Less than $10,000 | 28 (9.9%) | 4 (0.5%) |
| $10,000 to $24,999 | 10 (3.5%) | 0 (0.0%) |
| $25,000 to $34,999 | 13 (4.6%) | 30 (3.9%) |
| $35,000 to $49,999 | 10 (3.5%) | 46 (5.9%) |
| $50,000 to $74,999 | 16 (5.7%) | 35 (4.5%) |
| $75,000 to $99,999 | 10 (3.5%) | 53 (6.8%) |
| $100,000 to $149,999 | 17 (6.0%) | 55 (7.1%) |
| $150,000 or more | 178 (63.1%) | 148 (19.0%) |
| Total | 282 (100.0%) | 778 (100.0%) |
Property Value to Household Income Ratio in Shorewood Forest
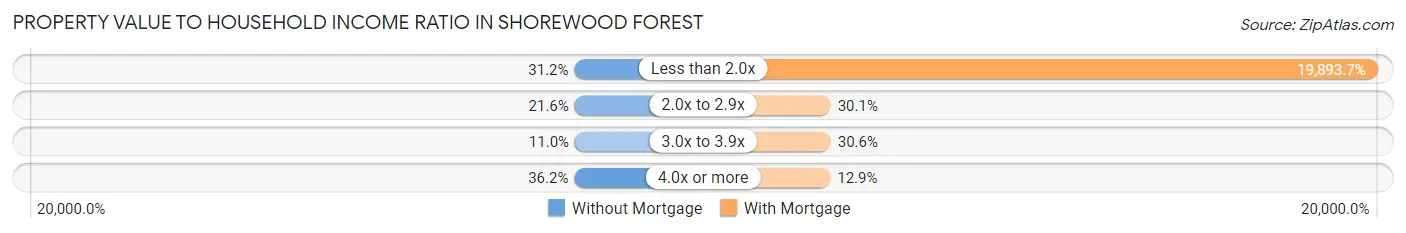
| Value-to-Income Ratio | Without Mortgage | With Mortgage |
| Less than 2.0x | 88 (31.2%) | 154,773 (19,893.7%) |
| 2.0x to 2.9x | 61 (21.6%) | 234 (30.1%) |
| 3.0x to 3.9x | 31 (11.0%) | 238 (30.6%) |
| 4.0x or more | 102 (36.2%) | 100 (12.9%) |
| Total | 282 (100.0%) | 778 (100.0%) |
Real Estate Taxes by Mortgage Status in Shorewood Forest
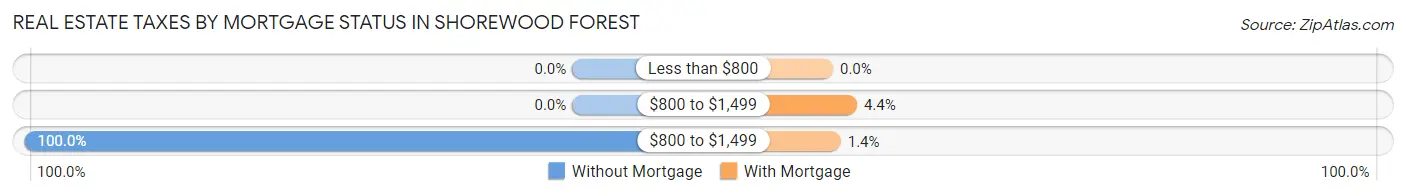
| Property Taxes | Without Mortgage | With Mortgage |
| Less than $800 | 0 (0.0%) | 0 (0.0%) |
| $800 to $1,499 | 0 (0.0%) | 34 (4.4%) |
| $800 to $1,499 | 282 (100.0%) | 11 (1.4%) |
| Total | 282 (100.0%) | 778 (100.0%) |
Health & Disability in Shorewood Forest
Health Insurance Coverage by Age in Shorewood Forest
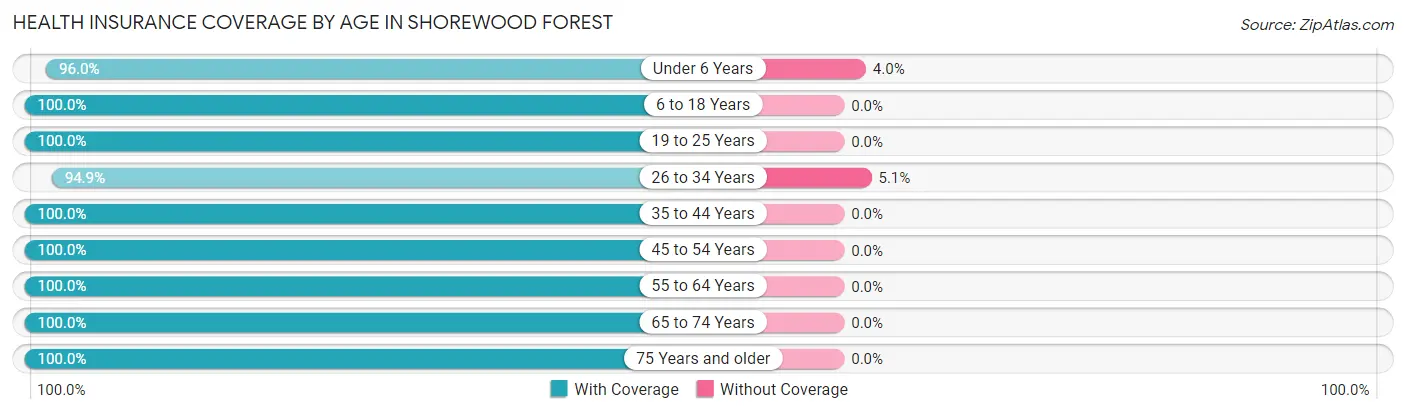
| Age Bracket | With Coverage | Without Coverage |
| Under 6 Years | 286 (96.0%) | 12 (4.0%) |
| 6 to 18 Years | 557 (100.0%) | 0 (0.0%) |
| 19 to 25 Years | 235 (100.0%) | 0 (0.0%) |
| 26 to 34 Years | 168 (94.9%) | 9 (5.1%) |
| 35 to 44 Years | 263 (100.0%) | 0 (0.0%) |
| 45 to 54 Years | 593 (100.0%) | 0 (0.0%) |
| 55 to 64 Years | 596 (100.0%) | 0 (0.0%) |
| 65 to 74 Years | 342 (100.0%) | 0 (0.0%) |
| 75 Years and older | 154 (100.0%) | 0 (0.0%) |
| Total | 3,194 (99.4%) | 21 (0.6%) |
Health Insurance Coverage by Citizenship Status in Shorewood Forest
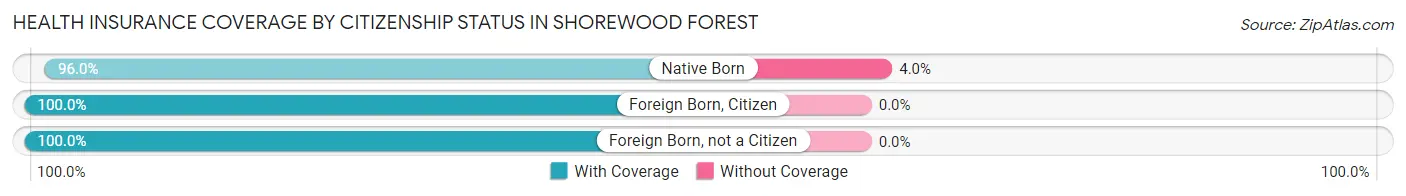
| Citizenship Status | With Coverage | Without Coverage |
| Native Born | 286 (96.0%) | 12 (4.0%) |
| Foreign Born, Citizen | 557 (100.0%) | 0 (0.0%) |
| Foreign Born, not a Citizen | 235 (100.0%) | 0 (0.0%) |
Health Insurance Coverage by Household Income in Shorewood Forest
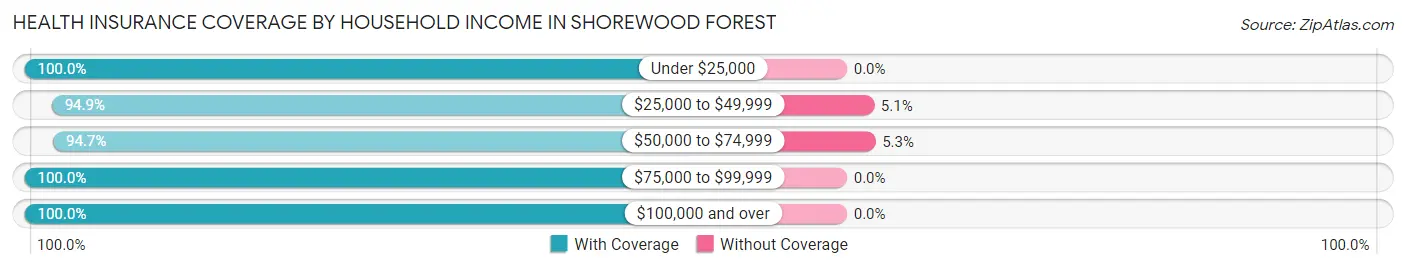
| Household Income | With Coverage | Without Coverage |
| Under $25,000 | 215 (100.0%) | 0 (0.0%) |
| $25,000 to $49,999 | 168 (94.9%) | 9 (5.1%) |
| $50,000 to $74,999 | 213 (94.7%) | 12 (5.3%) |
| $75,000 to $99,999 | 200 (100.0%) | 0 (0.0%) |
| $100,000 and over | 2,398 (100.0%) | 0 (0.0%) |
Public vs Private Health Insurance Coverage by Age in Shorewood Forest
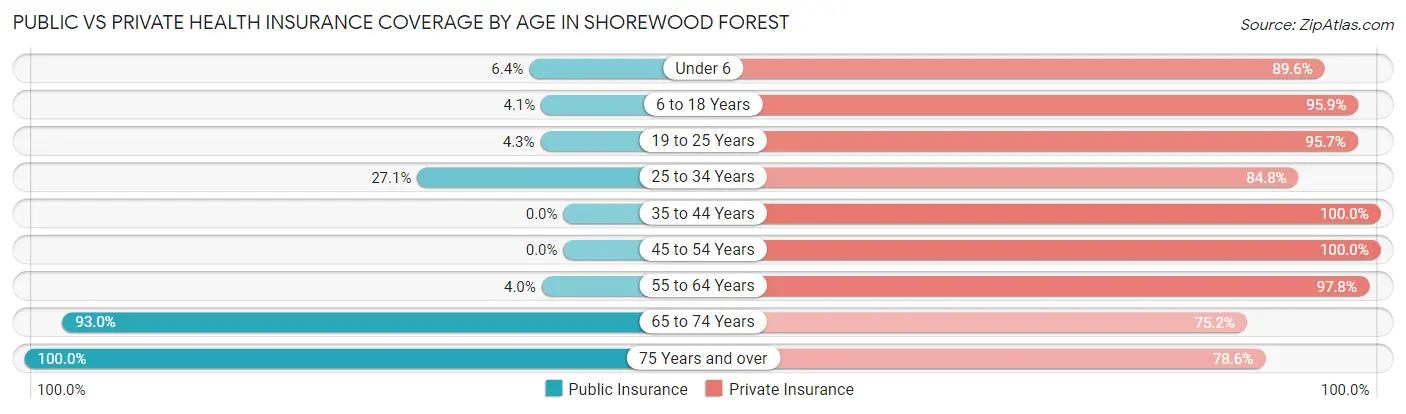
| Age Bracket | Public Insurance | Private Insurance |
| Under 6 | 19 (6.4%) | 267 (89.6%) |
| 6 to 18 Years | 23 (4.1%) | 534 (95.9%) |
| 19 to 25 Years | 10 (4.3%) | 225 (95.7%) |
| 25 to 34 Years | 48 (27.1%) | 150 (84.8%) |
| 35 to 44 Years | 0 (0.0%) | 263 (100.0%) |
| 45 to 54 Years | 0 (0.0%) | 593 (100.0%) |
| 55 to 64 Years | 24 (4.0%) | 583 (97.8%) |
| 65 to 74 Years | 318 (93.0%) | 257 (75.1%) |
| 75 Years and over | 154 (100.0%) | 121 (78.6%) |
| Total | 596 (18.5%) | 2,993 (93.1%) |
Disability Status by Sex by Age in Shorewood Forest
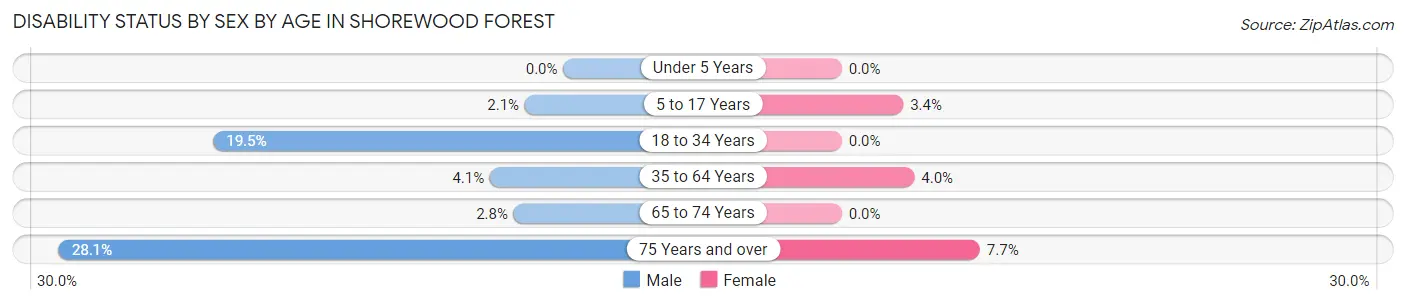
| Age Bracket | Male | Female |
| Under 5 Years | 0 (0.0%) | 0 (0.0%) |
| 5 to 17 Years | 7 (2.1%) | 8 (3.4%) |
| 18 to 34 Years | 53 (19.5%) | 0 (0.0%) |
| 35 to 64 Years | 31 (4.1%) | 28 (4.0%) |
| 65 to 74 Years | 5 (2.8%) | 0 (0.0%) |
| 75 Years and over | 25 (28.1%) | 5 (7.7%) |
Disability Class by Sex by Age in Shorewood Forest
Disability Class: Hearing Difficulty
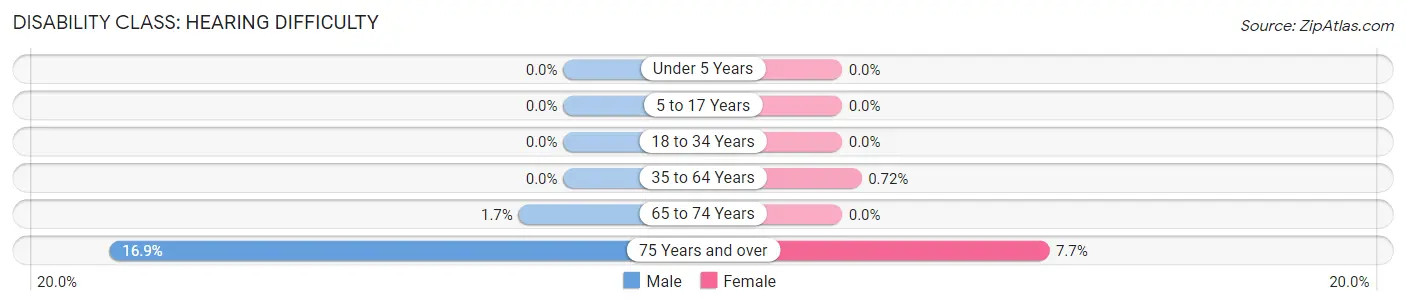
| Age Bracket | Male | Female |
| Under 5 Years | 0 (0.0%) | 0 (0.0%) |
| 5 to 17 Years | 0 (0.0%) | 0 (0.0%) |
| 18 to 34 Years | 0 (0.0%) | 0 (0.0%) |
| 35 to 64 Years | 0 (0.0%) | 5 (0.7%) |
| 65 to 74 Years | 3 (1.7%) | 0 (0.0%) |
| 75 Years and over | 15 (16.9%) | 5 (7.7%) |
Disability Class: Vision Difficulty
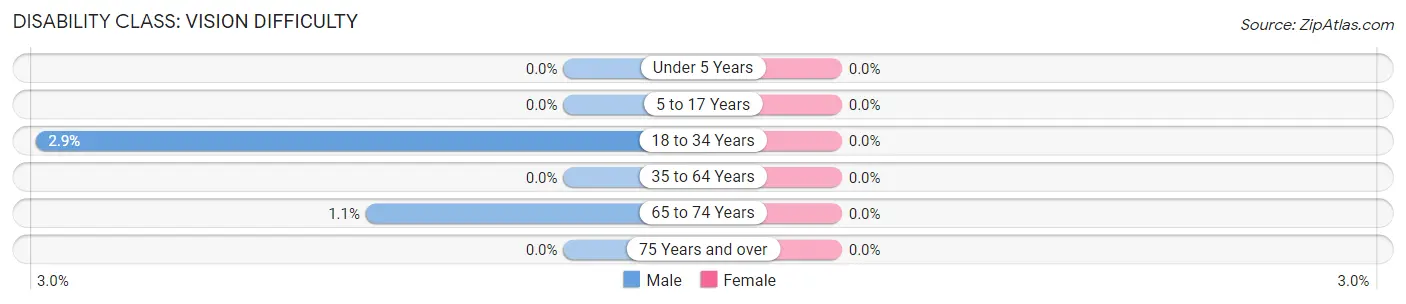
| Age Bracket | Male | Female |
| Under 5 Years | 0 (0.0%) | 0 (0.0%) |
| 5 to 17 Years | 0 (0.0%) | 0 (0.0%) |
| 18 to 34 Years | 8 (2.9%) | 0 (0.0%) |
| 35 to 64 Years | 0 (0.0%) | 0 (0.0%) |
| 65 to 74 Years | 2 (1.1%) | 0 (0.0%) |
| 75 Years and over | 0 (0.0%) | 0 (0.0%) |
Disability Class: Cognitive Difficulty
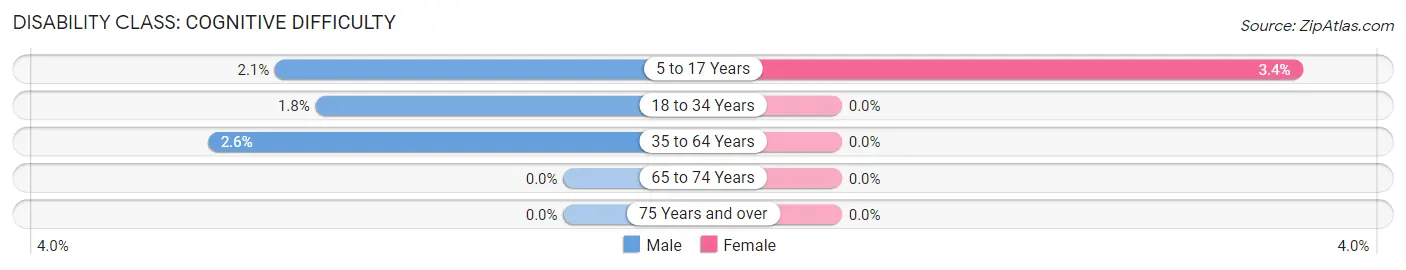
| Age Bracket | Male | Female |
| 5 to 17 Years | 7 (2.1%) | 8 (3.4%) |
| 18 to 34 Years | 5 (1.8%) | 0 (0.0%) |
| 35 to 64 Years | 20 (2.6%) | 0 (0.0%) |
| 65 to 74 Years | 0 (0.0%) | 0 (0.0%) |
| 75 Years and over | 0 (0.0%) | 0 (0.0%) |
Disability Class: Ambulatory Difficulty
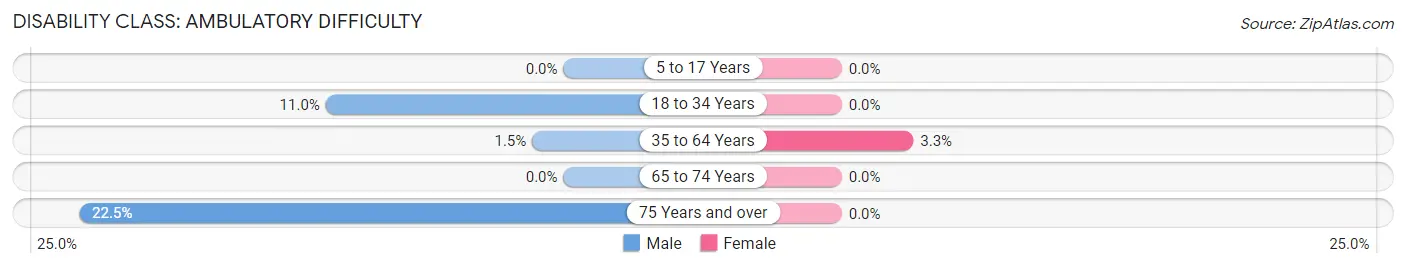
| Age Bracket | Male | Female |
| 5 to 17 Years | 0 (0.0%) | 0 (0.0%) |
| 18 to 34 Years | 30 (11.0%) | 0 (0.0%) |
| 35 to 64 Years | 11 (1.5%) | 23 (3.3%) |
| 65 to 74 Years | 0 (0.0%) | 0 (0.0%) |
| 75 Years and over | 20 (22.5%) | 0 (0.0%) |
Disability Class: Self-Care Difficulty
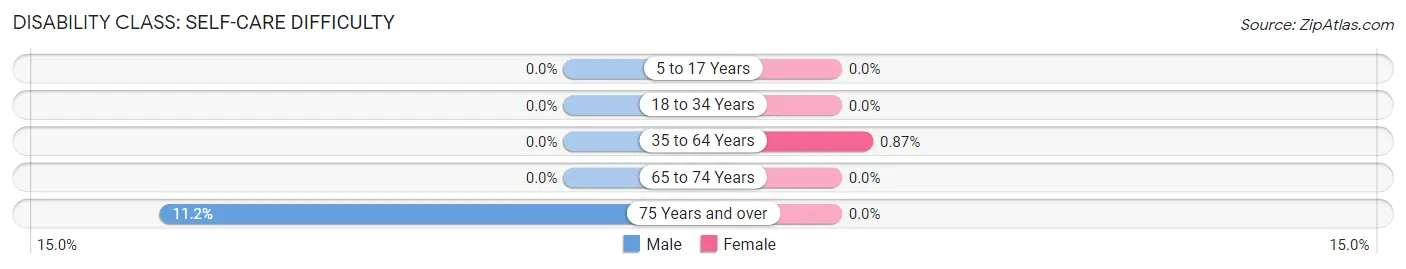
| Age Bracket | Male | Female |
| 5 to 17 Years | 0 (0.0%) | 0 (0.0%) |
| 18 to 34 Years | 0 (0.0%) | 0 (0.0%) |
| 35 to 64 Years | 0 (0.0%) | 6 (0.9%) |
| 65 to 74 Years | 0 (0.0%) | 0 (0.0%) |
| 75 Years and over | 10 (11.2%) | 0 (0.0%) |
Technology Access in Shorewood Forest
Computing Device Access in Shorewood Forest
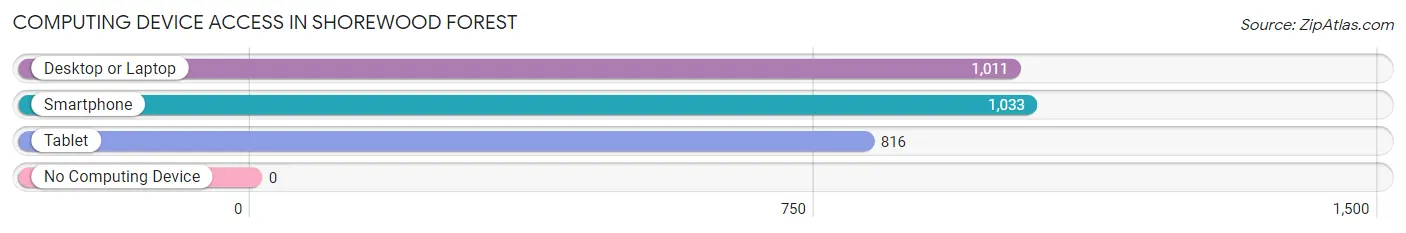
| Device Type | # Households | % Households |
| Desktop or Laptop | 1,011 | 95.4% |
| Smartphone | 1,033 | 97.5% |
| Tablet | 816 | 77.0% |
| No Computing Device | 0 | 0.0% |
| Total | 1,060 | 100.0% |
Internet Access in Shorewood Forest
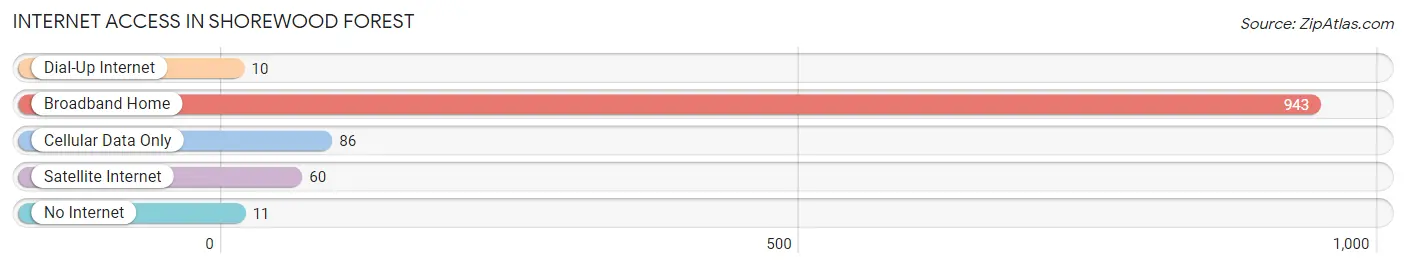
| Internet Type | # Households | % Households |
| Dial-Up Internet | 10 | 0.9% |
| Broadband Home | 943 | 89.0% |
| Cellular Data Only | 86 | 8.1% |
| Satellite Internet | 60 | 5.7% |
| No Internet | 11 | 1.0% |
| Total | 1,060 | 100.0% |
Shorewood Forest Summary
Shorewood Forest is a small, unincorporated community located in the northern part of Hamilton County, Indiana. It is situated on the banks of the White River, just south of the city of Noblesville. The community is home to approximately 1,000 people and is part of the greater Indianapolis metropolitan area.
History
Shorewood Forest was founded in the late 1800s by a group of settlers from the nearby town of Noblesville. The settlers were looking for a place to build a new community and chose the area along the White River due to its natural beauty and abundance of resources. The community was originally known as “Shorewood” and was later changed to “Shorewood Forest” in the early 1900s.
The community grew slowly over the years, but it was not until the 1950s that it began to experience significant growth. This was due to the construction of the White River Dam, which provided the community with a reliable source of water and electricity. The dam also created a recreational lake, which attracted many visitors to the area.
Geography
Shorewood Forest is located in the northern part of Hamilton County, Indiana. It is situated on the banks of the White River, just south of the city of Noblesville. The community is surrounded by rolling hills and lush forests, making it a popular destination for outdoor recreation.
The White River Dam is located just north of the community and provides a reliable source of water and electricity. The dam also created a recreational lake, which is popular for fishing, boating, and swimming.
Economy
The economy of Shorewood Forest is largely based on agriculture and tourism. The community is home to several farms, which produce a variety of crops, including corn, soybeans, and wheat. The area is also popular with tourists, who come to enjoy the natural beauty of the area and take part in outdoor activities such as fishing, boating, and swimming.
In addition to agriculture and tourism, the community is home to several small businesses, including a grocery store, a hardware store, and a restaurant.
Demographics
As of the 2010 census, the population of Shorewood Forest was 1,000. The racial makeup of the community was 97.2% White, 0.7% African American, 0.3% Native American, 0.3% Asian, and 1.5% from other races. The median household income was $50,000, and the median age was 40.
Conclusion
Shorewood Forest is a small, unincorporated community located in the northern part of Hamilton County, Indiana. It is situated on the banks of the White River, just south of the city of Noblesville. The community is home to approximately 1,000 people and is part of the greater Indianapolis metropolitan area. The economy of Shorewood Forest is largely based on agriculture and tourism, and the community is home to several small businesses. The population of Shorewood Forest is predominantly White, with a median household income of $50,000 and a median age of 40.
Common Questions
What is Per Capita Income in Shorewood Forest?
Per Capita income in Shorewood Forest is $89,843.
What is the Median Family Income in Shorewood Forest?
Median Family Income in Shorewood Forest is $165,781.
What is the Median Household income in Shorewood Forest?
Median Household Income in Shorewood Forest is $166,563.
What is Income or Wage Gap in Shorewood Forest?
Income or Wage Gap in Shorewood Forest is 61.5%.
Women in Shorewood Forest earn 38.5 cents for every dollar earned by a man.
What is Family Income Deficit in Shorewood Forest?
Family Income Deficit in Shorewood Forest is $9,025.
Families that are below poverty line in Shorewood Forest earn $9,025 less on average than the poverty threshold level.
What is Inequality or Gini Index in Shorewood Forest?
Inequality or Gini Index in Shorewood Forest is 0.52.
What is the Total Population of Shorewood Forest?
Total Population of Shorewood Forest is 3,215.
What is the Total Male Population of Shorewood Forest?
Total Male Population of Shorewood Forest is 1,704.
What is the Total Female Population of Shorewood Forest?
Total Female Population of Shorewood Forest is 1,511.
What is the Ratio of Males per 100 Females in Shorewood Forest?
There are 112.77 Males per 100 Females in Shorewood Forest.
What is the Ratio of Females per 100 Males in Shorewood Forest?
There are 88.67 Females per 100 Males in Shorewood Forest.
What is the Median Population Age in Shorewood Forest?
Median Population Age in Shorewood Forest is 46.4 Years.
What is the Average Family Size in Shorewood Forest
Average Family Size in Shorewood Forest is 3.2 People.
What is the Average Household Size in Shorewood Forest
Average Household Size in Shorewood Forest is 3.0 People.
How Large is the Labor Force in Shorewood Forest?
There are 1,582 People in the Labor Forcein in Shorewood Forest.
What is the Percentage of People in the Labor Force in Shorewood Forest?
62.9% of People are in the Labor Force in Shorewood Forest.
What is the Unemployment Rate in Shorewood Forest?
Unemployment Rate in Shorewood Forest is 1.4%.