Zip Codes with the Highest Percentage of Population Employed in Legal Services & Support in Fishers, IN
RELATED REPORTS & OPTIONS
Legal Services & Support
Fishers
Compare Zip Codes
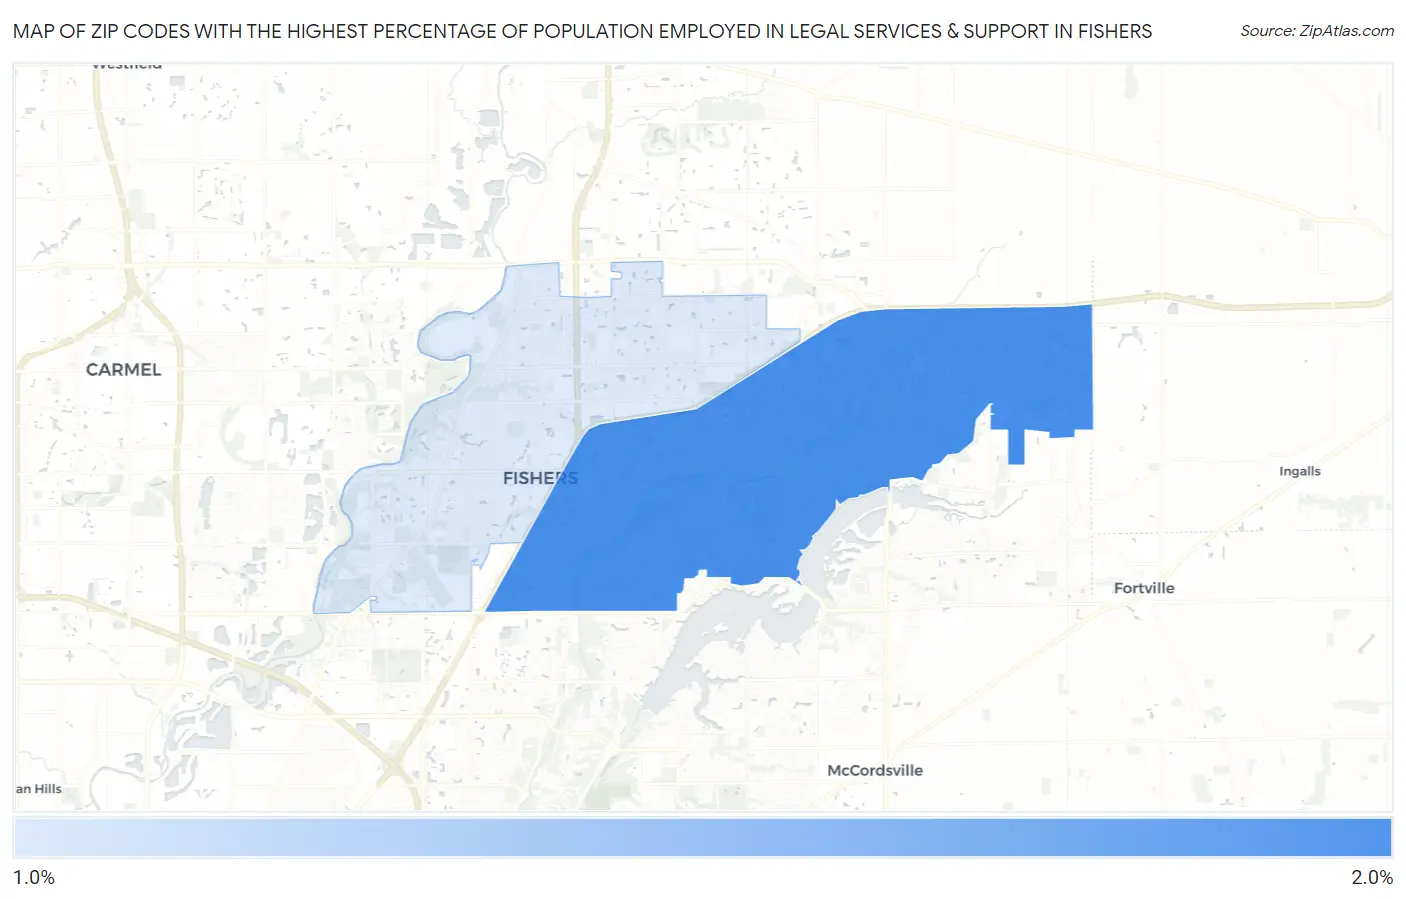
Map of Zip Codes with the Highest Percentage of Population Employed in Legal Services & Support in Fishers
1.6%
1.9%
Zip Codes with the Highest Percentage of Population Employed in Legal Services & Support in Fishers, IN
| Zip Code | % Employed | vs State | vs National | |
| 1. | 46037 | 1.9% | 0.76%(+1.15)#43 | 1.2%(+0.726)#3,710 |
| 2. | 46038 | 1.6% | 0.76%(+0.838)#51 | 1.2%(+0.416)#4,674 |
1
Common Questions
What are the Top Zip Codes with the Highest Percentage of Population Employed in Legal Services & Support in Fishers, IN?
Top Zip Codes with the Highest Percentage of Population Employed in Legal Services & Support in Fishers, IN are:
What zip code has the Highest Percentage of Population Employed in Legal Services & Support in Fishers, IN?
46037 has the Highest Percentage of Population Employed in Legal Services & Support in Fishers, IN with 1.9%.
What is the Percentage of Population Employed in Legal Services & Support in Fishers, IN?
Percentage of Population Employed in Legal Services & Support in Fishers is 1.8%.
What is the Percentage of Population Employed in Legal Services & Support in Indiana?
Percentage of Population Employed in Legal Services & Support in Indiana is 0.76%.
What is the Percentage of Population Employed in Legal Services & Support in the United States?
Percentage of Population Employed in Legal Services & Support in the United States is 1.2%.