Zip Codes with the Highest Percentage of Population Employed in Legal Services & Support in Evansville, IN
RELATED REPORTS & OPTIONS
Legal Services & Support
Evansville
Compare Zip Codes
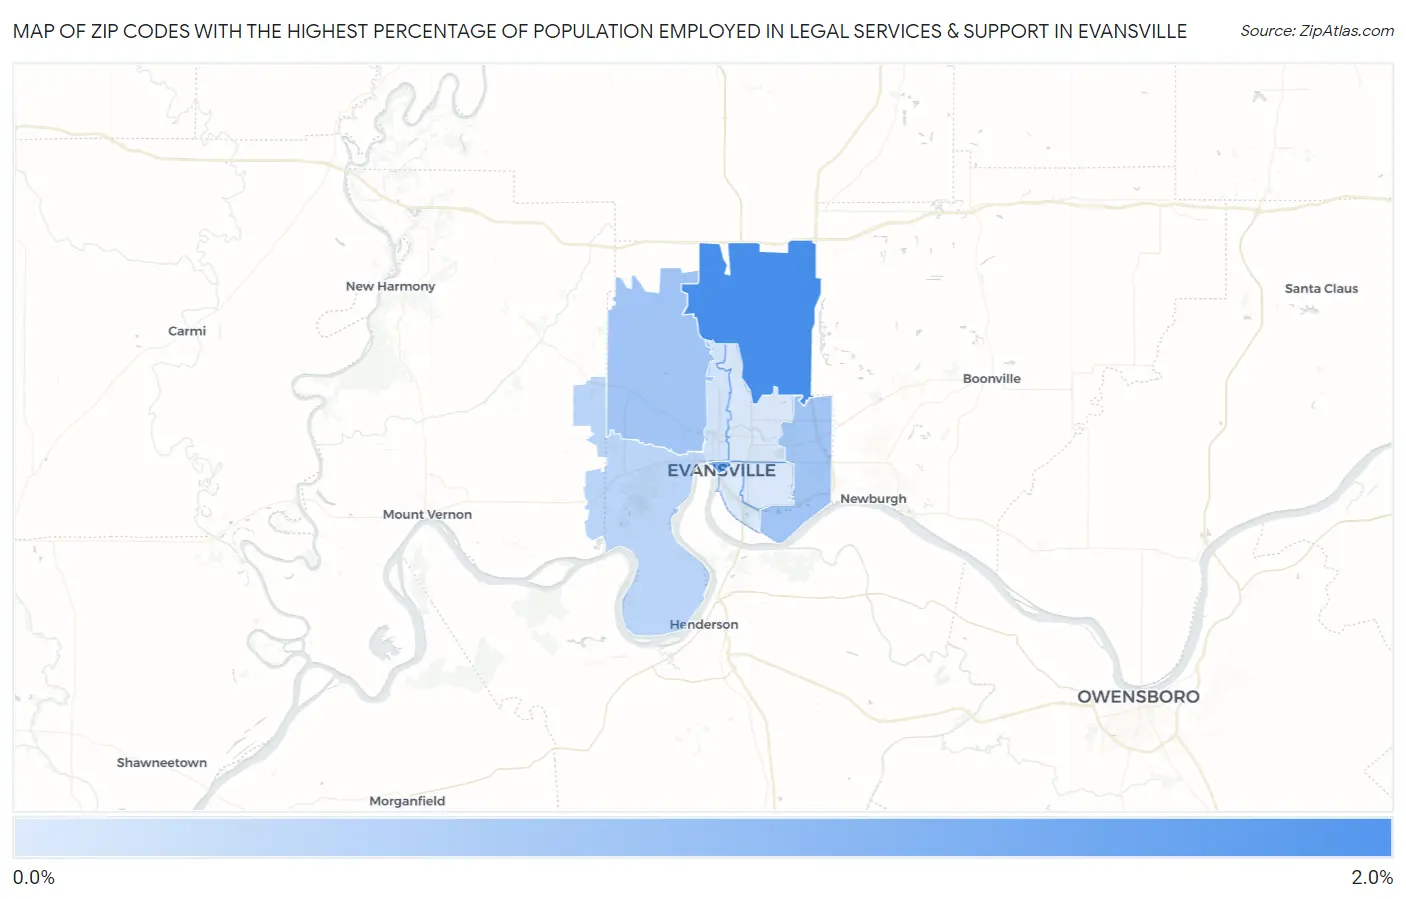
Map of Zip Codes with the Highest Percentage of Population Employed in Legal Services & Support in Evansville
0.15%
1.9%
Zip Codes with the Highest Percentage of Population Employed in Legal Services & Support in Evansville, IN
| Zip Code | % Employed | vs State | vs National | |
| 1. | 47725 | 1.9% | 0.76%(+1.12)#45 | 1.2%(+0.697)#3,775 |
| 2. | 47708 | 1.3% | 0.76%(+0.513)#77 | 1.2%(+0.092)#6,061 |
| 3. | 47720 | 0.83% | 0.76%(+0.067)#135 | 1.2%(-0.354)#9,195 |
| 4. | 47715 | 0.83% | 0.76%(+0.063)#136 | 1.2%(-0.359)#9,233 |
| 5. | 47712 | 0.53% | 0.76%(-0.229)#196 | 1.2%(-0.651)#12,224 |
| 6. | 47710 | 0.27% | 0.76%(-0.488)#288 | 1.2%(-0.910)#15,334 |
| 7. | 47711 | 0.21% | 0.76%(-0.551)#322 | 1.2%(-0.973)#16,078 |
| 8. | 47714 | 0.18% | 0.76%(-0.584)#336 | 1.2%(-1.01)#16,416 |
| 9. | 47713 | 0.15% | 0.76%(-0.613)#343 | 1.2%(-1.03)#16,693 |
1
Common Questions
What are the Top 5 Zip Codes with the Highest Percentage of Population Employed in Legal Services & Support in Evansville, IN?
Top 5 Zip Codes with the Highest Percentage of Population Employed in Legal Services & Support in Evansville, IN are:
What zip code has the Highest Percentage of Population Employed in Legal Services & Support in Evansville, IN?
47725 has the Highest Percentage of Population Employed in Legal Services & Support in Evansville, IN with 1.9%.
What is the Percentage of Population Employed in Legal Services & Support in Evansville, IN?
Percentage of Population Employed in Legal Services & Support in Evansville is 0.37%.
What is the Percentage of Population Employed in Legal Services & Support in Indiana?
Percentage of Population Employed in Legal Services & Support in Indiana is 0.76%.
What is the Percentage of Population Employed in Legal Services & Support in the United States?
Percentage of Population Employed in Legal Services & Support in the United States is 1.2%.