St Meinrad, IN Map & Demographics
St Meinrad Map
St Meinrad Overview
$28,194
PER CAPITA INCOME
$64,470
AVG FAMILY INCOME
$62,614
AVG HOUSEHOLD INCOME
27.1%
WAGE / INCOME GAP [ % ]
72.9¢/ $1
WAGE / INCOME GAP [ $ ]
0.31
INEQUALITY / GINI INDEX
786
TOTAL POPULATION
427
MALE POPULATION
359
FEMALE POPULATION
118.94
MALES / 100 FEMALES
84.07
FEMALES / 100 MALES
53.5
MEDIAN AGE
2.6
AVG FAMILY SIZE
2.4
AVG HOUSEHOLD SIZE
354
LABOR FORCE [ PEOPLE ]
51.5%
PERCENT IN LABOR FORCE
15.0%
UNEMPLOYMENT RATE
Income in St Meinrad
Income Overview in St Meinrad
Per Capita Income in St Meinrad is $28,194, while median incomes of families and households are $64,470 and $62,614 respectively.
| Characteristic | Number | Measure |
| Per Capita Income | 786 | $28,194 |
| Median Family Income | 224 | $64,470 |
| Mean Family Income | 224 | $77,210 |
| Median Household Income | 293 | $62,614 |
| Mean Household Income | 293 | $66,313 |
| Income Deficit | 224 | $0 |
| Wage / Income Gap (%) | 786 | 27.06% |
| Wage / Income Gap ($) | 786 | 72.94¢ per $1 |
| Gini / Inequality Index | 786 | 0.31 |
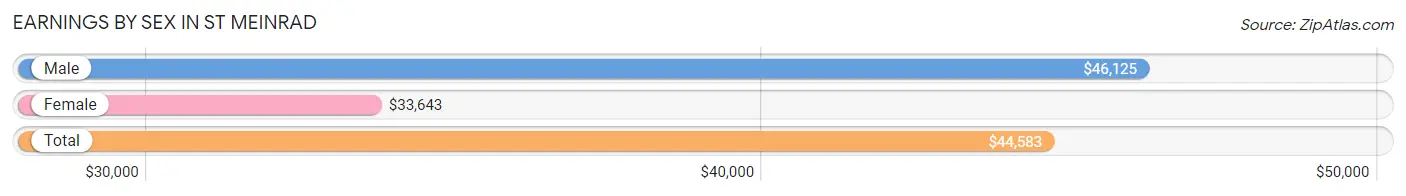
Earnings by Sex in St Meinrad
Average Earnings in St Meinrad are $44,583, $46,125 for men and $33,643 for women, a difference of 27.1%.
| Sex | Number | Average Earnings |
| Male | 211 (57.8%) | $46,125 |
| Female | 154 (42.2%) | $33,643 |
| Total | 365 (100.0%) | $44,583 |
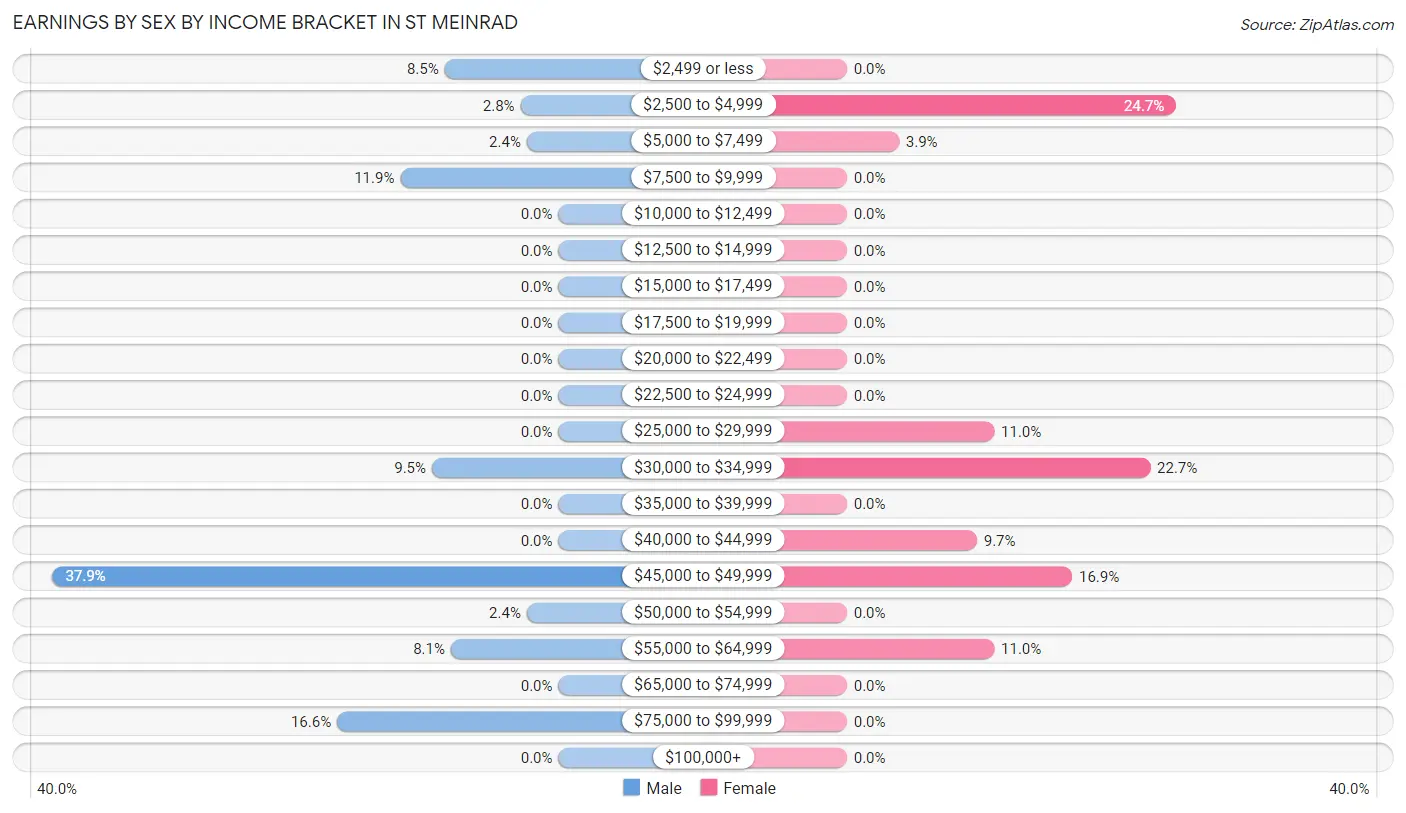
Earnings by Sex by Income Bracket in St Meinrad
The most common earnings brackets in St Meinrad are $45,000 to $49,999 for men (80 | 37.9%) and $2,500 to $4,999 for women (38 | 24.7%).
| Income | Male | Female |
| $2,499 or less | 18 (8.5%) | 0 (0.0%) |
| $2,500 to $4,999 | 6 (2.8%) | 38 (24.7%) |
| $5,000 to $7,499 | 5 (2.4%) | 6 (3.9%) |
| $7,500 to $9,999 | 25 (11.8%) | 0 (0.0%) |
| $10,000 to $12,499 | 0 (0.0%) | 0 (0.0%) |
| $12,500 to $14,999 | 0 (0.0%) | 0 (0.0%) |
| $15,000 to $17,499 | 0 (0.0%) | 0 (0.0%) |
| $17,500 to $19,999 | 0 (0.0%) | 0 (0.0%) |
| $20,000 to $22,499 | 0 (0.0%) | 0 (0.0%) |
| $22,500 to $24,999 | 0 (0.0%) | 0 (0.0%) |
| $25,000 to $29,999 | 0 (0.0%) | 17 (11.0%) |
| $30,000 to $34,999 | 20 (9.5%) | 35 (22.7%) |
| $35,000 to $39,999 | 0 (0.0%) | 0 (0.0%) |
| $40,000 to $44,999 | 0 (0.0%) | 15 (9.7%) |
| $45,000 to $49,999 | 80 (37.9%) | 26 (16.9%) |
| $50,000 to $54,999 | 5 (2.4%) | 0 (0.0%) |
| $55,000 to $64,999 | 17 (8.1%) | 17 (11.0%) |
| $65,000 to $74,999 | 0 (0.0%) | 0 (0.0%) |
| $75,000 to $99,999 | 35 (16.6%) | 0 (0.0%) |
| $100,000+ | 0 (0.0%) | 0 (0.0%) |
| Total | 211 (100.0%) | 154 (100.0%) |
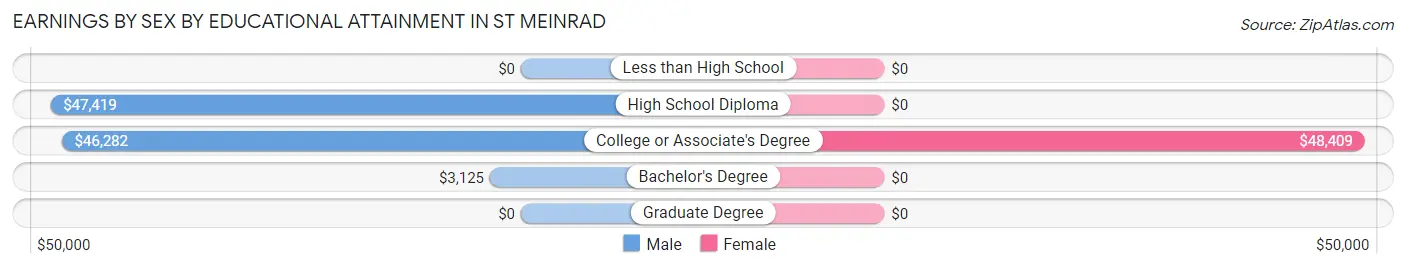
Earnings by Sex by Educational Attainment in St Meinrad
Average earnings in St Meinrad are $46,714 for men and $33,857 for women, a difference of 27.5%. Men with an educational attainment of high school diploma enjoy the highest average annual earnings of $47,419, while those with bachelor's degree education earn the least with $3,125. Women with an educational attainment of college or associate's degree earn the most with the average annual earnings of $48,409, while those with college or associate's degree education have the smallest earnings of $48,409.
| Educational Attainment | Male Income | Female Income |
| Less than High School | - | - |
| High School Diploma | $47,419 | $0 |
| College or Associate's Degree | $46,282 | $48,409 |
| Bachelor's Degree | $3,125 | $0 |
| Graduate Degree | - | - |
| Total | $46,714 | $33,857 |
Family Income in St Meinrad
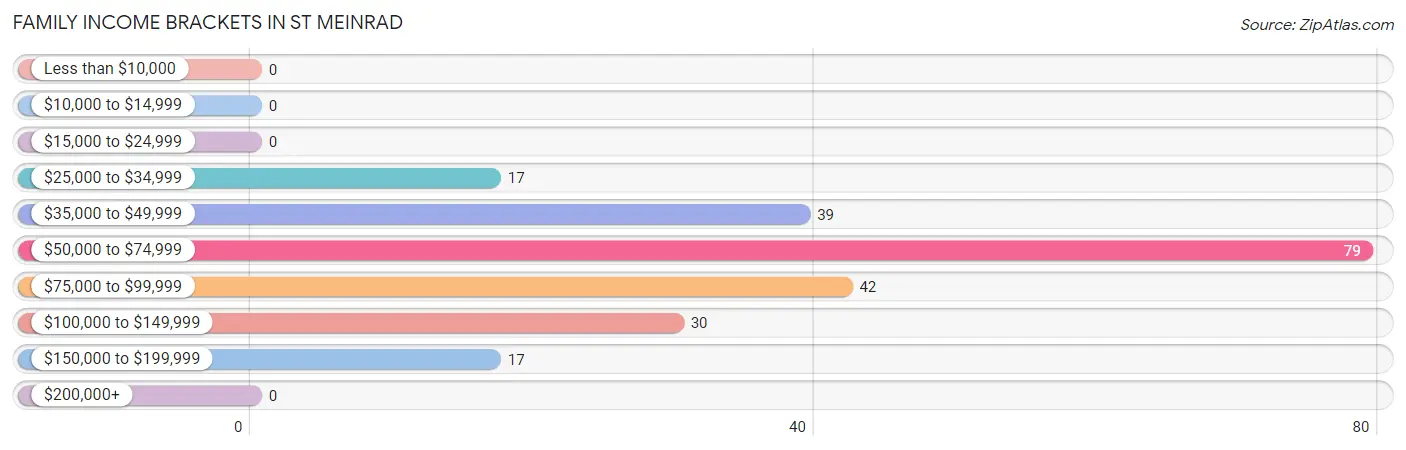
Family Income Brackets in St Meinrad
According to the St Meinrad family income data, there are 79 families falling into the $50,000 to $74,999 income range, which is the most common income bracket and makes up 35.3% of all families.
| Income Bracket | # Families | % Families |
| Less than $10,000 | 0 | 0.0% |
| $10,000 to $14,999 | 0 | 0.0% |
| $15,000 to $24,999 | 0 | 0.0% |
| $25,000 to $34,999 | 17 | 7.6% |
| $35,000 to $49,999 | 39 | 17.4% |
| $50,000 to $74,999 | 79 | 35.3% |
| $75,000 to $99,999 | 42 | 18.8% |
| $100,000 to $149,999 | 30 | 13.4% |
| $150,000 to $199,999 | 17 | 7.6% |
| $200,000+ | 0 | 0.0% |
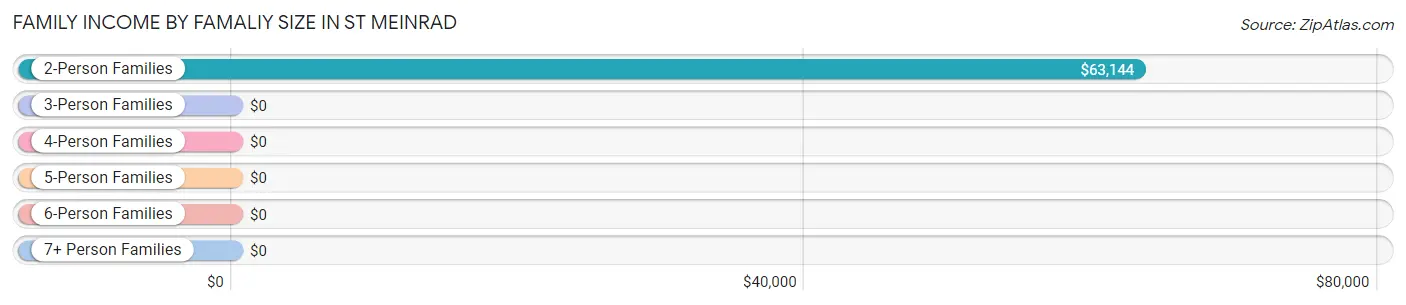
Family Income by Famaliy Size in St Meinrad
2-person families (155 | 69.2%) account for the highest median family income in St Meinrad with $63,144 per family, while 2-person families (155 | 69.2%) have the highest median income of $31,572 per family member.
| Income Bracket | # Families | Median Income |
| 2-Person Families | 155 (69.2%) | $63,144 |
| 3-Person Families | 49 (21.9%) | $0 |
| 4-Person Families | 0 (0.0%) | $0 |
| 5-Person Families | 20 (8.9%) | $0 |
| 6-Person Families | 0 (0.0%) | $0 |
| 7+ Person Families | 0 (0.0%) | $0 |
| Total | 224 (100.0%) | $64,470 |
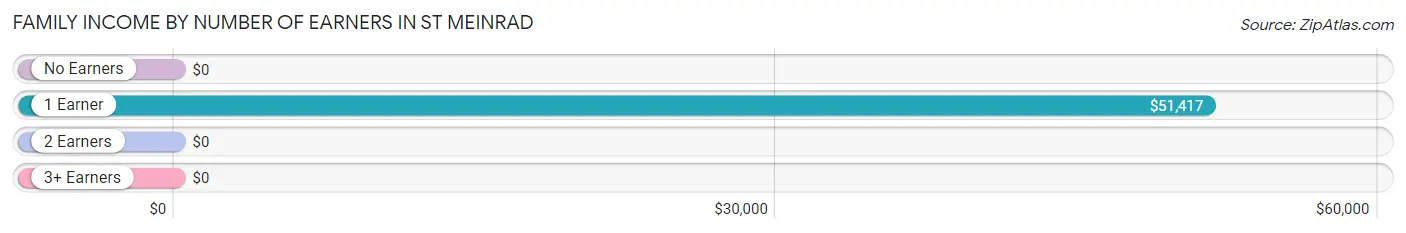
Family Income by Number of Earners in St Meinrad
| Number of Earners | # Families | Median Income |
| No Earners | 33 (14.7%) | $0 |
| 1 Earner | 129 (57.6%) | $51,417 |
| 2 Earners | 30 (13.4%) | $0 |
| 3+ Earners | 32 (14.3%) | $0 |
| Total | 224 (100.0%) | $64,470 |
Household Income in St Meinrad
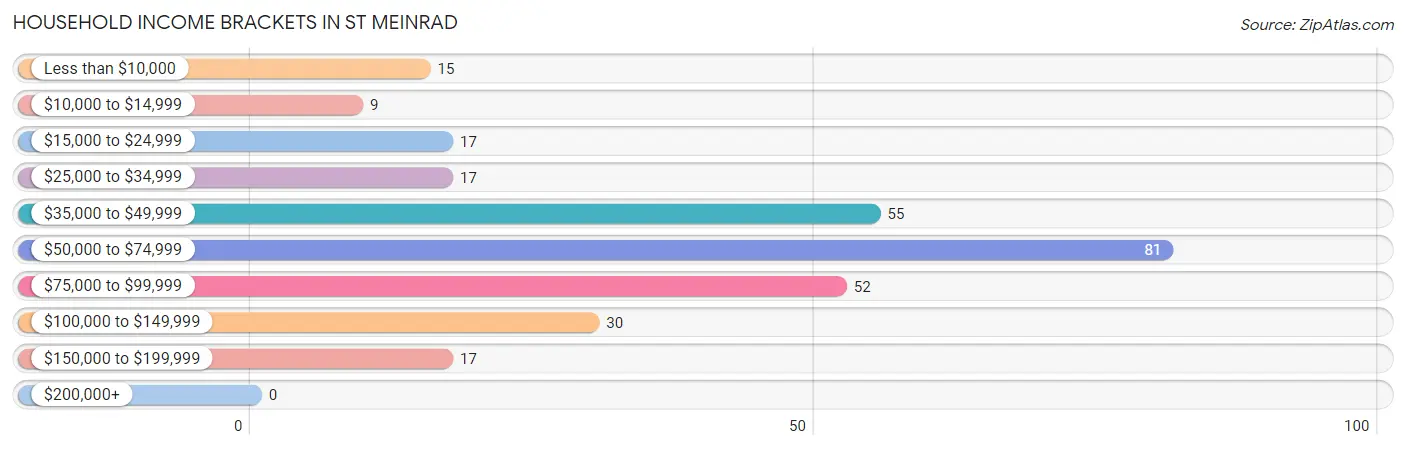
Household Income Brackets in St Meinrad
With 81 households falling in the category, the $50,000 to $74,999 income range is the most frequent in St Meinrad, accounting for 27.7% of all households.
| Income Bracket | # Households | % Households |
| Less than $10,000 | 15 | 5.1% |
| $10,000 to $14,999 | 9 | 3.1% |
| $15,000 to $24,999 | 17 | 5.8% |
| $25,000 to $34,999 | 17 | 5.8% |
| $35,000 to $49,999 | 55 | 18.8% |
| $50,000 to $74,999 | 81 | 27.6% |
| $75,000 to $99,999 | 52 | 17.7% |
| $100,000 to $149,999 | 30 | 10.2% |
| $150,000 to $199,999 | 17 | 5.8% |
| $200,000+ | 0 | 0.0% |
Household Income by Householder Age in St Meinrad
The median household income in St Meinrad is $62,614, with the highest median household income of $90,250 found in the 45 to 64 years age bracket for the primary householder. A total of 91 households (31.1%) fall into this category.

| Income Bracket | # Households | Median Income |
| 15 to 24 Years | 0 (0.0%) | $0 |
| 25 to 44 Years | 76 (25.9%) | $0 |
| 45 to 64 Years | 91 (31.1%) | $90,250 |
| 65+ Years | 126 (43.0%) | $62,652 |
| Total | 293 (100.0%) | $62,614 |
Poverty in St Meinrad
Income Below Poverty by Sex and Age in St Meinrad
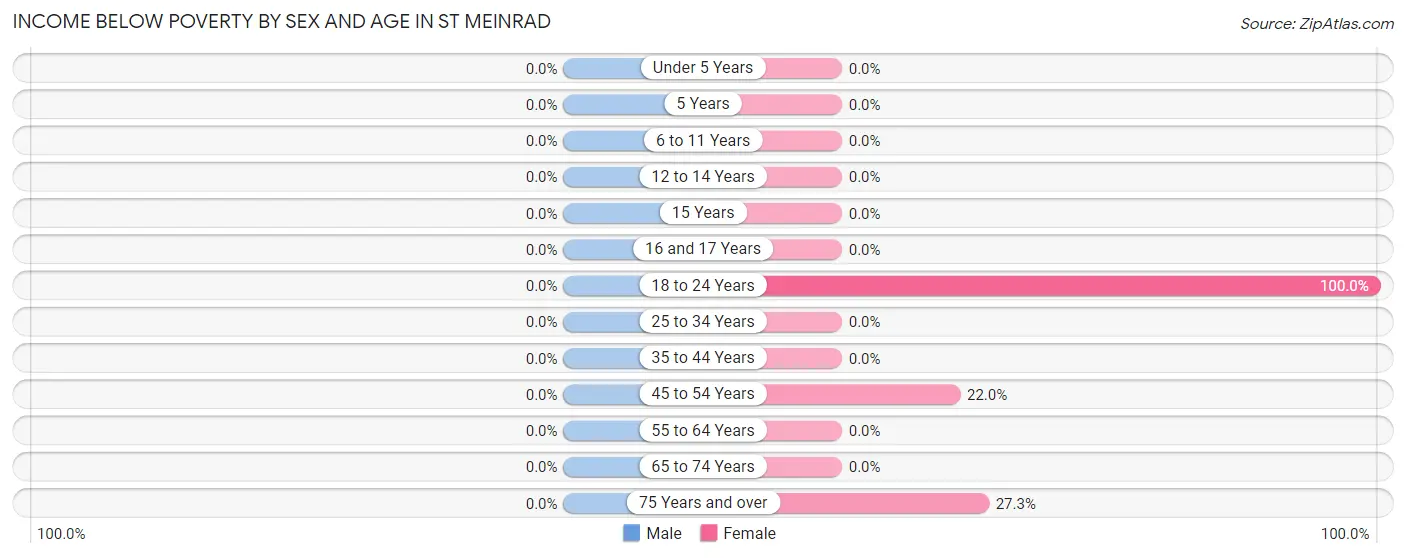
| Age Bracket | Male | Female |
| Under 5 Years | 0 (0.0%) | 0 (0.0%) |
| 5 Years | 0 (0.0%) | 0 (0.0%) |
| 6 to 11 Years | 0 (0.0%) | 0 (0.0%) |
| 12 to 14 Years | 0 (0.0%) | 0 (0.0%) |
| 15 Years | 0 (0.0%) | 0 (0.0%) |
| 16 and 17 Years | 0 (0.0%) | 0 (0.0%) |
| 18 to 24 Years | 0 (0.0%) | 6 (100.0%) |
| 25 to 34 Years | 0 (0.0%) | 0 (0.0%) |
| 35 to 44 Years | 0 (0.0%) | 0 (0.0%) |
| 45 to 54 Years | 0 (0.0%) | 9 (22.0%) |
| 55 to 64 Years | 0 (0.0%) | 0 (0.0%) |
| 65 to 74 Years | 0 (0.0%) | 0 (0.0%) |
| 75 Years and over | 0 (0.0%) | 15 (27.3%) |
| Total | 0 (0.0%) | 30 (8.4%) |
Income Above Poverty by Sex and Age in St Meinrad
According to the poverty statistics in St Meinrad, males aged under 5 years and females aged 6 to 11 years are the age groups that are most secure financially, with 100.0% of males and 100.0% of females in these age groups living above the poverty line.
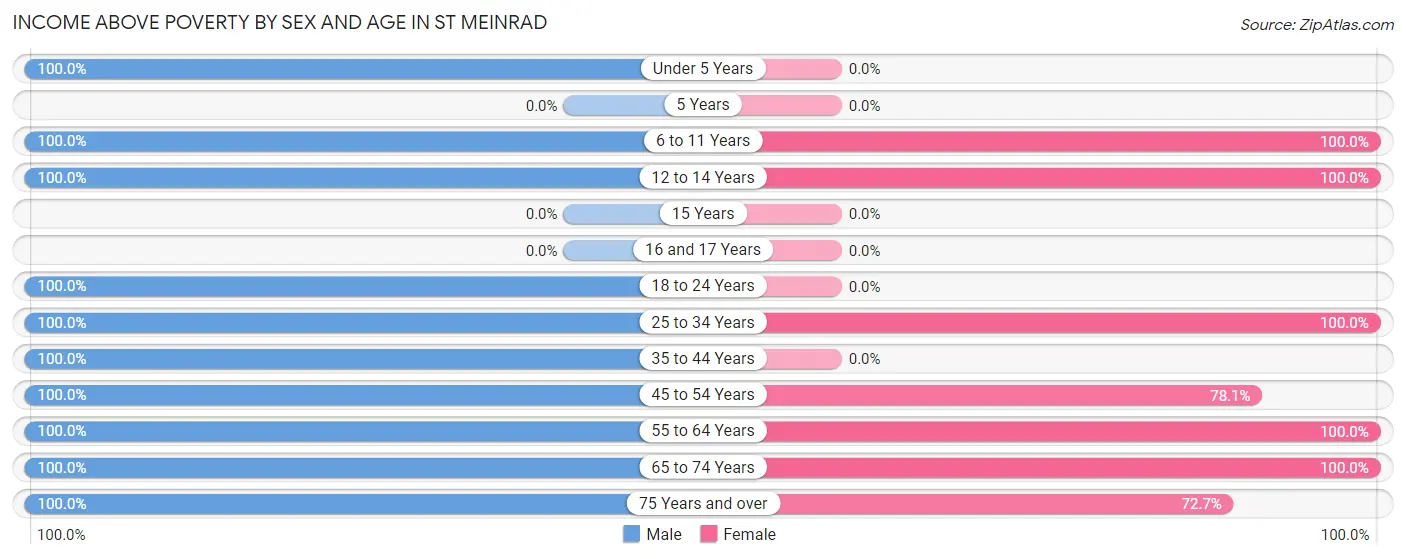
| Age Bracket | Male | Female |
| Under 5 Years | 23 (100.0%) | 0 (0.0%) |
| 5 Years | 0 (0.0%) | 0 (0.0%) |
| 6 to 11 Years | 23 (100.0%) | 15 (100.0%) |
| 12 to 14 Years | 22 (100.0%) | 15 (100.0%) |
| 15 Years | 0 (0.0%) | 0 (0.0%) |
| 16 and 17 Years | 0 (0.0%) | 0 (0.0%) |
| 18 to 24 Years | 22 (100.0%) | 0 (0.0%) |
| 25 to 34 Years | 18 (100.0%) | 85 (100.0%) |
| 35 to 44 Years | 56 (100.0%) | 0 (0.0%) |
| 45 to 54 Years | 31 (100.0%) | 32 (78.0%) |
| 55 to 64 Years | 51 (100.0%) | 64 (100.0%) |
| 65 to 74 Years | 107 (100.0%) | 78 (100.0%) |
| 75 Years and over | 23 (100.0%) | 40 (72.7%) |
| Total | 376 (100.0%) | 329 (91.6%) |
Income Below Poverty Among Married-Couple Families in St Meinrad
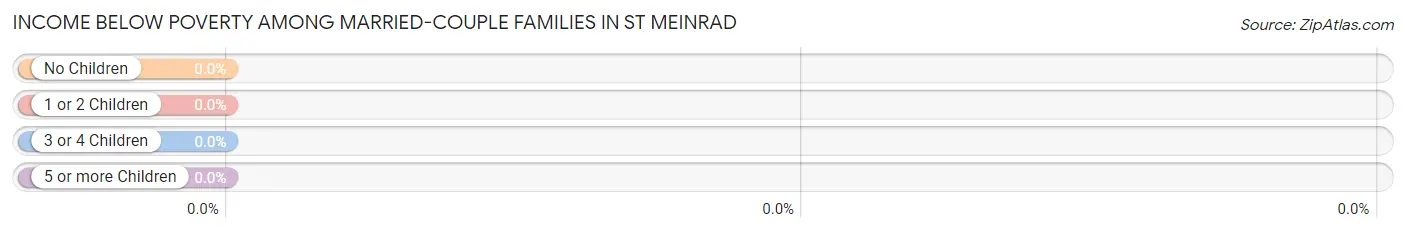
| Children | Above Poverty | Below Poverty |
| No Children | 175 (100.0%) | 0 (0.0%) |
| 1 or 2 Children | 0 (0.0%) | 0 (0.0%) |
| 3 or 4 Children | 20 (100.0%) | 0 (0.0%) |
| 5 or more Children | 0 (0.0%) | 0 (0.0%) |
| Total | 195 (100.0%) | 0 (0.0%) |
Income Below Poverty Among Single-Parent Households in St Meinrad
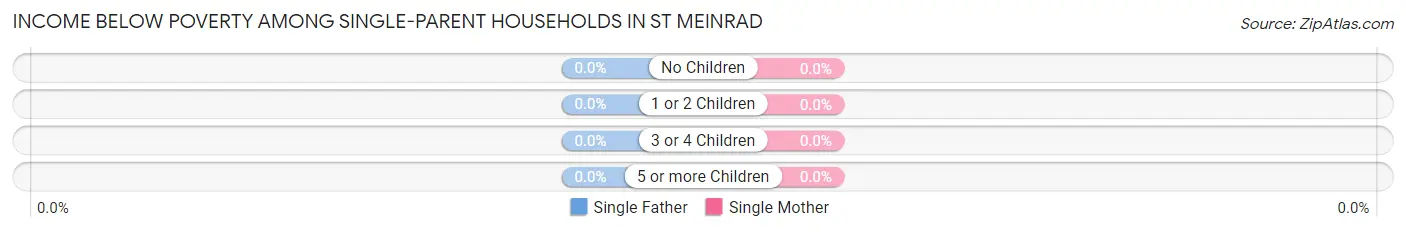
| Children | Single Father | Single Mother |
| No Children | 0 (0.0%) | 0 (0.0%) |
| 1 or 2 Children | 0 (0.0%) | 0 (0.0%) |
| 3 or 4 Children | 0 (0.0%) | 0 (0.0%) |
| 5 or more Children | 0 (0.0%) | 0 (0.0%) |
| Total | 0 (0.0%) | 0 (0.0%) |
Income Below Poverty Among Married-Couple vs Single-Parent Households in St Meinrad
| Children | Married-Couple Families | Single-Parent Households |
| No Children | 0 (0.0%) | 0 (0.0%) |
| 1 or 2 Children | 0 (0.0%) | 0 (0.0%) |
| 3 or 4 Children | 0 (0.0%) | 0 (0.0%) |
| 5 or more Children | 0 (0.0%) | 0 (0.0%) |
| Total | 0 (0.0%) | 0 (0.0%) |
Race in St Meinrad
The most populous races in St Meinrad are White / Caucasian (731 | 93.0%), Asian (37 | 4.7%), and Two or more Races (15 | 1.9%).
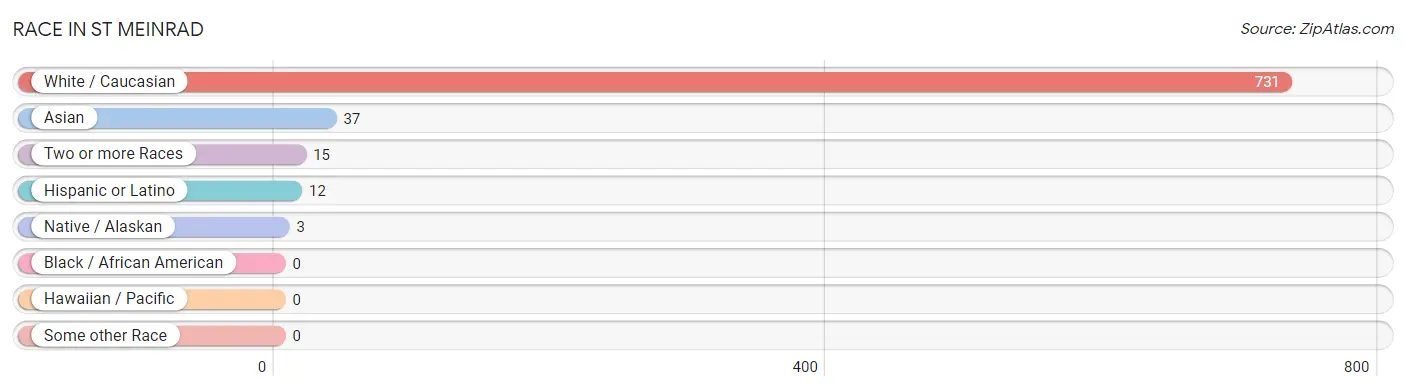
| Race | # Population | % Population |
| Asian | 37 | 4.7% |
| Black / African American | 0 | 0.0% |
| Hawaiian / Pacific | 0 | 0.0% |
| Hispanic or Latino | 12 | 1.5% |
| Native / Alaskan | 3 | 0.4% |
| White / Caucasian | 731 | 93.0% |
| Two or more Races | 15 | 1.9% |
| Some other Race | 0 | 0.0% |
| Total | 786 | 100.0% |
Ancestry in St Meinrad
The most populous ancestries reported in St Meinrad are German (367 | 46.7%), Irish (109 | 13.9%), European (72 | 9.2%), English (53 | 6.7%), and American (48 | 6.1%), together accounting for 82.6% of all St Meinrad residents.
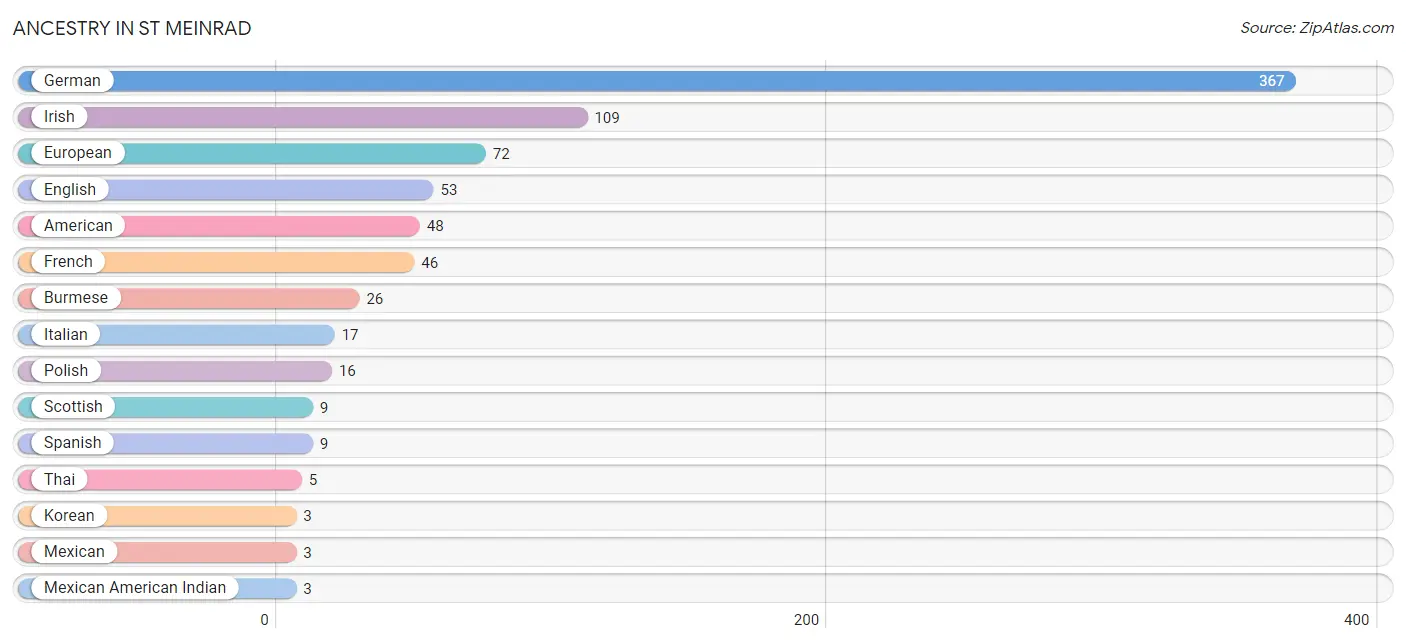
| Ancestry | # Population | % Population |
| American | 48 | 6.1% |
| Burmese | 26 | 3.3% |
| English | 53 | 6.7% |
| European | 72 | 9.2% |
| French | 46 | 5.9% |
| German | 367 | 46.7% |
| Irish | 109 | 13.9% |
| Italian | 17 | 2.2% |
| Korean | 3 | 0.4% |
| Mexican | 3 | 0.4% |
| Mexican American Indian | 3 | 0.4% |
| Polish | 16 | 2.0% |
| Scottish | 9 | 1.1% |
| Spanish | 9 | 1.1% |
| Sri Lankan | 3 | 0.4% |
| Thai | 5 | 0.6% | View All 16 Rows |
Immigrants in St Meinrad
The most numerous immigrant groups reported in St Meinrad came from Asia (29 | 3.7%), Eastern Asia (26 | 3.3%), Korea (26 | 3.3%), Central America (3 | 0.4%), and Latin America (3 | 0.4%), together accounting for 11.1% of all St Meinrad residents.
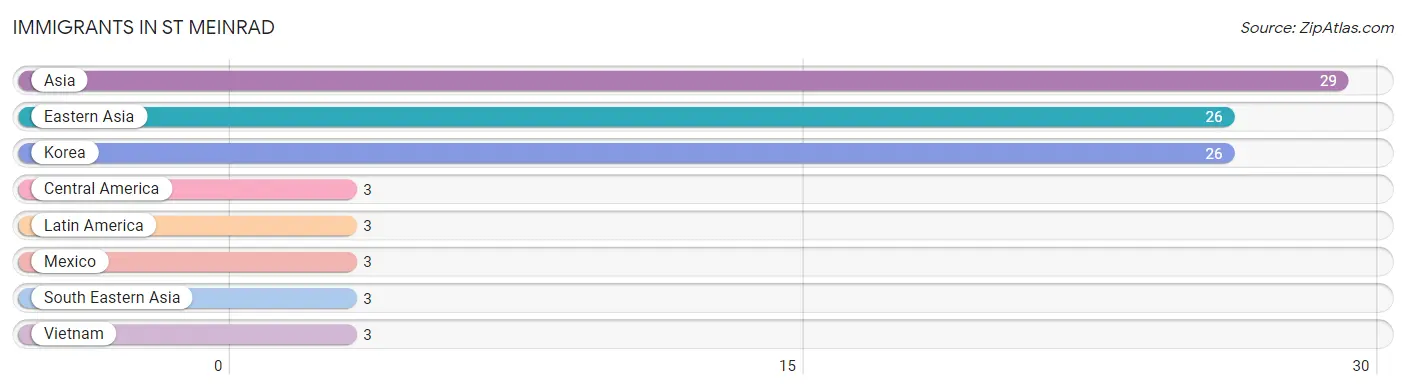
| Immigration Origin | # Population | % Population |
| Asia | 29 | 3.7% |
| Central America | 3 | 0.4% |
| Eastern Asia | 26 | 3.3% |
| Korea | 26 | 3.3% |
| Latin America | 3 | 0.4% |
| Mexico | 3 | 0.4% |
| South Eastern Asia | 3 | 0.4% |
| Vietnam | 3 | 0.4% | View All 8 Rows |
Sex and Age in St Meinrad
Sex and Age in St Meinrad
The most populous age groups in St Meinrad are 65 to 69 Years (76 | 17.8%) for men and 25 to 29 Years (65 | 18.1%) for women.
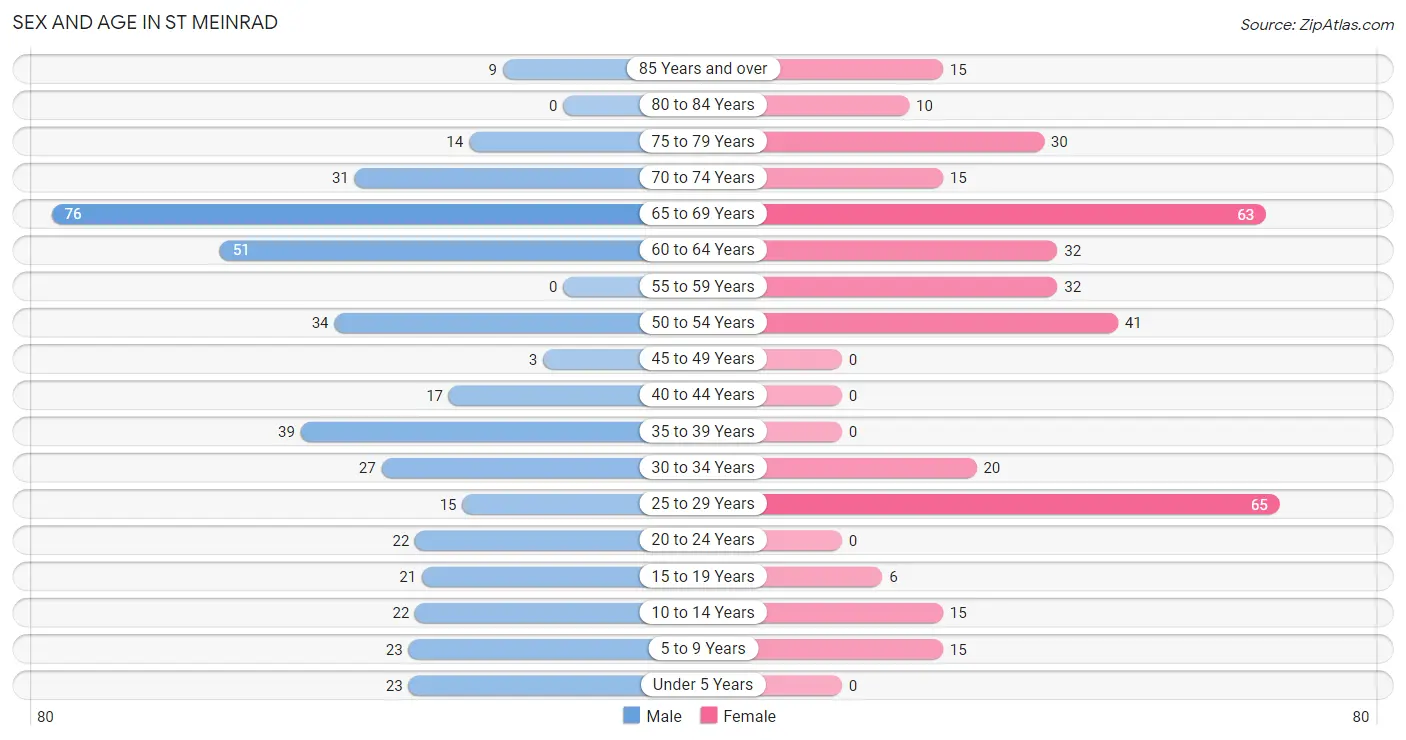
| Age Bracket | Male | Female |
| Under 5 Years | 23 (5.4%) | 0 (0.0%) |
| 5 to 9 Years | 23 (5.4%) | 15 (4.2%) |
| 10 to 14 Years | 22 (5.1%) | 15 (4.2%) |
| 15 to 19 Years | 21 (4.9%) | 6 (1.7%) |
| 20 to 24 Years | 22 (5.1%) | 0 (0.0%) |
| 25 to 29 Years | 15 (3.5%) | 65 (18.1%) |
| 30 to 34 Years | 27 (6.3%) | 20 (5.6%) |
| 35 to 39 Years | 39 (9.1%) | 0 (0.0%) |
| 40 to 44 Years | 17 (4.0%) | 0 (0.0%) |
| 45 to 49 Years | 3 (0.7%) | 0 (0.0%) |
| 50 to 54 Years | 34 (8.0%) | 41 (11.4%) |
| 55 to 59 Years | 0 (0.0%) | 32 (8.9%) |
| 60 to 64 Years | 51 (11.9%) | 32 (8.9%) |
| 65 to 69 Years | 76 (17.8%) | 63 (17.5%) |
| 70 to 74 Years | 31 (7.3%) | 15 (4.2%) |
| 75 to 79 Years | 14 (3.3%) | 30 (8.4%) |
| 80 to 84 Years | 0 (0.0%) | 10 (2.8%) |
| 85 Years and over | 9 (2.1%) | 15 (4.2%) |
| Total | 427 (100.0%) | 359 (100.0%) |
Families and Households in St Meinrad
Median Family Size in St Meinrad
The median family size in St Meinrad is 2.63 persons per family, with single male/father families (17 | 7.6%) accounting for the largest median family size of 2.76 persons per family. On the other hand, single female/mother families (12 | 5.4%) represent the smallest median family size with 2.42 persons per family.
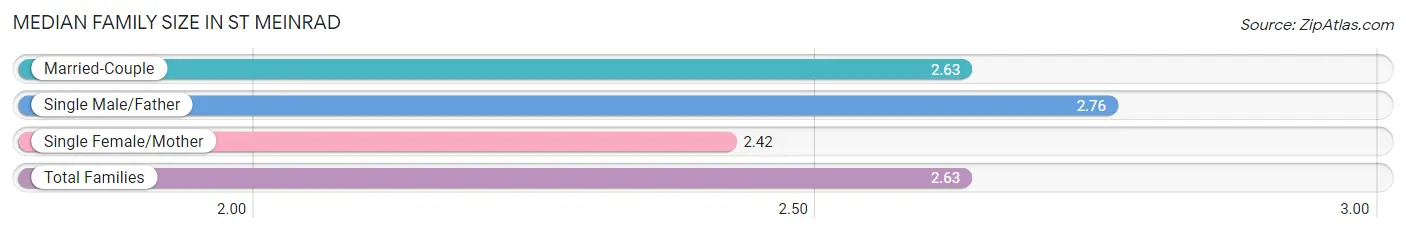
| Family Type | # Families | Family Size |
| Married-Couple | 195 (87.1%) | 2.63 |
| Single Male/Father | 17 (7.6%) | 2.76 |
| Single Female/Mother | 12 (5.4%) | 2.42 |
| Total Families | 224 (100.0%) | 2.63 |
Median Household Size in St Meinrad
The median household size in St Meinrad is 2.35 persons per household, with single male/father households (17 | 5.8%) accounting for the largest median household size of 2.76 persons per household. non-family households (69 | 23.5%) represent the smallest median household size with 1.48 persons per household.
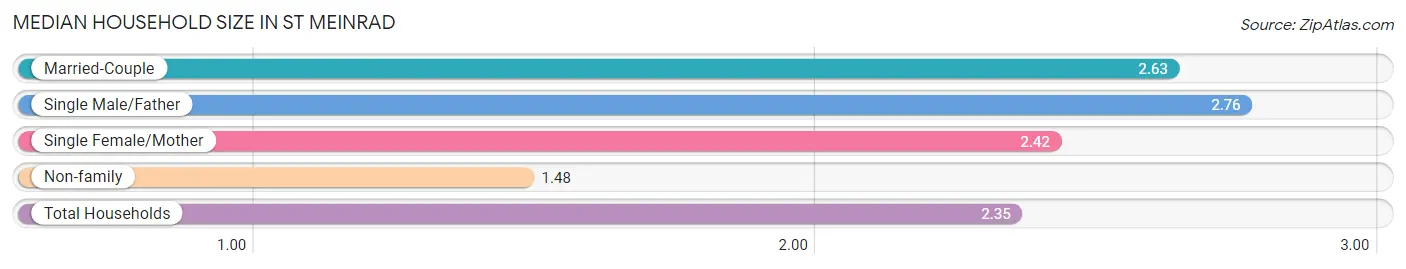
| Household Type | # Households | Household Size |
| Married-Couple | 195 (66.5%) | 2.63 |
| Single Male/Father | 17 (5.8%) | 2.76 |
| Single Female/Mother | 12 (4.1%) | 2.42 |
| Non-family | 69 (23.5%) | 1.48 |
| Total Households | 293 (100.0%) | 2.35 |
Household Size by Marriage Status in St Meinrad
Out of a total of 293 households in St Meinrad, 224 (76.4%) are family households, while 69 (23.5%) are nonfamily households. The most numerous type of family households are 2-person households, comprising 155, and the most common type of nonfamily households are 1-person households, comprising 43.
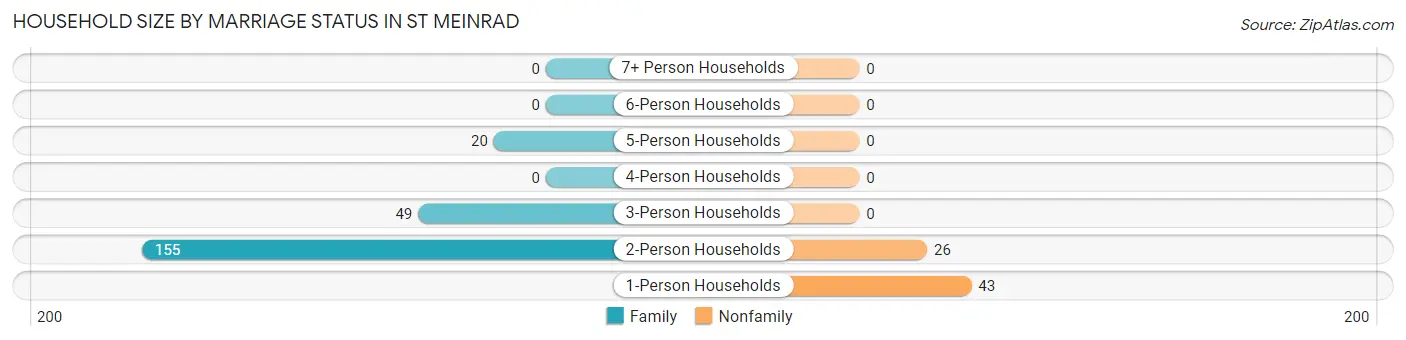
| Household Size | Family Households | Nonfamily Households |
| 1-Person Households | - | 43 (14.7%) |
| 2-Person Households | 155 (52.9%) | 26 (8.9%) |
| 3-Person Households | 49 (16.7%) | 0 (0.0%) |
| 4-Person Households | 0 (0.0%) | 0 (0.0%) |
| 5-Person Households | 20 (6.8%) | 0 (0.0%) |
| 6-Person Households | 0 (0.0%) | 0 (0.0%) |
| 7+ Person Households | 0 (0.0%) | 0 (0.0%) |
| Total | 224 (76.4%) | 69 (23.5%) |
Female Fertility in St Meinrad
Fertility by Age in St Meinrad
| Age Bracket | Women with Births | Births / 1,000 Women |
| 15 to 19 years | 0 (0.0%) | 0.0 |
| 20 to 34 years | 0 (0.0%) | 0.0 |
| 35 to 50 years | 0 (0.0%) | 0.0 |
| Total | 0 (0.0%) | 0.0 |
Fertility by Age by Marriage Status in St Meinrad
| Age Bracket | Married | Unmarried |
| 15 to 19 years | 0 (0.0%) | 0 (0.0%) |
| 20 to 34 years | 0 (0.0%) | 0 (0.0%) |
| 35 to 50 years | 0 (0.0%) | 0 (0.0%) |
| Total | 0 (0.0%) | 0 (0.0%) |
Fertility by Education in St Meinrad
| Educational Attainment | Women with Births | Births / 1,000 Women |
| Less than High School | 0 (0.0%) | 0.0 |
| High School Diploma | 0 (0.0%) | 0.0 |
| College or Associate's Degree | 0 (0.0%) | 0.0 |
| Bachelor's Degree | 0 (0.0%) | 0.0 |
| Graduate Degree | 0 (0.0%) | 0.0 |
| Total | 0 (0.0%) | 0.0 |
Fertility by Education by Marriage Status in St Meinrad
| Educational Attainment | Married | Unmarried |
| Less than High School | 0 (0.0%) | 0 (0.0%) |
| High School Diploma | 0 (0.0%) | 0 (0.0%) |
| College or Associate's Degree | 0 (0.0%) | 0 (0.0%) |
| Bachelor's Degree | 0 (0.0%) | 0 (0.0%) |
| Graduate Degree | 0 (0.0%) | 0 (0.0%) |
| Total | 0 (0.0%) | 0 (0.0%) |
Employment Characteristics in St Meinrad
Employment by Class of Employer in St Meinrad
Among the 301 employed individuals in St Meinrad, private company employees (150 | 49.8%), not-for-profit organizations (116 | 38.5%), and self-employed (incorporated) (17 | 5.7%) make up the most common classes of employment.
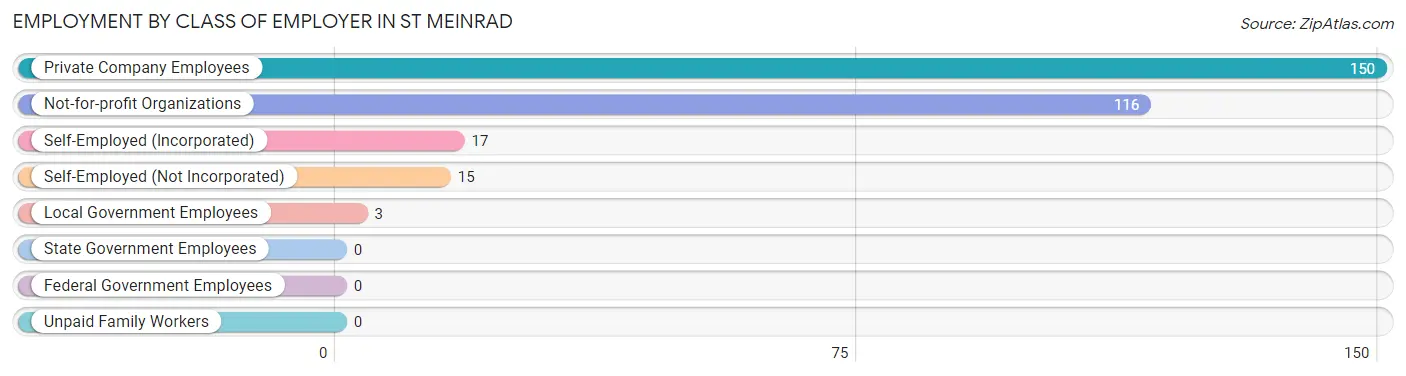
| Employer Class | # Employees | % Employees |
| Private Company Employees | 150 | 49.8% |
| Self-Employed (Incorporated) | 17 | 5.7% |
| Self-Employed (Not Incorporated) | 15 | 5.0% |
| Not-for-profit Organizations | 116 | 38.5% |
| Local Government Employees | 3 | 1.0% |
| State Government Employees | 0 | 0.0% |
| Federal Government Employees | 0 | 0.0% |
| Unpaid Family Workers | 0 | 0.0% |
| Total | 301 | 100.0% |
Employment Status by Age in St Meinrad
According to the labor force statistics for St Meinrad, out of the total population over 16 years of age (688), 51.5% or 354 individuals are in the labor force, with 15.0% or 53 of them unemployed. The age group with the highest labor force participation rate is 20 to 24 years, with 100.0% or 22 individuals in the labor force. Within the labor force, the 20 to 24 years age range has the highest percentage of unemployed individuals, with 100.0% or 22 of them being unemployed.
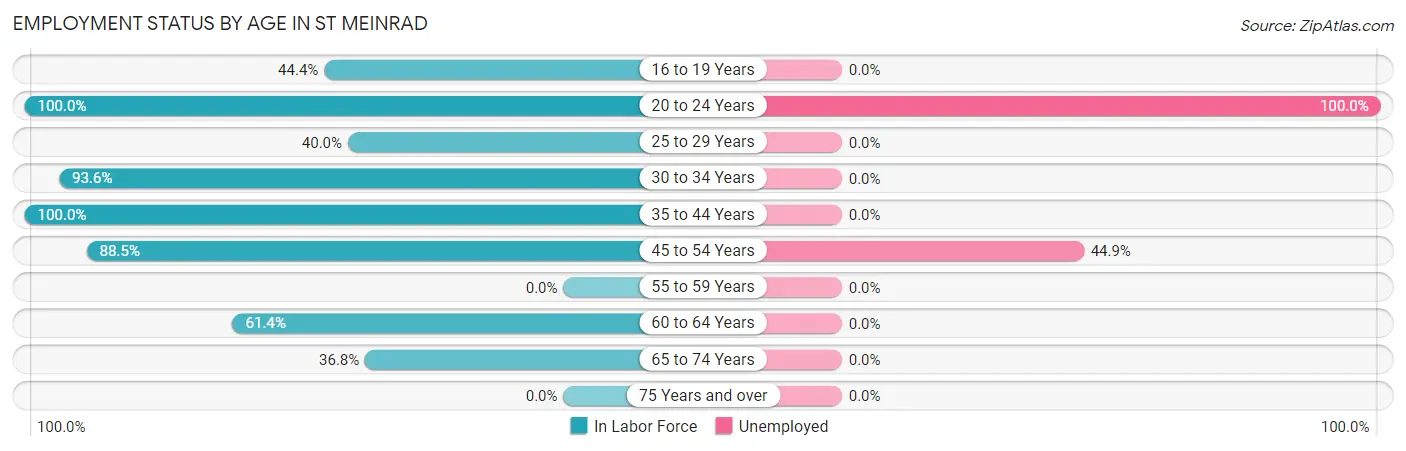
| Age Bracket | In Labor Force | Unemployed |
| 16 to 19 Years | 12 (44.4%) | 0 (0.0%) |
| 20 to 24 Years | 22 (100.0%) | 22 (100.0%) |
| 25 to 29 Years | 32 (40.0%) | 0 (0.0%) |
| 30 to 34 Years | 44 (93.6%) | 0 (0.0%) |
| 35 to 44 Years | 56 (100.0%) | 0 (0.0%) |
| 45 to 54 Years | 69 (88.5%) | 31 (44.9%) |
| 55 to 59 Years | 0 (0.0%) | 0 (0.0%) |
| 60 to 64 Years | 51 (61.4%) | 0 (0.0%) |
| 65 to 74 Years | 68 (36.8%) | 0 (0.0%) |
| 75 Years and over | 0 (0.0%) | 0 (0.0%) |
| Total | 354 (51.5%) | 53 (15.0%) |
Employment Status by Educational Attainment in St Meinrad
According to labor force statistics for St Meinrad, 67.0% of individuals (252) out of the total population between 25 and 64 years of age (376) are in the labor force, with 12.3% or 31 of them being unemployed. The group with the highest labor force participation rate are those with the educational attainment of bachelor's degree or higher, with 85.5% or 53 individuals in the labor force. Within the labor force, individuals with high school diploma education have the highest percentage of unemployment, with 35.2% or 31 of them being unemployed.
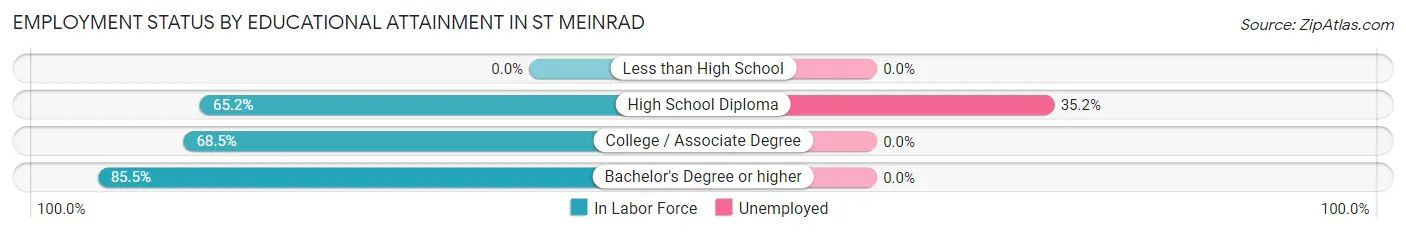
| Educational Attainment | In Labor Force | Unemployed |
| Less than High School | 0 (0.0%) | 0 (0.0%) |
| High School Diploma | 88 (65.2%) | 48 (35.2%) |
| College / Associate Degree | 111 (68.5%) | 0 (0.0%) |
| Bachelor's Degree or higher | 53 (85.5%) | 0 (0.0%) |
| Total | 252 (67.0%) | 46 (12.3%) |
Employment Occupations by Sex in St Meinrad
Management, Business, Science and Arts Occupations
The most common Management, Business, Science and Arts occupations in St Meinrad are Community & Social Service (44 | 14.6%), Management (37 | 12.3%), Legal Services & Support (32 | 10.6%), Health Diagnosing & Treating (28 | 9.3%), and Health Technologists (28 | 9.3%).
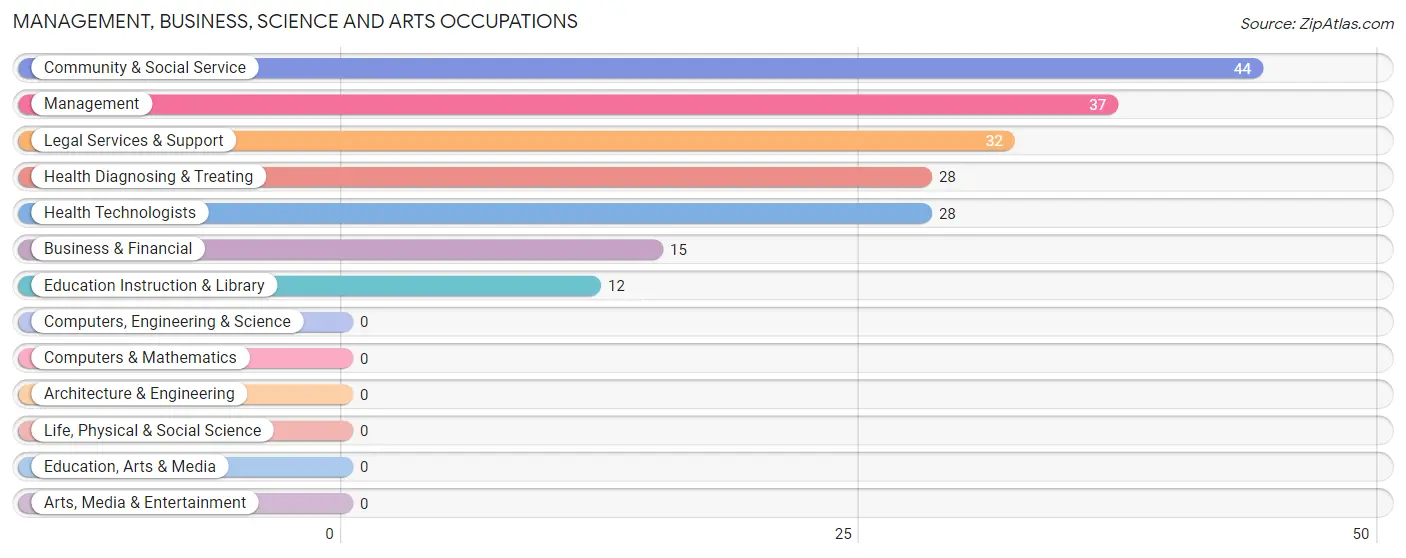
Management, Business, Science and Arts Occupations by Sex
Within the Management, Business, Science and Arts occupations in St Meinrad, the most male-oriented occupations are Education Instruction & Library (100.0%), Community & Social Service (65.9%), and Legal Services & Support (53.1%), while the most female-oriented occupations are Business & Financial (100.0%), Health Diagnosing & Treating (100.0%), and Health Technologists (100.0%).
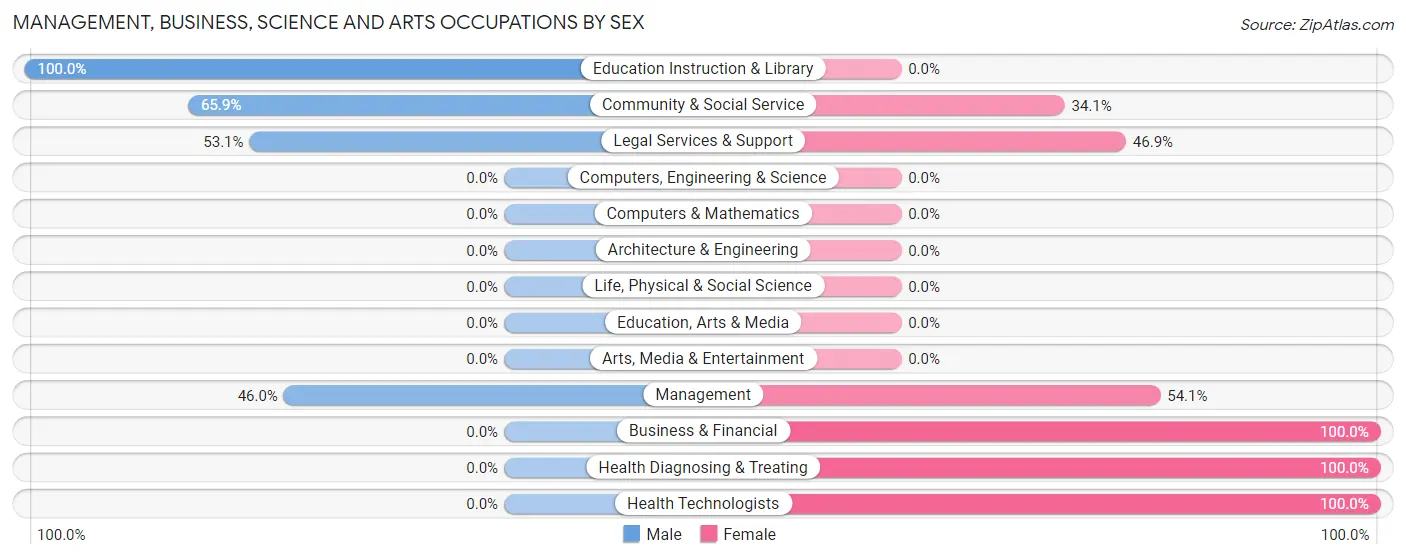
| Occupation | Male | Female |
| Management | 17 (46.0%) | 20 (54.0%) |
| Business & Financial | 0 (0.0%) | 15 (100.0%) |
| Computers, Engineering & Science | 0 (0.0%) | 0 (0.0%) |
| Computers & Mathematics | 0 (0.0%) | 0 (0.0%) |
| Architecture & Engineering | 0 (0.0%) | 0 (0.0%) |
| Life, Physical & Social Science | 0 (0.0%) | 0 (0.0%) |
| Community & Social Service | 29 (65.9%) | 15 (34.1%) |
| Education, Arts & Media | 0 (0.0%) | 0 (0.0%) |
| Legal Services & Support | 17 (53.1%) | 15 (46.9%) |
| Education Instruction & Library | 12 (100.0%) | 0 (0.0%) |
| Arts, Media & Entertainment | 0 (0.0%) | 0 (0.0%) |
| Health Diagnosing & Treating | 0 (0.0%) | 28 (100.0%) |
| Health Technologists | 0 (0.0%) | 28 (100.0%) |
| Total (Category) | 46 (37.1%) | 78 (62.9%) |
| Total (Overall) | 147 (48.8%) | 154 (51.2%) |
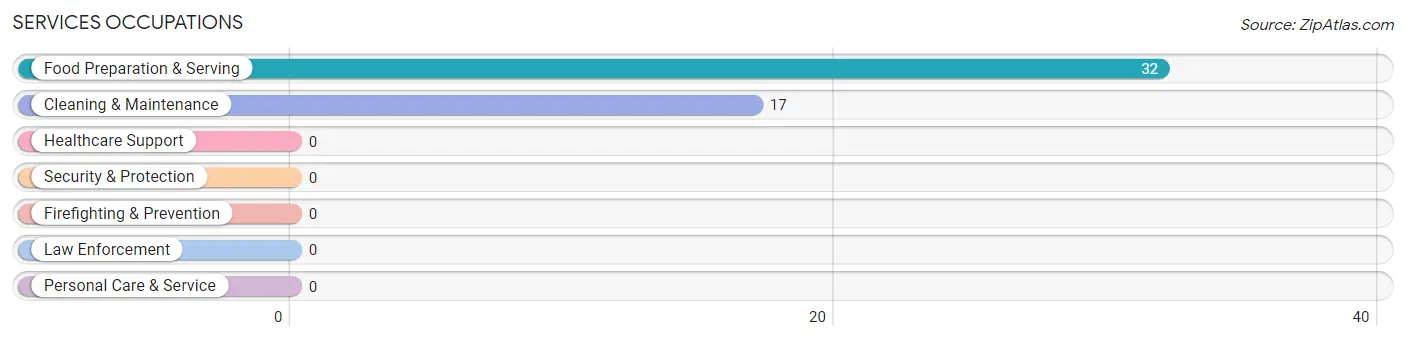
Services Occupations
The most common Services occupations in St Meinrad are Food Preparation & Serving (32 | 10.6%), and Cleaning & Maintenance (17 | 5.7%).
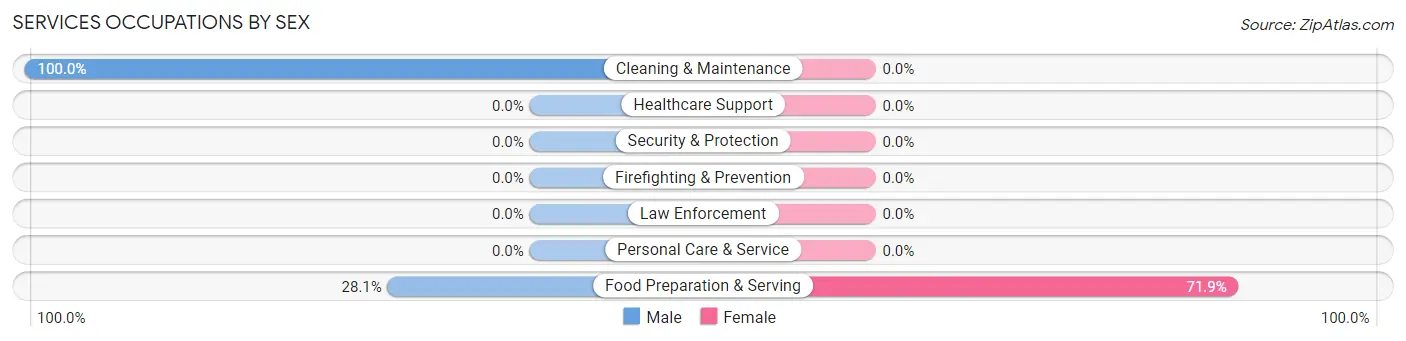
Services Occupations by Sex
| Occupation | Male | Female |
| Healthcare Support | 0 (0.0%) | 0 (0.0%) |
| Security & Protection | 0 (0.0%) | 0 (0.0%) |
| Firefighting & Prevention | 0 (0.0%) | 0 (0.0%) |
| Law Enforcement | 0 (0.0%) | 0 (0.0%) |
| Food Preparation & Serving | 9 (28.1%) | 23 (71.9%) |
| Cleaning & Maintenance | 17 (100.0%) | 0 (0.0%) |
| Personal Care & Service | 0 (0.0%) | 0 (0.0%) |
| Total (Category) | 26 (53.1%) | 23 (46.9%) |
| Total (Overall) | 147 (48.8%) | 154 (51.2%) |
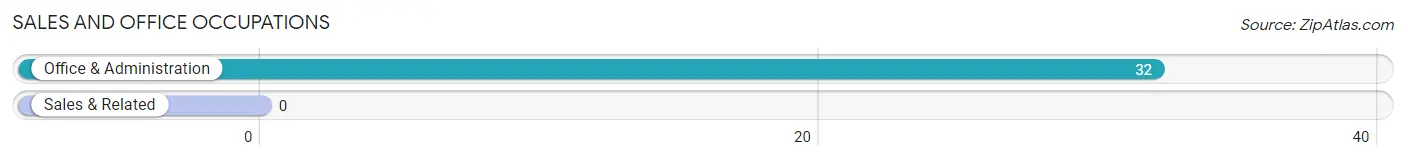
Sales and Office Occupations
The most common Sales and Office occupations in St Meinrad are , and Office & Administration (32 | 10.6%).
Sales and Office Occupations by Sex
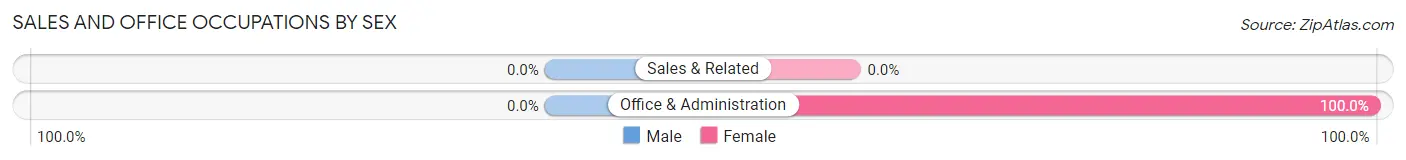
| Occupation | Male | Female |
| Sales & Related | 0 (0.0%) | 0 (0.0%) |
| Office & Administration | 0 (0.0%) | 32 (100.0%) |
| Total (Category) | 0 (0.0%) | 32 (100.0%) |
| Total (Overall) | 147 (48.8%) | 154 (51.2%) |
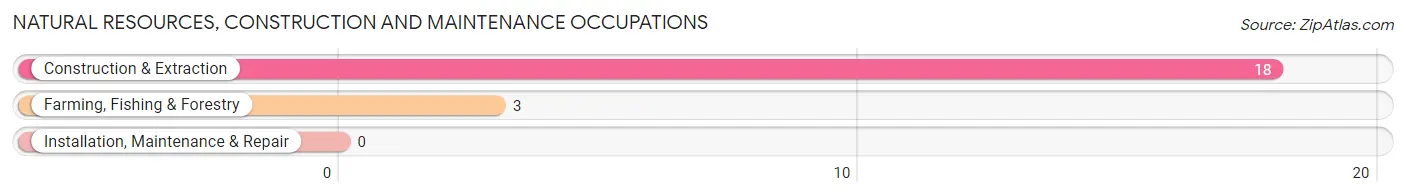
Natural Resources, Construction and Maintenance Occupations
The most common Natural Resources, Construction and Maintenance occupations in St Meinrad are Construction & Extraction (18 | 6.0%), and Farming, Fishing & Forestry (3 | 1.0%).
Natural Resources, Construction and Maintenance Occupations by Sex
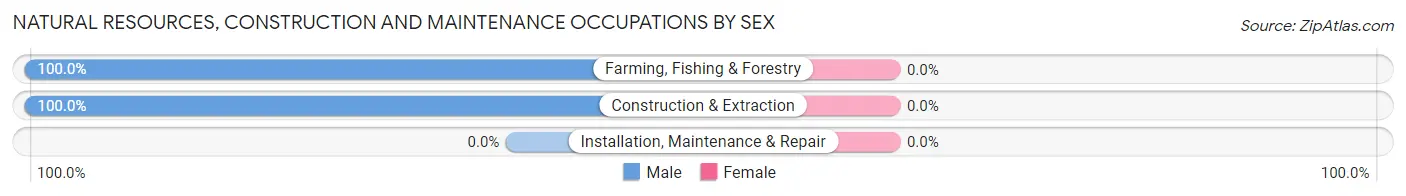
| Occupation | Male | Female |
| Farming, Fishing & Forestry | 3 (100.0%) | 0 (0.0%) |
| Construction & Extraction | 18 (100.0%) | 0 (0.0%) |
| Installation, Maintenance & Repair | 0 (0.0%) | 0 (0.0%) |
| Total (Category) | 21 (100.0%) | 0 (0.0%) |
| Total (Overall) | 147 (48.8%) | 154 (51.2%) |
Production, Transportation and Moving Occupations
The most common Production, Transportation and Moving occupations in St Meinrad are Material Moving (41 | 13.6%), Production (24 | 8.0%), and Transportation (10 | 3.3%).
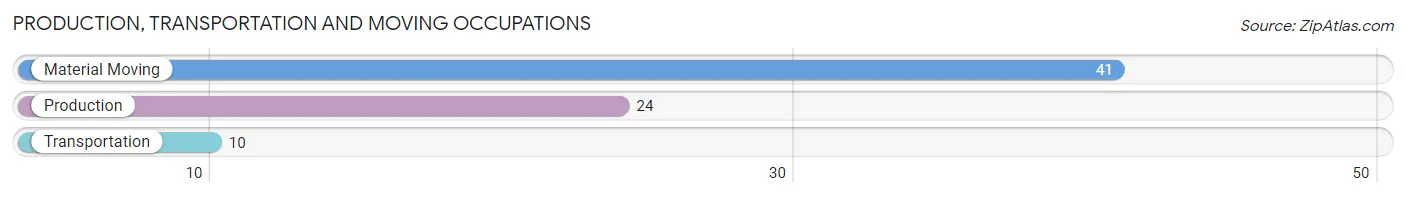
Production, Transportation and Moving Occupations by Sex
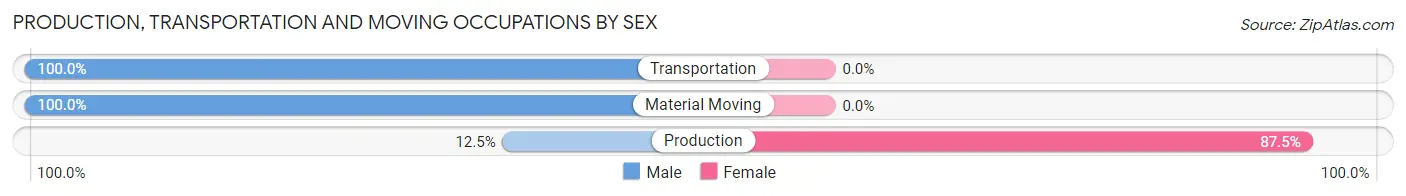
| Occupation | Male | Female |
| Production | 3 (12.5%) | 21 (87.5%) |
| Transportation | 10 (100.0%) | 0 (0.0%) |
| Material Moving | 41 (100.0%) | 0 (0.0%) |
| Total (Category) | 54 (72.0%) | 21 (28.0%) |
| Total (Overall) | 147 (48.8%) | 154 (51.2%) |
Employment Industries by Sex in St Meinrad
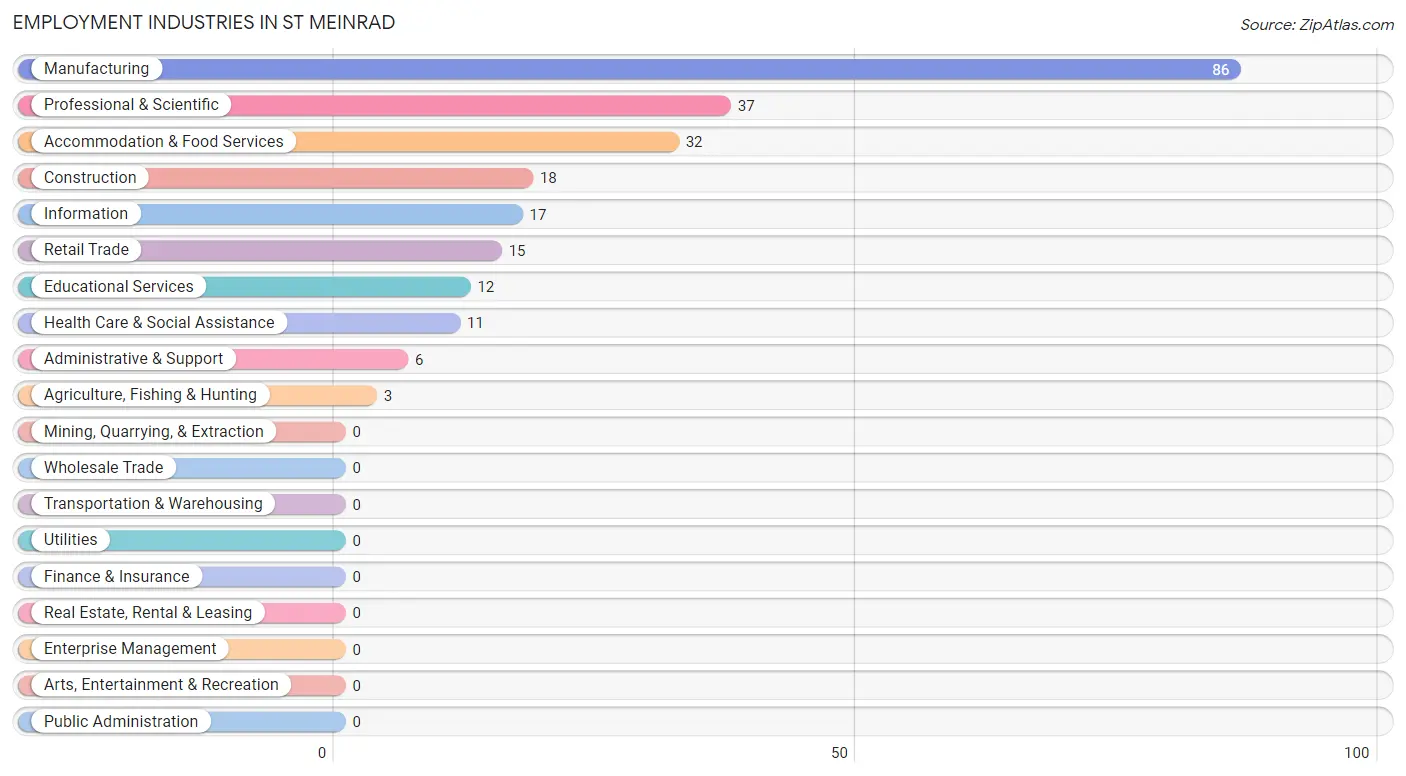
Employment Industries in St Meinrad
The major employment industries in St Meinrad include Manufacturing (86 | 28.6%), Professional & Scientific (37 | 12.3%), Accommodation & Food Services (32 | 10.6%), Construction (18 | 6.0%), and Information (17 | 5.7%).
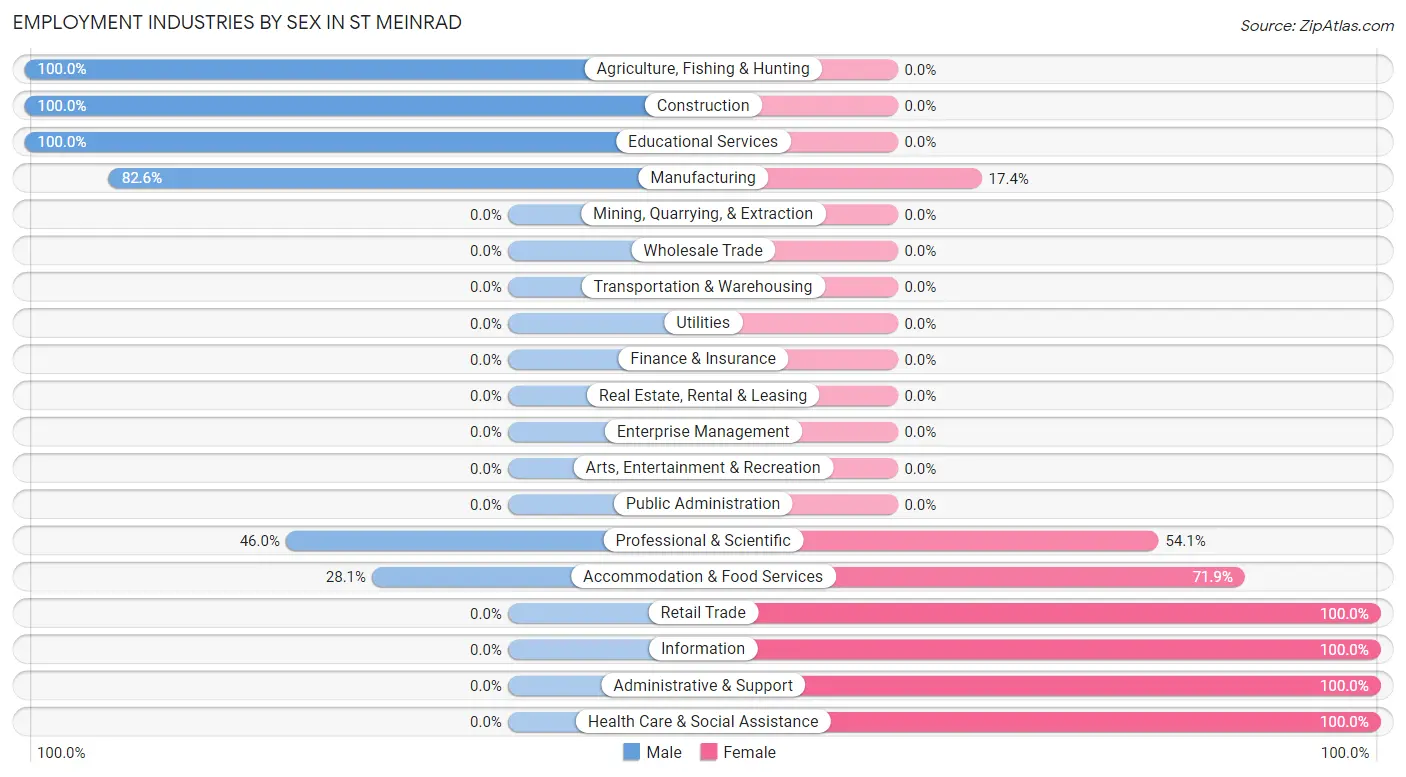
Employment Industries by Sex in St Meinrad
The St Meinrad industries that see more men than women are Agriculture, Fishing & Hunting (100.0%), Construction (100.0%), and Educational Services (100.0%), whereas the industries that tend to have a higher number of women are Retail Trade (100.0%), Information (100.0%), and Administrative & Support (100.0%).
| Industry | Male | Female |
| Agriculture, Fishing & Hunting | 3 (100.0%) | 0 (0.0%) |
| Mining, Quarrying, & Extraction | 0 (0.0%) | 0 (0.0%) |
| Construction | 18 (100.0%) | 0 (0.0%) |
| Manufacturing | 71 (82.6%) | 15 (17.4%) |
| Wholesale Trade | 0 (0.0%) | 0 (0.0%) |
| Retail Trade | 0 (0.0%) | 15 (100.0%) |
| Transportation & Warehousing | 0 (0.0%) | 0 (0.0%) |
| Utilities | 0 (0.0%) | 0 (0.0%) |
| Information | 0 (0.0%) | 17 (100.0%) |
| Finance & Insurance | 0 (0.0%) | 0 (0.0%) |
| Real Estate, Rental & Leasing | 0 (0.0%) | 0 (0.0%) |
| Professional & Scientific | 17 (46.0%) | 20 (54.0%) |
| Enterprise Management | 0 (0.0%) | 0 (0.0%) |
| Administrative & Support | 0 (0.0%) | 6 (100.0%) |
| Educational Services | 12 (100.0%) | 0 (0.0%) |
| Health Care & Social Assistance | 0 (0.0%) | 11 (100.0%) |
| Arts, Entertainment & Recreation | 0 (0.0%) | 0 (0.0%) |
| Accommodation & Food Services | 9 (28.1%) | 23 (71.9%) |
| Public Administration | 0 (0.0%) | 0 (0.0%) |
| Total | 147 (48.8%) | 154 (51.2%) |
Education in St Meinrad
School Enrollment in St Meinrad
The most common levels of schooling among the 174 students in St Meinrad are college / undergraduate (49 | 28.2%), elementary school (38 | 21.8%), and graduate / professional (27 | 15.5%).
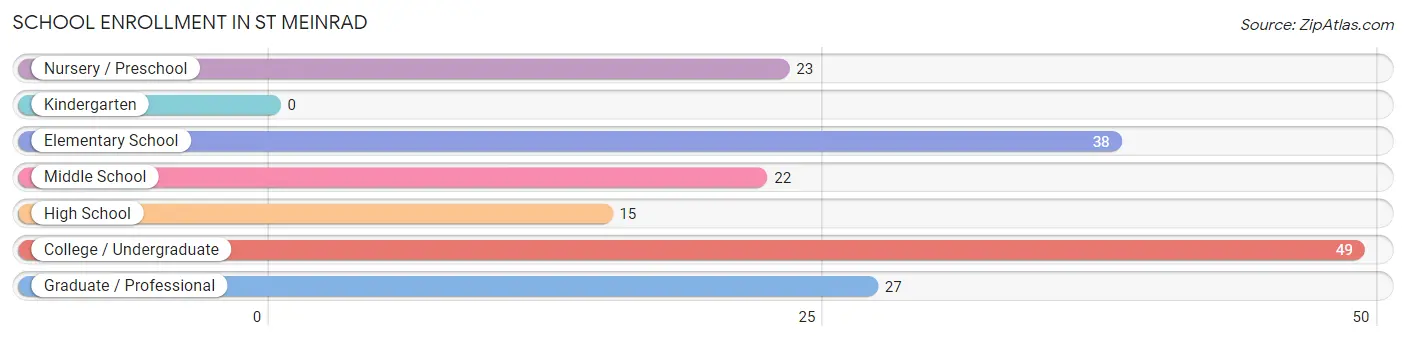
| School Level | # Students | % Students |
| Nursery / Preschool | 23 | 13.2% |
| Kindergarten | 0 | 0.0% |
| Elementary School | 38 | 21.8% |
| Middle School | 22 | 12.6% |
| High School | 15 | 8.6% |
| College / Undergraduate | 49 | 28.2% |
| Graduate / Professional | 27 | 15.5% |
| Total | 174 | 100.0% |
School Enrollment by Age by Funding Source in St Meinrad
Out of a total of 174 students who are enrolled in schools in St Meinrad, 31 (17.8%) attend a private institution, while the remaining 143 (82.2%) are enrolled in public schools. The age group of 35 years and over has the highest likelihood of being enrolled in private schools, with 3 (100.0% in the age bracket) enrolled. Conversely, the age group of 3 to 4 year olds has the lowest likelihood of being enrolled in a private school, with 23 (100.0% in the age bracket) attending a public institution.
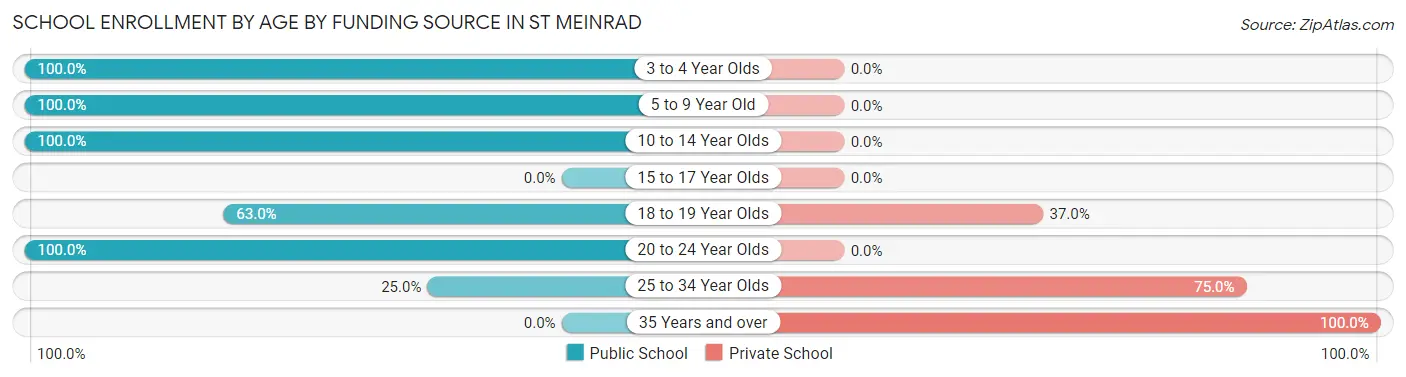
| Age Bracket | Public School | Private School |
| 3 to 4 Year Olds | 23 (100.0%) | 0 (0.0%) |
| 5 to 9 Year Old | 38 (100.0%) | 0 (0.0%) |
| 10 to 14 Year Olds | 37 (100.0%) | 0 (0.0%) |
| 15 to 17 Year Olds | 0 (0.0%) | 0 (0.0%) |
| 18 to 19 Year Olds | 17 (63.0%) | 10 (37.0%) |
| 20 to 24 Year Olds | 22 (100.0%) | 0 (0.0%) |
| 25 to 34 Year Olds | 6 (25.0%) | 18 (75.0%) |
| 35 Years and over | 0 (0.0%) | 3 (100.0%) |
| Total | 143 (82.2%) | 31 (17.8%) |
Educational Attainment by Field of Study in St Meinrad
Education (34 | 25.6%), liberal arts & history (32 | 24.1%), science & technology (20 | 15.0%), arts & humanities (20 | 15.0%), and communications (15 | 11.3%) are the most common fields of study among 133 individuals in St Meinrad who have obtained a bachelor's degree or higher.
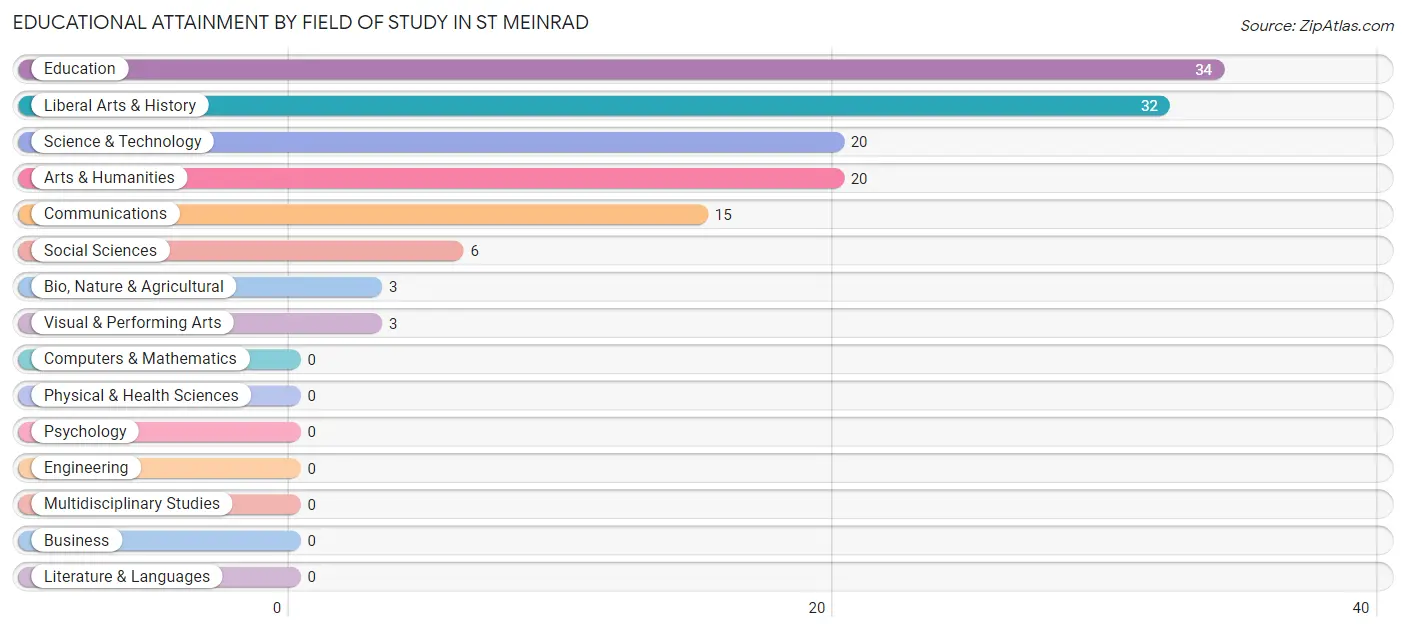
| Field of Study | # Graduates | % Graduates |
| Computers & Mathematics | 0 | 0.0% |
| Bio, Nature & Agricultural | 3 | 2.3% |
| Physical & Health Sciences | 0 | 0.0% |
| Psychology | 0 | 0.0% |
| Social Sciences | 6 | 4.5% |
| Engineering | 0 | 0.0% |
| Multidisciplinary Studies | 0 | 0.0% |
| Science & Technology | 20 | 15.0% |
| Business | 0 | 0.0% |
| Education | 34 | 25.6% |
| Literature & Languages | 0 | 0.0% |
| Liberal Arts & History | 32 | 24.1% |
| Visual & Performing Arts | 3 | 2.3% |
| Communications | 15 | 11.3% |
| Arts & Humanities | 20 | 15.0% |
| Total | 133 | 100.0% |
Transportation & Commute in St Meinrad
Vehicle Availability by Sex in St Meinrad
The most prevalent vehicle ownership categories in St Meinrad are males with 3 vehicles (62, accounting for 51.7%) and females with 3 vehicles (86, making up 41.9%).
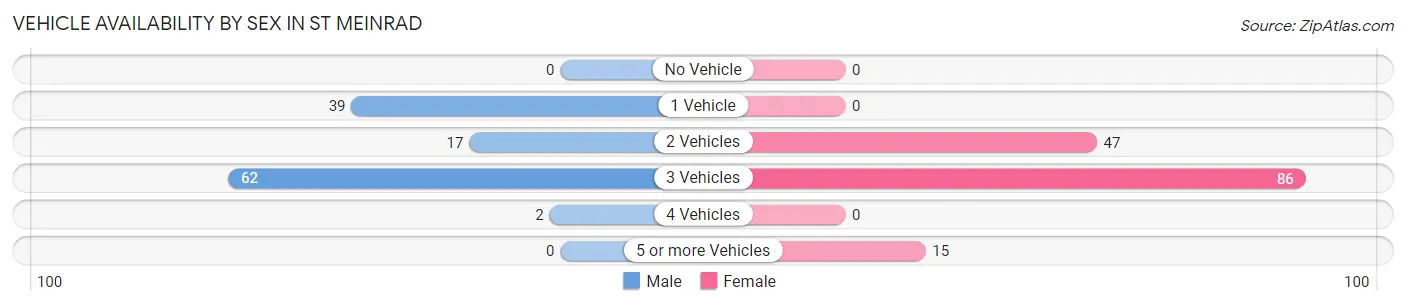
| Vehicles Available | Male | Female |
| No Vehicle | 0 (0.0%) | 0 (0.0%) |
| 1 Vehicle | 39 (32.5%) | 0 (0.0%) |
| 2 Vehicles | 17 (14.2%) | 47 (31.8%) |
| 3 Vehicles | 62 (51.7%) | 86 (58.1%) |
| 4 Vehicles | 2 (1.7%) | 0 (0.0%) |
| 5 or more Vehicles | 0 (0.0%) | 15 (10.1%) |
| Total | 120 (100.0%) | 148 (100.0%) |
Commute Time in St Meinrad
The most frequently occuring commute durations in St Meinrad are 10 to 14 minutes (130 commuters, 43.6%), 15 to 19 minutes (50 commuters, 16.8%), and less than 5 minutes (23 commuters, 7.7%).
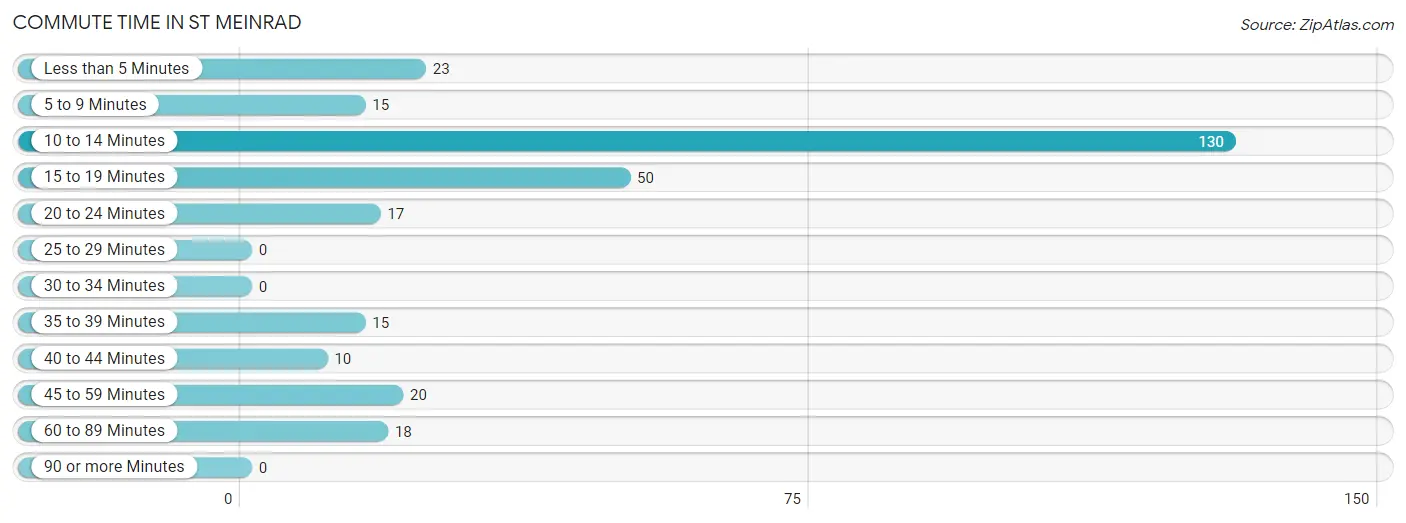
| Commute Time | # Commuters | % Commuters |
| Less than 5 Minutes | 23 | 7.7% |
| 5 to 9 Minutes | 15 | 5.0% |
| 10 to 14 Minutes | 130 | 43.6% |
| 15 to 19 Minutes | 50 | 16.8% |
| 20 to 24 Minutes | 17 | 5.7% |
| 25 to 29 Minutes | 0 | 0.0% |
| 30 to 34 Minutes | 0 | 0.0% |
| 35 to 39 Minutes | 15 | 5.0% |
| 40 to 44 Minutes | 10 | 3.4% |
| 45 to 59 Minutes | 20 | 6.7% |
| 60 to 89 Minutes | 18 | 6.0% |
| 90 or more Minutes | 0 | 0.0% |
Commute Time by Sex in St Meinrad
The most common commute times in St Meinrad are 10 to 14 minutes (43 commuters, 29.9%) for males and 10 to 14 minutes (87 commuters, 56.5%) for females.
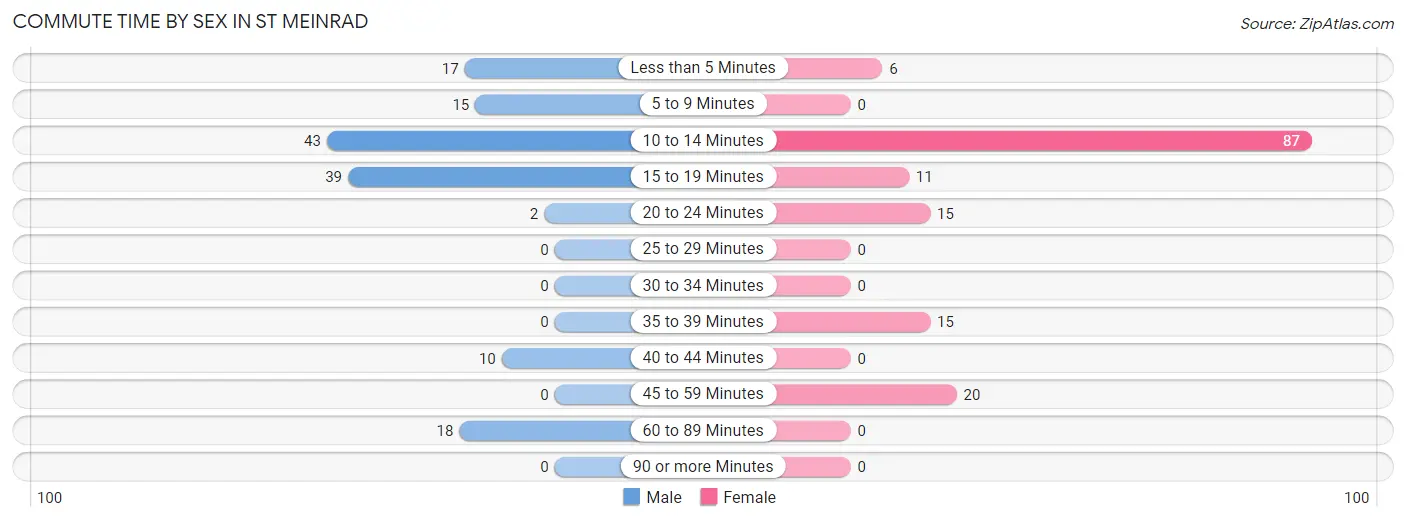
| Commute Time | Male | Female |
| Less than 5 Minutes | 17 (11.8%) | 6 (3.9%) |
| 5 to 9 Minutes | 15 (10.4%) | 0 (0.0%) |
| 10 to 14 Minutes | 43 (29.9%) | 87 (56.5%) |
| 15 to 19 Minutes | 39 (27.1%) | 11 (7.1%) |
| 20 to 24 Minutes | 2 (1.4%) | 15 (9.7%) |
| 25 to 29 Minutes | 0 (0.0%) | 0 (0.0%) |
| 30 to 34 Minutes | 0 (0.0%) | 0 (0.0%) |
| 35 to 39 Minutes | 0 (0.0%) | 15 (9.7%) |
| 40 to 44 Minutes | 10 (6.9%) | 0 (0.0%) |
| 45 to 59 Minutes | 0 (0.0%) | 20 (13.0%) |
| 60 to 89 Minutes | 18 (12.5%) | 0 (0.0%) |
| 90 or more Minutes | 0 (0.0%) | 0 (0.0%) |
Time of Departure to Work by Sex in St Meinrad
The most frequent times of departure to work in St Meinrad are 4:00 PM to 11:59 PM (42, 29.2%) for males and 4:00 PM to 11:59 PM (38, 24.7%) for females.
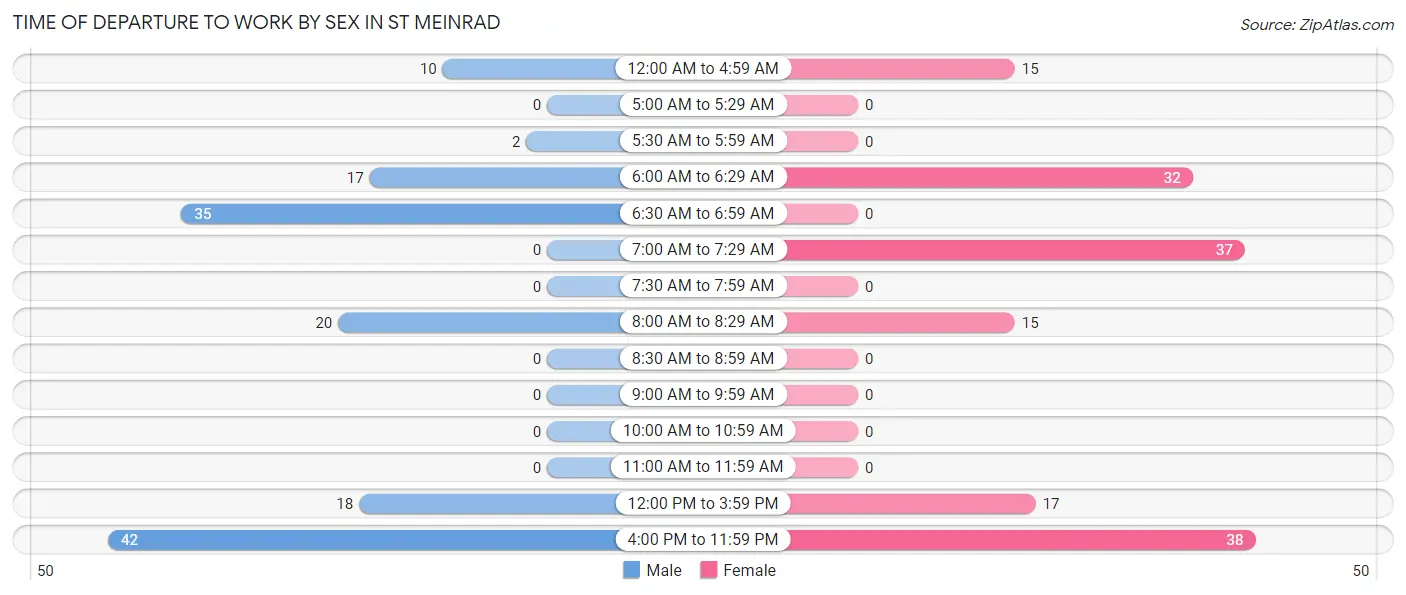
| Time of Departure | Male | Female |
| 12:00 AM to 4:59 AM | 10 (6.9%) | 15 (9.7%) |
| 5:00 AM to 5:29 AM | 0 (0.0%) | 0 (0.0%) |
| 5:30 AM to 5:59 AM | 2 (1.4%) | 0 (0.0%) |
| 6:00 AM to 6:29 AM | 17 (11.8%) | 32 (20.8%) |
| 6:30 AM to 6:59 AM | 35 (24.3%) | 0 (0.0%) |
| 7:00 AM to 7:29 AM | 0 (0.0%) | 37 (24.0%) |
| 7:30 AM to 7:59 AM | 0 (0.0%) | 0 (0.0%) |
| 8:00 AM to 8:29 AM | 20 (13.9%) | 15 (9.7%) |
| 8:30 AM to 8:59 AM | 0 (0.0%) | 0 (0.0%) |
| 9:00 AM to 9:59 AM | 0 (0.0%) | 0 (0.0%) |
| 10:00 AM to 10:59 AM | 0 (0.0%) | 0 (0.0%) |
| 11:00 AM to 11:59 AM | 0 (0.0%) | 0 (0.0%) |
| 12:00 PM to 3:59 PM | 18 (12.5%) | 17 (11.0%) |
| 4:00 PM to 11:59 PM | 42 (29.2%) | 38 (24.7%) |
| Total | 144 (100.0%) | 154 (100.0%) |
Housing Occupancy in St Meinrad
Occupancy by Ownership in St Meinrad
Of the total 293 dwellings in St Meinrad, owner-occupied units account for 201 (68.6%), while renter-occupied units make up 92 (31.4%).
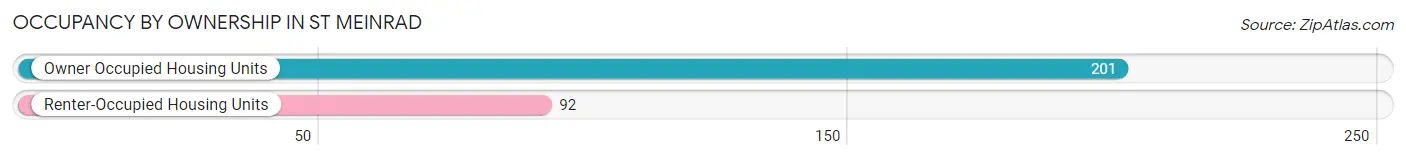
| Occupancy | # Housing Units | % Housing Units |
| Owner Occupied Housing Units | 201 | 68.6% |
| Renter-Occupied Housing Units | 92 | 31.4% |
| Total Occupied Housing Units | 293 | 100.0% |
Occupancy by Household Size in St Meinrad
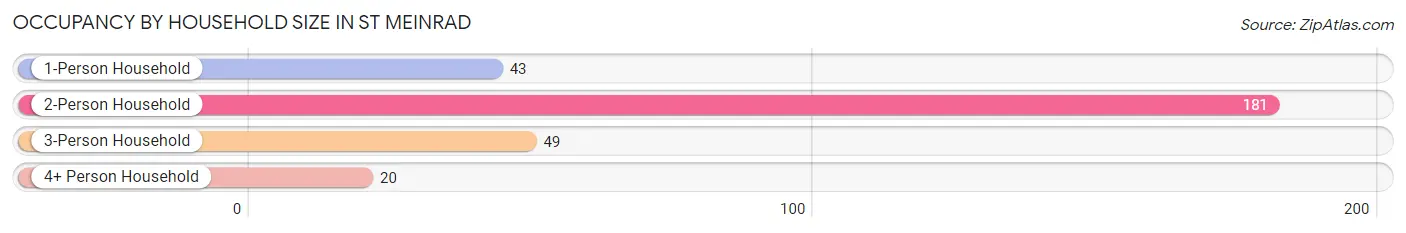
| Household Size | # Housing Units | % Housing Units |
| 1-Person Household | 43 | 14.7% |
| 2-Person Household | 181 | 61.8% |
| 3-Person Household | 49 | 16.7% |
| 4+ Person Household | 20 | 6.8% |
| Total Housing Units | 293 | 100.0% |
Occupancy by Ownership by Household Size in St Meinrad
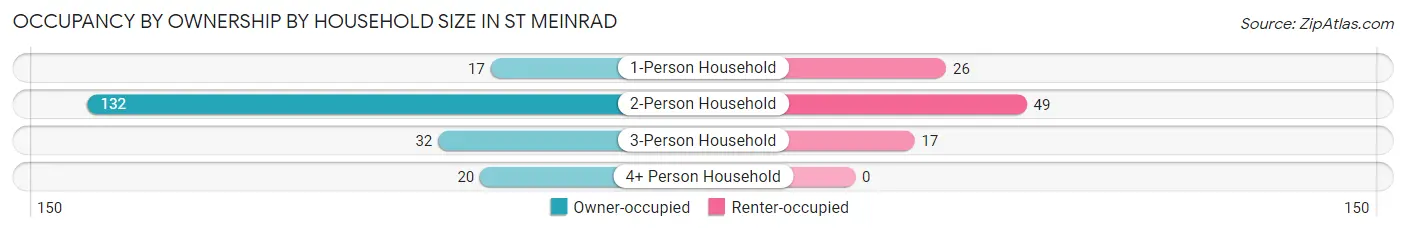
| Household Size | Owner-occupied | Renter-occupied |
| 1-Person Household | 17 (39.5%) | 26 (60.5%) |
| 2-Person Household | 132 (72.9%) | 49 (27.1%) |
| 3-Person Household | 32 (65.3%) | 17 (34.7%) |
| 4+ Person Household | 20 (100.0%) | 0 (0.0%) |
| Total Housing Units | 201 (68.6%) | 92 (31.4%) |
Occupancy by Educational Attainment in St Meinrad
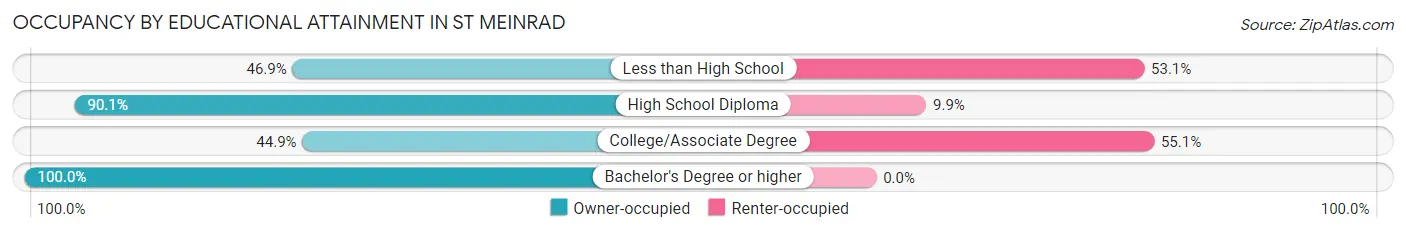
| Household Size | Owner-occupied | Renter-occupied |
| Less than High School | 15 (46.9%) | 17 (53.1%) |
| High School Diploma | 91 (90.1%) | 10 (9.9%) |
| College/Associate Degree | 53 (44.9%) | 65 (55.1%) |
| Bachelor's Degree or higher | 42 (100.0%) | 0 (0.0%) |
Occupancy by Age of Householder in St Meinrad
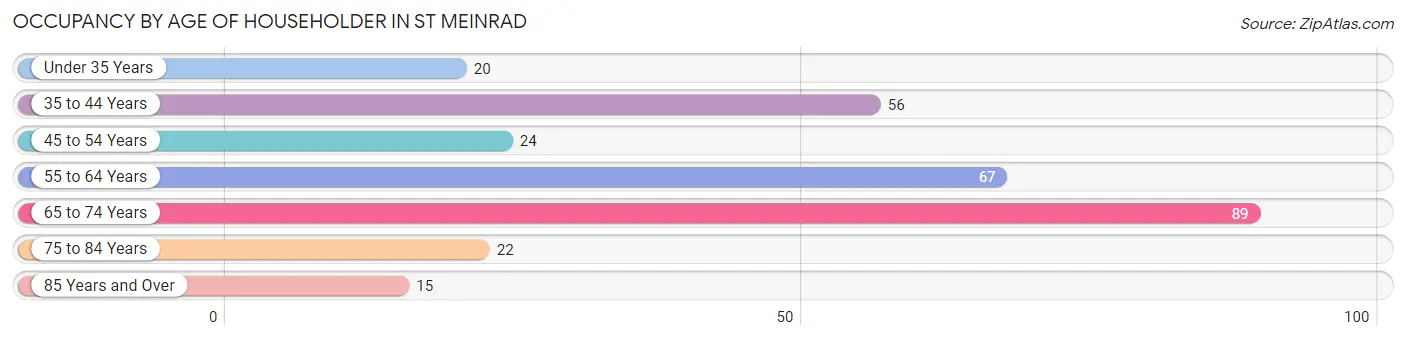
| Age Bracket | # Households | % Households |
| Under 35 Years | 20 | 6.8% |
| 35 to 44 Years | 56 | 19.1% |
| 45 to 54 Years | 24 | 8.2% |
| 55 to 64 Years | 67 | 22.9% |
| 65 to 74 Years | 89 | 30.4% |
| 75 to 84 Years | 22 | 7.5% |
| 85 Years and Over | 15 | 5.1% |
| Total | 293 | 100.0% |
Housing Finances in St Meinrad
Median Income by Occupancy in St Meinrad
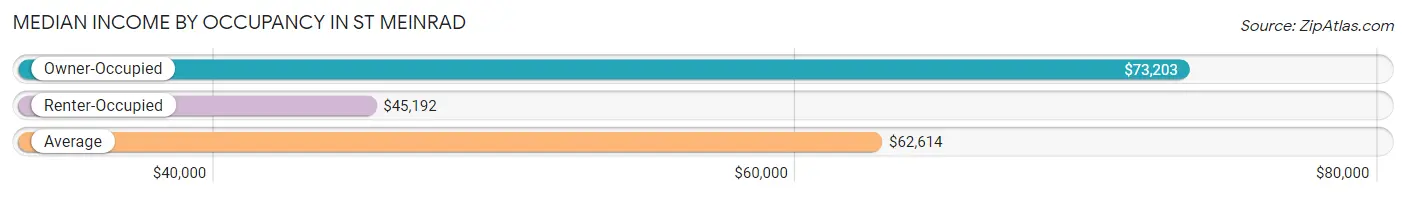
| Occupancy Type | # Households | Median Income |
| Owner-Occupied | 201 (68.6%) | $73,203 |
| Renter-Occupied | 92 (31.4%) | $45,192 |
| Average | 293 (100.0%) | $62,614 |
Occupancy by Householder Income Bracket in St Meinrad
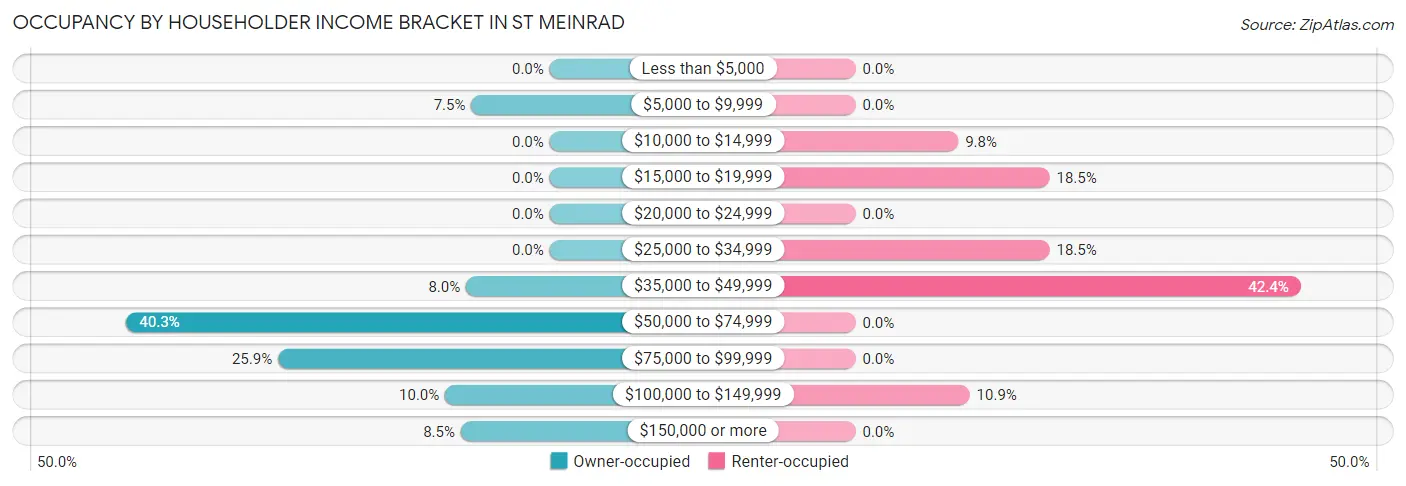
| Income Bracket | Owner-occupied | Renter-occupied |
| Less than $5,000 | 0 (0.0%) | 0 (0.0%) |
| $5,000 to $9,999 | 15 (7.5%) | 0 (0.0%) |
| $10,000 to $14,999 | 0 (0.0%) | 9 (9.8%) |
| $15,000 to $19,999 | 0 (0.0%) | 17 (18.5%) |
| $20,000 to $24,999 | 0 (0.0%) | 0 (0.0%) |
| $25,000 to $34,999 | 0 (0.0%) | 17 (18.5%) |
| $35,000 to $49,999 | 16 (8.0%) | 39 (42.4%) |
| $50,000 to $74,999 | 81 (40.3%) | 0 (0.0%) |
| $75,000 to $99,999 | 52 (25.9%) | 0 (0.0%) |
| $100,000 to $149,999 | 20 (10.0%) | 10 (10.9%) |
| $150,000 or more | 17 (8.5%) | 0 (0.0%) |
| Total | 201 (100.0%) | 92 (100.0%) |
Monthly Housing Cost Tiers in St Meinrad
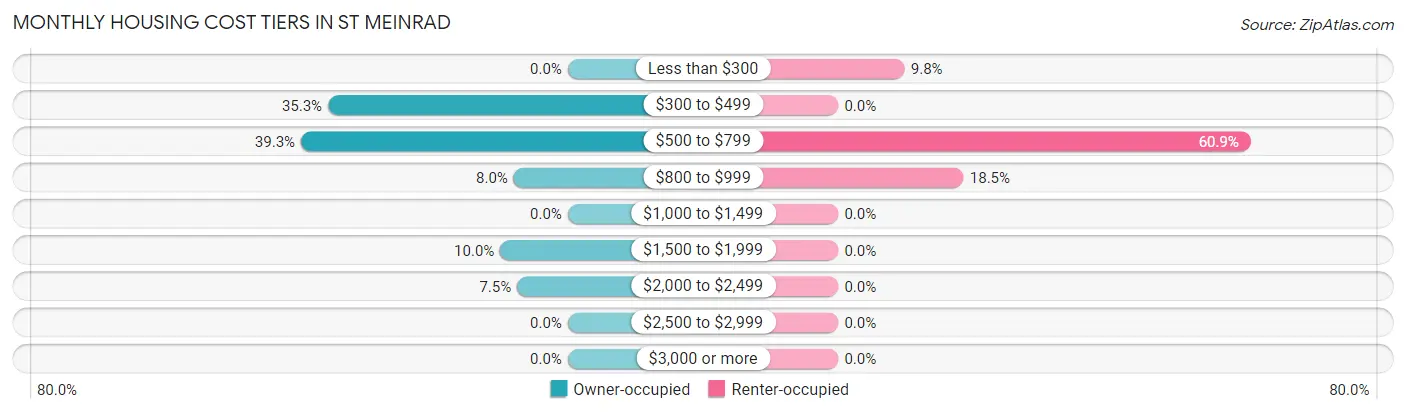
| Monthly Cost | Owner-occupied | Renter-occupied |
| Less than $300 | 0 (0.0%) | 9 (9.8%) |
| $300 to $499 | 71 (35.3%) | 0 (0.0%) |
| $500 to $799 | 79 (39.3%) | 56 (60.9%) |
| $800 to $999 | 16 (8.0%) | 17 (18.5%) |
| $1,000 to $1,499 | 0 (0.0%) | 0 (0.0%) |
| $1,500 to $1,999 | 20 (10.0%) | 0 (0.0%) |
| $2,000 to $2,499 | 15 (7.5%) | 0 (0.0%) |
| $2,500 to $2,999 | 0 (0.0%) | 0 (0.0%) |
| $3,000 or more | 0 (0.0%) | 0 (0.0%) |
| Total | 201 (100.0%) | 92 (100.0%) |
Physical Housing Characteristics in St Meinrad
Housing Structures in St Meinrad
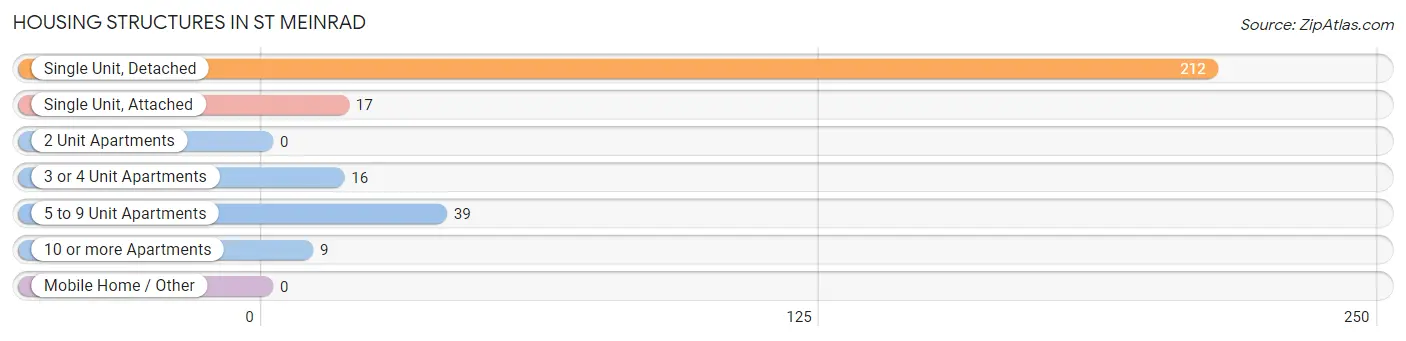
| Structure Type | # Housing Units | % Housing Units |
| Single Unit, Detached | 212 | 72.4% |
| Single Unit, Attached | 17 | 5.8% |
| 2 Unit Apartments | 0 | 0.0% |
| 3 or 4 Unit Apartments | 16 | 5.5% |
| 5 to 9 Unit Apartments | 39 | 13.3% |
| 10 or more Apartments | 9 | 3.1% |
| Mobile Home / Other | 0 | 0.0% |
| Total | 293 | 100.0% |
Housing Structures by Occupancy in St Meinrad
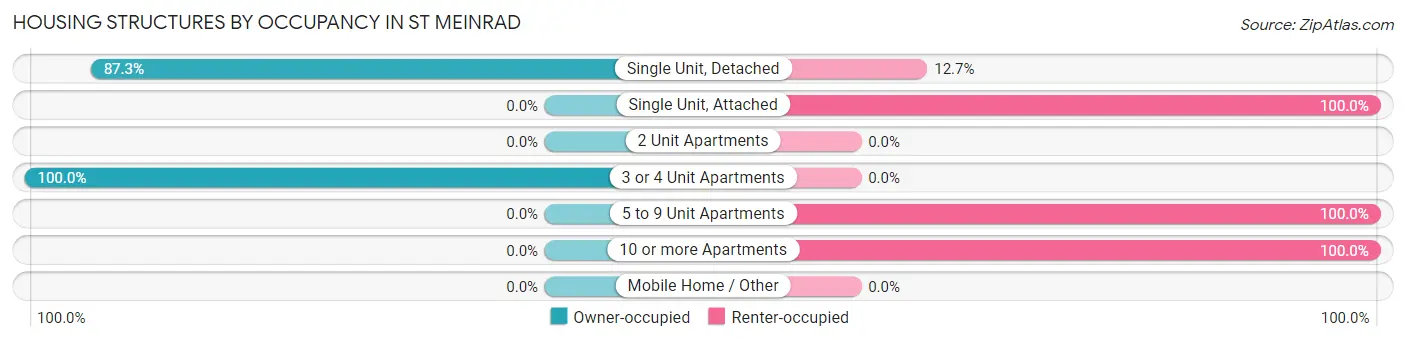
| Structure Type | Owner-occupied | Renter-occupied |
| Single Unit, Detached | 185 (87.3%) | 27 (12.7%) |
| Single Unit, Attached | 0 (0.0%) | 17 (100.0%) |
| 2 Unit Apartments | 0 (0.0%) | 0 (0.0%) |
| 3 or 4 Unit Apartments | 16 (100.0%) | 0 (0.0%) |
| 5 to 9 Unit Apartments | 0 (0.0%) | 39 (100.0%) |
| 10 or more Apartments | 0 (0.0%) | 9 (100.0%) |
| Mobile Home / Other | 0 (0.0%) | 0 (0.0%) |
| Total | 201 (68.6%) | 92 (31.4%) |
Housing Structures by Number of Rooms in St Meinrad
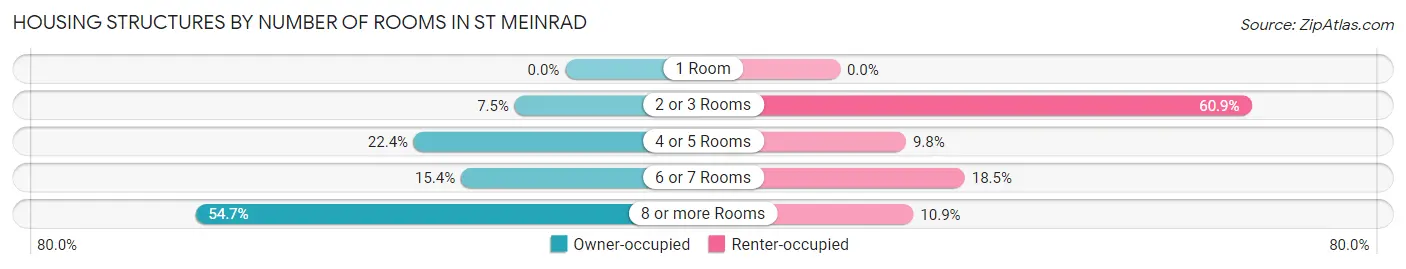
| Number of Rooms | Owner-occupied | Renter-occupied |
| 1 Room | 0 (0.0%) | 0 (0.0%) |
| 2 or 3 Rooms | 15 (7.5%) | 56 (60.9%) |
| 4 or 5 Rooms | 45 (22.4%) | 9 (9.8%) |
| 6 or 7 Rooms | 31 (15.4%) | 17 (18.5%) |
| 8 or more Rooms | 110 (54.7%) | 10 (10.9%) |
| Total | 201 (100.0%) | 92 (100.0%) |
Housing Structure by Heating Type in St Meinrad
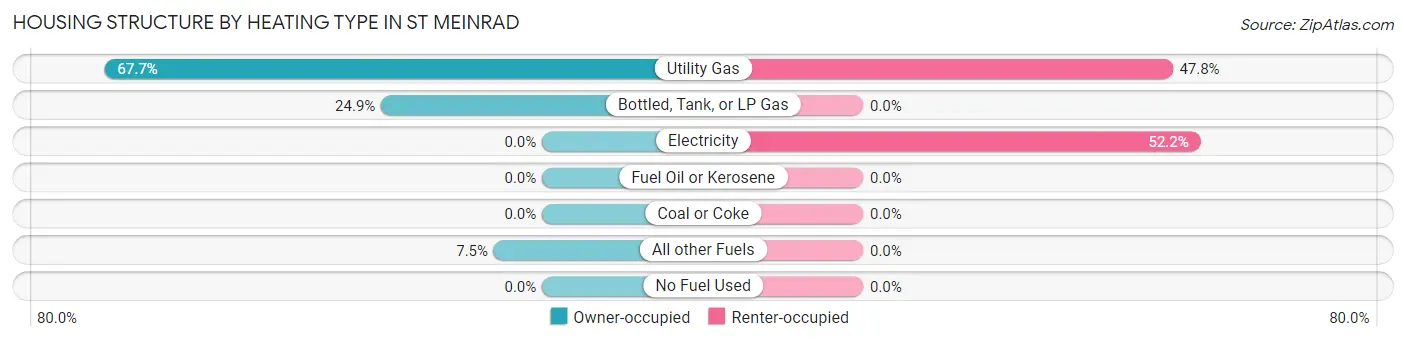
| Heating Type | Owner-occupied | Renter-occupied |
| Utility Gas | 136 (67.7%) | 44 (47.8%) |
| Bottled, Tank, or LP Gas | 50 (24.9%) | 0 (0.0%) |
| Electricity | 0 (0.0%) | 48 (52.2%) |
| Fuel Oil or Kerosene | 0 (0.0%) | 0 (0.0%) |
| Coal or Coke | 0 (0.0%) | 0 (0.0%) |
| All other Fuels | 15 (7.5%) | 0 (0.0%) |
| No Fuel Used | 0 (0.0%) | 0 (0.0%) |
| Total | 201 (100.0%) | 92 (100.0%) |
Household Vehicle Usage in St Meinrad
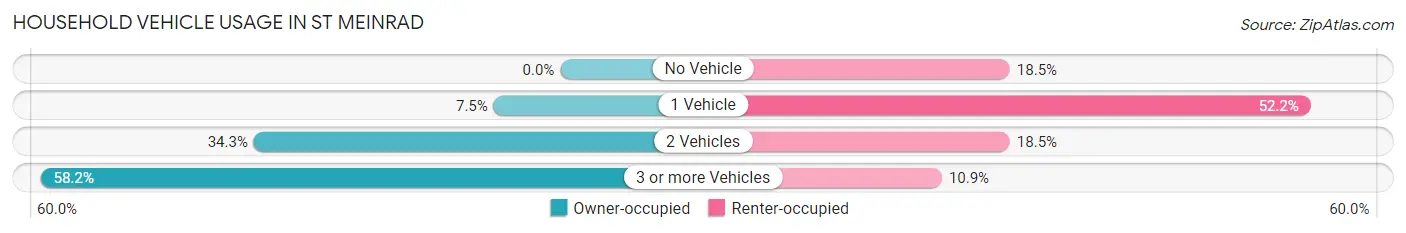
| Vehicles per Household | Owner-occupied | Renter-occupied |
| No Vehicle | 0 (0.0%) | 17 (18.5%) |
| 1 Vehicle | 15 (7.5%) | 48 (52.2%) |
| 2 Vehicles | 69 (34.3%) | 17 (18.5%) |
| 3 or more Vehicles | 117 (58.2%) | 10 (10.9%) |
| Total | 201 (100.0%) | 92 (100.0%) |
Real Estate & Mortgages in St Meinrad
Real Estate and Mortgage Overview in St Meinrad
| Characteristic | Without Mortgage | With Mortgage |
| Housing Units | 115 | 86 |
| Median Property Value | $99,700 | $269,300 |
| Median Household Income | $74,453 | $0 |
| Monthly Housing Costs | $467 | $0 |
| Real Estate Taxes | $487 | $0 |
Property Value by Mortgage Status in St Meinrad
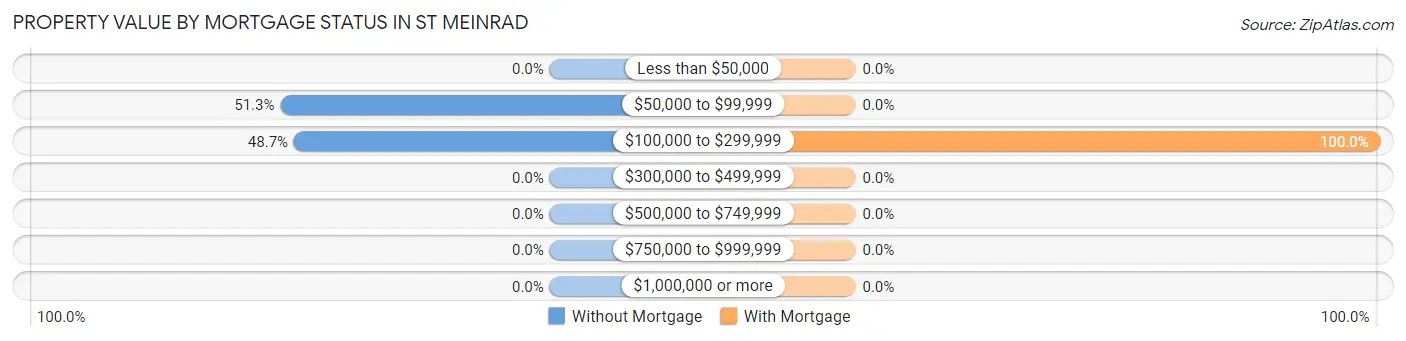
| Property Value | Without Mortgage | With Mortgage |
| Less than $50,000 | 0 (0.0%) | 0 (0.0%) |
| $50,000 to $99,999 | 59 (51.3%) | 0 (0.0%) |
| $100,000 to $299,999 | 56 (48.7%) | 86 (100.0%) |
| $300,000 to $499,999 | 0 (0.0%) | 0 (0.0%) |
| $500,000 to $749,999 | 0 (0.0%) | 0 (0.0%) |
| $750,000 to $999,999 | 0 (0.0%) | 0 (0.0%) |
| $1,000,000 or more | 0 (0.0%) | 0 (0.0%) |
| Total | 115 (100.0%) | 86 (100.0%) |
Household Income by Mortgage Status in St Meinrad
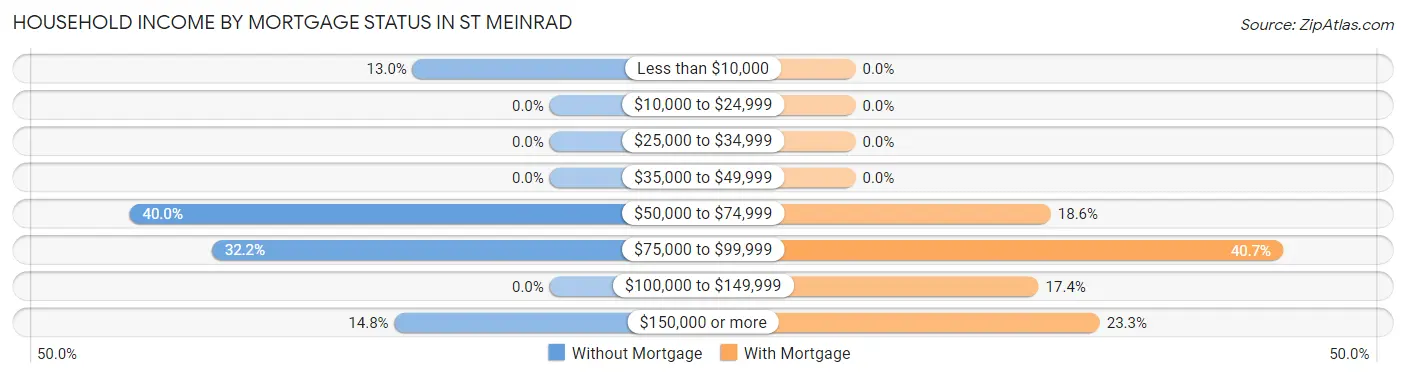
| Household Income | Without Mortgage | With Mortgage |
| Less than $10,000 | 15 (13.0%) | 0 (0.0%) |
| $10,000 to $24,999 | 0 (0.0%) | 0 (0.0%) |
| $25,000 to $34,999 | 0 (0.0%) | 0 (0.0%) |
| $35,000 to $49,999 | 0 (0.0%) | 0 (0.0%) |
| $50,000 to $74,999 | 46 (40.0%) | 16 (18.6%) |
| $75,000 to $99,999 | 37 (32.2%) | 35 (40.7%) |
| $100,000 to $149,999 | 0 (0.0%) | 15 (17.4%) |
| $150,000 or more | 17 (14.8%) | 20 (23.3%) |
| Total | 115 (100.0%) | 86 (100.0%) |
Property Value to Household Income Ratio in St Meinrad
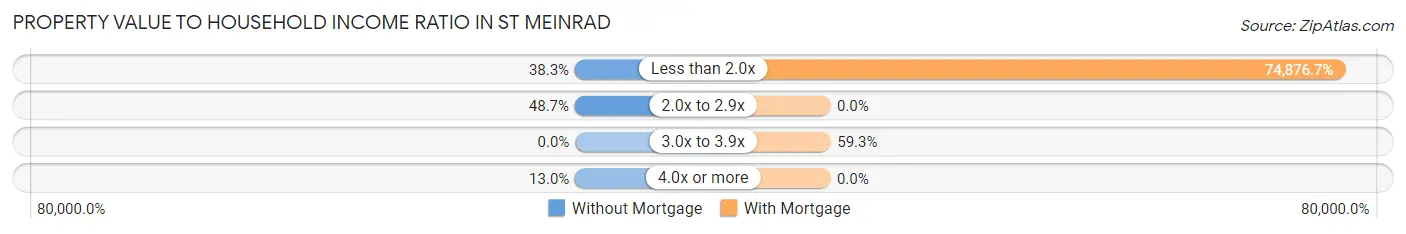
| Value-to-Income Ratio | Without Mortgage | With Mortgage |
| Less than 2.0x | 44 (38.3%) | 64,394 (74,876.7%) |
| 2.0x to 2.9x | 56 (48.7%) | 0 (0.0%) |
| 3.0x to 3.9x | 0 (0.0%) | 51 (59.3%) |
| 4.0x or more | 15 (13.0%) | 0 (0.0%) |
| Total | 115 (100.0%) | 86 (100.0%) |
Real Estate Taxes by Mortgage Status in St Meinrad
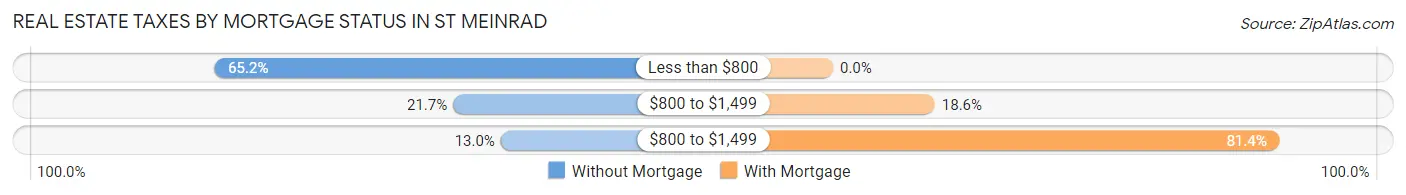
| Property Taxes | Without Mortgage | With Mortgage |
| Less than $800 | 75 (65.2%) | 0 (0.0%) |
| $800 to $1,499 | 25 (21.7%) | 16 (18.6%) |
| $800 to $1,499 | 15 (13.0%) | 70 (81.4%) |
| Total | 115 (100.0%) | 86 (100.0%) |
Health & Disability in St Meinrad
Health Insurance Coverage by Age in St Meinrad
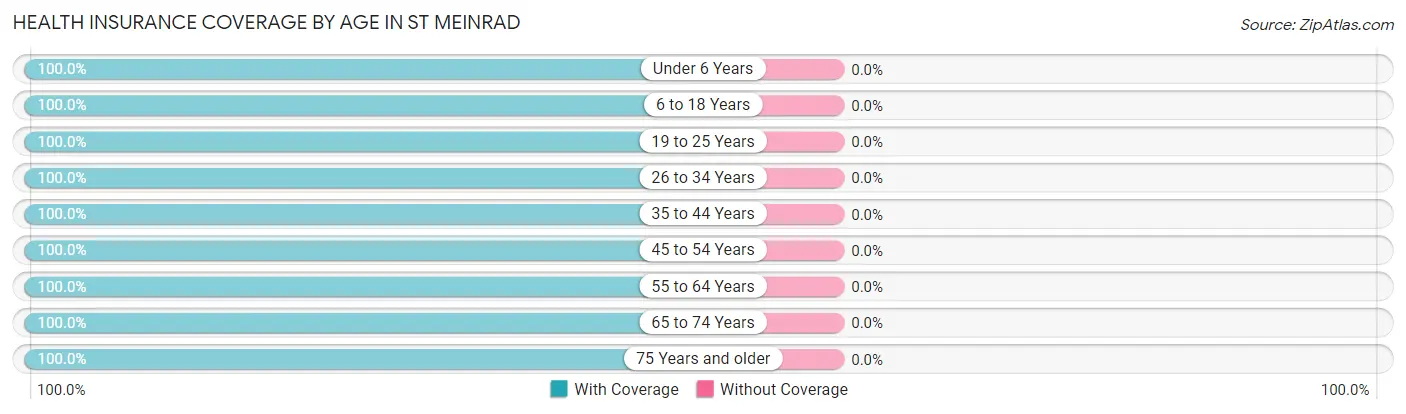
| Age Bracket | With Coverage | Without Coverage |
| Under 6 Years | 23 (100.0%) | 0 (0.0%) |
| 6 to 18 Years | 80 (100.0%) | 0 (0.0%) |
| 19 to 25 Years | 86 (100.0%) | 0 (0.0%) |
| 26 to 34 Years | 85 (100.0%) | 0 (0.0%) |
| 35 to 44 Years | 56 (100.0%) | 0 (0.0%) |
| 45 to 54 Years | 78 (100.0%) | 0 (0.0%) |
| 55 to 64 Years | 115 (100.0%) | 0 (0.0%) |
| 65 to 74 Years | 185 (100.0%) | 0 (0.0%) |
| 75 Years and older | 78 (100.0%) | 0 (0.0%) |
| Total | 786 (100.0%) | 0 (0.0%) |
Health Insurance Coverage by Citizenship Status in St Meinrad
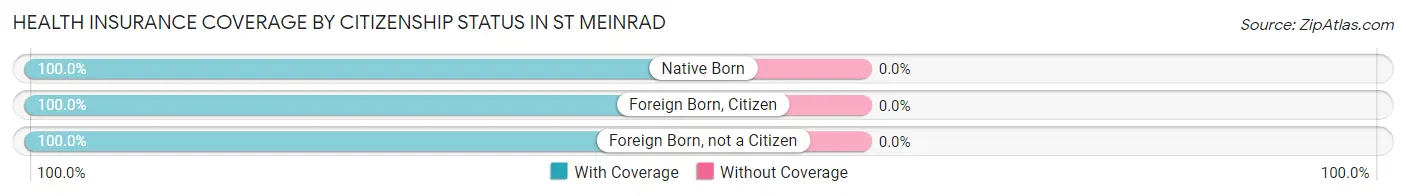
| Citizenship Status | With Coverage | Without Coverage |
| Native Born | 23 (100.0%) | 0 (0.0%) |
| Foreign Born, Citizen | 80 (100.0%) | 0 (0.0%) |
| Foreign Born, not a Citizen | 86 (100.0%) | 0 (0.0%) |
Health Insurance Coverage by Household Income in St Meinrad
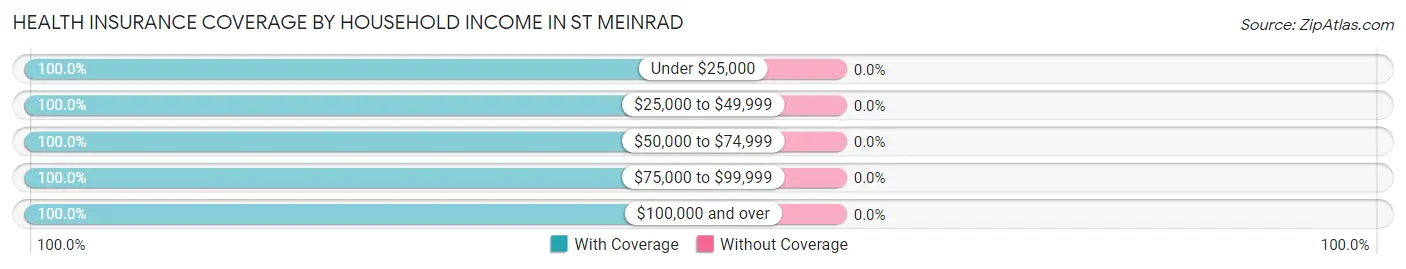
| Household Income | With Coverage | Without Coverage |
| Under $25,000 | 41 (100.0%) | 0 (0.0%) |
| $25,000 to $49,999 | 159 (100.0%) | 0 (0.0%) |
| $50,000 to $74,999 | 149 (100.0%) | 0 (0.0%) |
| $75,000 to $99,999 | 157 (100.0%) | 0 (0.0%) |
| $100,000 and over | 184 (100.0%) | 0 (0.0%) |
Public vs Private Health Insurance Coverage by Age in St Meinrad
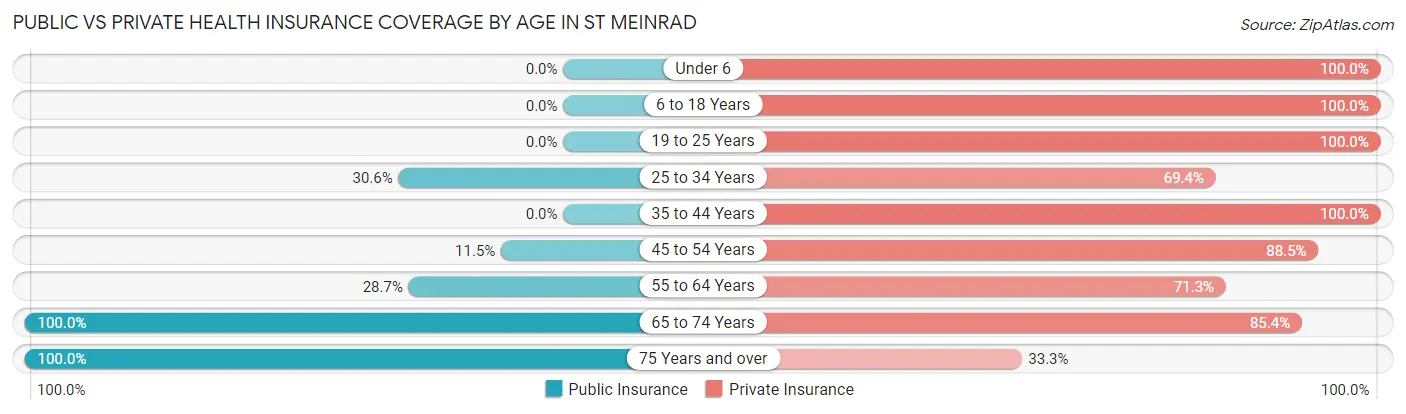
| Age Bracket | Public Insurance | Private Insurance |
| Under 6 | 0 (0.0%) | 23 (100.0%) |
| 6 to 18 Years | 0 (0.0%) | 80 (100.0%) |
| 19 to 25 Years | 0 (0.0%) | 86 (100.0%) |
| 25 to 34 Years | 26 (30.6%) | 59 (69.4%) |
| 35 to 44 Years | 0 (0.0%) | 56 (100.0%) |
| 45 to 54 Years | 9 (11.5%) | 69 (88.5%) |
| 55 to 64 Years | 33 (28.7%) | 82 (71.3%) |
| 65 to 74 Years | 185 (100.0%) | 158 (85.4%) |
| 75 Years and over | 78 (100.0%) | 26 (33.3%) |
| Total | 331 (42.1%) | 639 (81.3%) |
Disability Status by Sex by Age in St Meinrad
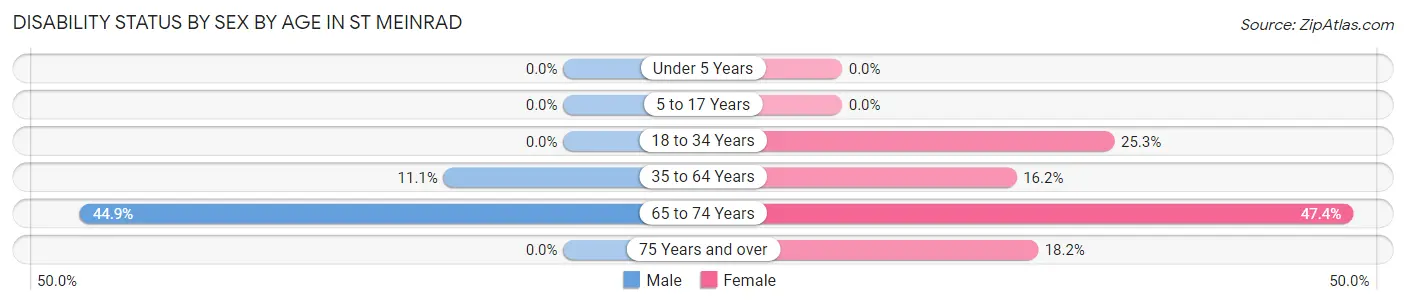
| Age Bracket | Male | Female |
| Under 5 Years | 0 (0.0%) | 0 (0.0%) |
| 5 to 17 Years | 0 (0.0%) | 0 (0.0%) |
| 18 to 34 Years | 0 (0.0%) | 23 (25.3%) |
| 35 to 64 Years | 16 (11.1%) | 17 (16.2%) |
| 65 to 74 Years | 48 (44.9%) | 37 (47.4%) |
| 75 Years and over | 0 (0.0%) | 10 (18.2%) |
Disability Class by Sex by Age in St Meinrad
Disability Class: Hearing Difficulty
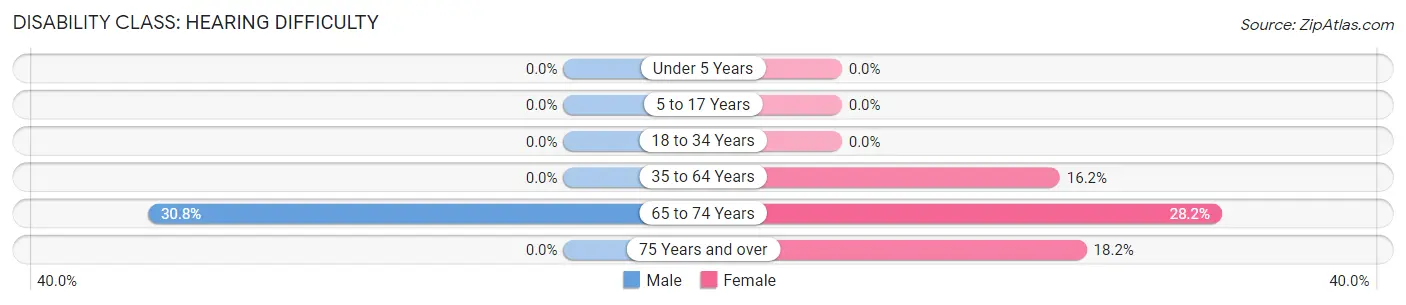
| Age Bracket | Male | Female |
| Under 5 Years | 0 (0.0%) | 0 (0.0%) |
| 5 to 17 Years | 0 (0.0%) | 0 (0.0%) |
| 18 to 34 Years | 0 (0.0%) | 0 (0.0%) |
| 35 to 64 Years | 0 (0.0%) | 17 (16.2%) |
| 65 to 74 Years | 33 (30.8%) | 22 (28.2%) |
| 75 Years and over | 0 (0.0%) | 10 (18.2%) |
Disability Class: Vision Difficulty
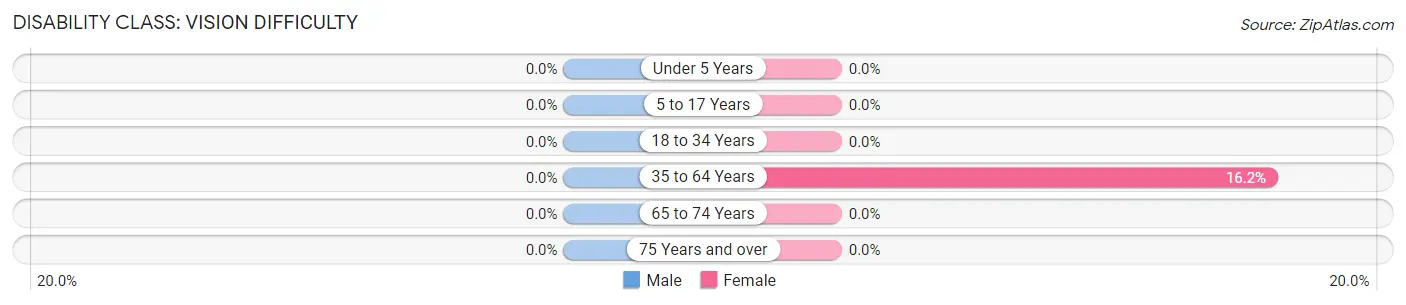
| Age Bracket | Male | Female |
| Under 5 Years | 0 (0.0%) | 0 (0.0%) |
| 5 to 17 Years | 0 (0.0%) | 0 (0.0%) |
| 18 to 34 Years | 0 (0.0%) | 0 (0.0%) |
| 35 to 64 Years | 0 (0.0%) | 17 (16.2%) |
| 65 to 74 Years | 0 (0.0%) | 0 (0.0%) |
| 75 Years and over | 0 (0.0%) | 0 (0.0%) |
Disability Class: Cognitive Difficulty
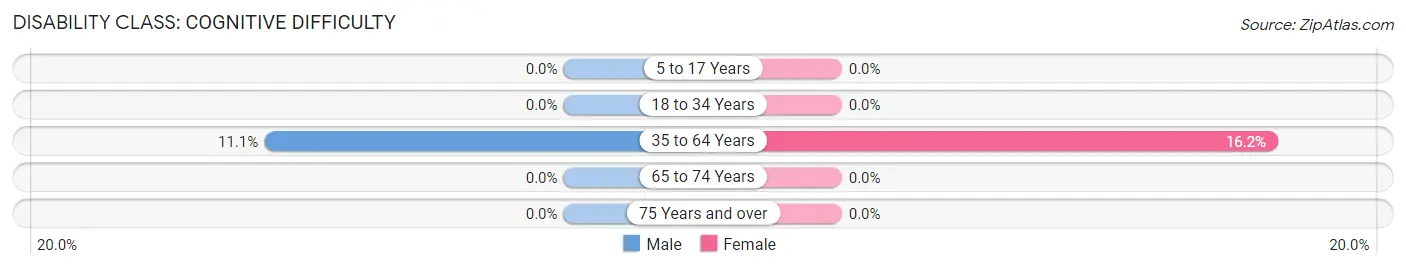
| Age Bracket | Male | Female |
| 5 to 17 Years | 0 (0.0%) | 0 (0.0%) |
| 18 to 34 Years | 0 (0.0%) | 0 (0.0%) |
| 35 to 64 Years | 16 (11.1%) | 17 (16.2%) |
| 65 to 74 Years | 0 (0.0%) | 0 (0.0%) |
| 75 Years and over | 0 (0.0%) | 0 (0.0%) |
Disability Class: Ambulatory Difficulty
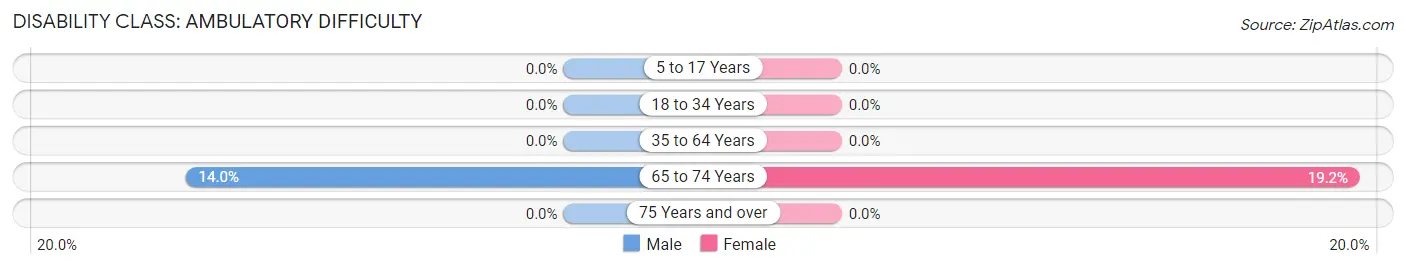
| Age Bracket | Male | Female |
| 5 to 17 Years | 0 (0.0%) | 0 (0.0%) |
| 18 to 34 Years | 0 (0.0%) | 0 (0.0%) |
| 35 to 64 Years | 0 (0.0%) | 0 (0.0%) |
| 65 to 74 Years | 15 (14.0%) | 15 (19.2%) |
| 75 Years and over | 0 (0.0%) | 0 (0.0%) |
Disability Class: Self-Care Difficulty
| Age Bracket | Male | Female |
| 5 to 17 Years | 0 (0.0%) | 0 (0.0%) |
| 18 to 34 Years | 0 (0.0%) | 0 (0.0%) |
| 35 to 64 Years | 0 (0.0%) | 0 (0.0%) |
| 65 to 74 Years | 0 (0.0%) | 0 (0.0%) |
| 75 Years and over | 0 (0.0%) | 0 (0.0%) |
Technology Access in St Meinrad
Computing Device Access in St Meinrad
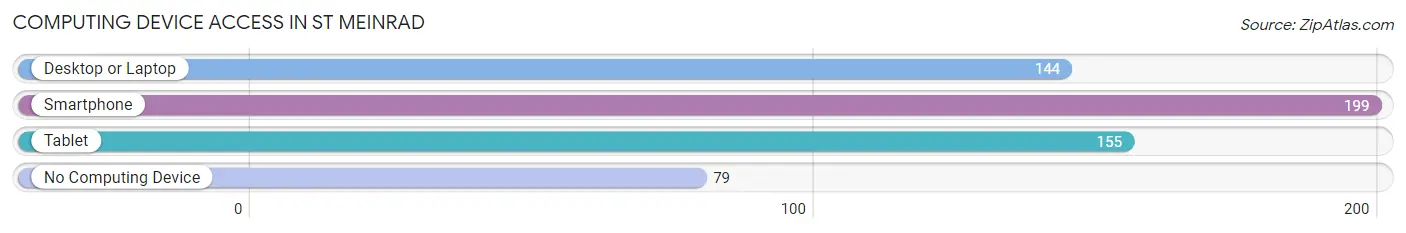
| Device Type | # Households | % Households |
| Desktop or Laptop | 144 | 49.1% |
| Smartphone | 199 | 67.9% |
| Tablet | 155 | 52.9% |
| No Computing Device | 79 | 27.0% |
| Total | 293 | 100.0% |
Internet Access in St Meinrad
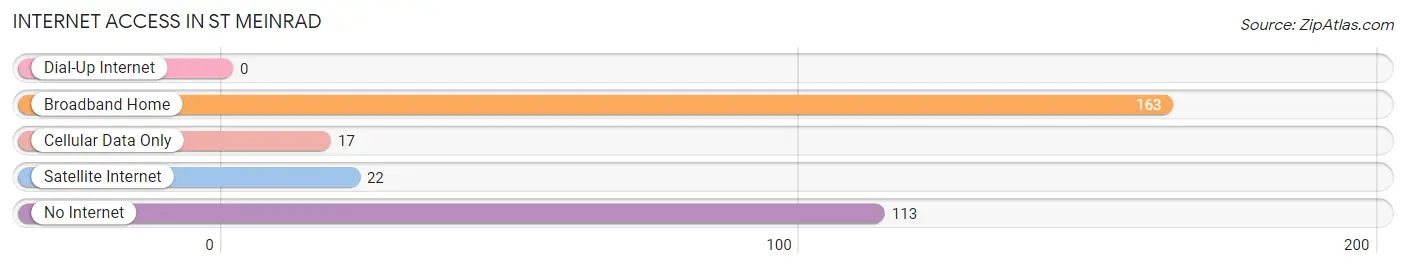
| Internet Type | # Households | % Households |
| Dial-Up Internet | 0 | 0.0% |
| Broadband Home | 163 | 55.6% |
| Cellular Data Only | 17 | 5.8% |
| Satellite Internet | 22 | 7.5% |
| No Internet | 113 | 38.6% |
| Total | 293 | 100.0% |
St Meinrad Summary
St. Meinrad is a small town located in Spencer County, Indiana, United States. It is situated along the Ohio River, approximately 30 miles east of Evansville. The town was founded in 1854 by two Benedictine monks from Einsiedeln Abbey in Switzerland, who established a monastery and school in the area. The population of St. Meinrad was 545 at the 2010 census.
History
St. Meinrad was founded in 1854 by two Benedictine monks from Einsiedeln Abbey in Switzerland. The monks, Father Boniface Wimmer and Father Meinrad Widmer, established a monastery and school in the area. The town was named after St. Meinrad, a hermit who lived in the area in the 9th century.
The monastery and school were initially established to serve the German-speaking immigrants who had settled in the area. The monks taught the immigrants the German language and culture, as well as providing religious instruction. The monastery also served as a center for the Catholic faith in the area.
In 1867, the monks established St. Meinrad Seminary and School of Theology, which is still in operation today. The seminary has educated many priests and religious leaders over the years, and is now a major center for Catholic education in the United States.
Geography
St. Meinrad is located in Spencer County, Indiana, approximately 30 miles east of Evansville. The town is situated along the Ohio River, and is surrounded by rolling hills and farmland. The climate in St. Meinrad is humid continental, with hot summers and cold winters.
Economy
The economy of St. Meinrad is largely based on agriculture and tourism. The town is home to several farms, which produce a variety of crops, including corn, soybeans, and wheat. The town is also home to several wineries, which produce a variety of wines.
Tourism is an important part of the local economy. The town is home to several attractions, including the St. Meinrad Archabbey, which is a popular destination for visitors. The town is also home to several restaurants, shops, and other businesses.
Demographics
As of the 2010 census, the population of St. Meinrad was 545. The racial makeup of the town was 97.3% White, 0.2% African American, 0.2% Native American, 0.4% Asian, 0.2% from other races, and 1.7% from two or more races. Hispanic or Latino of any race were 0.7% of the population.
The median income for a household in St. Meinrad was $41,250, and the median income for a family was $50,000. The per capita income for the town was $20,945. About 8.3% of families and 10.2% of the population were below the poverty line, including 11.3% of those under age 18 and 8.3% of those age 65 or over.
Common Questions
What is Per Capita Income in St Meinrad?
Per Capita income in St Meinrad is $28,194.
What is the Median Family Income in St Meinrad?
Median Family Income in St Meinrad is $64,470.
What is the Median Household income in St Meinrad?
Median Household Income in St Meinrad is $62,614.
What is Income or Wage Gap in St Meinrad?
Income or Wage Gap in St Meinrad is 27.1%.
Women in St Meinrad earn 72.9 cents for every dollar earned by a man.
What is Inequality or Gini Index in St Meinrad?
Inequality or Gini Index in St Meinrad is 0.31.
What is the Total Population of St Meinrad?
Total Population of St Meinrad is 786.
What is the Total Male Population of St Meinrad?
Total Male Population of St Meinrad is 427.
What is the Total Female Population of St Meinrad?
Total Female Population of St Meinrad is 359.
What is the Ratio of Males per 100 Females in St Meinrad?
There are 118.94 Males per 100 Females in St Meinrad.
What is the Ratio of Females per 100 Males in St Meinrad?
There are 84.07 Females per 100 Males in St Meinrad.
What is the Median Population Age in St Meinrad?
Median Population Age in St Meinrad is 53.5 Years.
What is the Average Family Size in St Meinrad
Average Family Size in St Meinrad is 2.6 People.
What is the Average Household Size in St Meinrad
Average Household Size in St Meinrad is 2.4 People.
How Large is the Labor Force in St Meinrad?
There are 354 People in the Labor Forcein in St Meinrad.
What is the Percentage of People in the Labor Force in St Meinrad?
51.5% of People are in the Labor Force in St Meinrad.
What is the Unemployment Rate in St Meinrad?
Unemployment Rate in St Meinrad is 15.0%.