Koontz Lake, IN Map & Demographics
Koontz Lake Map
Koontz Lake Overview
$40,285
PER CAPITA INCOME
$90,085
AVG FAMILY INCOME
$68,875
AVG HOUSEHOLD INCOME
44.2%
WAGE / INCOME GAP [ % ]
55.8¢/ $1
WAGE / INCOME GAP [ $ ]
0.42
INEQUALITY / GINI INDEX
1,364
TOTAL POPULATION
713
MALE POPULATION
651
FEMALE POPULATION
109.52
MALES / 100 FEMALES
91.30
FEMALES / 100 MALES
54.4
MEDIAN AGE
2.7
AVG FAMILY SIZE
1.9
AVG HOUSEHOLD SIZE
591
LABOR FORCE [ PEOPLE ]
52.1%
PERCENT IN LABOR FORCE
8.1%
UNEMPLOYMENT RATE
Income in Koontz Lake
Income Overview in Koontz Lake
Per Capita Income in Koontz Lake is $40,285, while median incomes of families and households are $90,085 and $68,875 respectively.
| Characteristic | Number | Measure |
| Per Capita Income | 1,364 | $40,285 |
| Median Family Income | 390 | $90,085 |
| Mean Family Income | 390 | $89,913 |
| Median Household Income | 705 | $68,875 |
| Mean Household Income | 705 | $81,846 |
| Income Deficit | 390 | $0 |
| Wage / Income Gap (%) | 1,364 | 44.17% |
| Wage / Income Gap ($) | 1,364 | 55.83¢ per $1 |
| Gini / Inequality Index | 1,364 | 0.42 |
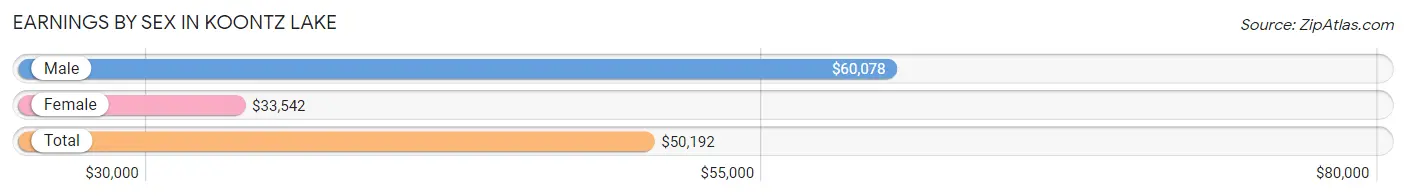
Earnings by Sex in Koontz Lake
Average Earnings in Koontz Lake are $50,192, $60,078 for men and $33,542 for women, a difference of 44.2%.
| Sex | Number | Average Earnings |
| Male | 351 (60.5%) | $60,078 |
| Female | 229 (39.5%) | $33,542 |
| Total | 580 (100.0%) | $50,192 |
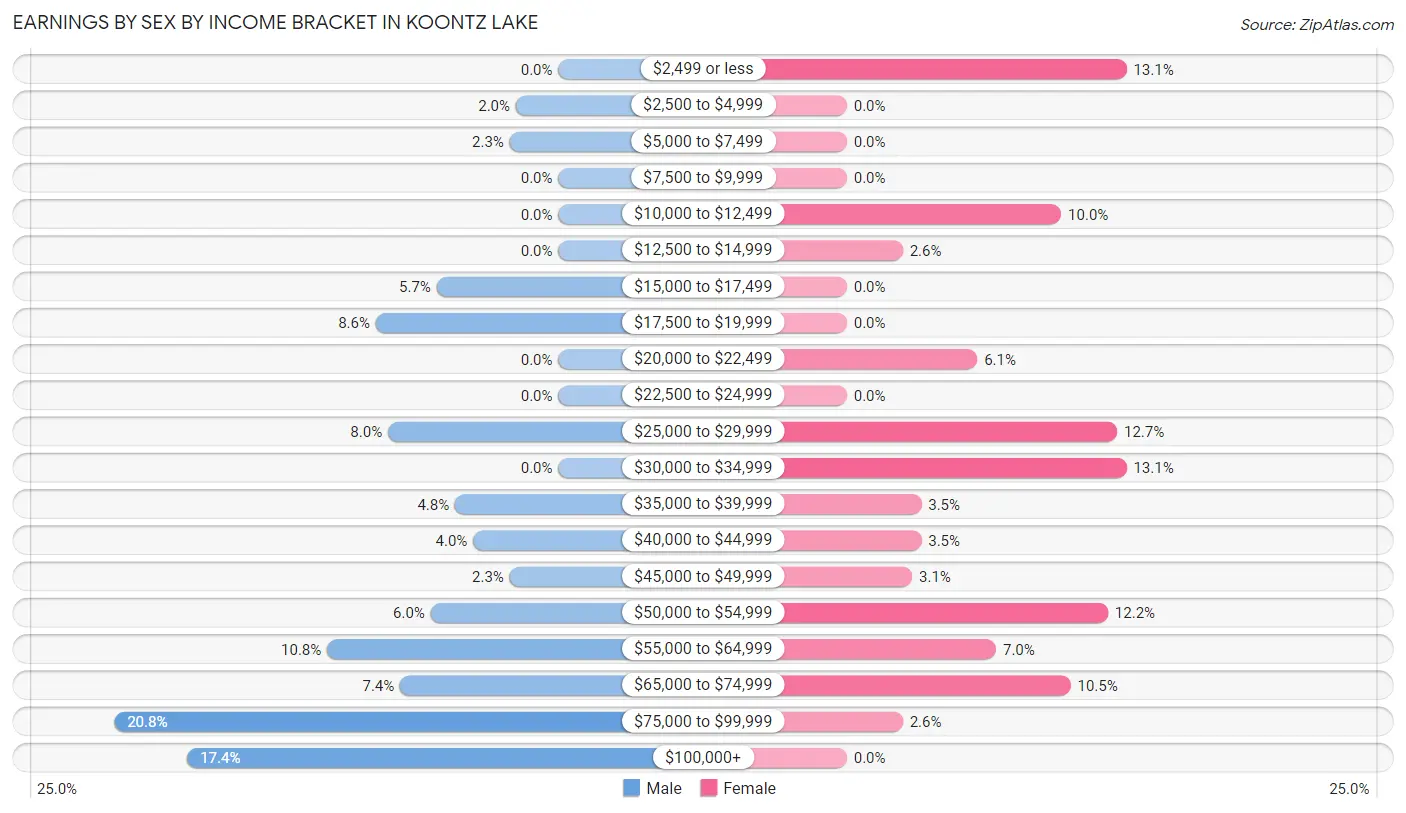
Earnings by Sex by Income Bracket in Koontz Lake
The most common earnings brackets in Koontz Lake are $75,000 to $99,999 for men (73 | 20.8%) and $2,499 or less for women (30 | 13.1%).
| Income | Male | Female |
| $2,499 or less | 0 (0.0%) | 30 (13.1%) |
| $2,500 to $4,999 | 7 (2.0%) | 0 (0.0%) |
| $5,000 to $7,499 | 8 (2.3%) | 0 (0.0%) |
| $7,500 to $9,999 | 0 (0.0%) | 0 (0.0%) |
| $10,000 to $12,499 | 0 (0.0%) | 23 (10.0%) |
| $12,500 to $14,999 | 0 (0.0%) | 6 (2.6%) |
| $15,000 to $17,499 | 20 (5.7%) | 0 (0.0%) |
| $17,500 to $19,999 | 30 (8.6%) | 0 (0.0%) |
| $20,000 to $22,499 | 0 (0.0%) | 14 (6.1%) |
| $22,500 to $24,999 | 0 (0.0%) | 0 (0.0%) |
| $25,000 to $29,999 | 28 (8.0%) | 29 (12.7%) |
| $30,000 to $34,999 | 0 (0.0%) | 30 (13.1%) |
| $35,000 to $39,999 | 17 (4.8%) | 8 (3.5%) |
| $40,000 to $44,999 | 14 (4.0%) | 8 (3.5%) |
| $45,000 to $49,999 | 8 (2.3%) | 7 (3.1%) |
| $50,000 to $54,999 | 21 (6.0%) | 28 (12.2%) |
| $55,000 to $64,999 | 38 (10.8%) | 16 (7.0%) |
| $65,000 to $74,999 | 26 (7.4%) | 24 (10.5%) |
| $75,000 to $99,999 | 73 (20.8%) | 6 (2.6%) |
| $100,000+ | 61 (17.4%) | 0 (0.0%) |
| Total | 351 (100.0%) | 229 (100.0%) |
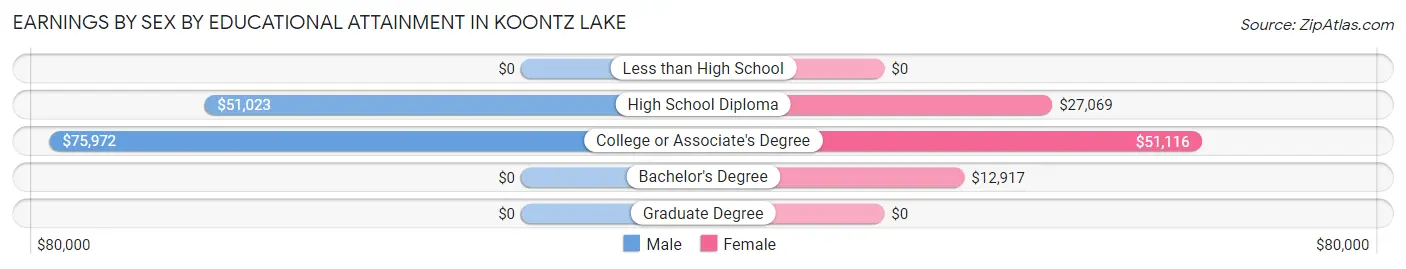
Earnings by Sex by Educational Attainment in Koontz Lake
Average earnings in Koontz Lake are $59,250 for men and $35,313 for women, a difference of 40.4%. Men with an educational attainment of college or associate's degree enjoy the highest average annual earnings of $75,972, while those with high school diploma education earn the least with $51,023. Women with an educational attainment of college or associate's degree earn the most with the average annual earnings of $51,116, while those with bachelor's degree education have the smallest earnings of $12,917.
| Educational Attainment | Male Income | Female Income |
| Less than High School | - | - |
| High School Diploma | $51,023 | $27,069 |
| College or Associate's Degree | $75,972 | $51,116 |
| Bachelor's Degree | - | - |
| Graduate Degree | - | - |
| Total | $59,250 | $35,313 |
Family Income in Koontz Lake
Family Income Brackets in Koontz Lake
According to the Koontz Lake family income data, there are 174 families falling into the $75,000 to $99,999 income range, which is the most common income bracket and makes up 44.6% of all families.
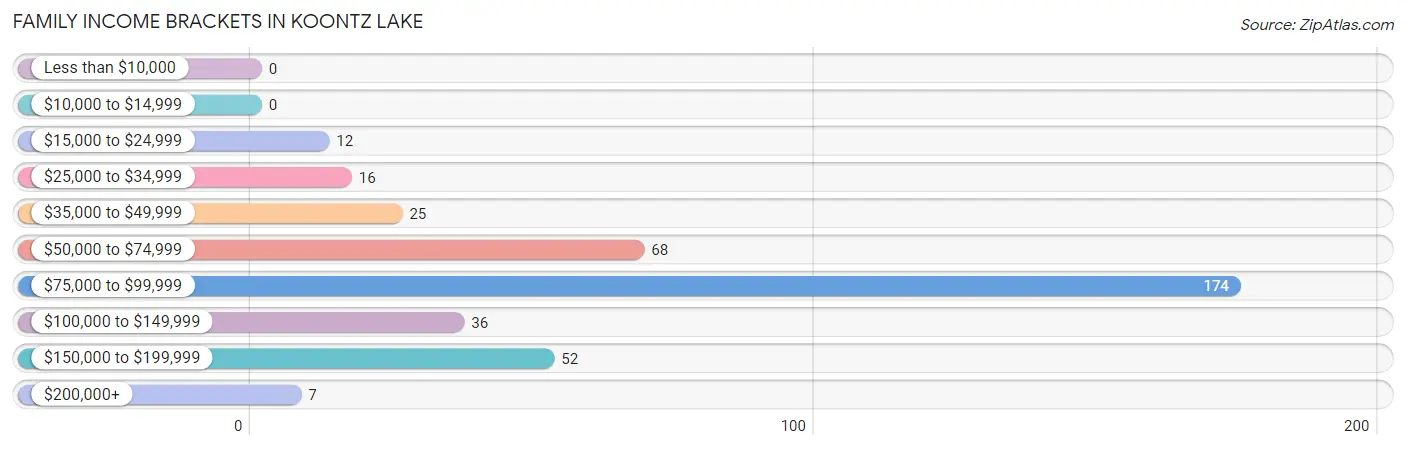
| Income Bracket | # Families | % Families |
| Less than $10,000 | 0 | 0.0% |
| $10,000 to $14,999 | 0 | 0.0% |
| $15,000 to $24,999 | 12 | 3.1% |
| $25,000 to $34,999 | 16 | 4.1% |
| $35,000 to $49,999 | 25 | 6.4% |
| $50,000 to $74,999 | 68 | 17.4% |
| $75,000 to $99,999 | 174 | 44.6% |
| $100,000 to $149,999 | 36 | 9.2% |
| $150,000 to $199,999 | 52 | 13.3% |
| $200,000+ | 7 | 1.8% |
Family Income by Famaliy Size in Koontz Lake
4-person families (80 | 20.5%) account for the highest median family income in Koontz Lake with $92,667 per family, while 2-person families (212 | 54.4%) have the highest median income of $45,256 per family member.
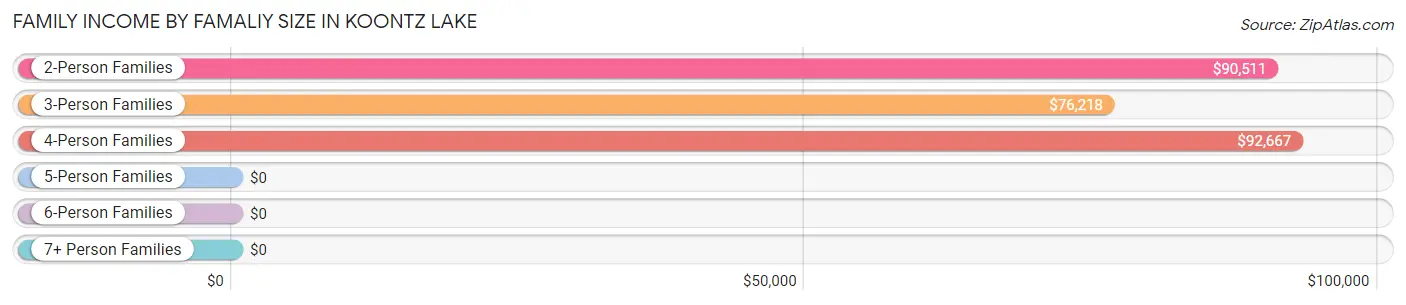
| Income Bracket | # Families | Median Income |
| 2-Person Families | 212 (54.4%) | $90,511 |
| 3-Person Families | 62 (15.9%) | $76,218 |
| 4-Person Families | 80 (20.5%) | $92,667 |
| 5-Person Families | 36 (9.2%) | $0 |
| 6-Person Families | 0 (0.0%) | $0 |
| 7+ Person Families | 0 (0.0%) | $0 |
| Total | 390 (100.0%) | $90,085 |
Family Income by Number of Earners in Koontz Lake
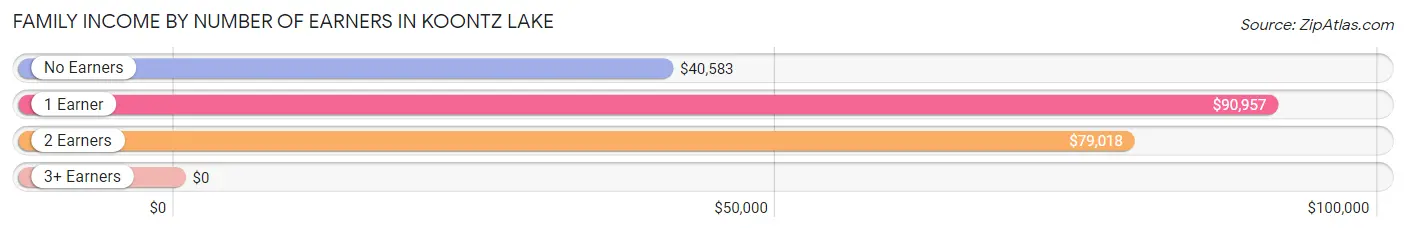
| Number of Earners | # Families | Median Income |
| No Earners | 63 (16.2%) | $40,583 |
| 1 Earner | 172 (44.1%) | $90,957 |
| 2 Earners | 131 (33.6%) | $79,018 |
| 3+ Earners | 24 (6.1%) | $0 |
| Total | 390 (100.0%) | $90,085 |
Household Income in Koontz Lake
Household Income Brackets in Koontz Lake
With 219 households falling in the category, the $75,000 to $99,999 income range is the most frequent in Koontz Lake, accounting for 31.1% of all households. In contrast, only 14 households (2.0%) fall into the $10,000 to $14,999 income bracket, making it the least populous group.
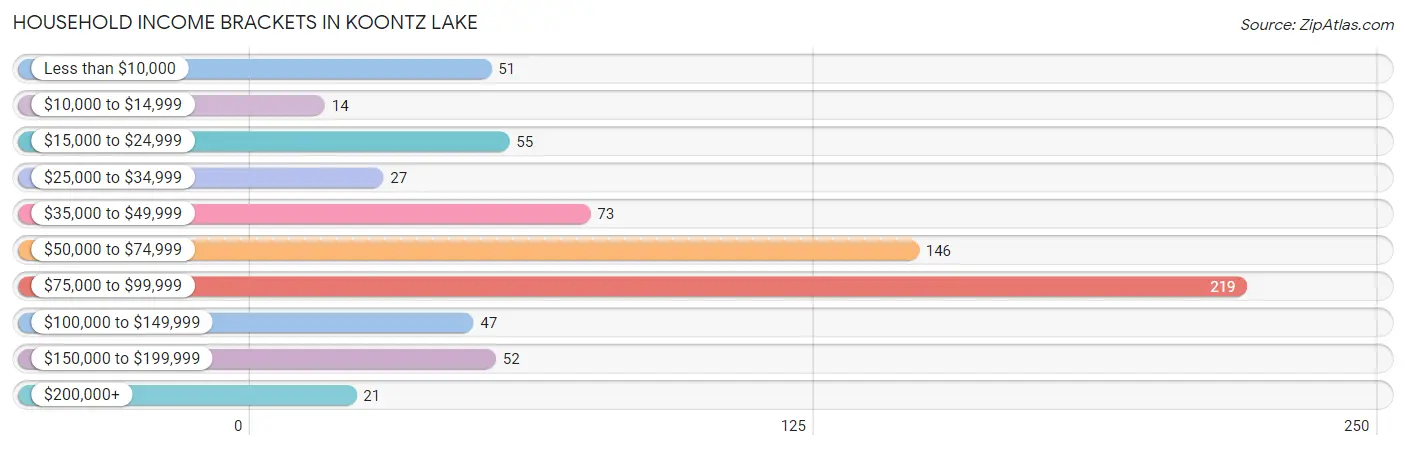
| Income Bracket | # Households | % Households |
| Less than $10,000 | 51 | 7.2% |
| $10,000 to $14,999 | 14 | 2.0% |
| $15,000 to $24,999 | 55 | 7.8% |
| $25,000 to $34,999 | 27 | 3.8% |
| $35,000 to $49,999 | 73 | 10.4% |
| $50,000 to $74,999 | 146 | 20.7% |
| $75,000 to $99,999 | 219 | 31.1% |
| $100,000 to $149,999 | 47 | 6.7% |
| $150,000 to $199,999 | 52 | 7.4% |
| $200,000+ | 21 | 3.0% |
Household Income by Householder Age in Koontz Lake
The median household income in Koontz Lake is $68,875, with the highest median household income of $90,270 found in the 45 to 64 years age bracket for the primary householder. A total of 295 households (41.8%) fall into this category.
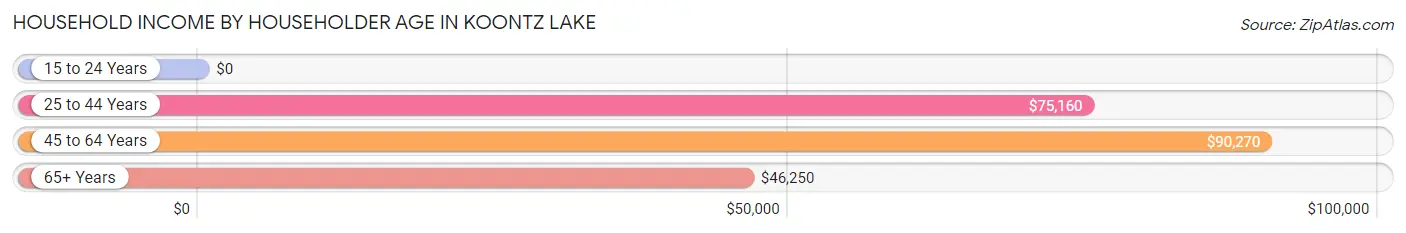
| Income Bracket | # Households | Median Income |
| 15 to 24 Years | 0 (0.0%) | $0 |
| 25 to 44 Years | 131 (18.6%) | $75,160 |
| 45 to 64 Years | 295 (41.8%) | $90,270 |
| 65+ Years | 279 (39.6%) | $46,250 |
| Total | 705 (100.0%) | $68,875 |
Poverty in Koontz Lake
Income Below Poverty by Sex and Age in Koontz Lake
With 5.3% poverty level for males and 10.7% for females among the residents of Koontz Lake, 45 to 54 year old males and 65 to 74 year old females are the most vulnerable to poverty, with 18 males (19.2%) and 14 females (34.2%) in their respective age groups living below the poverty level.
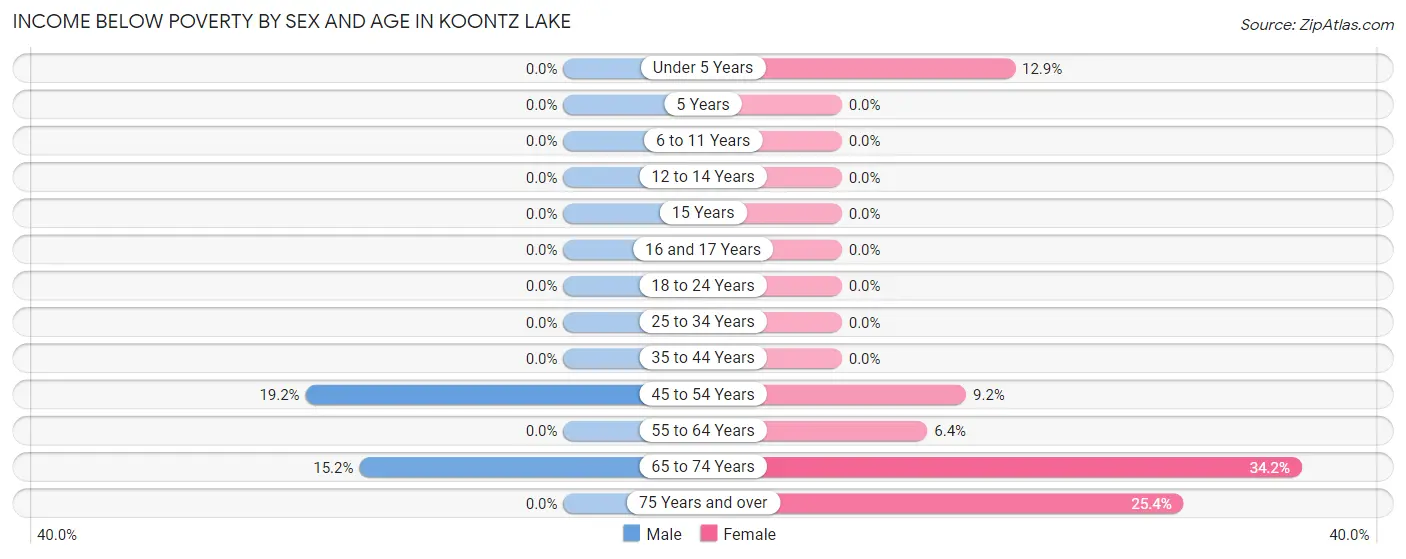
| Age Bracket | Male | Female |
| Under 5 Years | 0 (0.0%) | 9 (12.9%) |
| 5 Years | 0 (0.0%) | 0 (0.0%) |
| 6 to 11 Years | 0 (0.0%) | 0 (0.0%) |
| 12 to 14 Years | 0 (0.0%) | 0 (0.0%) |
| 15 Years | 0 (0.0%) | 0 (0.0%) |
| 16 and 17 Years | 0 (0.0%) | 0 (0.0%) |
| 18 to 24 Years | 0 (0.0%) | 0 (0.0%) |
| 25 to 34 Years | 0 (0.0%) | 0 (0.0%) |
| 35 to 44 Years | 0 (0.0%) | 0 (0.0%) |
| 45 to 54 Years | 18 (19.2%) | 6 (9.2%) |
| 55 to 64 Years | 0 (0.0%) | 8 (6.4%) |
| 65 to 74 Years | 20 (15.1%) | 14 (34.2%) |
| 75 Years and over | 0 (0.0%) | 33 (25.4%) |
| Total | 38 (5.3%) | 70 (10.7%) |
Income Above Poverty by Sex and Age in Koontz Lake
According to the poverty statistics in Koontz Lake, males aged under 5 years and females aged 5 years are the age groups that are most secure financially, with 100.0% of males and 100.0% of females in these age groups living above the poverty line.
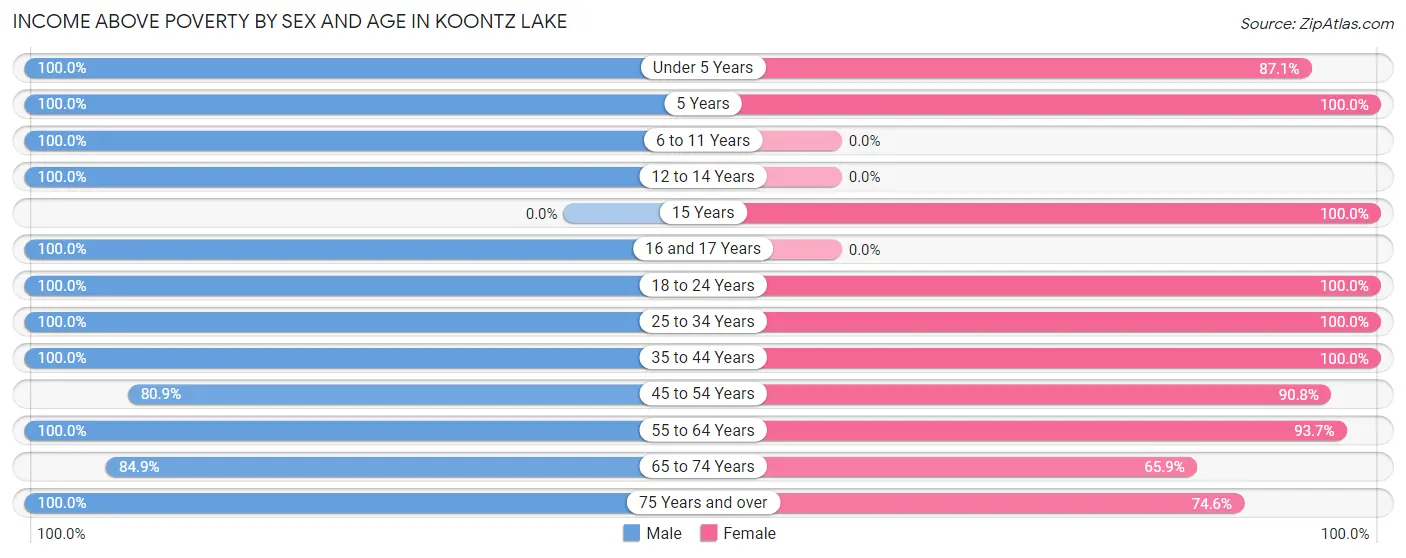
| Age Bracket | Male | Female |
| Under 5 Years | 36 (100.0%) | 61 (87.1%) |
| 5 Years | 28 (100.0%) | 47 (100.0%) |
| 6 to 11 Years | 18 (100.0%) | 0 (0.0%) |
| 12 to 14 Years | 10 (100.0%) | 0 (0.0%) |
| 15 Years | 0 (0.0%) | 20 (100.0%) |
| 16 and 17 Years | 15 (100.0%) | 0 (0.0%) |
| 18 to 24 Years | 28 (100.0%) | 54 (100.0%) |
| 25 to 34 Years | 68 (100.0%) | 44 (100.0%) |
| 35 to 44 Years | 42 (100.0%) | 54 (100.0%) |
| 45 to 54 Years | 76 (80.8%) | 59 (90.8%) |
| 55 to 64 Years | 173 (100.0%) | 118 (93.6%) |
| 65 to 74 Years | 112 (84.9%) | 27 (65.8%) |
| 75 Years and over | 69 (100.0%) | 97 (74.6%) |
| Total | 675 (94.7%) | 581 (89.2%) |
Income Below Poverty Among Married-Couple Families in Koontz Lake
The poverty statistics for married-couple families in Koontz Lake show that 3.1% or 12 of the total 390 families live below the poverty line. Families with 1 or 2 children have the highest poverty rate of 10.2%, comprising of 12 families. On the other hand, families with no children have the lowest poverty rate of 0.0%, which includes 0 families.
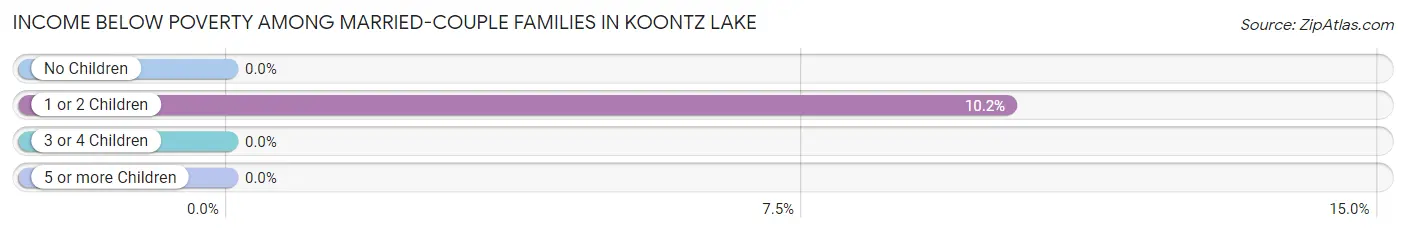
| Children | Above Poverty | Below Poverty |
| No Children | 236 (100.0%) | 0 (0.0%) |
| 1 or 2 Children | 106 (89.8%) | 12 (10.2%) |
| 3 or 4 Children | 36 (100.0%) | 0 (0.0%) |
| 5 or more Children | 0 (0.0%) | 0 (0.0%) |
| Total | 378 (96.9%) | 12 (3.1%) |
Income Below Poverty Among Single-Parent Households in Koontz Lake
| Children | Single Father | Single Mother |
| No Children | 0 (0.0%) | 0 (0.0%) |
| 1 or 2 Children | 0 (0.0%) | 0 (0.0%) |
| 3 or 4 Children | 0 (0.0%) | 0 (0.0%) |
| 5 or more Children | 0 (0.0%) | 0 (0.0%) |
| Total | 0 (0.0%) | 0 (0.0%) |
Income Below Poverty Among Married-Couple vs Single-Parent Households in Koontz Lake
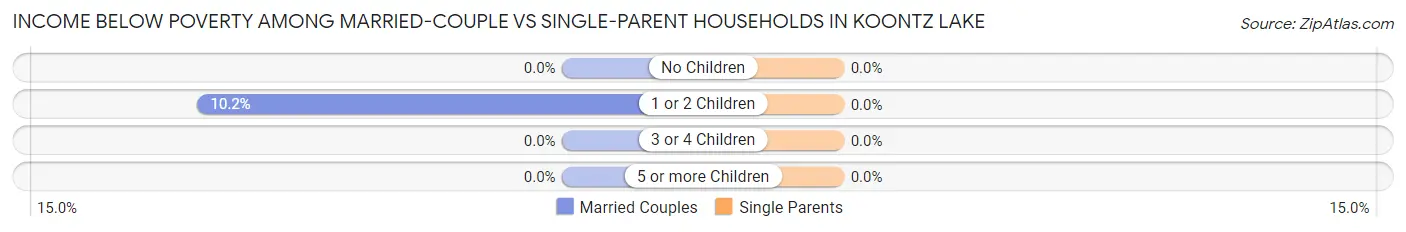
| Children | Married-Couple Families | Single-Parent Households |
| No Children | 0 (0.0%) | 0 (0.0%) |
| 1 or 2 Children | 12 (10.2%) | 0 (0.0%) |
| 3 or 4 Children | 0 (0.0%) | 0 (0.0%) |
| 5 or more Children | 0 (0.0%) | 0 (0.0%) |
| Total | 12 (3.1%) | 0 (0.0%) |
Race in Koontz Lake
The most populous races in Koontz Lake are White / Caucasian (1,364 | 100.0%), and Hispanic or Latino (18 | 1.3%).
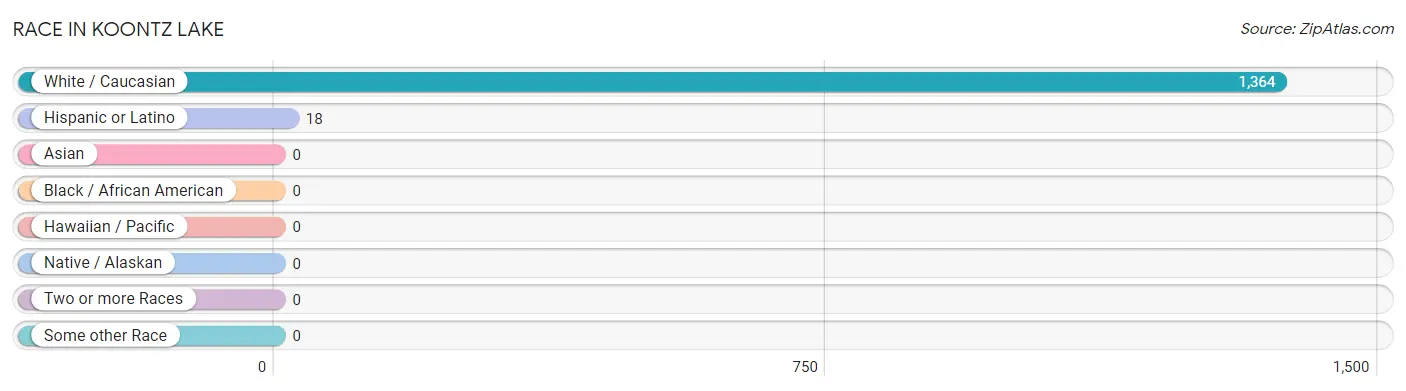
| Race | # Population | % Population |
| Asian | 0 | 0.0% |
| Black / African American | 0 | 0.0% |
| Hawaiian / Pacific | 0 | 0.0% |
| Hispanic or Latino | 18 | 1.3% |
| Native / Alaskan | 0 | 0.0% |
| White / Caucasian | 1,364 | 100.0% |
| Two or more Races | 0 | 0.0% |
| Some other Race | 0 | 0.0% |
| Total | 1,364 | 100.0% |
Ancestry in Koontz Lake
The most populous ancestries reported in Koontz Lake are German (180 | 13.2%), Polish (163 | 11.9%), English (151 | 11.1%), Irish (112 | 8.2%), and American (64 | 4.7%), together accounting for 49.1% of all Koontz Lake residents.
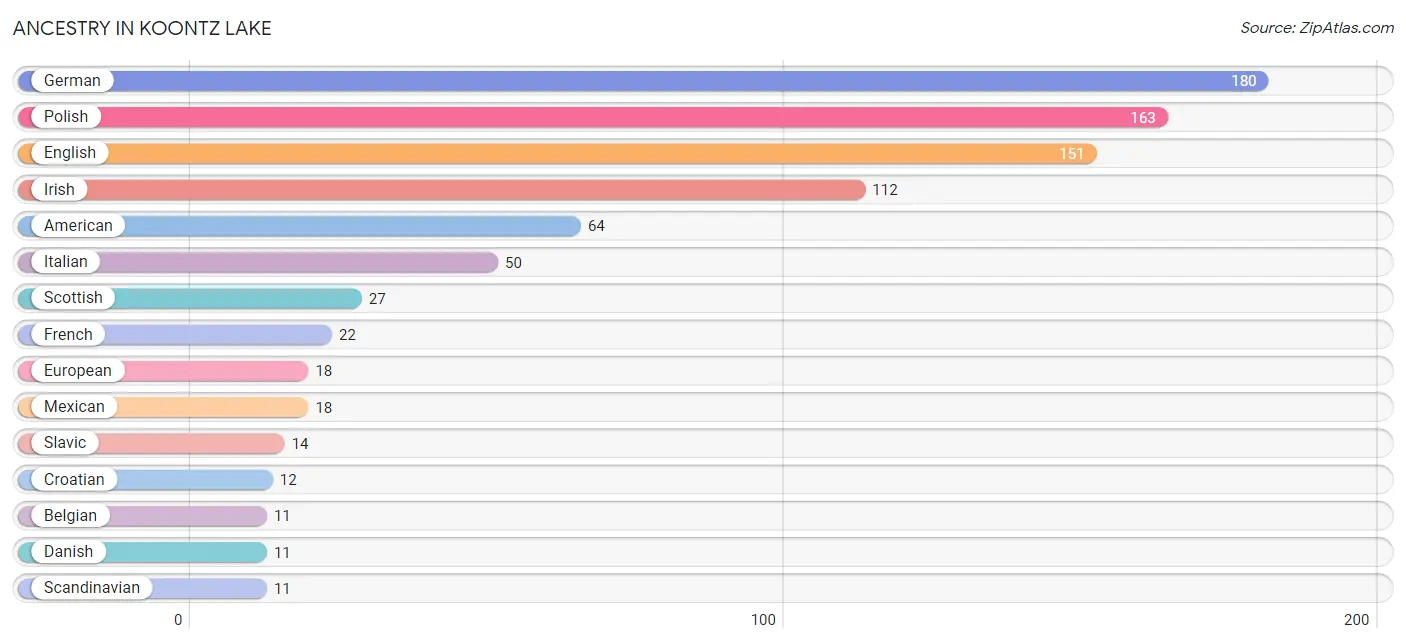
| Ancestry | # Population | % Population |
| American | 64 | 4.7% |
| Belgian | 11 | 0.8% |
| Croatian | 12 | 0.9% |
| Czech | 7 | 0.5% |
| Danish | 11 | 0.8% |
| English | 151 | 11.1% |
| European | 18 | 1.3% |
| French | 22 | 1.6% |
| French Canadian | 6 | 0.4% |
| German | 180 | 13.2% |
| Irish | 112 | 8.2% |
| Italian | 50 | 3.7% |
| Lithuanian | 7 | 0.5% |
| Mexican | 18 | 1.3% |
| Norwegian | 4 | 0.3% |
| Polish | 163 | 11.9% |
| Scandinavian | 11 | 0.8% |
| Scottish | 27 | 2.0% |
| Slavic | 14 | 1.0% |
| Slovak | 6 | 0.4% | View All 20 Rows |
Immigrants in Koontz Lake

| Immigration Origin | # Population | % Population | View All 0 Rows |
Sex and Age in Koontz Lake
Sex and Age in Koontz Lake
The most populous age groups in Koontz Lake are 65 to 69 Years (103 | 14.4%) for men and 60 to 64 Years (79 | 12.1%) for women.
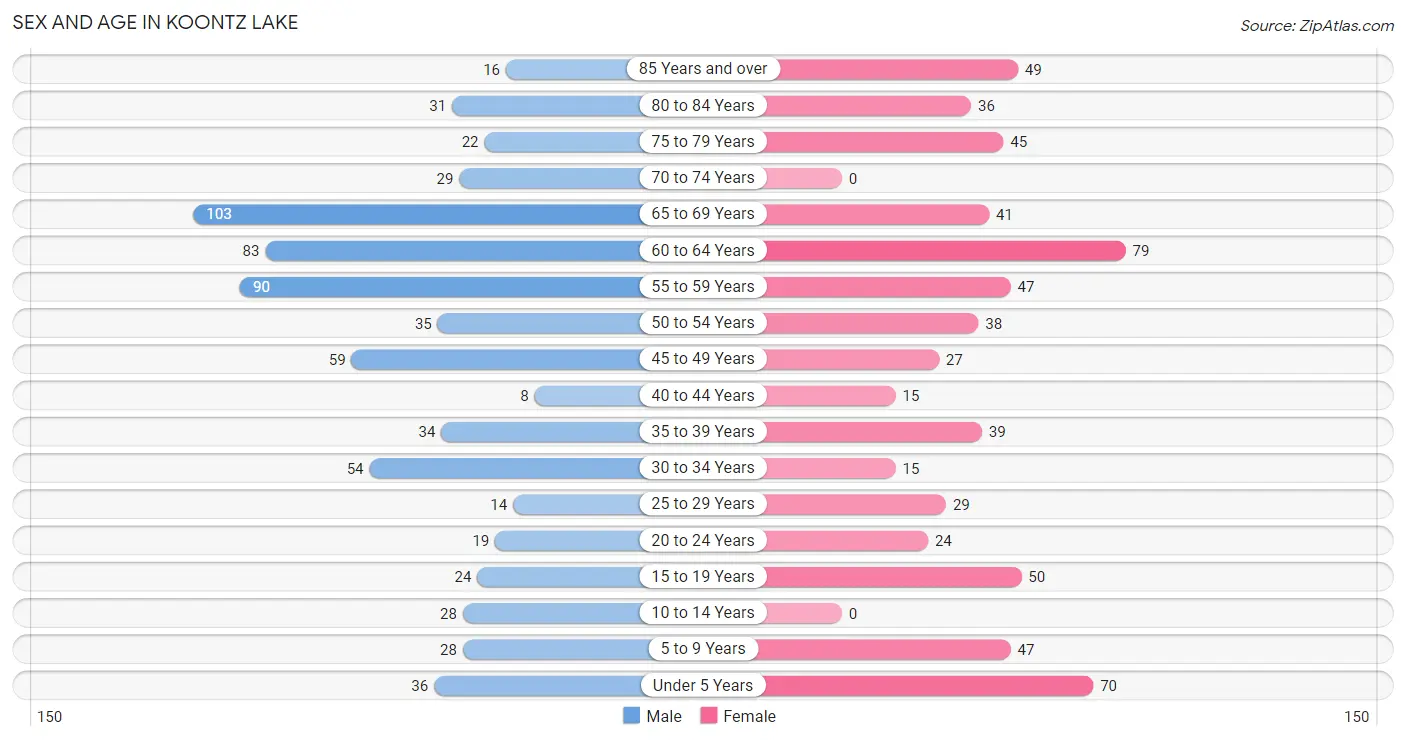
| Age Bracket | Male | Female |
| Under 5 Years | 36 (5.1%) | 70 (10.7%) |
| 5 to 9 Years | 28 (3.9%) | 47 (7.2%) |
| 10 to 14 Years | 28 (3.9%) | 0 (0.0%) |
| 15 to 19 Years | 24 (3.4%) | 50 (7.7%) |
| 20 to 24 Years | 19 (2.7%) | 24 (3.7%) |
| 25 to 29 Years | 14 (2.0%) | 29 (4.4%) |
| 30 to 34 Years | 54 (7.6%) | 15 (2.3%) |
| 35 to 39 Years | 34 (4.8%) | 39 (6.0%) |
| 40 to 44 Years | 8 (1.1%) | 15 (2.3%) |
| 45 to 49 Years | 59 (8.3%) | 27 (4.2%) |
| 50 to 54 Years | 35 (4.9%) | 38 (5.8%) |
| 55 to 59 Years | 90 (12.6%) | 47 (7.2%) |
| 60 to 64 Years | 83 (11.6%) | 79 (12.1%) |
| 65 to 69 Years | 103 (14.4%) | 41 (6.3%) |
| 70 to 74 Years | 29 (4.1%) | 0 (0.0%) |
| 75 to 79 Years | 22 (3.1%) | 45 (6.9%) |
| 80 to 84 Years | 31 (4.3%) | 36 (5.5%) |
| 85 Years and over | 16 (2.2%) | 49 (7.5%) |
| Total | 713 (100.0%) | 651 (100.0%) |
Families and Households in Koontz Lake
Median Family Size in Koontz Lake
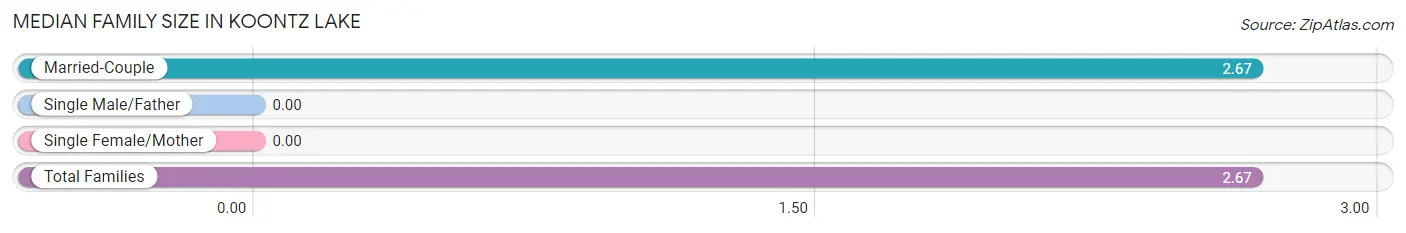
| Family Type | # Families | Family Size |
| Married-Couple | 390 (100.0%) | 2.67 |
| Single Male/Father | 0 (0.0%) | - |
| Single Female/Mother | 0 (0.0%) | - |
| Total Families | 390 (100.0%) | 2.67 |
Median Household Size in Koontz Lake
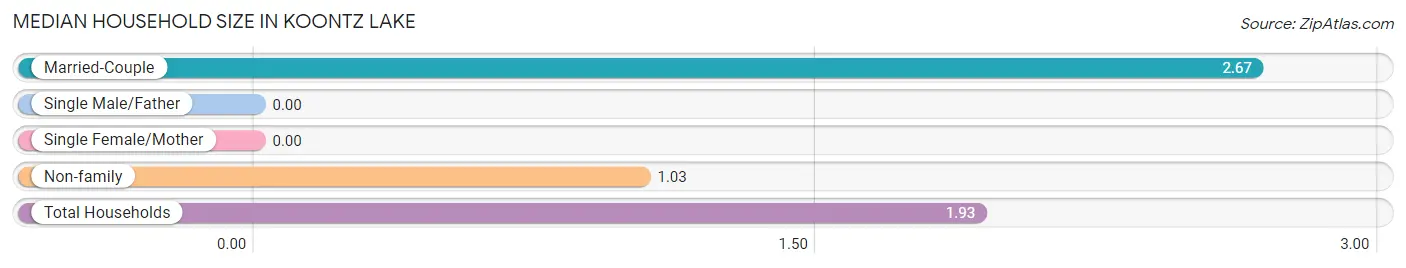
| Household Type | # Households | Household Size |
| Married-Couple | 390 (55.3%) | 2.67 |
| Single Male/Father | 0 (0.0%) | - |
| Single Female/Mother | 0 (0.0%) | - |
| Non-family | 315 (44.7%) | 1.03 |
| Total Households | 705 (100.0%) | 1.93 |
Household Size by Marriage Status in Koontz Lake
Out of a total of 705 households in Koontz Lake, 390 (55.3%) are family households, while 315 (44.7%) are nonfamily households. The most numerous type of family households are 2-person households, comprising 212, and the most common type of nonfamily households are 1-person households, comprising 307.
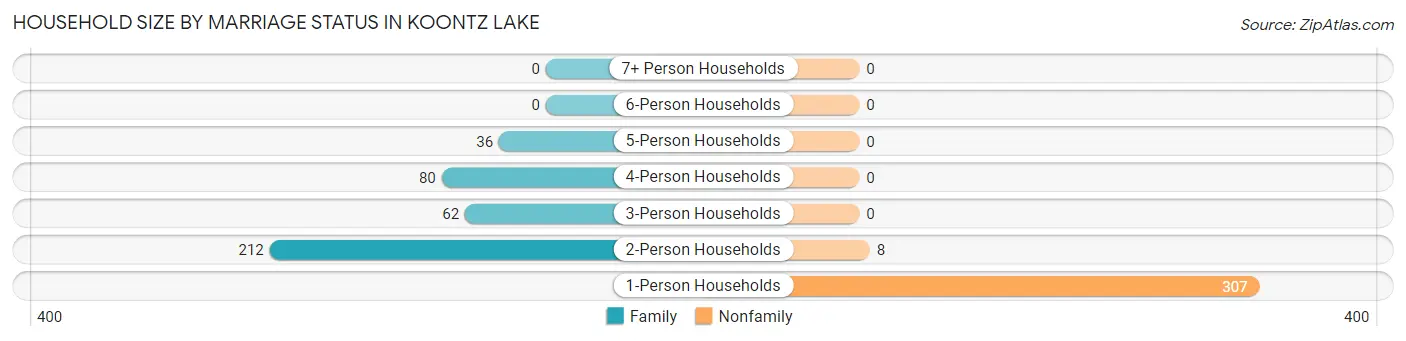
| Household Size | Family Households | Nonfamily Households |
| 1-Person Households | - | 307 (43.5%) |
| 2-Person Households | 212 (30.1%) | 8 (1.1%) |
| 3-Person Households | 62 (8.8%) | 0 (0.0%) |
| 4-Person Households | 80 (11.4%) | 0 (0.0%) |
| 5-Person Households | 36 (5.1%) | 0 (0.0%) |
| 6-Person Households | 0 (0.0%) | 0 (0.0%) |
| 7+ Person Households | 0 (0.0%) | 0 (0.0%) |
| Total | 390 (55.3%) | 315 (44.7%) |
Female Fertility in Koontz Lake
Fertility by Age in Koontz Lake
| Age Bracket | Women with Births | Births / 1,000 Women |
| 15 to 19 years | 0 (0.0%) | 0.0 |
| 20 to 34 years | 0 (0.0%) | 0.0 |
| 35 to 50 years | 0 (0.0%) | 0.0 |
| Total | 0 (0.0%) | 0.0 |
Fertility by Age by Marriage Status in Koontz Lake
| Age Bracket | Married | Unmarried |
| 15 to 19 years | 0 (0.0%) | 0 (0.0%) |
| 20 to 34 years | 0 (0.0%) | 0 (0.0%) |
| 35 to 50 years | 0 (0.0%) | 0 (0.0%) |
| Total | 0 (0.0%) | 0 (0.0%) |
Fertility by Education in Koontz Lake
| Educational Attainment | Women with Births | Births / 1,000 Women |
| Less than High School | 0 (0.0%) | 0.0 |
| High School Diploma | 0 (0.0%) | 0.0 |
| College or Associate's Degree | 0 (0.0%) | 0.0 |
| Bachelor's Degree | 0 (0.0%) | 0.0 |
| Graduate Degree | 0 (0.0%) | 0.0 |
| Total | 0 (0.0%) | 0.0 |
Fertility by Education by Marriage Status in Koontz Lake
| Educational Attainment | Married | Unmarried |
| Less than High School | 0 (0.0%) | 0 (0.0%) |
| High School Diploma | 0 (0.0%) | 0 (0.0%) |
| College or Associate's Degree | 0 (0.0%) | 0 (0.0%) |
| Bachelor's Degree | 0 (0.0%) | 0 (0.0%) |
| Graduate Degree | 0 (0.0%) | 0 (0.0%) |
| Total | 0 (0.0%) | 0 (0.0%) |
Employment Characteristics in Koontz Lake
Employment by Class of Employer in Koontz Lake
Among the 543 employed individuals in Koontz Lake, private company employees (418 | 77.0%), local government employees (63 | 11.6%), and not-for-profit organizations (25 | 4.6%) make up the most common classes of employment.
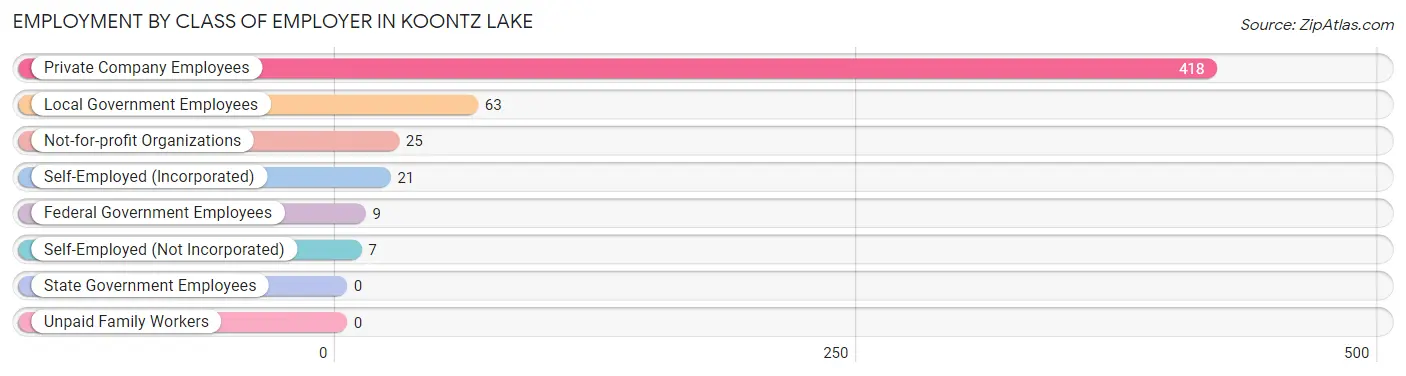
| Employer Class | # Employees | % Employees |
| Private Company Employees | 418 | 77.0% |
| Self-Employed (Incorporated) | 21 | 3.9% |
| Self-Employed (Not Incorporated) | 7 | 1.3% |
| Not-for-profit Organizations | 25 | 4.6% |
| Local Government Employees | 63 | 11.6% |
| State Government Employees | 0 | 0.0% |
| Federal Government Employees | 9 | 1.7% |
| Unpaid Family Workers | 0 | 0.0% |
| Total | 543 | 100.0% |
Employment Status by Age in Koontz Lake
According to the labor force statistics for Koontz Lake, out of the total population over 16 years of age (1,135), 52.1% or 591 individuals are in the labor force, with 8.1% or 48 of them unemployed. The age group with the highest labor force participation rate is 25 to 29 years, with 100.0% or 43 individuals in the labor force. Within the labor force, the 60 to 64 years age range has the highest percentage of unemployed individuals, with 25.9% or 30 of them being unemployed.
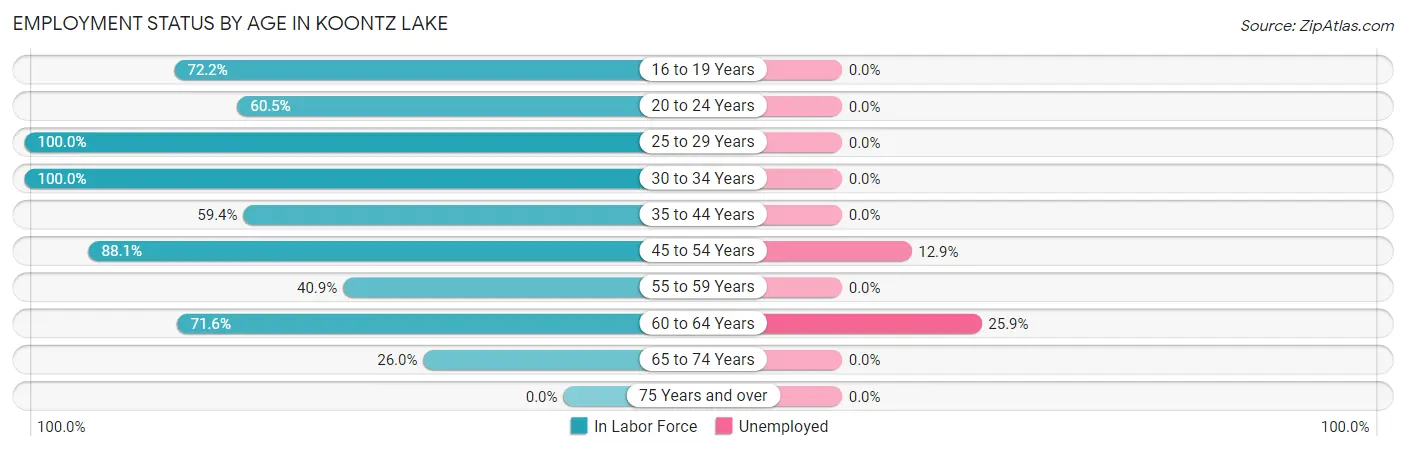
| Age Bracket | In Labor Force | Unemployed |
| 16 to 19 Years | 39 (72.2%) | 0 (0.0%) |
| 20 to 24 Years | 26 (60.5%) | 0 (0.0%) |
| 25 to 29 Years | 43 (100.0%) | 0 (0.0%) |
| 30 to 34 Years | 69 (100.0%) | 0 (0.0%) |
| 35 to 44 Years | 57 (59.4%) | 0 (0.0%) |
| 45 to 54 Years | 140 (88.1%) | 18 (12.9%) |
| 55 to 59 Years | 56 (40.9%) | 0 (0.0%) |
| 60 to 64 Years | 116 (71.6%) | 30 (25.9%) |
| 65 to 74 Years | 45 (26.0%) | 0 (0.0%) |
| 75 Years and over | 0 (0.0%) | 0 (0.0%) |
| Total | 591 (52.1%) | 48 (8.1%) |
Employment Status by Educational Attainment in Koontz Lake
According to labor force statistics for Koontz Lake, 72.2% of individuals (481) out of the total population between 25 and 64 years of age (666) are in the labor force, with 10.0% or 48 of them being unemployed. The group with the highest labor force participation rate are those with the educational attainment of less than high school, with 100.0% or 23 individuals in the labor force. Within the labor force, individuals with high school diploma education have the highest percentage of unemployment, with 13.7% or 30 of them being unemployed.
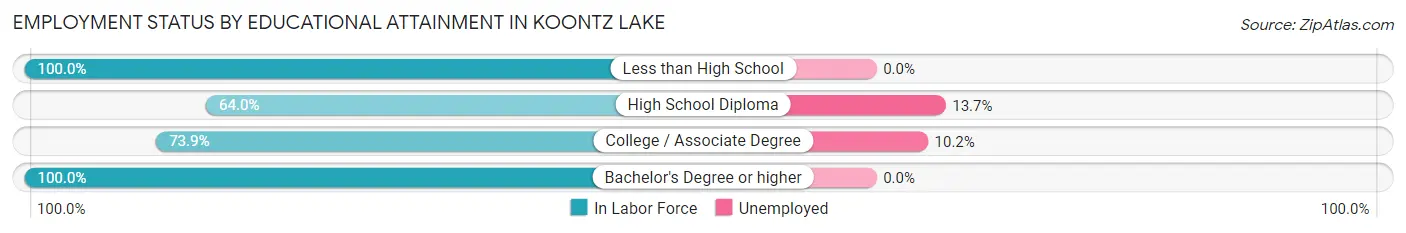
| Educational Attainment | In Labor Force | Unemployed |
| Less than High School | 23 (100.0%) | 0 (0.0%) |
| High School Diploma | 219 (64.0%) | 47 (13.7%) |
| College / Associate Degree | 176 (73.9%) | 24 (10.2%) |
| Bachelor's Degree or higher | 63 (100.0%) | 0 (0.0%) |
| Total | 481 (72.2%) | 67 (10.0%) |
Employment Occupations by Sex in Koontz Lake
Management, Business, Science and Arts Occupations
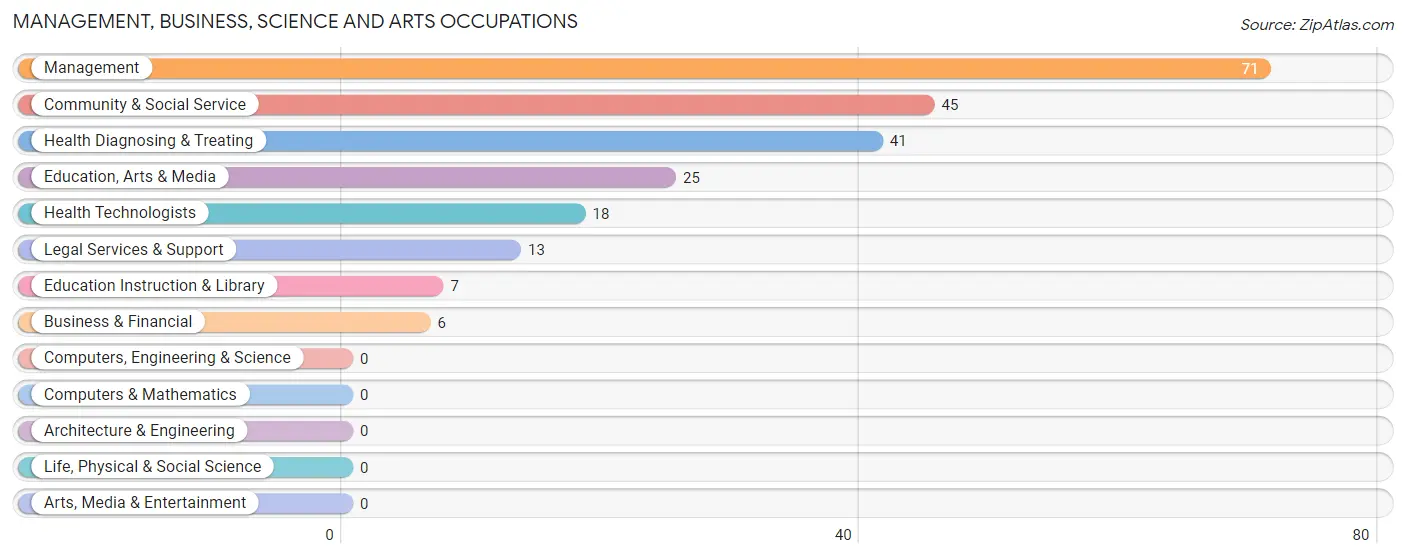
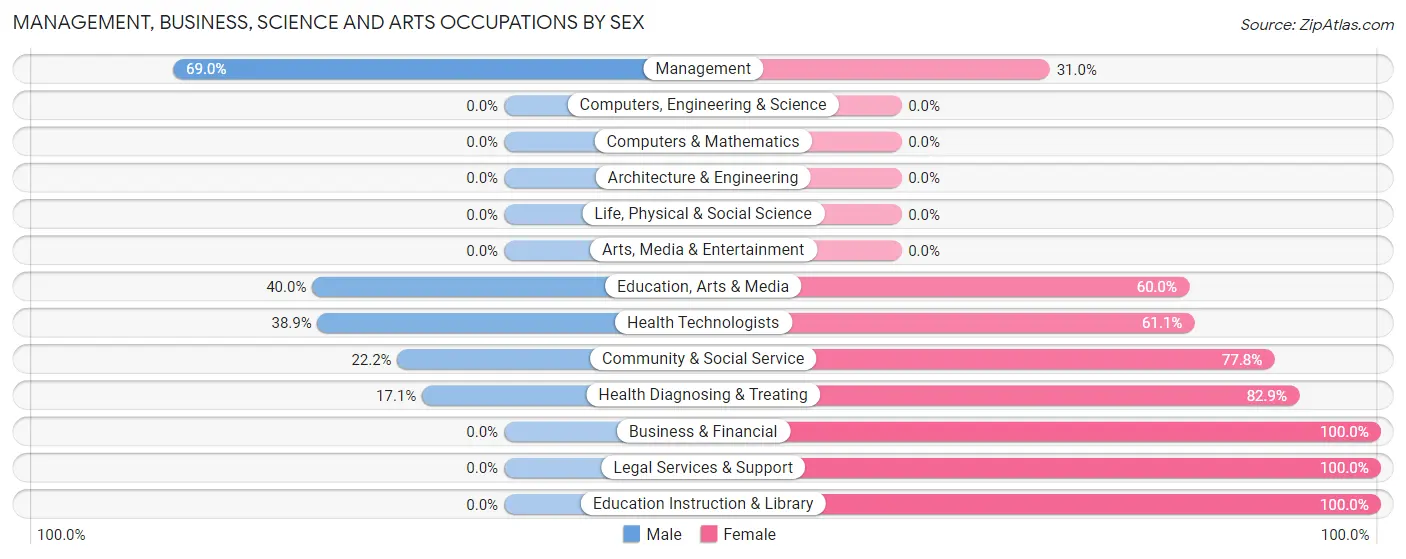
The most common Management, Business, Science and Arts occupations in Koontz Lake are Management (71 | 13.1%), Community & Social Service (45 | 8.3%), Health Diagnosing & Treating (41 | 7.5%), Education, Arts & Media (25 | 4.6%), and Health Technologists (18 | 3.3%).
Management, Business, Science and Arts Occupations by Sex
Within the Management, Business, Science and Arts occupations in Koontz Lake, the most male-oriented occupations are Management (69.0%), Education, Arts & Media (40.0%), and Health Technologists (38.9%), while the most female-oriented occupations are Business & Financial (100.0%), Legal Services & Support (100.0%), and Education Instruction & Library (100.0%).
| Occupation | Male | Female |
| Management | 49 (69.0%) | 22 (31.0%) |
| Business & Financial | 0 (0.0%) | 6 (100.0%) |
| Computers, Engineering & Science | 0 (0.0%) | 0 (0.0%) |
| Computers & Mathematics | 0 (0.0%) | 0 (0.0%) |
| Architecture & Engineering | 0 (0.0%) | 0 (0.0%) |
| Life, Physical & Social Science | 0 (0.0%) | 0 (0.0%) |
| Community & Social Service | 10 (22.2%) | 35 (77.8%) |
| Education, Arts & Media | 10 (40.0%) | 15 (60.0%) |
| Legal Services & Support | 0 (0.0%) | 13 (100.0%) |
| Education Instruction & Library | 0 (0.0%) | 7 (100.0%) |
| Arts, Media & Entertainment | 0 (0.0%) | 0 (0.0%) |
| Health Diagnosing & Treating | 7 (17.1%) | 34 (82.9%) |
| Health Technologists | 7 (38.9%) | 11 (61.1%) |
| Total (Category) | 66 (40.5%) | 97 (59.5%) |
| Total (Overall) | 314 (57.8%) | 229 (42.2%) |
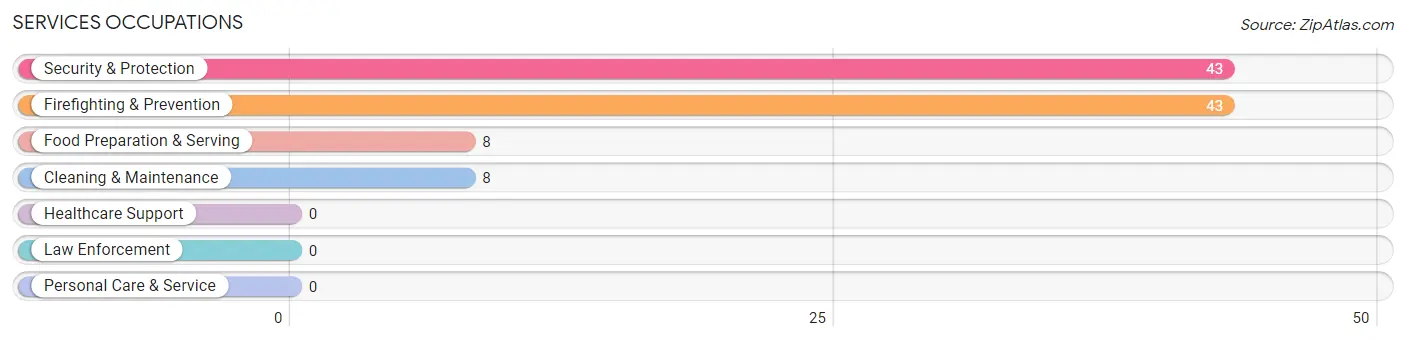
Services Occupations
The most common Services occupations in Koontz Lake are Security & Protection (43 | 7.9%), Firefighting & Prevention (43 | 7.9%), Food Preparation & Serving (8 | 1.5%), and Cleaning & Maintenance (8 | 1.5%).
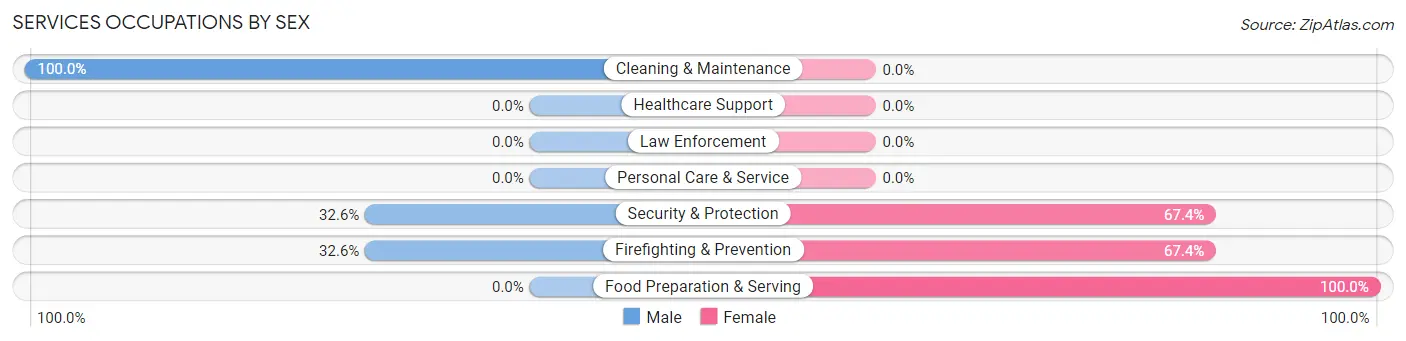
Services Occupations by Sex
Within the Services occupations in Koontz Lake, the most male-oriented occupations are Cleaning & Maintenance (100.0%), Security & Protection (32.6%), and Firefighting & Prevention (32.6%), while the most female-oriented occupations are Food Preparation & Serving (100.0%), Security & Protection (67.4%), and Firefighting & Prevention (67.4%).
| Occupation | Male | Female |
| Healthcare Support | 0 (0.0%) | 0 (0.0%) |
| Security & Protection | 14 (32.6%) | 29 (67.4%) |
| Firefighting & Prevention | 14 (32.6%) | 29 (67.4%) |
| Law Enforcement | 0 (0.0%) | 0 (0.0%) |
| Food Preparation & Serving | 0 (0.0%) | 8 (100.0%) |
| Cleaning & Maintenance | 8 (100.0%) | 0 (0.0%) |
| Personal Care & Service | 0 (0.0%) | 0 (0.0%) |
| Total (Category) | 22 (37.3%) | 37 (62.7%) |
| Total (Overall) | 314 (57.8%) | 229 (42.2%) |
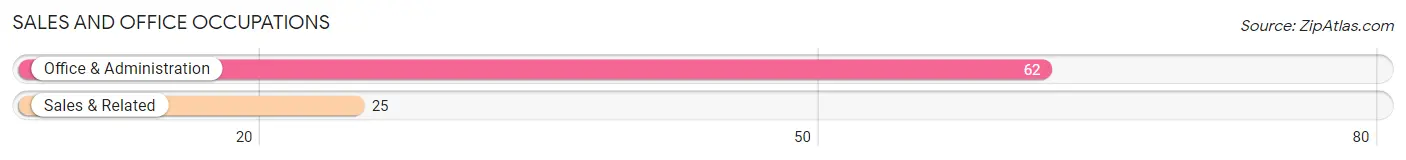
Sales and Office Occupations
The most common Sales and Office occupations in Koontz Lake are Office & Administration (62 | 11.4%), and Sales & Related (25 | 4.6%).
Sales and Office Occupations by Sex
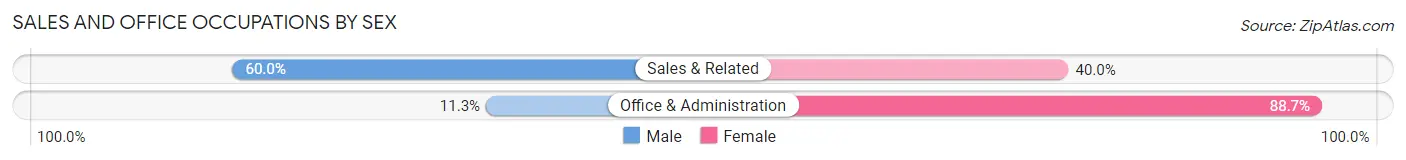
| Occupation | Male | Female |
| Sales & Related | 15 (60.0%) | 10 (40.0%) |
| Office & Administration | 7 (11.3%) | 55 (88.7%) |
| Total (Category) | 22 (25.3%) | 65 (74.7%) |
| Total (Overall) | 314 (57.8%) | 229 (42.2%) |
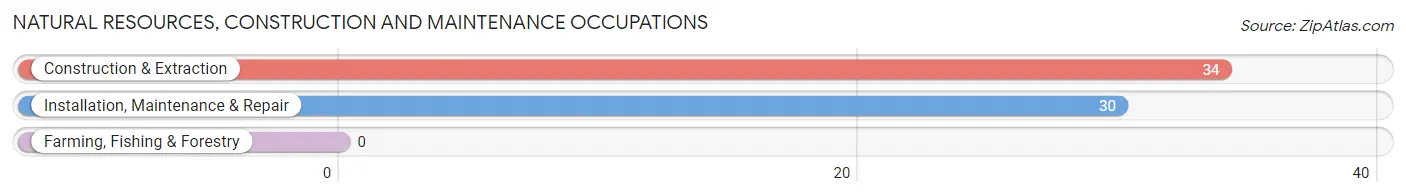
Natural Resources, Construction and Maintenance Occupations
The most common Natural Resources, Construction and Maintenance occupations in Koontz Lake are Construction & Extraction (34 | 6.3%), and Installation, Maintenance & Repair (30 | 5.5%).
Natural Resources, Construction and Maintenance Occupations by Sex
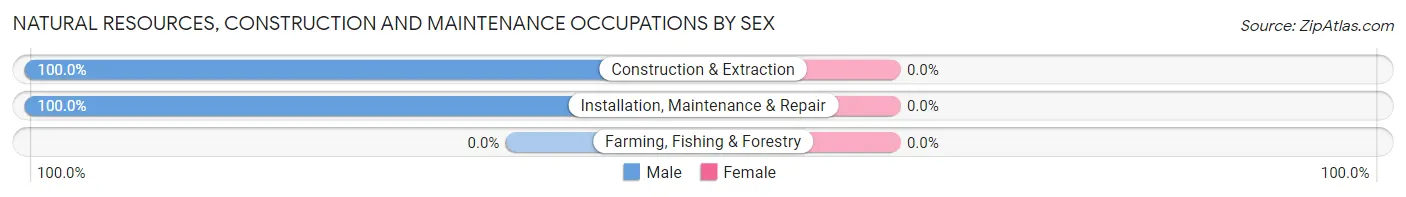
| Occupation | Male | Female |
| Farming, Fishing & Forestry | 0 (0.0%) | 0 (0.0%) |
| Construction & Extraction | 34 (100.0%) | 0 (0.0%) |
| Installation, Maintenance & Repair | 30 (100.0%) | 0 (0.0%) |
| Total (Category) | 64 (100.0%) | 0 (0.0%) |
| Total (Overall) | 314 (57.8%) | 229 (42.2%) |
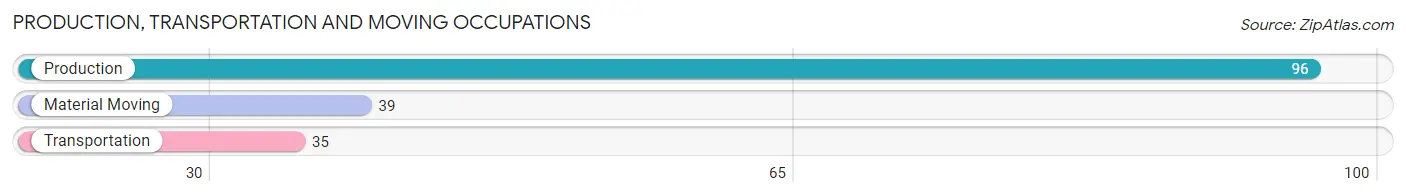
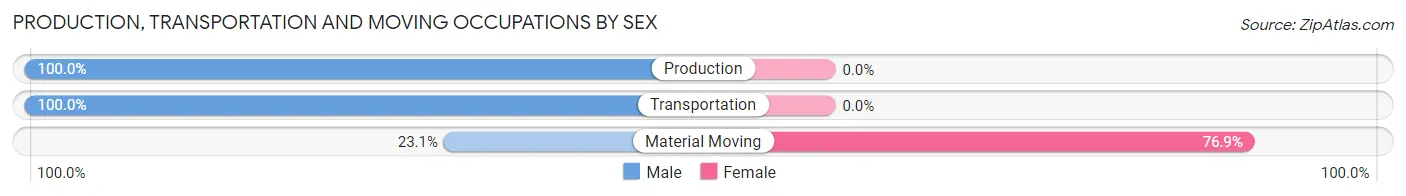
Production, Transportation and Moving Occupations
The most common Production, Transportation and Moving occupations in Koontz Lake are Production (96 | 17.7%), Material Moving (39 | 7.2%), and Transportation (35 | 6.5%).
Production, Transportation and Moving Occupations by Sex
| Occupation | Male | Female |
| Production | 96 (100.0%) | 0 (0.0%) |
| Transportation | 35 (100.0%) | 0 (0.0%) |
| Material Moving | 9 (23.1%) | 30 (76.9%) |
| Total (Category) | 140 (82.4%) | 30 (17.6%) |
| Total (Overall) | 314 (57.8%) | 229 (42.2%) |
Employment Industries by Sex in Koontz Lake
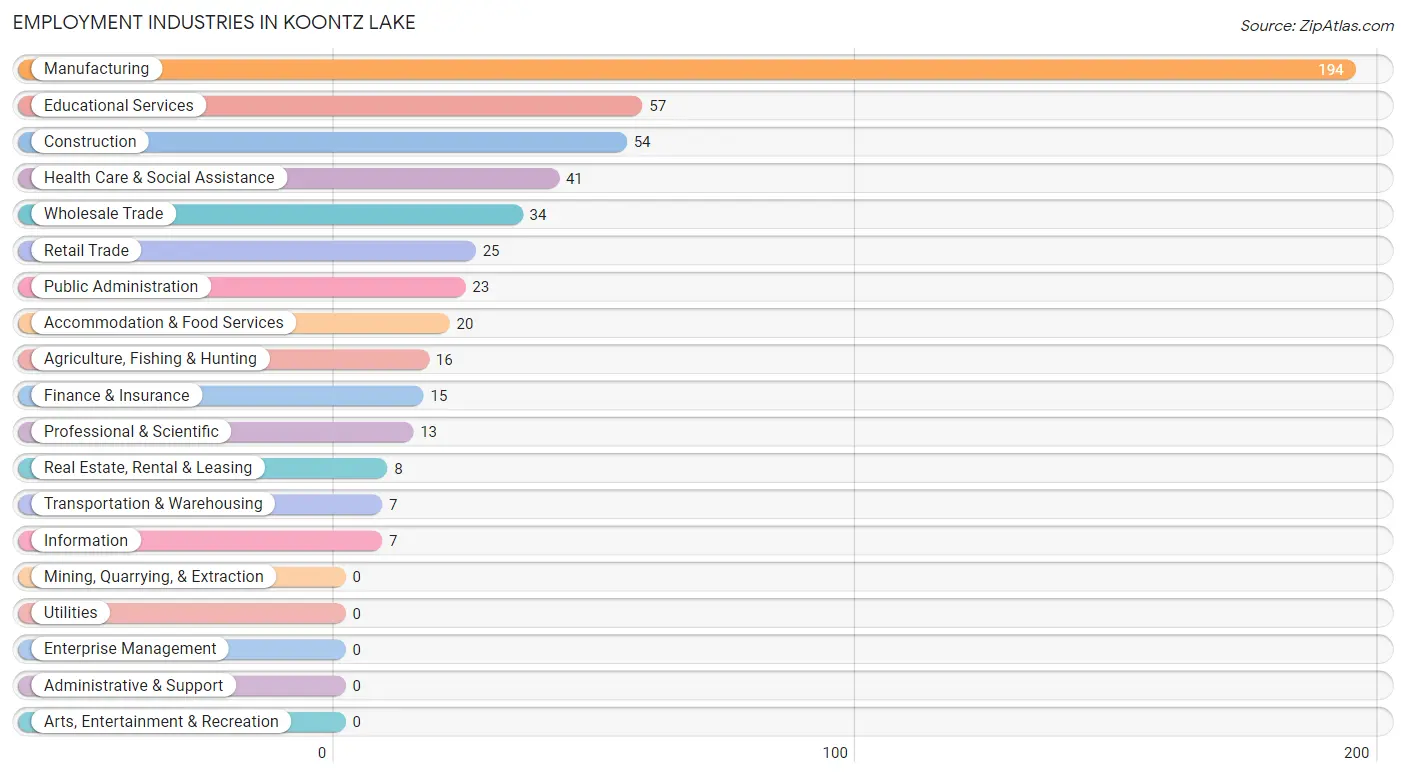
Employment Industries in Koontz Lake
The major employment industries in Koontz Lake include Manufacturing (194 | 35.7%), Educational Services (57 | 10.5%), Construction (54 | 9.9%), Health Care & Social Assistance (41 | 7.5%), and Wholesale Trade (34 | 6.3%).
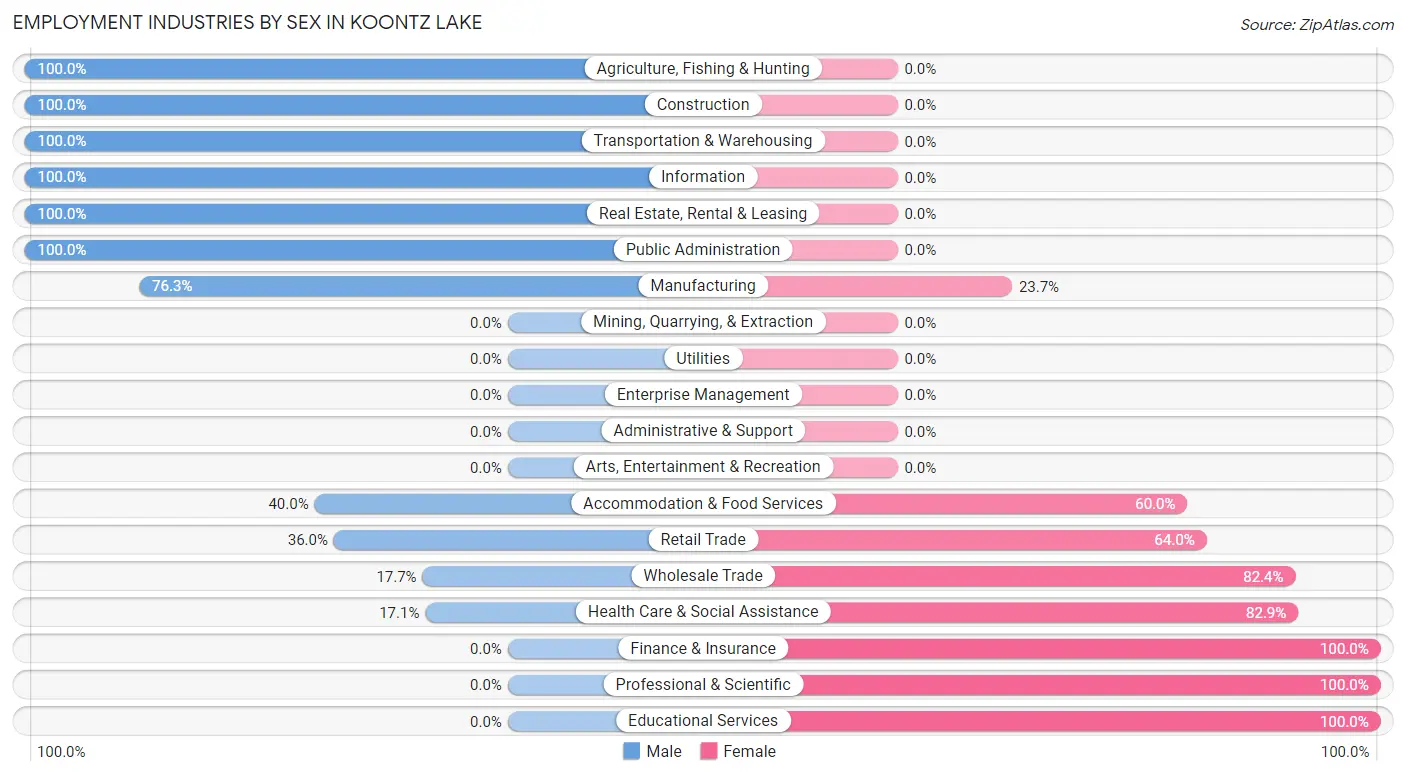
Employment Industries by Sex in Koontz Lake
The Koontz Lake industries that see more men than women are Agriculture, Fishing & Hunting (100.0%), Construction (100.0%), and Transportation & Warehousing (100.0%), whereas the industries that tend to have a higher number of women are Finance & Insurance (100.0%), Professional & Scientific (100.0%), and Educational Services (100.0%).
| Industry | Male | Female |
| Agriculture, Fishing & Hunting | 16 (100.0%) | 0 (0.0%) |
| Mining, Quarrying, & Extraction | 0 (0.0%) | 0 (0.0%) |
| Construction | 54 (100.0%) | 0 (0.0%) |
| Manufacturing | 148 (76.3%) | 46 (23.7%) |
| Wholesale Trade | 6 (17.6%) | 28 (82.4%) |
| Retail Trade | 9 (36.0%) | 16 (64.0%) |
| Transportation & Warehousing | 7 (100.0%) | 0 (0.0%) |
| Utilities | 0 (0.0%) | 0 (0.0%) |
| Information | 7 (100.0%) | 0 (0.0%) |
| Finance & Insurance | 0 (0.0%) | 15 (100.0%) |
| Real Estate, Rental & Leasing | 8 (100.0%) | 0 (0.0%) |
| Professional & Scientific | 0 (0.0%) | 13 (100.0%) |
| Enterprise Management | 0 (0.0%) | 0 (0.0%) |
| Administrative & Support | 0 (0.0%) | 0 (0.0%) |
| Educational Services | 0 (0.0%) | 57 (100.0%) |
| Health Care & Social Assistance | 7 (17.1%) | 34 (82.9%) |
| Arts, Entertainment & Recreation | 0 (0.0%) | 0 (0.0%) |
| Accommodation & Food Services | 8 (40.0%) | 12 (60.0%) |
| Public Administration | 23 (100.0%) | 0 (0.0%) |
| Total | 314 (57.8%) | 229 (42.2%) |
Education in Koontz Lake
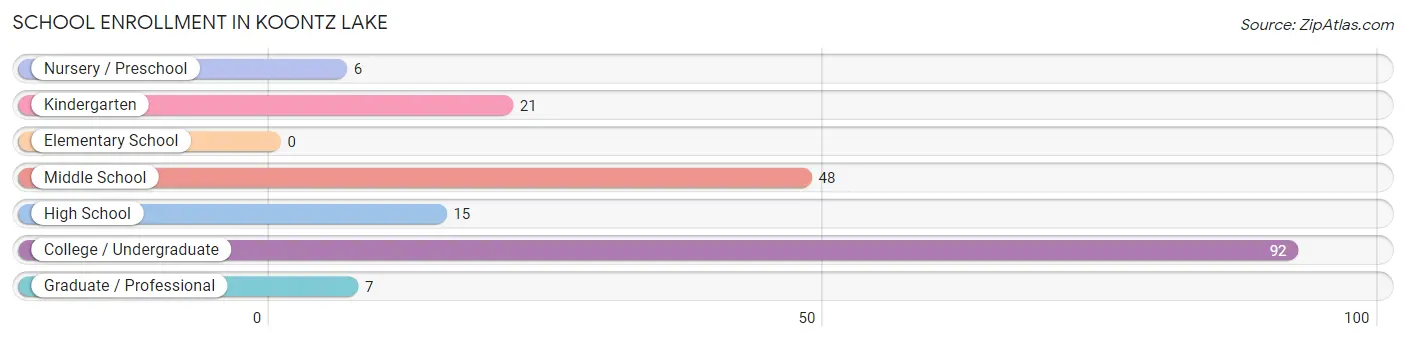
School Enrollment in Koontz Lake
The most common levels of schooling among the 189 students in Koontz Lake are college / undergraduate (92 | 48.7%), middle school (48 | 25.4%), and kindergarten (21 | 11.1%).
| School Level | # Students | % Students |
| Nursery / Preschool | 6 | 3.2% |
| Kindergarten | 21 | 11.1% |
| Elementary School | 0 | 0.0% |
| Middle School | 48 | 25.4% |
| High School | 15 | 7.9% |
| College / Undergraduate | 92 | 48.7% |
| Graduate / Professional | 7 | 3.7% |
| Total | 189 | 100.0% |
School Enrollment by Age by Funding Source in Koontz Lake
Out of a total of 189 students who are enrolled in schools in Koontz Lake, 42 (22.2%) attend a private institution, while the remaining 147 (77.8%) are enrolled in public schools. The age group of 3 to 4 year olds has the highest likelihood of being enrolled in private schools, with 6 (100.0% in the age bracket) enrolled. Conversely, the age group of 5 to 9 year old has the lowest likelihood of being enrolled in a private school, with 21 (100.0% in the age bracket) attending a public institution.
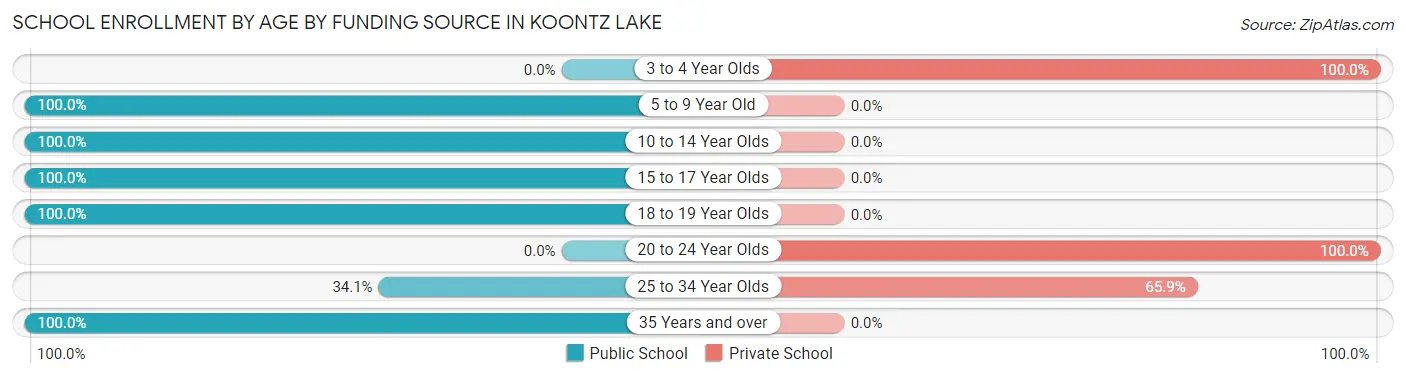
| Age Bracket | Public School | Private School |
| 3 to 4 Year Olds | 0 (0.0%) | 6 (100.0%) |
| 5 to 9 Year Old | 21 (100.0%) | 0 (0.0%) |
| 10 to 14 Year Olds | 28 (100.0%) | 0 (0.0%) |
| 15 to 17 Year Olds | 35 (100.0%) | 0 (0.0%) |
| 18 to 19 Year Olds | 9 (100.0%) | 0 (0.0%) |
| 20 to 24 Year Olds | 0 (0.0%) | 7 (100.0%) |
| 25 to 34 Year Olds | 15 (34.1%) | 29 (65.9%) |
| 35 Years and over | 39 (100.0%) | 0 (0.0%) |
| Total | 147 (77.8%) | 42 (22.2%) |
Educational Attainment by Field of Study in Koontz Lake
Business (49 | 34.3%), education (19 | 13.3%), liberal arts & history (18 | 12.6%), physical & health sciences (15 | 10.5%), and engineering (14 | 9.8%) are the most common fields of study among 143 individuals in Koontz Lake who have obtained a bachelor's degree or higher.
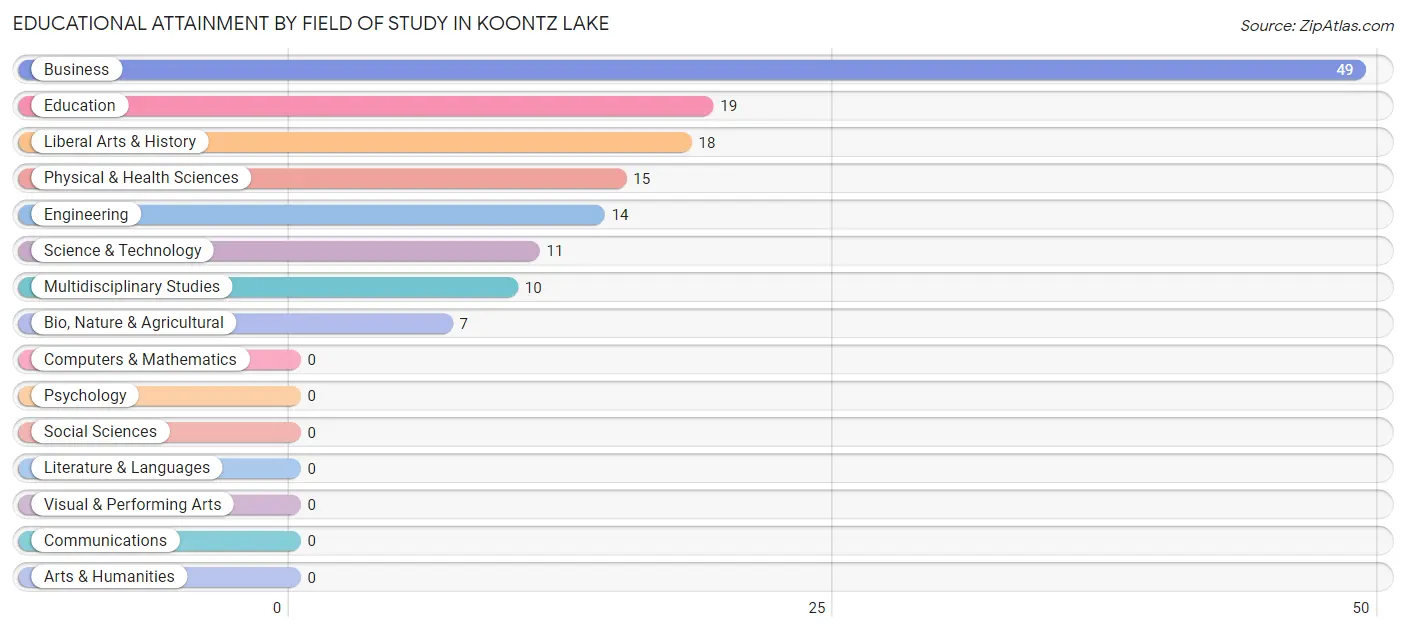
| Field of Study | # Graduates | % Graduates |
| Computers & Mathematics | 0 | 0.0% |
| Bio, Nature & Agricultural | 7 | 4.9% |
| Physical & Health Sciences | 15 | 10.5% |
| Psychology | 0 | 0.0% |
| Social Sciences | 0 | 0.0% |
| Engineering | 14 | 9.8% |
| Multidisciplinary Studies | 10 | 7.0% |
| Science & Technology | 11 | 7.7% |
| Business | 49 | 34.3% |
| Education | 19 | 13.3% |
| Literature & Languages | 0 | 0.0% |
| Liberal Arts & History | 18 | 12.6% |
| Visual & Performing Arts | 0 | 0.0% |
| Communications | 0 | 0.0% |
| Arts & Humanities | 0 | 0.0% |
| Total | 143 | 100.0% |
Transportation & Commute in Koontz Lake
Vehicle Availability by Sex in Koontz Lake
The most prevalent vehicle ownership categories in Koontz Lake are males with 2 vehicles (173, accounting for 55.1%) and females with 2 vehicles (129, making up 75.5%).
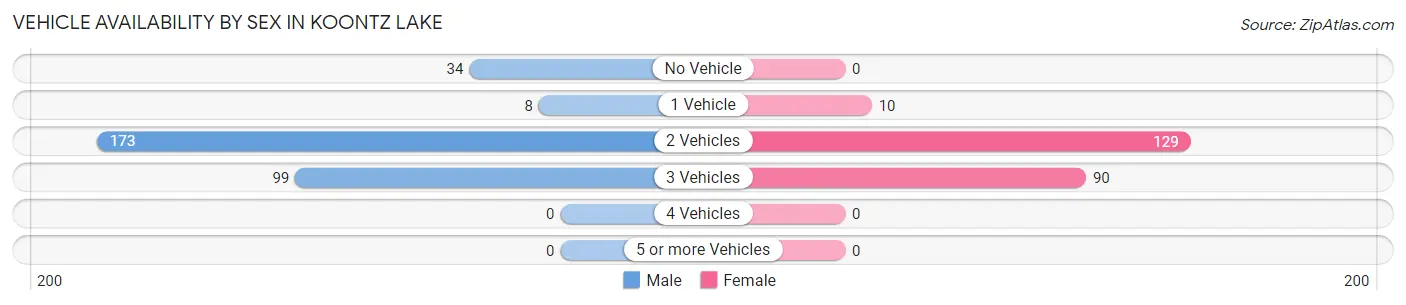
| Vehicles Available | Male | Female |
| No Vehicle | 34 (10.8%) | 0 (0.0%) |
| 1 Vehicle | 8 (2.5%) | 10 (4.4%) |
| 2 Vehicles | 173 (55.1%) | 129 (56.3%) |
| 3 Vehicles | 99 (31.5%) | 90 (39.3%) |
| 4 Vehicles | 0 (0.0%) | 0 (0.0%) |
| 5 or more Vehicles | 0 (0.0%) | 0 (0.0%) |
| Total | 314 (100.0%) | 229 (100.0%) |
Commute Time in Koontz Lake
The most frequently occuring commute durations in Koontz Lake are 5 to 9 minutes (82 commuters, 15.2%), 45 to 59 minutes (80 commuters, 14.8%), and 90 or more minutes (69 commuters, 12.8%).
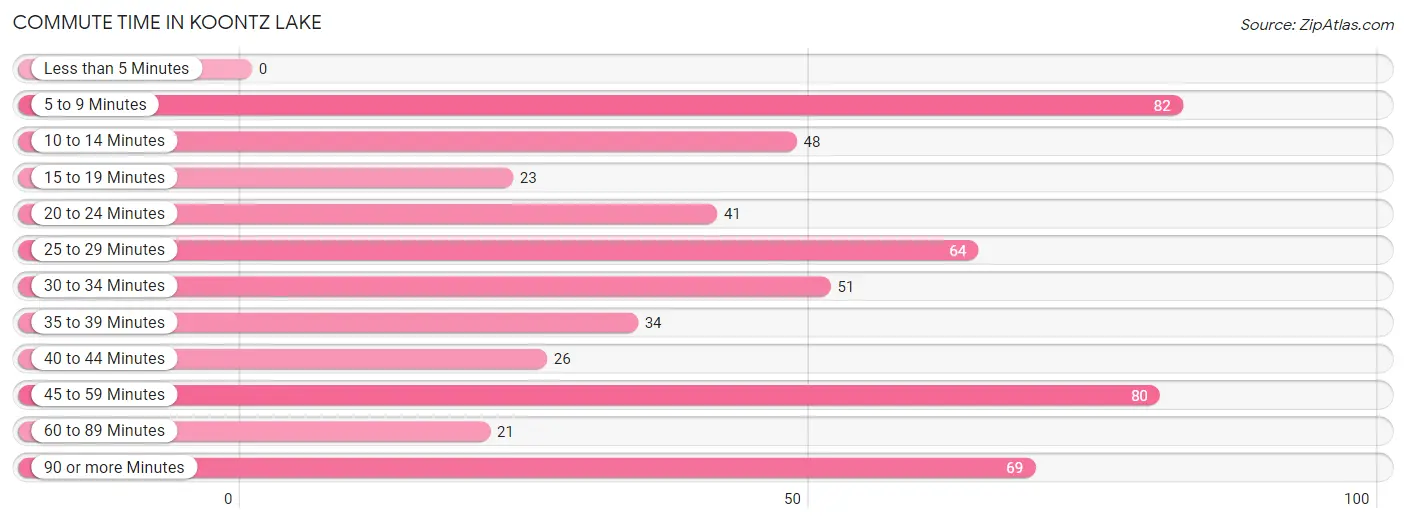
| Commute Time | # Commuters | % Commuters |
| Less than 5 Minutes | 0 | 0.0% |
| 5 to 9 Minutes | 82 | 15.2% |
| 10 to 14 Minutes | 48 | 8.9% |
| 15 to 19 Minutes | 23 | 4.3% |
| 20 to 24 Minutes | 41 | 7.6% |
| 25 to 29 Minutes | 64 | 11.9% |
| 30 to 34 Minutes | 51 | 9.5% |
| 35 to 39 Minutes | 34 | 6.3% |
| 40 to 44 Minutes | 26 | 4.8% |
| 45 to 59 Minutes | 80 | 14.8% |
| 60 to 89 Minutes | 21 | 3.9% |
| 90 or more Minutes | 69 | 12.8% |
Commute Time by Sex in Koontz Lake
The most common commute times in Koontz Lake are 90 or more minutes (61 commuters, 19.4%) for males and 5 to 9 minutes (64 commuters, 28.4%) for females.
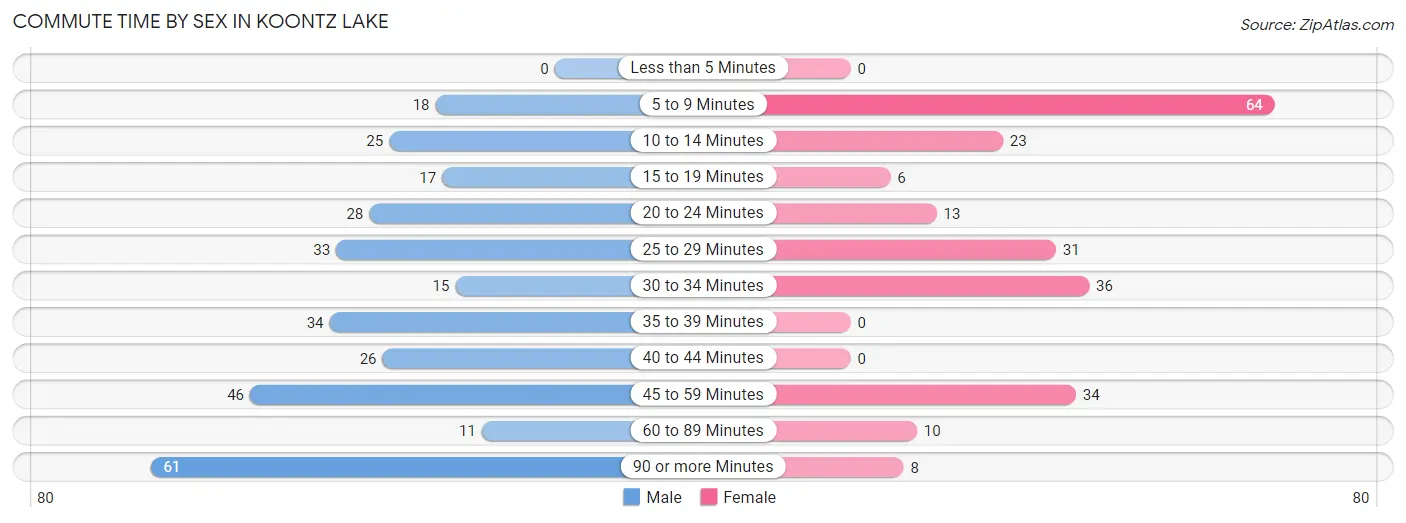
| Commute Time | Male | Female |
| Less than 5 Minutes | 0 (0.0%) | 0 (0.0%) |
| 5 to 9 Minutes | 18 (5.7%) | 64 (28.4%) |
| 10 to 14 Minutes | 25 (8.0%) | 23 (10.2%) |
| 15 to 19 Minutes | 17 (5.4%) | 6 (2.7%) |
| 20 to 24 Minutes | 28 (8.9%) | 13 (5.8%) |
| 25 to 29 Minutes | 33 (10.5%) | 31 (13.8%) |
| 30 to 34 Minutes | 15 (4.8%) | 36 (16.0%) |
| 35 to 39 Minutes | 34 (10.8%) | 0 (0.0%) |
| 40 to 44 Minutes | 26 (8.3%) | 0 (0.0%) |
| 45 to 59 Minutes | 46 (14.6%) | 34 (15.1%) |
| 60 to 89 Minutes | 11 (3.5%) | 10 (4.4%) |
| 90 or more Minutes | 61 (19.4%) | 8 (3.6%) |
Time of Departure to Work by Sex in Koontz Lake
The most frequent times of departure to work in Koontz Lake are 6:30 AM to 6:59 AM (111, 35.3%) for males and 7:30 AM to 7:59 AM (62, 27.6%) for females.
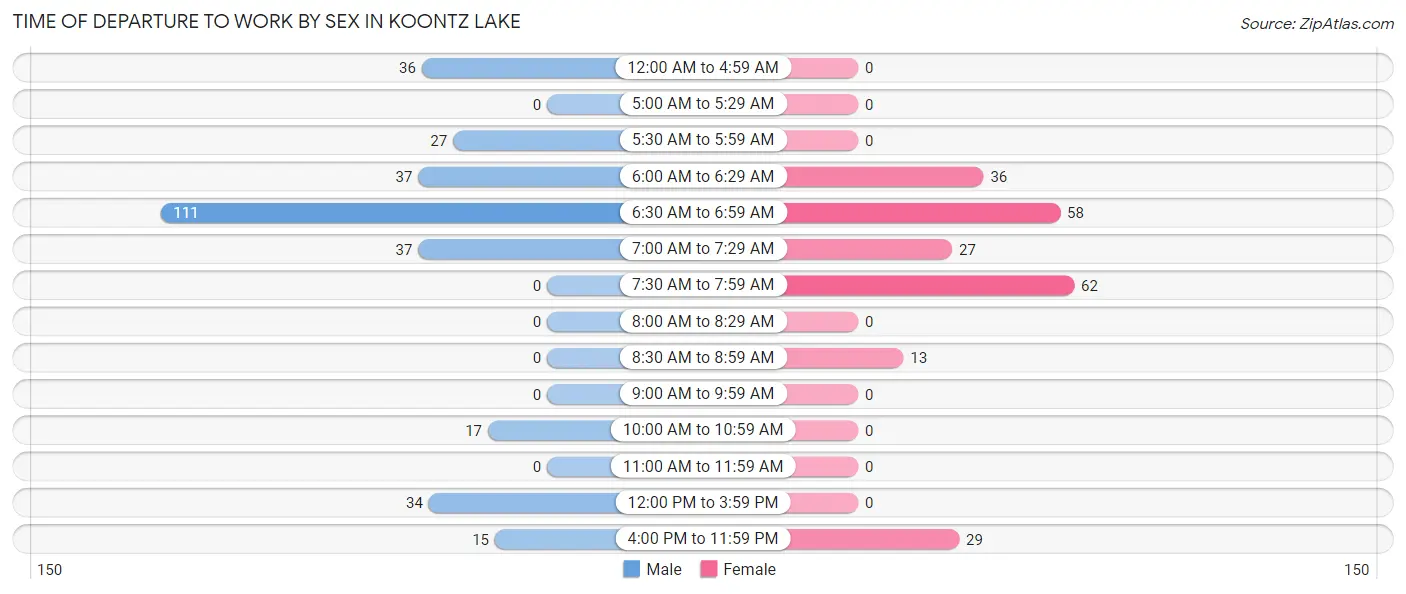
| Time of Departure | Male | Female |
| 12:00 AM to 4:59 AM | 36 (11.5%) | 0 (0.0%) |
| 5:00 AM to 5:29 AM | 0 (0.0%) | 0 (0.0%) |
| 5:30 AM to 5:59 AM | 27 (8.6%) | 0 (0.0%) |
| 6:00 AM to 6:29 AM | 37 (11.8%) | 36 (16.0%) |
| 6:30 AM to 6:59 AM | 111 (35.3%) | 58 (25.8%) |
| 7:00 AM to 7:29 AM | 37 (11.8%) | 27 (12.0%) |
| 7:30 AM to 7:59 AM | 0 (0.0%) | 62 (27.6%) |
| 8:00 AM to 8:29 AM | 0 (0.0%) | 0 (0.0%) |
| 8:30 AM to 8:59 AM | 0 (0.0%) | 13 (5.8%) |
| 9:00 AM to 9:59 AM | 0 (0.0%) | 0 (0.0%) |
| 10:00 AM to 10:59 AM | 17 (5.4%) | 0 (0.0%) |
| 11:00 AM to 11:59 AM | 0 (0.0%) | 0 (0.0%) |
| 12:00 PM to 3:59 PM | 34 (10.8%) | 0 (0.0%) |
| 4:00 PM to 11:59 PM | 15 (4.8%) | 29 (12.9%) |
| Total | 314 (100.0%) | 225 (100.0%) |
Housing Occupancy in Koontz Lake
Occupancy by Ownership in Koontz Lake
Of the total 705 dwellings in Koontz Lake, owner-occupied units account for 651 (92.3%), while renter-occupied units make up 54 (7.7%).
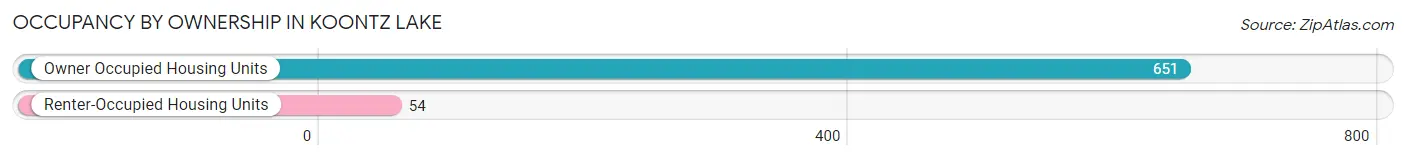
| Occupancy | # Housing Units | % Housing Units |
| Owner Occupied Housing Units | 651 | 92.3% |
| Renter-Occupied Housing Units | 54 | 7.7% |
| Total Occupied Housing Units | 705 | 100.0% |
Occupancy by Household Size in Koontz Lake
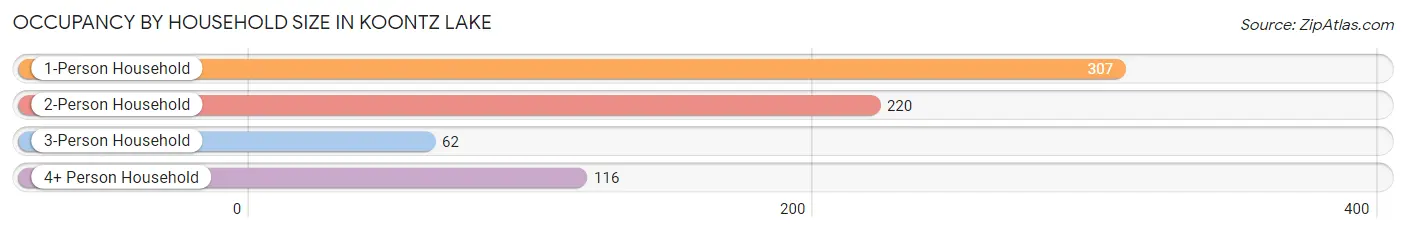
| Household Size | # Housing Units | % Housing Units |
| 1-Person Household | 307 | 43.5% |
| 2-Person Household | 220 | 31.2% |
| 3-Person Household | 62 | 8.8% |
| 4+ Person Household | 116 | 16.5% |
| Total Housing Units | 705 | 100.0% |
Occupancy by Ownership by Household Size in Koontz Lake
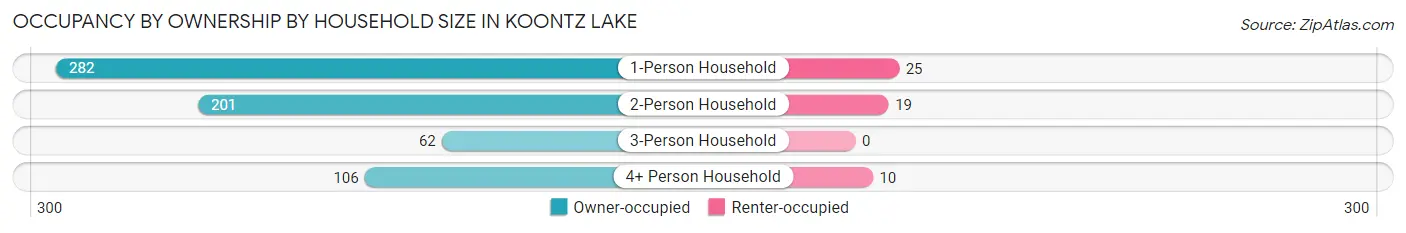
| Household Size | Owner-occupied | Renter-occupied |
| 1-Person Household | 282 (91.9%) | 25 (8.1%) |
| 2-Person Household | 201 (91.4%) | 19 (8.6%) |
| 3-Person Household | 62 (100.0%) | 0 (0.0%) |
| 4+ Person Household | 106 (91.4%) | 10 (8.6%) |
| Total Housing Units | 651 (92.3%) | 54 (7.7%) |
Occupancy by Educational Attainment in Koontz Lake
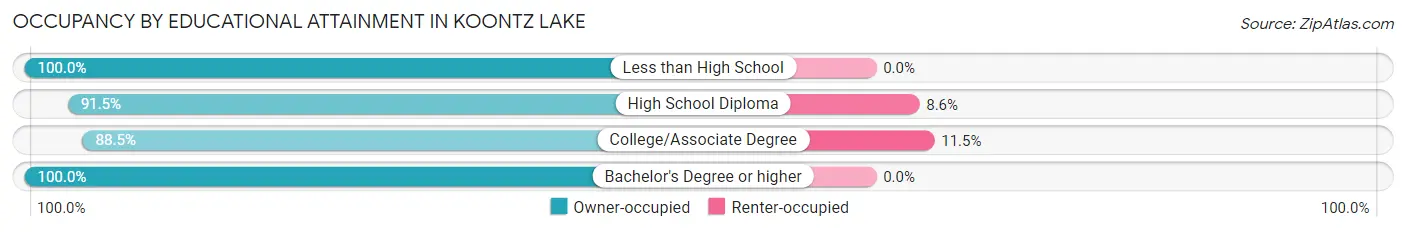
| Household Size | Owner-occupied | Renter-occupied |
| Less than High School | 21 (100.0%) | 0 (0.0%) |
| High School Diploma | 310 (91.4%) | 29 (8.6%) |
| College/Associate Degree | 192 (88.5%) | 25 (11.5%) |
| Bachelor's Degree or higher | 128 (100.0%) | 0 (0.0%) |
Occupancy by Age of Householder in Koontz Lake
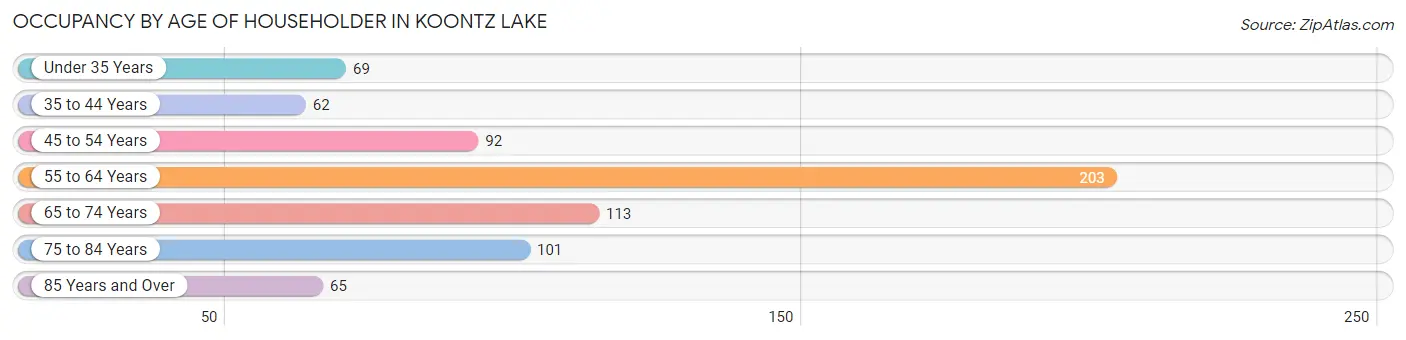
| Age Bracket | # Households | % Households |
| Under 35 Years | 69 | 9.8% |
| 35 to 44 Years | 62 | 8.8% |
| 45 to 54 Years | 92 | 13.1% |
| 55 to 64 Years | 203 | 28.8% |
| 65 to 74 Years | 113 | 16.0% |
| 75 to 84 Years | 101 | 14.3% |
| 85 Years and Over | 65 | 9.2% |
| Total | 705 | 100.0% |
Housing Finances in Koontz Lake
Median Income by Occupancy in Koontz Lake
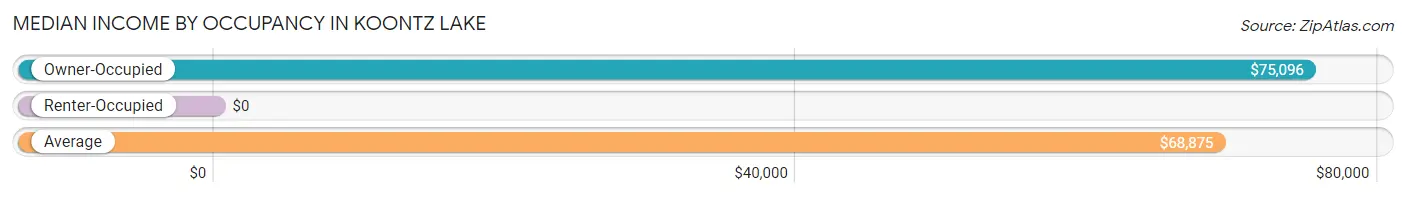
| Occupancy Type | # Households | Median Income |
| Owner-Occupied | 651 (92.3%) | $75,096 |
| Renter-Occupied | 54 (7.7%) | $0 |
| Average | 705 (100.0%) | $68,875 |
Occupancy by Householder Income Bracket in Koontz Lake
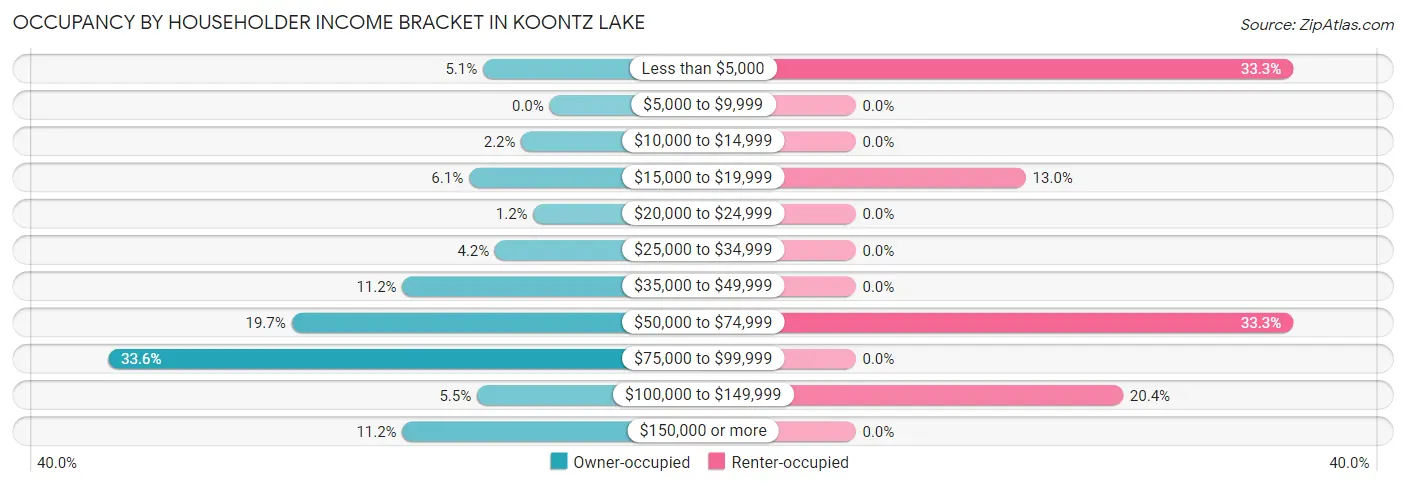
| Income Bracket | Owner-occupied | Renter-occupied |
| Less than $5,000 | 33 (5.1%) | 18 (33.3%) |
| $5,000 to $9,999 | 0 (0.0%) | 0 (0.0%) |
| $10,000 to $14,999 | 14 (2.1%) | 0 (0.0%) |
| $15,000 to $19,999 | 40 (6.1%) | 7 (13.0%) |
| $20,000 to $24,999 | 8 (1.2%) | 0 (0.0%) |
| $25,000 to $34,999 | 27 (4.2%) | 0 (0.0%) |
| $35,000 to $49,999 | 73 (11.2%) | 0 (0.0%) |
| $50,000 to $74,999 | 128 (19.7%) | 18 (33.3%) |
| $75,000 to $99,999 | 219 (33.6%) | 0 (0.0%) |
| $100,000 to $149,999 | 36 (5.5%) | 11 (20.4%) |
| $150,000 or more | 73 (11.2%) | 0 (0.0%) |
| Total | 651 (100.0%) | 54 (100.0%) |
Monthly Housing Cost Tiers in Koontz Lake
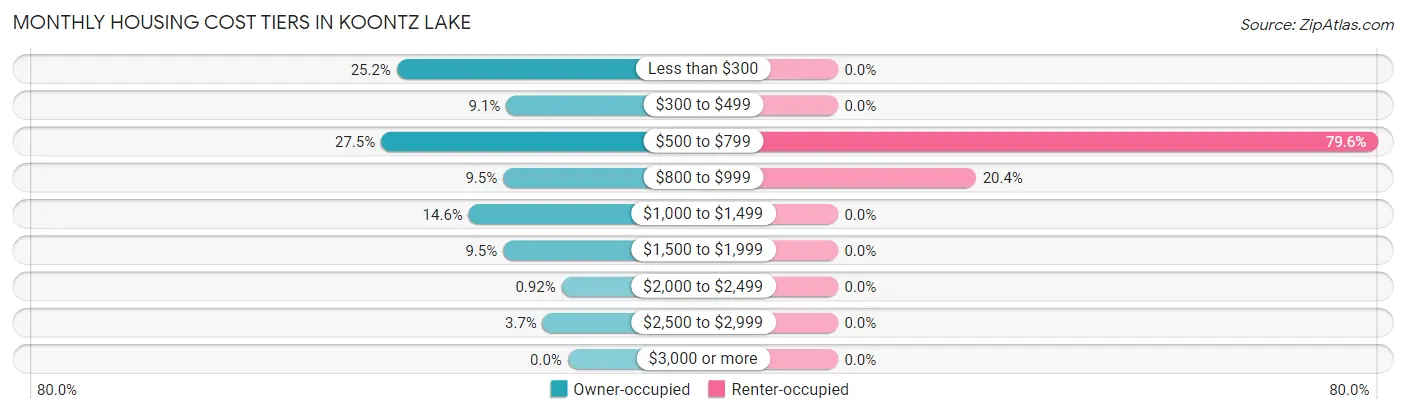
| Monthly Cost | Owner-occupied | Renter-occupied |
| Less than $300 | 164 (25.2%) | 0 (0.0%) |
| $300 to $499 | 59 (9.1%) | 0 (0.0%) |
| $500 to $799 | 179 (27.5%) | 43 (79.6%) |
| $800 to $999 | 62 (9.5%) | 11 (20.4%) |
| $1,000 to $1,499 | 95 (14.6%) | 0 (0.0%) |
| $1,500 to $1,999 | 62 (9.5%) | 0 (0.0%) |
| $2,000 to $2,499 | 6 (0.9%) | 0 (0.0%) |
| $2,500 to $2,999 | 24 (3.7%) | 0 (0.0%) |
| $3,000 or more | 0 (0.0%) | 0 (0.0%) |
| Total | 651 (100.0%) | 54 (100.0%) |
Physical Housing Characteristics in Koontz Lake
Housing Structures in Koontz Lake
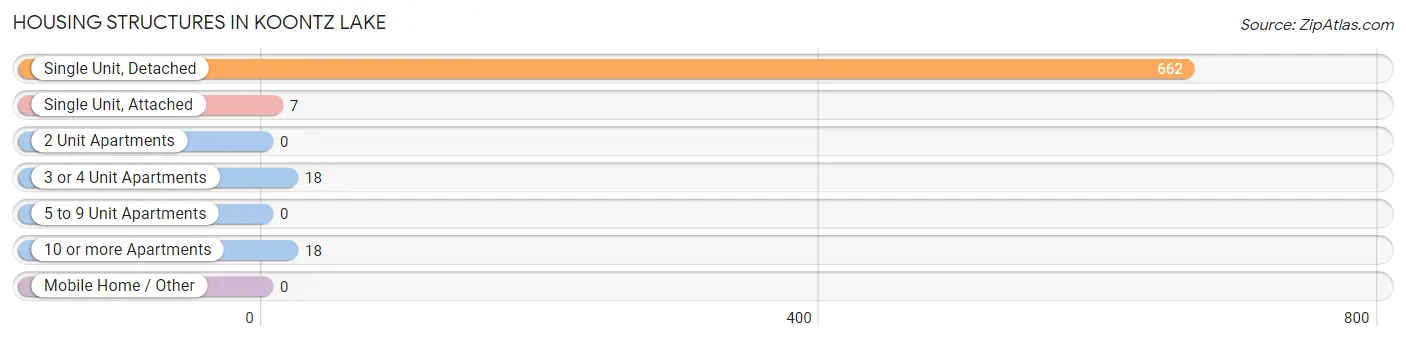
| Structure Type | # Housing Units | % Housing Units |
| Single Unit, Detached | 662 | 93.9% |
| Single Unit, Attached | 7 | 1.0% |
| 2 Unit Apartments | 0 | 0.0% |
| 3 or 4 Unit Apartments | 18 | 2.5% |
| 5 to 9 Unit Apartments | 0 | 0.0% |
| 10 or more Apartments | 18 | 2.5% |
| Mobile Home / Other | 0 | 0.0% |
| Total | 705 | 100.0% |
Housing Structures by Occupancy in Koontz Lake
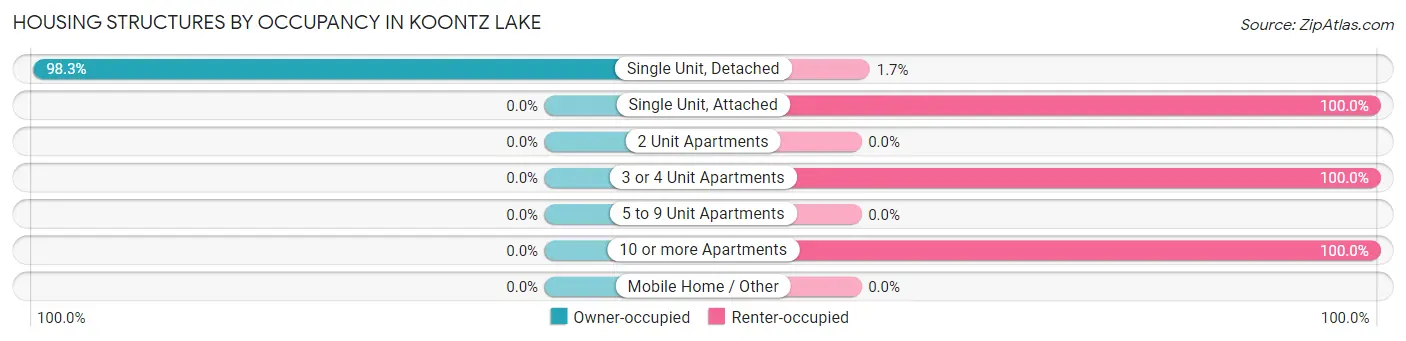
| Structure Type | Owner-occupied | Renter-occupied |
| Single Unit, Detached | 651 (98.3%) | 11 (1.7%) |
| Single Unit, Attached | 0 (0.0%) | 7 (100.0%) |
| 2 Unit Apartments | 0 (0.0%) | 0 (0.0%) |
| 3 or 4 Unit Apartments | 0 (0.0%) | 18 (100.0%) |
| 5 to 9 Unit Apartments | 0 (0.0%) | 0 (0.0%) |
| 10 or more Apartments | 0 (0.0%) | 18 (100.0%) |
| Mobile Home / Other | 0 (0.0%) | 0 (0.0%) |
| Total | 651 (92.3%) | 54 (7.7%) |
Housing Structures by Number of Rooms in Koontz Lake
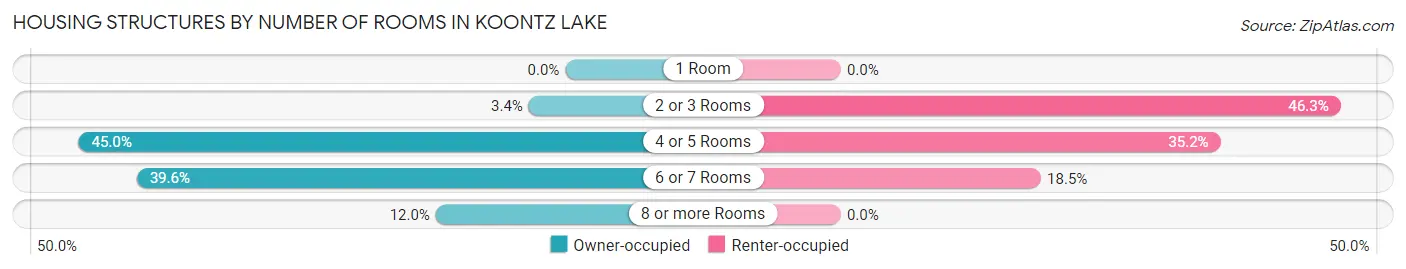
| Number of Rooms | Owner-occupied | Renter-occupied |
| 1 Room | 0 (0.0%) | 0 (0.0%) |
| 2 or 3 Rooms | 22 (3.4%) | 25 (46.3%) |
| 4 or 5 Rooms | 293 (45.0%) | 19 (35.2%) |
| 6 or 7 Rooms | 258 (39.6%) | 10 (18.5%) |
| 8 or more Rooms | 78 (12.0%) | 0 (0.0%) |
| Total | 651 (100.0%) | 54 (100.0%) |
Housing Structure by Heating Type in Koontz Lake
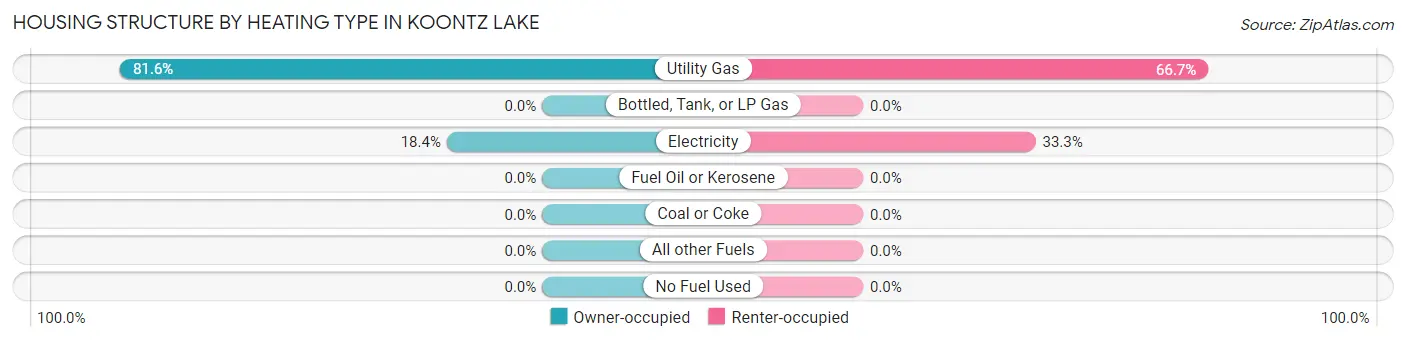
| Heating Type | Owner-occupied | Renter-occupied |
| Utility Gas | 531 (81.6%) | 36 (66.7%) |
| Bottled, Tank, or LP Gas | 0 (0.0%) | 0 (0.0%) |
| Electricity | 120 (18.4%) | 18 (33.3%) |
| Fuel Oil or Kerosene | 0 (0.0%) | 0 (0.0%) |
| Coal or Coke | 0 (0.0%) | 0 (0.0%) |
| All other Fuels | 0 (0.0%) | 0 (0.0%) |
| No Fuel Used | 0 (0.0%) | 0 (0.0%) |
| Total | 651 (100.0%) | 54 (100.0%) |
Household Vehicle Usage in Koontz Lake
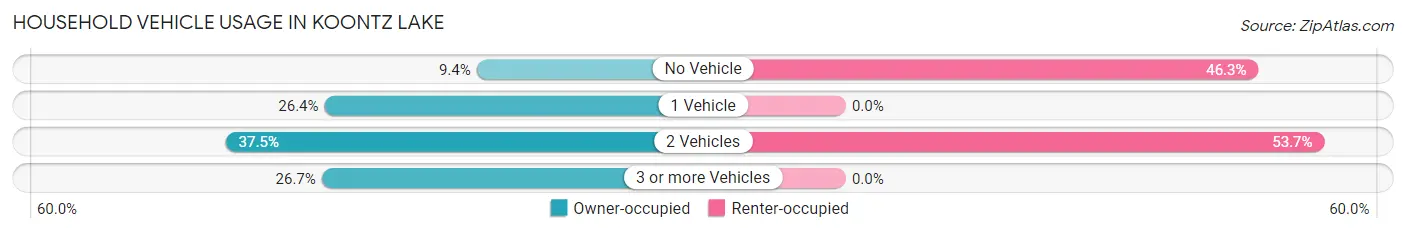
| Vehicles per Household | Owner-occupied | Renter-occupied |
| No Vehicle | 61 (9.4%) | 25 (46.3%) |
| 1 Vehicle | 172 (26.4%) | 0 (0.0%) |
| 2 Vehicles | 244 (37.5%) | 29 (53.7%) |
| 3 or more Vehicles | 174 (26.7%) | 0 (0.0%) |
| Total | 651 (100.0%) | 54 (100.0%) |
Real Estate & Mortgages in Koontz Lake
Real Estate and Mortgage Overview in Koontz Lake
| Characteristic | Without Mortgage | With Mortgage |
| Housing Units | 246 | 405 |
| Median Property Value | $114,400 | $117,900 |
| Median Household Income | $46,406 | $66 |
| Monthly Housing Costs | $285 | $0 |
| Real Estate Taxes | $669 | $0 |
Property Value by Mortgage Status in Koontz Lake
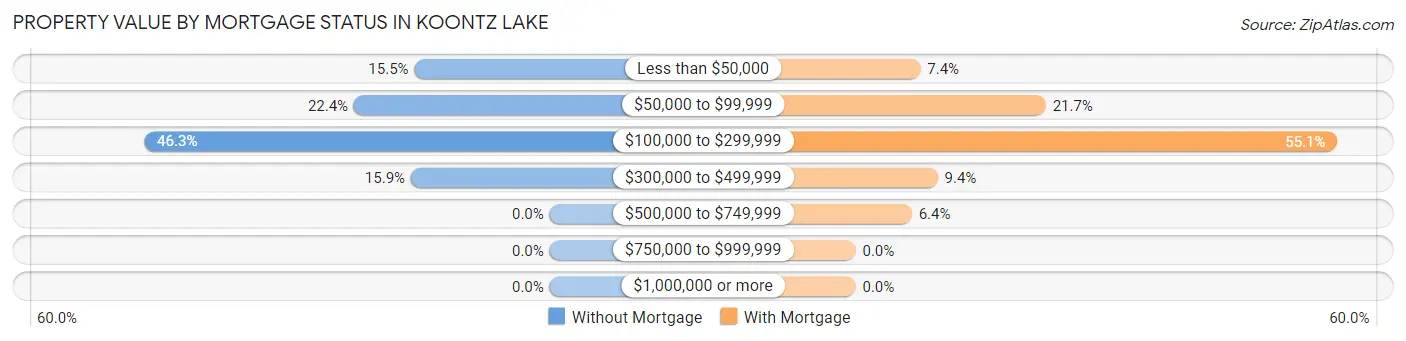
| Property Value | Without Mortgage | With Mortgage |
| Less than $50,000 | 38 (15.4%) | 30 (7.4%) |
| $50,000 to $99,999 | 55 (22.4%) | 88 (21.7%) |
| $100,000 to $299,999 | 114 (46.3%) | 223 (55.1%) |
| $300,000 to $499,999 | 39 (15.9%) | 38 (9.4%) |
| $500,000 to $749,999 | 0 (0.0%) | 26 (6.4%) |
| $750,000 to $999,999 | 0 (0.0%) | 0 (0.0%) |
| $1,000,000 or more | 0 (0.0%) | 0 (0.0%) |
| Total | 246 (100.0%) | 405 (100.0%) |
Household Income by Mortgage Status in Koontz Lake
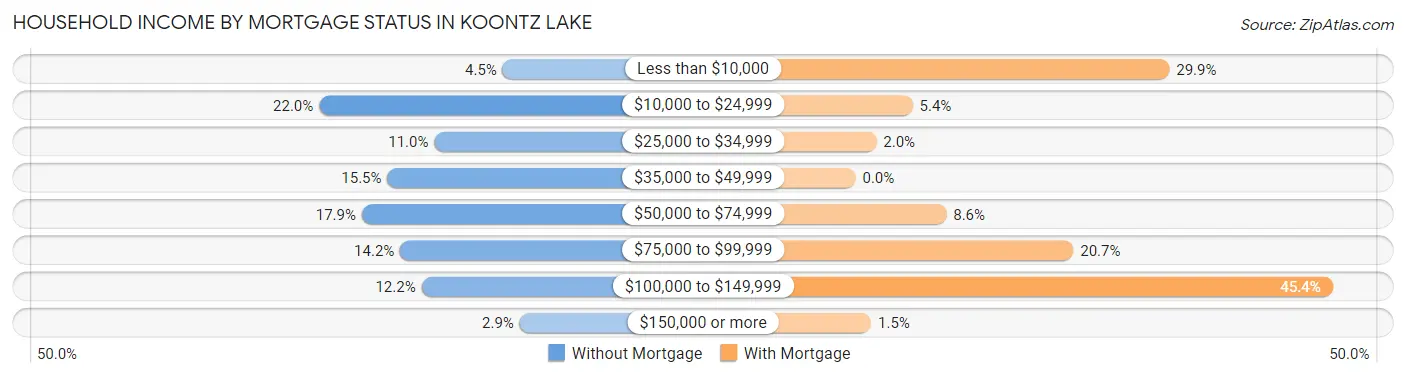
| Household Income | Without Mortgage | With Mortgage |
| Less than $10,000 | 11 (4.5%) | 121 (29.9%) |
| $10,000 to $24,999 | 54 (22.0%) | 22 (5.4%) |
| $25,000 to $34,999 | 27 (11.0%) | 8 (2.0%) |
| $35,000 to $49,999 | 38 (15.4%) | 0 (0.0%) |
| $50,000 to $74,999 | 44 (17.9%) | 35 (8.6%) |
| $75,000 to $99,999 | 35 (14.2%) | 84 (20.7%) |
| $100,000 to $149,999 | 30 (12.2%) | 184 (45.4%) |
| $150,000 or more | 7 (2.9%) | 6 (1.5%) |
| Total | 246 (100.0%) | 405 (100.0%) |
Property Value to Household Income Ratio in Koontz Lake
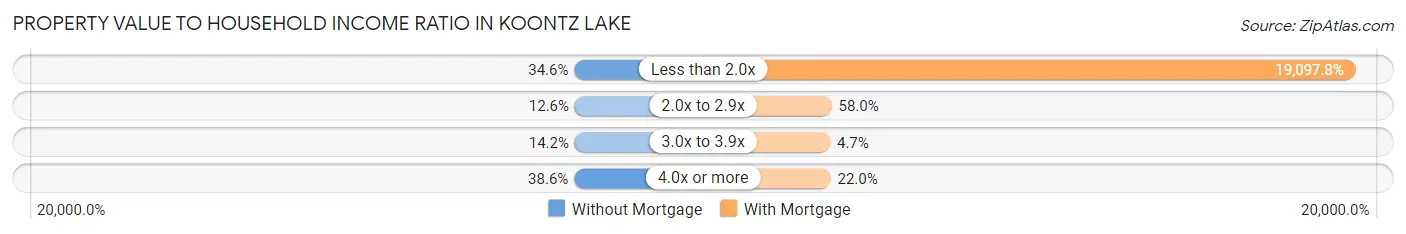
| Value-to-Income Ratio | Without Mortgage | With Mortgage |
| Less than 2.0x | 85 (34.5%) | 77,346 (19,097.8%) |
| 2.0x to 2.9x | 31 (12.6%) | 235 (58.0%) |
| 3.0x to 3.9x | 35 (14.2%) | 19 (4.7%) |
| 4.0x or more | 95 (38.6%) | 89 (22.0%) |
| Total | 246 (100.0%) | 405 (100.0%) |
Real Estate Taxes by Mortgage Status in Koontz Lake
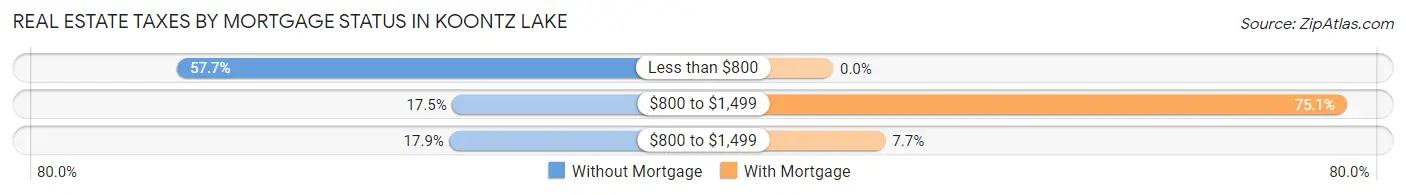
| Property Taxes | Without Mortgage | With Mortgage |
| Less than $800 | 142 (57.7%) | 0 (0.0%) |
| $800 to $1,499 | 43 (17.5%) | 304 (75.1%) |
| $800 to $1,499 | 44 (17.9%) | 31 (7.6%) |
| Total | 246 (100.0%) | 405 (100.0%) |
Health & Disability in Koontz Lake
Health Insurance Coverage by Age in Koontz Lake
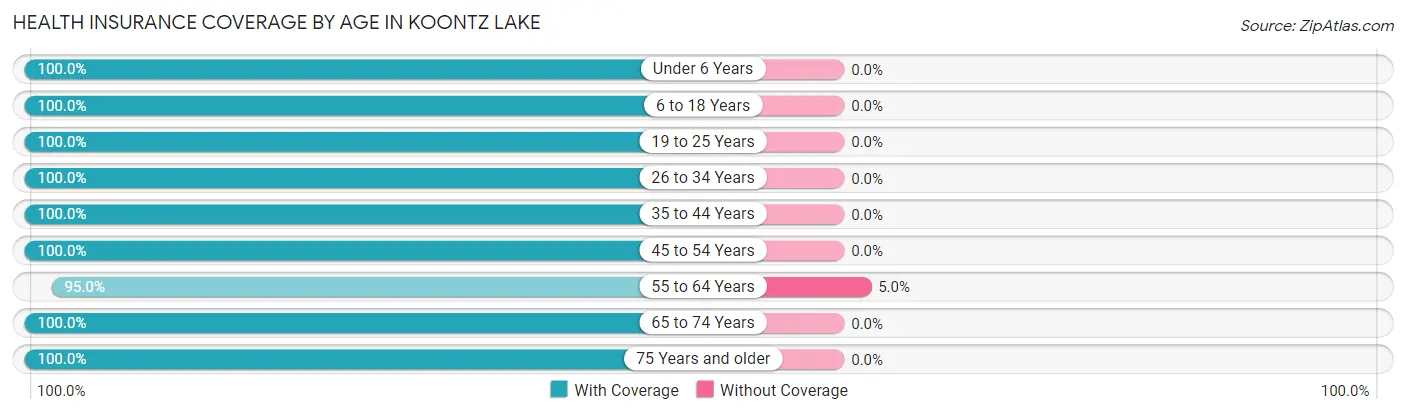
| Age Bracket | With Coverage | Without Coverage |
| Under 6 Years | 181 (100.0%) | 0 (0.0%) |
| 6 to 18 Years | 72 (100.0%) | 0 (0.0%) |
| 19 to 25 Years | 102 (100.0%) | 0 (0.0%) |
| 26 to 34 Years | 83 (100.0%) | 0 (0.0%) |
| 35 to 44 Years | 96 (100.0%) | 0 (0.0%) |
| 45 to 54 Years | 159 (100.0%) | 0 (0.0%) |
| 55 to 64 Years | 284 (95.0%) | 15 (5.0%) |
| 65 to 74 Years | 173 (100.0%) | 0 (0.0%) |
| 75 Years and older | 199 (100.0%) | 0 (0.0%) |
| Total | 1,349 (98.9%) | 15 (1.1%) |
Health Insurance Coverage by Citizenship Status in Koontz Lake
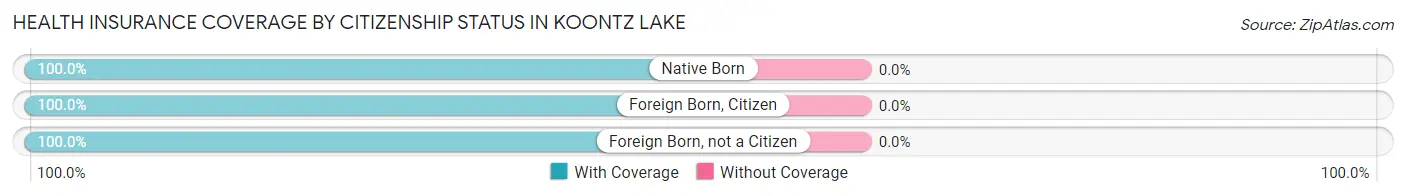
| Citizenship Status | With Coverage | Without Coverage |
| Native Born | 181 (100.0%) | 0 (0.0%) |
| Foreign Born, Citizen | 72 (100.0%) | 0 (0.0%) |
| Foreign Born, not a Citizen | 102 (100.0%) | 0 (0.0%) |
Health Insurance Coverage by Household Income in Koontz Lake
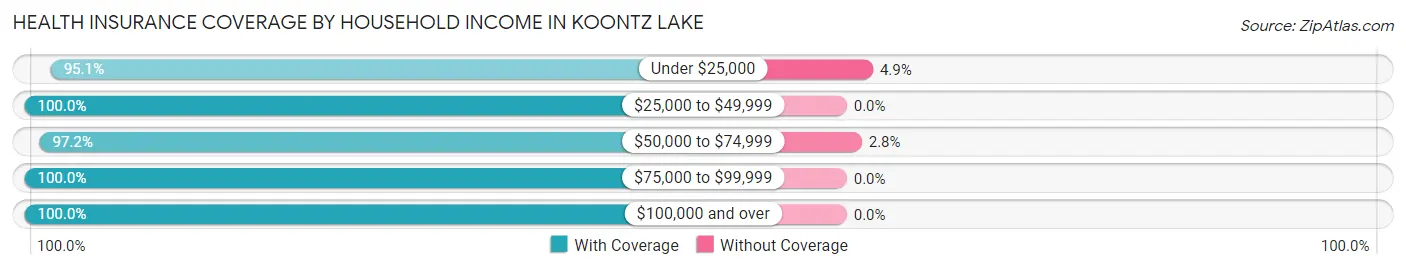
| Household Income | With Coverage | Without Coverage |
| Under $25,000 | 136 (95.1%) | 7 (4.9%) |
| $25,000 to $49,999 | 136 (100.0%) | 0 (0.0%) |
| $50,000 to $74,999 | 277 (97.2%) | 8 (2.8%) |
| $75,000 to $99,999 | 440 (100.0%) | 0 (0.0%) |
| $100,000 and over | 360 (100.0%) | 0 (0.0%) |
Public vs Private Health Insurance Coverage by Age in Koontz Lake
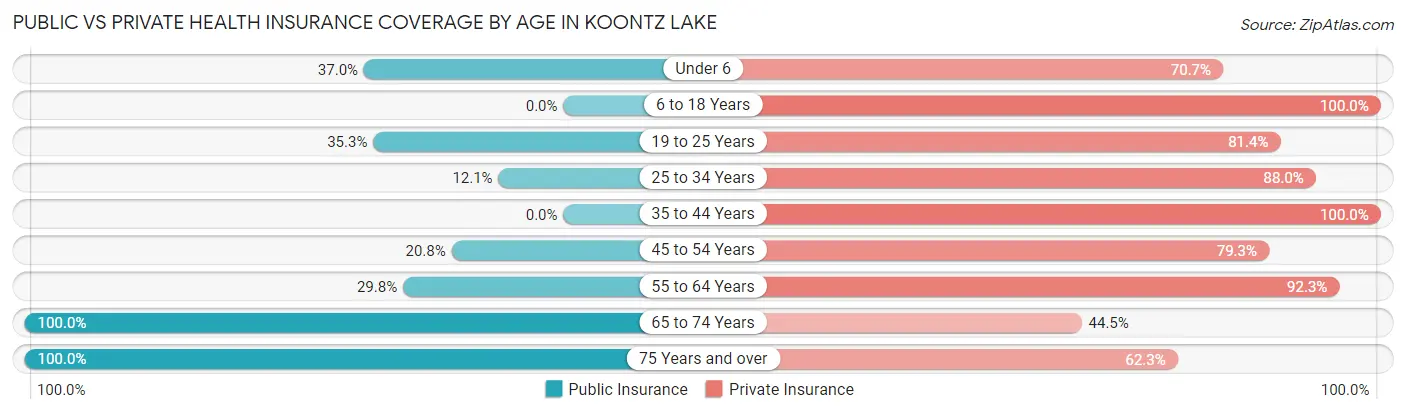
| Age Bracket | Public Insurance | Private Insurance |
| Under 6 | 67 (37.0%) | 128 (70.7%) |
| 6 to 18 Years | 0 (0.0%) | 72 (100.0%) |
| 19 to 25 Years | 36 (35.3%) | 83 (81.4%) |
| 25 to 34 Years | 10 (12.0%) | 73 (87.9%) |
| 35 to 44 Years | 0 (0.0%) | 96 (100.0%) |
| 45 to 54 Years | 33 (20.7%) | 126 (79.2%) |
| 55 to 64 Years | 89 (29.8%) | 276 (92.3%) |
| 65 to 74 Years | 173 (100.0%) | 77 (44.5%) |
| 75 Years and over | 199 (100.0%) | 124 (62.3%) |
| Total | 607 (44.5%) | 1,055 (77.3%) |
Disability Status by Sex by Age in Koontz Lake
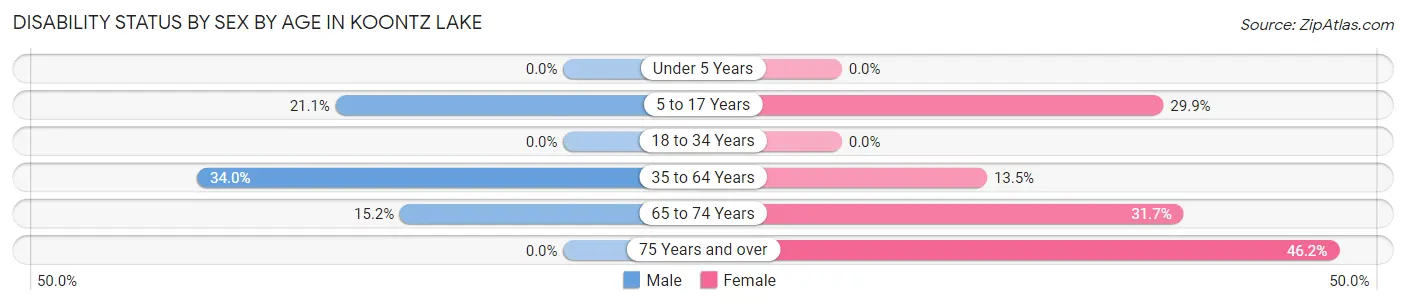
| Age Bracket | Male | Female |
| Under 5 Years | 0 (0.0%) | 0 (0.0%) |
| 5 to 17 Years | 15 (21.1%) | 20 (29.8%) |
| 18 to 34 Years | 0 (0.0%) | 0 (0.0%) |
| 35 to 64 Years | 105 (34.0%) | 33 (13.5%) |
| 65 to 74 Years | 20 (15.1%) | 13 (31.7%) |
| 75 Years and over | 0 (0.0%) | 60 (46.2%) |
Disability Class by Sex by Age in Koontz Lake
Disability Class: Hearing Difficulty
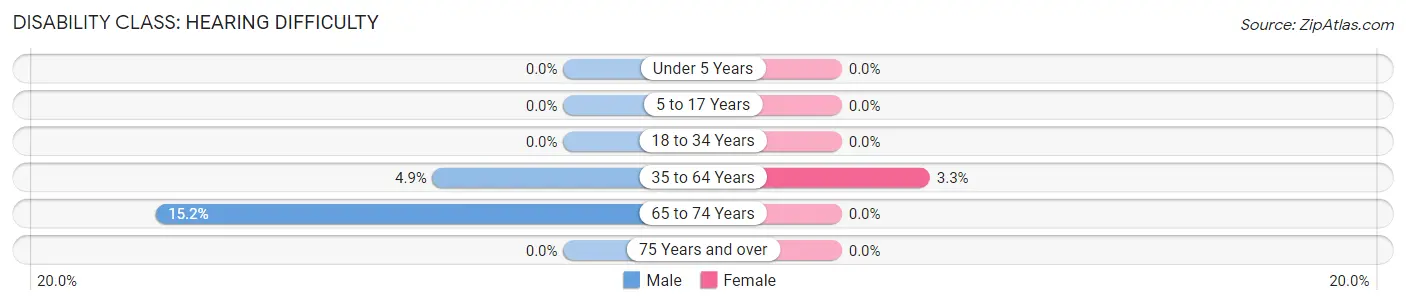
| Age Bracket | Male | Female |
| Under 5 Years | 0 (0.0%) | 0 (0.0%) |
| 5 to 17 Years | 0 (0.0%) | 0 (0.0%) |
| 18 to 34 Years | 0 (0.0%) | 0 (0.0%) |
| 35 to 64 Years | 15 (4.9%) | 8 (3.3%) |
| 65 to 74 Years | 20 (15.1%) | 0 (0.0%) |
| 75 Years and over | 0 (0.0%) | 0 (0.0%) |
Disability Class: Vision Difficulty
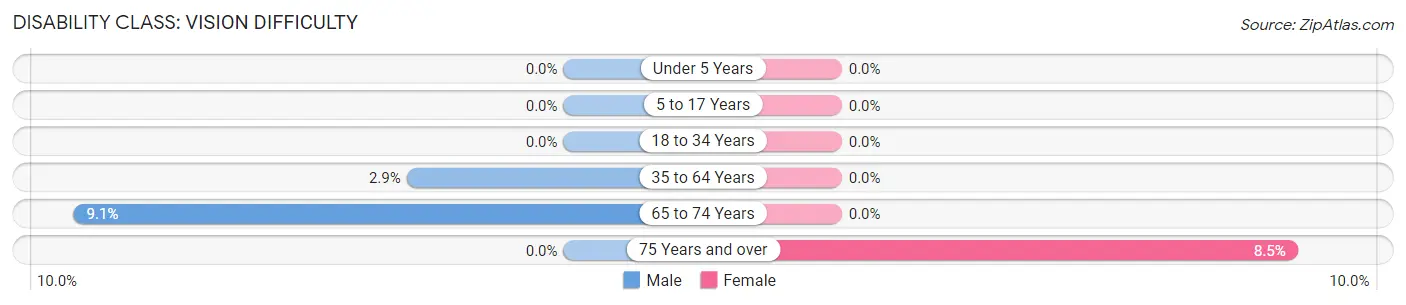
| Age Bracket | Male | Female |
| Under 5 Years | 0 (0.0%) | 0 (0.0%) |
| 5 to 17 Years | 0 (0.0%) | 0 (0.0%) |
| 18 to 34 Years | 0 (0.0%) | 0 (0.0%) |
| 35 to 64 Years | 9 (2.9%) | 0 (0.0%) |
| 65 to 74 Years | 12 (9.1%) | 0 (0.0%) |
| 75 Years and over | 0 (0.0%) | 11 (8.5%) |
Disability Class: Cognitive Difficulty
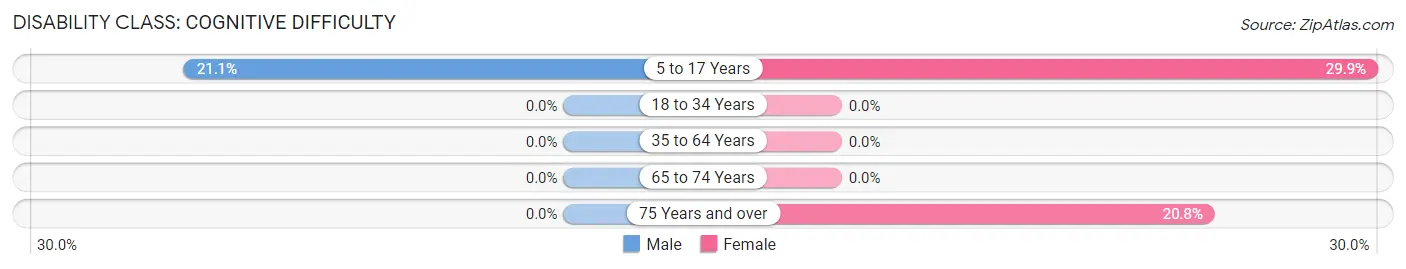
| Age Bracket | Male | Female |
| 5 to 17 Years | 15 (21.1%) | 20 (29.8%) |
| 18 to 34 Years | 0 (0.0%) | 0 (0.0%) |
| 35 to 64 Years | 0 (0.0%) | 0 (0.0%) |
| 65 to 74 Years | 0 (0.0%) | 0 (0.0%) |
| 75 Years and over | 0 (0.0%) | 27 (20.8%) |
Disability Class: Ambulatory Difficulty
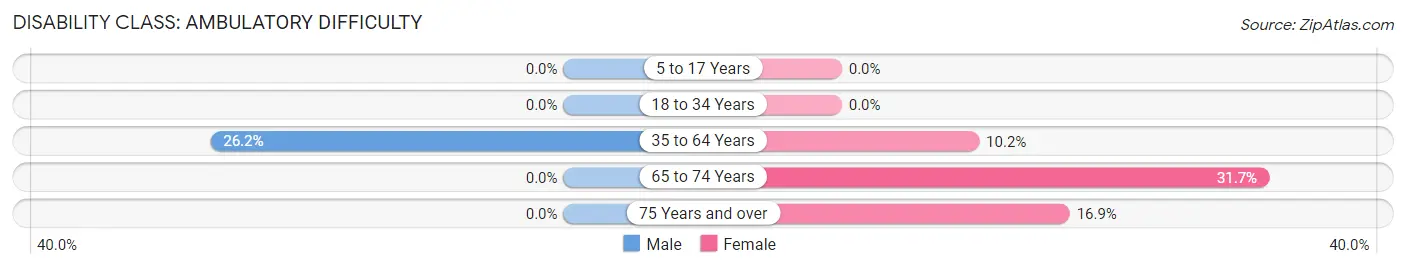
| Age Bracket | Male | Female |
| 5 to 17 Years | 0 (0.0%) | 0 (0.0%) |
| 18 to 34 Years | 0 (0.0%) | 0 (0.0%) |
| 35 to 64 Years | 81 (26.2%) | 25 (10.2%) |
| 65 to 74 Years | 0 (0.0%) | 13 (31.7%) |
| 75 Years and over | 0 (0.0%) | 22 (16.9%) |
Disability Class: Self-Care Difficulty
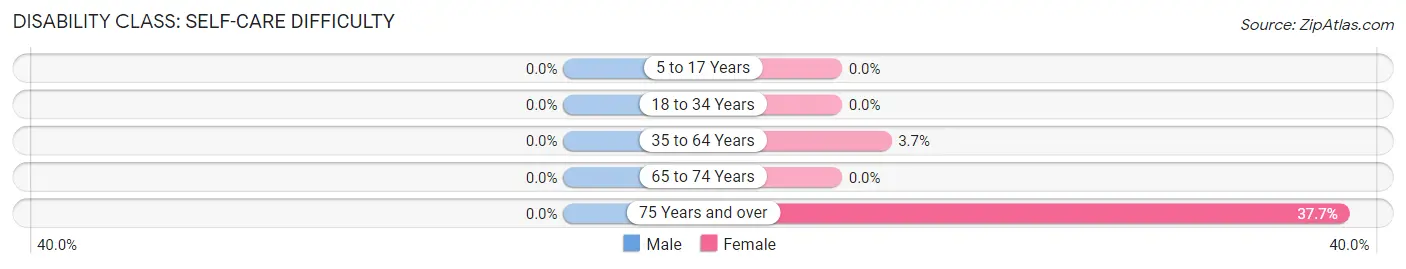
| Age Bracket | Male | Female |
| 5 to 17 Years | 0 (0.0%) | 0 (0.0%) |
| 18 to 34 Years | 0 (0.0%) | 0 (0.0%) |
| 35 to 64 Years | 0 (0.0%) | 9 (3.7%) |
| 65 to 74 Years | 0 (0.0%) | 0 (0.0%) |
| 75 Years and over | 0 (0.0%) | 49 (37.7%) |
Technology Access in Koontz Lake
Computing Device Access in Koontz Lake
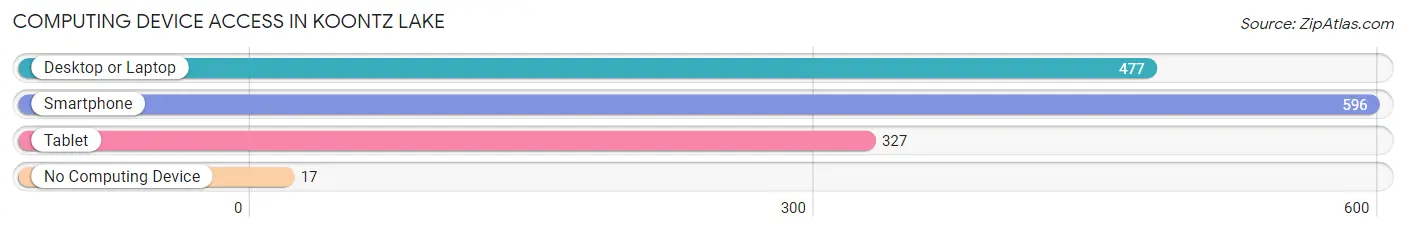
| Device Type | # Households | % Households |
| Desktop or Laptop | 477 | 67.7% |
| Smartphone | 596 | 84.5% |
| Tablet | 327 | 46.4% |
| No Computing Device | 17 | 2.4% |
| Total | 705 | 100.0% |
Internet Access in Koontz Lake
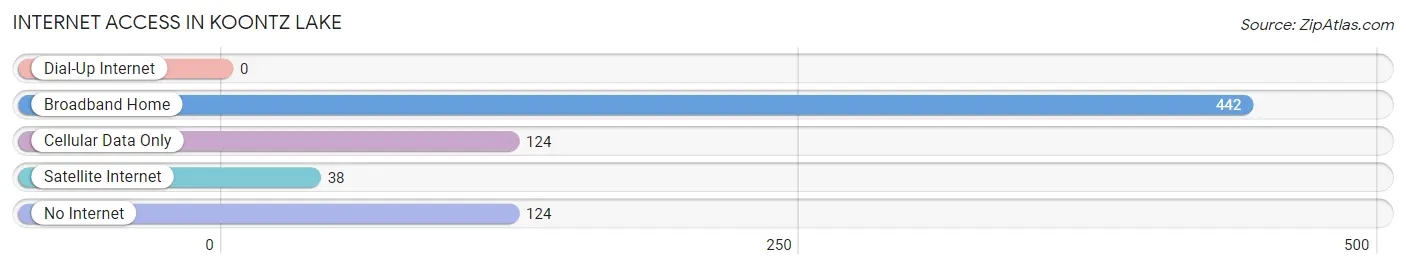
| Internet Type | # Households | % Households |
| Dial-Up Internet | 0 | 0.0% |
| Broadband Home | 442 | 62.7% |
| Cellular Data Only | 124 | 17.6% |
| Satellite Internet | 38 | 5.4% |
| No Internet | 124 | 17.6% |
| Total | 705 | 100.0% |
Koontz Lake Summary
Koontz Lake is a small unincorporated community located in the northern part of Starke County, Indiana. It is situated on the banks of Koontz Lake, a natural lake that was created by a glacier during the last ice age. The lake is approximately 1,000 acres in size and is a popular destination for fishing, boating, and swimming.
History
Koontz Lake was first settled in the early 1800s by a group of German immigrants. The area was originally known as “Kuntz’s Lake” after the family that first settled there. The name was eventually changed to Koontz Lake in the late 1800s.
The area was primarily used for farming and logging until the early 1900s when the first resort was built on the lake. The resort, known as Koontz Lake Resort, was a popular destination for fishing and boating. The resort was eventually sold in the 1950s and the new owners renamed it Koontz Lake Inn.
The area has remained a popular destination for fishing, boating, and swimming ever since. In recent years, the area has become a popular destination for camping, hiking, and other outdoor activities.
Geography
Koontz Lake is located in the northern part of Starke County, Indiana. It is situated on the banks of Koontz Lake, a natural lake that was created by a glacier during the last ice age. The lake is approximately 1,000 acres in size and is a popular destination for fishing, boating, and swimming.
The area is mostly flat with some rolling hills. The terrain is mostly wooded with some open fields. The area is home to a variety of wildlife including deer, turkey, and other small game.
Economy
The economy of Koontz Lake is largely based on tourism. The area is a popular destination for fishing, boating, and other outdoor activities. The area is also home to several small businesses including restaurants, convenience stores, and other retail establishments.
Demographics
As of the 2010 census, the population of Koontz Lake was 1,072. The population is primarily white (97.2%) with a small percentage of African American (1.2%) and Hispanic (1.6%) residents. The median household income is $45,000 and the median home value is $125,000.
Conclusion
Koontz Lake is a small unincorporated community located in the northern part of Starke County, Indiana. It is situated on the banks of Koontz Lake, a natural lake that was created by a glacier during the last ice age. The area is a popular destination for fishing, boating, and other outdoor activities. The economy of Koontz Lake is largely based on tourism and the area is home to a variety of small businesses. The population of Koontz Lake is primarily white with a small percentage of African American and Hispanic residents.
Common Questions
What is Per Capita Income in Koontz Lake?
Per Capita income in Koontz Lake is $40,285.
What is the Median Family Income in Koontz Lake?
Median Family Income in Koontz Lake is $90,085.
What is the Median Household income in Koontz Lake?
Median Household Income in Koontz Lake is $68,875.
What is Income or Wage Gap in Koontz Lake?
Income or Wage Gap in Koontz Lake is 44.2%.
Women in Koontz Lake earn 55.8 cents for every dollar earned by a man.
What is Inequality or Gini Index in Koontz Lake?
Inequality or Gini Index in Koontz Lake is 0.42.
What is the Total Population of Koontz Lake?
Total Population of Koontz Lake is 1,364.
What is the Total Male Population of Koontz Lake?
Total Male Population of Koontz Lake is 713.
What is the Total Female Population of Koontz Lake?
Total Female Population of Koontz Lake is 651.
What is the Ratio of Males per 100 Females in Koontz Lake?
There are 109.52 Males per 100 Females in Koontz Lake.
What is the Ratio of Females per 100 Males in Koontz Lake?
There are 91.30 Females per 100 Males in Koontz Lake.
What is the Median Population Age in Koontz Lake?
Median Population Age in Koontz Lake is 54.4 Years.
What is the Average Family Size in Koontz Lake
Average Family Size in Koontz Lake is 2.7 People.
What is the Average Household Size in Koontz Lake
Average Household Size in Koontz Lake is 1.9 People.
How Large is the Labor Force in Koontz Lake?
There are 591 People in the Labor Forcein in Koontz Lake.
What is the Percentage of People in the Labor Force in Koontz Lake?
52.1% of People are in the Labor Force in Koontz Lake.
What is the Unemployment Rate in Koontz Lake?
Unemployment Rate in Koontz Lake is 8.1%.