Galena, IN Map & Demographics
Galena Map
Galena Overview
$38,606
PER CAPITA INCOME
$105,960
AVG FAMILY INCOME
$105,379
AVG HOUSEHOLD INCOME
50.9%
WAGE / INCOME GAP [ % ]
49.1¢/ $1
WAGE / INCOME GAP [ $ ]
0.33
INEQUALITY / GINI INDEX
1,526
TOTAL POPULATION
770
MALE POPULATION
756
FEMALE POPULATION
101.85
MALES / 100 FEMALES
98.18
FEMALES / 100 MALES
39.9
MEDIAN AGE
3.3
AVG FAMILY SIZE
3.1
AVG HOUSEHOLD SIZE
755
LABOR FORCE [ PEOPLE ]
69.1%
PERCENT IN LABOR FORCE
4.9%
UNEMPLOYMENT RATE
Galena Area Codes
Income in Galena
Income Overview in Galena
Per Capita Income in Galena is $38,606, while median incomes of families and households are $105,960 and $105,379 respectively.
| Characteristic | Number | Measure |
| Per Capita Income | 1,526 | $38,606 |
| Median Family Income | 437 | $105,960 |
| Mean Family Income | 437 | $124,392 |
| Median Household Income | 489 | $105,379 |
| Mean Household Income | 489 | $118,961 |
| Income Deficit | 437 | $0 |
| Wage / Income Gap (%) | 1,526 | 50.94% |
| Wage / Income Gap ($) | 1,526 | 49.06¢ per $1 |
| Gini / Inequality Index | 1,526 | 0.33 |
Earnings by Sex in Galena
Average Earnings in Galena are $45,164, $70,061 for men and $34,375 for women, a difference of 50.9%.
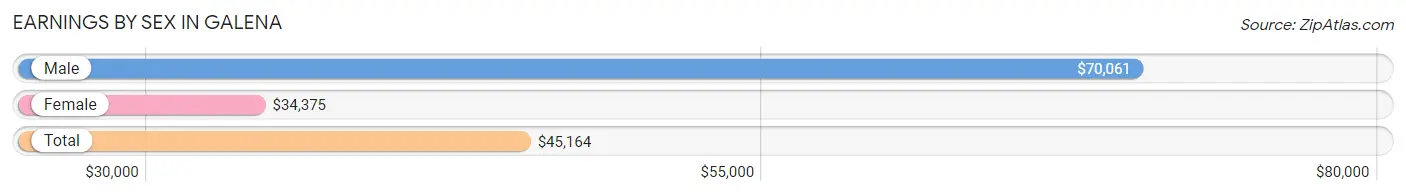
| Sex | Number | Average Earnings |
| Male | 402 (49.8%) | $70,061 |
| Female | 405 (50.2%) | $34,375 |
| Total | 807 (100.0%) | $45,164 |
Earnings by Sex by Income Bracket in Galena
The most common earnings brackets in Galena are $100,000+ for men (106 | 26.4%) and $30,000 to $34,999 for women (70 | 17.3%).
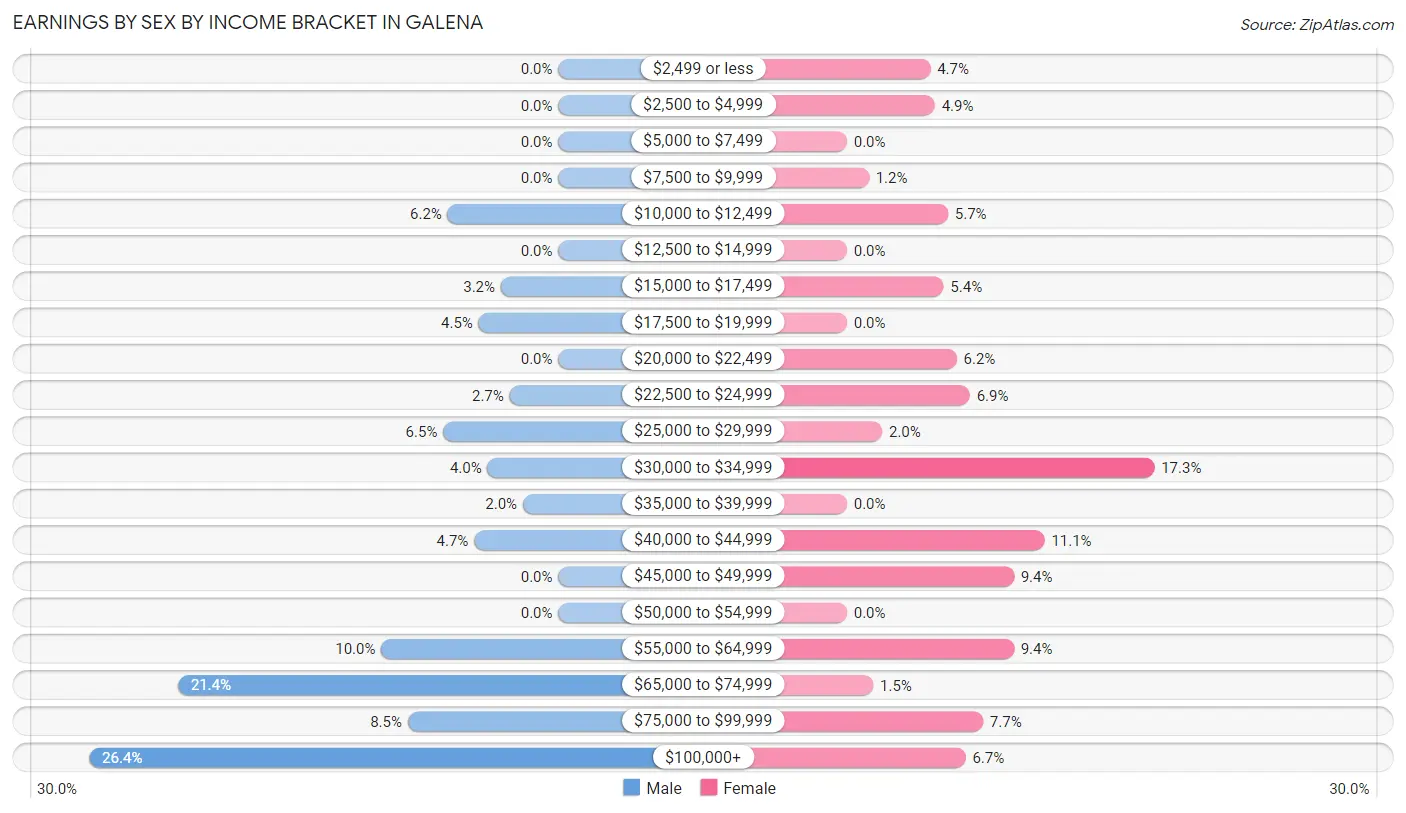
| Income | Male | Female |
| $2,499 or less | 0 (0.0%) | 19 (4.7%) |
| $2,500 to $4,999 | 0 (0.0%) | 20 (4.9%) |
| $5,000 to $7,499 | 0 (0.0%) | 0 (0.0%) |
| $7,500 to $9,999 | 0 (0.0%) | 5 (1.2%) |
| $10,000 to $12,499 | 25 (6.2%) | 23 (5.7%) |
| $12,500 to $14,999 | 0 (0.0%) | 0 (0.0%) |
| $15,000 to $17,499 | 13 (3.2%) | 22 (5.4%) |
| $17,500 to $19,999 | 18 (4.5%) | 0 (0.0%) |
| $20,000 to $22,499 | 0 (0.0%) | 25 (6.2%) |
| $22,500 to $24,999 | 11 (2.7%) | 28 (6.9%) |
| $25,000 to $29,999 | 26 (6.5%) | 8 (2.0%) |
| $30,000 to $34,999 | 16 (4.0%) | 70 (17.3%) |
| $35,000 to $39,999 | 8 (2.0%) | 0 (0.0%) |
| $40,000 to $44,999 | 19 (4.7%) | 45 (11.1%) |
| $45,000 to $49,999 | 0 (0.0%) | 38 (9.4%) |
| $50,000 to $54,999 | 0 (0.0%) | 0 (0.0%) |
| $55,000 to $64,999 | 40 (10.0%) | 38 (9.4%) |
| $65,000 to $74,999 | 86 (21.4%) | 6 (1.5%) |
| $75,000 to $99,999 | 34 (8.5%) | 31 (7.6%) |
| $100,000+ | 106 (26.4%) | 27 (6.7%) |
| Total | 402 (100.0%) | 405 (100.0%) |
Earnings by Sex by Educational Attainment in Galena
Average earnings in Galena are $71,189 for men and $34,896 for women, a difference of 51.0%. Men with an educational attainment of bachelor's degree enjoy the highest average annual earnings of $73,917, while those with high school diploma education earn the least with $70,823. Women with an educational attainment of bachelor's degree earn the most with the average annual earnings of $63,611, while those with high school diploma education have the smallest earnings of $24,911.
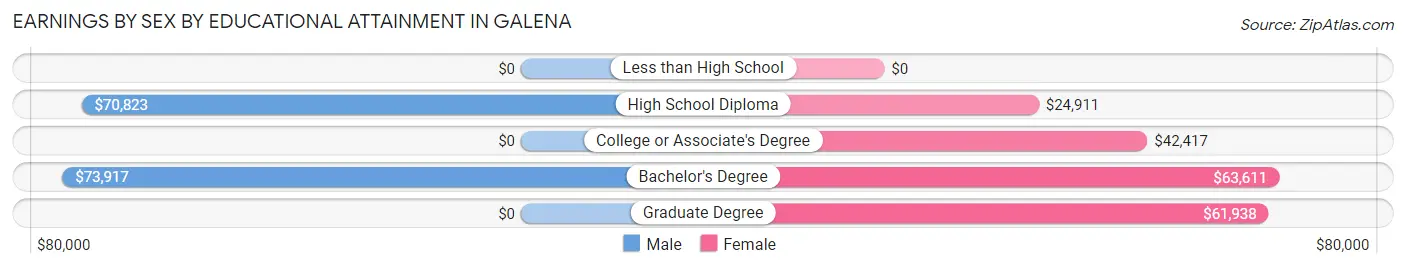
| Educational Attainment | Male Income | Female Income |
| Less than High School | - | - |
| High School Diploma | $70,823 | $24,911 |
| College or Associate's Degree | - | - |
| Bachelor's Degree | $73,917 | $63,611 |
| Graduate Degree | - | - |
| Total | $71,189 | $34,896 |
Family Income in Galena
Family Income Brackets in Galena
According to the Galena family income data, there are 120 families falling into the $100,000 to $149,999 income range, which is the most common income bracket and makes up 27.5% of all families.
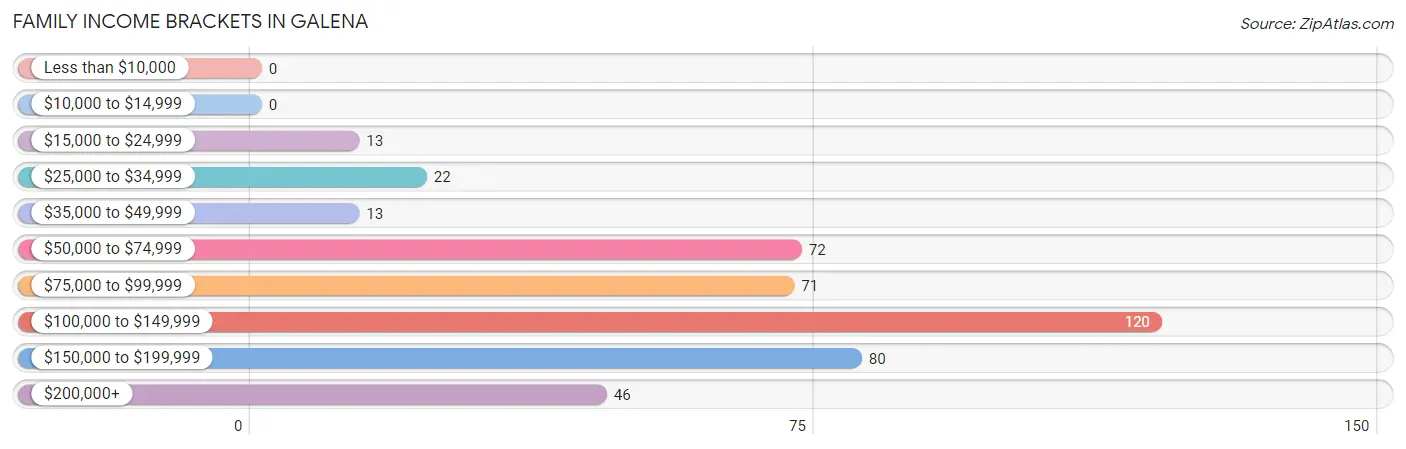
| Income Bracket | # Families | % Families |
| Less than $10,000 | 0 | 0.0% |
| $10,000 to $14,999 | 0 | 0.0% |
| $15,000 to $24,999 | 13 | 3.0% |
| $25,000 to $34,999 | 22 | 5.0% |
| $35,000 to $49,999 | 13 | 3.0% |
| $50,000 to $74,999 | 72 | 16.5% |
| $75,000 to $99,999 | 71 | 16.2% |
| $100,000 to $149,999 | 120 | 27.5% |
| $150,000 to $199,999 | 80 | 18.3% |
| $200,000+ | 46 | 10.5% |
Family Income by Famaliy Size in Galena
3-person families (97 | 22.2%) account for the highest median family income in Galena with $128,047 per family, while 2-person families (183 | 41.9%) have the highest median income of $44,618 per family member.
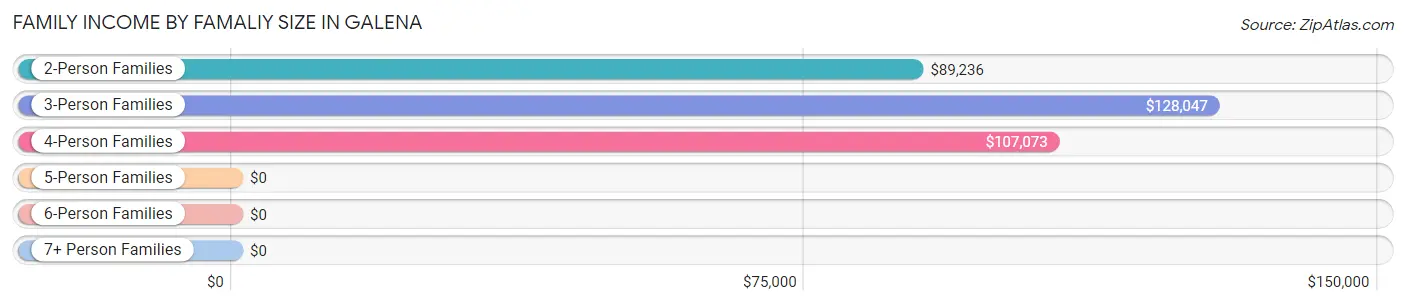
| Income Bracket | # Families | Median Income |
| 2-Person Families | 183 (41.9%) | $89,236 |
| 3-Person Families | 97 (22.2%) | $128,047 |
| 4-Person Families | 126 (28.8%) | $107,073 |
| 5-Person Families | 16 (3.7%) | $0 |
| 6-Person Families | 0 (0.0%) | $0 |
| 7+ Person Families | 15 (3.4%) | $0 |
| Total | 437 (100.0%) | $105,960 |
Family Income by Number of Earners in Galena
The median family income in Galena is $105,960, with families comprising 3+ earners (71) having the highest median family income of $195,069, while families with 1 earner (113) have the lowest median family income of $70,179, accounting for 16.3% and 25.9% of families, respectively.
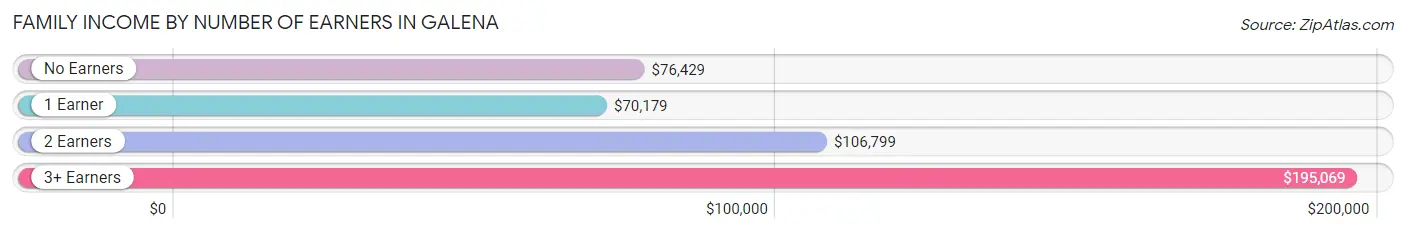
| Number of Earners | # Families | Median Income |
| No Earners | 34 (7.8%) | $76,429 |
| 1 Earner | 113 (25.9%) | $70,179 |
| 2 Earners | 219 (50.1%) | $106,799 |
| 3+ Earners | 71 (16.3%) | $195,069 |
| Total | 437 (100.0%) | $105,960 |
Household Income in Galena
Household Income Brackets in Galena
With 126 households falling in the category, the $100,000 to $149,999 income range is the most frequent in Galena, accounting for 25.8% of all households.
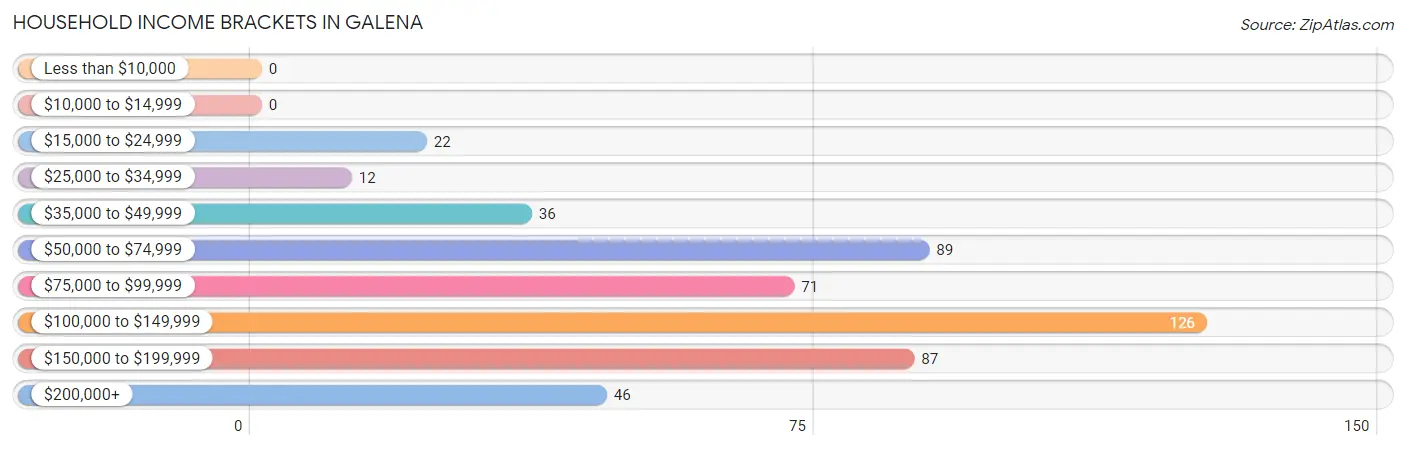
| Income Bracket | # Households | % Households |
| Less than $10,000 | 0 | 0.0% |
| $10,000 to $14,999 | 0 | 0.0% |
| $15,000 to $24,999 | 22 | 4.5% |
| $25,000 to $34,999 | 12 | 2.5% |
| $35,000 to $49,999 | 36 | 7.4% |
| $50,000 to $74,999 | 89 | 18.2% |
| $75,000 to $99,999 | 71 | 14.5% |
| $100,000 to $149,999 | 126 | 25.8% |
| $150,000 to $199,999 | 87 | 17.8% |
| $200,000+ | 46 | 9.4% |
Household Income by Householder Age in Galena
The median household income in Galena is $105,379, with the highest median household income of $129,688 found in the 45 to 64 years age bracket for the primary householder. A total of 216 households (44.2%) fall into this category. Meanwhile, the 15 to 24 years age bracket for the primary householder has the lowest median household income of $0, with 10 households (2.0%) in this group.
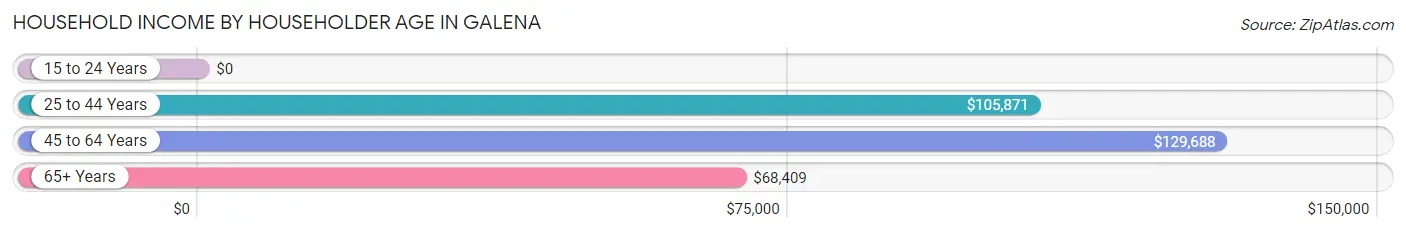
| Income Bracket | # Households | Median Income |
| 15 to 24 Years | 10 (2.0%) | $0 |
| 25 to 44 Years | 153 (31.3%) | $105,871 |
| 45 to 64 Years | 216 (44.2%) | $129,688 |
| 65+ Years | 110 (22.5%) | $68,409 |
| Total | 489 (100.0%) | $105,379 |
Poverty in Galena
Income Below Poverty by Sex and Age in Galena
| Age Bracket | Male | Female |
| Under 5 Years | 0 (0.0%) | 0 (0.0%) |
| 5 Years | 0 (0.0%) | 0 (0.0%) |
| 6 to 11 Years | 0 (0.0%) | 0 (0.0%) |
| 12 to 14 Years | 0 (0.0%) | 0 (0.0%) |
| 15 Years | 0 (0.0%) | 0 (0.0%) |
| 16 and 17 Years | 0 (0.0%) | 0 (0.0%) |
| 18 to 24 Years | 0 (0.0%) | 0 (0.0%) |
| 25 to 34 Years | 0 (0.0%) | 0 (0.0%) |
| 35 to 44 Years | 0 (0.0%) | 0 (0.0%) |
| 45 to 54 Years | 0 (0.0%) | 0 (0.0%) |
| 55 to 64 Years | 0 (0.0%) | 0 (0.0%) |
| 65 to 74 Years | 0 (0.0%) | 0 (0.0%) |
| 75 Years and over | 0 (0.0%) | 0 (0.0%) |
| Total | 0 (0.0%) | 0 (0.0%) |
Income Above Poverty by Sex and Age in Galena
According to the poverty statistics in Galena, males aged under 5 years and females aged under 5 years are the age groups that are most secure financially, with 100.0% of males and 100.0% of females in these age groups living above the poverty line.
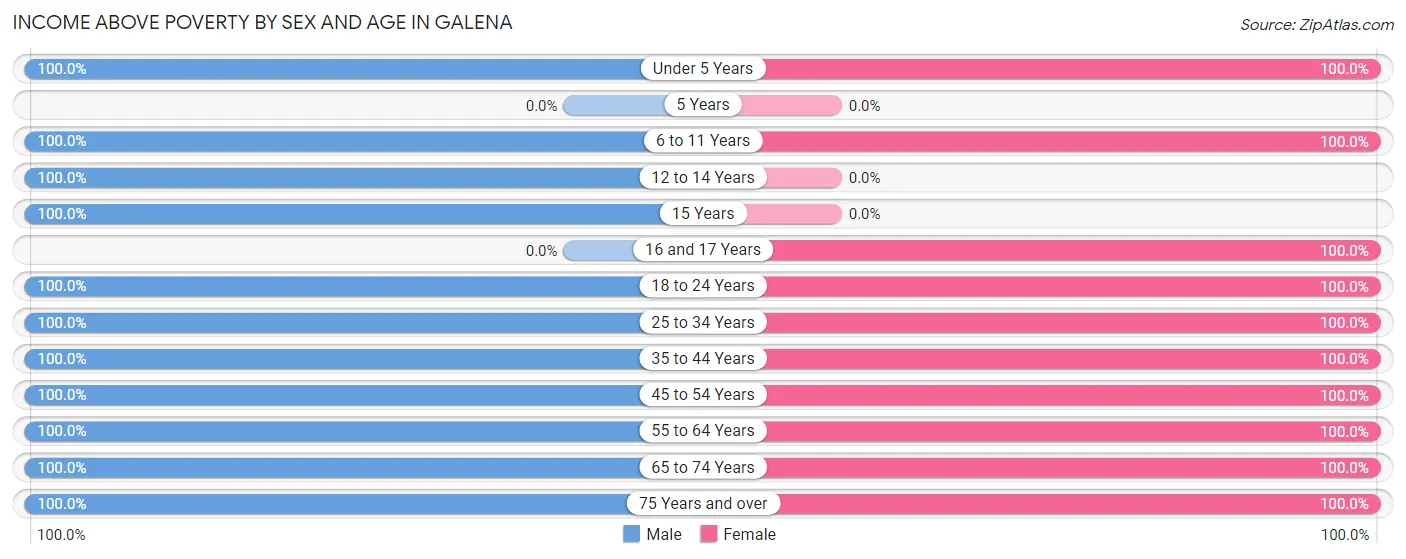
| Age Bracket | Male | Female |
| Under 5 Years | 81 (100.0%) | 31 (100.0%) |
| 5 Years | 0 (0.0%) | 0 (0.0%) |
| 6 to 11 Years | 114 (100.0%) | 138 (100.0%) |
| 12 to 14 Years | 42 (100.0%) | 0 (0.0%) |
| 15 Years | 19 (100.0%) | 0 (0.0%) |
| 16 and 17 Years | 0 (0.0%) | 27 (100.0%) |
| 18 to 24 Years | 37 (100.0%) | 10 (100.0%) |
| 25 to 34 Years | 118 (100.0%) | 81 (100.0%) |
| 35 to 44 Years | 91 (100.0%) | 91 (100.0%) |
| 45 to 54 Years | 102 (100.0%) | 122 (100.0%) |
| 55 to 64 Years | 74 (100.0%) | 136 (100.0%) |
| 65 to 74 Years | 38 (100.0%) | 75 (100.0%) |
| 75 Years and over | 54 (100.0%) | 37 (100.0%) |
| Total | 770 (100.0%) | 748 (100.0%) |
Income Below Poverty Among Married-Couple Families in Galena
| Children | Above Poverty | Below Poverty |
| No Children | 188 (100.0%) | 0 (0.0%) |
| 1 or 2 Children | 150 (100.0%) | 0 (0.0%) |
| 3 or 4 Children | 31 (100.0%) | 0 (0.0%) |
| 5 or more Children | 0 (0.0%) | 0 (0.0%) |
| Total | 369 (100.0%) | 0 (0.0%) |
Income Below Poverty Among Single-Parent Households in Galena
| Children | Single Father | Single Mother |
| No Children | 0 (0.0%) | 0 (0.0%) |
| 1 or 2 Children | 0 (0.0%) | 0 (0.0%) |
| 3 or 4 Children | 0 (0.0%) | 0 (0.0%) |
| 5 or more Children | 0 (0.0%) | 0 (0.0%) |
| Total | 0 (0.0%) | 0 (0.0%) |
Income Below Poverty Among Married-Couple vs Single-Parent Households in Galena
| Children | Married-Couple Families | Single-Parent Households |
| No Children | 0 (0.0%) | 0 (0.0%) |
| 1 or 2 Children | 0 (0.0%) | 0 (0.0%) |
| 3 or 4 Children | 0 (0.0%) | 0 (0.0%) |
| 5 or more Children | 0 (0.0%) | 0 (0.0%) |
| Total | 0 (0.0%) | 0 (0.0%) |
Race in Galena
The most populous races in Galena are White / Caucasian (1,451 | 95.1%), Two or more Races (65 | 4.3%), and Hispanic or Latino (47 | 3.1%).
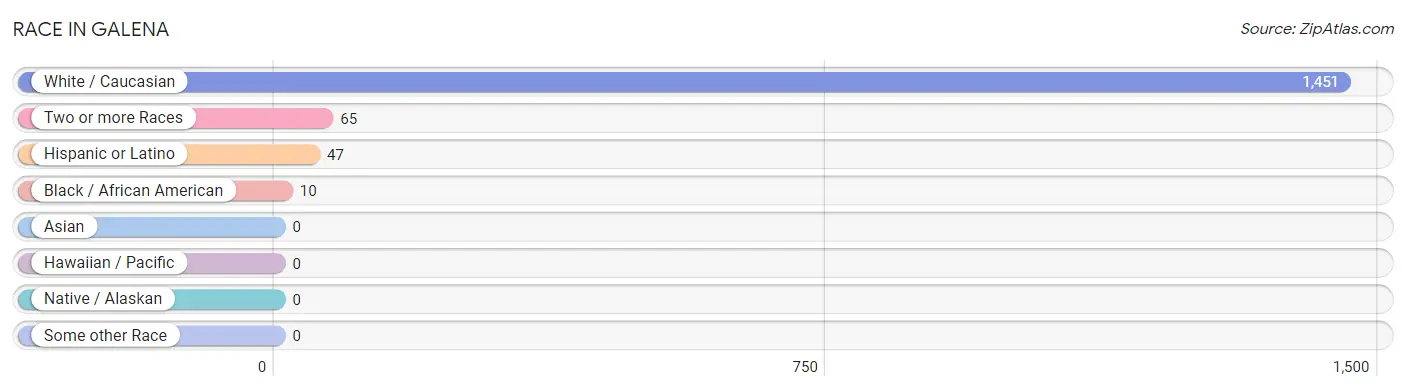
| Race | # Population | % Population |
| Asian | 0 | 0.0% |
| Black / African American | 10 | 0.7% |
| Hawaiian / Pacific | 0 | 0.0% |
| Hispanic or Latino | 47 | 3.1% |
| Native / Alaskan | 0 | 0.0% |
| White / Caucasian | 1,451 | 95.1% |
| Two or more Races | 65 | 4.3% |
| Some other Race | 0 | 0.0% |
| Total | 1,526 | 100.0% |
Ancestry in Galena
The most populous ancestries reported in Galena are German (372 | 24.4%), English (169 | 11.1%), Italian (91 | 6.0%), Irish (89 | 5.8%), and European (74 | 4.9%), together accounting for 52.1% of all Galena residents.
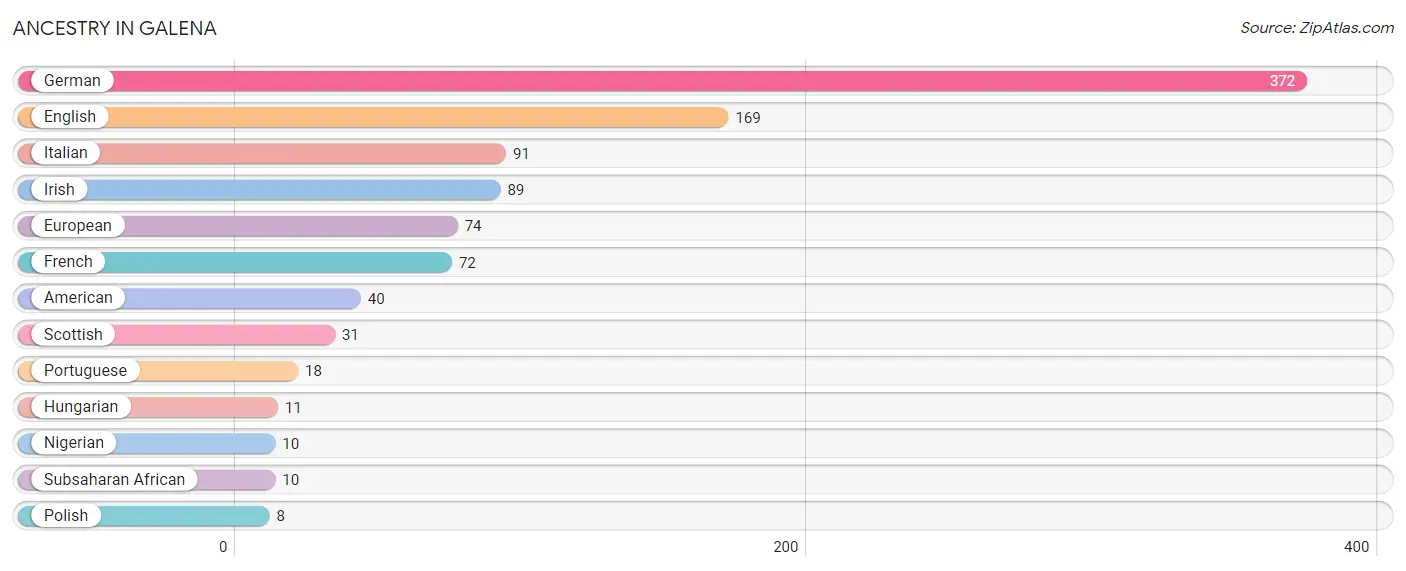
| Ancestry | # Population | % Population |
| American | 40 | 2.6% |
| English | 169 | 11.1% |
| European | 74 | 4.9% |
| French | 72 | 4.7% |
| German | 372 | 24.4% |
| Hungarian | 11 | 0.7% |
| Irish | 89 | 5.8% |
| Italian | 91 | 6.0% |
| Nigerian | 10 | 0.7% |
| Polish | 8 | 0.5% |
| Portuguese | 18 | 1.2% |
| Scottish | 31 | 2.0% |
| Subsaharan African | 10 | 0.7% | View All 13 Rows |
Immigrants in Galena
The most numerous immigrant groups reported in Galena came from Brazil (18 | 1.2%), Latin America (18 | 1.2%), South America (18 | 1.2%), Europe (12 | 0.8%), and Germany (12 | 0.8%), together accounting for 5.1% of all Galena residents.
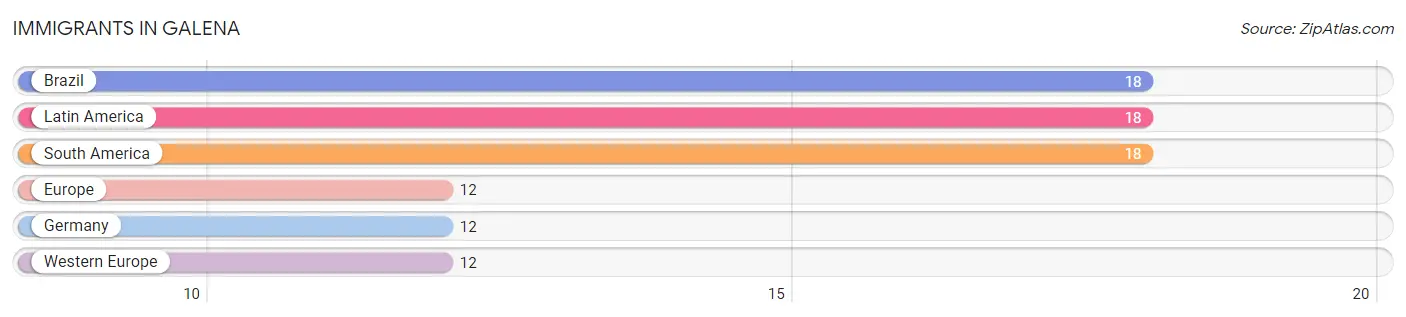
| Immigration Origin | # Population | % Population |
| Brazil | 18 | 1.2% |
| Europe | 12 | 0.8% |
| Germany | 12 | 0.8% |
| Latin America | 18 | 1.2% |
| South America | 18 | 1.2% |
| Western Europe | 12 | 0.8% | View All 6 Rows |
Sex and Age in Galena
Sex and Age in Galena
The most populous age groups in Galena are 10 to 14 Years (87 | 11.3%) for men and 5 to 9 Years (138 | 18.2%) for women.
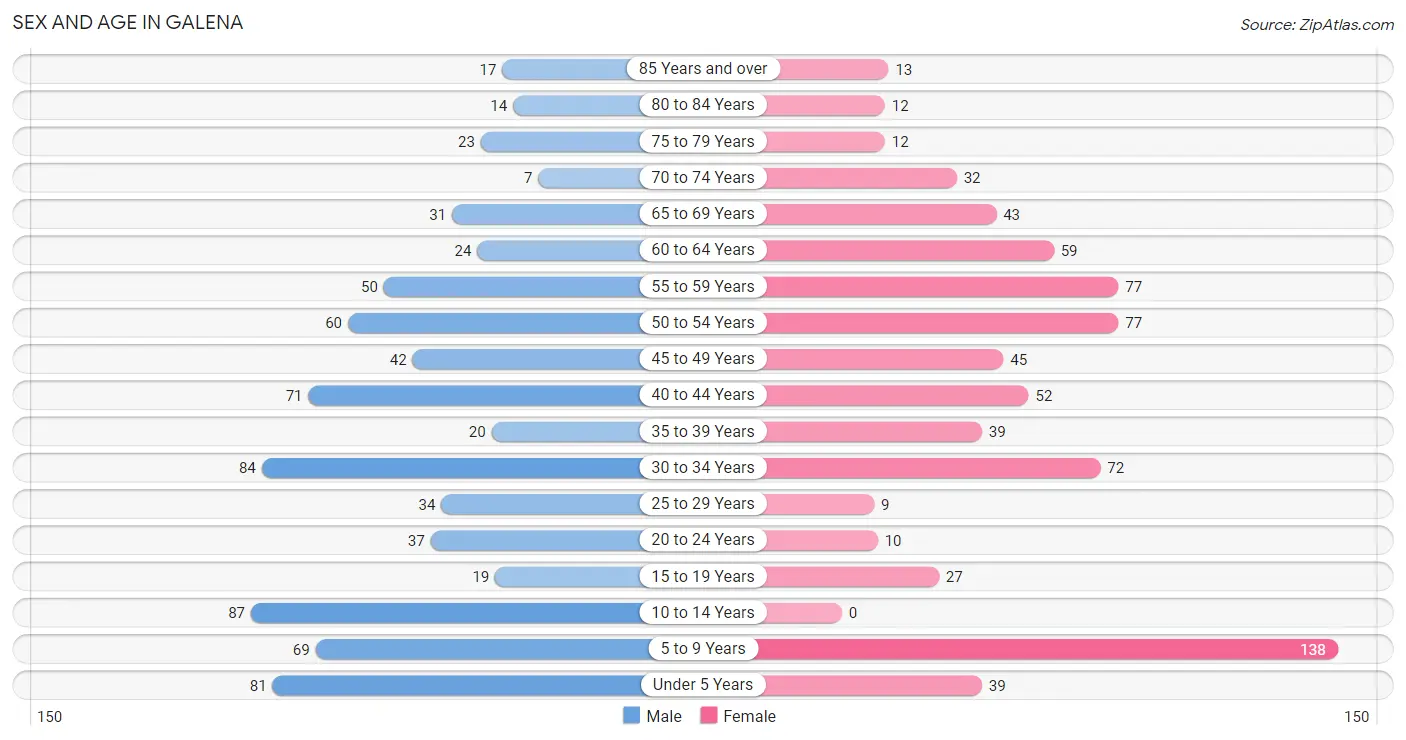
| Age Bracket | Male | Female |
| Under 5 Years | 81 (10.5%) | 39 (5.2%) |
| 5 to 9 Years | 69 (9.0%) | 138 (18.2%) |
| 10 to 14 Years | 87 (11.3%) | 0 (0.0%) |
| 15 to 19 Years | 19 (2.5%) | 27 (3.6%) |
| 20 to 24 Years | 37 (4.8%) | 10 (1.3%) |
| 25 to 29 Years | 34 (4.4%) | 9 (1.2%) |
| 30 to 34 Years | 84 (10.9%) | 72 (9.5%) |
| 35 to 39 Years | 20 (2.6%) | 39 (5.2%) |
| 40 to 44 Years | 71 (9.2%) | 52 (6.9%) |
| 45 to 49 Years | 42 (5.4%) | 45 (5.9%) |
| 50 to 54 Years | 60 (7.8%) | 77 (10.2%) |
| 55 to 59 Years | 50 (6.5%) | 77 (10.2%) |
| 60 to 64 Years | 24 (3.1%) | 59 (7.8%) |
| 65 to 69 Years | 31 (4.0%) | 43 (5.7%) |
| 70 to 74 Years | 7 (0.9%) | 32 (4.2%) |
| 75 to 79 Years | 23 (3.0%) | 12 (1.6%) |
| 80 to 84 Years | 14 (1.8%) | 12 (1.6%) |
| 85 Years and over | 17 (2.2%) | 13 (1.7%) |
| Total | 770 (100.0%) | 756 (100.0%) |
Families and Households in Galena
Median Family Size in Galena
The median family size in Galena is 3.32 persons per family, with married-couple families (369 | 84.4%) accounting for the largest median family size of 3.41 persons per family. On the other hand, single male/father families (16 | 3.7%) represent the smallest median family size with 2.25 persons per family.
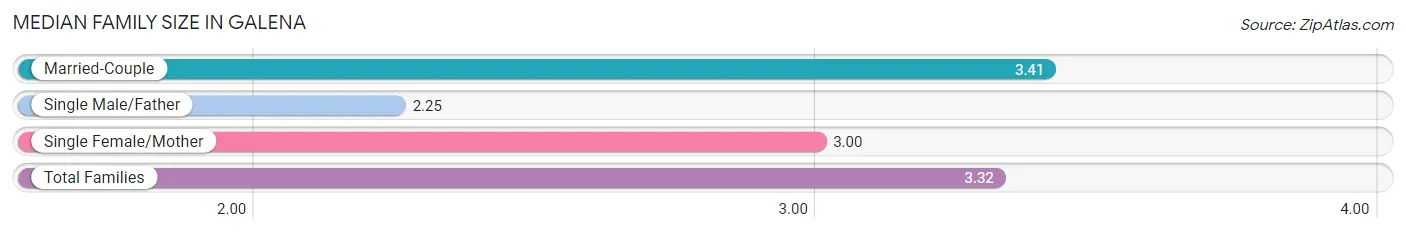
| Family Type | # Families | Family Size |
| Married-Couple | 369 (84.4%) | 3.41 |
| Single Male/Father | 16 (3.7%) | 2.25 |
| Single Female/Mother | 52 (11.9%) | 3.00 |
| Total Families | 437 (100.0%) | 3.32 |
Median Household Size in Galena
The median household size in Galena is 3.12 persons per household, with married-couple households (369 | 75.5%) accounting for the largest median household size of 3.43 persons per household. non-family households (52 | 10.6%) represent the smallest median household size with 1.12 persons per household.
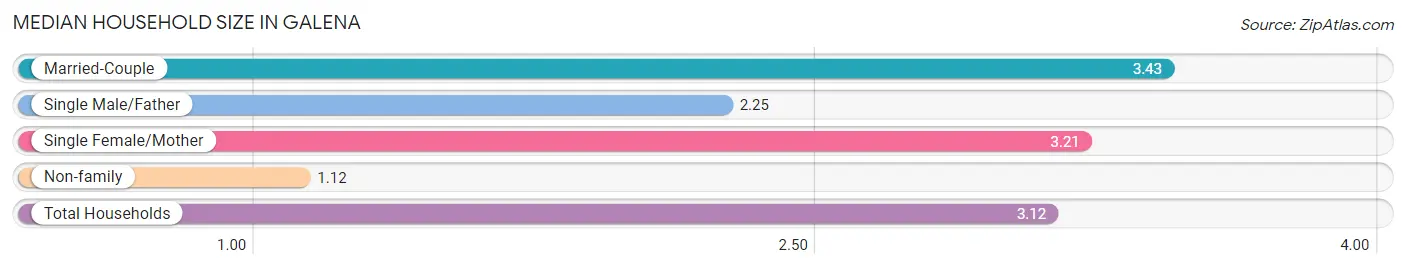
| Household Type | # Households | Household Size |
| Married-Couple | 369 (75.5%) | 3.43 |
| Single Male/Father | 16 (3.3%) | 2.25 |
| Single Female/Mother | 52 (10.6%) | 3.21 |
| Non-family | 52 (10.6%) | 1.12 |
| Total Households | 489 (100.0%) | 3.12 |
Household Size by Marriage Status in Galena
Out of a total of 489 households in Galena, 437 (89.4%) are family households, while 52 (10.6%) are nonfamily households. The most numerous type of family households are 2-person households, comprising 173, and the most common type of nonfamily households are 1-person households, comprising 45.
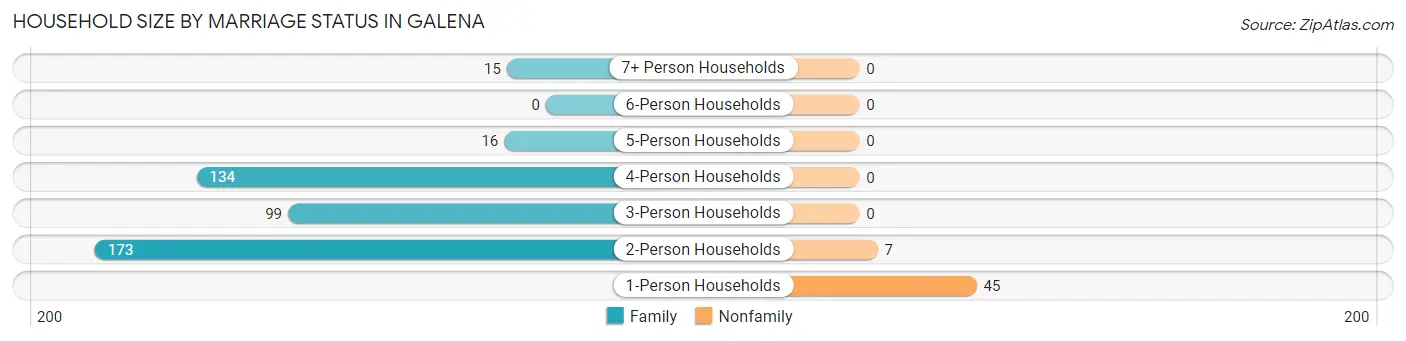
| Household Size | Family Households | Nonfamily Households |
| 1-Person Households | - | 45 (9.2%) |
| 2-Person Households | 173 (35.4%) | 7 (1.4%) |
| 3-Person Households | 99 (20.3%) | 0 (0.0%) |
| 4-Person Households | 134 (27.4%) | 0 (0.0%) |
| 5-Person Households | 16 (3.3%) | 0 (0.0%) |
| 6-Person Households | 0 (0.0%) | 0 (0.0%) |
| 7+ Person Households | 15 (3.1%) | 0 (0.0%) |
| Total | 437 (89.4%) | 52 (10.6%) |
Female Fertility in Galena
Fertility by Age in Galena
| Age Bracket | Women with Births | Births / 1,000 Women |
| 15 to 19 years | 0 (0.0%) | 0.0 |
| 20 to 34 years | 0 (0.0%) | 0.0 |
| 35 to 50 years | 0 (0.0%) | 0.0 |
| Total | 0 (0.0%) | 0.0 |
Fertility by Age by Marriage Status in Galena
| Age Bracket | Married | Unmarried |
| 15 to 19 years | 0 (0.0%) | 0 (0.0%) |
| 20 to 34 years | 0 (0.0%) | 0 (0.0%) |
| 35 to 50 years | 0 (0.0%) | 0 (0.0%) |
| Total | 0 (0.0%) | 0 (0.0%) |
Fertility by Education in Galena
| Educational Attainment | Women with Births | Births / 1,000 Women |
| Less than High School | 0 (0.0%) | 0.0 |
| High School Diploma | 0 (0.0%) | 0.0 |
| College or Associate's Degree | 0 (0.0%) | 0.0 |
| Bachelor's Degree | 0 (0.0%) | 0.0 |
| Graduate Degree | 0 (0.0%) | 0.0 |
| Total | 0 (0.0%) | 0.0 |
Fertility by Education by Marriage Status in Galena
| Educational Attainment | Married | Unmarried |
| Less than High School | 0 (0.0%) | 0 (0.0%) |
| High School Diploma | 0 (0.0%) | 0 (0.0%) |
| College or Associate's Degree | 0 (0.0%) | 0 (0.0%) |
| Bachelor's Degree | 0 (0.0%) | 0 (0.0%) |
| Graduate Degree | 0 (0.0%) | 0 (0.0%) |
| Total | 0 (0.0%) | 0 (0.0%) |
Employment Characteristics in Galena
Employment by Class of Employer in Galena
Among the 672 employed individuals in Galena, private company employees (550 | 81.9%), not-for-profit organizations (65 | 9.7%), and state government employees (31 | 4.6%) make up the most common classes of employment.
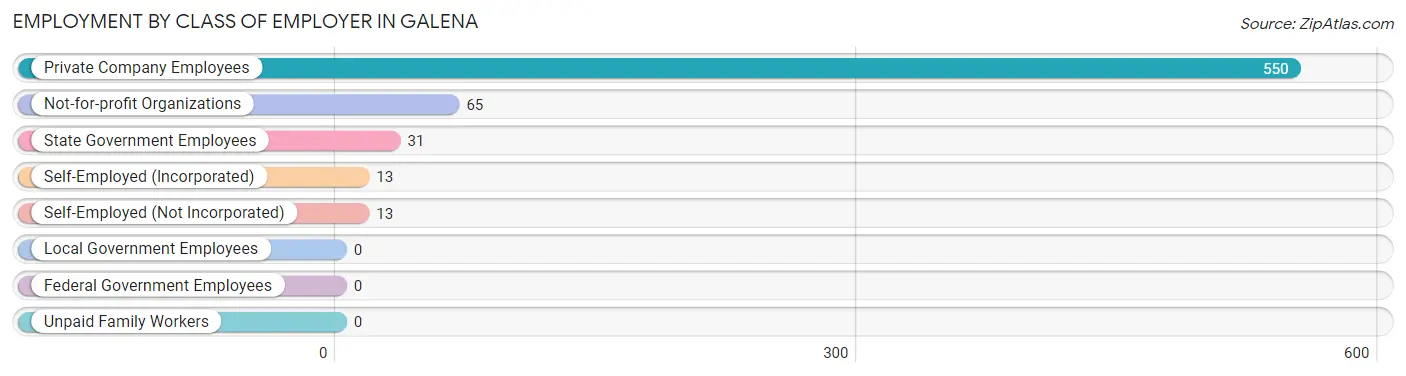
| Employer Class | # Employees | % Employees |
| Private Company Employees | 550 | 81.9% |
| Self-Employed (Incorporated) | 13 | 1.9% |
| Self-Employed (Not Incorporated) | 13 | 1.9% |
| Not-for-profit Organizations | 65 | 9.7% |
| Local Government Employees | 0 | 0.0% |
| State Government Employees | 31 | 4.6% |
| Federal Government Employees | 0 | 0.0% |
| Unpaid Family Workers | 0 | 0.0% |
| Total | 672 | 100.0% |
Employment Status by Age in Galena
According to the labor force statistics for Galena, out of the total population over 16 years of age (1,093), 69.1% or 755 individuals are in the labor force, with 4.9% or 37 of them unemployed. The age group with the highest labor force participation rate is 25 to 29 years, with 100.0% or 43 individuals in the labor force. Within the labor force, the 25 to 29 years age range has the highest percentage of unemployed individuals, with 53.5% or 23 of them being unemployed.
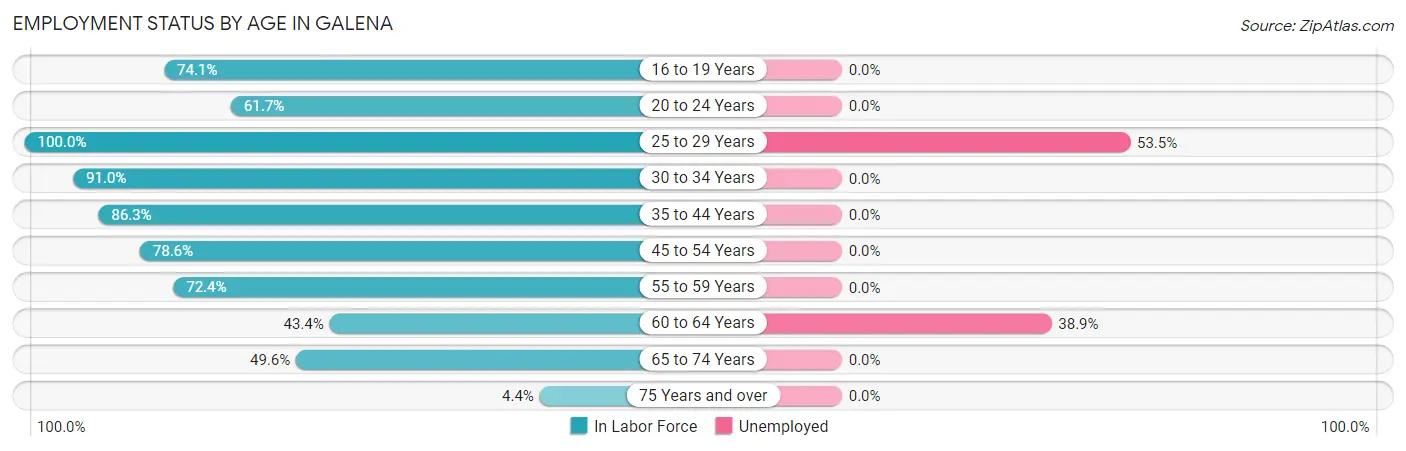
| Age Bracket | In Labor Force | Unemployed |
| 16 to 19 Years | 20 (74.1%) | 0 (0.0%) |
| 20 to 24 Years | 29 (61.7%) | 0 (0.0%) |
| 25 to 29 Years | 43 (100.0%) | 23 (53.5%) |
| 30 to 34 Years | 142 (91.0%) | 0 (0.0%) |
| 35 to 44 Years | 157 (86.3%) | 0 (0.0%) |
| 45 to 54 Years | 176 (78.6%) | 0 (0.0%) |
| 55 to 59 Years | 92 (72.4%) | 0 (0.0%) |
| 60 to 64 Years | 36 (43.4%) | 14 (38.9%) |
| 65 to 74 Years | 56 (49.6%) | 0 (0.0%) |
| 75 Years and over | 4 (4.4%) | 0 (0.0%) |
| Total | 755 (69.1%) | 37 (4.9%) |
Employment Status by Educational Attainment in Galena
According to labor force statistics for Galena, 79.3% of individuals (646) out of the total population between 25 and 64 years of age (815) are in the labor force, with 5.7% or 37 of them being unemployed. The group with the highest labor force participation rate are those with the educational attainment of bachelor's degree or higher, with 97.7% or 257 individuals in the labor force. Within the labor force, individuals with high school diploma education have the highest percentage of unemployment, with 10.2% or 23 of them being unemployed.
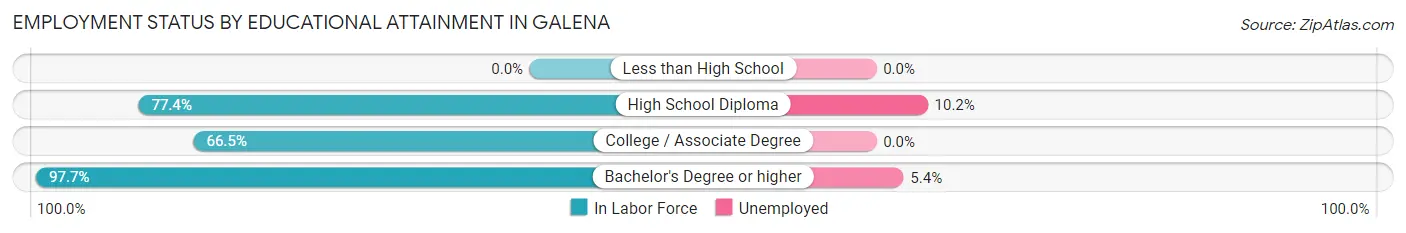
| Educational Attainment | In Labor Force | Unemployed |
| Less than High School | 0 (0.0%) | 0 (0.0%) |
| High School Diploma | 226 (77.4%) | 30 (10.2%) |
| College / Associate Degree | 163 (66.5%) | 0 (0.0%) |
| Bachelor's Degree or higher | 257 (97.7%) | 14 (5.4%) |
| Total | 646 (79.3%) | 46 (5.7%) |
Employment Occupations by Sex in Galena
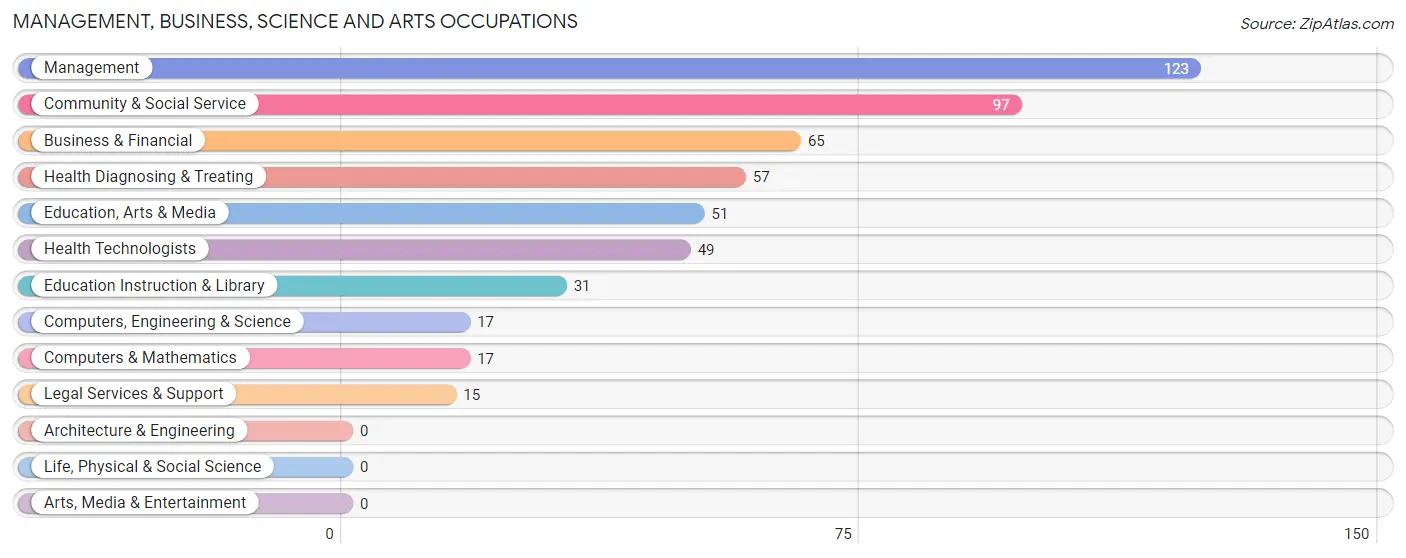
Management, Business, Science and Arts Occupations
The most common Management, Business, Science and Arts occupations in Galena are Management (123 | 17.1%), Community & Social Service (97 | 13.5%), Business & Financial (65 | 9.0%), Health Diagnosing & Treating (57 | 7.9%), and Education, Arts & Media (51 | 7.1%).
Management, Business, Science and Arts Occupations by Sex
Within the Management, Business, Science and Arts occupations in Galena, the most male-oriented occupations are Business & Financial (64.6%), Education Instruction & Library (64.5%), and Management (56.9%), while the most female-oriented occupations are Education, Arts & Media (100.0%), Legal Services & Support (100.0%), and Health Diagnosing & Treating (86.0%).
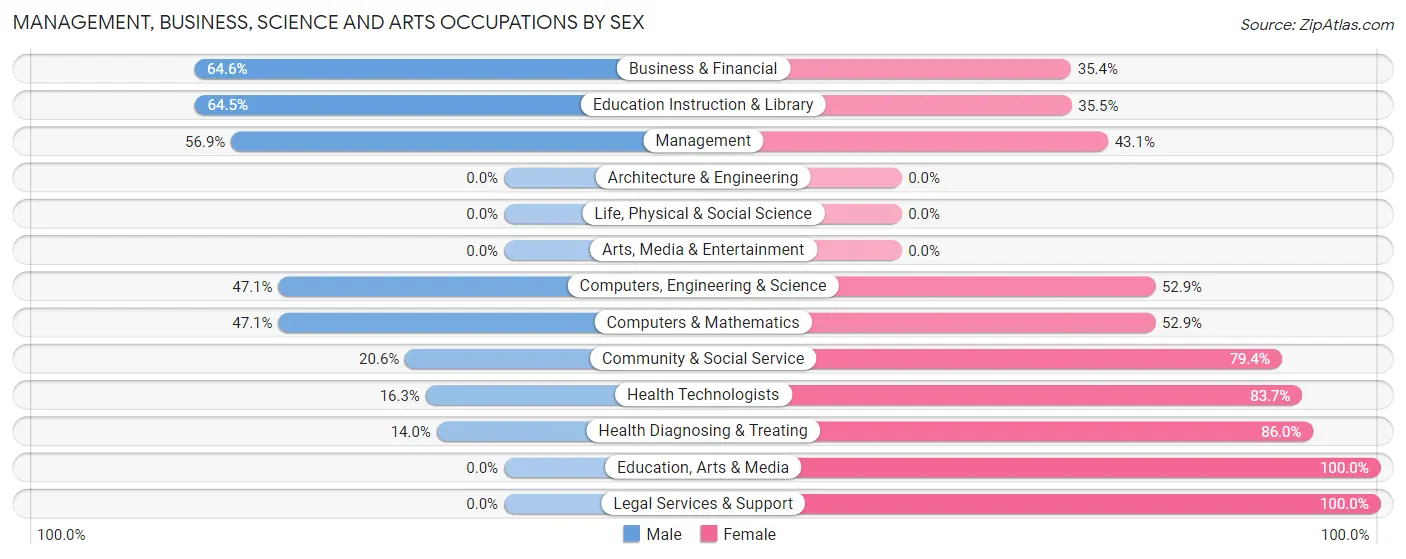
| Occupation | Male | Female |
| Management | 70 (56.9%) | 53 (43.1%) |
| Business & Financial | 42 (64.6%) | 23 (35.4%) |
| Computers, Engineering & Science | 8 (47.1%) | 9 (52.9%) |
| Computers & Mathematics | 8 (47.1%) | 9 (52.9%) |
| Architecture & Engineering | 0 (0.0%) | 0 (0.0%) |
| Life, Physical & Social Science | 0 (0.0%) | 0 (0.0%) |
| Community & Social Service | 20 (20.6%) | 77 (79.4%) |
| Education, Arts & Media | 0 (0.0%) | 51 (100.0%) |
| Legal Services & Support | 0 (0.0%) | 15 (100.0%) |
| Education Instruction & Library | 20 (64.5%) | 11 (35.5%) |
| Arts, Media & Entertainment | 0 (0.0%) | 0 (0.0%) |
| Health Diagnosing & Treating | 8 (14.0%) | 49 (86.0%) |
| Health Technologists | 8 (16.3%) | 41 (83.7%) |
| Total (Category) | 148 (41.2%) | 211 (58.8%) |
| Total (Overall) | 356 (49.6%) | 362 (50.4%) |
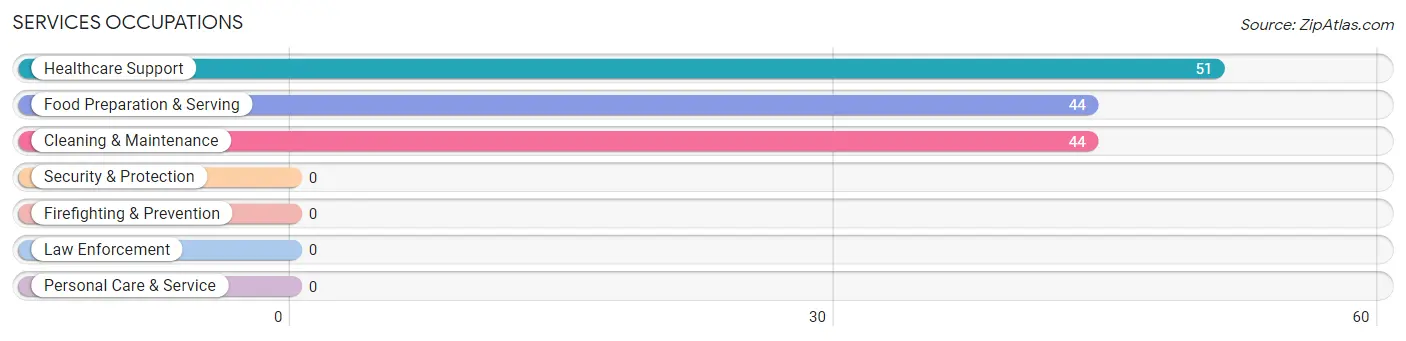
Services Occupations
The most common Services occupations in Galena are Healthcare Support (51 | 7.1%), Food Preparation & Serving (44 | 6.1%), and Cleaning & Maintenance (44 | 6.1%).
Services Occupations by Sex
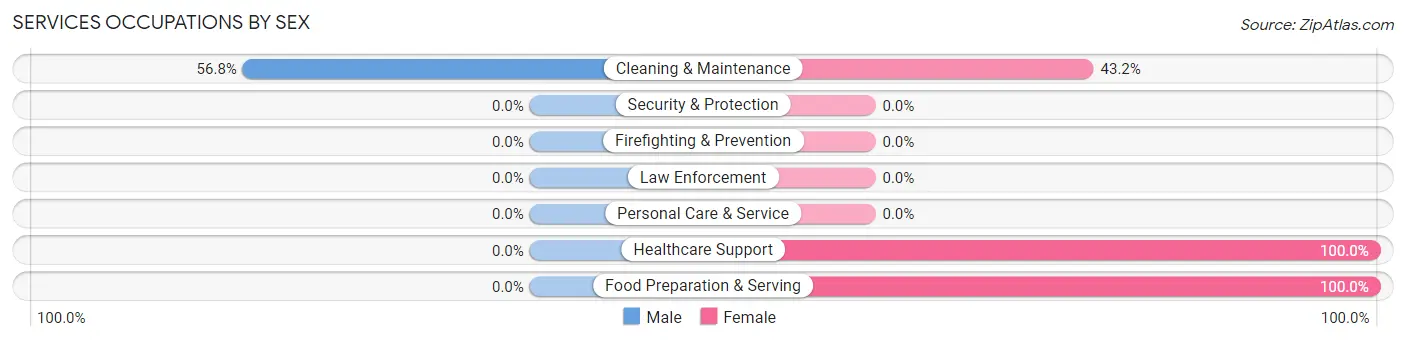
| Occupation | Male | Female |
| Healthcare Support | 0 (0.0%) | 51 (100.0%) |
| Security & Protection | 0 (0.0%) | 0 (0.0%) |
| Firefighting & Prevention | 0 (0.0%) | 0 (0.0%) |
| Law Enforcement | 0 (0.0%) | 0 (0.0%) |
| Food Preparation & Serving | 0 (0.0%) | 44 (100.0%) |
| Cleaning & Maintenance | 25 (56.8%) | 19 (43.2%) |
| Personal Care & Service | 0 (0.0%) | 0 (0.0%) |
| Total (Category) | 25 (18.0%) | 114 (82.0%) |
| Total (Overall) | 356 (49.6%) | 362 (50.4%) |
Sales and Office Occupations
The most common Sales and Office occupations in Galena are Sales & Related (45 | 6.3%), and Office & Administration (23 | 3.2%).

Sales and Office Occupations by Sex

| Occupation | Male | Female |
| Sales & Related | 17 (37.8%) | 28 (62.2%) |
| Office & Administration | 23 (100.0%) | 0 (0.0%) |
| Total (Category) | 40 (58.8%) | 28 (41.2%) |
| Total (Overall) | 356 (49.6%) | 362 (50.4%) |
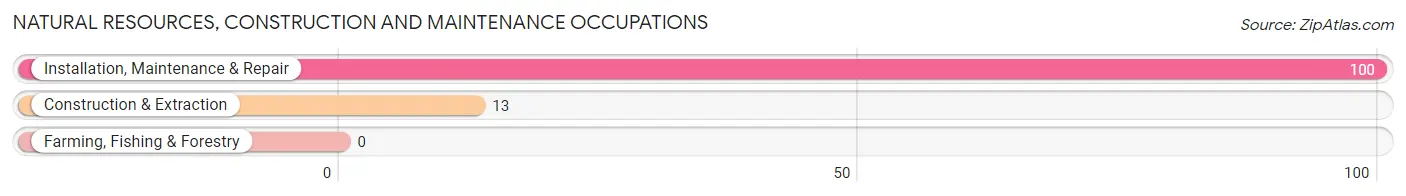
Natural Resources, Construction and Maintenance Occupations
The most common Natural Resources, Construction and Maintenance occupations in Galena are Installation, Maintenance & Repair (100 | 13.9%), and Construction & Extraction (13 | 1.8%).
Natural Resources, Construction and Maintenance Occupations by Sex
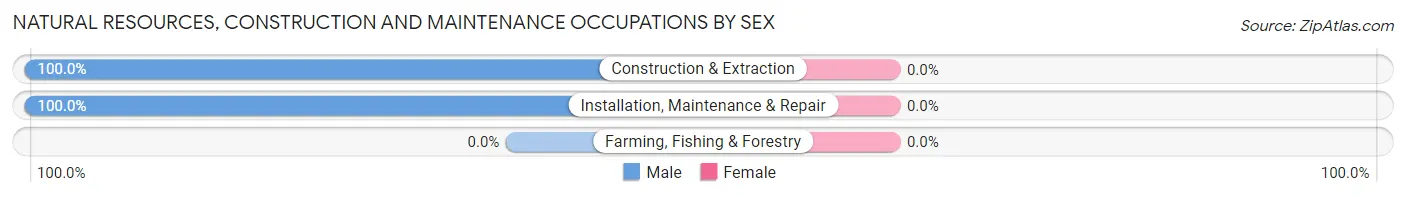
| Occupation | Male | Female |
| Farming, Fishing & Forestry | 0 (0.0%) | 0 (0.0%) |
| Construction & Extraction | 13 (100.0%) | 0 (0.0%) |
| Installation, Maintenance & Repair | 100 (100.0%) | 0 (0.0%) |
| Total (Category) | 113 (100.0%) | 0 (0.0%) |
| Total (Overall) | 356 (49.6%) | 362 (50.4%) |
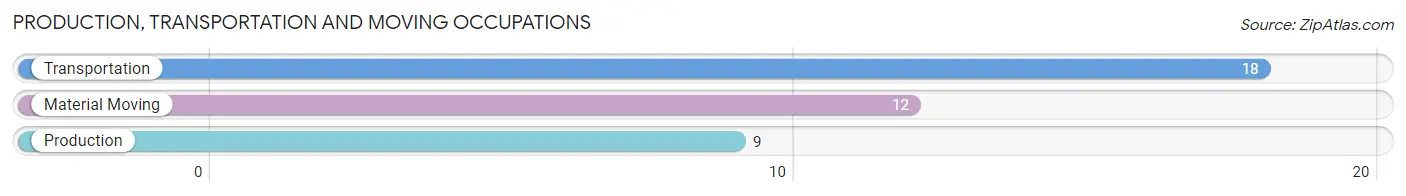
Production, Transportation and Moving Occupations
The most common Production, Transportation and Moving occupations in Galena are Transportation (18 | 2.5%), Material Moving (12 | 1.7%), and Production (9 | 1.3%).
Production, Transportation and Moving Occupations by Sex
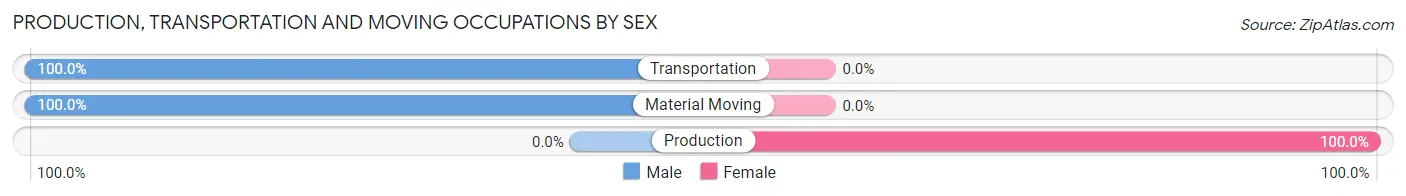
| Occupation | Male | Female |
| Production | 0 (0.0%) | 9 (100.0%) |
| Transportation | 18 (100.0%) | 0 (0.0%) |
| Material Moving | 12 (100.0%) | 0 (0.0%) |
| Total (Category) | 30 (76.9%) | 9 (23.1%) |
| Total (Overall) | 356 (49.6%) | 362 (50.4%) |
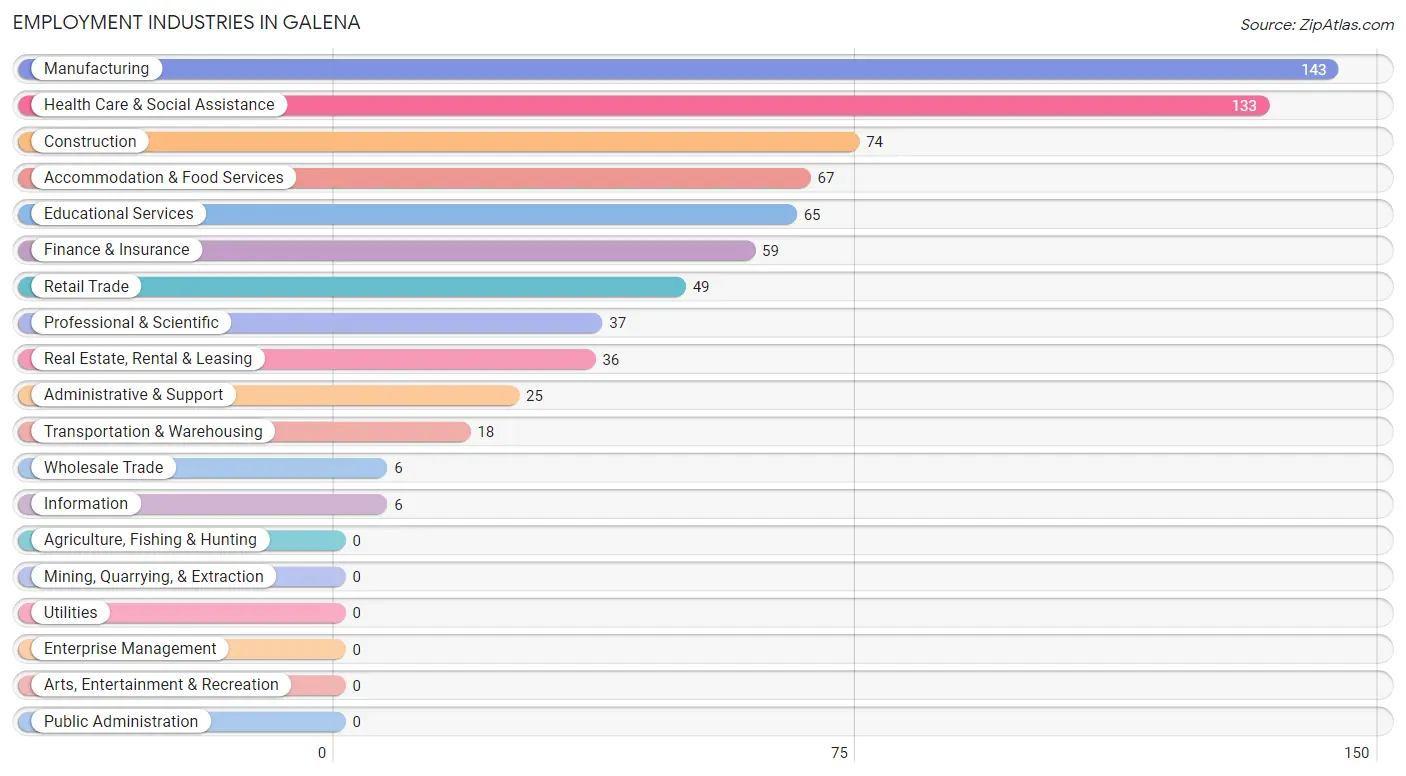
Employment Industries by Sex in Galena
Employment Industries in Galena
The major employment industries in Galena include Manufacturing (143 | 19.9%), Health Care & Social Assistance (133 | 18.5%), Construction (74 | 10.3%), Accommodation & Food Services (67 | 9.3%), and Educational Services (65 | 9.0%).
Employment Industries by Sex in Galena
The Galena industries that see more men than women are Construction (100.0%), Wholesale Trade (100.0%), and Transportation & Warehousing (100.0%), whereas the industries that tend to have a higher number of women are Information (100.0%), Real Estate, Rental & Leasing (100.0%), and Health Care & Social Assistance (94.0%).
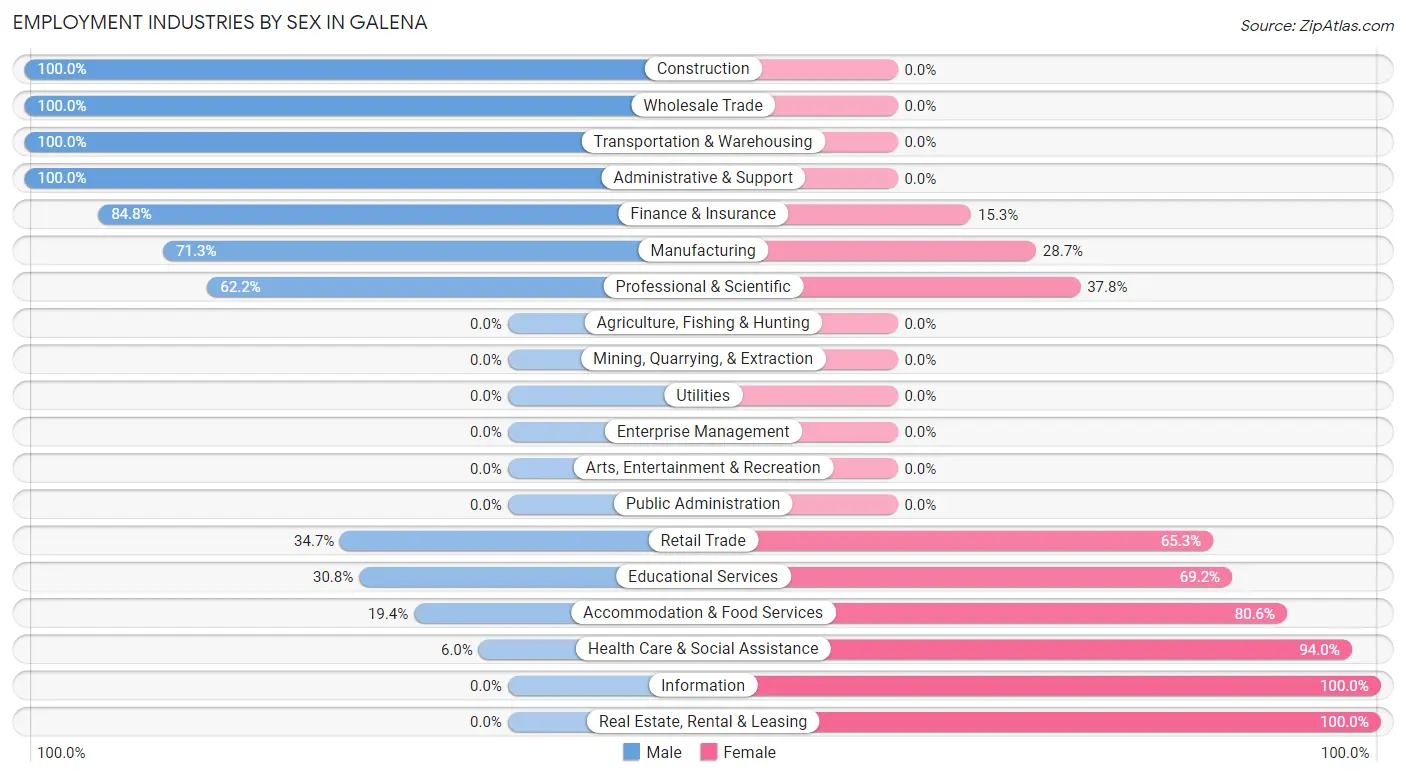
| Industry | Male | Female |
| Agriculture, Fishing & Hunting | 0 (0.0%) | 0 (0.0%) |
| Mining, Quarrying, & Extraction | 0 (0.0%) | 0 (0.0%) |
| Construction | 74 (100.0%) | 0 (0.0%) |
| Manufacturing | 102 (71.3%) | 41 (28.7%) |
| Wholesale Trade | 6 (100.0%) | 0 (0.0%) |
| Retail Trade | 17 (34.7%) | 32 (65.3%) |
| Transportation & Warehousing | 18 (100.0%) | 0 (0.0%) |
| Utilities | 0 (0.0%) | 0 (0.0%) |
| Information | 0 (0.0%) | 6 (100.0%) |
| Finance & Insurance | 50 (84.8%) | 9 (15.2%) |
| Real Estate, Rental & Leasing | 0 (0.0%) | 36 (100.0%) |
| Professional & Scientific | 23 (62.2%) | 14 (37.8%) |
| Enterprise Management | 0 (0.0%) | 0 (0.0%) |
| Administrative & Support | 25 (100.0%) | 0 (0.0%) |
| Educational Services | 20 (30.8%) | 45 (69.2%) |
| Health Care & Social Assistance | 8 (6.0%) | 125 (94.0%) |
| Arts, Entertainment & Recreation | 0 (0.0%) | 0 (0.0%) |
| Accommodation & Food Services | 13 (19.4%) | 54 (80.6%) |
| Public Administration | 0 (0.0%) | 0 (0.0%) |
| Total | 356 (49.6%) | 362 (50.4%) |
Education in Galena
School Enrollment in Galena
The most common levels of schooling among the 392 students in Galena are elementary school (206 | 52.5%), high school (76 | 19.4%), and middle school (40 | 10.2%).
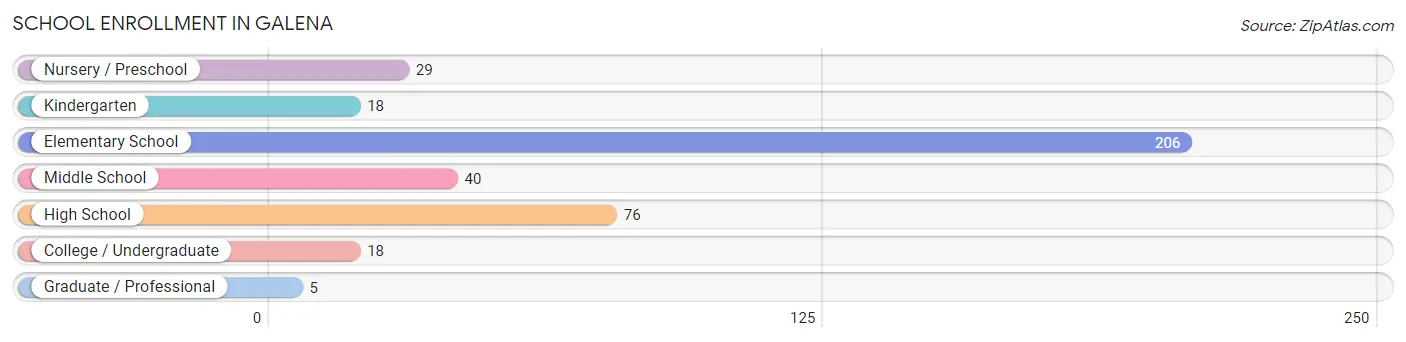
| School Level | # Students | % Students |
| Nursery / Preschool | 29 | 7.4% |
| Kindergarten | 18 | 4.6% |
| Elementary School | 206 | 52.5% |
| Middle School | 40 | 10.2% |
| High School | 76 | 19.4% |
| College / Undergraduate | 18 | 4.6% |
| Graduate / Professional | 5 | 1.3% |
| Total | 392 | 100.0% |
School Enrollment by Age by Funding Source in Galena
Out of a total of 392 students who are enrolled in schools in Galena, 94 (24.0%) attend a private institution, while the remaining 298 (76.0%) are enrolled in public schools. The age group of 3 to 4 year olds has the highest likelihood of being enrolled in private schools, with 21 (72.4% in the age bracket) enrolled. Conversely, the age group of 10 to 14 year olds has the lowest likelihood of being enrolled in a private school, with 87 (100.0% in the age bracket) attending a public institution.
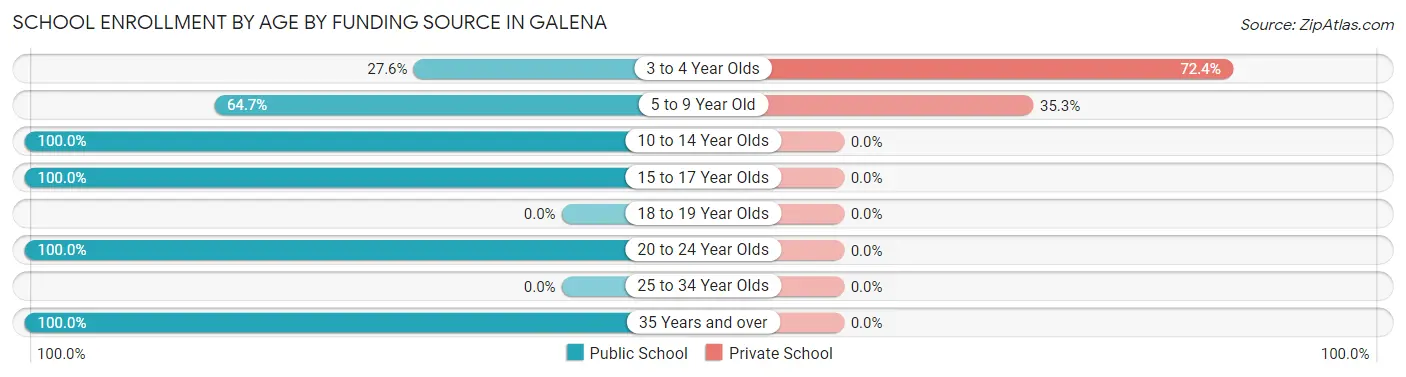
| Age Bracket | Public School | Private School |
| 3 to 4 Year Olds | 8 (27.6%) | 21 (72.4%) |
| 5 to 9 Year Old | 134 (64.7%) | 73 (35.3%) |
| 10 to 14 Year Olds | 87 (100.0%) | 0 (0.0%) |
| 15 to 17 Year Olds | 46 (100.0%) | 0 (0.0%) |
| 18 to 19 Year Olds | 0 (0.0%) | 0 (0.0%) |
| 20 to 24 Year Olds | 18 (100.0%) | 0 (0.0%) |
| 25 to 34 Year Olds | 0 (0.0%) | 0 (0.0%) |
| 35 Years and over | 5 (100.0%) | 0 (0.0%) |
| Total | 298 (76.0%) | 94 (24.0%) |
Educational Attainment by Field of Study in Galena
Business (105 | 30.3%), education (47 | 13.5%), science & technology (46 | 13.3%), psychology (38 | 11.0%), and communications (27 | 7.8%) are the most common fields of study among 347 individuals in Galena who have obtained a bachelor's degree or higher.
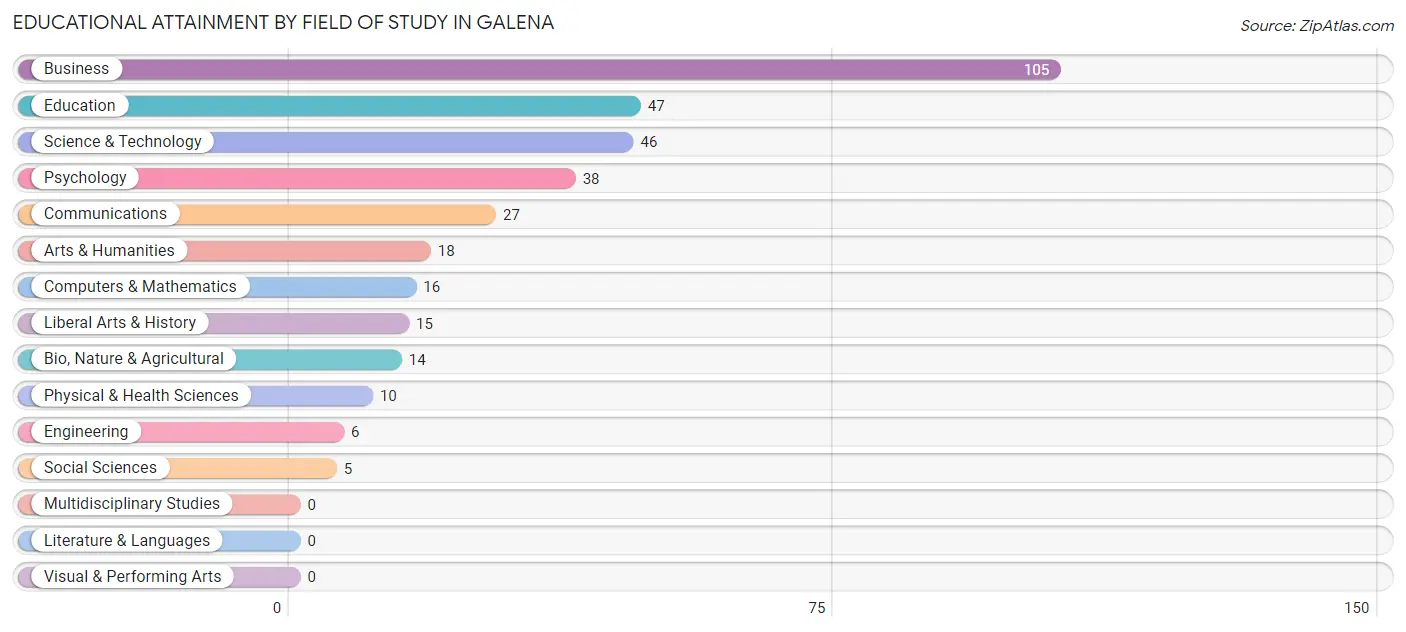
| Field of Study | # Graduates | % Graduates |
| Computers & Mathematics | 16 | 4.6% |
| Bio, Nature & Agricultural | 14 | 4.0% |
| Physical & Health Sciences | 10 | 2.9% |
| Psychology | 38 | 11.0% |
| Social Sciences | 5 | 1.4% |
| Engineering | 6 | 1.7% |
| Multidisciplinary Studies | 0 | 0.0% |
| Science & Technology | 46 | 13.3% |
| Business | 105 | 30.3% |
| Education | 47 | 13.5% |
| Literature & Languages | 0 | 0.0% |
| Liberal Arts & History | 15 | 4.3% |
| Visual & Performing Arts | 0 | 0.0% |
| Communications | 27 | 7.8% |
| Arts & Humanities | 18 | 5.2% |
| Total | 347 | 100.0% |
Transportation & Commute in Galena
Vehicle Availability by Sex in Galena
The most prevalent vehicle ownership categories in Galena are males with 3 vehicles (113, accounting for 34.1%) and females with 3 vehicles (103, making up 33.1%).
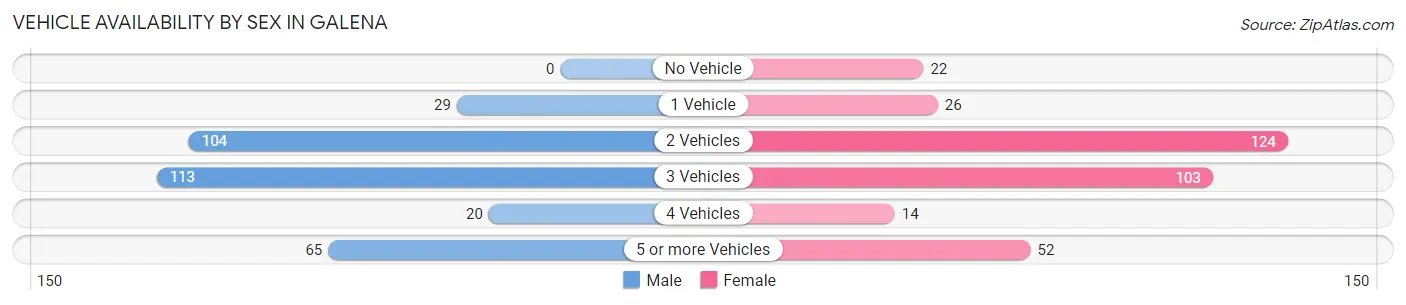
| Vehicles Available | Male | Female |
| No Vehicle | 0 (0.0%) | 22 (6.5%) |
| 1 Vehicle | 29 (8.8%) | 26 (7.6%) |
| 2 Vehicles | 104 (31.4%) | 124 (36.4%) |
| 3 Vehicles | 113 (34.1%) | 103 (30.2%) |
| 4 Vehicles | 20 (6.0%) | 14 (4.1%) |
| 5 or more Vehicles | 65 (19.6%) | 52 (15.2%) |
| Total | 331 (100.0%) | 341 (100.0%) |
Commute Time in Galena
The most frequently occuring commute durations in Galena are 30 to 34 minutes (152 commuters, 25.5%), 20 to 24 minutes (142 commuters, 23.8%), and 10 to 14 minutes (70 commuters, 11.7%).
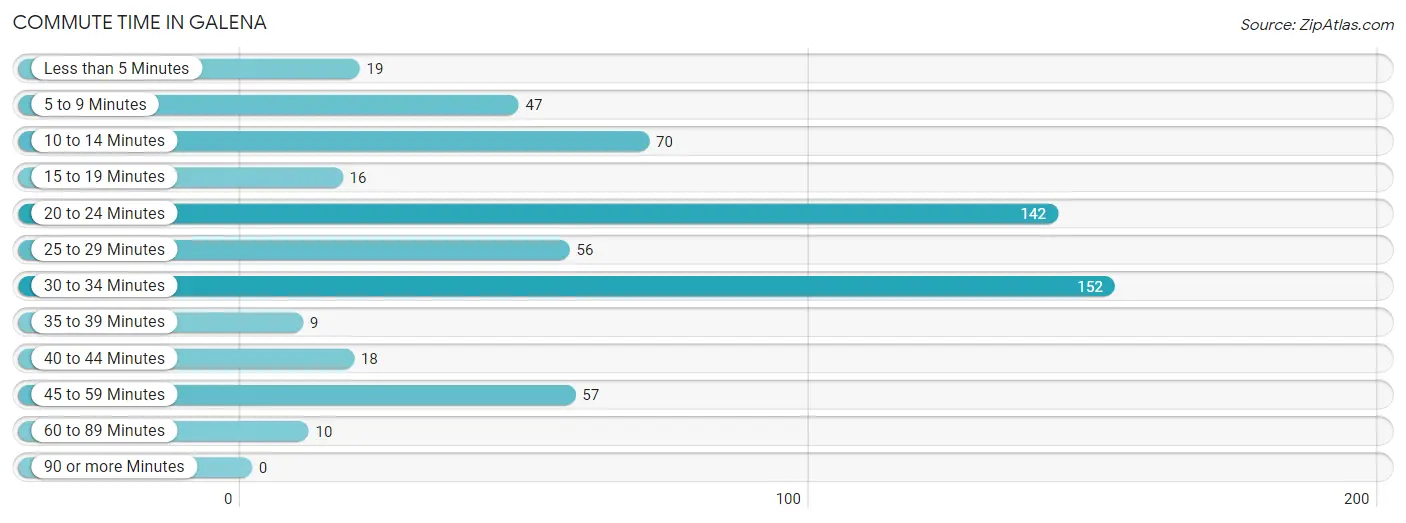
| Commute Time | # Commuters | % Commuters |
| Less than 5 Minutes | 19 | 3.2% |
| 5 to 9 Minutes | 47 | 7.9% |
| 10 to 14 Minutes | 70 | 11.7% |
| 15 to 19 Minutes | 16 | 2.7% |
| 20 to 24 Minutes | 142 | 23.8% |
| 25 to 29 Minutes | 56 | 9.4% |
| 30 to 34 Minutes | 152 | 25.5% |
| 35 to 39 Minutes | 9 | 1.5% |
| 40 to 44 Minutes | 18 | 3.0% |
| 45 to 59 Minutes | 57 | 9.6% |
| 60 to 89 Minutes | 10 | 1.7% |
| 90 or more Minutes | 0 | 0.0% |
Commute Time by Sex in Galena
The most common commute times in Galena are 30 to 34 minutes (79 commuters, 26.4%) for males and 30 to 34 minutes (73 commuters, 24.6%) for females.
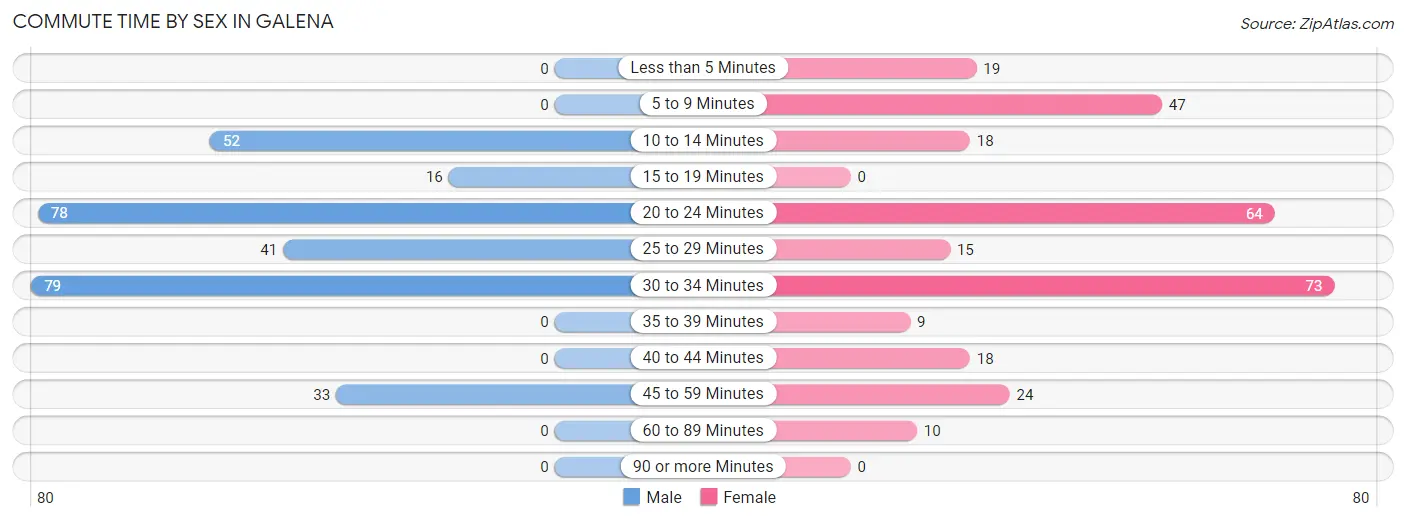
| Commute Time | Male | Female |
| Less than 5 Minutes | 0 (0.0%) | 19 (6.4%) |
| 5 to 9 Minutes | 0 (0.0%) | 47 (15.8%) |
| 10 to 14 Minutes | 52 (17.4%) | 18 (6.1%) |
| 15 to 19 Minutes | 16 (5.3%) | 0 (0.0%) |
| 20 to 24 Minutes | 78 (26.1%) | 64 (21.5%) |
| 25 to 29 Minutes | 41 (13.7%) | 15 (5.1%) |
| 30 to 34 Minutes | 79 (26.4%) | 73 (24.6%) |
| 35 to 39 Minutes | 0 (0.0%) | 9 (3.0%) |
| 40 to 44 Minutes | 0 (0.0%) | 18 (6.1%) |
| 45 to 59 Minutes | 33 (11.0%) | 24 (8.1%) |
| 60 to 89 Minutes | 0 (0.0%) | 10 (3.4%) |
| 90 or more Minutes | 0 (0.0%) | 0 (0.0%) |
Time of Departure to Work by Sex in Galena
The most frequent times of departure to work in Galena are 7:00 AM to 7:29 AM (75, 25.1%) for males and 7:00 AM to 7:29 AM (74, 24.9%) for females.
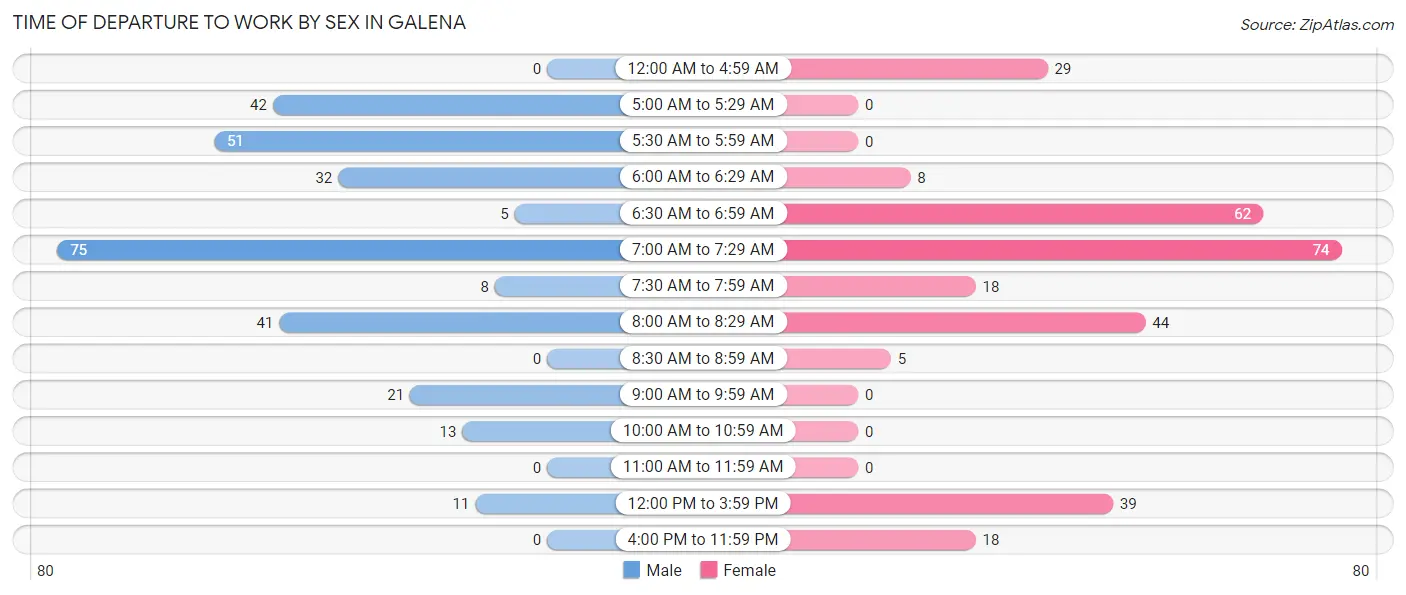
| Time of Departure | Male | Female |
| 12:00 AM to 4:59 AM | 0 (0.0%) | 29 (9.8%) |
| 5:00 AM to 5:29 AM | 42 (14.1%) | 0 (0.0%) |
| 5:30 AM to 5:59 AM | 51 (17.1%) | 0 (0.0%) |
| 6:00 AM to 6:29 AM | 32 (10.7%) | 8 (2.7%) |
| 6:30 AM to 6:59 AM | 5 (1.7%) | 62 (20.9%) |
| 7:00 AM to 7:29 AM | 75 (25.1%) | 74 (24.9%) |
| 7:30 AM to 7:59 AM | 8 (2.7%) | 18 (6.1%) |
| 8:00 AM to 8:29 AM | 41 (13.7%) | 44 (14.8%) |
| 8:30 AM to 8:59 AM | 0 (0.0%) | 5 (1.7%) |
| 9:00 AM to 9:59 AM | 21 (7.0%) | 0 (0.0%) |
| 10:00 AM to 10:59 AM | 13 (4.3%) | 0 (0.0%) |
| 11:00 AM to 11:59 AM | 0 (0.0%) | 0 (0.0%) |
| 12:00 PM to 3:59 PM | 11 (3.7%) | 39 (13.1%) |
| 4:00 PM to 11:59 PM | 0 (0.0%) | 18 (6.1%) |
| Total | 299 (100.0%) | 297 (100.0%) |
Housing Occupancy in Galena
Occupancy by Ownership in Galena
Of the total 489 dwellings in Galena, owner-occupied units account for 483 (98.8%), while renter-occupied units make up 6 (1.2%).
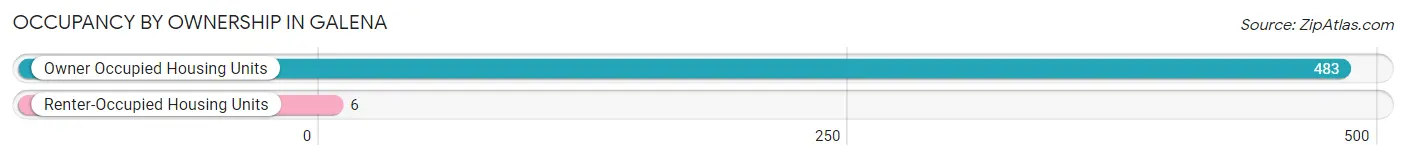
| Occupancy | # Housing Units | % Housing Units |
| Owner Occupied Housing Units | 483 | 98.8% |
| Renter-Occupied Housing Units | 6 | 1.2% |
| Total Occupied Housing Units | 489 | 100.0% |
Occupancy by Household Size in Galena
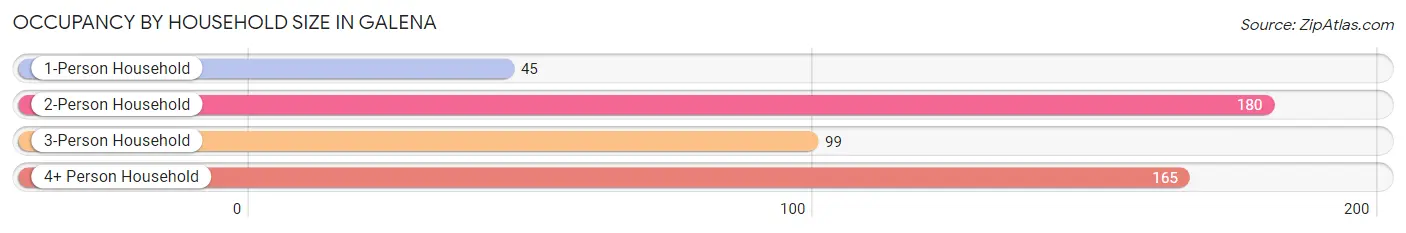
| Household Size | # Housing Units | % Housing Units |
| 1-Person Household | 45 | 9.2% |
| 2-Person Household | 180 | 36.8% |
| 3-Person Household | 99 | 20.3% |
| 4+ Person Household | 165 | 33.7% |
| Total Housing Units | 489 | 100.0% |
Occupancy by Ownership by Household Size in Galena
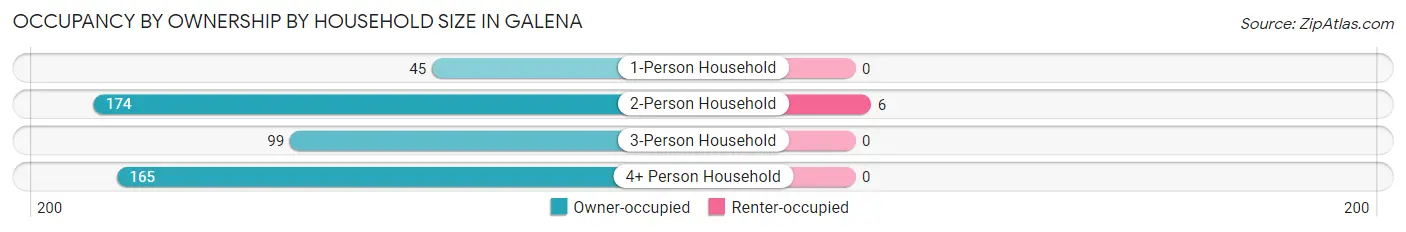
| Household Size | Owner-occupied | Renter-occupied |
| 1-Person Household | 45 (100.0%) | 0 (0.0%) |
| 2-Person Household | 174 (96.7%) | 6 (3.3%) |
| 3-Person Household | 99 (100.0%) | 0 (0.0%) |
| 4+ Person Household | 165 (100.0%) | 0 (0.0%) |
| Total Housing Units | 483 (98.8%) | 6 (1.2%) |
Occupancy by Educational Attainment in Galena
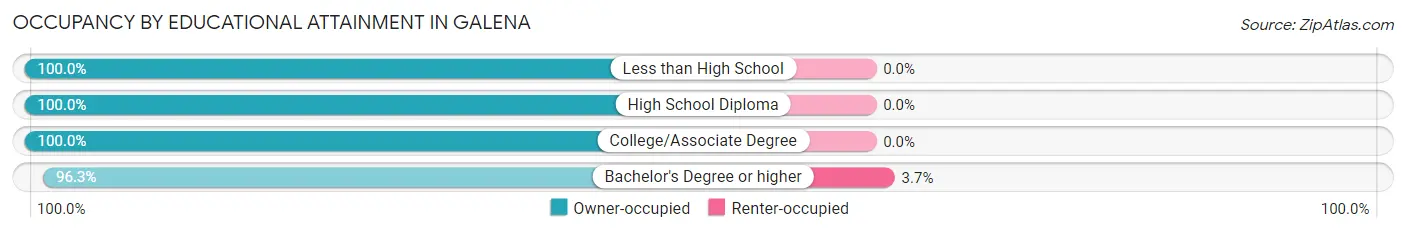
| Household Size | Owner-occupied | Renter-occupied |
| Less than High School | 17 (100.0%) | 0 (0.0%) |
| High School Diploma | 132 (100.0%) | 0 (0.0%) |
| College/Associate Degree | 176 (100.0%) | 0 (0.0%) |
| Bachelor's Degree or higher | 158 (96.3%) | 6 (3.7%) |
Occupancy by Age of Householder in Galena
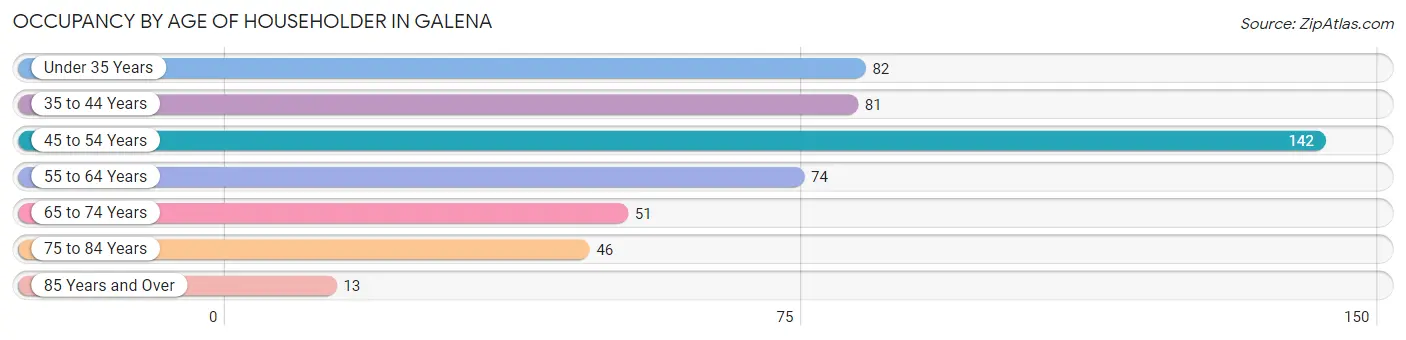
| Age Bracket | # Households | % Households |
| Under 35 Years | 82 | 16.8% |
| 35 to 44 Years | 81 | 16.6% |
| 45 to 54 Years | 142 | 29.0% |
| 55 to 64 Years | 74 | 15.1% |
| 65 to 74 Years | 51 | 10.4% |
| 75 to 84 Years | 46 | 9.4% |
| 85 Years and Over | 13 | 2.7% |
| Total | 489 | 100.0% |
Housing Finances in Galena
Median Income by Occupancy in Galena
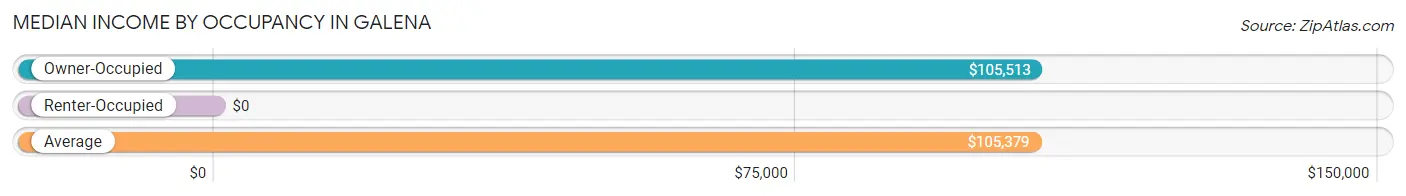
| Occupancy Type | # Households | Median Income |
| Owner-Occupied | 483 (98.8%) | $105,513 |
| Renter-Occupied | 6 (1.2%) | $0 |
| Average | 489 (100.0%) | $105,379 |
Occupancy by Householder Income Bracket in Galena
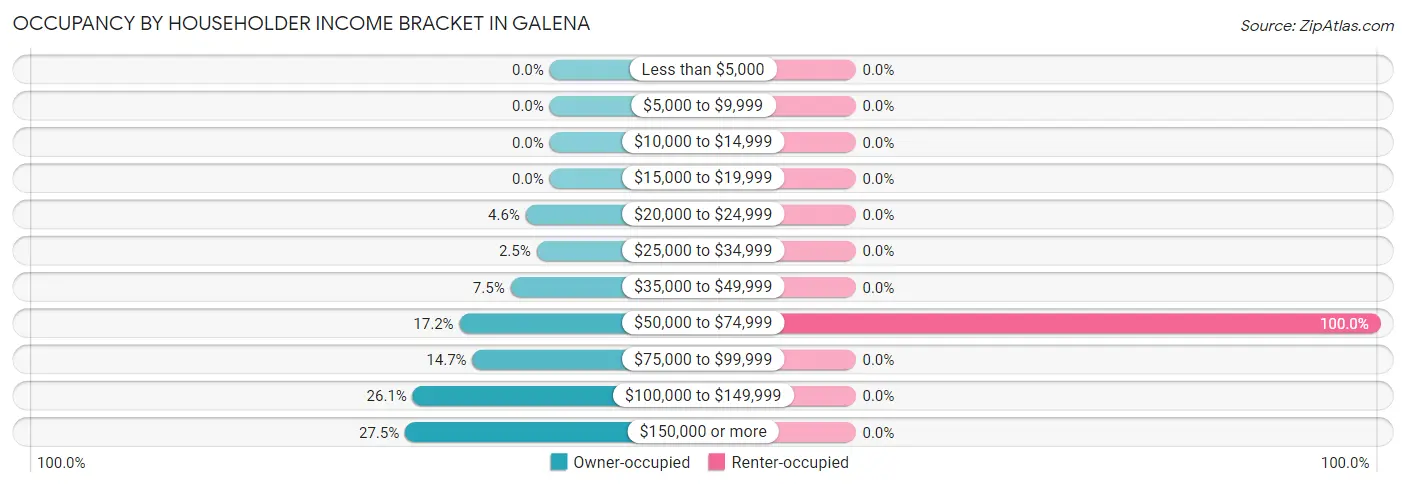
| Income Bracket | Owner-occupied | Renter-occupied |
| Less than $5,000 | 0 (0.0%) | 0 (0.0%) |
| $5,000 to $9,999 | 0 (0.0%) | 0 (0.0%) |
| $10,000 to $14,999 | 0 (0.0%) | 0 (0.0%) |
| $15,000 to $19,999 | 0 (0.0%) | 0 (0.0%) |
| $20,000 to $24,999 | 22 (4.5%) | 0 (0.0%) |
| $25,000 to $34,999 | 12 (2.5%) | 0 (0.0%) |
| $35,000 to $49,999 | 36 (7.4%) | 0 (0.0%) |
| $50,000 to $74,999 | 83 (17.2%) | 6 (100.0%) |
| $75,000 to $99,999 | 71 (14.7%) | 0 (0.0%) |
| $100,000 to $149,999 | 126 (26.1%) | 0 (0.0%) |
| $150,000 or more | 133 (27.5%) | 0 (0.0%) |
| Total | 483 (100.0%) | 6 (100.0%) |
Monthly Housing Cost Tiers in Galena
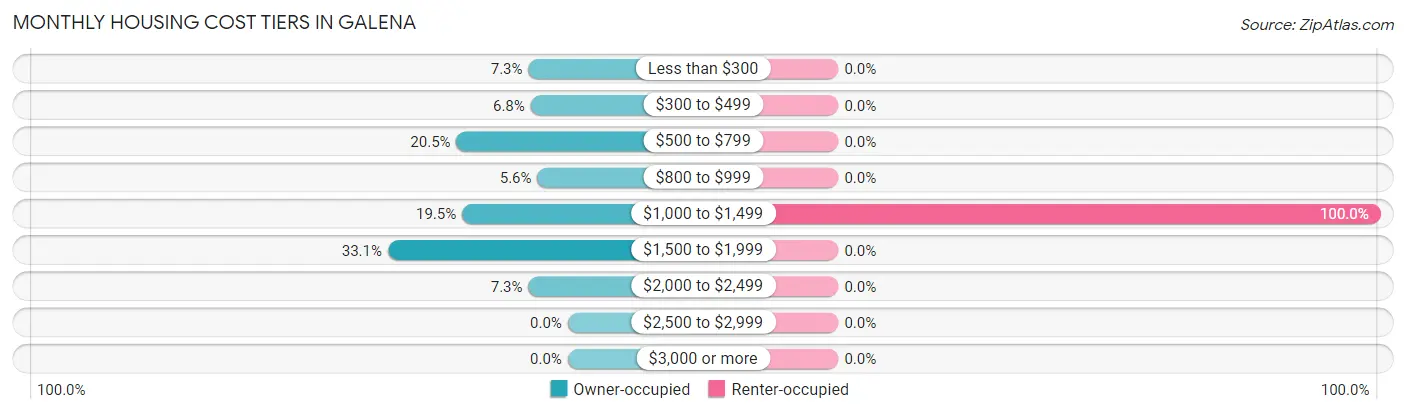
| Monthly Cost | Owner-occupied | Renter-occupied |
| Less than $300 | 35 (7.2%) | 0 (0.0%) |
| $300 to $499 | 33 (6.8%) | 0 (0.0%) |
| $500 to $799 | 99 (20.5%) | 0 (0.0%) |
| $800 to $999 | 27 (5.6%) | 0 (0.0%) |
| $1,000 to $1,499 | 94 (19.5%) | 6 (100.0%) |
| $1,500 to $1,999 | 160 (33.1%) | 0 (0.0%) |
| $2,000 to $2,499 | 35 (7.2%) | 0 (0.0%) |
| $2,500 to $2,999 | 0 (0.0%) | 0 (0.0%) |
| $3,000 or more | 0 (0.0%) | 0 (0.0%) |
| Total | 483 (100.0%) | 6 (100.0%) |
Physical Housing Characteristics in Galena
Housing Structures in Galena
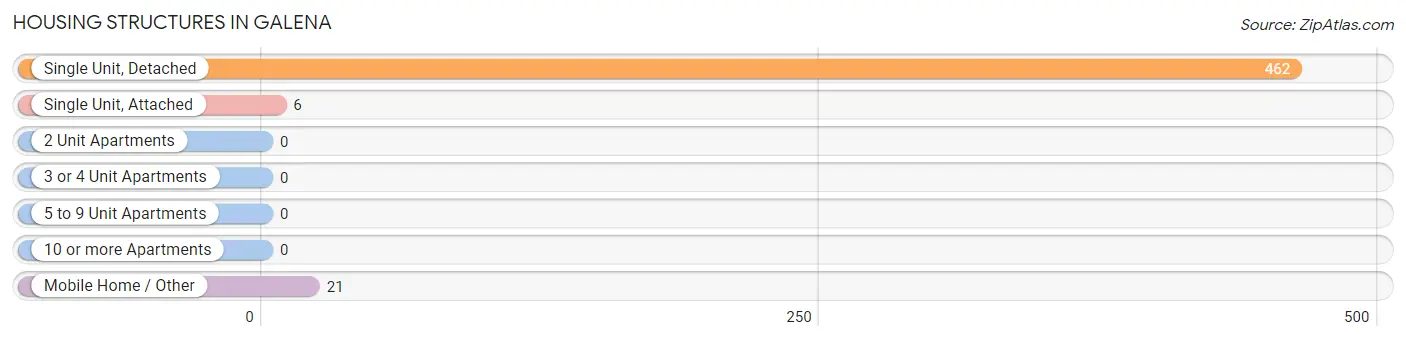
| Structure Type | # Housing Units | % Housing Units |
| Single Unit, Detached | 462 | 94.5% |
| Single Unit, Attached | 6 | 1.2% |
| 2 Unit Apartments | 0 | 0.0% |
| 3 or 4 Unit Apartments | 0 | 0.0% |
| 5 to 9 Unit Apartments | 0 | 0.0% |
| 10 or more Apartments | 0 | 0.0% |
| Mobile Home / Other | 21 | 4.3% |
| Total | 489 | 100.0% |
Housing Structures by Occupancy in Galena
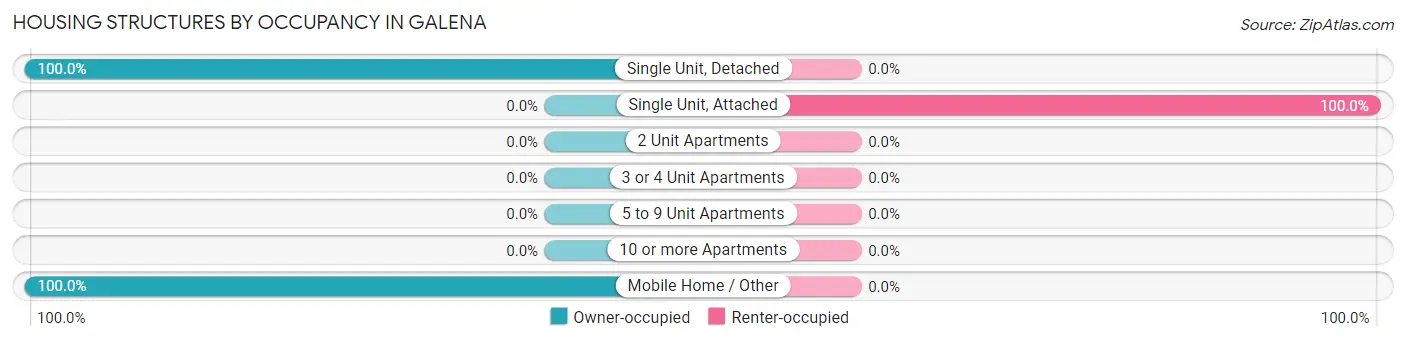
| Structure Type | Owner-occupied | Renter-occupied |
| Single Unit, Detached | 462 (100.0%) | 0 (0.0%) |
| Single Unit, Attached | 0 (0.0%) | 6 (100.0%) |
| 2 Unit Apartments | 0 (0.0%) | 0 (0.0%) |
| 3 or 4 Unit Apartments | 0 (0.0%) | 0 (0.0%) |
| 5 to 9 Unit Apartments | 0 (0.0%) | 0 (0.0%) |
| 10 or more Apartments | 0 (0.0%) | 0 (0.0%) |
| Mobile Home / Other | 21 (100.0%) | 0 (0.0%) |
| Total | 483 (98.8%) | 6 (1.2%) |
Housing Structures by Number of Rooms in Galena
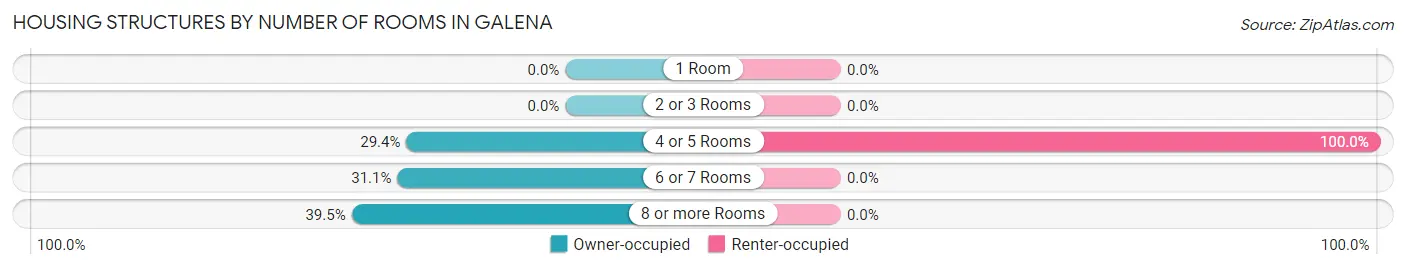
| Number of Rooms | Owner-occupied | Renter-occupied |
| 1 Room | 0 (0.0%) | 0 (0.0%) |
| 2 or 3 Rooms | 0 (0.0%) | 0 (0.0%) |
| 4 or 5 Rooms | 142 (29.4%) | 6 (100.0%) |
| 6 or 7 Rooms | 150 (31.1%) | 0 (0.0%) |
| 8 or more Rooms | 191 (39.5%) | 0 (0.0%) |
| Total | 483 (100.0%) | 6 (100.0%) |
Housing Structure by Heating Type in Galena
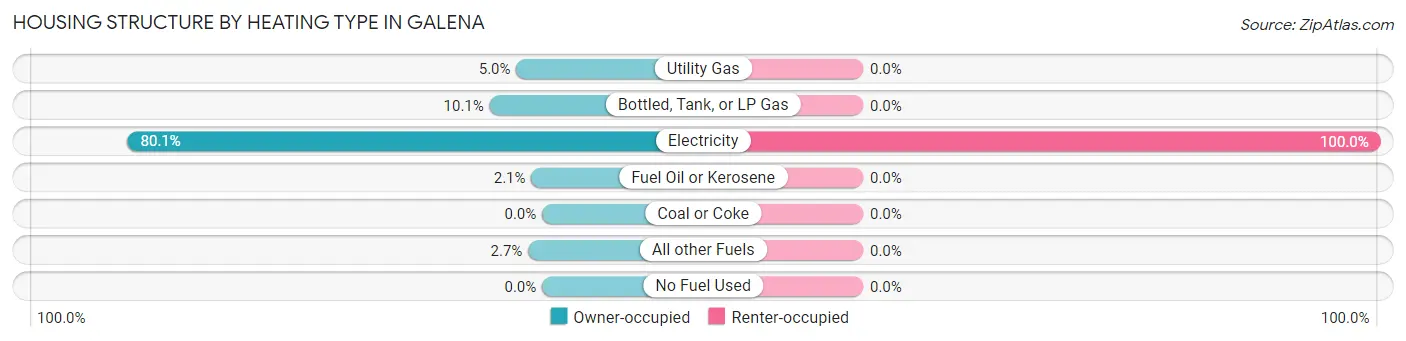
| Heating Type | Owner-occupied | Renter-occupied |
| Utility Gas | 24 (5.0%) | 0 (0.0%) |
| Bottled, Tank, or LP Gas | 49 (10.1%) | 0 (0.0%) |
| Electricity | 387 (80.1%) | 6 (100.0%) |
| Fuel Oil or Kerosene | 10 (2.1%) | 0 (0.0%) |
| Coal or Coke | 0 (0.0%) | 0 (0.0%) |
| All other Fuels | 13 (2.7%) | 0 (0.0%) |
| No Fuel Used | 0 (0.0%) | 0 (0.0%) |
| Total | 483 (100.0%) | 6 (100.0%) |
Household Vehicle Usage in Galena
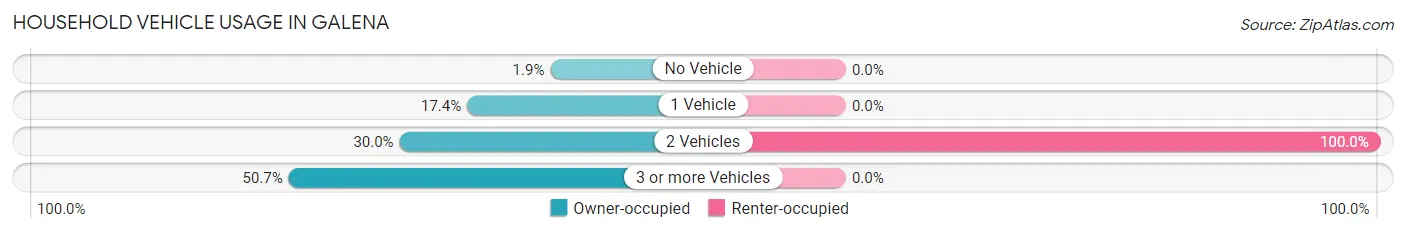
| Vehicles per Household | Owner-occupied | Renter-occupied |
| No Vehicle | 9 (1.9%) | 0 (0.0%) |
| 1 Vehicle | 84 (17.4%) | 0 (0.0%) |
| 2 Vehicles | 145 (30.0%) | 6 (100.0%) |
| 3 or more Vehicles | 245 (50.7%) | 0 (0.0%) |
| Total | 483 (100.0%) | 6 (100.0%) |
Real Estate & Mortgages in Galena
Real Estate and Mortgage Overview in Galena
| Characteristic | Without Mortgage | With Mortgage |
| Housing Units | 152 | 331 |
| Median Property Value | $234,600 | $252,700 |
| Median Household Income | $79,583 | $105 |
| Monthly Housing Costs | $529 | $0 |
| Real Estate Taxes | $1,598 | $10 |
Property Value by Mortgage Status in Galena
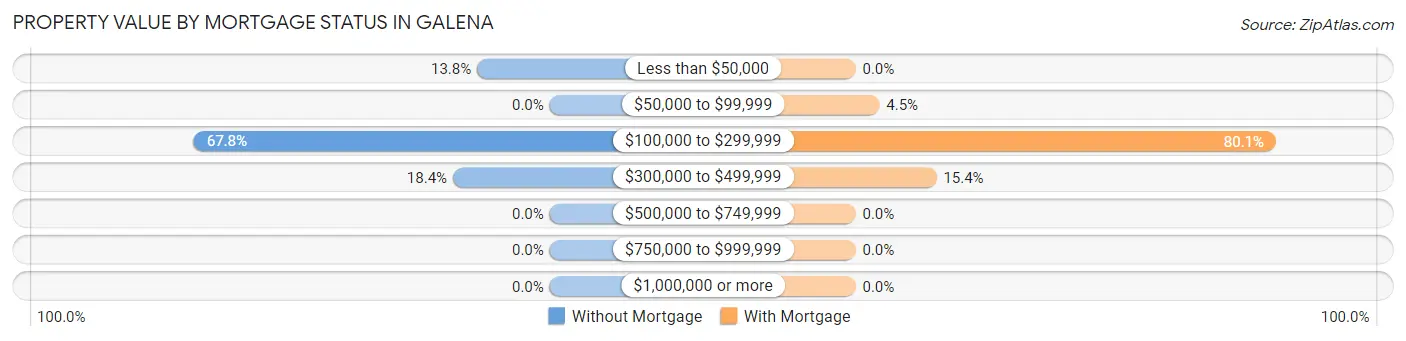
| Property Value | Without Mortgage | With Mortgage |
| Less than $50,000 | 21 (13.8%) | 0 (0.0%) |
| $50,000 to $99,999 | 0 (0.0%) | 15 (4.5%) |
| $100,000 to $299,999 | 103 (67.8%) | 265 (80.1%) |
| $300,000 to $499,999 | 28 (18.4%) | 51 (15.4%) |
| $500,000 to $749,999 | 0 (0.0%) | 0 (0.0%) |
| $750,000 to $999,999 | 0 (0.0%) | 0 (0.0%) |
| $1,000,000 or more | 0 (0.0%) | 0 (0.0%) |
| Total | 152 (100.0%) | 331 (100.0%) |
Household Income by Mortgage Status in Galena
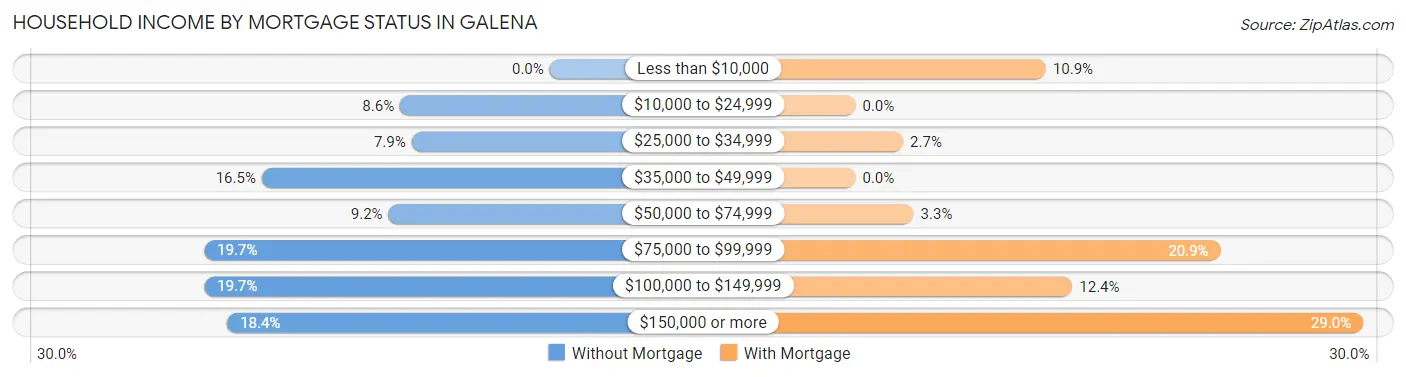
| Household Income | Without Mortgage | With Mortgage |
| Less than $10,000 | 0 (0.0%) | 36 (10.9%) |
| $10,000 to $24,999 | 13 (8.6%) | 0 (0.0%) |
| $25,000 to $34,999 | 12 (7.9%) | 9 (2.7%) |
| $35,000 to $49,999 | 25 (16.5%) | 0 (0.0%) |
| $50,000 to $74,999 | 14 (9.2%) | 11 (3.3%) |
| $75,000 to $99,999 | 30 (19.7%) | 69 (20.8%) |
| $100,000 to $149,999 | 30 (19.7%) | 41 (12.4%) |
| $150,000 or more | 28 (18.4%) | 96 (29.0%) |
| Total | 152 (100.0%) | 331 (100.0%) |
Property Value to Household Income Ratio in Galena
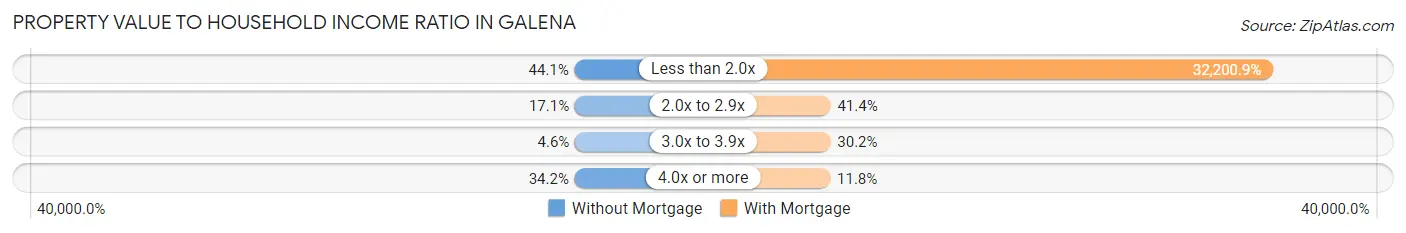
| Value-to-Income Ratio | Without Mortgage | With Mortgage |
| Less than 2.0x | 67 (44.1%) | 106,585 (32,200.9%) |
| 2.0x to 2.9x | 26 (17.1%) | 137 (41.4%) |
| 3.0x to 3.9x | 7 (4.6%) | 100 (30.2%) |
| 4.0x or more | 52 (34.2%) | 39 (11.8%) |
| Total | 152 (100.0%) | 331 (100.0%) |
Real Estate Taxes by Mortgage Status in Galena
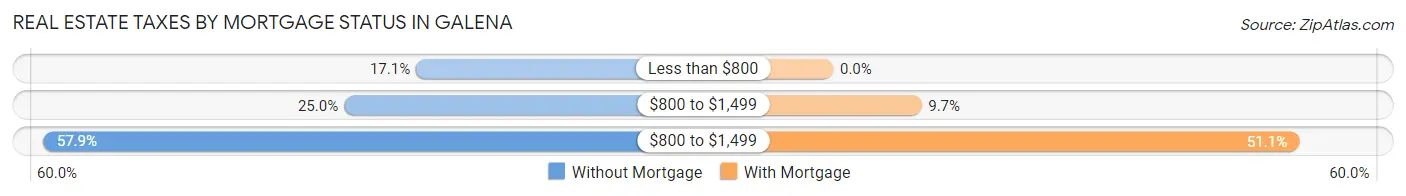
| Property Taxes | Without Mortgage | With Mortgage |
| Less than $800 | 26 (17.1%) | 0 (0.0%) |
| $800 to $1,499 | 38 (25.0%) | 32 (9.7%) |
| $800 to $1,499 | 88 (57.9%) | 169 (51.1%) |
| Total | 152 (100.0%) | 331 (100.0%) |
Health & Disability in Galena
Health Insurance Coverage by Age in Galena
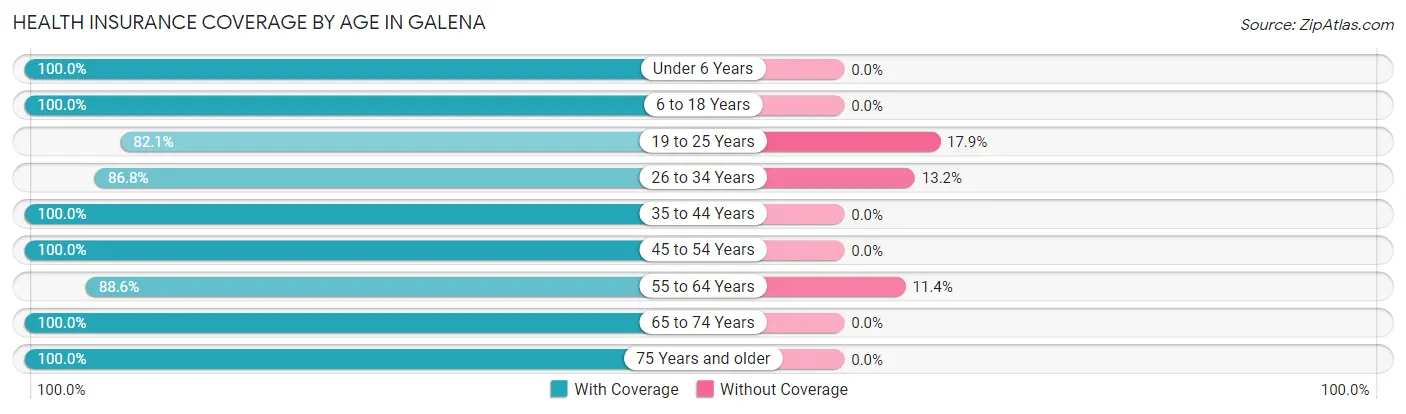
| Age Bracket | With Coverage | Without Coverage |
| Under 6 Years | 120 (100.0%) | 0 (0.0%) |
| 6 to 18 Years | 340 (100.0%) | 0 (0.0%) |
| 19 to 25 Years | 46 (82.1%) | 10 (17.9%) |
| 26 to 34 Years | 165 (86.8%) | 25 (13.2%) |
| 35 to 44 Years | 182 (100.0%) | 0 (0.0%) |
| 45 to 54 Years | 224 (100.0%) | 0 (0.0%) |
| 55 to 64 Years | 186 (88.6%) | 24 (11.4%) |
| 65 to 74 Years | 113 (100.0%) | 0 (0.0%) |
| 75 Years and older | 91 (100.0%) | 0 (0.0%) |
| Total | 1,467 (96.1%) | 59 (3.9%) |
Health Insurance Coverage by Citizenship Status in Galena
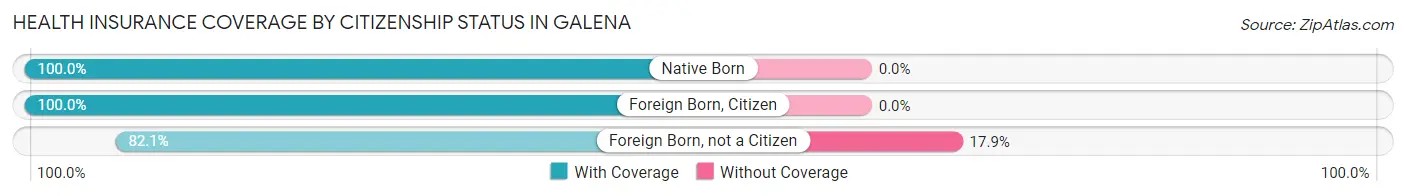
| Citizenship Status | With Coverage | Without Coverage |
| Native Born | 120 (100.0%) | 0 (0.0%) |
| Foreign Born, Citizen | 340 (100.0%) | 0 (0.0%) |
| Foreign Born, not a Citizen | 46 (82.1%) | 10 (17.9%) |
Health Insurance Coverage by Household Income in Galena
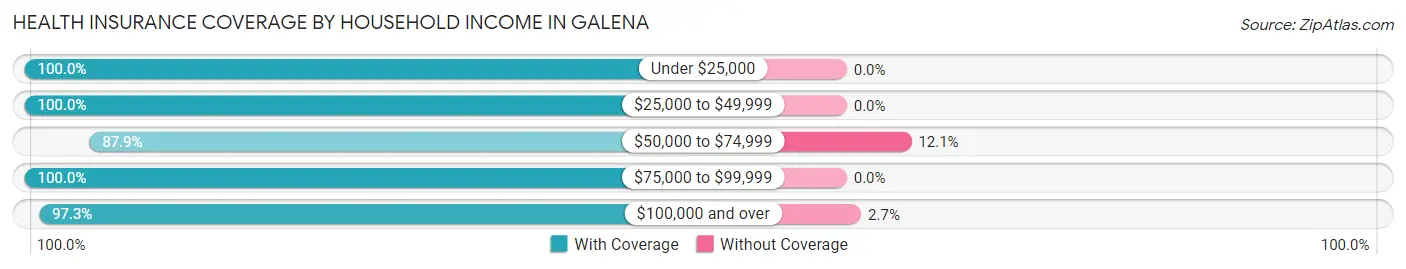
| Household Income | With Coverage | Without Coverage |
| Under $25,000 | 41 (100.0%) | 0 (0.0%) |
| $25,000 to $49,999 | 99 (100.0%) | 0 (0.0%) |
| $50,000 to $74,999 | 254 (87.9%) | 35 (12.1%) |
| $75,000 to $99,999 | 204 (100.0%) | 0 (0.0%) |
| $100,000 and over | 869 (97.3%) | 24 (2.7%) |
Public vs Private Health Insurance Coverage by Age in Galena
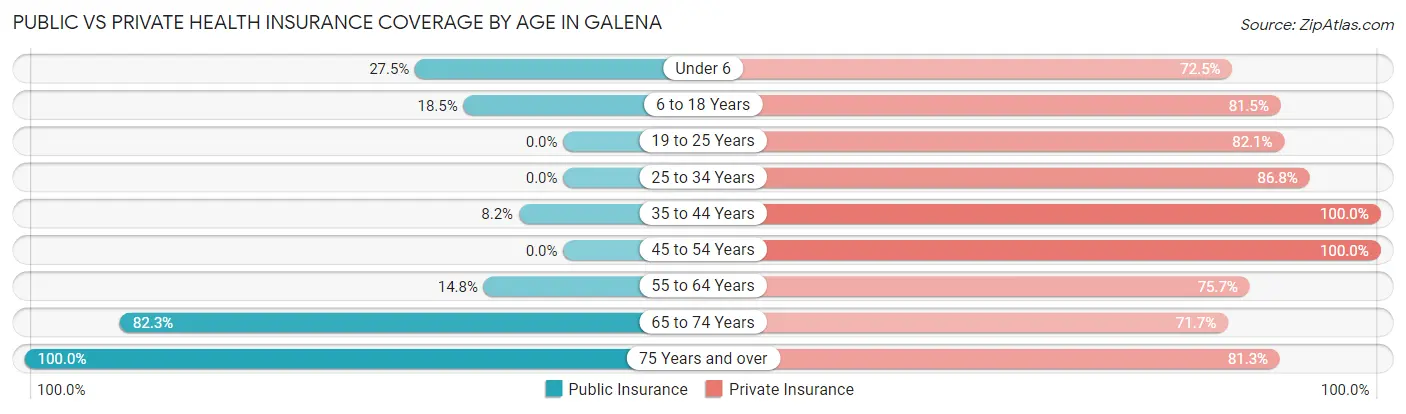
| Age Bracket | Public Insurance | Private Insurance |
| Under 6 | 33 (27.5%) | 87 (72.5%) |
| 6 to 18 Years | 63 (18.5%) | 277 (81.5%) |
| 19 to 25 Years | 0 (0.0%) | 46 (82.1%) |
| 25 to 34 Years | 0 (0.0%) | 165 (86.8%) |
| 35 to 44 Years | 15 (8.2%) | 182 (100.0%) |
| 45 to 54 Years | 0 (0.0%) | 224 (100.0%) |
| 55 to 64 Years | 31 (14.8%) | 159 (75.7%) |
| 65 to 74 Years | 93 (82.3%) | 81 (71.7%) |
| 75 Years and over | 91 (100.0%) | 74 (81.3%) |
| Total | 326 (21.4%) | 1,295 (84.9%) |
Disability Status by Sex by Age in Galena
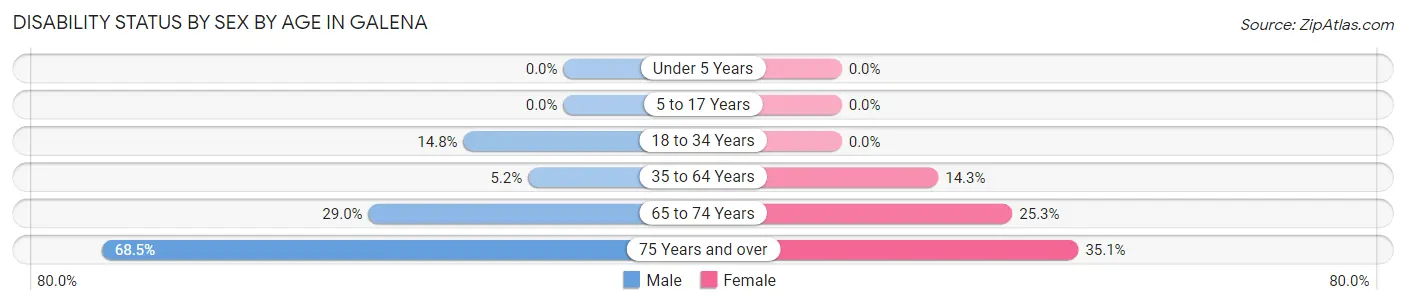
| Age Bracket | Male | Female |
| Under 5 Years | 0 (0.0%) | 0 (0.0%) |
| 5 to 17 Years | 0 (0.0%) | 0 (0.0%) |
| 18 to 34 Years | 23 (14.8%) | 0 (0.0%) |
| 35 to 64 Years | 14 (5.2%) | 50 (14.3%) |
| 65 to 74 Years | 11 (28.9%) | 19 (25.3%) |
| 75 Years and over | 37 (68.5%) | 13 (35.1%) |
Disability Class by Sex by Age in Galena
Disability Class: Hearing Difficulty
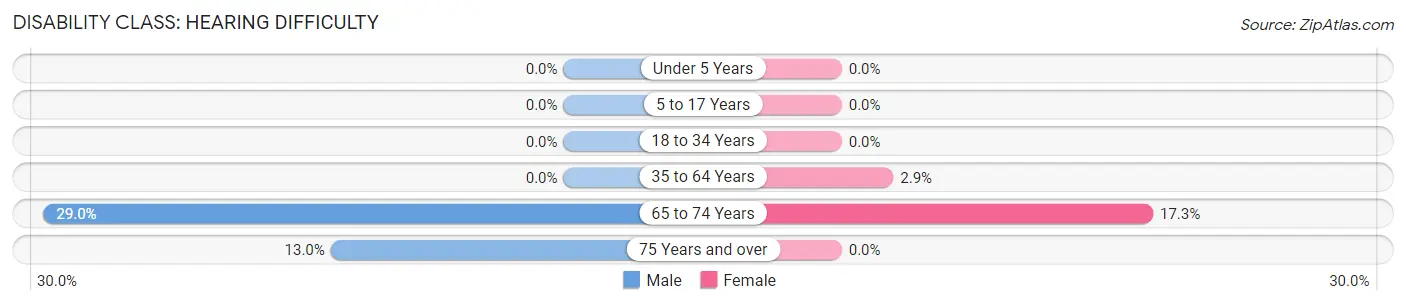
| Age Bracket | Male | Female |
| Under 5 Years | 0 (0.0%) | 0 (0.0%) |
| 5 to 17 Years | 0 (0.0%) | 0 (0.0%) |
| 18 to 34 Years | 0 (0.0%) | 0 (0.0%) |
| 35 to 64 Years | 0 (0.0%) | 10 (2.9%) |
| 65 to 74 Years | 11 (28.9%) | 13 (17.3%) |
| 75 Years and over | 7 (13.0%) | 0 (0.0%) |
Disability Class: Vision Difficulty
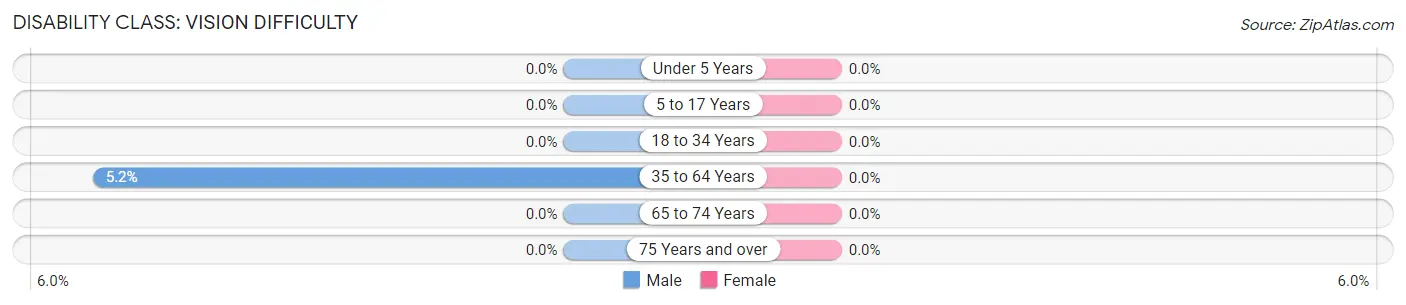
| Age Bracket | Male | Female |
| Under 5 Years | 0 (0.0%) | 0 (0.0%) |
| 5 to 17 Years | 0 (0.0%) | 0 (0.0%) |
| 18 to 34 Years | 0 (0.0%) | 0 (0.0%) |
| 35 to 64 Years | 14 (5.2%) | 0 (0.0%) |
| 65 to 74 Years | 0 (0.0%) | 0 (0.0%) |
| 75 Years and over | 0 (0.0%) | 0 (0.0%) |
Disability Class: Cognitive Difficulty
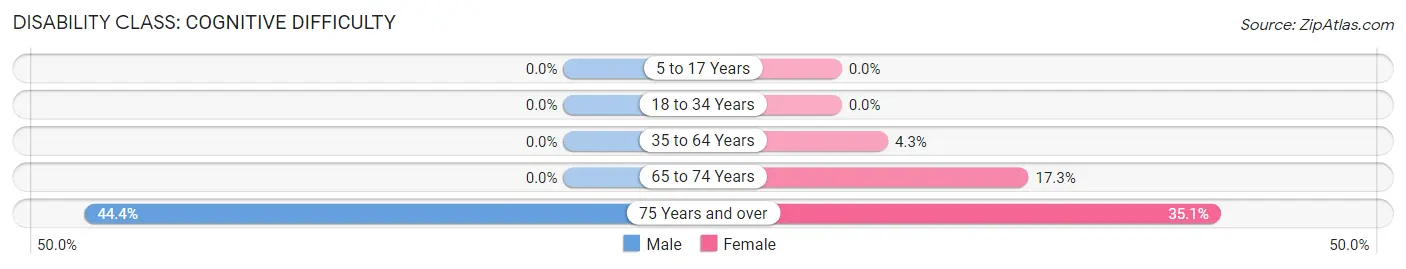
| Age Bracket | Male | Female |
| 5 to 17 Years | 0 (0.0%) | 0 (0.0%) |
| 18 to 34 Years | 0 (0.0%) | 0 (0.0%) |
| 35 to 64 Years | 0 (0.0%) | 15 (4.3%) |
| 65 to 74 Years | 0 (0.0%) | 13 (17.3%) |
| 75 Years and over | 24 (44.4%) | 13 (35.1%) |
Disability Class: Ambulatory Difficulty
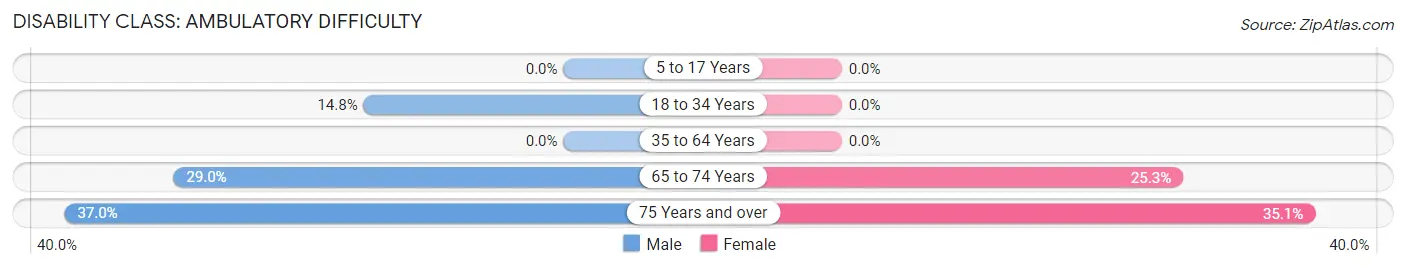
| Age Bracket | Male | Female |
| 5 to 17 Years | 0 (0.0%) | 0 (0.0%) |
| 18 to 34 Years | 23 (14.8%) | 0 (0.0%) |
| 35 to 64 Years | 0 (0.0%) | 0 (0.0%) |
| 65 to 74 Years | 11 (28.9%) | 19 (25.3%) |
| 75 Years and over | 20 (37.0%) | 13 (35.1%) |
Disability Class: Self-Care Difficulty
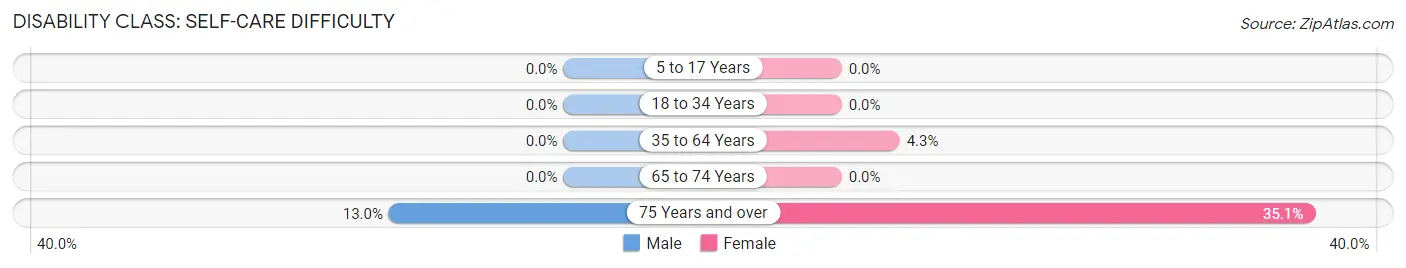
| Age Bracket | Male | Female |
| 5 to 17 Years | 0 (0.0%) | 0 (0.0%) |
| 18 to 34 Years | 0 (0.0%) | 0 (0.0%) |
| 35 to 64 Years | 0 (0.0%) | 15 (4.3%) |
| 65 to 74 Years | 0 (0.0%) | 0 (0.0%) |
| 75 Years and over | 7 (13.0%) | 13 (35.1%) |
Technology Access in Galena
Computing Device Access in Galena
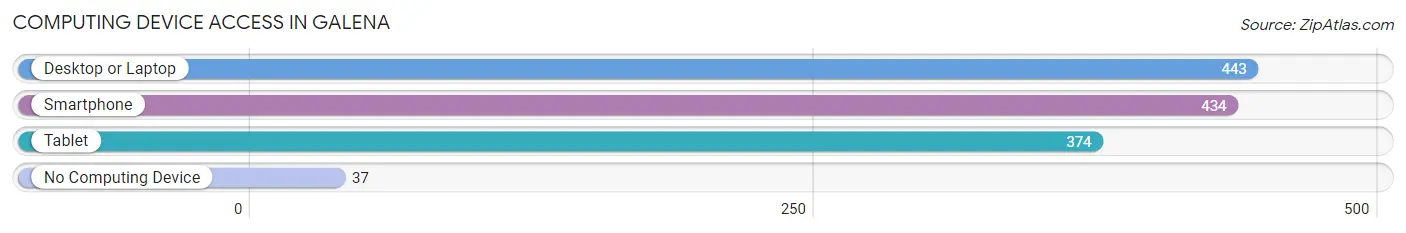
| Device Type | # Households | % Households |
| Desktop or Laptop | 443 | 90.6% |
| Smartphone | 434 | 88.7% |
| Tablet | 374 | 76.5% |
| No Computing Device | 37 | 7.6% |
| Total | 489 | 100.0% |
Internet Access in Galena
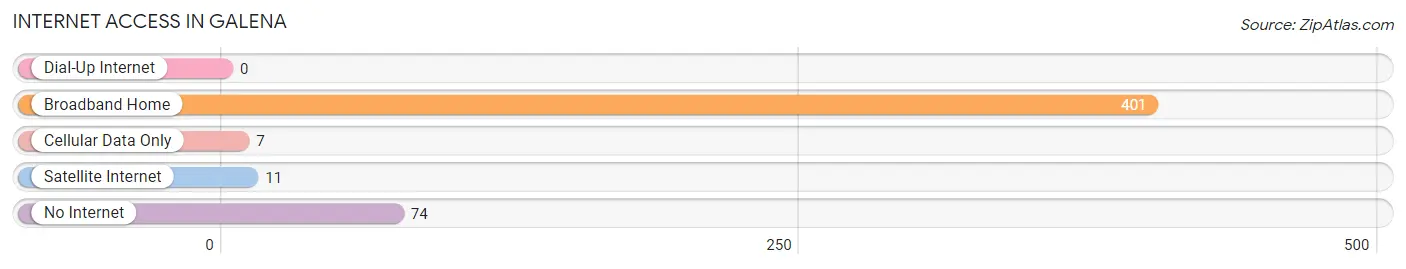
| Internet Type | # Households | % Households |
| Dial-Up Internet | 0 | 0.0% |
| Broadband Home | 401 | 82.0% |
| Cellular Data Only | 7 | 1.4% |
| Satellite Internet | 11 | 2.2% |
| No Internet | 74 | 15.1% |
| Total | 489 | 100.0% |
Galena Summary
Galena is a small town located in the state of Indiana, in the United States. It is situated in the southeastern part of the state, in the county of Dearborn. The town is located on the banks of the Ohio River, and is part of the Cincinnati metropolitan area. The population of Galena was estimated to be 1,845 in the year 2000.
History
Galena was first settled in 1818 by a group of settlers from Kentucky. The town was named after the mineral galena, which was found in the area. The town was incorporated in 1837, and the first post office was established in 1838.
The town was an important stop on the Underground Railroad, and was a major center of abolitionist activity in the mid-1800s. During the Civil War, the town was the site of a major battle between Union and Confederate forces.
Geography
Galena is located in the southeastern part of Indiana, in the county of Dearborn. The town is situated on the banks of the Ohio River, and is part of the Cincinnati metropolitan area. The town is located at an elevation of 590 feet above sea level.
The climate in Galena is humid continental, with hot summers and cold winters. The average annual temperature is around 50 degrees Fahrenheit. The average annual precipitation is around 40 inches.
Economy
The economy of Galena is largely based on agriculture and manufacturing. The town is home to several small businesses, including a furniture factory, a printing company, and a machine shop. The town also has a few restaurants and retail stores.
The town is also home to a number of tourist attractions, including the Galena Historic District, the Galena Museum, and the Galena Riverwalk.
Demographics
As of the year 2000, the population of Galena was estimated to be 1,845. The racial makeup of the town was 97.3% White, 0.7% African American, 0.3% Native American, 0.2% Asian, and 1.5% from other races. The median household income was $37,917, and the median family income was $45,917.
The town is served by the Dearborn County School District, which includes two elementary schools, one middle school, and one high school. The town also has a public library.
Conclusion
Galena is a small town located in the southeastern part of Indiana, in the county of Dearborn. The town is situated on the banks of the Ohio River, and is part of the Cincinnati metropolitan area. The population of Galena was estimated to be 1,845 in the year 2000. The economy of the town is largely based on agriculture and manufacturing, and the town is home to several tourist attractions. The racial makeup of the town is predominantly White, with a small percentage of African American, Native American, and Asian residents. The median household income is $37,917, and the median family income is $45,917. The town is served by the Dearborn County School District, which includes two elementary schools, one middle school, and one high school.
Common Questions
What is Per Capita Income in Galena?
Per Capita income in Galena is $38,606.
What is the Median Family Income in Galena?
Median Family Income in Galena is $105,960.
What is the Median Household income in Galena?
Median Household Income in Galena is $105,379.
What is Income or Wage Gap in Galena?
Income or Wage Gap in Galena is 50.9%.
Women in Galena earn 49.1 cents for every dollar earned by a man.
What is Inequality or Gini Index in Galena?
Inequality or Gini Index in Galena is 0.33.
What is the Total Population of Galena?
Total Population of Galena is 1,526.
What is the Total Male Population of Galena?
Total Male Population of Galena is 770.
What is the Total Female Population of Galena?
Total Female Population of Galena is 756.
What is the Ratio of Males per 100 Females in Galena?
There are 101.85 Males per 100 Females in Galena.
What is the Ratio of Females per 100 Males in Galena?
There are 98.18 Females per 100 Males in Galena.
What is the Median Population Age in Galena?
Median Population Age in Galena is 39.9 Years.
What is the Average Family Size in Galena
Average Family Size in Galena is 3.3 People.
What is the Average Household Size in Galena
Average Household Size in Galena is 3.1 People.
How Large is the Labor Force in Galena?
There are 755 People in the Labor Forcein in Galena.
What is the Percentage of People in the Labor Force in Galena?
69.1% of People are in the Labor Force in Galena.
What is the Unemployment Rate in Galena?
Unemployment Rate in Galena is 4.9%.