Clear Lake, IN Map & Demographics
Clear Lake Map
Clear Lake Overview
$105,556
PER CAPITA INCOME
$96,250
AVG FAMILY INCOME
$87,813
AVG HOUSEHOLD INCOME
0.59
INEQUALITY / GINI INDEX
396
TOTAL POPULATION
199
MALE POPULATION
197
FEMALE POPULATION
101.02
MALES / 100 FEMALES
98.99
FEMALES / 100 MALES
68.3
MEDIAN AGE
2.2
AVG FAMILY SIZE
1.8
AVG HOUSEHOLD SIZE
168
LABOR FORCE [ PEOPLE ]
44.0%
PERCENT IN LABOR FORCE
2.4%
UNEMPLOYMENT RATE
Income in Clear Lake
Income Overview in Clear Lake
Per Capita Income in Clear Lake is $105,556, while median incomes of families and households are $96,250 and $87,813 respectively.
| Characteristic | Number | Measure |
| Per Capita Income | 396 | $105,556 |
| Median Family Income | 141 | $96,250 |
| Mean Family Income | 141 | $238,286 |
| Median Household Income | 217 | $87,813 |
| Mean Household Income | 217 | $191,769 |
| Income Deficit | 141 | $0 |
| Wage / Income Gap (%) | 396 | 0.00% |
| Wage / Income Gap ($) | 396 | 100.00¢ per $1 |
| Gini / Inequality Index | 396 | 0.59 |
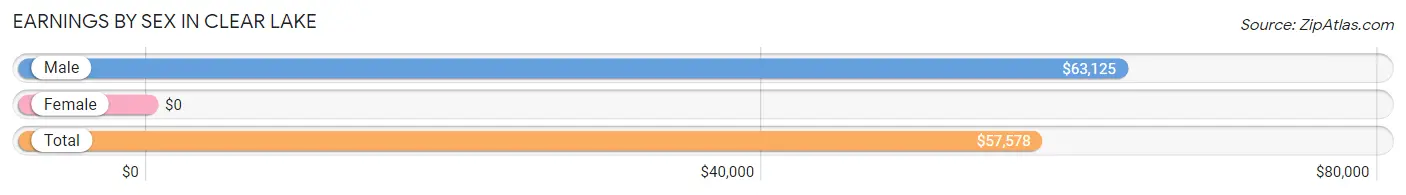
Earnings by Sex in Clear Lake
| Sex | Number | Average Earnings |
| Male | 114 (61.6%) | $63,125 |
| Female | 71 (38.4%) | $0 |
| Total | 185 (100.0%) | $57,578 |
Earnings by Sex by Income Bracket in Clear Lake
The most common earnings brackets in Clear Lake are $100,000+ for men (44 | 38.6%) and $5,000 to $7,499 for women (14 | 19.7%).

| Income | Male | Female |
| $2,499 or less | 3 (2.6%) | 8 (11.3%) |
| $2,500 to $4,999 | 2 (1.8%) | 1 (1.4%) |
| $5,000 to $7,499 | 3 (2.6%) | 14 (19.7%) |
| $7,500 to $9,999 | 0 (0.0%) | 9 (12.7%) |
| $10,000 to $12,499 | 1 (0.9%) | 0 (0.0%) |
| $12,500 to $14,999 | 2 (1.8%) | 1 (1.4%) |
| $15,000 to $17,499 | 3 (2.6%) | 0 (0.0%) |
| $17,500 to $19,999 | 0 (0.0%) | 5 (7.0%) |
| $20,000 to $22,499 | 0 (0.0%) | 0 (0.0%) |
| $22,500 to $24,999 | 0 (0.0%) | 0 (0.0%) |
| $25,000 to $29,999 | 6 (5.3%) | 1 (1.4%) |
| $30,000 to $34,999 | 9 (7.9%) | 3 (4.2%) |
| $35,000 to $39,999 | 8 (7.0%) | 5 (7.0%) |
| $40,000 to $44,999 | 1 (0.9%) | 2 (2.8%) |
| $45,000 to $49,999 | 2 (1.8%) | 2 (2.8%) |
| $50,000 to $54,999 | 0 (0.0%) | 0 (0.0%) |
| $55,000 to $64,999 | 20 (17.5%) | 1 (1.4%) |
| $65,000 to $74,999 | 3 (2.6%) | 2 (2.8%) |
| $75,000 to $99,999 | 7 (6.1%) | 8 (11.3%) |
| $100,000+ | 44 (38.6%) | 9 (12.7%) |
| Total | 114 (100.0%) | 71 (100.0%) |
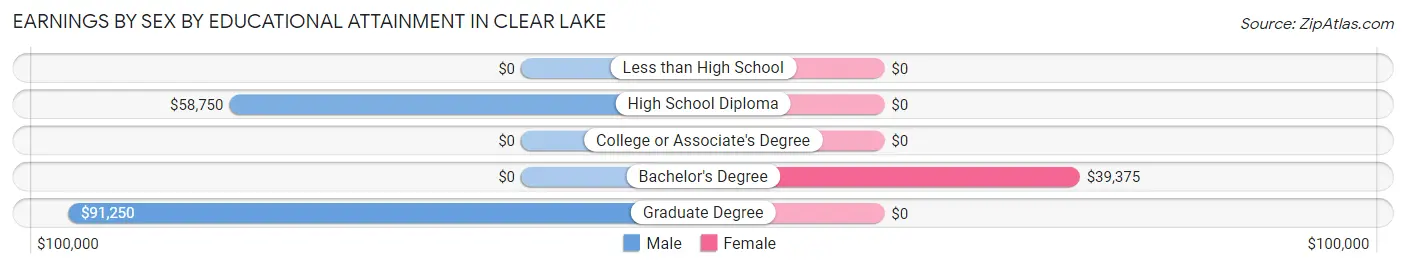
Earnings by Sex by Educational Attainment in Clear Lake
| Educational Attainment | Male Income | Female Income |
| Less than High School | - | - |
| High School Diploma | $58,750 | $0 |
| College or Associate's Degree | - | - |
| Bachelor's Degree | - | - |
| Graduate Degree | $91,250 | $0 |
| Total | $63,750 | $0 |
Family Income in Clear Lake
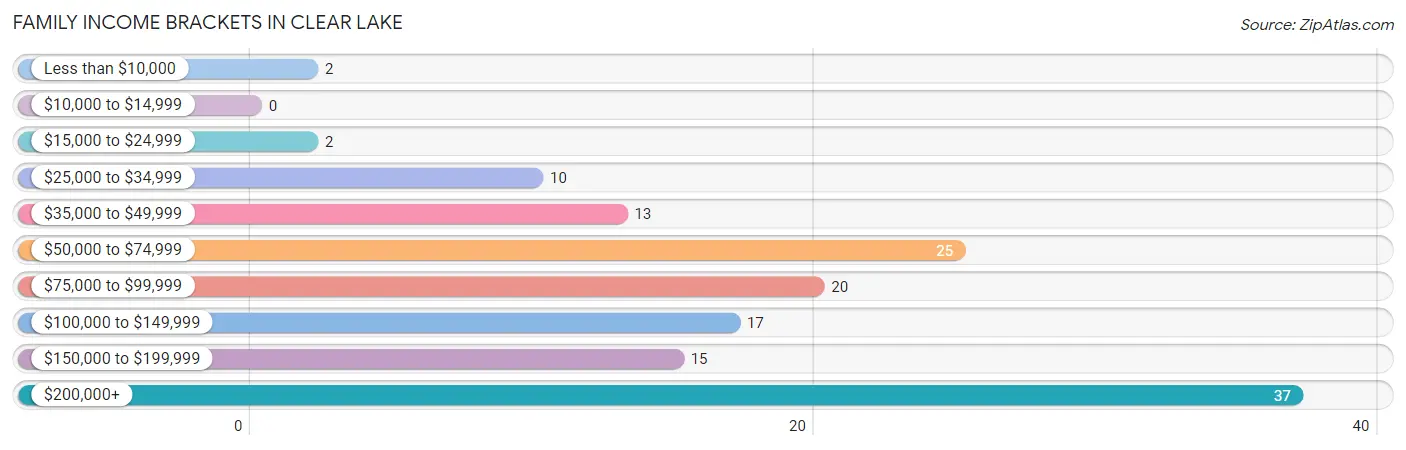
Family Income Brackets in Clear Lake
According to the Clear Lake family income data, there are 37 families falling into the $200,000+ income range, which is the most common income bracket and makes up 26.2% of all families.
| Income Bracket | # Families | % Families |
| Less than $10,000 | 2 | 1.4% |
| $10,000 to $14,999 | 0 | 0.0% |
| $15,000 to $24,999 | 2 | 1.4% |
| $25,000 to $34,999 | 10 | 7.1% |
| $35,000 to $49,999 | 13 | 9.2% |
| $50,000 to $74,999 | 25 | 17.7% |
| $75,000 to $99,999 | 20 | 14.2% |
| $100,000 to $149,999 | 17 | 12.1% |
| $150,000 to $199,999 | 15 | 10.6% |
| $200,000+ | 37 | 26.2% |
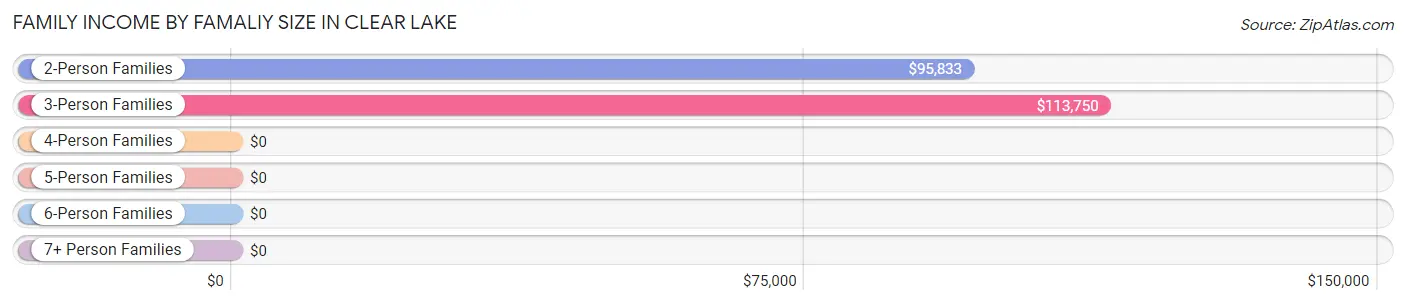
Family Income by Famaliy Size in Clear Lake
3-person families (16 | 11.4%) account for the highest median family income in Clear Lake with $113,750 per family, while 2-person families (122 | 86.5%) have the highest median income of $47,916 per family member.
| Income Bracket | # Families | Median Income |
| 2-Person Families | 122 (86.5%) | $95,833 |
| 3-Person Families | 16 (11.4%) | $113,750 |
| 4-Person Families | 0 (0.0%) | $0 |
| 5-Person Families | 2 (1.4%) | $0 |
| 6-Person Families | 1 (0.7%) | $0 |
| 7+ Person Families | 0 (0.0%) | $0 |
| Total | 141 (100.0%) | $96,250 |
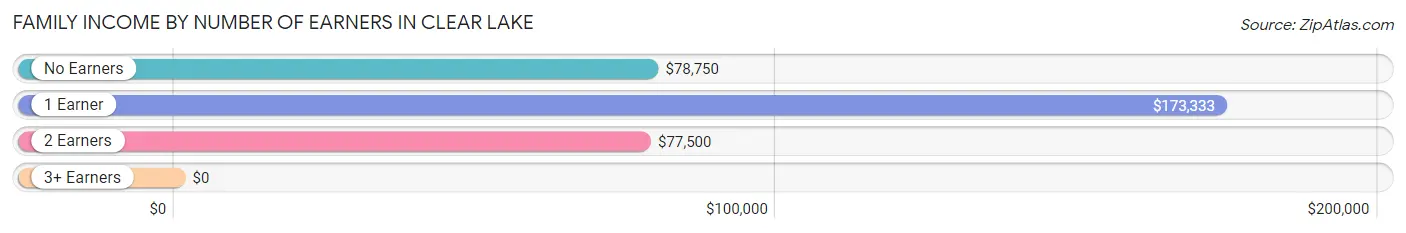
Family Income by Number of Earners in Clear Lake
| Number of Earners | # Families | Median Income |
| No Earners | 39 (27.7%) | $78,750 |
| 1 Earner | 56 (39.7%) | $173,333 |
| 2 Earners | 44 (31.2%) | $77,500 |
| 3+ Earners | 2 (1.4%) | $0 |
| Total | 141 (100.0%) | $96,250 |
Household Income in Clear Lake
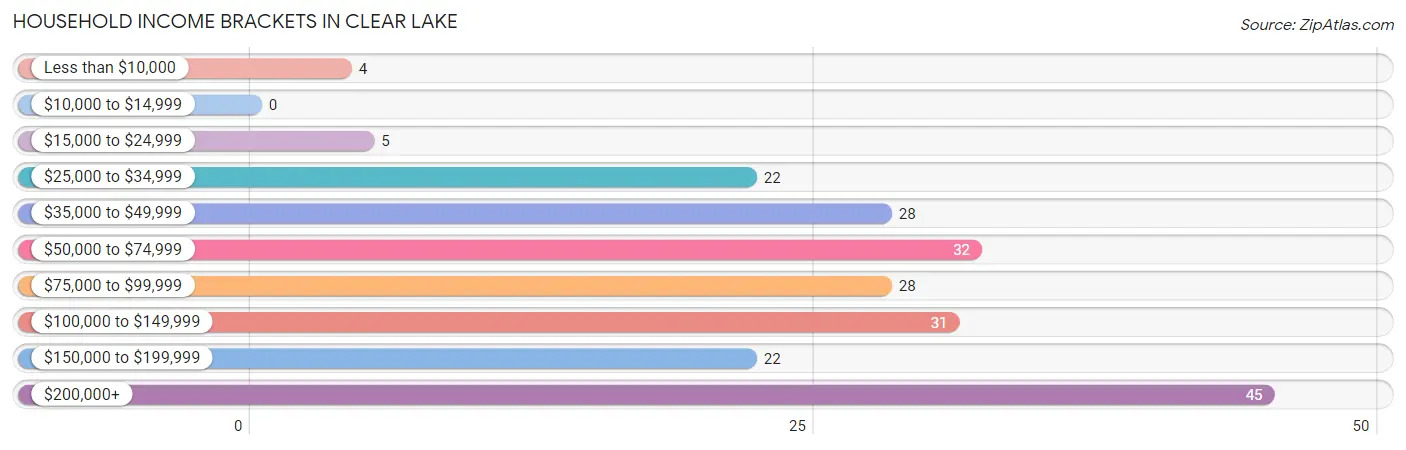
Household Income Brackets in Clear Lake
With 45 households falling in the category, the $200,000+ income range is the most frequent in Clear Lake, accounting for 20.7% of all households.
| Income Bracket | # Households | % Households |
| Less than $10,000 | 4 | 1.8% |
| $10,000 to $14,999 | 0 | 0.0% |
| $15,000 to $24,999 | 5 | 2.3% |
| $25,000 to $34,999 | 22 | 10.1% |
| $35,000 to $49,999 | 28 | 12.9% |
| $50,000 to $74,999 | 32 | 14.7% |
| $75,000 to $99,999 | 28 | 12.9% |
| $100,000 to $149,999 | 31 | 14.3% |
| $150,000 to $199,999 | 22 | 10.1% |
| $200,000+ | 45 | 20.7% |
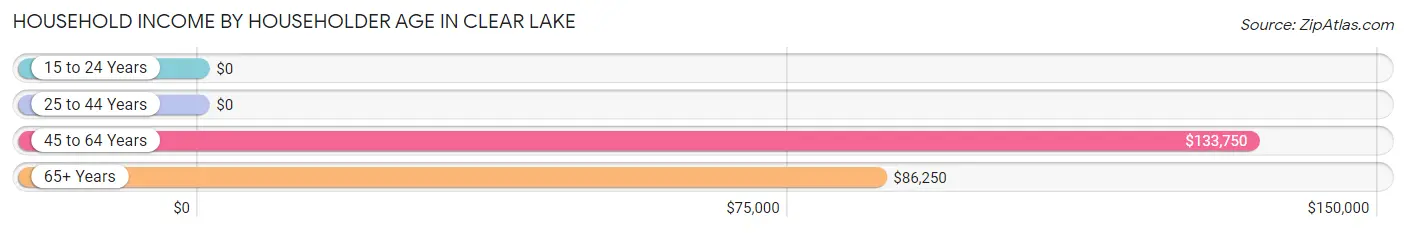
Household Income by Householder Age in Clear Lake
The median household income in Clear Lake is $87,813, with the highest median household income of $133,750 found in the 45 to 64 years age bracket for the primary householder. A total of 47 households (21.7%) fall into this category.
| Income Bracket | # Households | Median Income |
| 15 to 24 Years | 0 (0.0%) | $0 |
| 25 to 44 Years | 18 (8.3%) | $0 |
| 45 to 64 Years | 47 (21.7%) | $133,750 |
| 65+ Years | 152 (70.1%) | $86,250 |
| Total | 217 (100.0%) | $87,813 |
Poverty in Clear Lake
Income Below Poverty by Sex and Age in Clear Lake
With 2.5% poverty level for males and 1.0% for females among the residents of Clear Lake, 45 to 54 year old males and 75 year old and over females are the most vulnerable to poverty, with 2 males (9.5%) and 2 females (3.5%) in their respective age groups living below the poverty level.
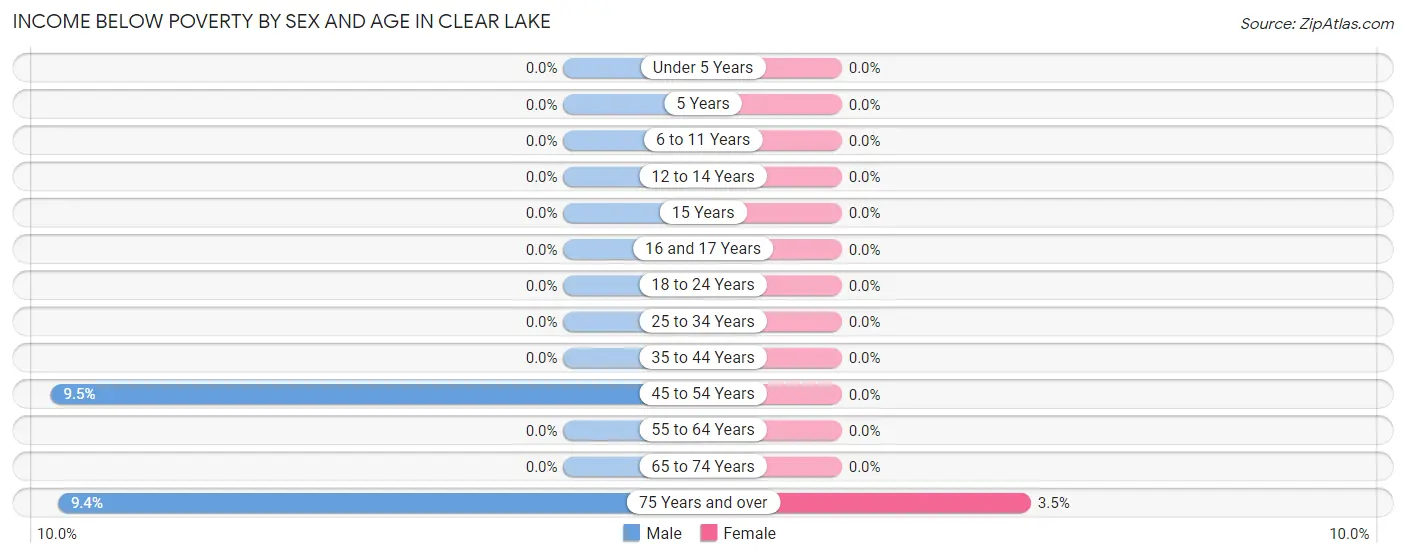
| Age Bracket | Male | Female |
| Under 5 Years | 0 (0.0%) | 0 (0.0%) |
| 5 Years | 0 (0.0%) | 0 (0.0%) |
| 6 to 11 Years | 0 (0.0%) | 0 (0.0%) |
| 12 to 14 Years | 0 (0.0%) | 0 (0.0%) |
| 15 Years | 0 (0.0%) | 0 (0.0%) |
| 16 and 17 Years | 0 (0.0%) | 0 (0.0%) |
| 18 to 24 Years | 0 (0.0%) | 0 (0.0%) |
| 25 to 34 Years | 0 (0.0%) | 0 (0.0%) |
| 35 to 44 Years | 0 (0.0%) | 0 (0.0%) |
| 45 to 54 Years | 2 (9.5%) | 0 (0.0%) |
| 55 to 64 Years | 0 (0.0%) | 0 (0.0%) |
| 65 to 74 Years | 0 (0.0%) | 0 (0.0%) |
| 75 Years and over | 3 (9.4%) | 2 (3.5%) |
| Total | 5 (2.5%) | 2 (1.0%) |
Income Above Poverty by Sex and Age in Clear Lake
According to the poverty statistics in Clear Lake, males aged under 5 years and females aged under 5 years are the age groups that are most secure financially, with 100.0% of males and 100.0% of females in these age groups living above the poverty line.
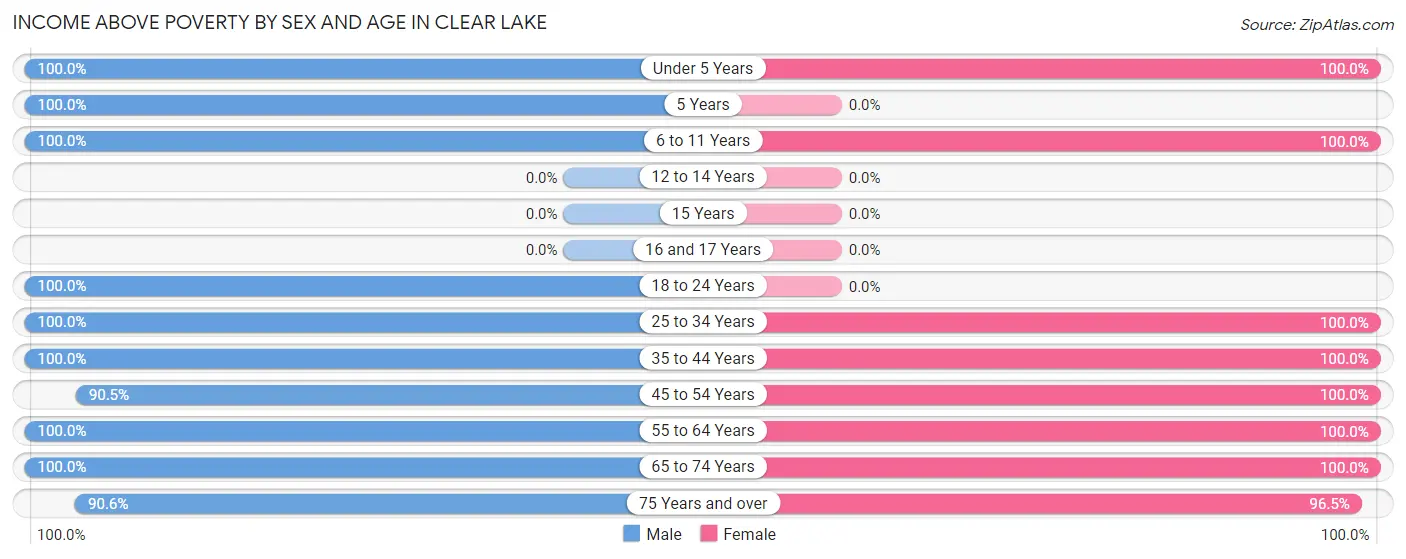
| Age Bracket | Male | Female |
| Under 5 Years | 5 (100.0%) | 1 (100.0%) |
| 5 Years | 1 (100.0%) | 0 (0.0%) |
| 6 to 11 Years | 5 (100.0%) | 2 (100.0%) |
| 12 to 14 Years | 0 (0.0%) | 0 (0.0%) |
| 15 Years | 0 (0.0%) | 0 (0.0%) |
| 16 and 17 Years | 0 (0.0%) | 0 (0.0%) |
| 18 to 24 Years | 2 (100.0%) | 0 (0.0%) |
| 25 to 34 Years | 9 (100.0%) | 6 (100.0%) |
| 35 to 44 Years | 12 (100.0%) | 6 (100.0%) |
| 45 to 54 Years | 19 (90.5%) | 20 (100.0%) |
| 55 to 64 Years | 46 (100.0%) | 33 (100.0%) |
| 65 to 74 Years | 66 (100.0%) | 72 (100.0%) |
| 75 Years and over | 29 (90.6%) | 55 (96.5%) |
| Total | 194 (97.5%) | 195 (99.0%) |
Income Below Poverty Among Married-Couple Families in Clear Lake
The poverty statistics for married-couple families in Clear Lake show that 1.5% or 2 of the total 133 families live below the poverty line. Families with no children have the highest poverty rate of 1.6%, comprising of 2 families. On the other hand, families with 1 or 2 children have the lowest poverty rate of 0.0%, which includes 0 families.
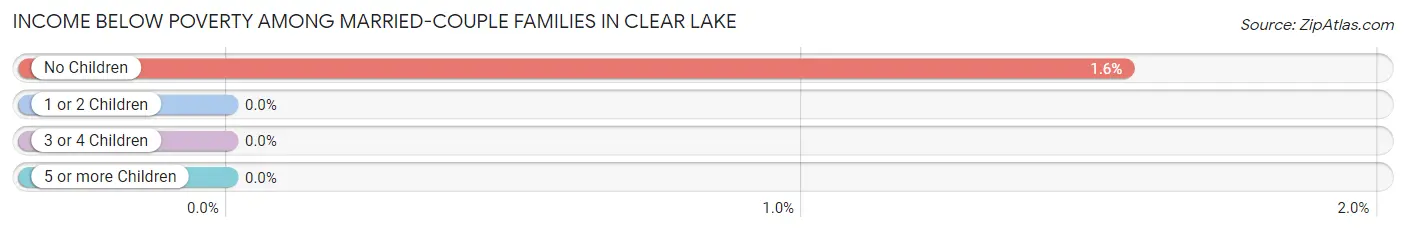
| Children | Above Poverty | Below Poverty |
| No Children | 126 (98.4%) | 2 (1.6%) |
| 1 or 2 Children | 2 (100.0%) | 0 (0.0%) |
| 3 or 4 Children | 3 (100.0%) | 0 (0.0%) |
| 5 or more Children | 0 (0.0%) | 0 (0.0%) |
| Total | 131 (98.5%) | 2 (1.5%) |
Income Below Poverty Among Single-Parent Households in Clear Lake
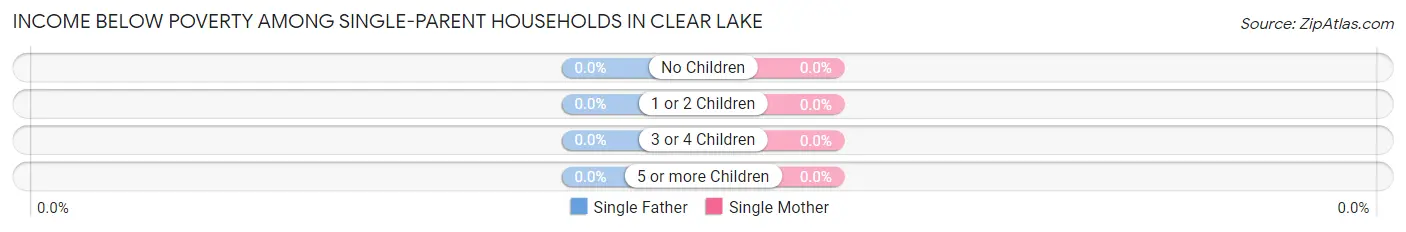
| Children | Single Father | Single Mother |
| No Children | 0 (0.0%) | 0 (0.0%) |
| 1 or 2 Children | 0 (0.0%) | 0 (0.0%) |
| 3 or 4 Children | 0 (0.0%) | 0 (0.0%) |
| 5 or more Children | 0 (0.0%) | 0 (0.0%) |
| Total | 0 (0.0%) | 0 (0.0%) |
Income Below Poverty Among Married-Couple vs Single-Parent Households in Clear Lake
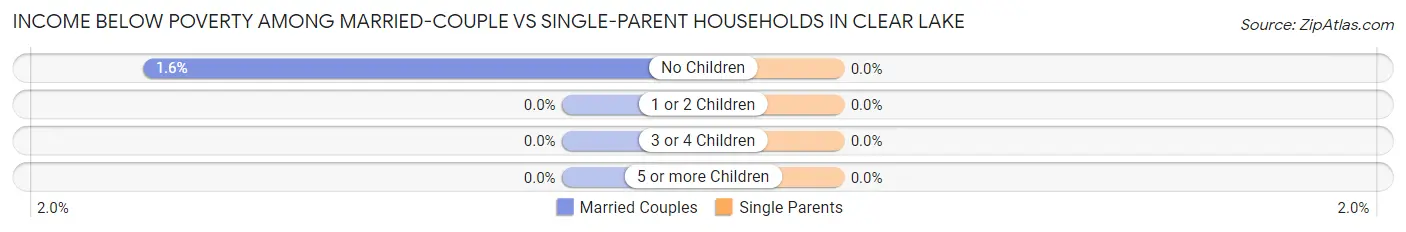
| Children | Married-Couple Families | Single-Parent Households |
| No Children | 2 (1.6%) | 0 (0.0%) |
| 1 or 2 Children | 0 (0.0%) | 0 (0.0%) |
| 3 or 4 Children | 0 (0.0%) | 0 (0.0%) |
| 5 or more Children | 0 (0.0%) | 0 (0.0%) |
| Total | 2 (1.5%) | 0 (0.0%) |
Race in Clear Lake
The most populous races in Clear Lake are White / Caucasian (388 | 98.0%), Asian (4 | 1.0%), and Some other Race (4 | 1.0%).
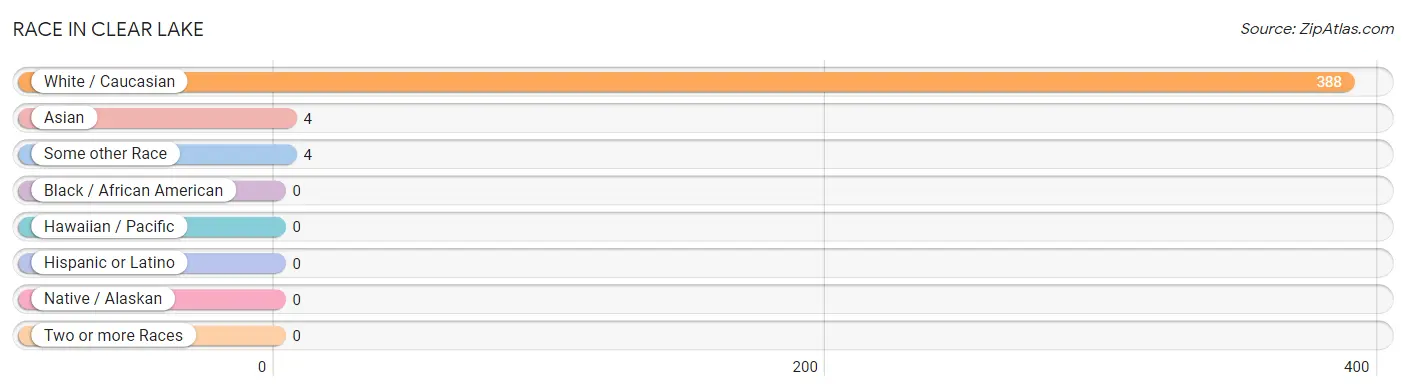
| Race | # Population | % Population |
| Asian | 4 | 1.0% |
| Black / African American | 0 | 0.0% |
| Hawaiian / Pacific | 0 | 0.0% |
| Hispanic or Latino | 0 | 0.0% |
| Native / Alaskan | 0 | 0.0% |
| White / Caucasian | 388 | 98.0% |
| Two or more Races | 0 | 0.0% |
| Some other Race | 4 | 1.0% |
| Total | 396 | 100.0% |
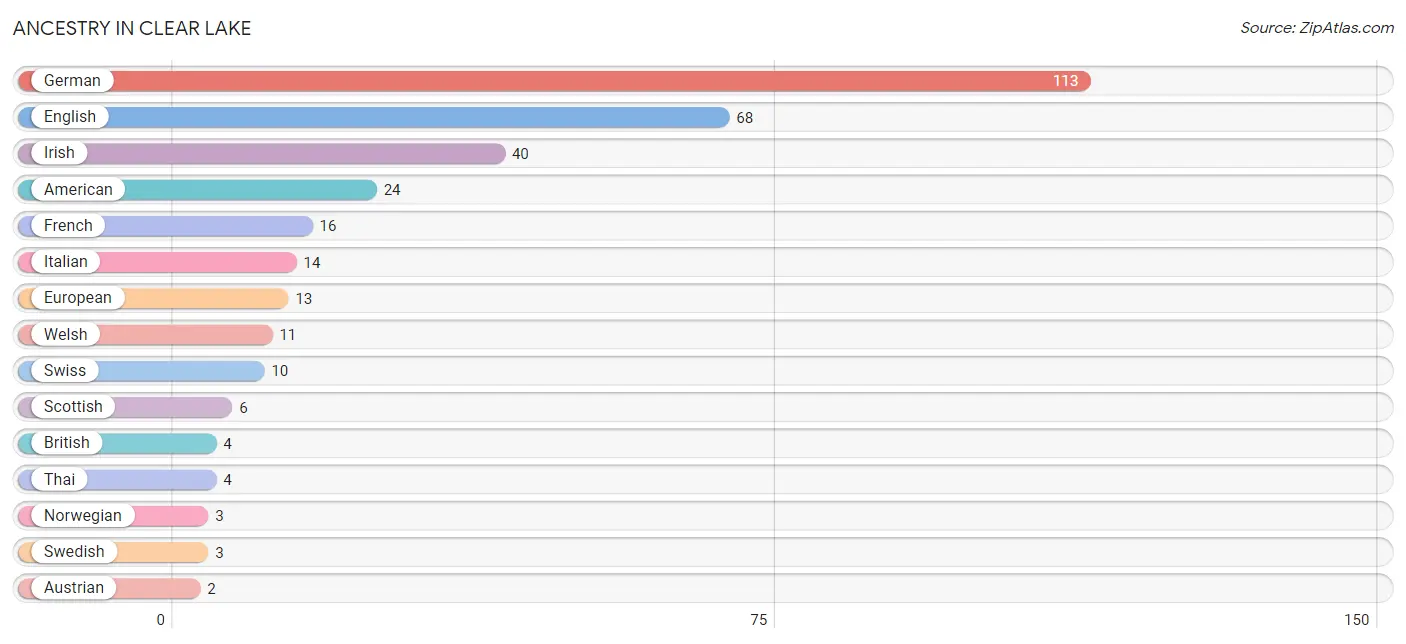
Ancestry in Clear Lake
The most populous ancestries reported in Clear Lake are German (113 | 28.5%), English (68 | 17.2%), Irish (40 | 10.1%), American (24 | 6.1%), and French (16 | 4.0%), together accounting for 65.9% of all Clear Lake residents.
| Ancestry | # Population | % Population |
| American | 24 | 6.1% |
| Arab | 1 | 0.3% |
| Austrian | 2 | 0.5% |
| British | 4 | 1.0% |
| Danish | 2 | 0.5% |
| Eastern European | 2 | 0.5% |
| English | 68 | 17.2% |
| European | 13 | 3.3% |
| French | 16 | 4.0% |
| German | 113 | 28.5% |
| Greek | 1 | 0.3% |
| Hungarian | 1 | 0.3% |
| Irish | 40 | 10.1% |
| Italian | 14 | 3.5% |
| Norwegian | 3 | 0.8% |
| Polish | 2 | 0.5% |
| Scandinavian | 1 | 0.3% |
| Scotch-Irish | 2 | 0.5% |
| Scottish | 6 | 1.5% |
| Swedish | 3 | 0.8% |
| Swiss | 10 | 2.5% |
| Syrian | 1 | 0.3% |
| Thai | 4 | 1.0% |
| Ukrainian | 1 | 0.3% |
| Welsh | 11 | 2.8% | View All 25 Rows |
Immigrants in Clear Lake
The most numerous immigrant groups reported in Clear Lake came from Asia (4 | 1.0%), India (4 | 1.0%), and South Central Asia (4 | 1.0%), together accounting for 3.0% of all Clear Lake residents.
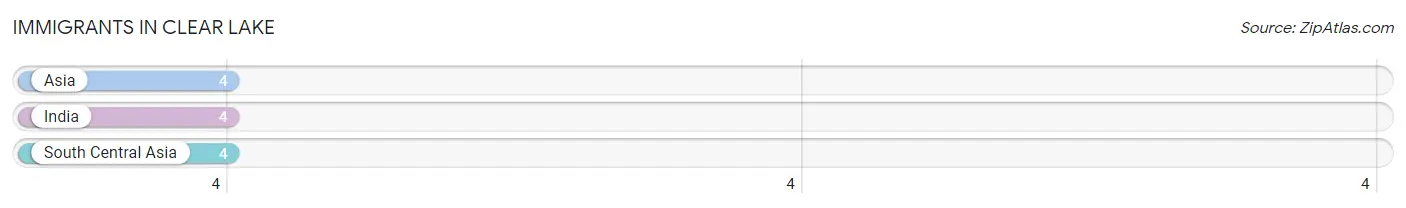
| Immigration Origin | # Population | % Population |
| Asia | 4 | 1.0% |
| India | 4 | 1.0% |
| South Central Asia | 4 | 1.0% | View All 3 Rows |
Sex and Age in Clear Lake
Sex and Age in Clear Lake
The most populous age groups in Clear Lake are 70 to 74 Years (40 | 20.1%) for men and 65 to 69 Years (40 | 20.3%) for women.
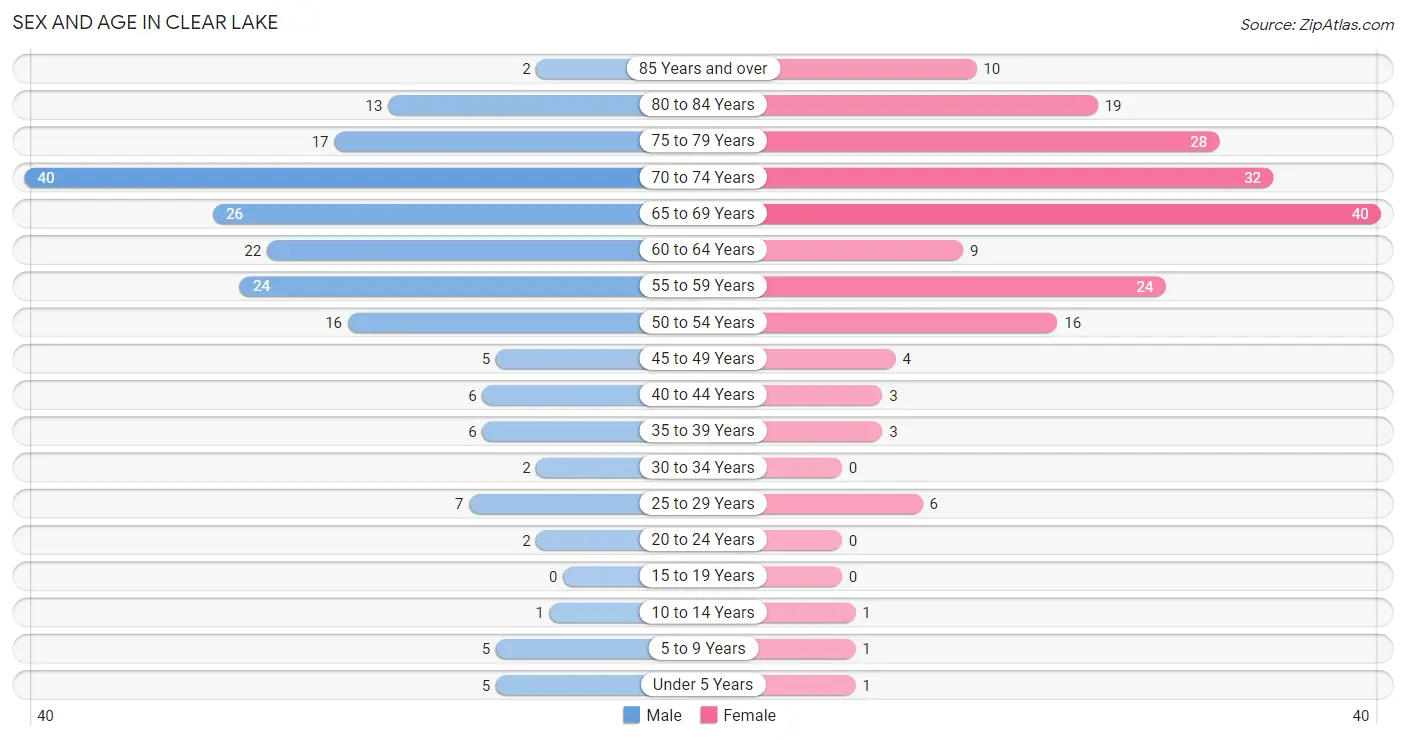
| Age Bracket | Male | Female |
| Under 5 Years | 5 (2.5%) | 1 (0.5%) |
| 5 to 9 Years | 5 (2.5%) | 1 (0.5%) |
| 10 to 14 Years | 1 (0.5%) | 1 (0.5%) |
| 15 to 19 Years | 0 (0.0%) | 0 (0.0%) |
| 20 to 24 Years | 2 (1.0%) | 0 (0.0%) |
| 25 to 29 Years | 7 (3.5%) | 6 (3.0%) |
| 30 to 34 Years | 2 (1.0%) | 0 (0.0%) |
| 35 to 39 Years | 6 (3.0%) | 3 (1.5%) |
| 40 to 44 Years | 6 (3.0%) | 3 (1.5%) |
| 45 to 49 Years | 5 (2.5%) | 4 (2.0%) |
| 50 to 54 Years | 16 (8.0%) | 16 (8.1%) |
| 55 to 59 Years | 24 (12.1%) | 24 (12.2%) |
| 60 to 64 Years | 22 (11.1%) | 9 (4.6%) |
| 65 to 69 Years | 26 (13.1%) | 40 (20.3%) |
| 70 to 74 Years | 40 (20.1%) | 32 (16.2%) |
| 75 to 79 Years | 17 (8.5%) | 28 (14.2%) |
| 80 to 84 Years | 13 (6.5%) | 19 (9.6%) |
| 85 Years and over | 2 (1.0%) | 10 (5.1%) |
| Total | 199 (100.0%) | 197 (100.0%) |
Families and Households in Clear Lake
Median Family Size in Clear Lake
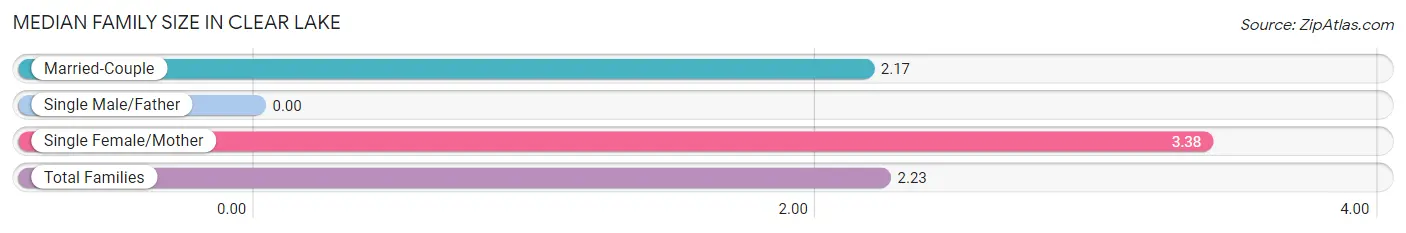
| Family Type | # Families | Family Size |
| Married-Couple | 133 (94.3%) | 2.17 |
| Single Male/Father | 0 (0.0%) | - |
| Single Female/Mother | 8 (5.7%) | 3.38 |
| Total Families | 141 (100.0%) | 2.23 |
Median Household Size in Clear Lake
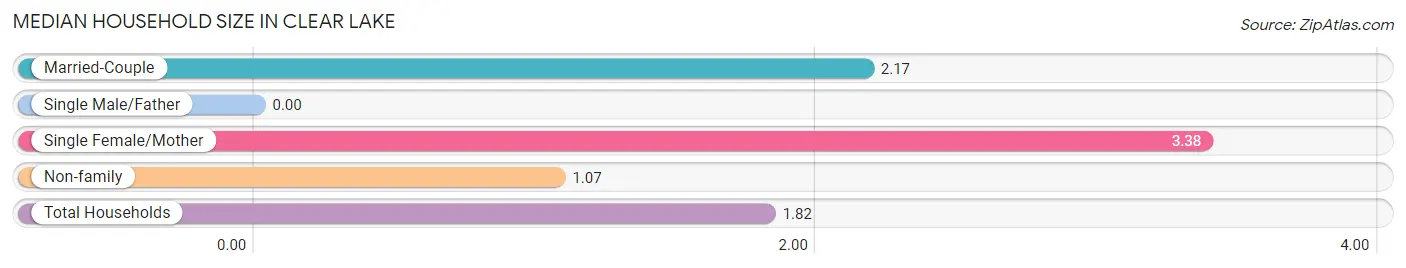
| Household Type | # Households | Household Size |
| Married-Couple | 133 (61.3%) | 2.17 |
| Single Male/Father | 0 (0.0%) | - |
| Single Female/Mother | 8 (3.7%) | 3.38 |
| Non-family | 76 (35.0%) | 1.07 |
| Total Households | 217 (100.0%) | 1.82 |
Household Size by Marriage Status in Clear Lake
Out of a total of 217 households in Clear Lake, 141 (65.0%) are family households, while 76 (35.0%) are nonfamily households. The most numerous type of family households are 2-person households, comprising 122, and the most common type of nonfamily households are 1-person households, comprising 71.
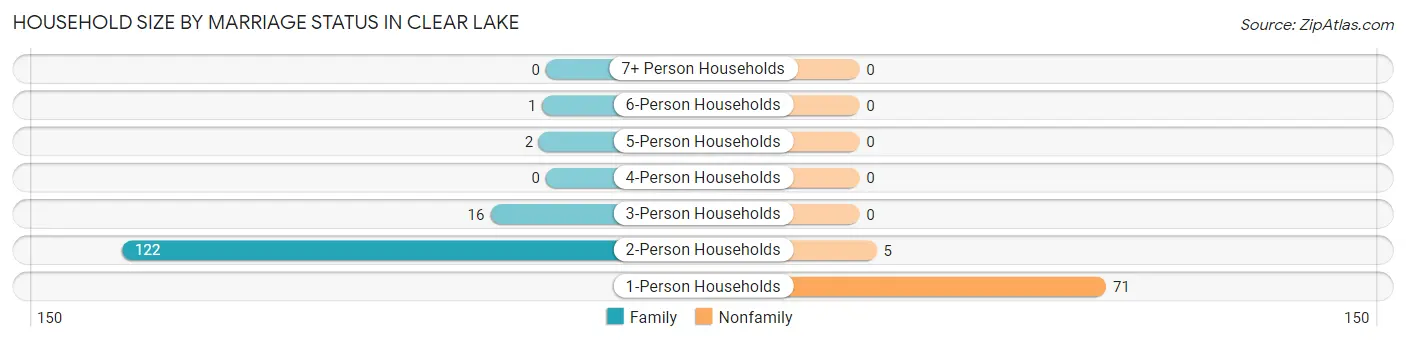
| Household Size | Family Households | Nonfamily Households |
| 1-Person Households | - | 71 (32.7%) |
| 2-Person Households | 122 (56.2%) | 5 (2.3%) |
| 3-Person Households | 16 (7.4%) | 0 (0.0%) |
| 4-Person Households | 0 (0.0%) | 0 (0.0%) |
| 5-Person Households | 2 (0.9%) | 0 (0.0%) |
| 6-Person Households | 1 (0.5%) | 0 (0.0%) |
| 7+ Person Households | 0 (0.0%) | 0 (0.0%) |
| Total | 141 (65.0%) | 76 (35.0%) |
Female Fertility in Clear Lake
Fertility by Age in Clear Lake
Average fertility rate in Clear Lake is 105.0 births per 1,000 women. Women in the age bracket of 20 to 34 years have the highest fertility rate with 333.0 births per 1,000 women. Women in the age bracket of 20 to 34 years acount for 100.0% of all women with births.
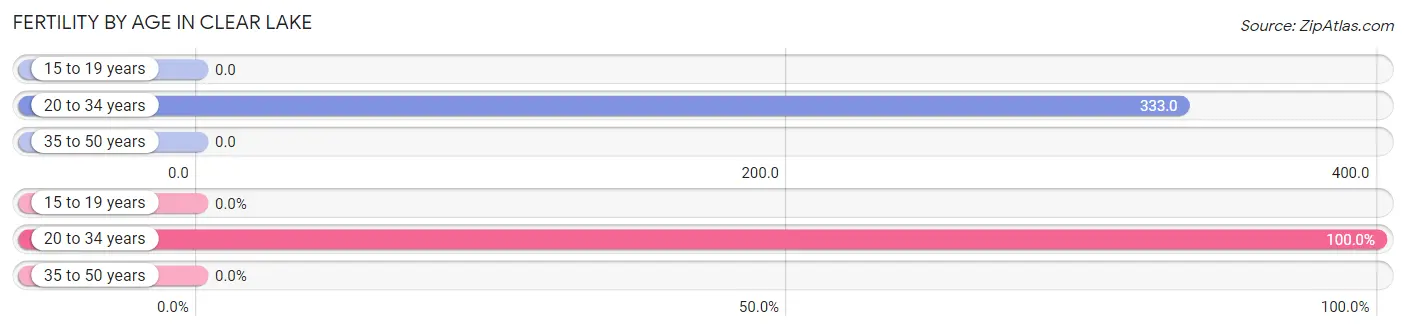
| Age Bracket | Women with Births | Births / 1,000 Women |
| 15 to 19 years | 0 (0.0%) | 0.0 |
| 20 to 34 years | 2 (100.0%) | 333.0 |
| 35 to 50 years | 0 (0.0%) | 0.0 |
| Total | 2 (100.0%) | 105.0 |
Fertility by Age by Marriage Status in Clear Lake
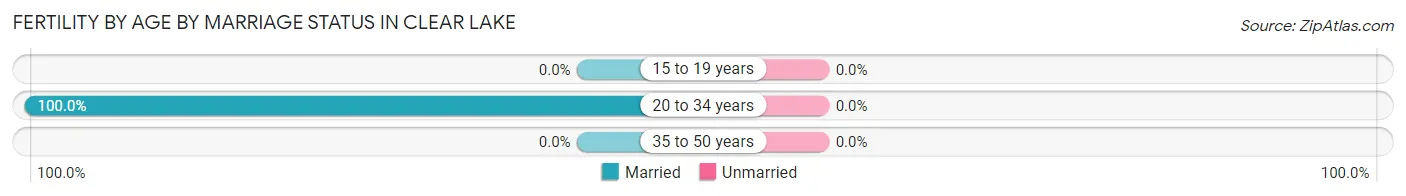
| Age Bracket | Married | Unmarried |
| 15 to 19 years | 0 (0.0%) | 0 (0.0%) |
| 20 to 34 years | 2 (100.0%) | 0 (0.0%) |
| 35 to 50 years | 0 (0.0%) | 0 (0.0%) |
| Total | 2 (100.0%) | 0 (0.0%) |
Fertility by Education in Clear Lake
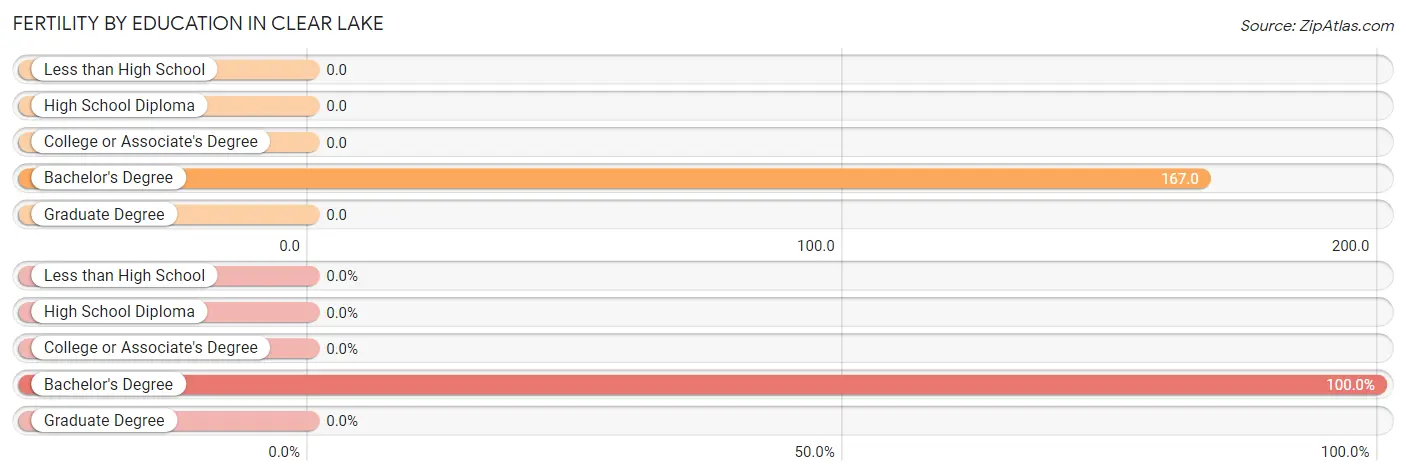
| Educational Attainment | Women with Births | Births / 1,000 Women |
| Less than High School | 0 (0.0%) | 0.0 |
| High School Diploma | 0 (0.0%) | 0.0 |
| College or Associate's Degree | 0 (0.0%) | 0.0 |
| Bachelor's Degree | 2 (100.0%) | 167.0 |
| Graduate Degree | 0 (0.0%) | 0.0 |
| Total | 2 (100.0%) | 105.0 |
Fertility by Education by Marriage Status in Clear Lake
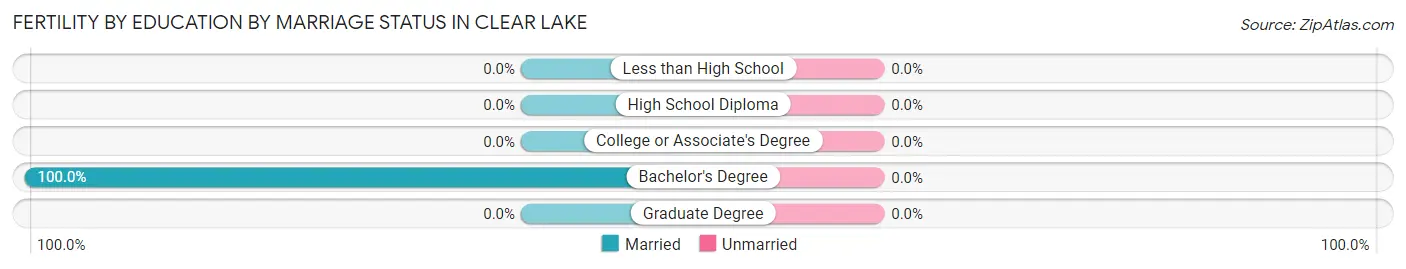
| Educational Attainment | Married | Unmarried |
| Less than High School | 0 (0.0%) | 0 (0.0%) |
| High School Diploma | 0 (0.0%) | 0 (0.0%) |
| College or Associate's Degree | 0 (0.0%) | 0 (0.0%) |
| Bachelor's Degree | 2 (100.0%) | 0 (0.0%) |
| Graduate Degree | 0 (0.0%) | 0 (0.0%) |
| Total | 2 (100.0%) | 0 (0.0%) |
Employment Characteristics in Clear Lake
Employment by Class of Employer in Clear Lake
Among the 164 employed individuals in Clear Lake, private company employees (106 | 64.6%), self-employed (not incorporated) (31 | 18.9%), and self-employed (incorporated) (9 | 5.5%) make up the most common classes of employment.
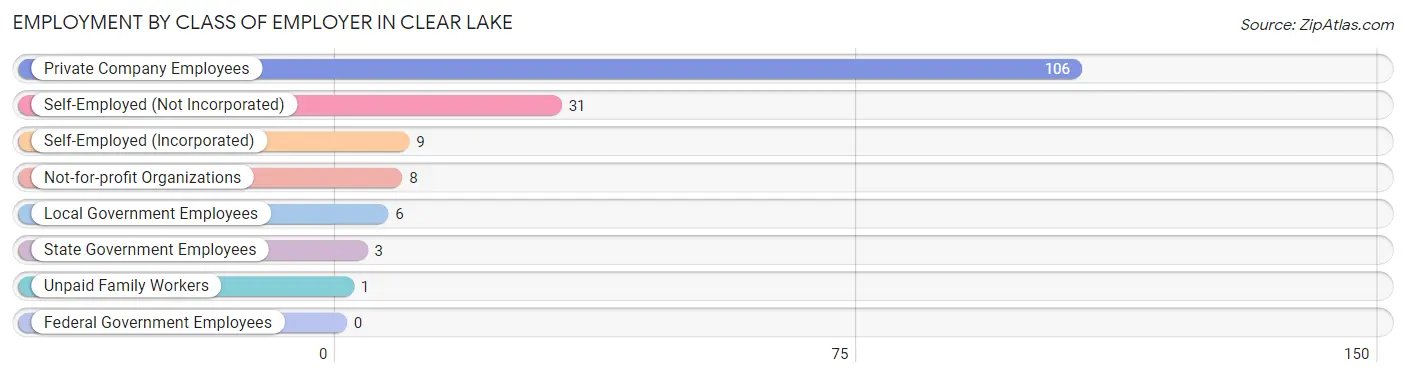
| Employer Class | # Employees | % Employees |
| Private Company Employees | 106 | 64.6% |
| Self-Employed (Incorporated) | 9 | 5.5% |
| Self-Employed (Not Incorporated) | 31 | 18.9% |
| Not-for-profit Organizations | 8 | 4.9% |
| Local Government Employees | 6 | 3.7% |
| State Government Employees | 3 | 1.8% |
| Federal Government Employees | 0 | 0.0% |
| Unpaid Family Workers | 1 | 0.6% |
| Total | 164 | 100.0% |
Employment Status by Age in Clear Lake
According to the labor force statistics for Clear Lake, out of the total population over 16 years of age (382), 44.0% or 168 individuals are in the labor force, with 2.4% or 4 of them unemployed. The age group with the highest labor force participation rate is 20 to 24 years, with 100.0% or 2 individuals in the labor force. Within the labor force, the 75 years and over age range has the highest percentage of unemployed individuals, with 12.5% or 1 of them being unemployed.
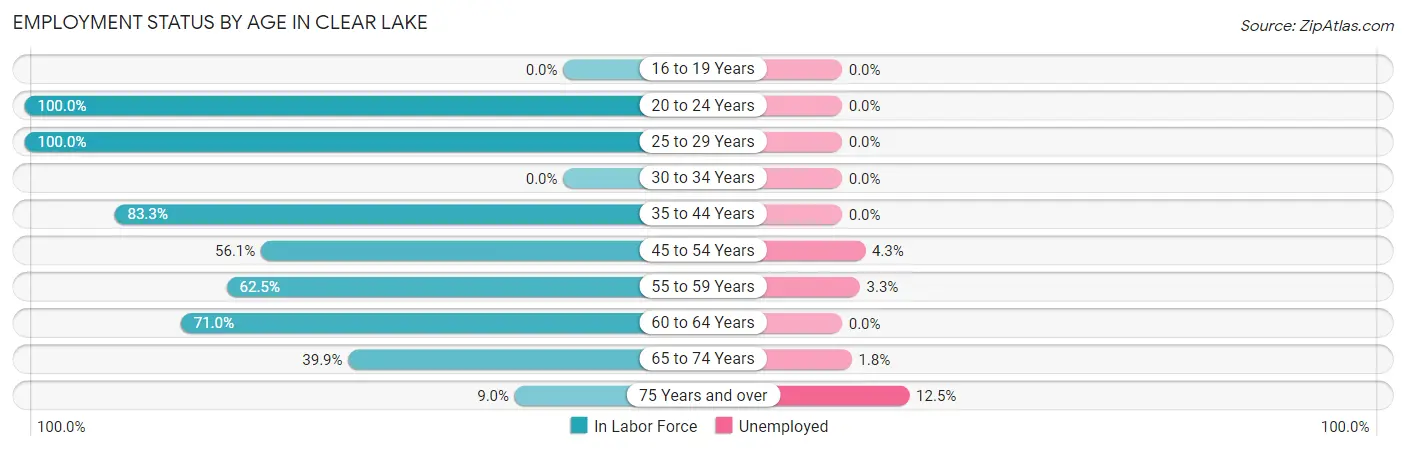
| Age Bracket | In Labor Force | Unemployed |
| 16 to 19 Years | 0 (0.0%) | 0 (0.0%) |
| 20 to 24 Years | 2 (100.0%) | 0 (0.0%) |
| 25 to 29 Years | 13 (100.0%) | 0 (0.0%) |
| 30 to 34 Years | 0 (0.0%) | 0 (0.0%) |
| 35 to 44 Years | 15 (83.3%) | 0 (0.0%) |
| 45 to 54 Years | 23 (56.1%) | 1 (4.3%) |
| 55 to 59 Years | 30 (62.5%) | 1 (3.3%) |
| 60 to 64 Years | 22 (71.0%) | 0 (0.0%) |
| 65 to 74 Years | 55 (39.9%) | 1 (1.8%) |
| 75 Years and over | 8 (9.0%) | 1 (12.5%) |
| Total | 168 (44.0%) | 4 (2.4%) |
Employment Status by Educational Attainment in Clear Lake
According to labor force statistics for Clear Lake, 67.3% of individuals (103) out of the total population between 25 and 64 years of age (153) are in the labor force, with 1.9% or 2 of them being unemployed. The group with the highest labor force participation rate are those with the educational attainment of less than high school, with 100.0% or 6 individuals in the labor force. Within the labor force, individuals with college / associate degree education have the highest percentage of unemployment, with 3.0% or 1 of them being unemployed.
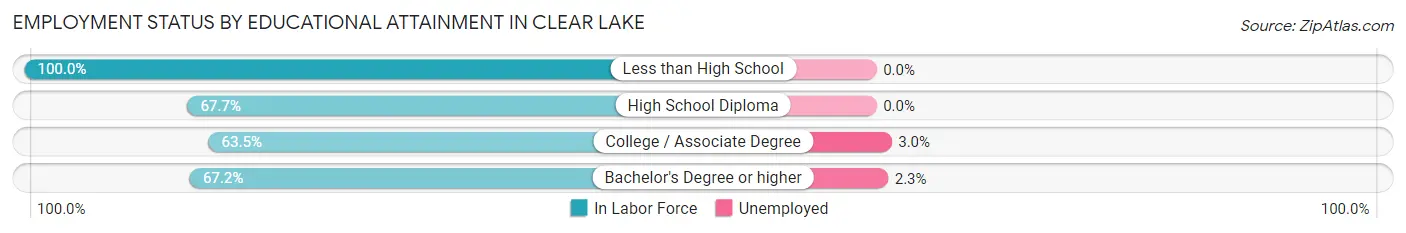
| Educational Attainment | In Labor Force | Unemployed |
| Less than High School | 6 (100.0%) | 0 (0.0%) |
| High School Diploma | 21 (67.7%) | 0 (0.0%) |
| College / Associate Degree | 33 (63.5%) | 2 (3.0%) |
| Bachelor's Degree or higher | 43 (67.2%) | 1 (2.3%) |
| Total | 103 (67.3%) | 3 (1.9%) |
Employment Occupations by Sex in Clear Lake
Management, Business, Science and Arts Occupations
The most common Management, Business, Science and Arts occupations in Clear Lake are Management (26 | 15.9%), Community & Social Service (21 | 12.8%), Business & Financial (12 | 7.3%), Health Diagnosing & Treating (10 | 6.1%), and Health Technologists (9 | 5.5%).
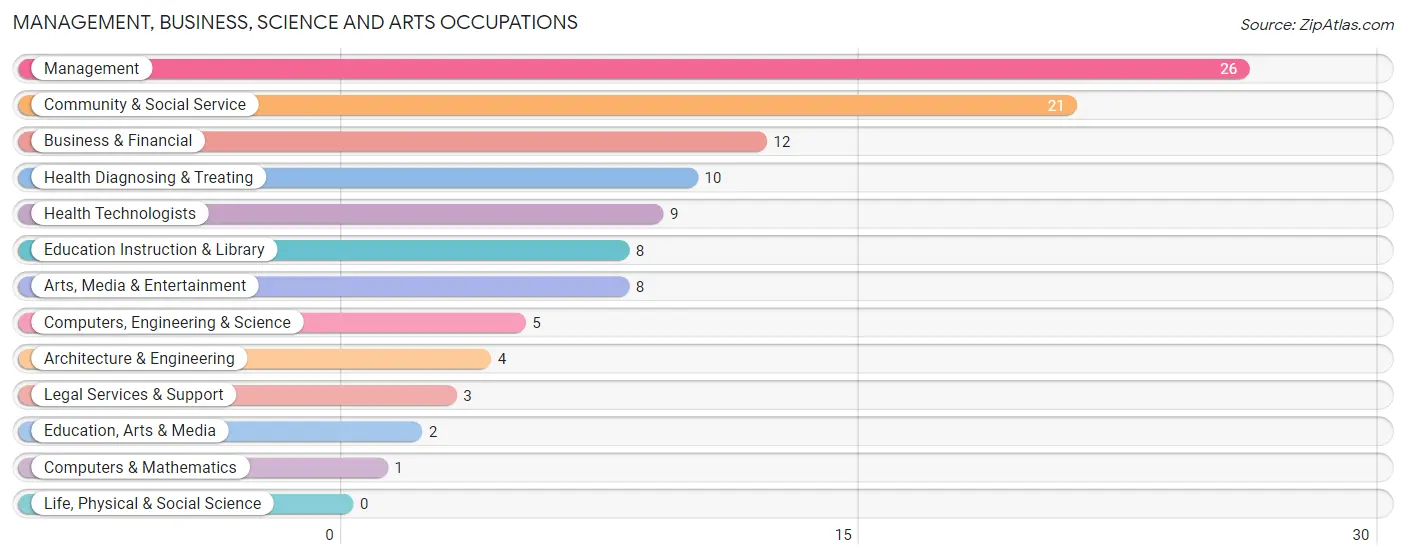
Management, Business, Science and Arts Occupations by Sex
Within the Management, Business, Science and Arts occupations in Clear Lake, the most male-oriented occupations are Architecture & Engineering (100.0%), Legal Services & Support (100.0%), and Business & Financial (91.7%), while the most female-oriented occupations are Computers & Mathematics (100.0%), Education, Arts & Media (100.0%), and Health Diagnosing & Treating (70.0%).
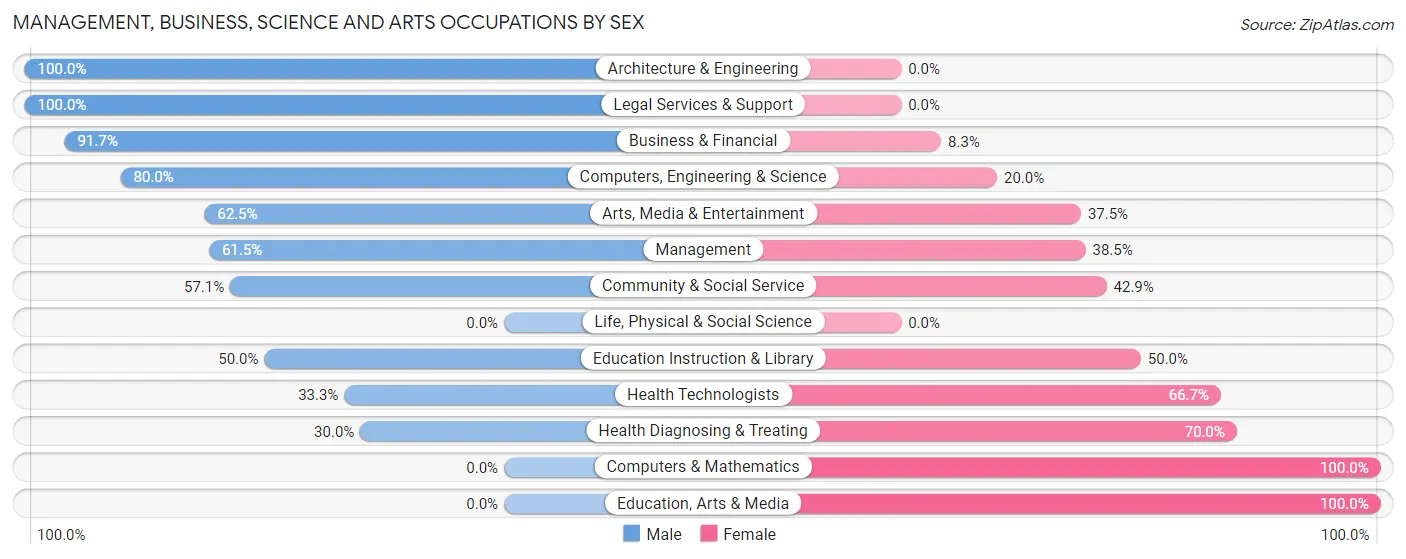
| Occupation | Male | Female |
| Management | 16 (61.5%) | 10 (38.5%) |
| Business & Financial | 11 (91.7%) | 1 (8.3%) |
| Computers, Engineering & Science | 4 (80.0%) | 1 (20.0%) |
| Computers & Mathematics | 0 (0.0%) | 1 (100.0%) |
| Architecture & Engineering | 4 (100.0%) | 0 (0.0%) |
| Life, Physical & Social Science | 0 (0.0%) | 0 (0.0%) |
| Community & Social Service | 12 (57.1%) | 9 (42.9%) |
| Education, Arts & Media | 0 (0.0%) | 2 (100.0%) |
| Legal Services & Support | 3 (100.0%) | 0 (0.0%) |
| Education Instruction & Library | 4 (50.0%) | 4 (50.0%) |
| Arts, Media & Entertainment | 5 (62.5%) | 3 (37.5%) |
| Health Diagnosing & Treating | 3 (30.0%) | 7 (70.0%) |
| Health Technologists | 3 (33.3%) | 6 (66.7%) |
| Total (Category) | 46 (62.2%) | 28 (37.8%) |
| Total (Overall) | 104 (63.4%) | 60 (36.6%) |
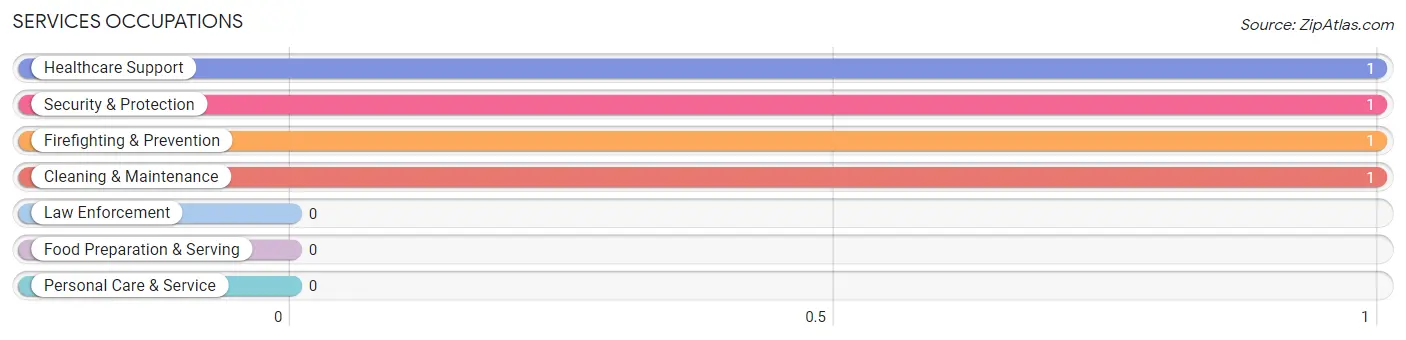
Services Occupations
The most common Services occupations in Clear Lake are Healthcare Support (1 | 0.6%), Security & Protection (1 | 0.6%), Firefighting & Prevention (1 | 0.6%), and Cleaning & Maintenance (1 | 0.6%).
Services Occupations by Sex
Within the Services occupations in Clear Lake, the most male-oriented occupations are Security & Protection (100.0%), and Firefighting & Prevention (100.0%), while the most female-oriented occupations are Healthcare Support (100.0%), and Cleaning & Maintenance (100.0%).
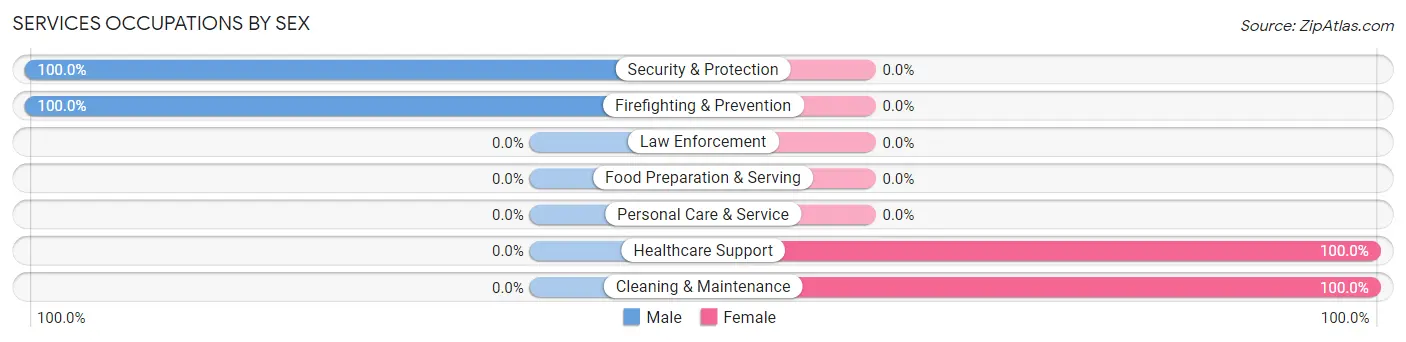
| Occupation | Male | Female |
| Healthcare Support | 0 (0.0%) | 1 (100.0%) |
| Security & Protection | 1 (100.0%) | 0 (0.0%) |
| Firefighting & Prevention | 1 (100.0%) | 0 (0.0%) |
| Law Enforcement | 0 (0.0%) | 0 (0.0%) |
| Food Preparation & Serving | 0 (0.0%) | 0 (0.0%) |
| Cleaning & Maintenance | 0 (0.0%) | 1 (100.0%) |
| Personal Care & Service | 0 (0.0%) | 0 (0.0%) |
| Total (Category) | 1 (33.3%) | 2 (66.7%) |
| Total (Overall) | 104 (63.4%) | 60 (36.6%) |
Sales and Office Occupations
The most common Sales and Office occupations in Clear Lake are Sales & Related (16 | 9.8%), and Office & Administration (9 | 5.5%).
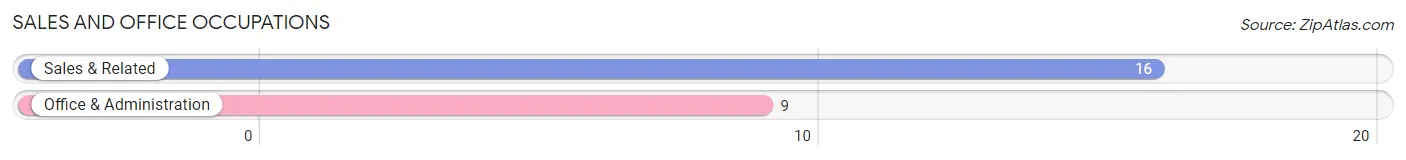
Sales and Office Occupations by Sex
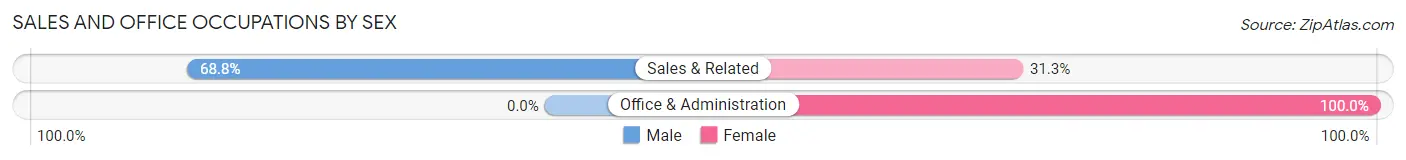
| Occupation | Male | Female |
| Sales & Related | 11 (68.8%) | 5 (31.2%) |
| Office & Administration | 0 (0.0%) | 9 (100.0%) |
| Total (Category) | 11 (44.0%) | 14 (56.0%) |
| Total (Overall) | 104 (63.4%) | 60 (36.6%) |
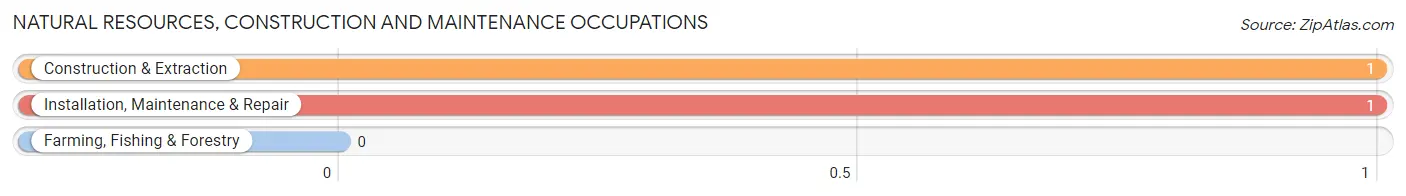
Natural Resources, Construction and Maintenance Occupations
The most common Natural Resources, Construction and Maintenance occupations in Clear Lake are Construction & Extraction (1 | 0.6%), and Installation, Maintenance & Repair (1 | 0.6%).
Natural Resources, Construction and Maintenance Occupations by Sex
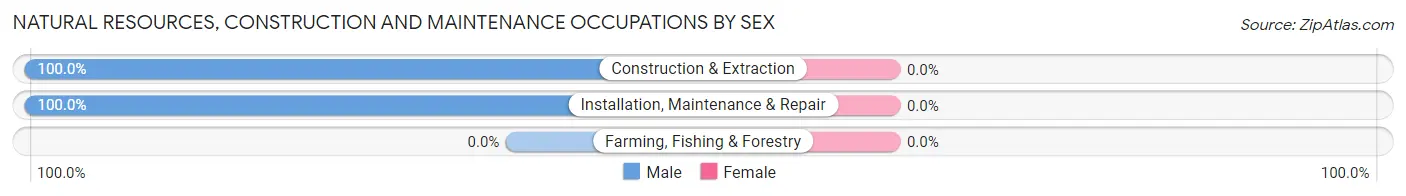
| Occupation | Male | Female |
| Farming, Fishing & Forestry | 0 (0.0%) | 0 (0.0%) |
| Construction & Extraction | 1 (100.0%) | 0 (0.0%) |
| Installation, Maintenance & Repair | 1 (100.0%) | 0 (0.0%) |
| Total (Category) | 2 (100.0%) | 0 (0.0%) |
| Total (Overall) | 104 (63.4%) | 60 (36.6%) |
Production, Transportation and Moving Occupations
The most common Production, Transportation and Moving occupations in Clear Lake are Production (25 | 15.2%), Transportation (19 | 11.6%), and Material Moving (16 | 9.8%).
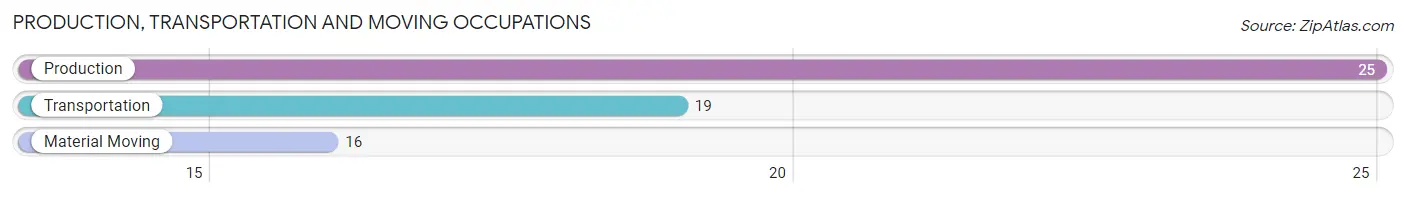
Production, Transportation and Moving Occupations by Sex
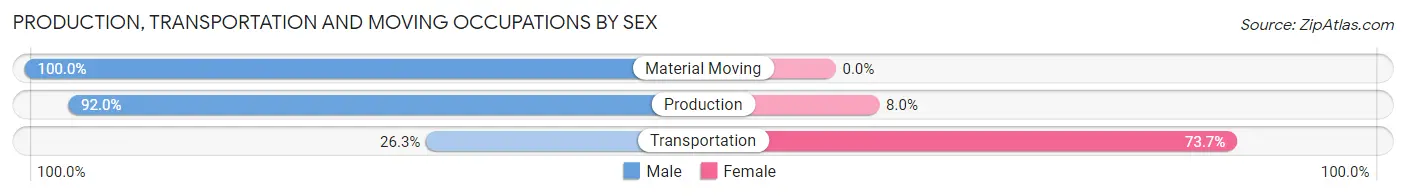
| Occupation | Male | Female |
| Production | 23 (92.0%) | 2 (8.0%) |
| Transportation | 5 (26.3%) | 14 (73.7%) |
| Material Moving | 16 (100.0%) | 0 (0.0%) |
| Total (Category) | 44 (73.3%) | 16 (26.7%) |
| Total (Overall) | 104 (63.4%) | 60 (36.6%) |
Employment Industries by Sex in Clear Lake
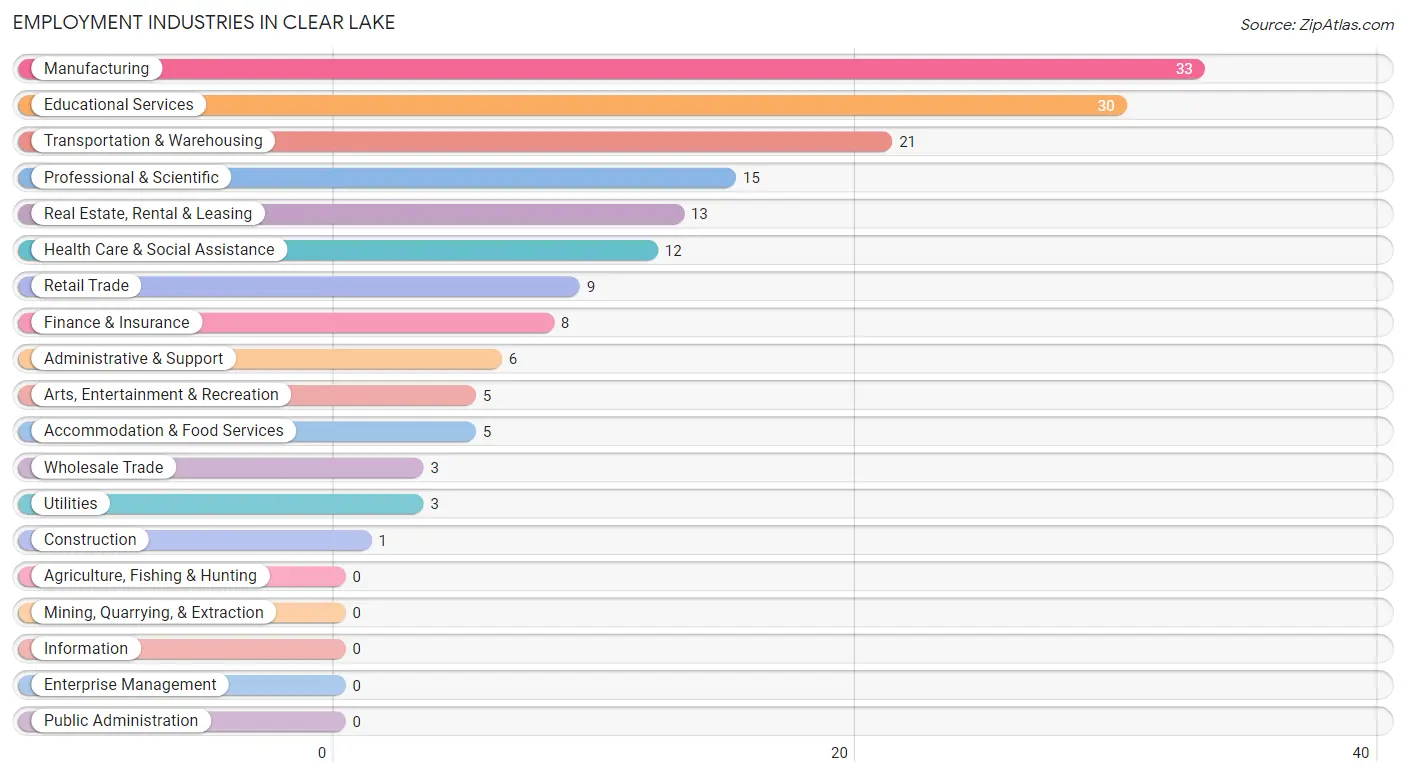
Employment Industries in Clear Lake
The major employment industries in Clear Lake include Manufacturing (33 | 20.1%), Educational Services (30 | 18.3%), Transportation & Warehousing (21 | 12.8%), Professional & Scientific (15 | 9.1%), and Real Estate, Rental & Leasing (13 | 7.9%).
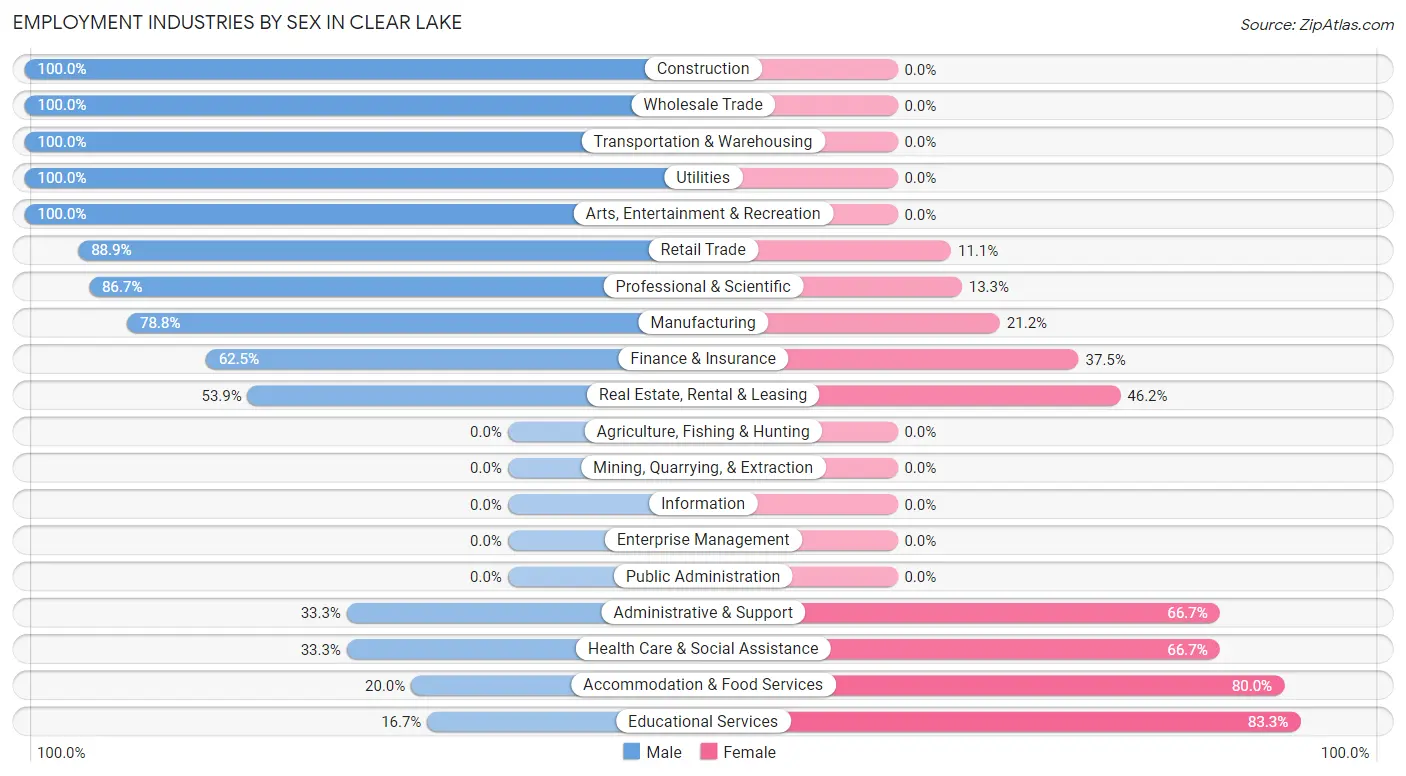
Employment Industries by Sex in Clear Lake
The Clear Lake industries that see more men than women are Construction (100.0%), Wholesale Trade (100.0%), and Transportation & Warehousing (100.0%), whereas the industries that tend to have a higher number of women are Educational Services (83.3%), Accommodation & Food Services (80.0%), and Administrative & Support (66.7%).
| Industry | Male | Female |
| Agriculture, Fishing & Hunting | 0 (0.0%) | 0 (0.0%) |
| Mining, Quarrying, & Extraction | 0 (0.0%) | 0 (0.0%) |
| Construction | 1 (100.0%) | 0 (0.0%) |
| Manufacturing | 26 (78.8%) | 7 (21.2%) |
| Wholesale Trade | 3 (100.0%) | 0 (0.0%) |
| Retail Trade | 8 (88.9%) | 1 (11.1%) |
| Transportation & Warehousing | 21 (100.0%) | 0 (0.0%) |
| Utilities | 3 (100.0%) | 0 (0.0%) |
| Information | 0 (0.0%) | 0 (0.0%) |
| Finance & Insurance | 5 (62.5%) | 3 (37.5%) |
| Real Estate, Rental & Leasing | 7 (53.8%) | 6 (46.2%) |
| Professional & Scientific | 13 (86.7%) | 2 (13.3%) |
| Enterprise Management | 0 (0.0%) | 0 (0.0%) |
| Administrative & Support | 2 (33.3%) | 4 (66.7%) |
| Educational Services | 5 (16.7%) | 25 (83.3%) |
| Health Care & Social Assistance | 4 (33.3%) | 8 (66.7%) |
| Arts, Entertainment & Recreation | 5 (100.0%) | 0 (0.0%) |
| Accommodation & Food Services | 1 (20.0%) | 4 (80.0%) |
| Public Administration | 0 (0.0%) | 0 (0.0%) |
| Total | 104 (63.4%) | 60 (36.6%) |
Education in Clear Lake
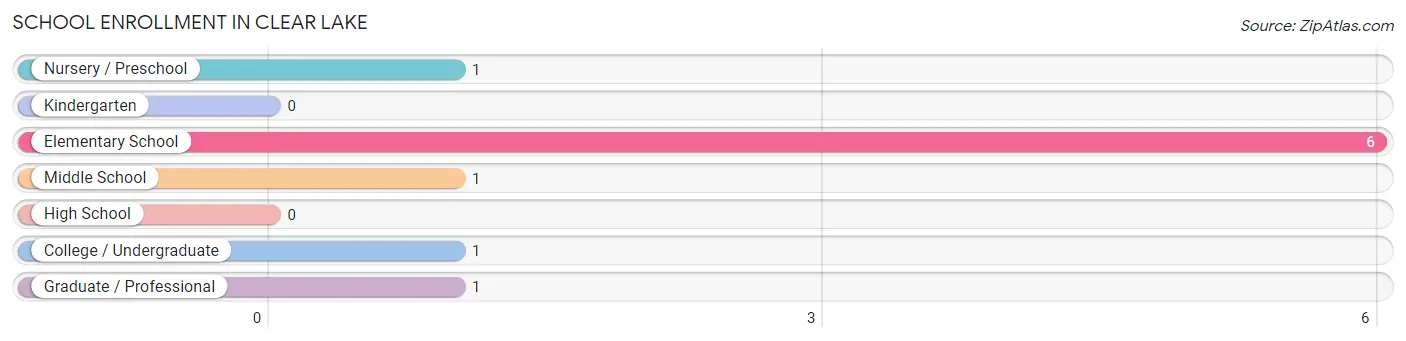
School Enrollment in Clear Lake
The most common levels of schooling among the 10 students in Clear Lake are elementary school (6 | 60.0%), nursery / preschool (1 | 10.0%), and middle school (1 | 10.0%).
| School Level | # Students | % Students |
| Nursery / Preschool | 1 | 10.0% |
| Kindergarten | 0 | 0.0% |
| Elementary School | 6 | 60.0% |
| Middle School | 1 | 10.0% |
| High School | 0 | 0.0% |
| College / Undergraduate | 1 | 10.0% |
| Graduate / Professional | 1 | 10.0% |
| Total | 10 | 100.0% |
School Enrollment by Age by Funding Source in Clear Lake
Out of a total of 10 students who are enrolled in schools in Clear Lake, 5 (50.0%) attend a private institution, while the remaining 5 (50.0%) are enrolled in public schools. The age group of 5 to 9 year old has the highest likelihood of being enrolled in private schools, with 3 (50.0% in the age bracket) enrolled. Conversely, the age group of 5 to 9 year old has the lowest likelihood of being enrolled in a private school, with 3 (50.0% in the age bracket) attending a public institution.
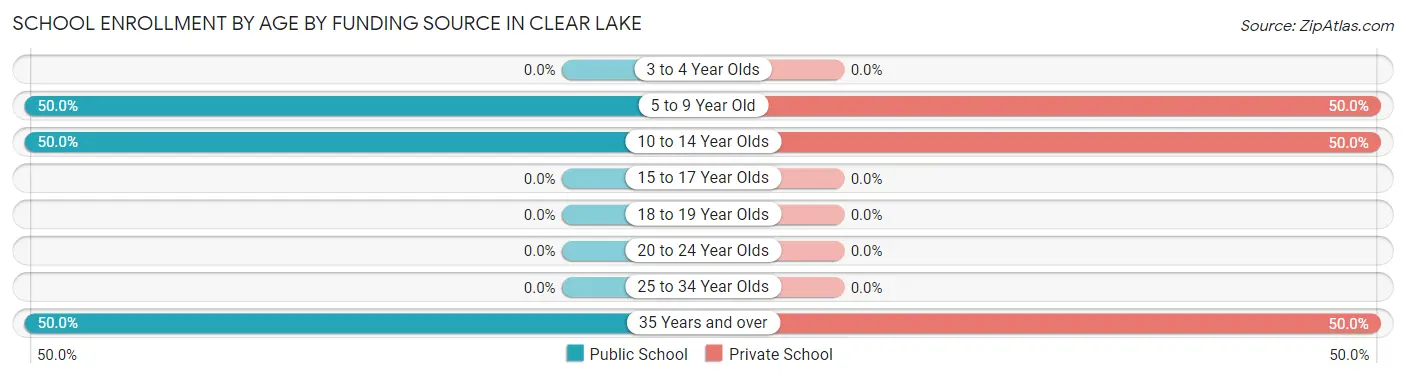
| Age Bracket | Public School | Private School |
| 3 to 4 Year Olds | 0 (0.0%) | 0 (0.0%) |
| 5 to 9 Year Old | 3 (50.0%) | 3 (50.0%) |
| 10 to 14 Year Olds | 1 (50.0%) | 1 (50.0%) |
| 15 to 17 Year Olds | 0 (0.0%) | 0 (0.0%) |
| 18 to 19 Year Olds | 0 (0.0%) | 0 (0.0%) |
| 20 to 24 Year Olds | 0 (0.0%) | 0 (0.0%) |
| 25 to 34 Year Olds | 0 (0.0%) | 0 (0.0%) |
| 35 Years and over | 1 (50.0%) | 1 (50.0%) |
| Total | 5 (50.0%) | 5 (50.0%) |
Educational Attainment by Field of Study in Clear Lake
Education (56 | 30.6%), business (46 | 25.1%), engineering (16 | 8.7%), science & technology (16 | 8.7%), and psychology (10 | 5.5%) are the most common fields of study among 183 individuals in Clear Lake who have obtained a bachelor's degree or higher.
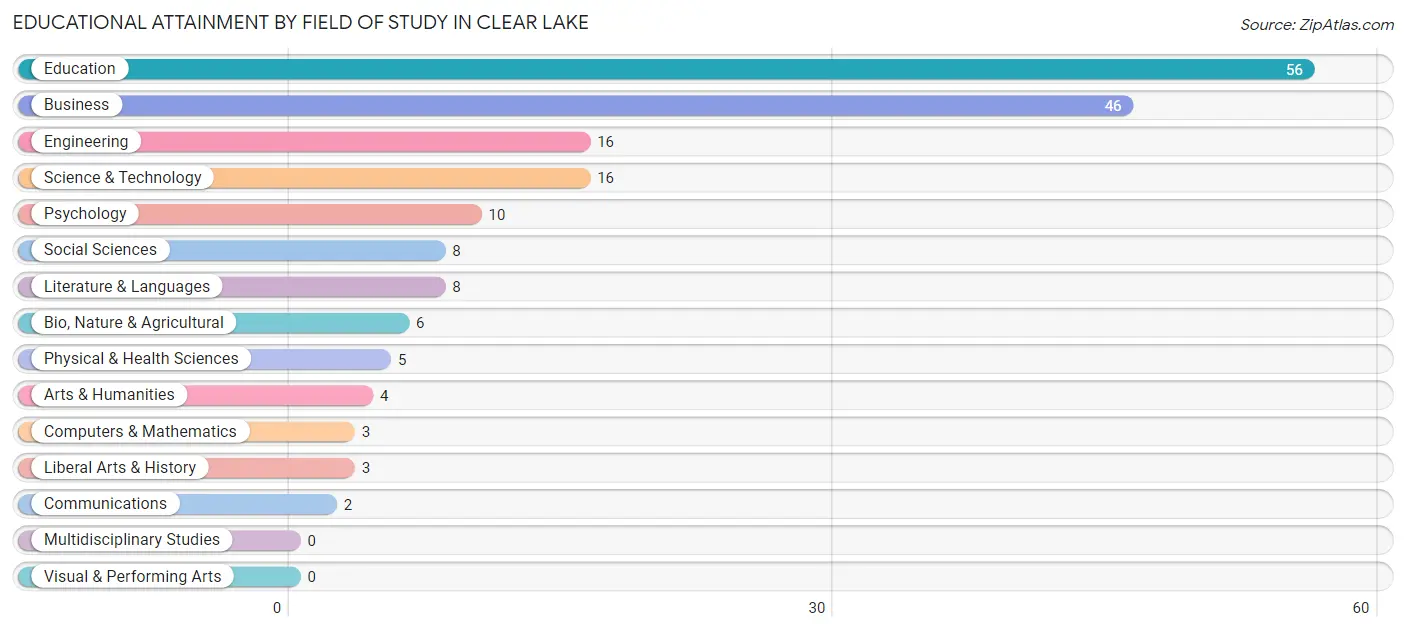
| Field of Study | # Graduates | % Graduates |
| Computers & Mathematics | 3 | 1.6% |
| Bio, Nature & Agricultural | 6 | 3.3% |
| Physical & Health Sciences | 5 | 2.7% |
| Psychology | 10 | 5.5% |
| Social Sciences | 8 | 4.4% |
| Engineering | 16 | 8.7% |
| Multidisciplinary Studies | 0 | 0.0% |
| Science & Technology | 16 | 8.7% |
| Business | 46 | 25.1% |
| Education | 56 | 30.6% |
| Literature & Languages | 8 | 4.4% |
| Liberal Arts & History | 3 | 1.6% |
| Visual & Performing Arts | 0 | 0.0% |
| Communications | 2 | 1.1% |
| Arts & Humanities | 4 | 2.2% |
| Total | 183 | 100.0% |
Transportation & Commute in Clear Lake
Vehicle Availability by Sex in Clear Lake
The most prevalent vehicle ownership categories in Clear Lake are males with 2 vehicles (46, accounting for 44.2%) and females with 2 vehicles (19, making up 76.7%).
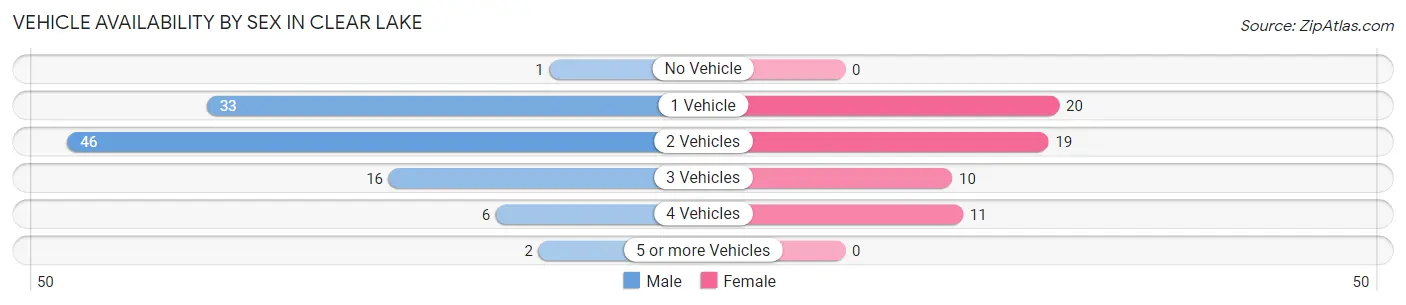
| Vehicles Available | Male | Female |
| No Vehicle | 1 (1.0%) | 0 (0.0%) |
| 1 Vehicle | 33 (31.7%) | 20 (33.3%) |
| 2 Vehicles | 46 (44.2%) | 19 (31.7%) |
| 3 Vehicles | 16 (15.4%) | 10 (16.7%) |
| 4 Vehicles | 6 (5.8%) | 11 (18.3%) |
| 5 or more Vehicles | 2 (1.9%) | 0 (0.0%) |
| Total | 104 (100.0%) | 60 (100.0%) |
Commute Time in Clear Lake
The most frequently occuring commute durations in Clear Lake are 10 to 14 minutes (27 commuters, 18.4%), 20 to 24 minutes (23 commuters, 15.7%), and 60 to 89 minutes (19 commuters, 12.9%).
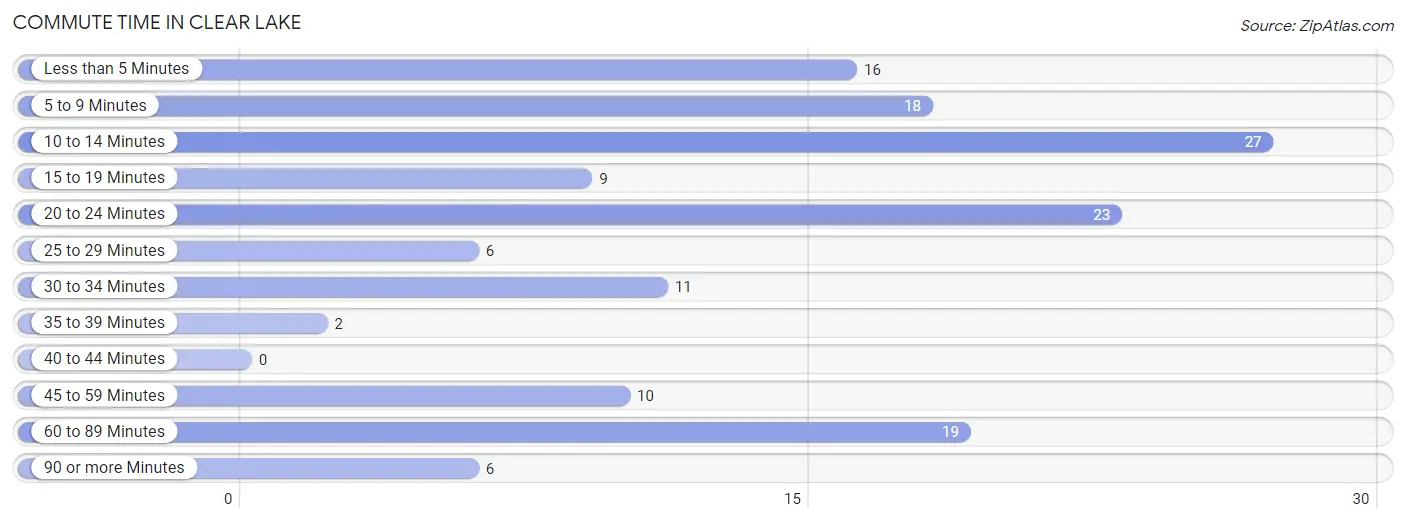
| Commute Time | # Commuters | % Commuters |
| Less than 5 Minutes | 16 | 10.9% |
| 5 to 9 Minutes | 18 | 12.2% |
| 10 to 14 Minutes | 27 | 18.4% |
| 15 to 19 Minutes | 9 | 6.1% |
| 20 to 24 Minutes | 23 | 15.7% |
| 25 to 29 Minutes | 6 | 4.1% |
| 30 to 34 Minutes | 11 | 7.5% |
| 35 to 39 Minutes | 2 | 1.4% |
| 40 to 44 Minutes | 0 | 0.0% |
| 45 to 59 Minutes | 10 | 6.8% |
| 60 to 89 Minutes | 19 | 12.9% |
| 90 or more Minutes | 6 | 4.1% |
Commute Time by Sex in Clear Lake
The most common commute times in Clear Lake are 10 to 14 minutes (20 commuters, 20.4%) for males and 20 to 24 minutes (20 commuters, 40.8%) for females.
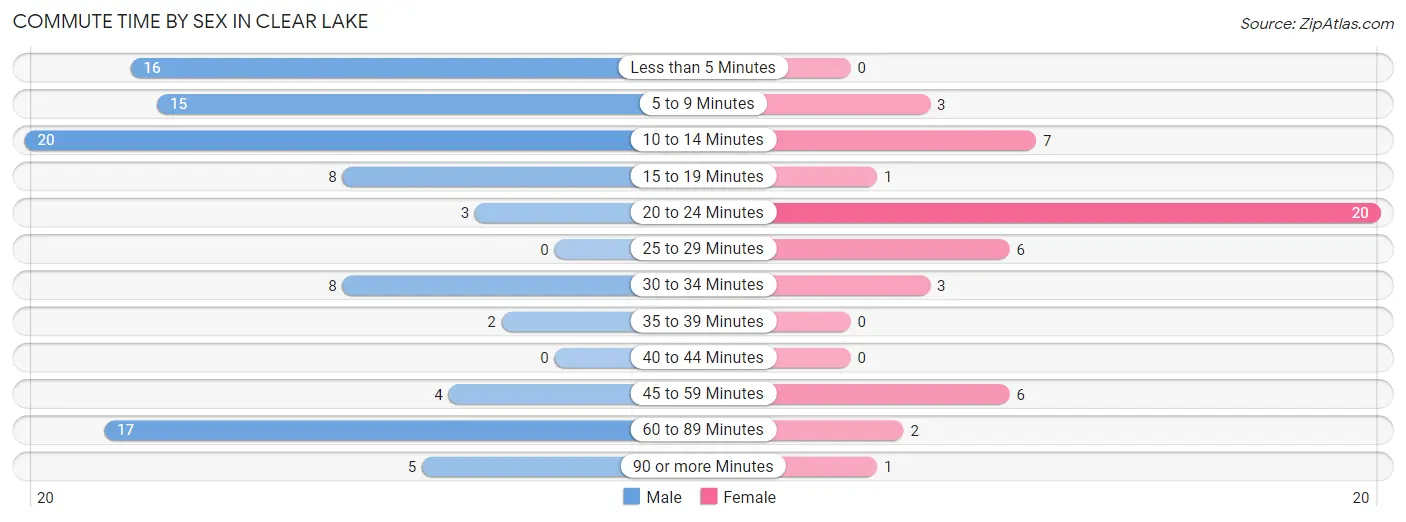
| Commute Time | Male | Female |
| Less than 5 Minutes | 16 (16.3%) | 0 (0.0%) |
| 5 to 9 Minutes | 15 (15.3%) | 3 (6.1%) |
| 10 to 14 Minutes | 20 (20.4%) | 7 (14.3%) |
| 15 to 19 Minutes | 8 (8.2%) | 1 (2.0%) |
| 20 to 24 Minutes | 3 (3.1%) | 20 (40.8%) |
| 25 to 29 Minutes | 0 (0.0%) | 6 (12.2%) |
| 30 to 34 Minutes | 8 (8.2%) | 3 (6.1%) |
| 35 to 39 Minutes | 2 (2.0%) | 0 (0.0%) |
| 40 to 44 Minutes | 0 (0.0%) | 0 (0.0%) |
| 45 to 59 Minutes | 4 (4.1%) | 6 (12.2%) |
| 60 to 89 Minutes | 17 (17.3%) | 2 (4.1%) |
| 90 or more Minutes | 5 (5.1%) | 1 (2.0%) |
Time of Departure to Work by Sex in Clear Lake
The most frequent times of departure to work in Clear Lake are 12:00 AM to 4:59 AM (18, 18.4%) for males and 7:00 AM to 7:29 AM (19, 38.8%) for females.
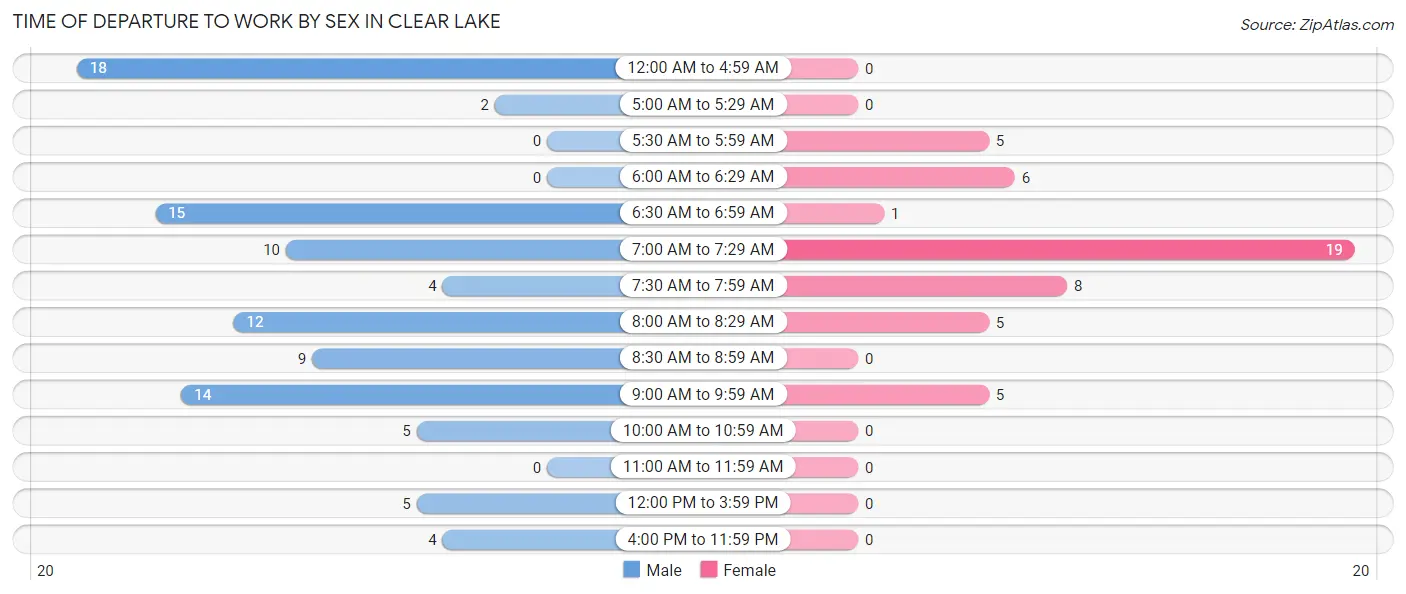
| Time of Departure | Male | Female |
| 12:00 AM to 4:59 AM | 18 (18.4%) | 0 (0.0%) |
| 5:00 AM to 5:29 AM | 2 (2.0%) | 0 (0.0%) |
| 5:30 AM to 5:59 AM | 0 (0.0%) | 5 (10.2%) |
| 6:00 AM to 6:29 AM | 0 (0.0%) | 6 (12.2%) |
| 6:30 AM to 6:59 AM | 15 (15.3%) | 1 (2.0%) |
| 7:00 AM to 7:29 AM | 10 (10.2%) | 19 (38.8%) |
| 7:30 AM to 7:59 AM | 4 (4.1%) | 8 (16.3%) |
| 8:00 AM to 8:29 AM | 12 (12.2%) | 5 (10.2%) |
| 8:30 AM to 8:59 AM | 9 (9.2%) | 0 (0.0%) |
| 9:00 AM to 9:59 AM | 14 (14.3%) | 5 (10.2%) |
| 10:00 AM to 10:59 AM | 5 (5.1%) | 0 (0.0%) |
| 11:00 AM to 11:59 AM | 0 (0.0%) | 0 (0.0%) |
| 12:00 PM to 3:59 PM | 5 (5.1%) | 0 (0.0%) |
| 4:00 PM to 11:59 PM | 4 (4.1%) | 0 (0.0%) |
| Total | 98 (100.0%) | 49 (100.0%) |
Housing Occupancy in Clear Lake
Occupancy by Ownership in Clear Lake
Of the total 217 dwellings in Clear Lake, owner-occupied units account for 184 (84.8%), while renter-occupied units make up 33 (15.2%).
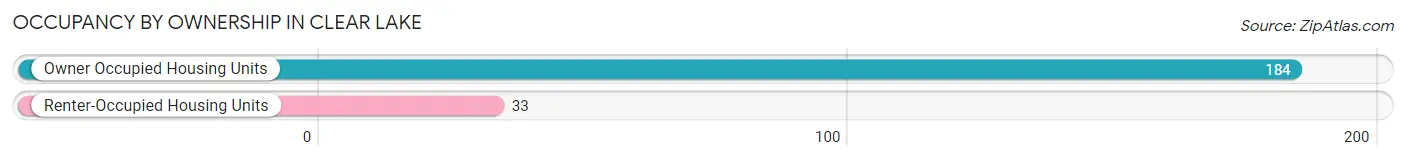
| Occupancy | # Housing Units | % Housing Units |
| Owner Occupied Housing Units | 184 | 84.8% |
| Renter-Occupied Housing Units | 33 | 15.2% |
| Total Occupied Housing Units | 217 | 100.0% |
Occupancy by Household Size in Clear Lake
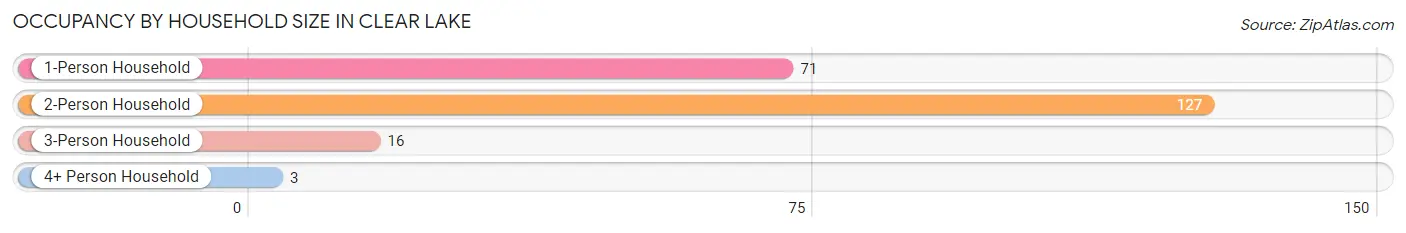
| Household Size | # Housing Units | % Housing Units |
| 1-Person Household | 71 | 32.7% |
| 2-Person Household | 127 | 58.5% |
| 3-Person Household | 16 | 7.4% |
| 4+ Person Household | 3 | 1.4% |
| Total Housing Units | 217 | 100.0% |
Occupancy by Ownership by Household Size in Clear Lake
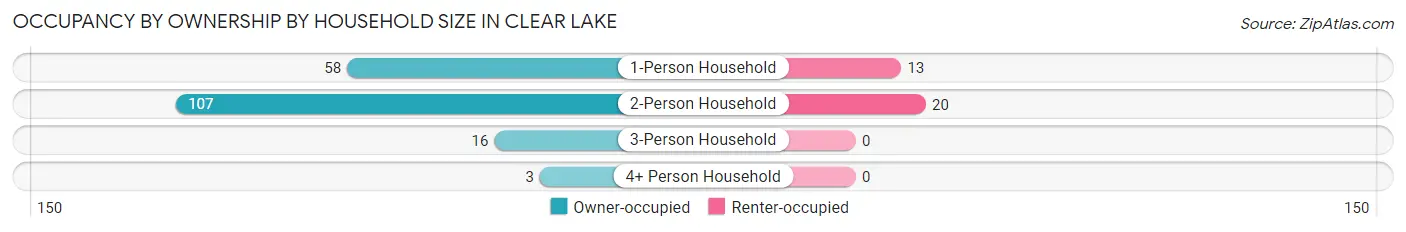
| Household Size | Owner-occupied | Renter-occupied |
| 1-Person Household | 58 (81.7%) | 13 (18.3%) |
| 2-Person Household | 107 (84.3%) | 20 (15.8%) |
| 3-Person Household | 16 (100.0%) | 0 (0.0%) |
| 4+ Person Household | 3 (100.0%) | 0 (0.0%) |
| Total Housing Units | 184 (84.8%) | 33 (15.2%) |
Occupancy by Educational Attainment in Clear Lake
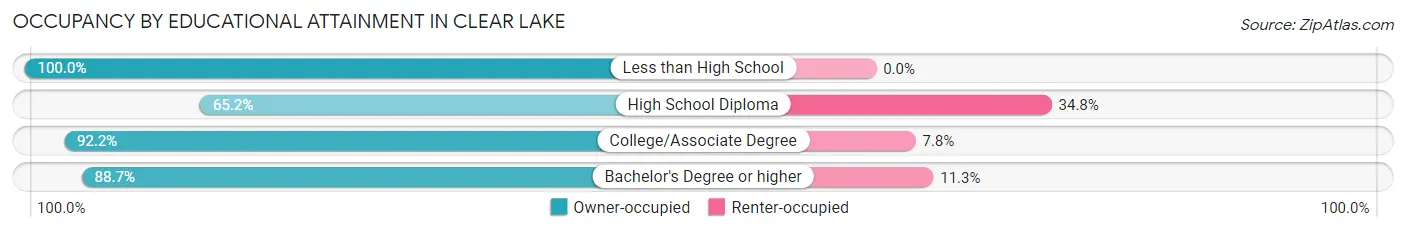
| Household Size | Owner-occupied | Renter-occupied |
| Less than High School | 1 (100.0%) | 0 (0.0%) |
| High School Diploma | 30 (65.2%) | 16 (34.8%) |
| College/Associate Degree | 59 (92.2%) | 5 (7.8%) |
| Bachelor's Degree or higher | 94 (88.7%) | 12 (11.3%) |
Occupancy by Age of Householder in Clear Lake
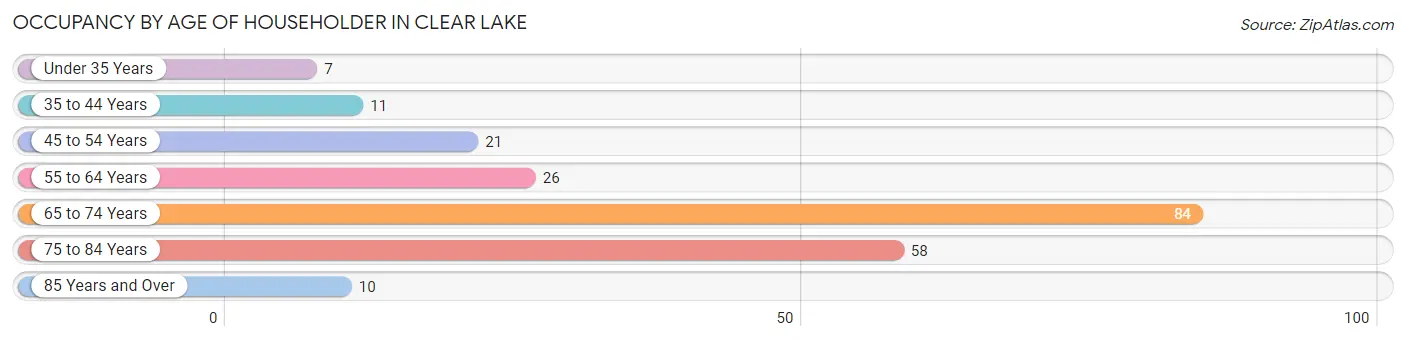
| Age Bracket | # Households | % Households |
| Under 35 Years | 7 | 3.2% |
| 35 to 44 Years | 11 | 5.1% |
| 45 to 54 Years | 21 | 9.7% |
| 55 to 64 Years | 26 | 12.0% |
| 65 to 74 Years | 84 | 38.7% |
| 75 to 84 Years | 58 | 26.7% |
| 85 Years and Over | 10 | 4.6% |
| Total | 217 | 100.0% |
Housing Finances in Clear Lake
Median Income by Occupancy in Clear Lake
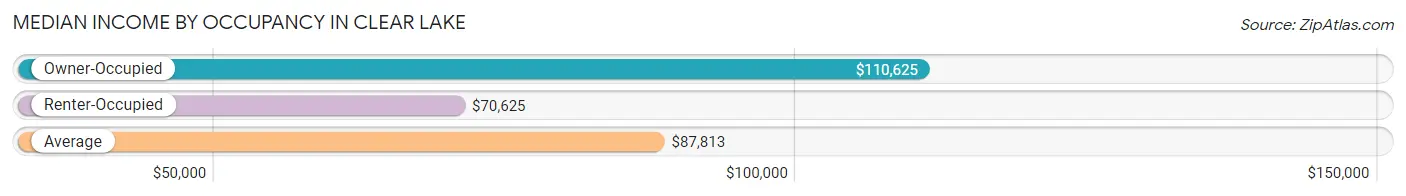
| Occupancy Type | # Households | Median Income |
| Owner-Occupied | 184 (84.8%) | $110,625 |
| Renter-Occupied | 33 (15.2%) | $70,625 |
| Average | 217 (100.0%) | $87,813 |
Occupancy by Householder Income Bracket in Clear Lake
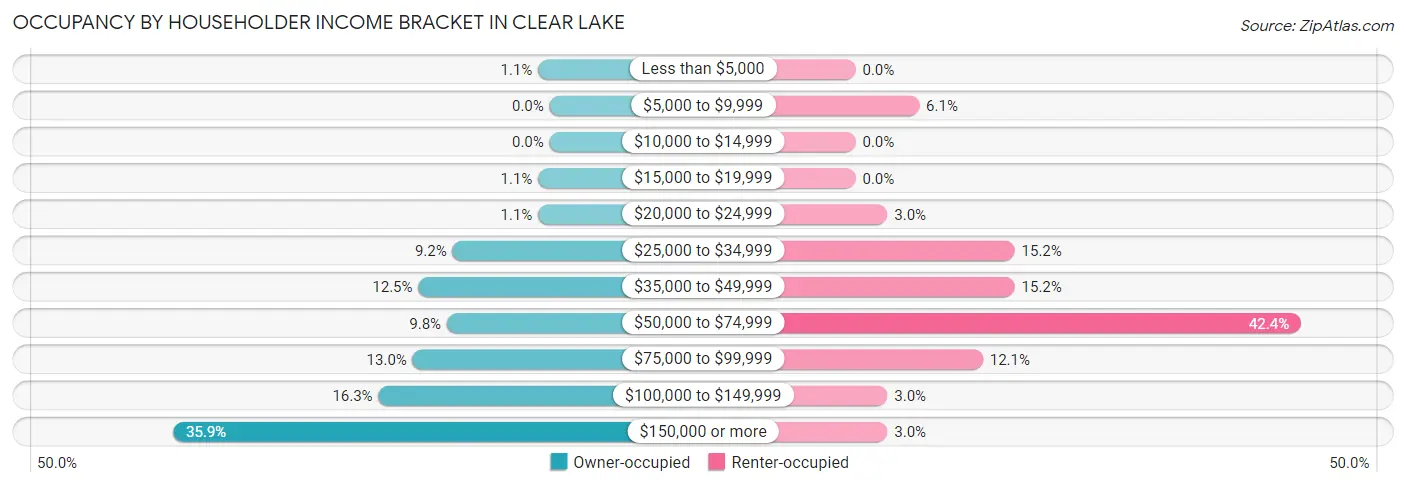
| Income Bracket | Owner-occupied | Renter-occupied |
| Less than $5,000 | 2 (1.1%) | 0 (0.0%) |
| $5,000 to $9,999 | 0 (0.0%) | 2 (6.1%) |
| $10,000 to $14,999 | 0 (0.0%) | 0 (0.0%) |
| $15,000 to $19,999 | 2 (1.1%) | 0 (0.0%) |
| $20,000 to $24,999 | 2 (1.1%) | 1 (3.0%) |
| $25,000 to $34,999 | 17 (9.2%) | 5 (15.1%) |
| $35,000 to $49,999 | 23 (12.5%) | 5 (15.1%) |
| $50,000 to $74,999 | 18 (9.8%) | 14 (42.4%) |
| $75,000 to $99,999 | 24 (13.0%) | 4 (12.1%) |
| $100,000 to $149,999 | 30 (16.3%) | 1 (3.0%) |
| $150,000 or more | 66 (35.9%) | 1 (3.0%) |
| Total | 184 (100.0%) | 33 (100.0%) |
Monthly Housing Cost Tiers in Clear Lake
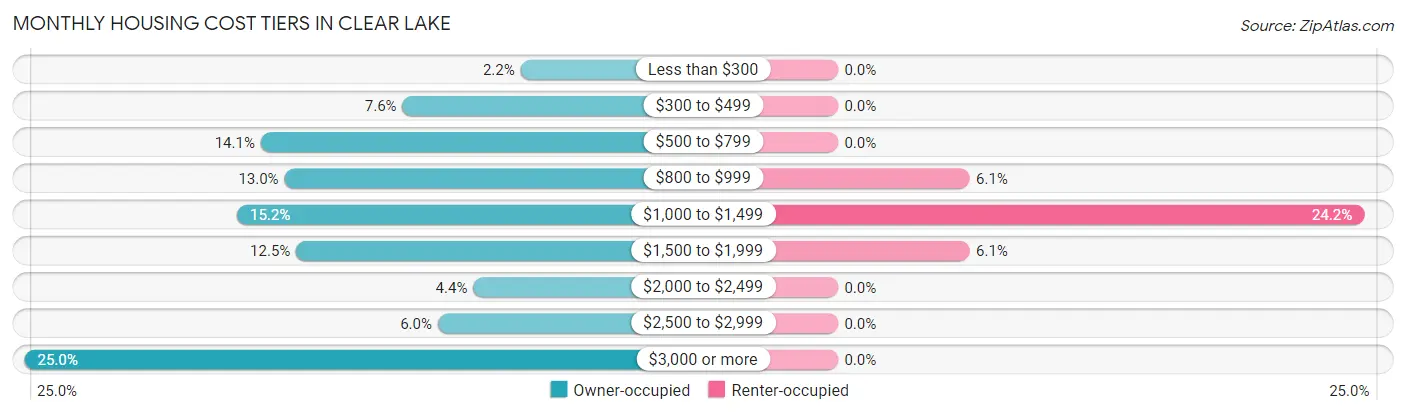
| Monthly Cost | Owner-occupied | Renter-occupied |
| Less than $300 | 4 (2.2%) | 0 (0.0%) |
| $300 to $499 | 14 (7.6%) | 0 (0.0%) |
| $500 to $799 | 26 (14.1%) | 0 (0.0%) |
| $800 to $999 | 24 (13.0%) | 2 (6.1%) |
| $1,000 to $1,499 | 28 (15.2%) | 8 (24.2%) |
| $1,500 to $1,999 | 23 (12.5%) | 2 (6.1%) |
| $2,000 to $2,499 | 8 (4.3%) | 0 (0.0%) |
| $2,500 to $2,999 | 11 (6.0%) | 0 (0.0%) |
| $3,000 or more | 46 (25.0%) | 0 (0.0%) |
| Total | 184 (100.0%) | 33 (100.0%) |
Physical Housing Characteristics in Clear Lake
Housing Structures in Clear Lake
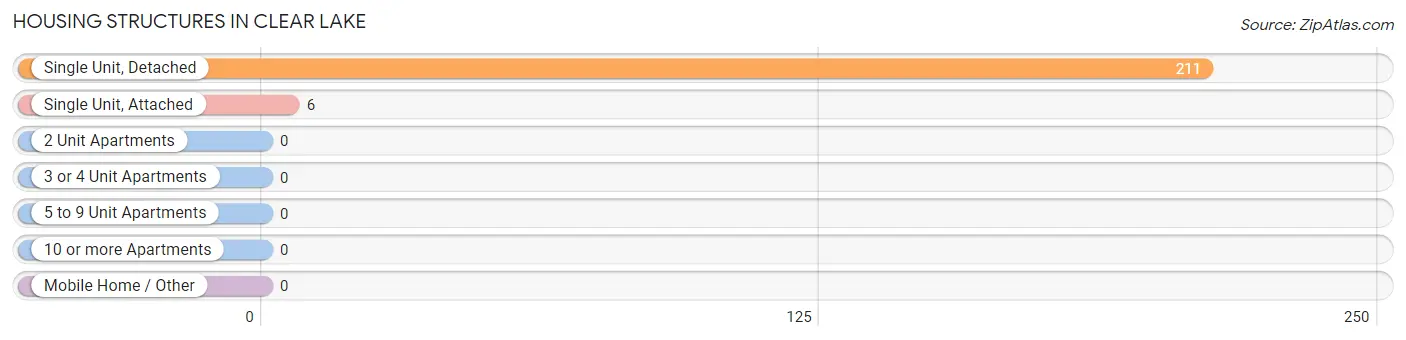
| Structure Type | # Housing Units | % Housing Units |
| Single Unit, Detached | 211 | 97.2% |
| Single Unit, Attached | 6 | 2.8% |
| 2 Unit Apartments | 0 | 0.0% |
| 3 or 4 Unit Apartments | 0 | 0.0% |
| 5 to 9 Unit Apartments | 0 | 0.0% |
| 10 or more Apartments | 0 | 0.0% |
| Mobile Home / Other | 0 | 0.0% |
| Total | 217 | 100.0% |
Housing Structures by Occupancy in Clear Lake
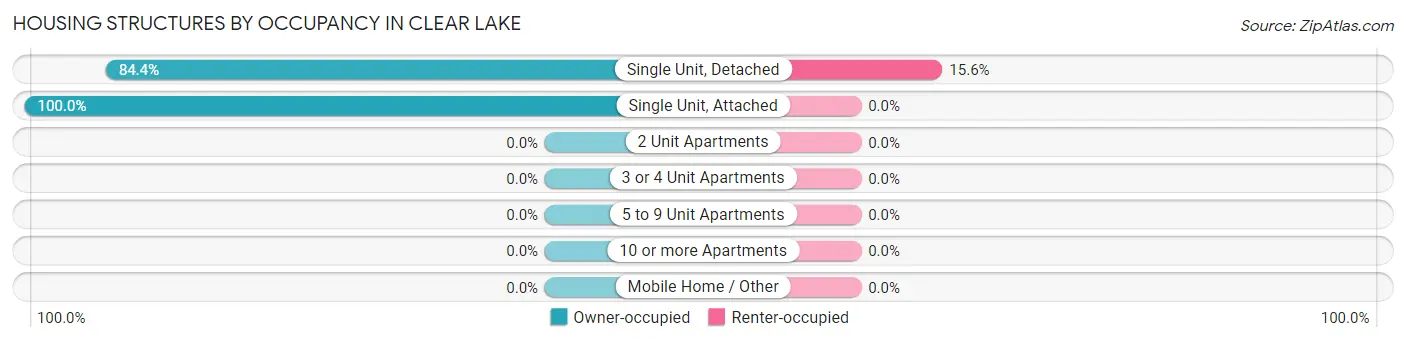
| Structure Type | Owner-occupied | Renter-occupied |
| Single Unit, Detached | 178 (84.4%) | 33 (15.6%) |
| Single Unit, Attached | 6 (100.0%) | 0 (0.0%) |
| 2 Unit Apartments | 0 (0.0%) | 0 (0.0%) |
| 3 or 4 Unit Apartments | 0 (0.0%) | 0 (0.0%) |
| 5 to 9 Unit Apartments | 0 (0.0%) | 0 (0.0%) |
| 10 or more Apartments | 0 (0.0%) | 0 (0.0%) |
| Mobile Home / Other | 0 (0.0%) | 0 (0.0%) |
| Total | 184 (84.8%) | 33 (15.2%) |
Housing Structures by Number of Rooms in Clear Lake
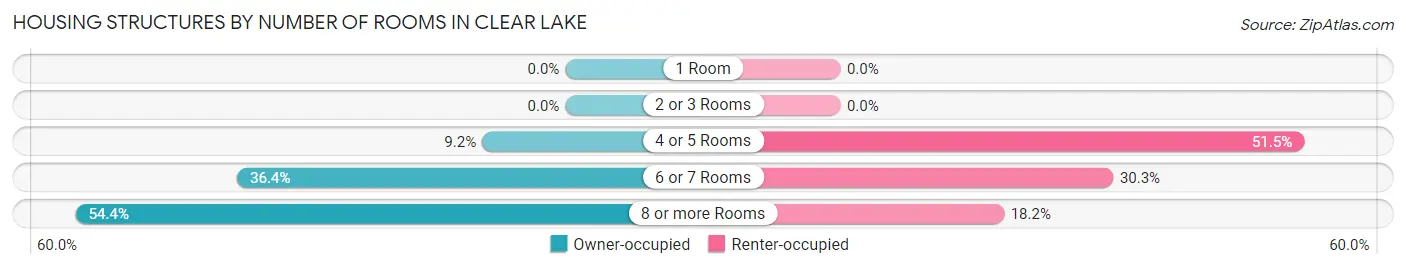
| Number of Rooms | Owner-occupied | Renter-occupied |
| 1 Room | 0 (0.0%) | 0 (0.0%) |
| 2 or 3 Rooms | 0 (0.0%) | 0 (0.0%) |
| 4 or 5 Rooms | 17 (9.2%) | 17 (51.5%) |
| 6 or 7 Rooms | 67 (36.4%) | 10 (30.3%) |
| 8 or more Rooms | 100 (54.3%) | 6 (18.2%) |
| Total | 184 (100.0%) | 33 (100.0%) |
Housing Structure by Heating Type in Clear Lake
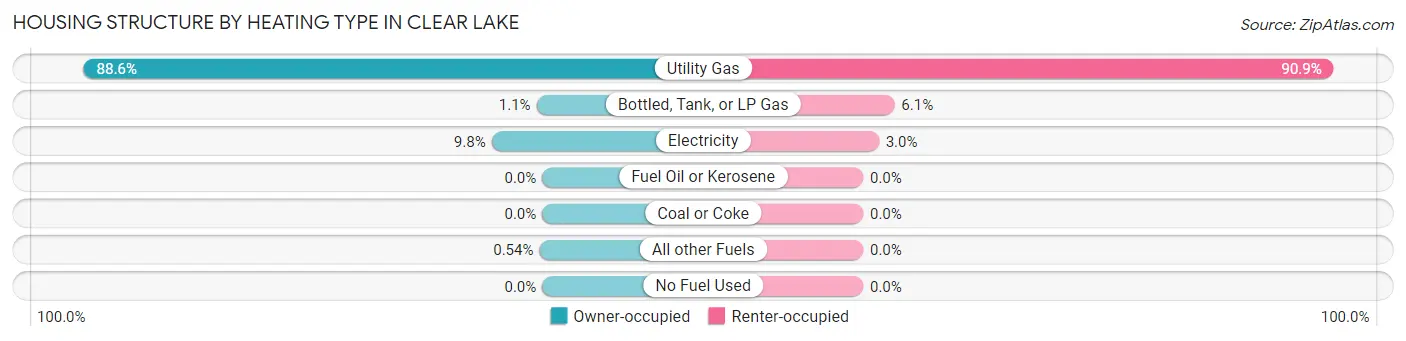
| Heating Type | Owner-occupied | Renter-occupied |
| Utility Gas | 163 (88.6%) | 30 (90.9%) |
| Bottled, Tank, or LP Gas | 2 (1.1%) | 2 (6.1%) |
| Electricity | 18 (9.8%) | 1 (3.0%) |
| Fuel Oil or Kerosene | 0 (0.0%) | 0 (0.0%) |
| Coal or Coke | 0 (0.0%) | 0 (0.0%) |
| All other Fuels | 1 (0.5%) | 0 (0.0%) |
| No Fuel Used | 0 (0.0%) | 0 (0.0%) |
| Total | 184 (100.0%) | 33 (100.0%) |
Household Vehicle Usage in Clear Lake
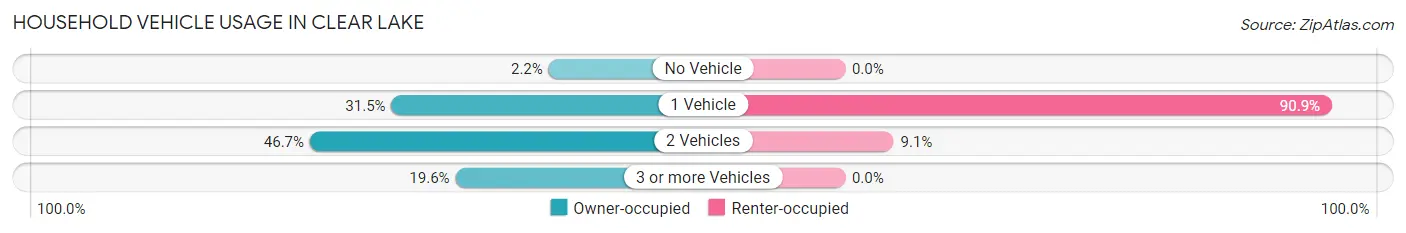
| Vehicles per Household | Owner-occupied | Renter-occupied |
| No Vehicle | 4 (2.2%) | 0 (0.0%) |
| 1 Vehicle | 58 (31.5%) | 30 (90.9%) |
| 2 Vehicles | 86 (46.7%) | 3 (9.1%) |
| 3 or more Vehicles | 36 (19.6%) | 0 (0.0%) |
| Total | 184 (100.0%) | 33 (100.0%) |
Real Estate & Mortgages in Clear Lake
Real Estate and Mortgage Overview in Clear Lake
| Characteristic | Without Mortgage | With Mortgage |
| Housing Units | 111 | 73 |
| Median Property Value | $691,400 | $758,900 |
| Median Household Income | $96,875 | $36 |
| Monthly Housing Costs | $872 | $46 |
| Real Estate Taxes | $5,139 | $0 |
Property Value by Mortgage Status in Clear Lake
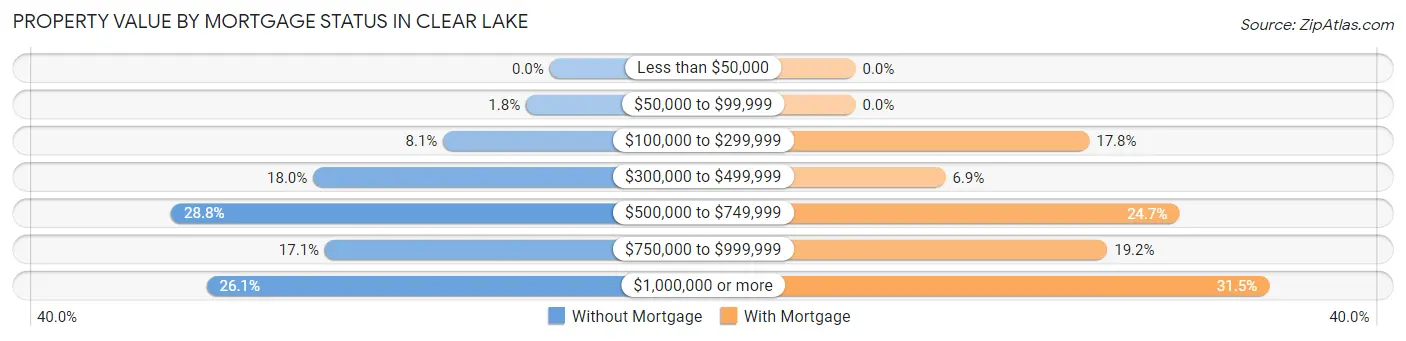
| Property Value | Without Mortgage | With Mortgage |
| Less than $50,000 | 0 (0.0%) | 0 (0.0%) |
| $50,000 to $99,999 | 2 (1.8%) | 0 (0.0%) |
| $100,000 to $299,999 | 9 (8.1%) | 13 (17.8%) |
| $300,000 to $499,999 | 20 (18.0%) | 5 (6.9%) |
| $500,000 to $749,999 | 32 (28.8%) | 18 (24.7%) |
| $750,000 to $999,999 | 19 (17.1%) | 14 (19.2%) |
| $1,000,000 or more | 29 (26.1%) | 23 (31.5%) |
| Total | 111 (100.0%) | 73 (100.0%) |
Household Income by Mortgage Status in Clear Lake
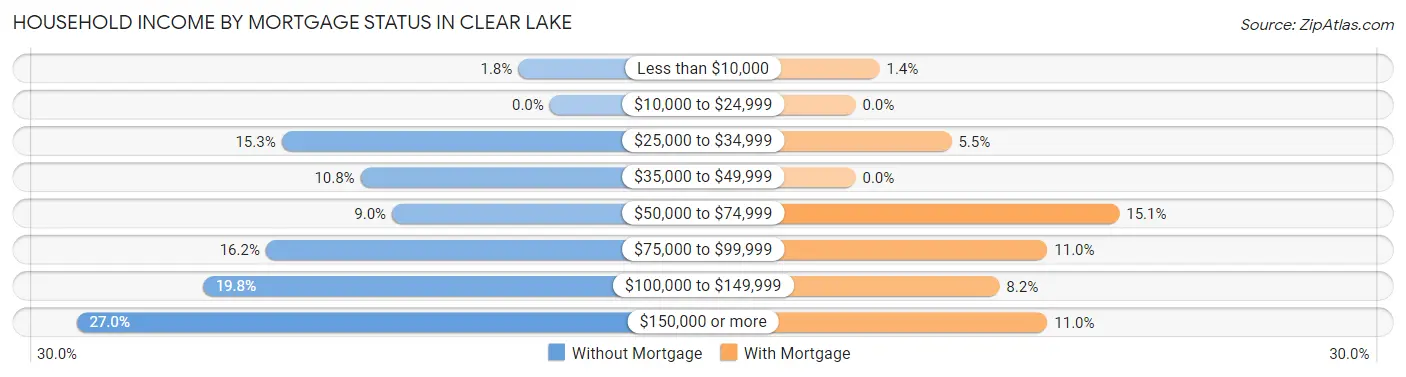
| Household Income | Without Mortgage | With Mortgage |
| Less than $10,000 | 2 (1.8%) | 1 (1.4%) |
| $10,000 to $24,999 | 0 (0.0%) | 0 (0.0%) |
| $25,000 to $34,999 | 17 (15.3%) | 4 (5.5%) |
| $35,000 to $49,999 | 12 (10.8%) | 0 (0.0%) |
| $50,000 to $74,999 | 10 (9.0%) | 11 (15.1%) |
| $75,000 to $99,999 | 18 (16.2%) | 8 (11.0%) |
| $100,000 to $149,999 | 22 (19.8%) | 6 (8.2%) |
| $150,000 or more | 30 (27.0%) | 8 (11.0%) |
| Total | 111 (100.0%) | 73 (100.0%) |
Property Value to Household Income Ratio in Clear Lake
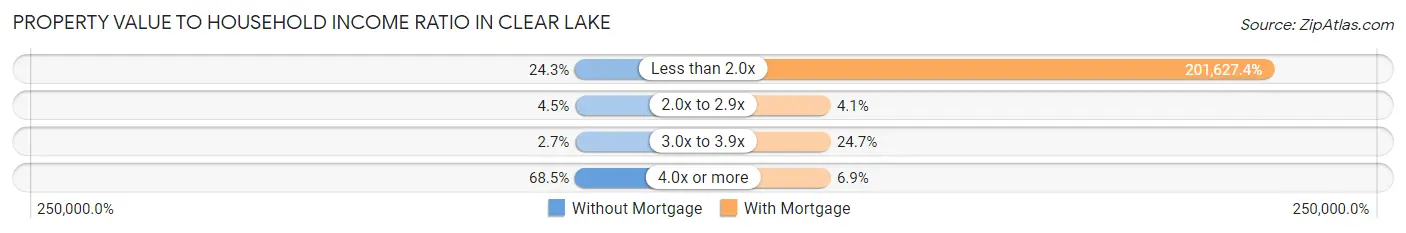
| Value-to-Income Ratio | Without Mortgage | With Mortgage |
| Less than 2.0x | 27 (24.3%) | 147,188 (201,627.4%) |
| 2.0x to 2.9x | 5 (4.5%) | 3 (4.1%) |
| 3.0x to 3.9x | 3 (2.7%) | 18 (24.7%) |
| 4.0x or more | 76 (68.5%) | 5 (6.9%) |
| Total | 111 (100.0%) | 73 (100.0%) |
Real Estate Taxes by Mortgage Status in Clear Lake
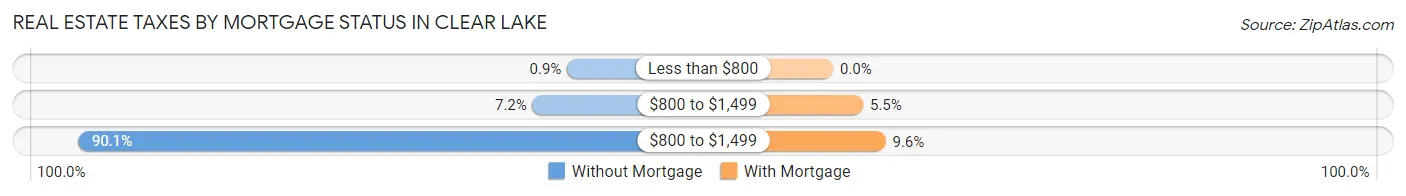
| Property Taxes | Without Mortgage | With Mortgage |
| Less than $800 | 1 (0.9%) | 0 (0.0%) |
| $800 to $1,499 | 8 (7.2%) | 4 (5.5%) |
| $800 to $1,499 | 100 (90.1%) | 7 (9.6%) |
| Total | 111 (100.0%) | 73 (100.0%) |
Health & Disability in Clear Lake
Health Insurance Coverage by Age in Clear Lake
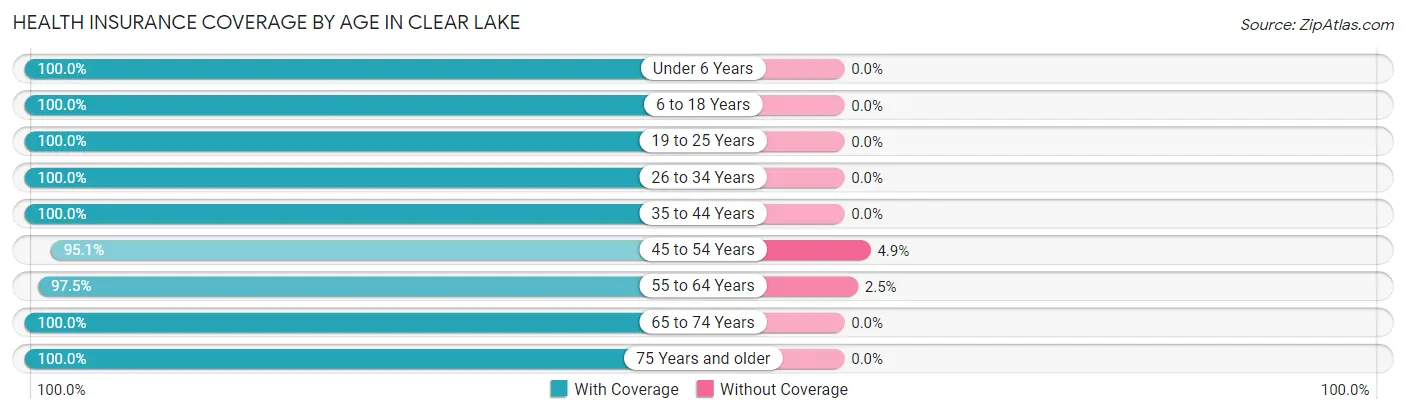
| Age Bracket | With Coverage | Without Coverage |
| Under 6 Years | 7 (100.0%) | 0 (0.0%) |
| 6 to 18 Years | 7 (100.0%) | 0 (0.0%) |
| 19 to 25 Years | 2 (100.0%) | 0 (0.0%) |
| 26 to 34 Years | 15 (100.0%) | 0 (0.0%) |
| 35 to 44 Years | 18 (100.0%) | 0 (0.0%) |
| 45 to 54 Years | 39 (95.1%) | 2 (4.9%) |
| 55 to 64 Years | 77 (97.5%) | 2 (2.5%) |
| 65 to 74 Years | 138 (100.0%) | 0 (0.0%) |
| 75 Years and older | 89 (100.0%) | 0 (0.0%) |
| Total | 392 (99.0%) | 4 (1.0%) |
Health Insurance Coverage by Citizenship Status in Clear Lake
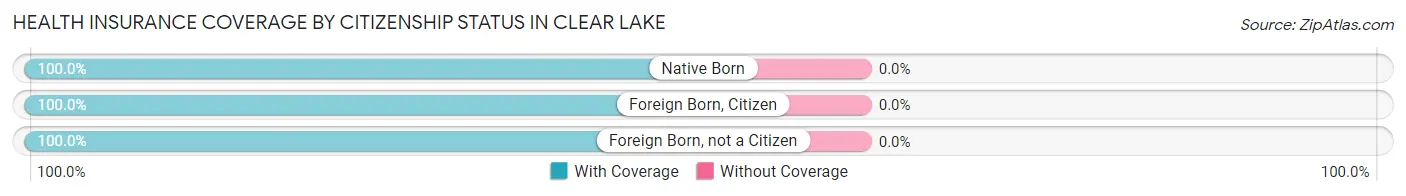
| Citizenship Status | With Coverage | Without Coverage |
| Native Born | 7 (100.0%) | 0 (0.0%) |
| Foreign Born, Citizen | 7 (100.0%) | 0 (0.0%) |
| Foreign Born, not a Citizen | 2 (100.0%) | 0 (0.0%) |
Health Insurance Coverage by Household Income in Clear Lake
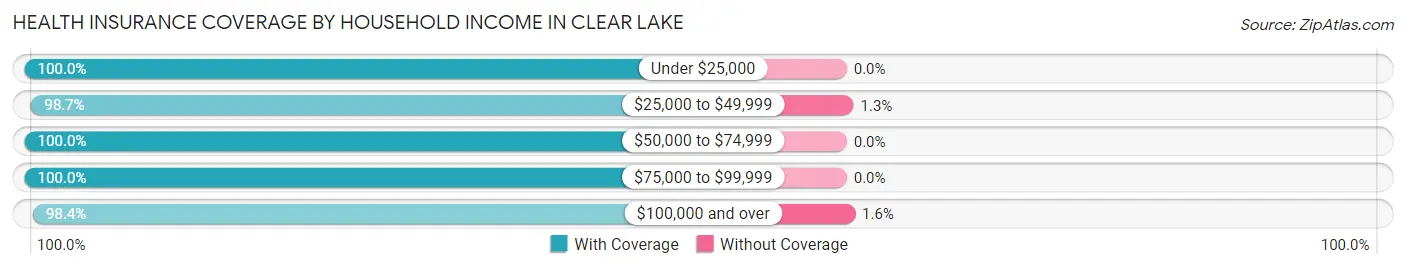
| Household Income | With Coverage | Without Coverage |
| Under $25,000 | 12 (100.0%) | 0 (0.0%) |
| $25,000 to $49,999 | 78 (98.7%) | 1 (1.3%) |
| $50,000 to $74,999 | 63 (100.0%) | 0 (0.0%) |
| $75,000 to $99,999 | 50 (100.0%) | 0 (0.0%) |
| $100,000 and over | 189 (98.4%) | 3 (1.6%) |
Public vs Private Health Insurance Coverage by Age in Clear Lake
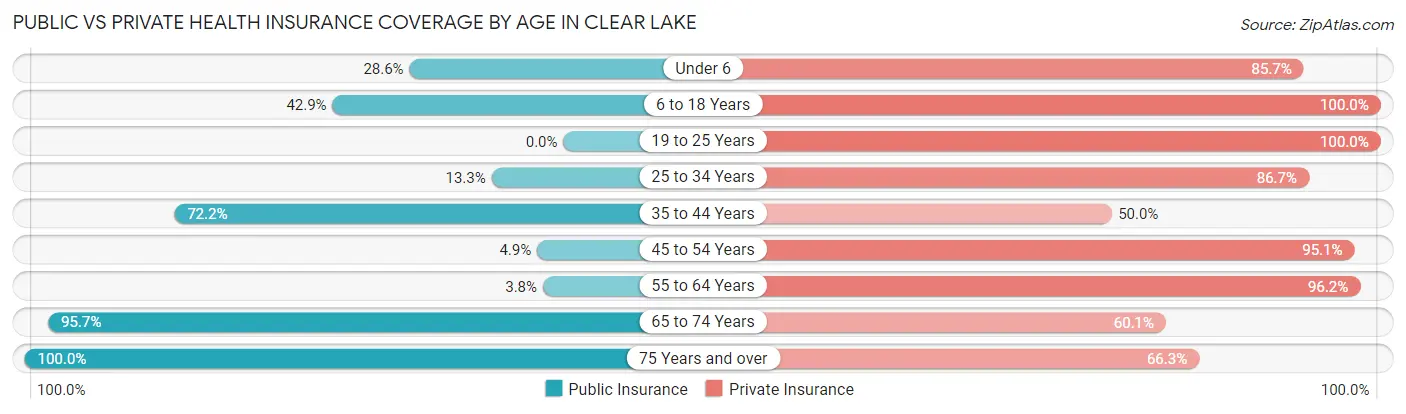
| Age Bracket | Public Insurance | Private Insurance |
| Under 6 | 2 (28.6%) | 6 (85.7%) |
| 6 to 18 Years | 3 (42.9%) | 7 (100.0%) |
| 19 to 25 Years | 0 (0.0%) | 2 (100.0%) |
| 25 to 34 Years | 2 (13.3%) | 13 (86.7%) |
| 35 to 44 Years | 13 (72.2%) | 9 (50.0%) |
| 45 to 54 Years | 2 (4.9%) | 39 (95.1%) |
| 55 to 64 Years | 3 (3.8%) | 76 (96.2%) |
| 65 to 74 Years | 132 (95.7%) | 83 (60.1%) |
| 75 Years and over | 89 (100.0%) | 59 (66.3%) |
| Total | 246 (62.1%) | 294 (74.2%) |
Disability Status by Sex by Age in Clear Lake
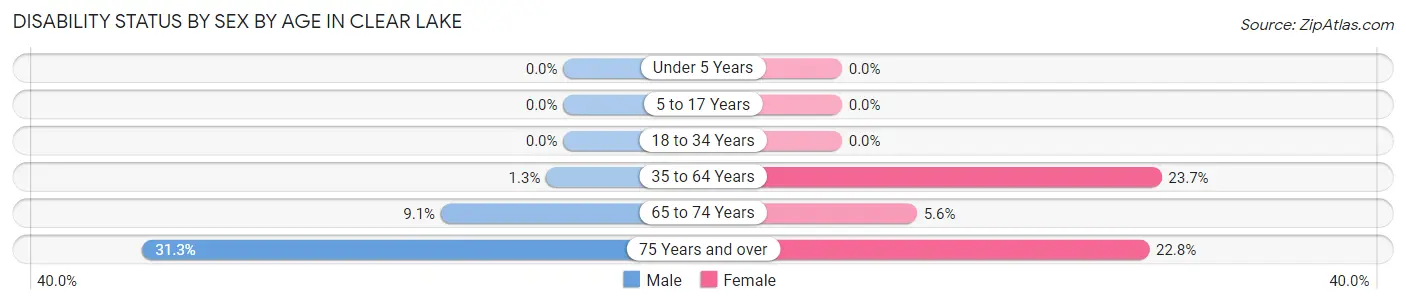
| Age Bracket | Male | Female |
| Under 5 Years | 0 (0.0%) | 0 (0.0%) |
| 5 to 17 Years | 0 (0.0%) | 0 (0.0%) |
| 18 to 34 Years | 0 (0.0%) | 0 (0.0%) |
| 35 to 64 Years | 1 (1.3%) | 14 (23.7%) |
| 65 to 74 Years | 6 (9.1%) | 4 (5.6%) |
| 75 Years and over | 10 (31.2%) | 13 (22.8%) |
Disability Class by Sex by Age in Clear Lake
Disability Class: Hearing Difficulty
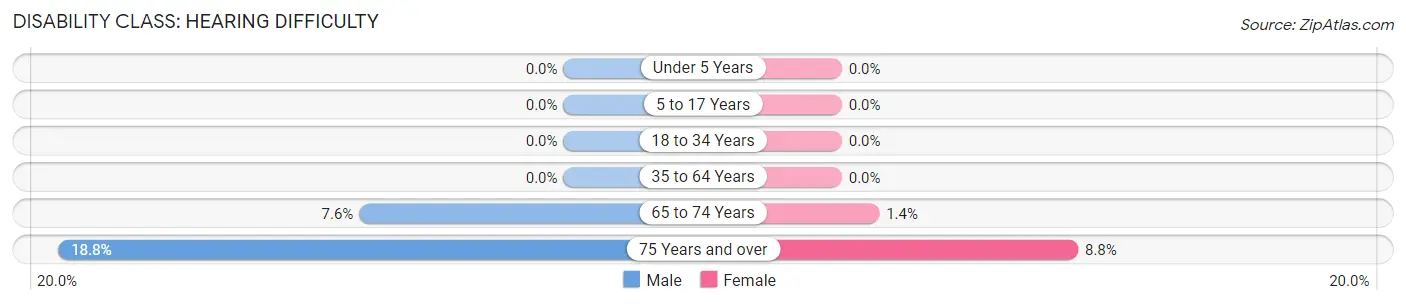
| Age Bracket | Male | Female |
| Under 5 Years | 0 (0.0%) | 0 (0.0%) |
| 5 to 17 Years | 0 (0.0%) | 0 (0.0%) |
| 18 to 34 Years | 0 (0.0%) | 0 (0.0%) |
| 35 to 64 Years | 0 (0.0%) | 0 (0.0%) |
| 65 to 74 Years | 5 (7.6%) | 1 (1.4%) |
| 75 Years and over | 6 (18.8%) | 5 (8.8%) |
Disability Class: Vision Difficulty
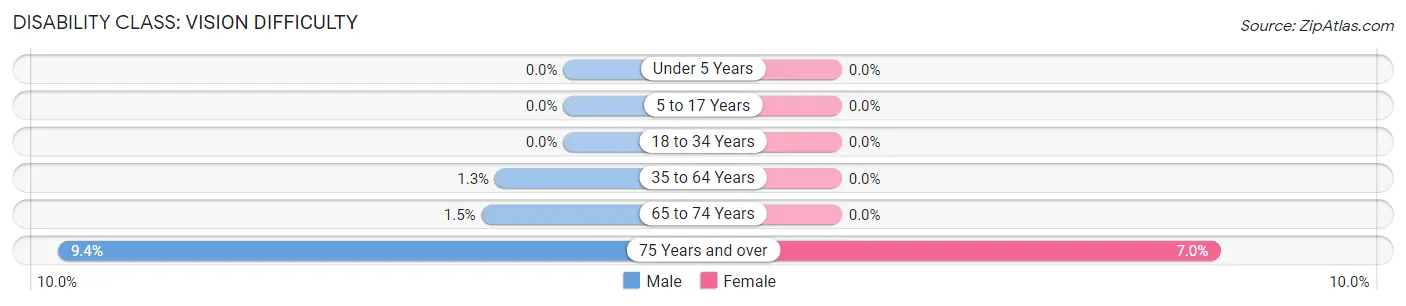
| Age Bracket | Male | Female |
| Under 5 Years | 0 (0.0%) | 0 (0.0%) |
| 5 to 17 Years | 0 (0.0%) | 0 (0.0%) |
| 18 to 34 Years | 0 (0.0%) | 0 (0.0%) |
| 35 to 64 Years | 1 (1.3%) | 0 (0.0%) |
| 65 to 74 Years | 1 (1.5%) | 0 (0.0%) |
| 75 Years and over | 3 (9.4%) | 4 (7.0%) |
Disability Class: Cognitive Difficulty
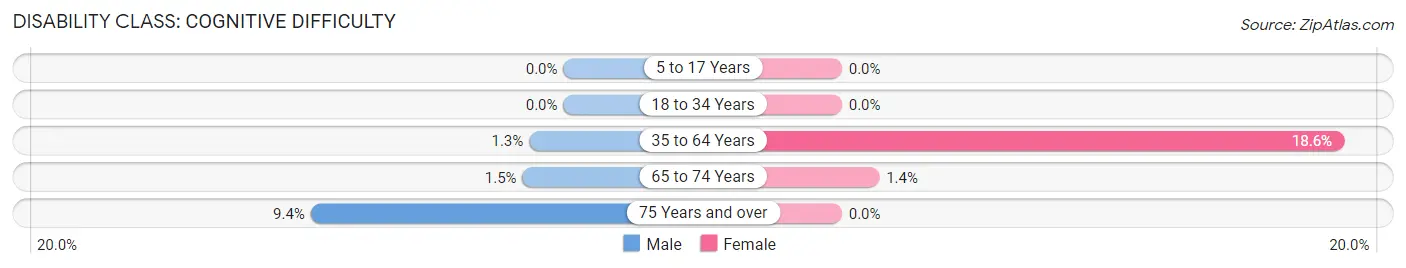
| Age Bracket | Male | Female |
| 5 to 17 Years | 0 (0.0%) | 0 (0.0%) |
| 18 to 34 Years | 0 (0.0%) | 0 (0.0%) |
| 35 to 64 Years | 1 (1.3%) | 11 (18.6%) |
| 65 to 74 Years | 1 (1.5%) | 1 (1.4%) |
| 75 Years and over | 3 (9.4%) | 0 (0.0%) |
Disability Class: Ambulatory Difficulty
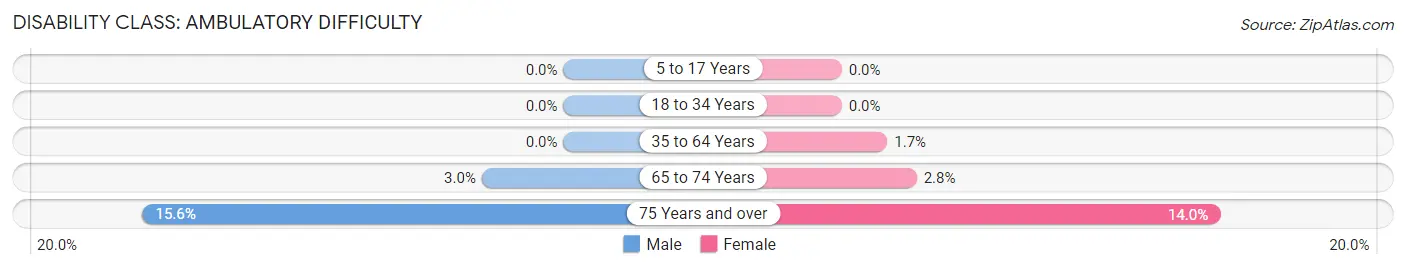
| Age Bracket | Male | Female |
| 5 to 17 Years | 0 (0.0%) | 0 (0.0%) |
| 18 to 34 Years | 0 (0.0%) | 0 (0.0%) |
| 35 to 64 Years | 0 (0.0%) | 1 (1.7%) |
| 65 to 74 Years | 2 (3.0%) | 2 (2.8%) |
| 75 Years and over | 5 (15.6%) | 8 (14.0%) |
Disability Class: Self-Care Difficulty
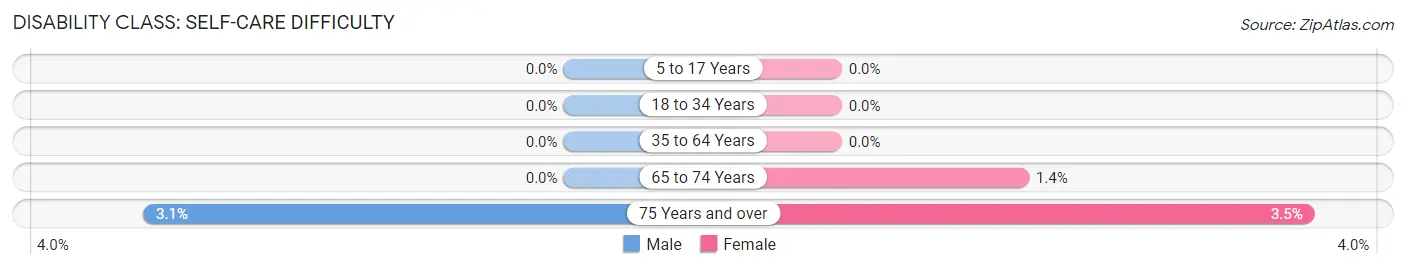
| Age Bracket | Male | Female |
| 5 to 17 Years | 0 (0.0%) | 0 (0.0%) |
| 18 to 34 Years | 0 (0.0%) | 0 (0.0%) |
| 35 to 64 Years | 0 (0.0%) | 0 (0.0%) |
| 65 to 74 Years | 0 (0.0%) | 1 (1.4%) |
| 75 Years and over | 1 (3.1%) | 2 (3.5%) |
Technology Access in Clear Lake
Computing Device Access in Clear Lake
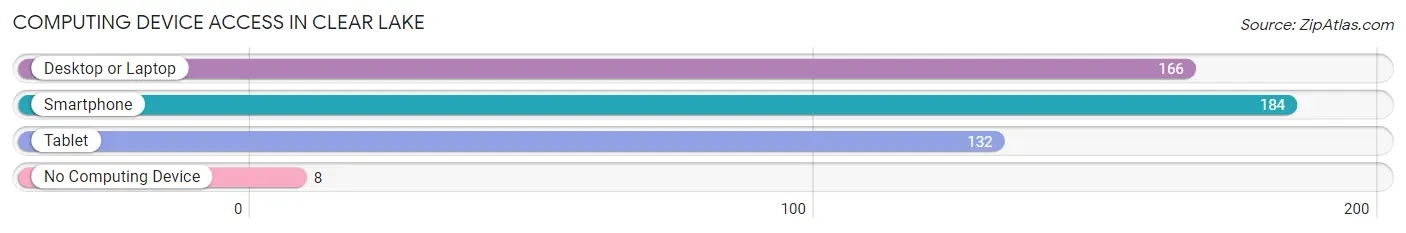
| Device Type | # Households | % Households |
| Desktop or Laptop | 166 | 76.5% |
| Smartphone | 184 | 84.8% |
| Tablet | 132 | 60.8% |
| No Computing Device | 8 | 3.7% |
| Total | 217 | 100.0% |
Internet Access in Clear Lake
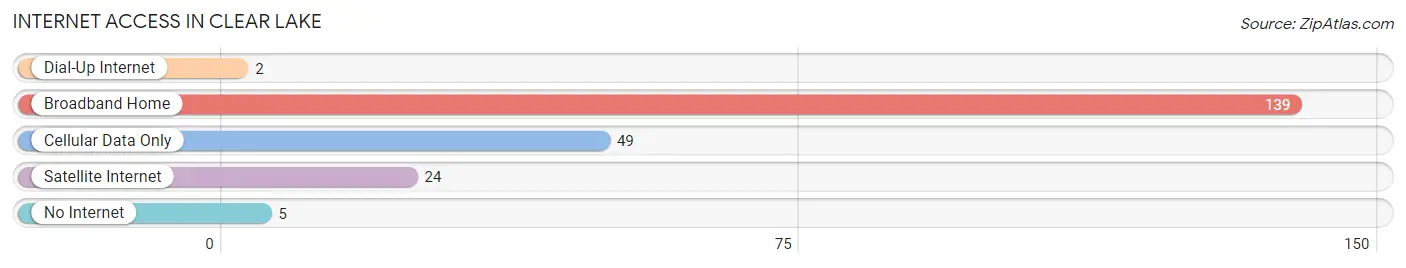
| Internet Type | # Households | % Households |
| Dial-Up Internet | 2 | 0.9% |
| Broadband Home | 139 | 64.1% |
| Cellular Data Only | 49 | 22.6% |
| Satellite Internet | 24 | 11.1% |
| No Internet | 5 | 2.3% |
| Total | 217 | 100.0% |
Clear Lake Summary
History
Clear Lake is a small town located in LaPorte County, Indiana. It is situated on the banks of Clear Lake, a natural lake that was formed by a glacier during the last ice age. The town was founded in 1837 by settlers from New York and Pennsylvania. The first settlers were attracted to the area by the abundance of fish and game in the lake.
The town was originally called Clear Lake Village, but the name was changed to Clear Lake in 1845. The town was incorporated in 1851 and the first mayor was elected in 1852.
Clear Lake has a rich history of industry and agriculture. In the late 1800s, the town was home to several sawmills, gristmills, and a brickyard. The town also had a thriving dairy industry, with several local farms producing milk and cheese.
In the early 1900s, Clear Lake began to attract tourists from Chicago and other nearby cities. The town was known for its beautiful lake and its many resorts. The resorts offered fishing, boating, and swimming, as well as other recreational activities.
In the 1950s, Clear Lake began to experience a decline in its economy. The sawmills and gristmills closed, and the dairy industry moved away. The town’s population began to decline as well.
In the late 1970s, the town began to experience a resurgence. The town was designated as a National Historic District in 1979, and the Clear Lake Historical Society was formed in 1980. The town also began to attract new businesses, such as a winery and a microbrewery.
Today, Clear Lake is a small but vibrant community. The town is home to several businesses, including a winery, a microbrewery, and a restaurant. The town also has a museum, a library, and a park.
Geography
Clear Lake is located in LaPorte County, Indiana. The town is situated on the banks of Clear Lake, a natural lake that was formed by a glacier during the last ice age. The lake is approximately 1,000 acres in size and is fed by several small streams.
The town is located in a rural area, surrounded by farmland and woodlands. The nearest major city is South Bend, which is approximately 30 miles away.
Economy
Clear Lake’s economy is largely based on tourism and agriculture. The town is home to several wineries, microbreweries, and restaurants, which attract visitors from nearby cities. The town also has a museum, a library, and a park, which attract visitors from all over the region.
The town’s agricultural industry is centered around dairy farming. Several local farms produce milk and cheese, which are sold in nearby cities.
Demographics
As of the 2010 census, the population of Clear Lake was 1,845. The town has a median age of 43.7 years, and the median household income is $45,945. The town is predominantly white (94.3%), with small percentages of African American (2.2%), Hispanic (1.7%), and Asian (1.2%) residents.
Conclusion
Clear Lake is a small town located in LaPorte County, Indiana. The town was founded in 1837 and has a rich history of industry and agriculture. Today, the town is a vibrant community, with a thriving tourism and agricultural industry. The town is home to several businesses, a museum, a library, and a park. The population of Clear Lake is predominantly white, with small percentages of African American, Hispanic, and Asian residents.
Common Questions
What is Per Capita Income in Clear Lake?
Per Capita income in Clear Lake is $105,556.
What is the Median Family Income in Clear Lake?
Median Family Income in Clear Lake is $96,250.
What is the Median Household income in Clear Lake?
Median Household Income in Clear Lake is $87,813.
What is Inequality or Gini Index in Clear Lake?
Inequality or Gini Index in Clear Lake is 0.59.
What is the Total Population of Clear Lake?
Total Population of Clear Lake is 396.
What is the Total Male Population of Clear Lake?
Total Male Population of Clear Lake is 199.
What is the Total Female Population of Clear Lake?
Total Female Population of Clear Lake is 197.
What is the Ratio of Males per 100 Females in Clear Lake?
There are 101.02 Males per 100 Females in Clear Lake.
What is the Ratio of Females per 100 Males in Clear Lake?
There are 98.99 Females per 100 Males in Clear Lake.
What is the Median Population Age in Clear Lake?
Median Population Age in Clear Lake is 68.3 Years.
What is the Average Family Size in Clear Lake
Average Family Size in Clear Lake is 2.2 People.
What is the Average Household Size in Clear Lake
Average Household Size in Clear Lake is 1.8 People.
How Large is the Labor Force in Clear Lake?
There are 168 People in the Labor Forcein in Clear Lake.
What is the Percentage of People in the Labor Force in Clear Lake?
44.0% of People are in the Labor Force in Clear Lake.
What is the Unemployment Rate in Clear Lake?
Unemployment Rate in Clear Lake is 2.4%.