Homecroft, IN Map & Demographics
Homecroft Map
Homecroft Overview
$43,766
PER CAPITA INCOME
$102,321
AVG FAMILY INCOME
$83,125
AVG HOUSEHOLD INCOME
7.8%
WAGE / INCOME GAP [ % ]
92.2¢/ $1
WAGE / INCOME GAP [ $ ]
0.32
INEQUALITY / GINI INDEX
737
TOTAL POPULATION
335
MALE POPULATION
402
FEMALE POPULATION
83.33
MALES / 100 FEMALES
120.00
FEMALES / 100 MALES
42.6
MEDIAN AGE
2.7
AVG FAMILY SIZE
2.2
AVG HOUSEHOLD SIZE
464
LABOR FORCE [ PEOPLE ]
73.4%
PERCENT IN LABOR FORCE
0.4%
UNEMPLOYMENT RATE
Homecroft Area Codes
Income in Homecroft
Income Overview in Homecroft
Per Capita Income in Homecroft is $43,766, while median incomes of families and households are $102,321 and $83,125 respectively.
| Characteristic | Number | Measure |
| Per Capita Income | 737 | $43,766 |
| Median Family Income | 221 | $102,321 |
| Mean Family Income | 221 | $106,350 |
| Median Household Income | 339 | $83,125 |
| Mean Household Income | 339 | $94,581 |
| Income Deficit | 221 | $0 |
| Wage / Income Gap (%) | 737 | 7.85% |
| Wage / Income Gap ($) | 737 | 92.15¢ per $1 |
| Gini / Inequality Index | 737 | 0.32 |
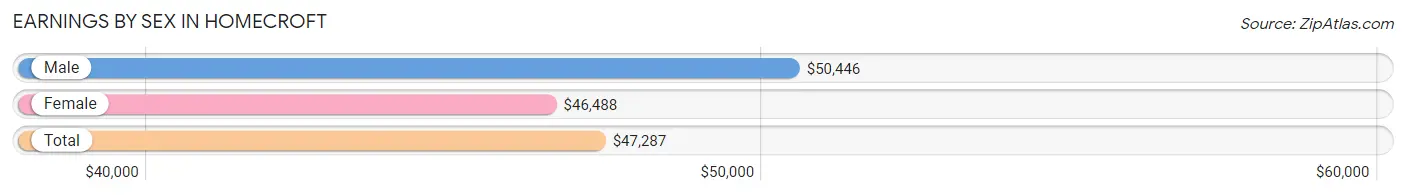
Earnings by Sex in Homecroft
Average Earnings in Homecroft are $47,287, $50,446 for men and $46,488 for women, a difference of 7.9%.
| Sex | Number | Average Earnings |
| Male | 219 (45.4%) | $50,446 |
| Female | 263 (54.6%) | $46,488 |
| Total | 482 (100.0%) | $47,287 |
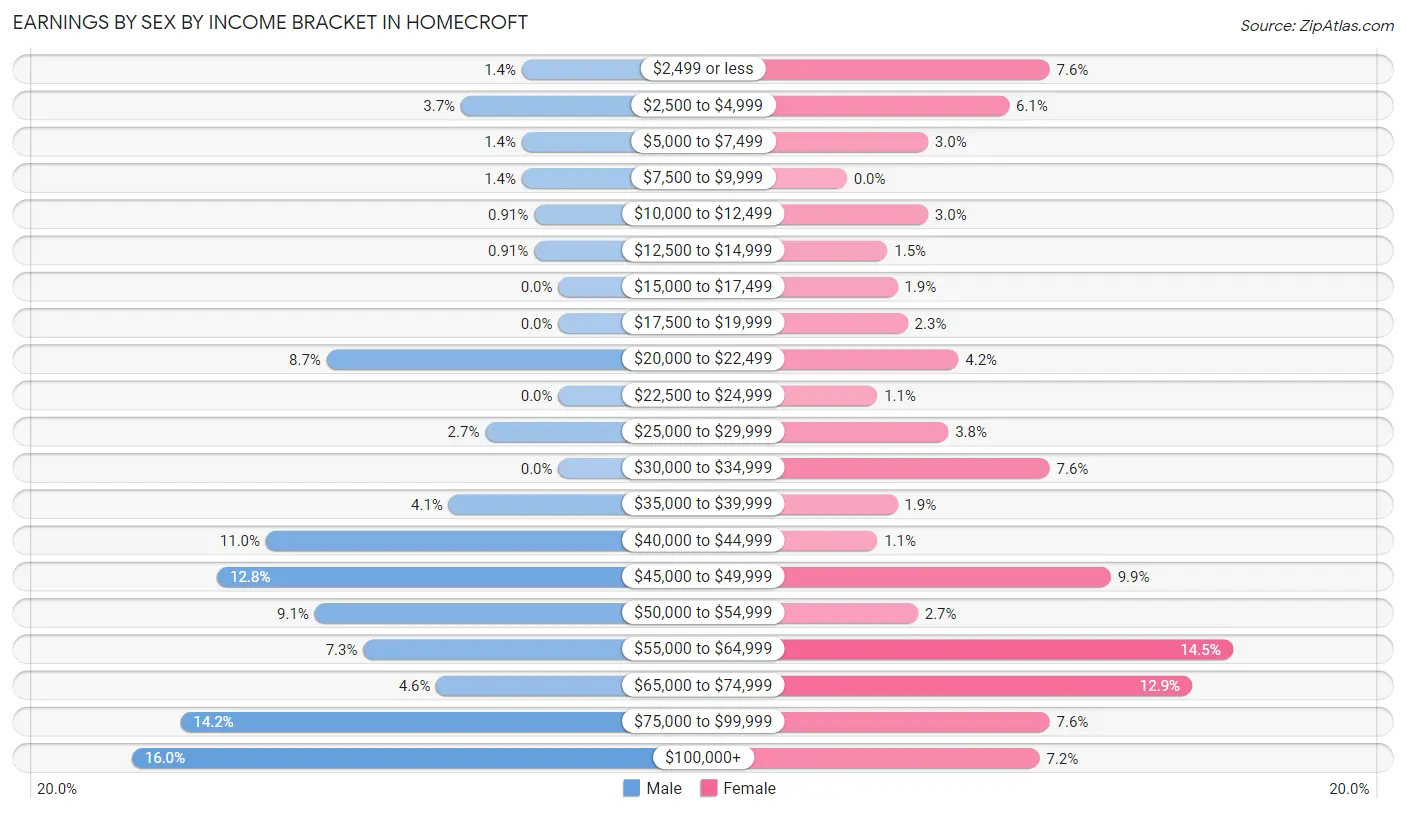
Earnings by Sex by Income Bracket in Homecroft
The most common earnings brackets in Homecroft are $100,000+ for men (35 | 16.0%) and $55,000 to $64,999 for women (38 | 14.4%).
| Income | Male | Female |
| $2,499 or less | 3 (1.4%) | 20 (7.6%) |
| $2,500 to $4,999 | 8 (3.6%) | 16 (6.1%) |
| $5,000 to $7,499 | 3 (1.4%) | 8 (3.0%) |
| $7,500 to $9,999 | 3 (1.4%) | 0 (0.0%) |
| $10,000 to $12,499 | 2 (0.9%) | 8 (3.0%) |
| $12,500 to $14,999 | 2 (0.9%) | 4 (1.5%) |
| $15,000 to $17,499 | 0 (0.0%) | 5 (1.9%) |
| $17,500 to $19,999 | 0 (0.0%) | 6 (2.3%) |
| $20,000 to $22,499 | 19 (8.7%) | 11 (4.2%) |
| $22,500 to $24,999 | 0 (0.0%) | 3 (1.1%) |
| $25,000 to $29,999 | 6 (2.7%) | 10 (3.8%) |
| $30,000 to $34,999 | 0 (0.0%) | 20 (7.6%) |
| $35,000 to $39,999 | 9 (4.1%) | 5 (1.9%) |
| $40,000 to $44,999 | 24 (11.0%) | 3 (1.1%) |
| $45,000 to $49,999 | 28 (12.8%) | 26 (9.9%) |
| $50,000 to $54,999 | 20 (9.1%) | 7 (2.7%) |
| $55,000 to $64,999 | 16 (7.3%) | 38 (14.4%) |
| $65,000 to $74,999 | 10 (4.6%) | 34 (12.9%) |
| $75,000 to $99,999 | 31 (14.2%) | 20 (7.6%) |
| $100,000+ | 35 (16.0%) | 19 (7.2%) |
| Total | 219 (100.0%) | 263 (100.0%) |
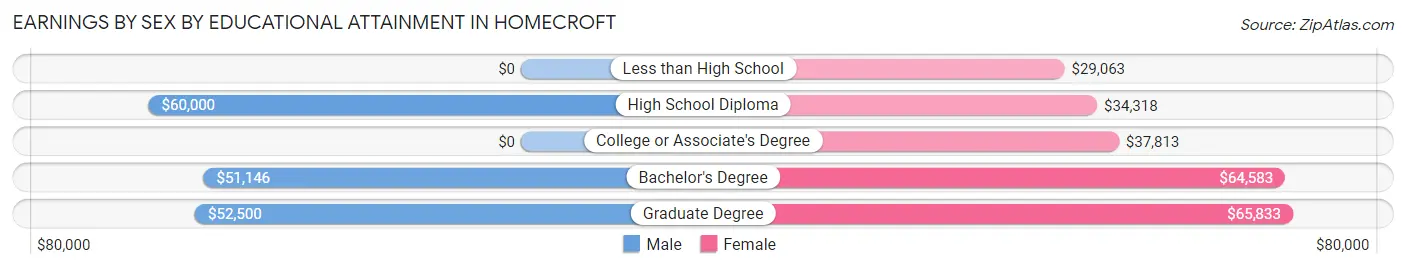
Earnings by Sex by Educational Attainment in Homecroft
Average earnings in Homecroft are $51,518 for men and $50,313 for women, a difference of 2.3%. Men with an educational attainment of high school diploma enjoy the highest average annual earnings of $60,000, while those with bachelor's degree education earn the least with $51,146. Women with an educational attainment of graduate degree earn the most with the average annual earnings of $65,833, while those with less than high school education have the smallest earnings of $29,063.
| Educational Attainment | Male Income | Female Income |
| Less than High School | - | - |
| High School Diploma | $60,000 | $34,318 |
| College or Associate's Degree | - | - |
| Bachelor's Degree | $51,146 | $64,583 |
| Graduate Degree | $52,500 | $65,833 |
| Total | $51,518 | $50,313 |
Family Income in Homecroft
Family Income Brackets in Homecroft
According to the Homecroft family income data, there are 71 families falling into the $100,000 to $149,999 income range, which is the most common income bracket and makes up 32.1% of all families.
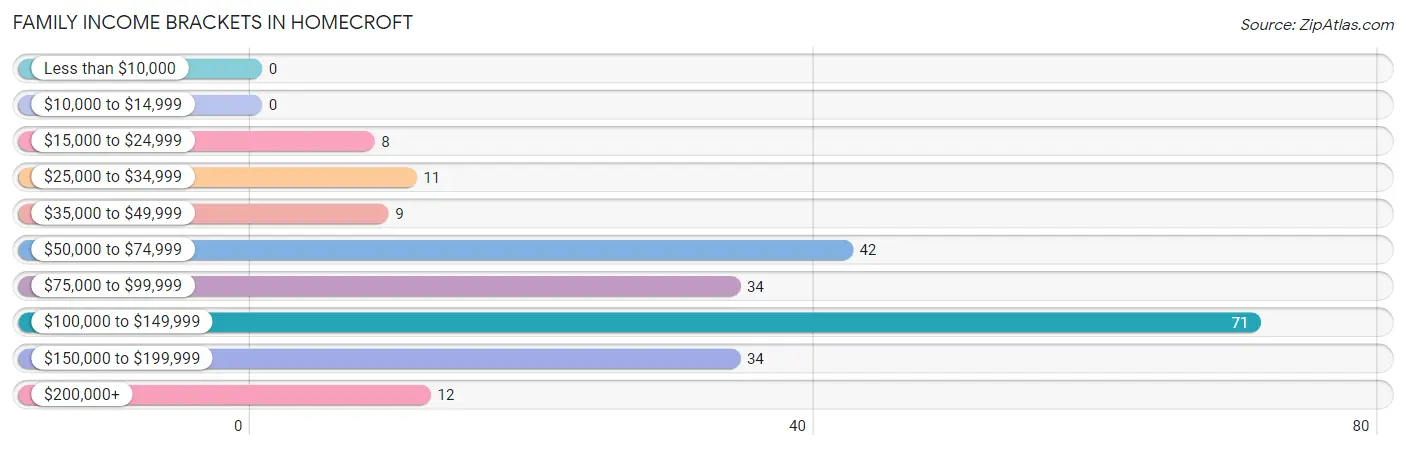
| Income Bracket | # Families | % Families |
| Less than $10,000 | 0 | 0.0% |
| $10,000 to $14,999 | 0 | 0.0% |
| $15,000 to $24,999 | 8 | 3.6% |
| $25,000 to $34,999 | 11 | 5.0% |
| $35,000 to $49,999 | 9 | 4.1% |
| $50,000 to $74,999 | 42 | 19.0% |
| $75,000 to $99,999 | 34 | 15.4% |
| $100,000 to $149,999 | 71 | 32.1% |
| $150,000 to $199,999 | 34 | 15.4% |
| $200,000+ | 12 | 5.4% |
Family Income by Famaliy Size in Homecroft
3-person families (31 | 14.0%) account for the highest median family income in Homecroft with $113,958 per family, while 2-person families (139 | 62.9%) have the highest median income of $49,479 per family member.
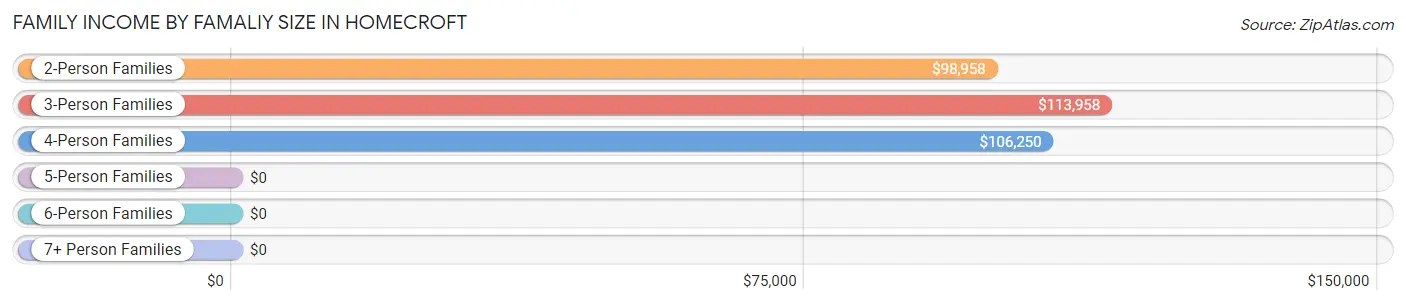
| Income Bracket | # Families | Median Income |
| 2-Person Families | 139 (62.9%) | $98,958 |
| 3-Person Families | 31 (14.0%) | $113,958 |
| 4-Person Families | 45 (20.4%) | $106,250 |
| 5-Person Families | 2 (0.9%) | $0 |
| 6-Person Families | 4 (1.8%) | $0 |
| 7+ Person Families | 0 (0.0%) | $0 |
| Total | 221 (100.0%) | $102,321 |
Family Income by Number of Earners in Homecroft
The median family income in Homecroft is $102,321, with families comprising 3+ earners (24) having the highest median family income of $147,778, while families with no earners (28) have the lowest median family income of $51,250, accounting for 10.9% and 12.7% of families, respectively.
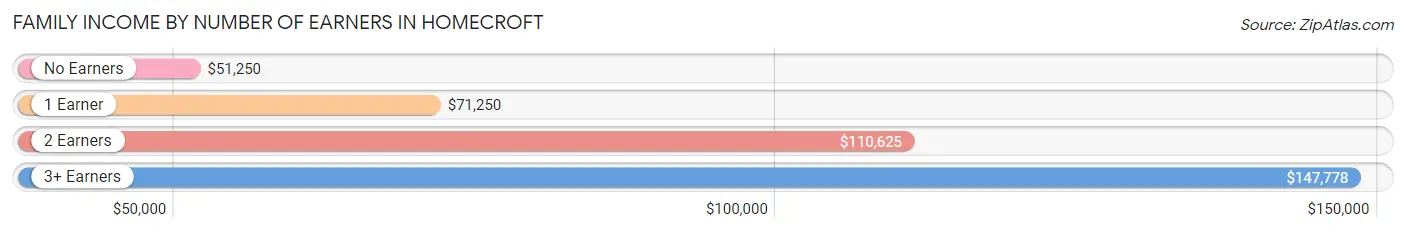
| Number of Earners | # Families | Median Income |
| No Earners | 28 (12.7%) | $51,250 |
| 1 Earner | 56 (25.3%) | $71,250 |
| 2 Earners | 113 (51.1%) | $110,625 |
| 3+ Earners | 24 (10.9%) | $147,778 |
| Total | 221 (100.0%) | $102,321 |
Household Income in Homecroft
Household Income Brackets in Homecroft
With 87 households falling in the category, the $100,000 to $149,999 income range is the most frequent in Homecroft, accounting for 25.7% of all households.
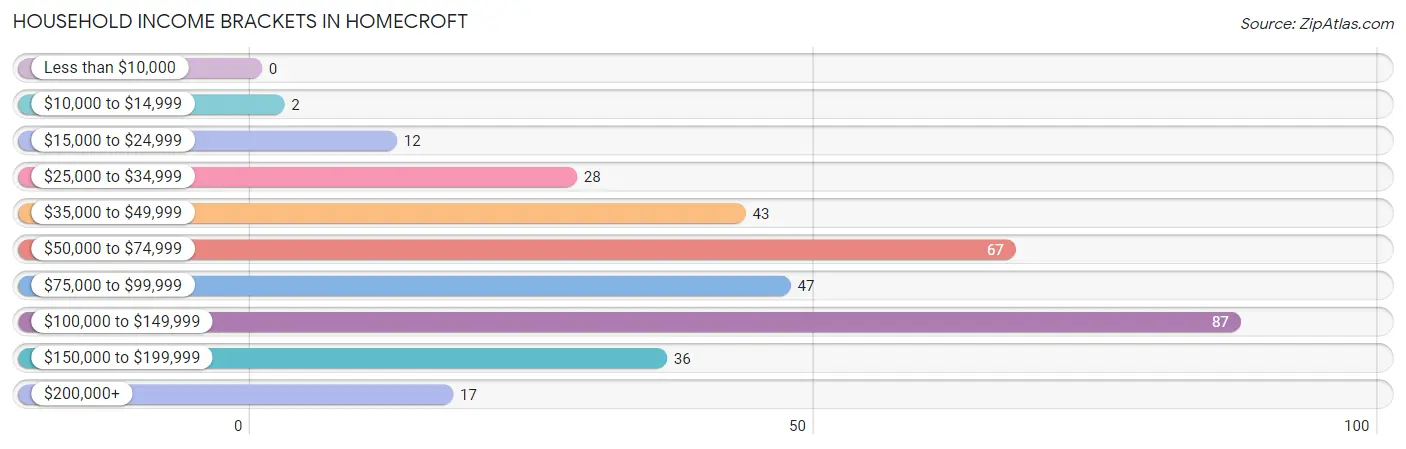
| Income Bracket | # Households | % Households |
| Less than $10,000 | 0 | 0.0% |
| $10,000 to $14,999 | 2 | 0.6% |
| $15,000 to $24,999 | 12 | 3.5% |
| $25,000 to $34,999 | 28 | 8.3% |
| $35,000 to $49,999 | 43 | 12.7% |
| $50,000 to $74,999 | 67 | 19.8% |
| $75,000 to $99,999 | 47 | 13.9% |
| $100,000 to $149,999 | 87 | 25.7% |
| $150,000 to $199,999 | 36 | 10.6% |
| $200,000+ | 17 | 5.0% |
Household Income by Householder Age in Homecroft
The median household income in Homecroft is $83,125, with the highest median household income of $109,044 found in the 25 to 44 years age bracket for the primary householder. A total of 121 households (35.7%) fall into this category.
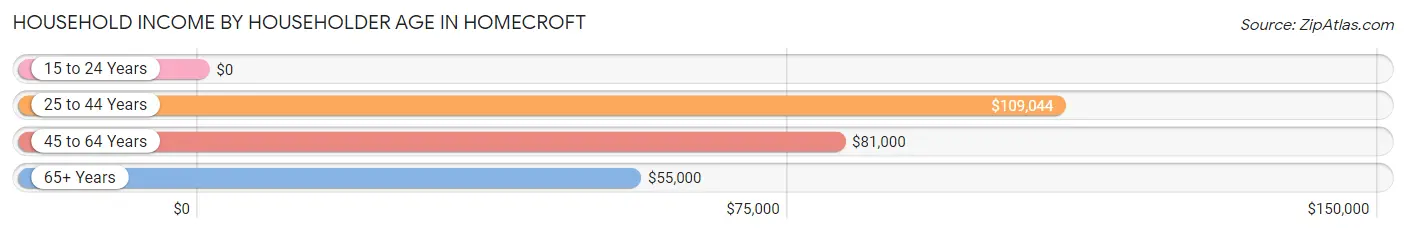
| Income Bracket | # Households | Median Income |
| 15 to 24 Years | 0 (0.0%) | $0 |
| 25 to 44 Years | 121 (35.7%) | $109,044 |
| 45 to 64 Years | 132 (38.9%) | $81,000 |
| 65+ Years | 86 (25.4%) | $55,000 |
| Total | 339 (100.0%) | $83,125 |
Poverty in Homecroft
Income Below Poverty by Sex and Age in Homecroft
With 1.5% poverty level for males and 0.7% for females among the residents of Homecroft, 18 to 24 year old males and 45 to 54 year old females are the most vulnerable to poverty, with 3 males (18.8%) and 2 females (4.3%) in their respective age groups living below the poverty level.
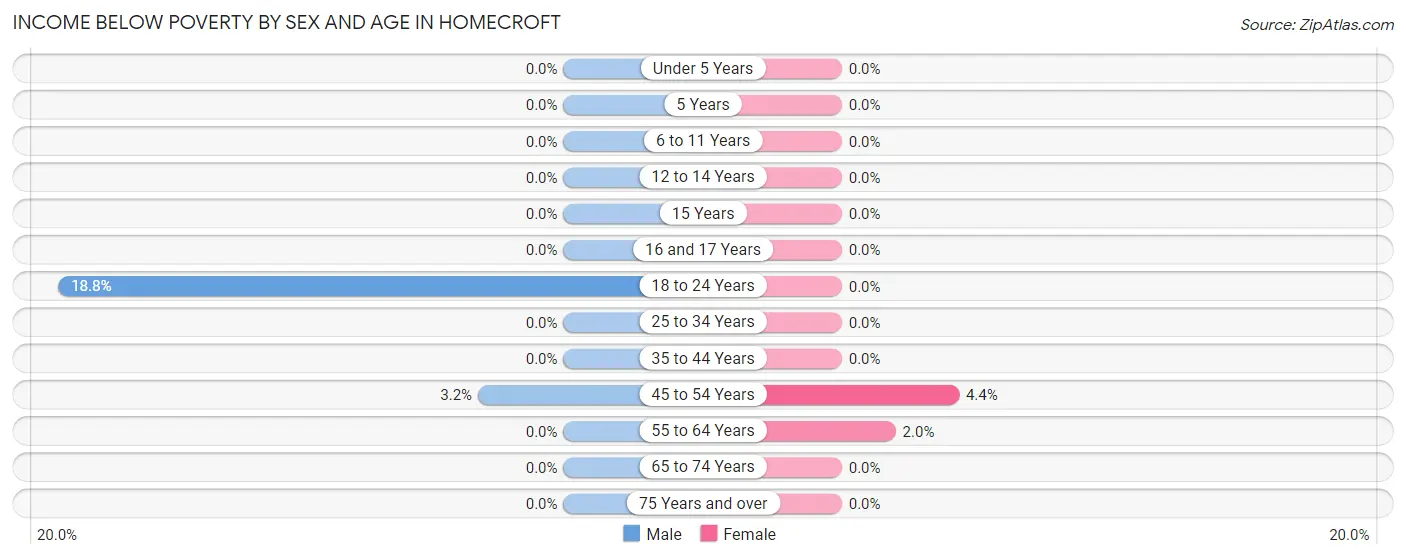
| Age Bracket | Male | Female |
| Under 5 Years | 0 (0.0%) | 0 (0.0%) |
| 5 Years | 0 (0.0%) | 0 (0.0%) |
| 6 to 11 Years | 0 (0.0%) | 0 (0.0%) |
| 12 to 14 Years | 0 (0.0%) | 0 (0.0%) |
| 15 Years | 0 (0.0%) | 0 (0.0%) |
| 16 and 17 Years | 0 (0.0%) | 0 (0.0%) |
| 18 to 24 Years | 3 (18.8%) | 0 (0.0%) |
| 25 to 34 Years | 0 (0.0%) | 0 (0.0%) |
| 35 to 44 Years | 0 (0.0%) | 0 (0.0%) |
| 45 to 54 Years | 2 (3.2%) | 2 (4.3%) |
| 55 to 64 Years | 0 (0.0%) | 1 (2.0%) |
| 65 to 74 Years | 0 (0.0%) | 0 (0.0%) |
| 75 Years and over | 0 (0.0%) | 0 (0.0%) |
| Total | 5 (1.5%) | 3 (0.7%) |
Income Above Poverty by Sex and Age in Homecroft
According to the poverty statistics in Homecroft, males aged under 5 years and females aged under 5 years are the age groups that are most secure financially, with 100.0% of males and 100.0% of females in these age groups living above the poverty line.
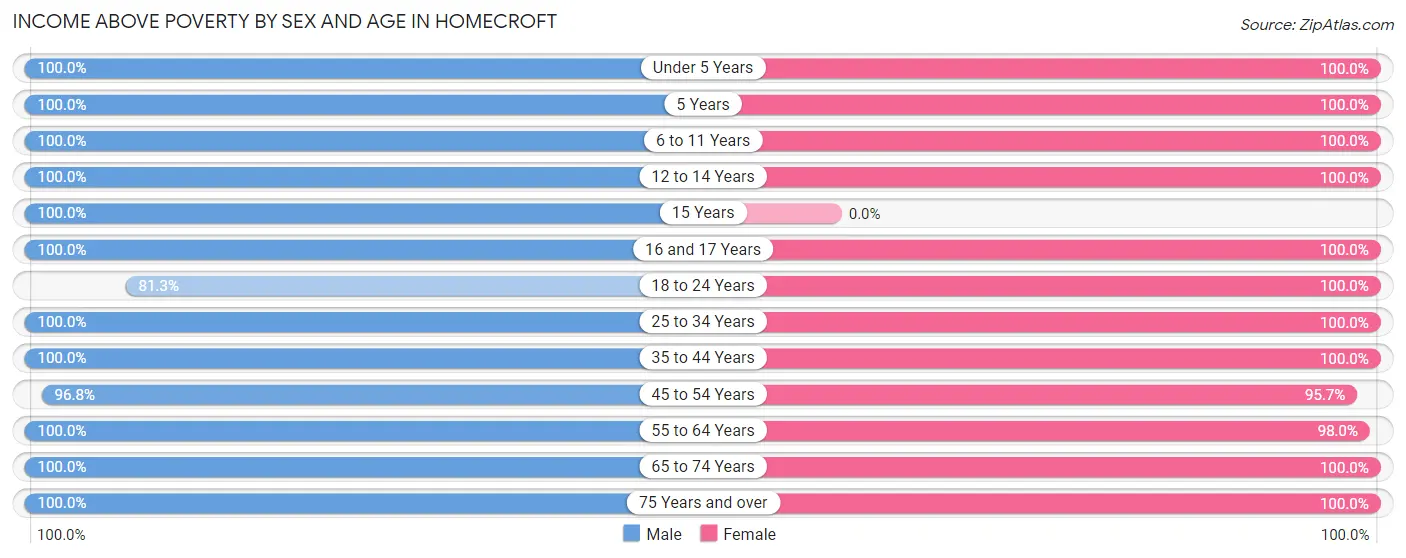
| Age Bracket | Male | Female |
| Under 5 Years | 9 (100.0%) | 21 (100.0%) |
| 5 Years | 15 (100.0%) | 4 (100.0%) |
| 6 to 11 Years | 15 (100.0%) | 21 (100.0%) |
| 12 to 14 Years | 8 (100.0%) | 10 (100.0%) |
| 15 Years | 2 (100.0%) | 0 (0.0%) |
| 16 and 17 Years | 2 (100.0%) | 9 (100.0%) |
| 18 to 24 Years | 13 (81.2%) | 22 (100.0%) |
| 25 to 34 Years | 43 (100.0%) | 52 (100.0%) |
| 35 to 44 Years | 63 (100.0%) | 82 (100.0%) |
| 45 to 54 Years | 61 (96.8%) | 44 (95.7%) |
| 55 to 64 Years | 55 (100.0%) | 49 (98.0%) |
| 65 to 74 Years | 26 (100.0%) | 63 (100.0%) |
| 75 Years and over | 18 (100.0%) | 22 (100.0%) |
| Total | 330 (98.5%) | 399 (99.3%) |
Income Below Poverty Among Married-Couple Families in Homecroft
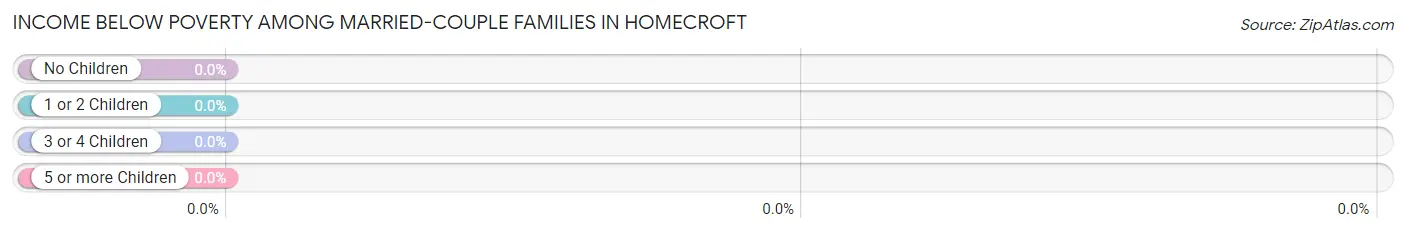
| Children | Above Poverty | Below Poverty |
| No Children | 115 (100.0%) | 0 (0.0%) |
| 1 or 2 Children | 56 (100.0%) | 0 (0.0%) |
| 3 or 4 Children | 6 (100.0%) | 0 (0.0%) |
| 5 or more Children | 0 (0.0%) | 0 (0.0%) |
| Total | 177 (100.0%) | 0 (0.0%) |
Income Below Poverty Among Single-Parent Households in Homecroft
| Children | Single Father | Single Mother |
| No Children | 0 (0.0%) | 0 (0.0%) |
| 1 or 2 Children | 0 (0.0%) | 0 (0.0%) |
| 3 or 4 Children | 0 (0.0%) | 0 (0.0%) |
| 5 or more Children | 0 (0.0%) | 0 (0.0%) |
| Total | 0 (0.0%) | 0 (0.0%) |
Income Below Poverty Among Married-Couple vs Single-Parent Households in Homecroft
| Children | Married-Couple Families | Single-Parent Households |
| No Children | 0 (0.0%) | 0 (0.0%) |
| 1 or 2 Children | 0 (0.0%) | 0 (0.0%) |
| 3 or 4 Children | 0 (0.0%) | 0 (0.0%) |
| 5 or more Children | 0 (0.0%) | 0 (0.0%) |
| Total | 0 (0.0%) | 0 (0.0%) |
Race in Homecroft
The most populous races in Homecroft are White / Caucasian (698 | 94.7%), Black / African American (18 | 2.4%), and Two or more Races (13 | 1.8%).
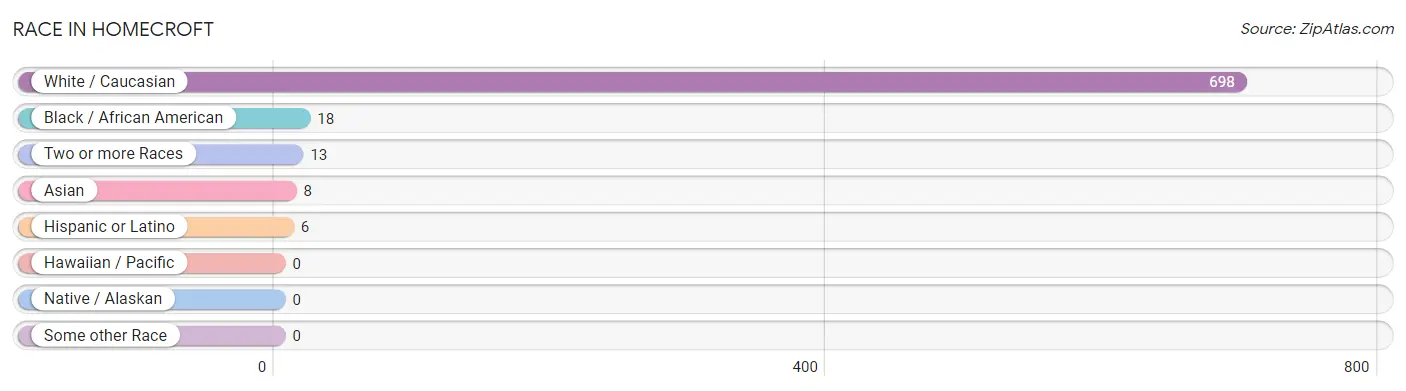
| Race | # Population | % Population |
| Asian | 8 | 1.1% |
| Black / African American | 18 | 2.4% |
| Hawaiian / Pacific | 0 | 0.0% |
| Hispanic or Latino | 6 | 0.8% |
| Native / Alaskan | 0 | 0.0% |
| White / Caucasian | 698 | 94.7% |
| Two or more Races | 13 | 1.8% |
| Some other Race | 0 | 0.0% |
| Total | 737 | 100.0% |
Ancestry in Homecroft
The most populous ancestries reported in Homecroft are German (220 | 29.8%), Irish (137 | 18.6%), English (120 | 16.3%), American (36 | 4.9%), and Scottish (33 | 4.5%), together accounting for 74.1% of all Homecroft residents.
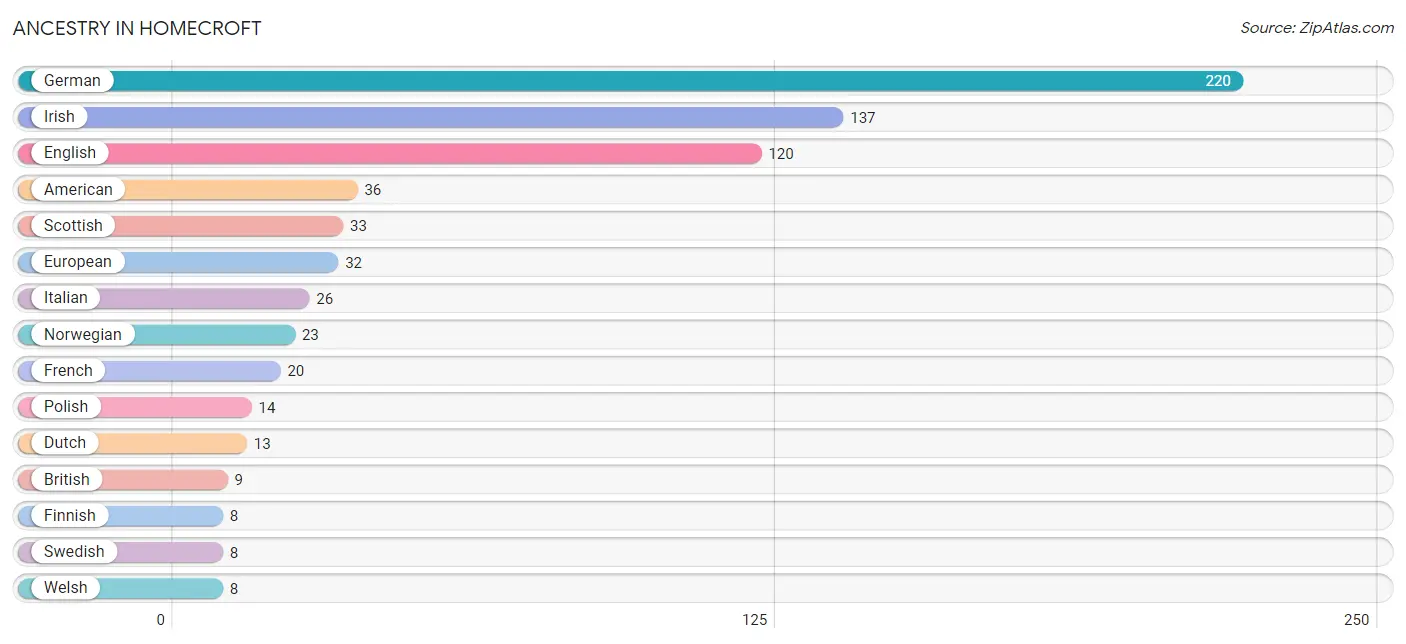
| Ancestry | # Population | % Population |
| American | 36 | 4.9% |
| Austrian | 2 | 0.3% |
| British | 9 | 1.2% |
| Cherokee | 7 | 0.9% |
| Colombian | 6 | 0.8% |
| Dutch | 13 | 1.8% |
| English | 120 | 16.3% |
| European | 32 | 4.3% |
| Finnish | 8 | 1.1% |
| French | 20 | 2.7% |
| French Canadian | 2 | 0.3% |
| German | 220 | 29.8% |
| Greek | 7 | 0.9% |
| Indonesian | 3 | 0.4% |
| Irish | 137 | 18.6% |
| Italian | 26 | 3.5% |
| Norwegian | 23 | 3.1% |
| Polish | 14 | 1.9% |
| Romanian | 2 | 0.3% |
| Russian | 5 | 0.7% |
| Scotch-Irish | 1 | 0.1% |
| Scottish | 33 | 4.5% |
| South American | 6 | 0.8% |
| Swedish | 8 | 1.1% |
| Swiss | 1 | 0.1% |
| Welsh | 8 | 1.1% | View All 26 Rows |
Immigrants in Homecroft
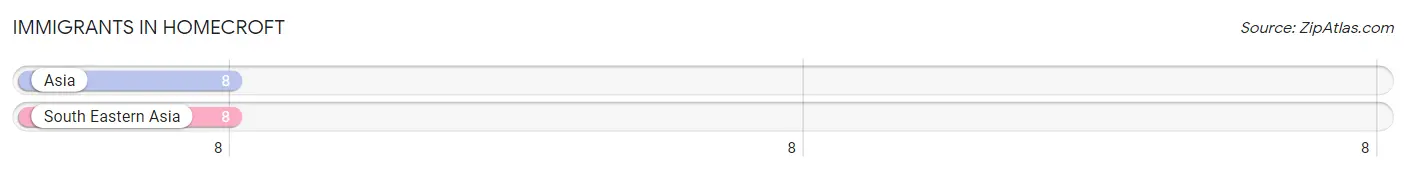
The most numerous immigrant groups reported in Homecroft came from Asia (8 | 1.1%), and South Eastern Asia (8 | 1.1%), together accounting for 2.2% of all Homecroft residents.
| Immigration Origin | # Population | % Population |
| Asia | 8 | 1.1% |
| South Eastern Asia | 8 | 1.1% | View All 2 Rows |
Sex and Age in Homecroft
Sex and Age in Homecroft
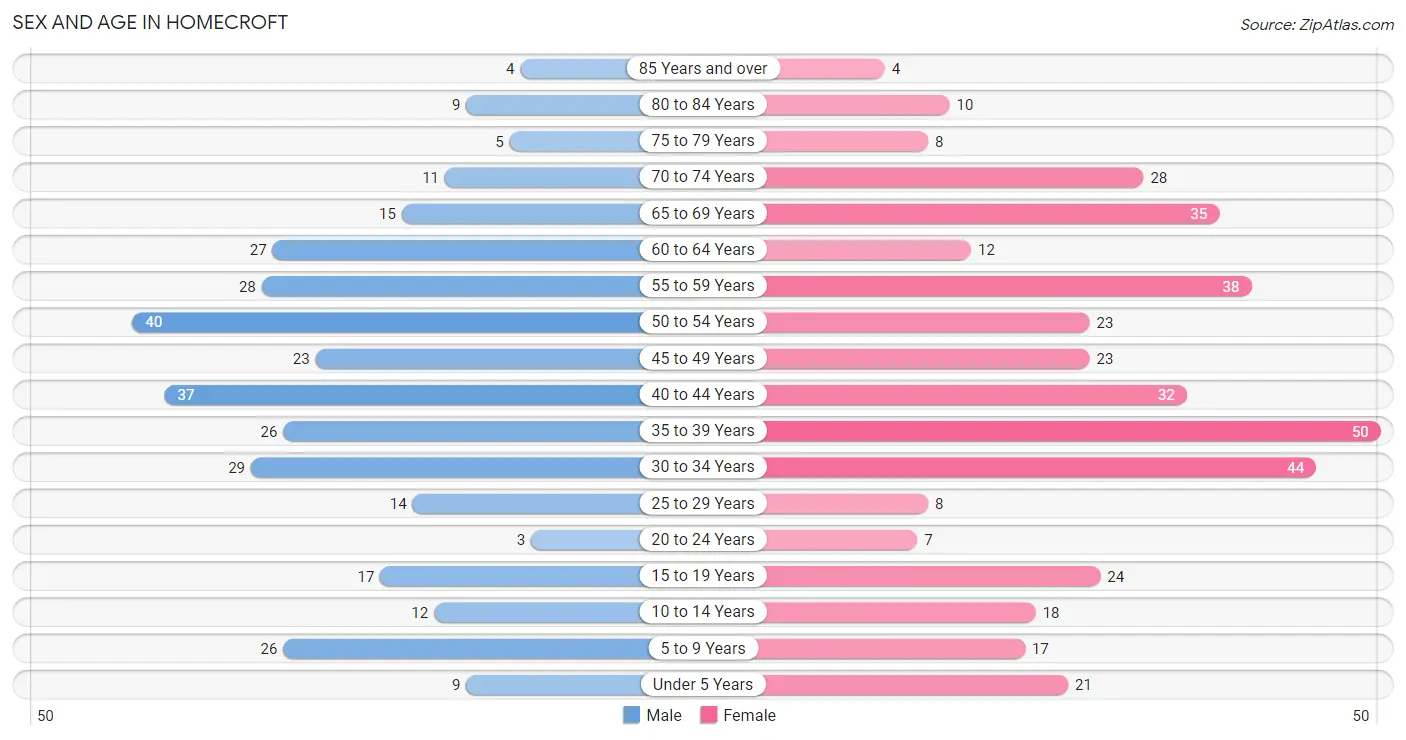
The most populous age groups in Homecroft are 50 to 54 Years (40 | 11.9%) for men and 35 to 39 Years (50 | 12.4%) for women.
| Age Bracket | Male | Female |
| Under 5 Years | 9 (2.7%) | 21 (5.2%) |
| 5 to 9 Years | 26 (7.8%) | 17 (4.2%) |
| 10 to 14 Years | 12 (3.6%) | 18 (4.5%) |
| 15 to 19 Years | 17 (5.1%) | 24 (6.0%) |
| 20 to 24 Years | 3 (0.9%) | 7 (1.7%) |
| 25 to 29 Years | 14 (4.2%) | 8 (2.0%) |
| 30 to 34 Years | 29 (8.7%) | 44 (11.0%) |
| 35 to 39 Years | 26 (7.8%) | 50 (12.4%) |
| 40 to 44 Years | 37 (11.0%) | 32 (8.0%) |
| 45 to 49 Years | 23 (6.9%) | 23 (5.7%) |
| 50 to 54 Years | 40 (11.9%) | 23 (5.7%) |
| 55 to 59 Years | 28 (8.4%) | 38 (9.5%) |
| 60 to 64 Years | 27 (8.1%) | 12 (3.0%) |
| 65 to 69 Years | 15 (4.5%) | 35 (8.7%) |
| 70 to 74 Years | 11 (3.3%) | 28 (7.0%) |
| 75 to 79 Years | 5 (1.5%) | 8 (2.0%) |
| 80 to 84 Years | 9 (2.7%) | 10 (2.5%) |
| 85 Years and over | 4 (1.2%) | 4 (1.0%) |
| Total | 335 (100.0%) | 402 (100.0%) |
Families and Households in Homecroft
Median Family Size in Homecroft
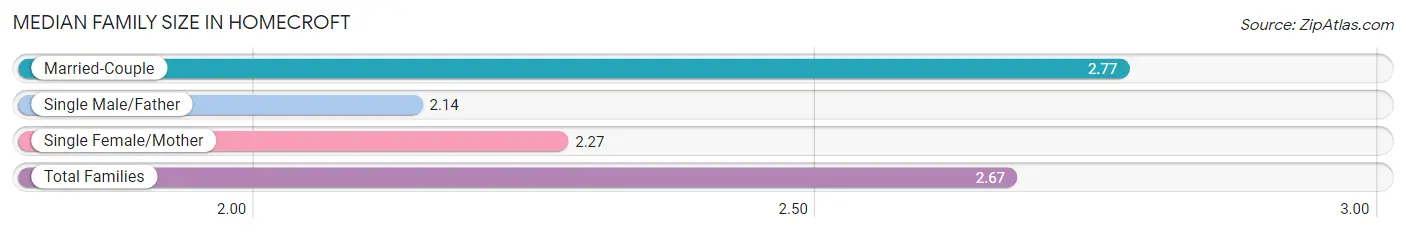
The median family size in Homecroft is 2.67 persons per family, with married-couple families (177 | 80.1%) accounting for the largest median family size of 2.77 persons per family. On the other hand, single male/father families (7 | 3.2%) represent the smallest median family size with 2.14 persons per family.
| Family Type | # Families | Family Size |
| Married-Couple | 177 (80.1%) | 2.77 |
| Single Male/Father | 7 (3.2%) | 2.14 |
| Single Female/Mother | 37 (16.7%) | 2.27 |
| Total Families | 221 (100.0%) | 2.67 |
Median Household Size in Homecroft
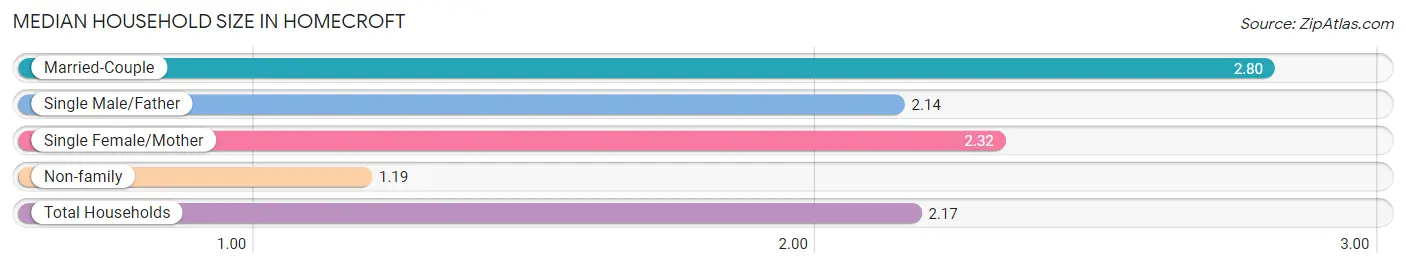
The median household size in Homecroft is 2.17 persons per household, with married-couple households (177 | 52.2%) accounting for the largest median household size of 2.8 persons per household. non-family households (118 | 34.8%) represent the smallest median household size with 1.19 persons per household.
| Household Type | # Households | Household Size |
| Married-Couple | 177 (52.2%) | 2.80 |
| Single Male/Father | 7 (2.1%) | 2.14 |
| Single Female/Mother | 37 (10.9%) | 2.32 |
| Non-family | 118 (34.8%) | 1.19 |
| Total Households | 339 (100.0%) | 2.17 |
Household Size by Marriage Status in Homecroft
Out of a total of 339 households in Homecroft, 221 (65.2%) are family households, while 118 (34.8%) are nonfamily households. The most numerous type of family households are 2-person households, comprising 134, and the most common type of nonfamily households are 1-person households, comprising 99.
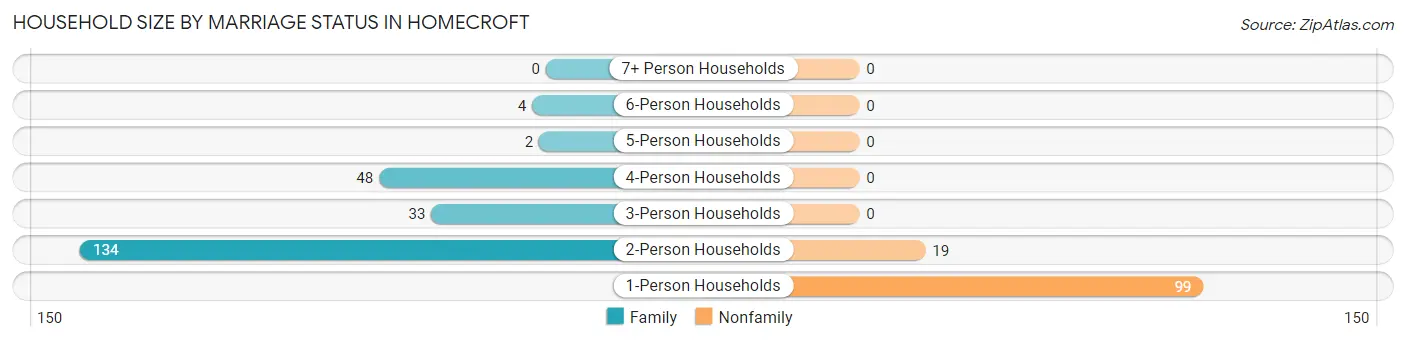
| Household Size | Family Households | Nonfamily Households |
| 1-Person Households | - | 99 (29.2%) |
| 2-Person Households | 134 (39.5%) | 19 (5.6%) |
| 3-Person Households | 33 (9.7%) | 0 (0.0%) |
| 4-Person Households | 48 (14.2%) | 0 (0.0%) |
| 5-Person Households | 2 (0.6%) | 0 (0.0%) |
| 6-Person Households | 4 (1.2%) | 0 (0.0%) |
| 7+ Person Households | 0 (0.0%) | 0 (0.0%) |
| Total | 221 (65.2%) | 118 (34.8%) |
Female Fertility in Homecroft
Fertility by Age in Homecroft
Average fertility rate in Homecroft is 10.0 births per 1,000 women. Women in the age bracket of 20 to 34 years have the highest fertility rate with 34.0 births per 1,000 women. Women in the age bracket of 20 to 34 years acount for 100.0% of all women with births.
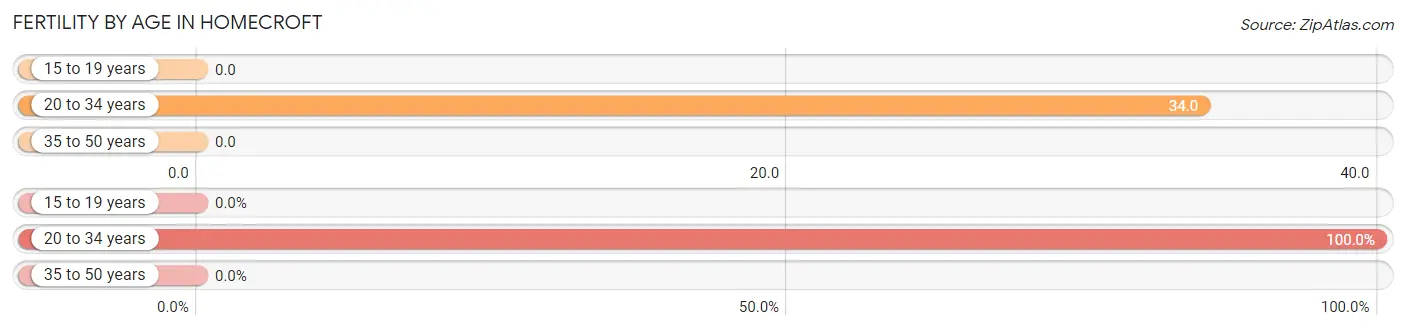
| Age Bracket | Women with Births | Births / 1,000 Women |
| 15 to 19 years | 0 (0.0%) | 0.0 |
| 20 to 34 years | 2 (100.0%) | 34.0 |
| 35 to 50 years | 0 (0.0%) | 0.0 |
| Total | 2 (100.0%) | 10.0 |
Fertility by Age by Marriage Status in Homecroft
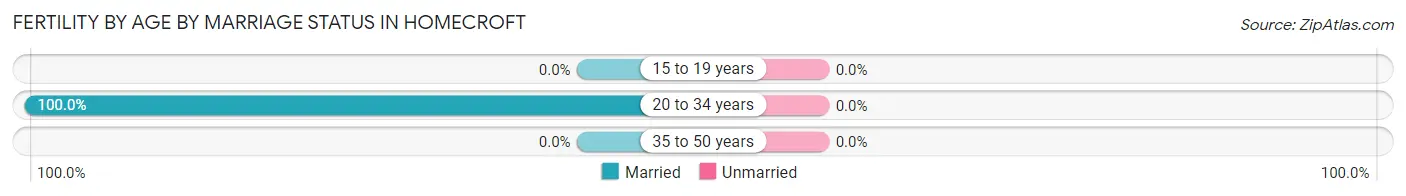
| Age Bracket | Married | Unmarried |
| 15 to 19 years | 0 (0.0%) | 0 (0.0%) |
| 20 to 34 years | 2 (100.0%) | 0 (0.0%) |
| 35 to 50 years | 0 (0.0%) | 0 (0.0%) |
| Total | 2 (100.0%) | 0 (0.0%) |
Fertility by Education in Homecroft
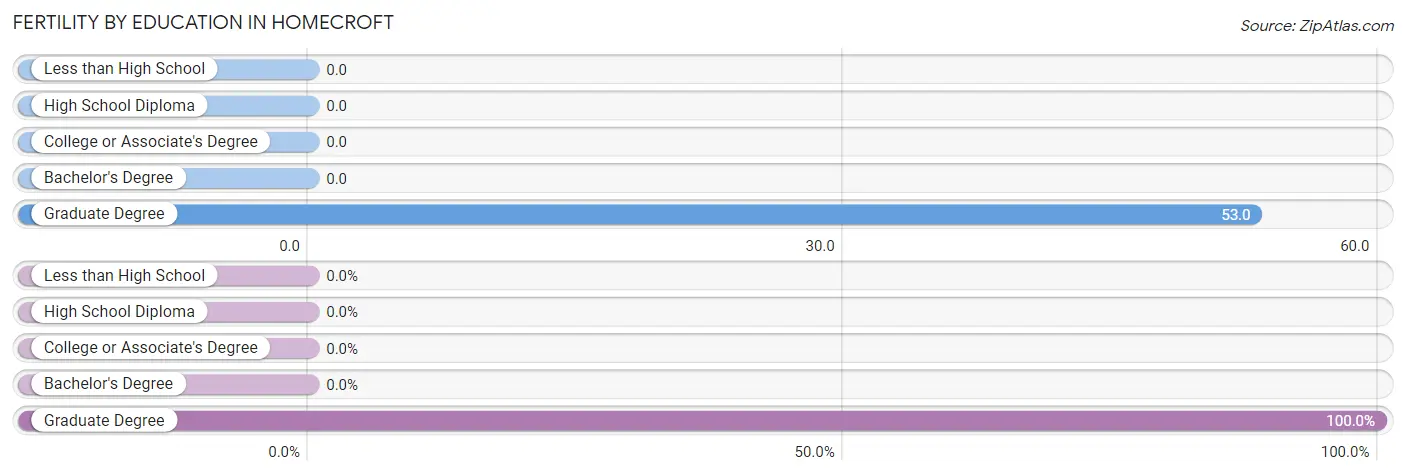
| Educational Attainment | Women with Births | Births / 1,000 Women |
| Less than High School | 0 (0.0%) | 0.0 |
| High School Diploma | 0 (0.0%) | 0.0 |
| College or Associate's Degree | 0 (0.0%) | 0.0 |
| Bachelor's Degree | 0 (0.0%) | 0.0 |
| Graduate Degree | 2 (100.0%) | 53.0 |
| Total | 2 (100.0%) | 10.0 |
Fertility by Education by Marriage Status in Homecroft
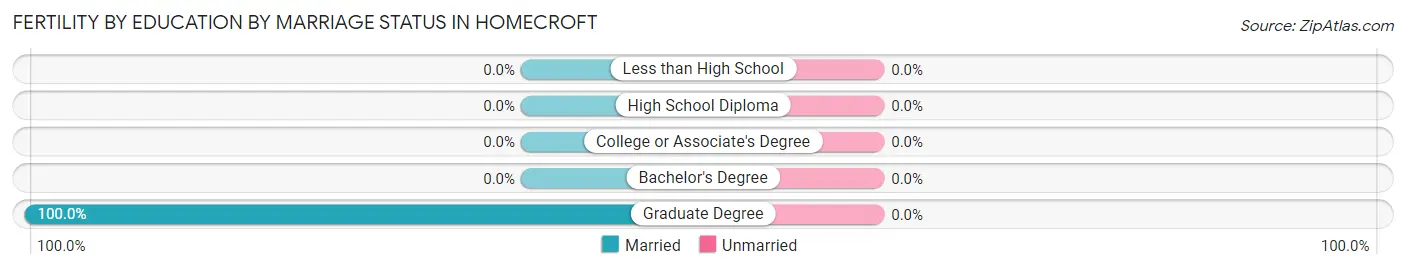
| Educational Attainment | Married | Unmarried |
| Less than High School | 0 (0.0%) | 0 (0.0%) |
| High School Diploma | 0 (0.0%) | 0 (0.0%) |
| College or Associate's Degree | 0 (0.0%) | 0 (0.0%) |
| Bachelor's Degree | 0 (0.0%) | 0 (0.0%) |
| Graduate Degree | 2 (100.0%) | 0 (0.0%) |
| Total | 2 (100.0%) | 0 (0.0%) |
Employment Characteristics in Homecroft
Employment by Class of Employer in Homecroft
Among the 457 employed individuals in Homecroft, private company employees (292 | 63.9%), local government employees (54 | 11.8%), and not-for-profit organizations (52 | 11.4%) make up the most common classes of employment.
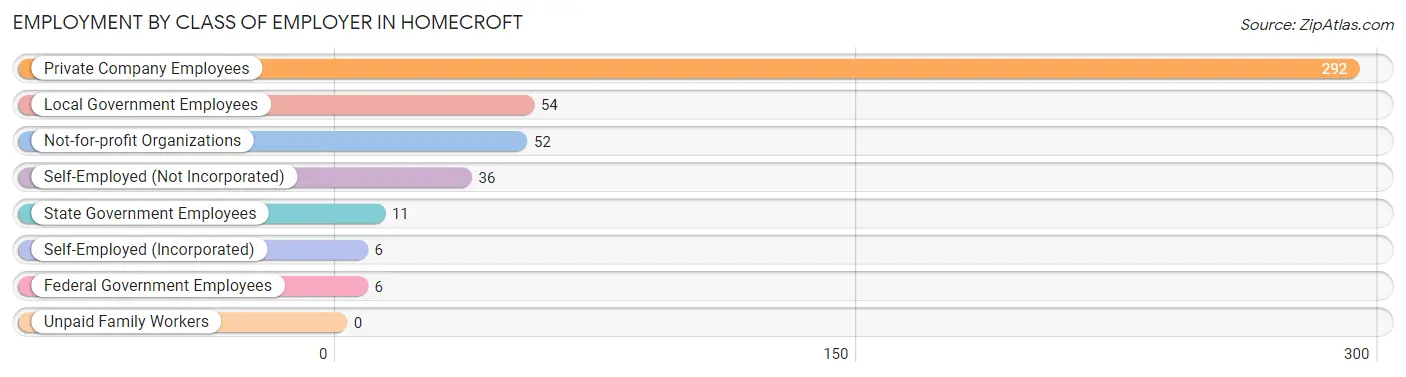
| Employer Class | # Employees | % Employees |
| Private Company Employees | 292 | 63.9% |
| Self-Employed (Incorporated) | 6 | 1.3% |
| Self-Employed (Not Incorporated) | 36 | 7.9% |
| Not-for-profit Organizations | 52 | 11.4% |
| Local Government Employees | 54 | 11.8% |
| State Government Employees | 11 | 2.4% |
| Federal Government Employees | 6 | 1.3% |
| Unpaid Family Workers | 0 | 0.0% |
| Total | 457 | 100.0% |
Employment Status by Age in Homecroft
According to the labor force statistics for Homecroft, out of the total population over 16 years of age (632), 73.4% or 464 individuals are in the labor force, with 0.4% or 2 of them unemployed. The age group with the highest labor force participation rate is 20 to 24 years, with 100.0% or 10 individuals in the labor force. Within the labor force, the 16 to 19 years age range has the highest percentage of unemployed individuals, with 6.3% or 2 of them being unemployed.
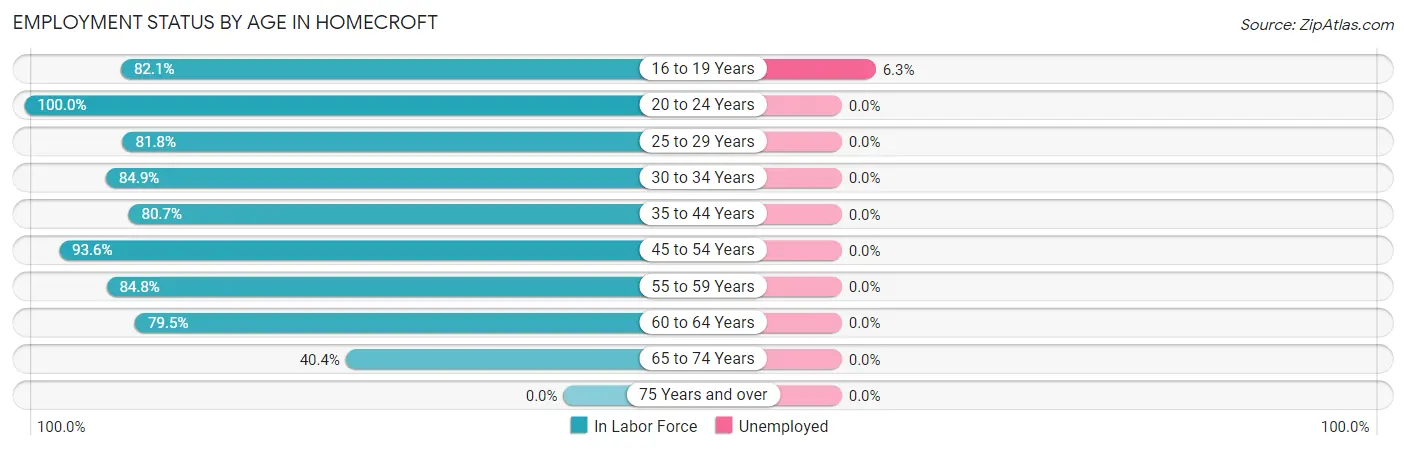
| Age Bracket | In Labor Force | Unemployed |
| 16 to 19 Years | 32 (82.1%) | 2 (6.3%) |
| 20 to 24 Years | 10 (100.0%) | 0 (0.0%) |
| 25 to 29 Years | 18 (81.8%) | 0 (0.0%) |
| 30 to 34 Years | 62 (84.9%) | 0 (0.0%) |
| 35 to 44 Years | 117 (80.7%) | 0 (0.0%) |
| 45 to 54 Years | 102 (93.6%) | 0 (0.0%) |
| 55 to 59 Years | 56 (84.8%) | 0 (0.0%) |
| 60 to 64 Years | 31 (79.5%) | 0 (0.0%) |
| 65 to 74 Years | 36 (40.4%) | 0 (0.0%) |
| 75 Years and over | 0 (0.0%) | 0 (0.0%) |
| Total | 464 (73.4%) | 2 (0.4%) |
Employment Status by Educational Attainment in Homecroft
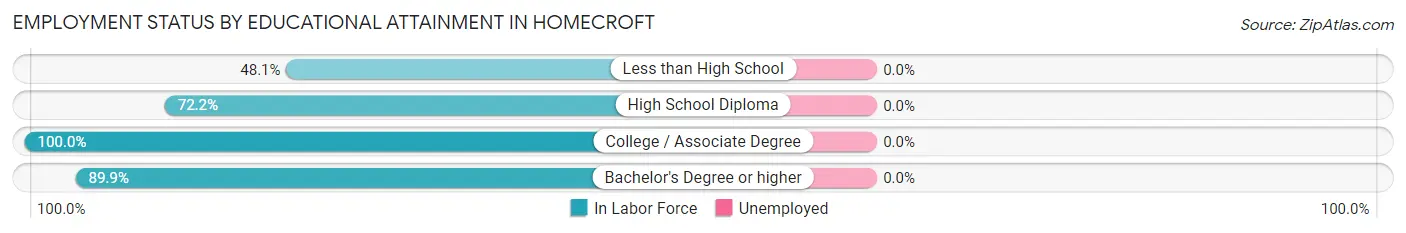
| Educational Attainment | In Labor Force | Unemployed |
| Less than High School | 13 (48.1%) | 0 (0.0%) |
| High School Diploma | 78 (72.2%) | 0 (0.0%) |
| College / Associate Degree | 82 (100.0%) | 0 (0.0%) |
| Bachelor's Degree or higher | 213 (89.9%) | 0 (0.0%) |
| Total | 386 (85.0%) | 0 (0.0%) |
Employment Occupations by Sex in Homecroft
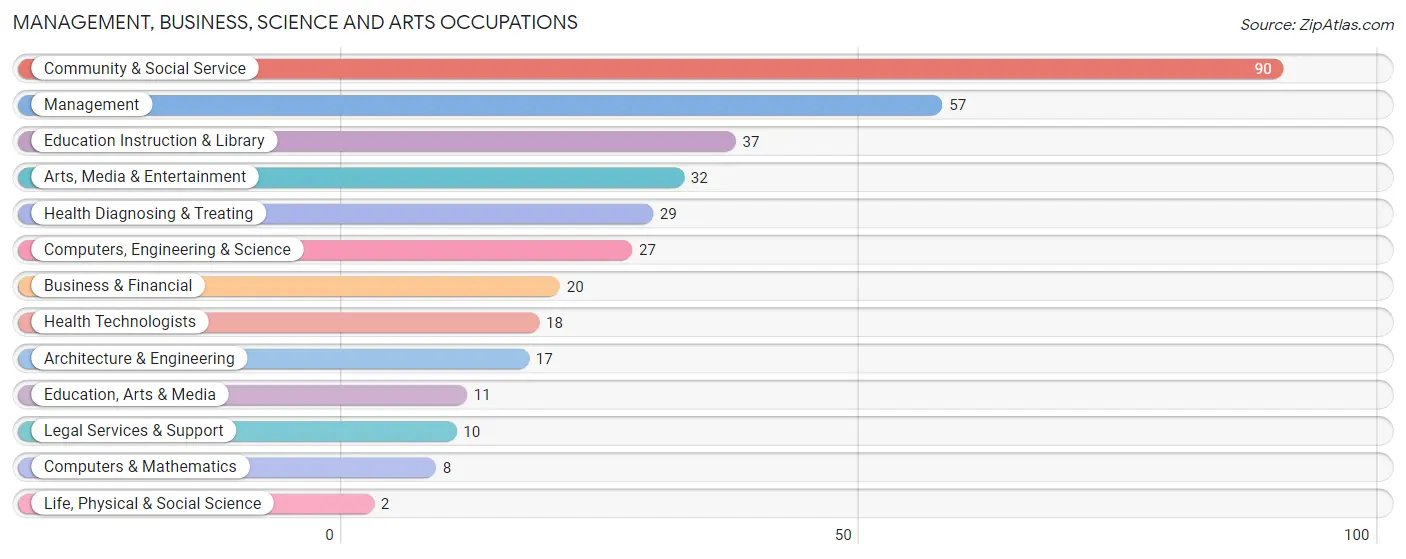
Management, Business, Science and Arts Occupations
The most common Management, Business, Science and Arts occupations in Homecroft are Community & Social Service (90 | 19.5%), Management (57 | 12.3%), Education Instruction & Library (37 | 8.0%), Arts, Media & Entertainment (32 | 6.9%), and Health Diagnosing & Treating (29 | 6.3%).
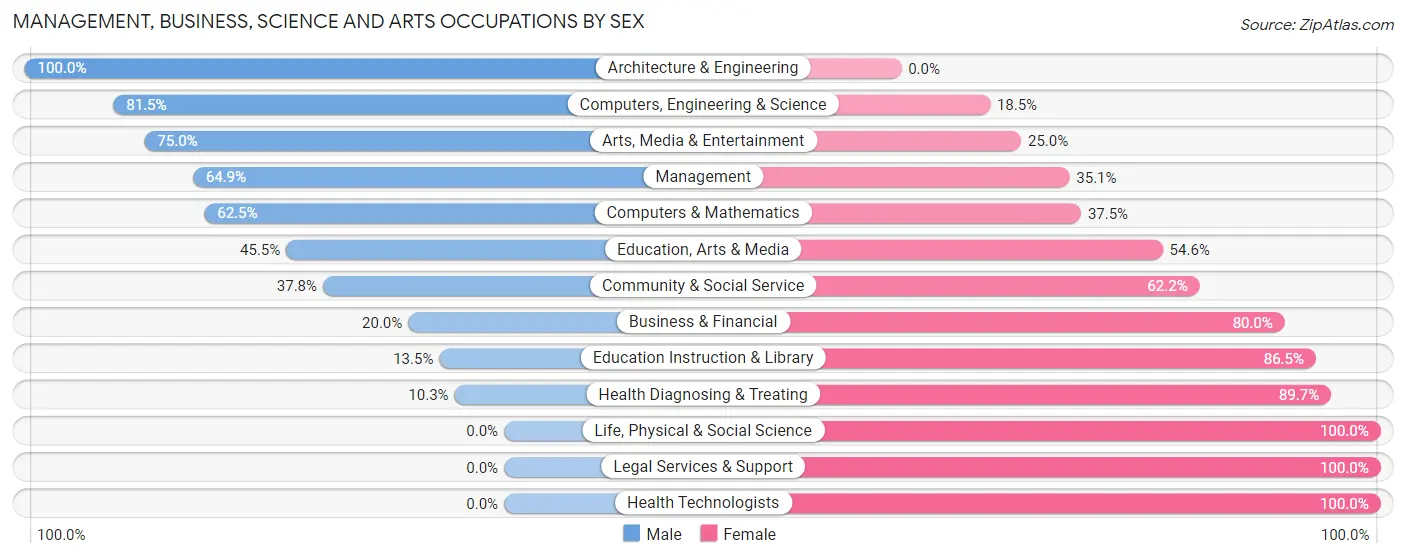
Management, Business, Science and Arts Occupations by Sex
Within the Management, Business, Science and Arts occupations in Homecroft, the most male-oriented occupations are Architecture & Engineering (100.0%), Computers, Engineering & Science (81.5%), and Arts, Media & Entertainment (75.0%), while the most female-oriented occupations are Life, Physical & Social Science (100.0%), Legal Services & Support (100.0%), and Health Technologists (100.0%).
| Occupation | Male | Female |
| Management | 37 (64.9%) | 20 (35.1%) |
| Business & Financial | 4 (20.0%) | 16 (80.0%) |
| Computers, Engineering & Science | 22 (81.5%) | 5 (18.5%) |
| Computers & Mathematics | 5 (62.5%) | 3 (37.5%) |
| Architecture & Engineering | 17 (100.0%) | 0 (0.0%) |
| Life, Physical & Social Science | 0 (0.0%) | 2 (100.0%) |
| Community & Social Service | 34 (37.8%) | 56 (62.2%) |
| Education, Arts & Media | 5 (45.5%) | 6 (54.5%) |
| Legal Services & Support | 0 (0.0%) | 10 (100.0%) |
| Education Instruction & Library | 5 (13.5%) | 32 (86.5%) |
| Arts, Media & Entertainment | 24 (75.0%) | 8 (25.0%) |
| Health Diagnosing & Treating | 3 (10.3%) | 26 (89.7%) |
| Health Technologists | 0 (0.0%) | 18 (100.0%) |
| Total (Category) | 100 (44.8%) | 123 (55.2%) |
| Total (Overall) | 219 (47.4%) | 243 (52.6%) |
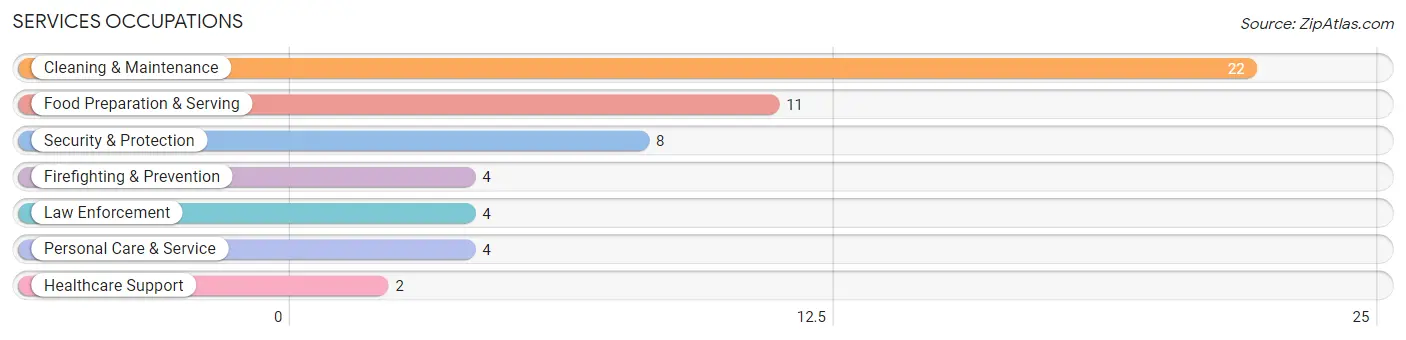
Services Occupations
The most common Services occupations in Homecroft are Cleaning & Maintenance (22 | 4.8%), Food Preparation & Serving (11 | 2.4%), Security & Protection (8 | 1.7%), Firefighting & Prevention (4 | 0.9%), and Law Enforcement (4 | 0.9%).
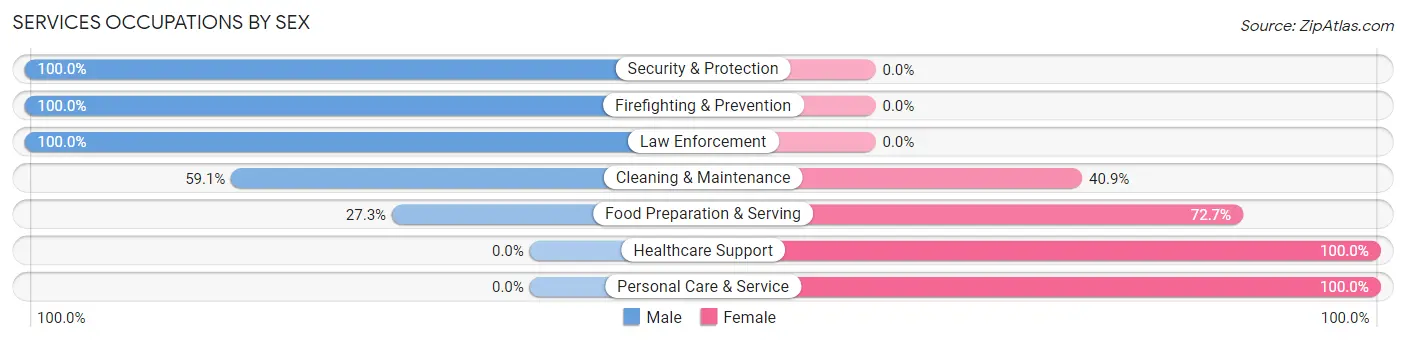
Services Occupations by Sex
Within the Services occupations in Homecroft, the most male-oriented occupations are Security & Protection (100.0%), Firefighting & Prevention (100.0%), and Law Enforcement (100.0%), while the most female-oriented occupations are Healthcare Support (100.0%), Personal Care & Service (100.0%), and Food Preparation & Serving (72.7%).
| Occupation | Male | Female |
| Healthcare Support | 0 (0.0%) | 2 (100.0%) |
| Security & Protection | 8 (100.0%) | 0 (0.0%) |
| Firefighting & Prevention | 4 (100.0%) | 0 (0.0%) |
| Law Enforcement | 4 (100.0%) | 0 (0.0%) |
| Food Preparation & Serving | 3 (27.3%) | 8 (72.7%) |
| Cleaning & Maintenance | 13 (59.1%) | 9 (40.9%) |
| Personal Care & Service | 0 (0.0%) | 4 (100.0%) |
| Total (Category) | 24 (51.1%) | 23 (48.9%) |
| Total (Overall) | 219 (47.4%) | 243 (52.6%) |
Sales and Office Occupations
The most common Sales and Office occupations in Homecroft are Office & Administration (58 | 12.6%), and Sales & Related (51 | 11.0%).
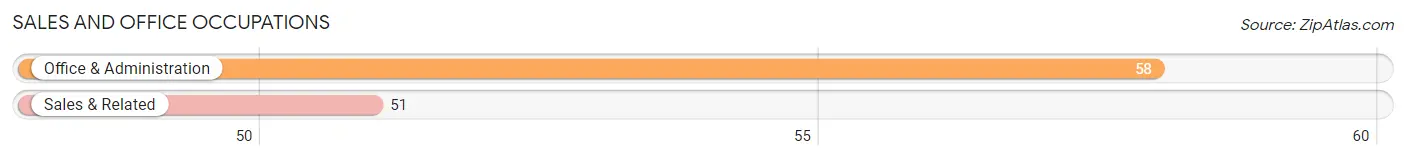
Sales and Office Occupations by Sex
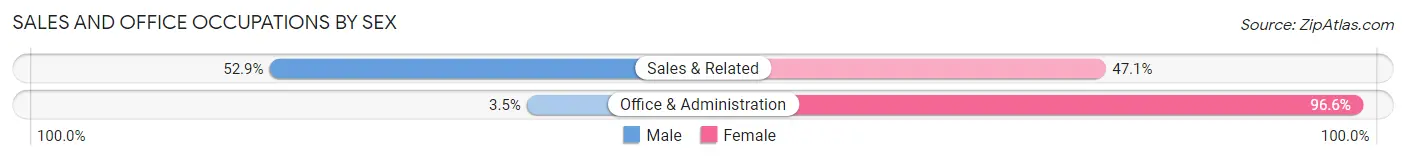
| Occupation | Male | Female |
| Sales & Related | 27 (52.9%) | 24 (47.1%) |
| Office & Administration | 2 (3.5%) | 56 (96.6%) |
| Total (Category) | 29 (26.6%) | 80 (73.4%) |
| Total (Overall) | 219 (47.4%) | 243 (52.6%) |
Natural Resources, Construction and Maintenance Occupations
The most common Natural Resources, Construction and Maintenance occupations in Homecroft are Construction & Extraction (19 | 4.1%), and Installation, Maintenance & Repair (5 | 1.1%).
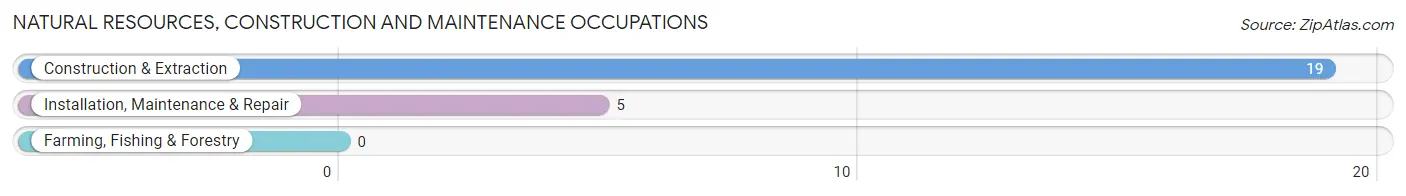
Natural Resources, Construction and Maintenance Occupations by Sex
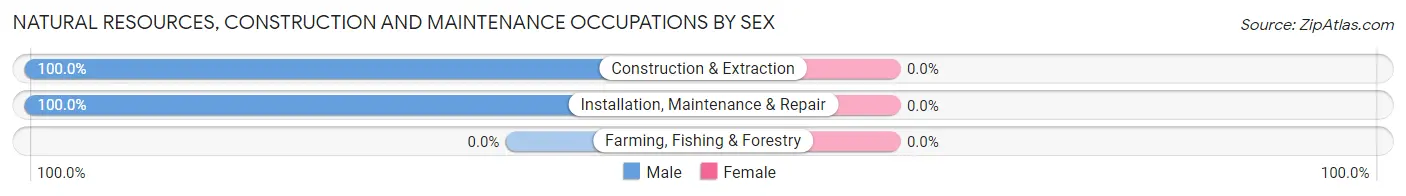
| Occupation | Male | Female |
| Farming, Fishing & Forestry | 0 (0.0%) | 0 (0.0%) |
| Construction & Extraction | 19 (100.0%) | 0 (0.0%) |
| Installation, Maintenance & Repair | 5 (100.0%) | 0 (0.0%) |
| Total (Category) | 24 (100.0%) | 0 (0.0%) |
| Total (Overall) | 219 (47.4%) | 243 (52.6%) |
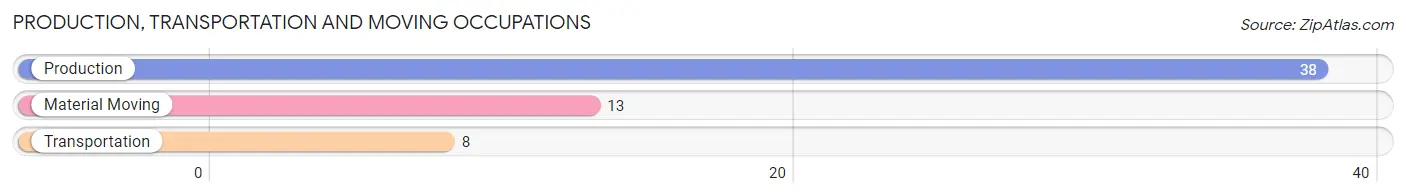
Production, Transportation and Moving Occupations
The most common Production, Transportation and Moving occupations in Homecroft are Production (38 | 8.2%), Material Moving (13 | 2.8%), and Transportation (8 | 1.7%).
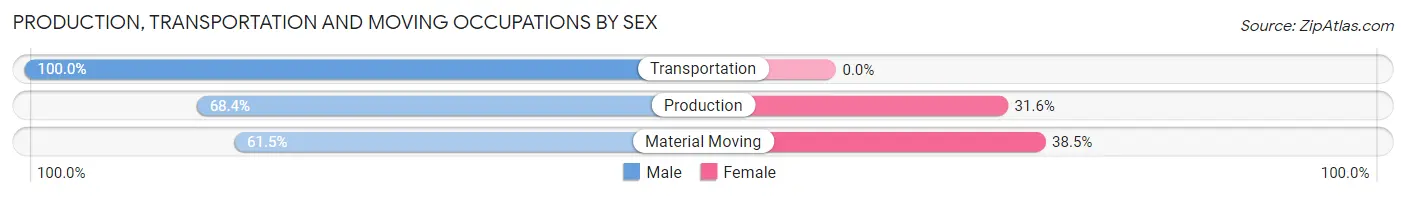
Production, Transportation and Moving Occupations by Sex
| Occupation | Male | Female |
| Production | 26 (68.4%) | 12 (31.6%) |
| Transportation | 8 (100.0%) | 0 (0.0%) |
| Material Moving | 8 (61.5%) | 5 (38.5%) |
| Total (Category) | 42 (71.2%) | 17 (28.8%) |
| Total (Overall) | 219 (47.4%) | 243 (52.6%) |
Employment Industries by Sex in Homecroft
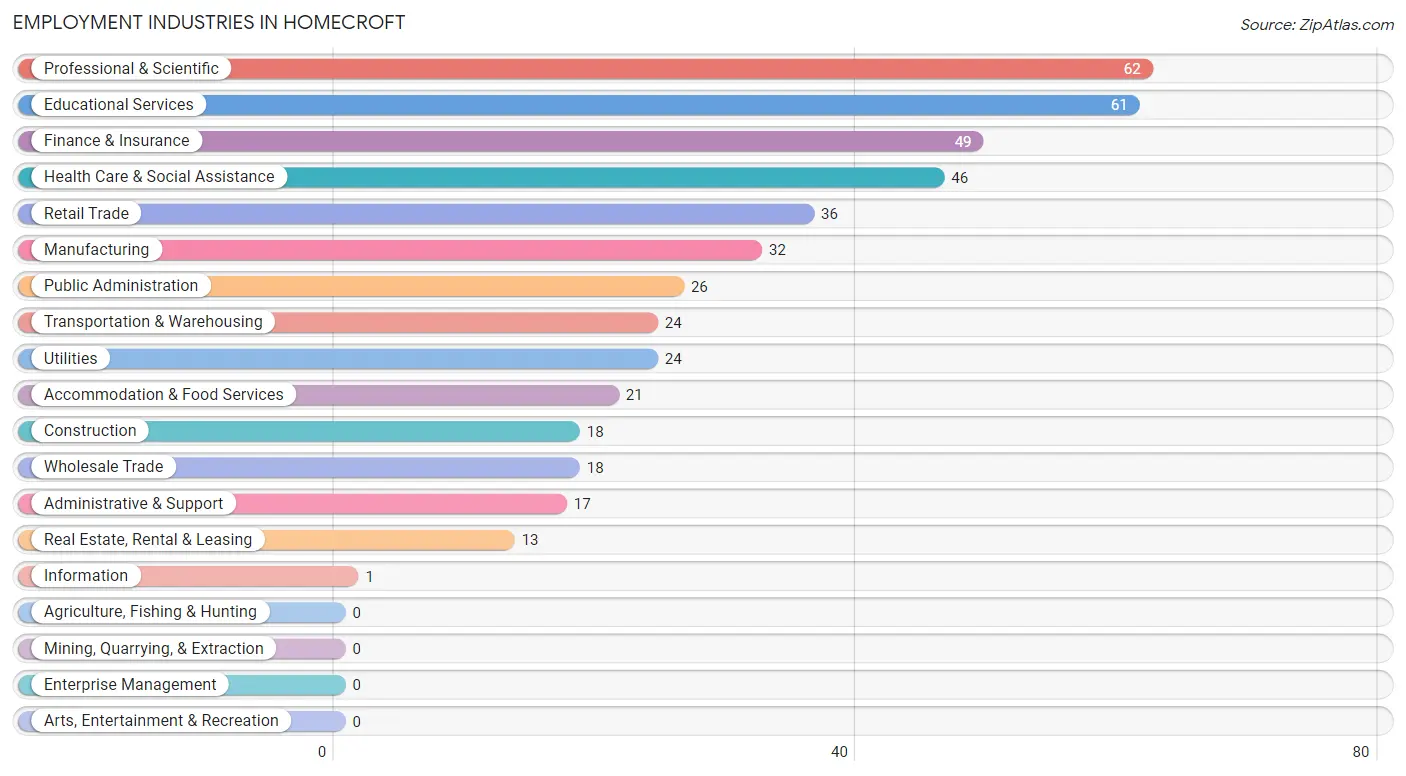
Employment Industries in Homecroft
The major employment industries in Homecroft include Professional & Scientific (62 | 13.4%), Educational Services (61 | 13.2%), Finance & Insurance (49 | 10.6%), Health Care & Social Assistance (46 | 10.0%), and Retail Trade (36 | 7.8%).
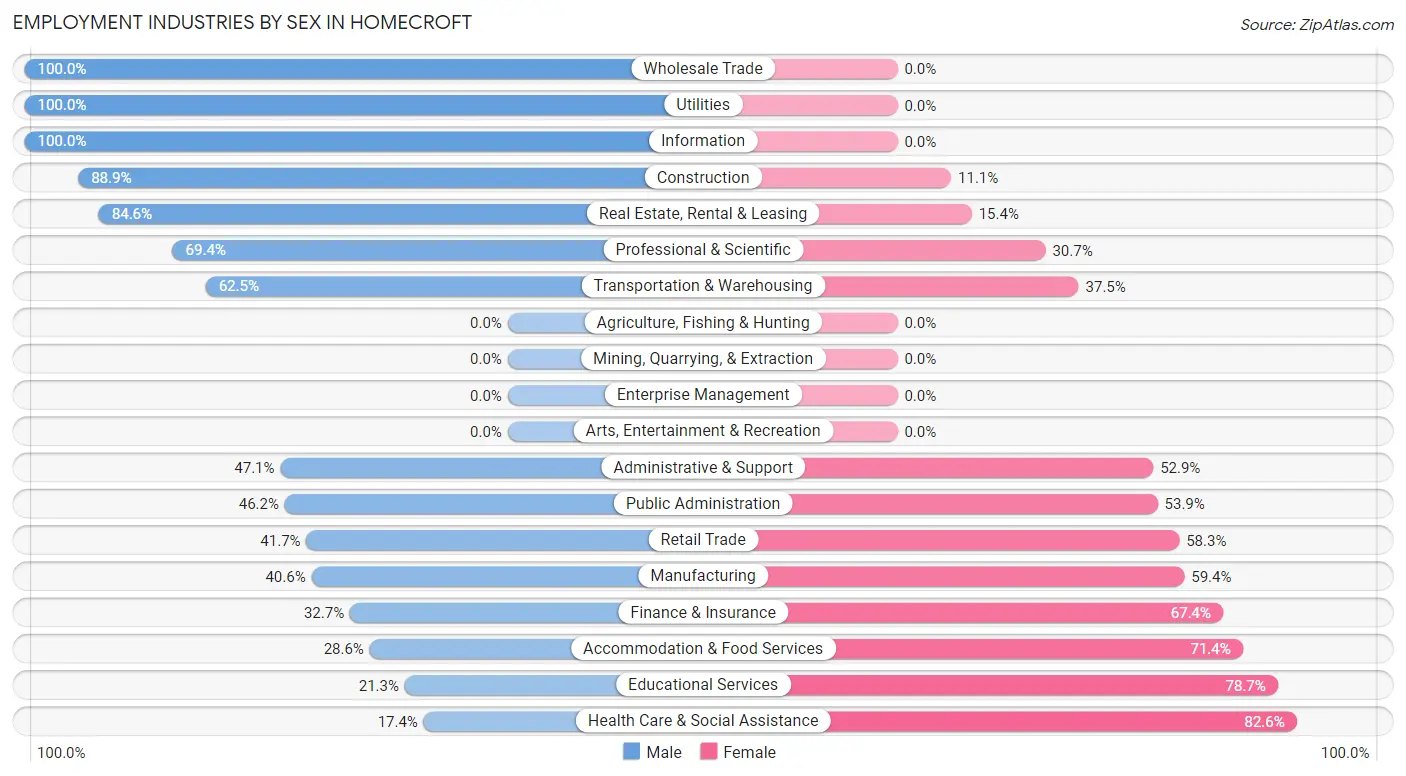
Employment Industries by Sex in Homecroft
The Homecroft industries that see more men than women are Wholesale Trade (100.0%), Utilities (100.0%), and Information (100.0%), whereas the industries that tend to have a higher number of women are Health Care & Social Assistance (82.6%), Educational Services (78.7%), and Accommodation & Food Services (71.4%).
| Industry | Male | Female |
| Agriculture, Fishing & Hunting | 0 (0.0%) | 0 (0.0%) |
| Mining, Quarrying, & Extraction | 0 (0.0%) | 0 (0.0%) |
| Construction | 16 (88.9%) | 2 (11.1%) |
| Manufacturing | 13 (40.6%) | 19 (59.4%) |
| Wholesale Trade | 18 (100.0%) | 0 (0.0%) |
| Retail Trade | 15 (41.7%) | 21 (58.3%) |
| Transportation & Warehousing | 15 (62.5%) | 9 (37.5%) |
| Utilities | 24 (100.0%) | 0 (0.0%) |
| Information | 1 (100.0%) | 0 (0.0%) |
| Finance & Insurance | 16 (32.7%) | 33 (67.3%) |
| Real Estate, Rental & Leasing | 11 (84.6%) | 2 (15.4%) |
| Professional & Scientific | 43 (69.4%) | 19 (30.6%) |
| Enterprise Management | 0 (0.0%) | 0 (0.0%) |
| Administrative & Support | 8 (47.1%) | 9 (52.9%) |
| Educational Services | 13 (21.3%) | 48 (78.7%) |
| Health Care & Social Assistance | 8 (17.4%) | 38 (82.6%) |
| Arts, Entertainment & Recreation | 0 (0.0%) | 0 (0.0%) |
| Accommodation & Food Services | 6 (28.6%) | 15 (71.4%) |
| Public Administration | 12 (46.2%) | 14 (53.8%) |
| Total | 219 (47.4%) | 243 (52.6%) |
Education in Homecroft
School Enrollment in Homecroft
The most common levels of schooling among the 99 students in Homecroft are high school (32 | 32.3%), elementary school (24 | 24.2%), and middle school (20 | 20.2%).
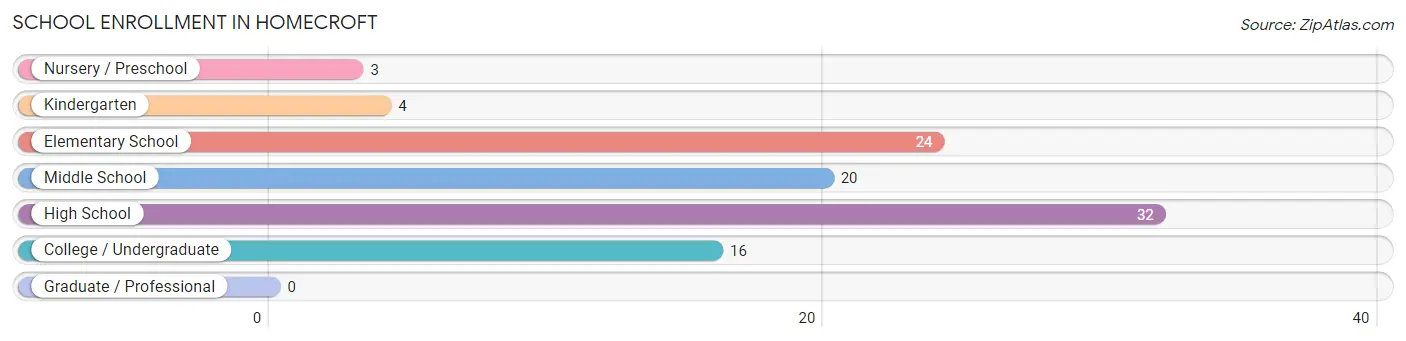
| School Level | # Students | % Students |
| Nursery / Preschool | 3 | 3.0% |
| Kindergarten | 4 | 4.0% |
| Elementary School | 24 | 24.2% |
| Middle School | 20 | 20.2% |
| High School | 32 | 32.3% |
| College / Undergraduate | 16 | 16.2% |
| Graduate / Professional | 0 | 0.0% |
| Total | 99 | 100.0% |
School Enrollment by Age by Funding Source in Homecroft
Out of a total of 99 students who are enrolled in schools in Homecroft, 25 (25.3%) attend a private institution, while the remaining 74 (74.7%) are enrolled in public schools. The age group of 5 to 9 year old has the highest likelihood of being enrolled in private schools, with 13 (54.2% in the age bracket) enrolled. Conversely, the age group of 3 to 4 year olds has the lowest likelihood of being enrolled in a private school, with 3 (100.0% in the age bracket) attending a public institution.
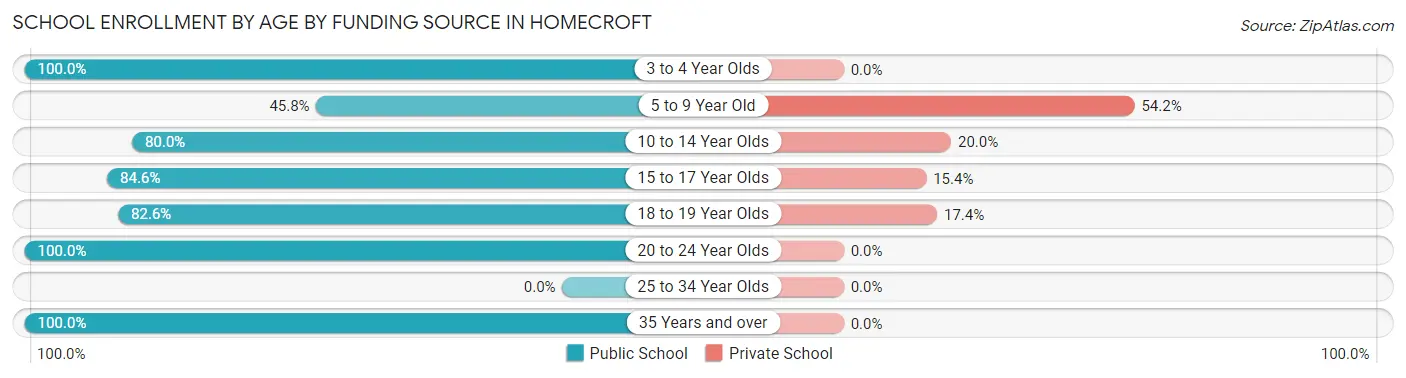
| Age Bracket | Public School | Private School |
| 3 to 4 Year Olds | 3 (100.0%) | 0 (0.0%) |
| 5 to 9 Year Old | 11 (45.8%) | 13 (54.2%) |
| 10 to 14 Year Olds | 24 (80.0%) | 6 (20.0%) |
| 15 to 17 Year Olds | 11 (84.6%) | 2 (15.4%) |
| 18 to 19 Year Olds | 19 (82.6%) | 4 (17.4%) |
| 20 to 24 Year Olds | 3 (100.0%) | 0 (0.0%) |
| 25 to 34 Year Olds | 0 (0.0%) | 0 (0.0%) |
| 35 Years and over | 3 (100.0%) | 0 (0.0%) |
| Total | 74 (74.7%) | 25 (25.3%) |
Educational Attainment by Field of Study in Homecroft
Business (50 | 17.1%), physical & health sciences (37 | 12.6%), education (33 | 11.3%), science & technology (27 | 9.2%), and arts & humanities (26 | 8.9%) are the most common fields of study among 293 individuals in Homecroft who have obtained a bachelor's degree or higher.
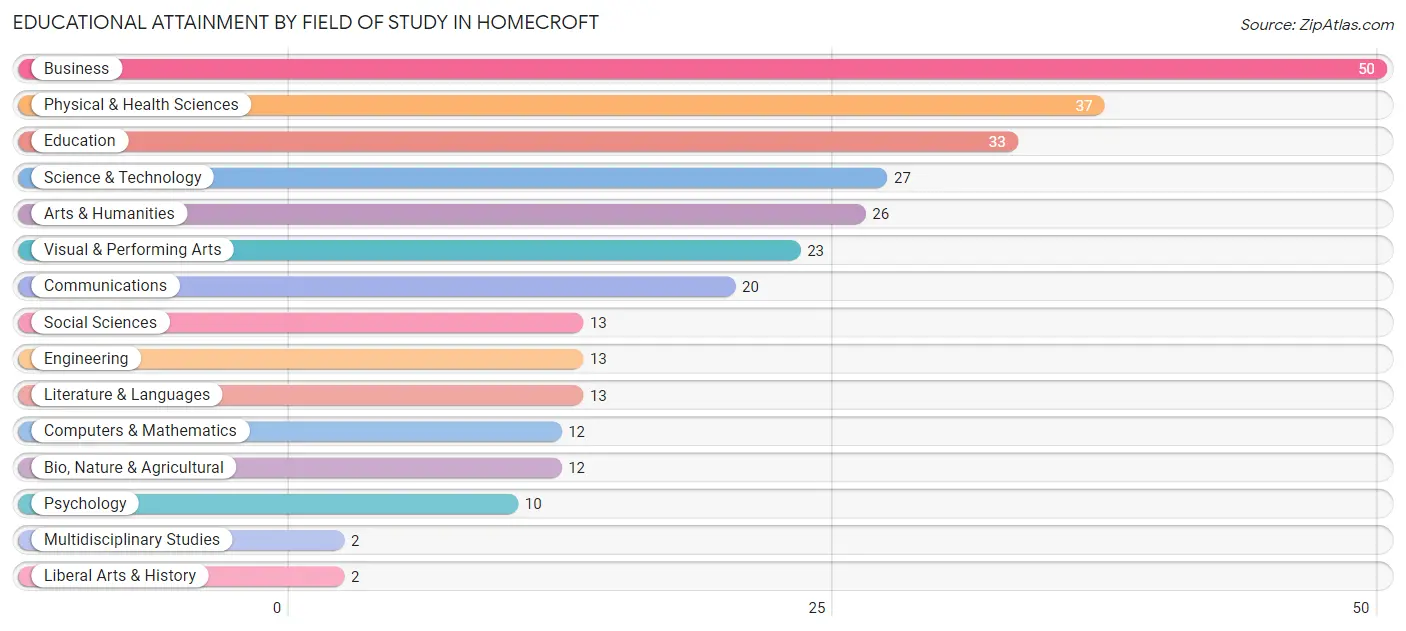
| Field of Study | # Graduates | % Graduates |
| Computers & Mathematics | 12 | 4.1% |
| Bio, Nature & Agricultural | 12 | 4.1% |
| Physical & Health Sciences | 37 | 12.6% |
| Psychology | 10 | 3.4% |
| Social Sciences | 13 | 4.4% |
| Engineering | 13 | 4.4% |
| Multidisciplinary Studies | 2 | 0.7% |
| Science & Technology | 27 | 9.2% |
| Business | 50 | 17.1% |
| Education | 33 | 11.3% |
| Literature & Languages | 13 | 4.4% |
| Liberal Arts & History | 2 | 0.7% |
| Visual & Performing Arts | 23 | 7.9% |
| Communications | 20 | 6.8% |
| Arts & Humanities | 26 | 8.9% |
| Total | 293 | 100.0% |
Transportation & Commute in Homecroft
Vehicle Availability by Sex in Homecroft
The most prevalent vehicle ownership categories in Homecroft are males with 2 vehicles (117, accounting for 53.4%) and females with 2 vehicles (130, making up 49.2%).
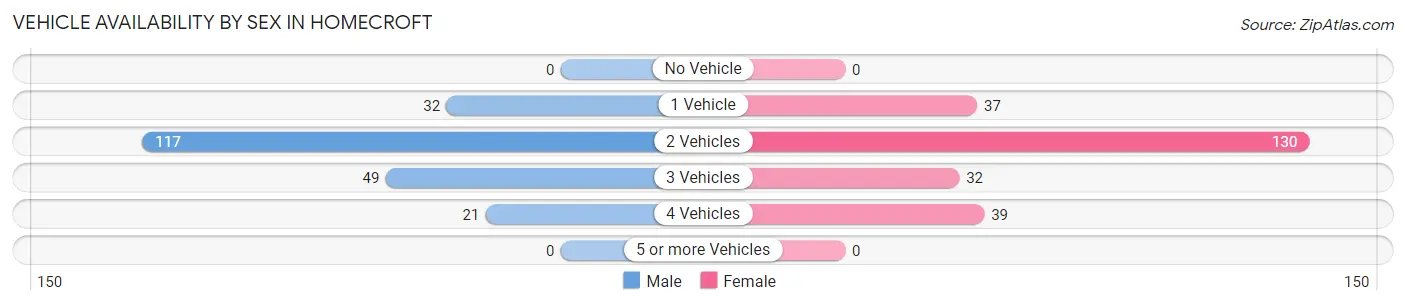
| Vehicles Available | Male | Female |
| No Vehicle | 0 (0.0%) | 0 (0.0%) |
| 1 Vehicle | 32 (14.6%) | 37 (15.5%) |
| 2 Vehicles | 117 (53.4%) | 130 (54.6%) |
| 3 Vehicles | 49 (22.4%) | 32 (13.5%) |
| 4 Vehicles | 21 (9.6%) | 39 (16.4%) |
| 5 or more Vehicles | 0 (0.0%) | 0 (0.0%) |
| Total | 219 (100.0%) | 238 (100.0%) |
Commute Time in Homecroft
The most frequently occuring commute durations in Homecroft are 30 to 34 minutes (79 commuters, 19.3%), 15 to 19 minutes (73 commuters, 17.8%), and 20 to 24 minutes (66 commuters, 16.1%).
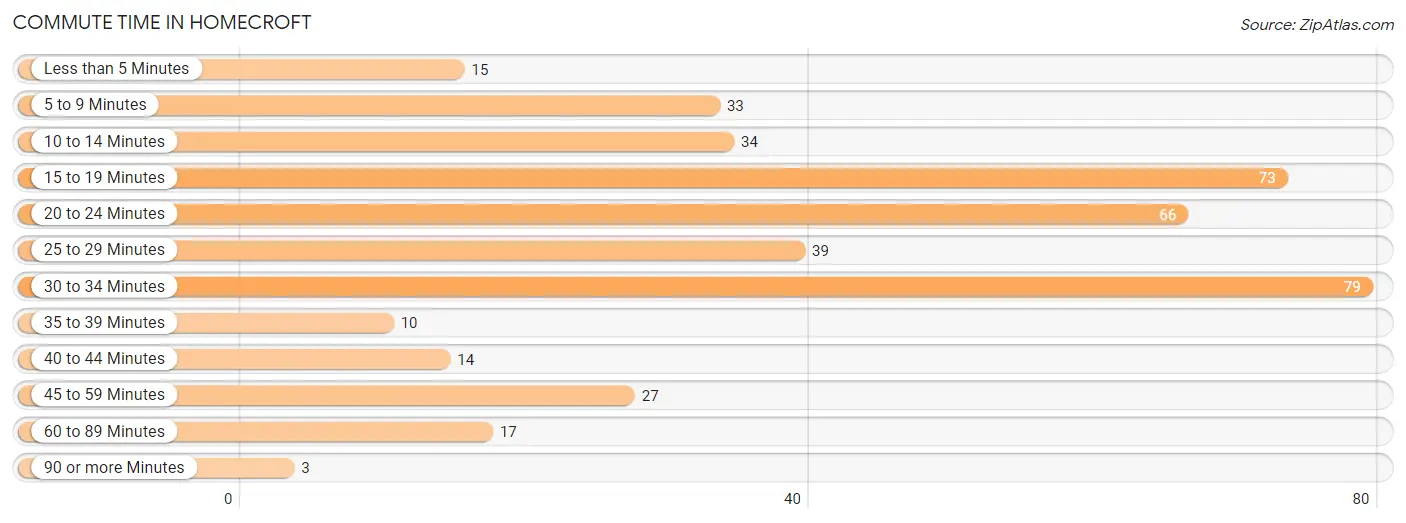
| Commute Time | # Commuters | % Commuters |
| Less than 5 Minutes | 15 | 3.7% |
| 5 to 9 Minutes | 33 | 8.1% |
| 10 to 14 Minutes | 34 | 8.3% |
| 15 to 19 Minutes | 73 | 17.8% |
| 20 to 24 Minutes | 66 | 16.1% |
| 25 to 29 Minutes | 39 | 9.5% |
| 30 to 34 Minutes | 79 | 19.3% |
| 35 to 39 Minutes | 10 | 2.4% |
| 40 to 44 Minutes | 14 | 3.4% |
| 45 to 59 Minutes | 27 | 6.6% |
| 60 to 89 Minutes | 17 | 4.2% |
| 90 or more Minutes | 3 | 0.7% |
Commute Time by Sex in Homecroft
The most common commute times in Homecroft are 30 to 34 minutes (48 commuters, 23.0%) for males and 15 to 19 minutes (51 commuters, 25.4%) for females.
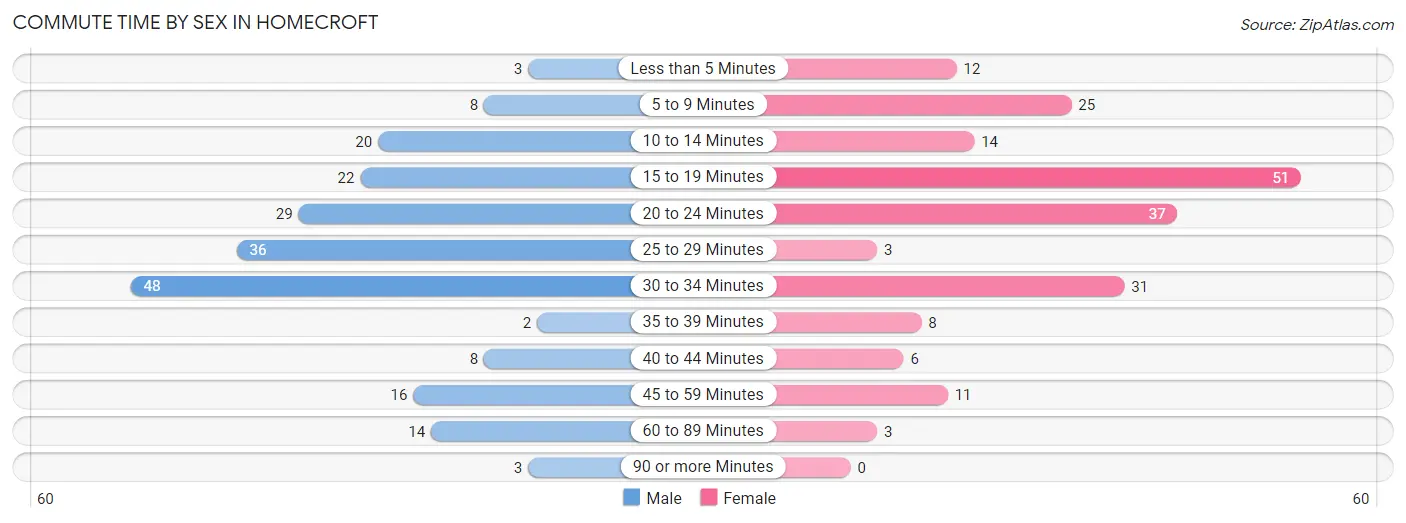
| Commute Time | Male | Female |
| Less than 5 Minutes | 3 (1.4%) | 12 (6.0%) |
| 5 to 9 Minutes | 8 (3.8%) | 25 (12.4%) |
| 10 to 14 Minutes | 20 (9.6%) | 14 (7.0%) |
| 15 to 19 Minutes | 22 (10.5%) | 51 (25.4%) |
| 20 to 24 Minutes | 29 (13.9%) | 37 (18.4%) |
| 25 to 29 Minutes | 36 (17.2%) | 3 (1.5%) |
| 30 to 34 Minutes | 48 (23.0%) | 31 (15.4%) |
| 35 to 39 Minutes | 2 (1.0%) | 8 (4.0%) |
| 40 to 44 Minutes | 8 (3.8%) | 6 (3.0%) |
| 45 to 59 Minutes | 16 (7.7%) | 11 (5.5%) |
| 60 to 89 Minutes | 14 (6.7%) | 3 (1.5%) |
| 90 or more Minutes | 3 (1.4%) | 0 (0.0%) |
Time of Departure to Work by Sex in Homecroft
The most frequent times of departure to work in Homecroft are 7:00 AM to 7:29 AM (41, 19.6%) for males and 8:00 AM to 8:29 AM (46, 22.9%) for females.
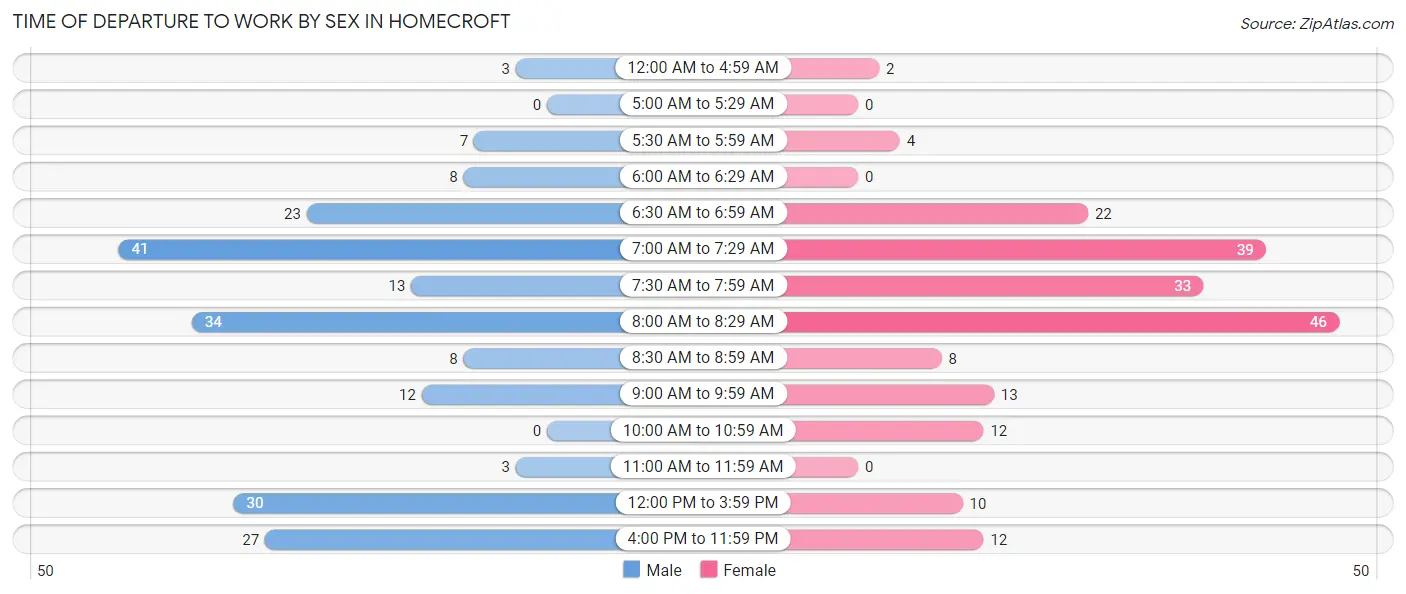
| Time of Departure | Male | Female |
| 12:00 AM to 4:59 AM | 3 (1.4%) | 2 (1.0%) |
| 5:00 AM to 5:29 AM | 0 (0.0%) | 0 (0.0%) |
| 5:30 AM to 5:59 AM | 7 (3.4%) | 4 (2.0%) |
| 6:00 AM to 6:29 AM | 8 (3.8%) | 0 (0.0%) |
| 6:30 AM to 6:59 AM | 23 (11.0%) | 22 (11.0%) |
| 7:00 AM to 7:29 AM | 41 (19.6%) | 39 (19.4%) |
| 7:30 AM to 7:59 AM | 13 (6.2%) | 33 (16.4%) |
| 8:00 AM to 8:29 AM | 34 (16.3%) | 46 (22.9%) |
| 8:30 AM to 8:59 AM | 8 (3.8%) | 8 (4.0%) |
| 9:00 AM to 9:59 AM | 12 (5.7%) | 13 (6.5%) |
| 10:00 AM to 10:59 AM | 0 (0.0%) | 12 (6.0%) |
| 11:00 AM to 11:59 AM | 3 (1.4%) | 0 (0.0%) |
| 12:00 PM to 3:59 PM | 30 (14.3%) | 10 (5.0%) |
| 4:00 PM to 11:59 PM | 27 (12.9%) | 12 (6.0%) |
| Total | 209 (100.0%) | 201 (100.0%) |
Housing Occupancy in Homecroft
Occupancy by Ownership in Homecroft
Of the total 339 dwellings in Homecroft, owner-occupied units account for 308 (90.9%), while renter-occupied units make up 31 (9.1%).
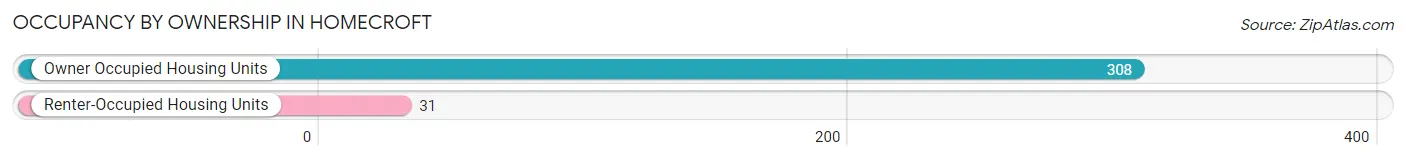
| Occupancy | # Housing Units | % Housing Units |
| Owner Occupied Housing Units | 308 | 90.9% |
| Renter-Occupied Housing Units | 31 | 9.1% |
| Total Occupied Housing Units | 339 | 100.0% |
Occupancy by Household Size in Homecroft
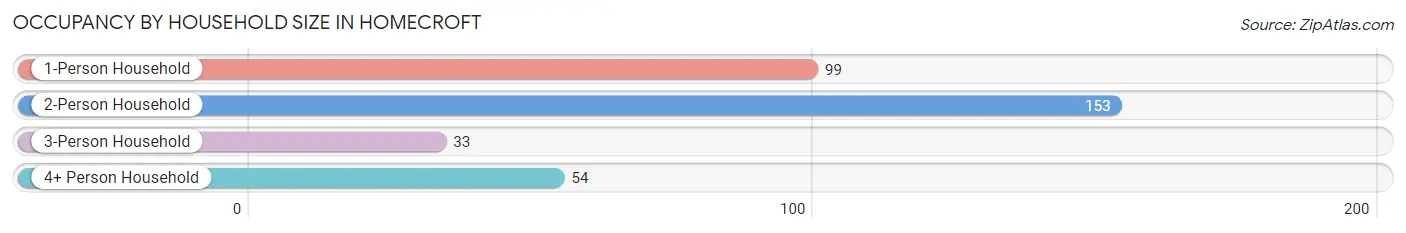
| Household Size | # Housing Units | % Housing Units |
| 1-Person Household | 99 | 29.2% |
| 2-Person Household | 153 | 45.1% |
| 3-Person Household | 33 | 9.7% |
| 4+ Person Household | 54 | 15.9% |
| Total Housing Units | 339 | 100.0% |
Occupancy by Ownership by Household Size in Homecroft
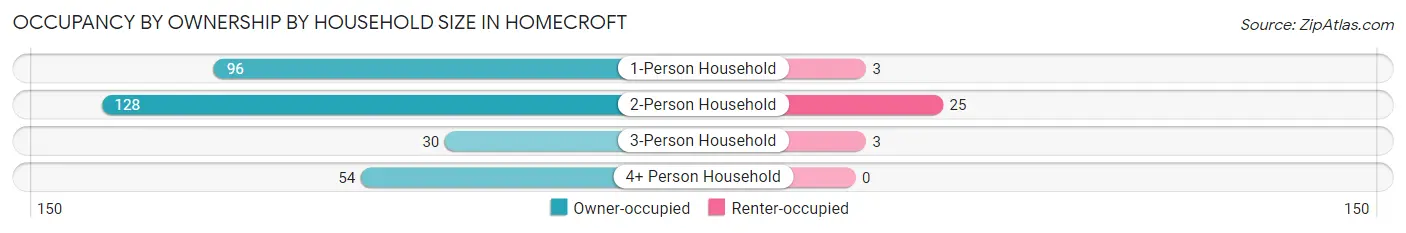
| Household Size | Owner-occupied | Renter-occupied |
| 1-Person Household | 96 (97.0%) | 3 (3.0%) |
| 2-Person Household | 128 (83.7%) | 25 (16.3%) |
| 3-Person Household | 30 (90.9%) | 3 (9.1%) |
| 4+ Person Household | 54 (100.0%) | 0 (0.0%) |
| Total Housing Units | 308 (90.9%) | 31 (9.1%) |
Occupancy by Educational Attainment in Homecroft
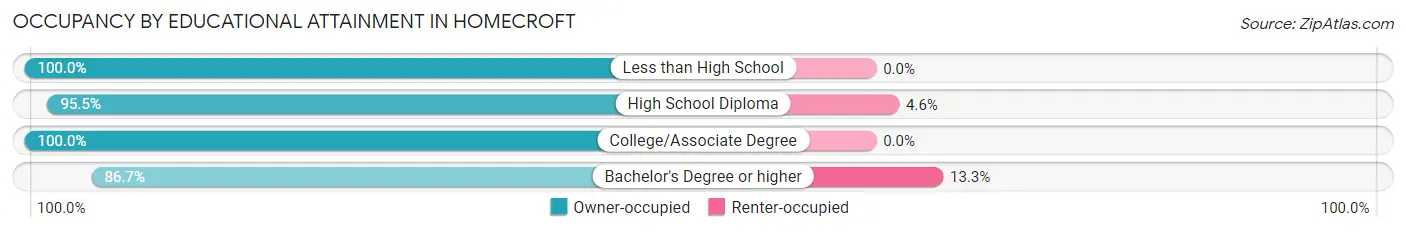
| Household Size | Owner-occupied | Renter-occupied |
| Less than High School | 4 (100.0%) | 0 (0.0%) |
| High School Diploma | 63 (95.5%) | 3 (4.5%) |
| College/Associate Degree | 58 (100.0%) | 0 (0.0%) |
| Bachelor's Degree or higher | 183 (86.7%) | 28 (13.3%) |
Occupancy by Age of Householder in Homecroft
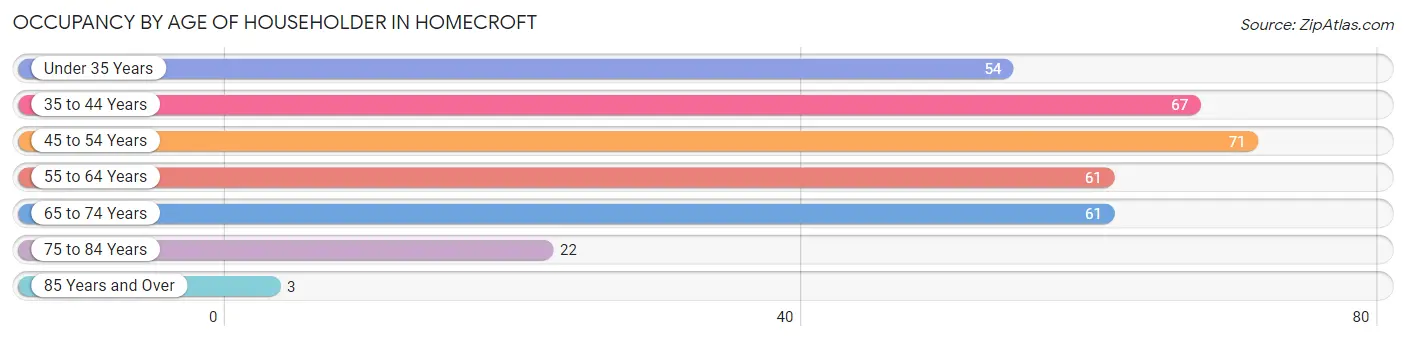
| Age Bracket | # Households | % Households |
| Under 35 Years | 54 | 15.9% |
| 35 to 44 Years | 67 | 19.8% |
| 45 to 54 Years | 71 | 20.9% |
| 55 to 64 Years | 61 | 18.0% |
| 65 to 74 Years | 61 | 18.0% |
| 75 to 84 Years | 22 | 6.5% |
| 85 Years and Over | 3 | 0.9% |
| Total | 339 | 100.0% |
Housing Finances in Homecroft
Median Income by Occupancy in Homecroft
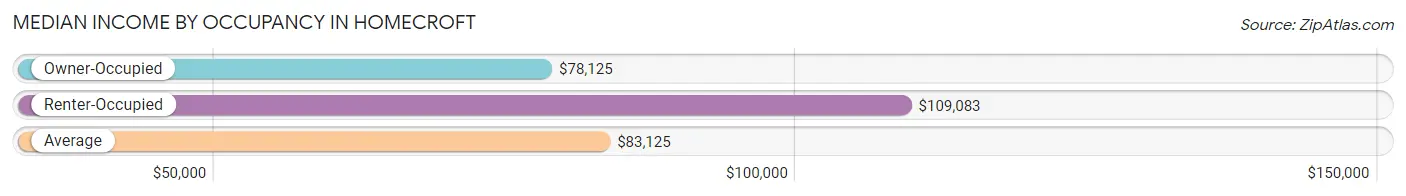
| Occupancy Type | # Households | Median Income |
| Owner-Occupied | 308 (90.9%) | $78,125 |
| Renter-Occupied | 31 (9.1%) | $109,083 |
| Average | 339 (100.0%) | $83,125 |
Occupancy by Householder Income Bracket in Homecroft
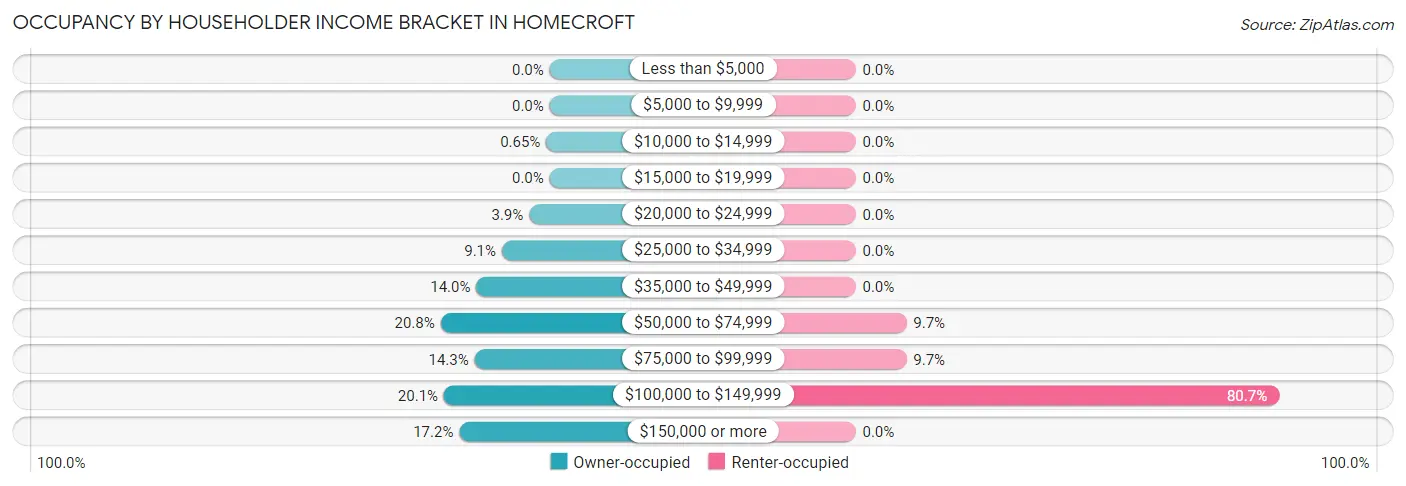
| Income Bracket | Owner-occupied | Renter-occupied |
| Less than $5,000 | 0 (0.0%) | 0 (0.0%) |
| $5,000 to $9,999 | 0 (0.0%) | 0 (0.0%) |
| $10,000 to $14,999 | 2 (0.6%) | 0 (0.0%) |
| $15,000 to $19,999 | 0 (0.0%) | 0 (0.0%) |
| $20,000 to $24,999 | 12 (3.9%) | 0 (0.0%) |
| $25,000 to $34,999 | 28 (9.1%) | 0 (0.0%) |
| $35,000 to $49,999 | 43 (14.0%) | 0 (0.0%) |
| $50,000 to $74,999 | 64 (20.8%) | 3 (9.7%) |
| $75,000 to $99,999 | 44 (14.3%) | 3 (9.7%) |
| $100,000 to $149,999 | 62 (20.1%) | 25 (80.6%) |
| $150,000 or more | 53 (17.2%) | 0 (0.0%) |
| Total | 308 (100.0%) | 31 (100.0%) |
Monthly Housing Cost Tiers in Homecroft
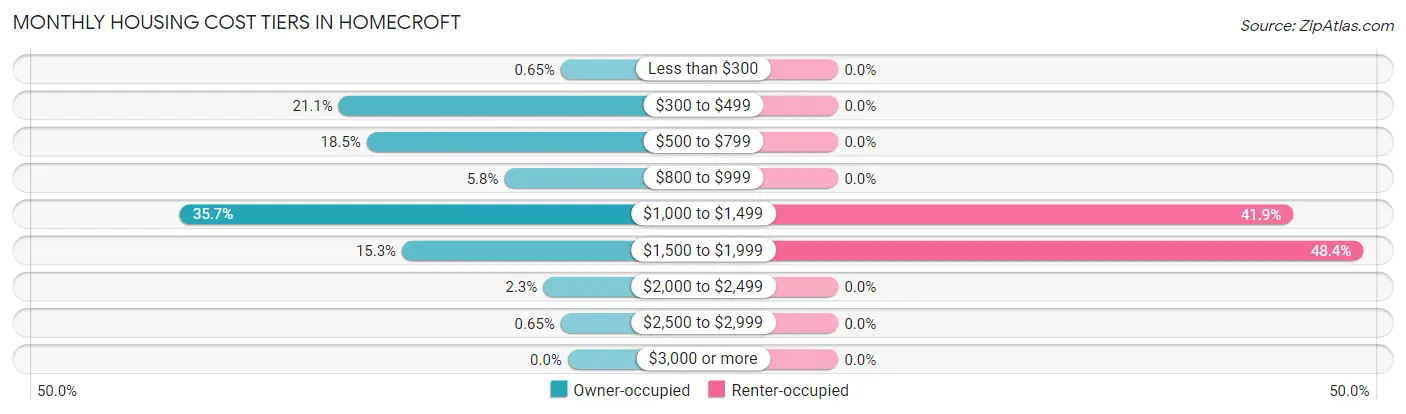
| Monthly Cost | Owner-occupied | Renter-occupied |
| Less than $300 | 2 (0.6%) | 0 (0.0%) |
| $300 to $499 | 65 (21.1%) | 0 (0.0%) |
| $500 to $799 | 57 (18.5%) | 0 (0.0%) |
| $800 to $999 | 18 (5.8%) | 0 (0.0%) |
| $1,000 to $1,499 | 110 (35.7%) | 13 (41.9%) |
| $1,500 to $1,999 | 47 (15.3%) | 15 (48.4%) |
| $2,000 to $2,499 | 7 (2.3%) | 0 (0.0%) |
| $2,500 to $2,999 | 2 (0.6%) | 0 (0.0%) |
| $3,000 or more | 0 (0.0%) | 0 (0.0%) |
| Total | 308 (100.0%) | 31 (100.0%) |
Physical Housing Characteristics in Homecroft
Housing Structures in Homecroft
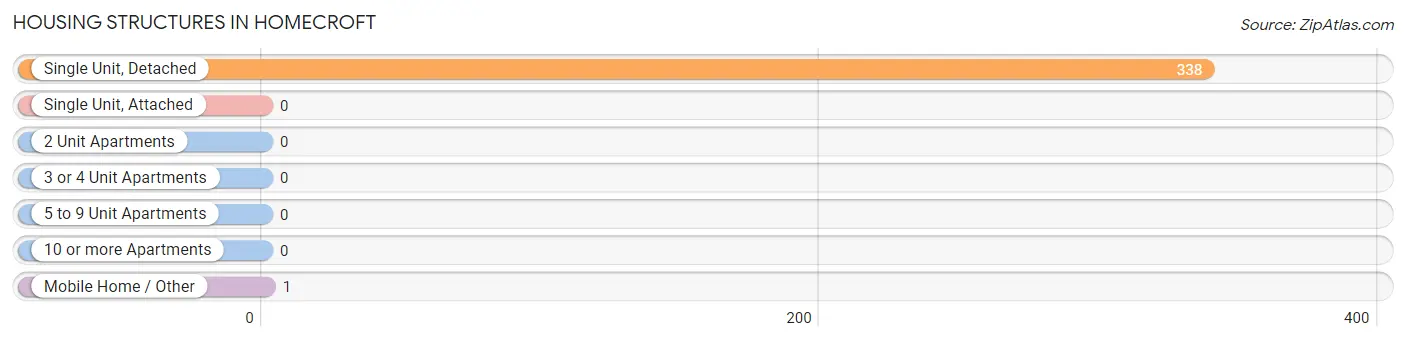
| Structure Type | # Housing Units | % Housing Units |
| Single Unit, Detached | 338 | 99.7% |
| Single Unit, Attached | 0 | 0.0% |
| 2 Unit Apartments | 0 | 0.0% |
| 3 or 4 Unit Apartments | 0 | 0.0% |
| 5 to 9 Unit Apartments | 0 | 0.0% |
| 10 or more Apartments | 0 | 0.0% |
| Mobile Home / Other | 1 | 0.3% |
| Total | 339 | 100.0% |
Housing Structures by Occupancy in Homecroft
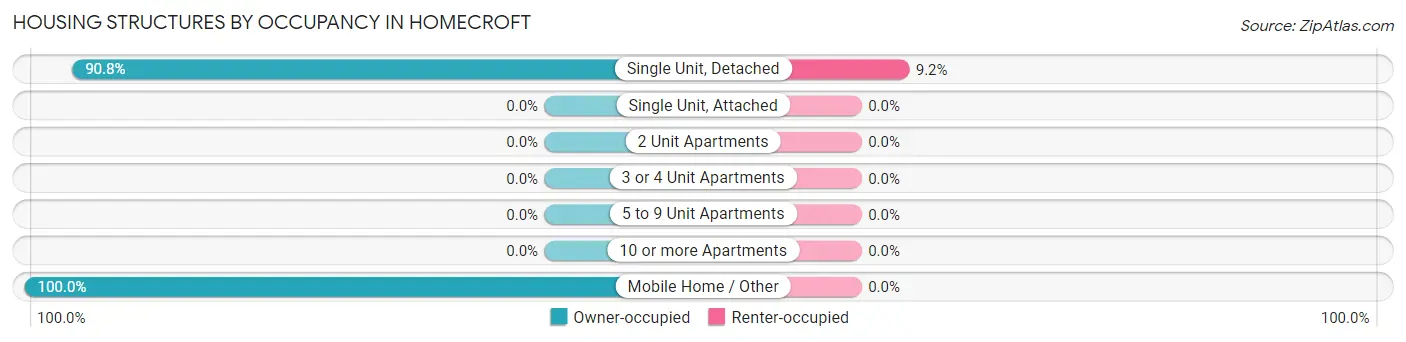
| Structure Type | Owner-occupied | Renter-occupied |
| Single Unit, Detached | 307 (90.8%) | 31 (9.2%) |
| Single Unit, Attached | 0 (0.0%) | 0 (0.0%) |
| 2 Unit Apartments | 0 (0.0%) | 0 (0.0%) |
| 3 or 4 Unit Apartments | 0 (0.0%) | 0 (0.0%) |
| 5 to 9 Unit Apartments | 0 (0.0%) | 0 (0.0%) |
| 10 or more Apartments | 0 (0.0%) | 0 (0.0%) |
| Mobile Home / Other | 1 (100.0%) | 0 (0.0%) |
| Total | 308 (90.9%) | 31 (9.1%) |
Housing Structures by Number of Rooms in Homecroft
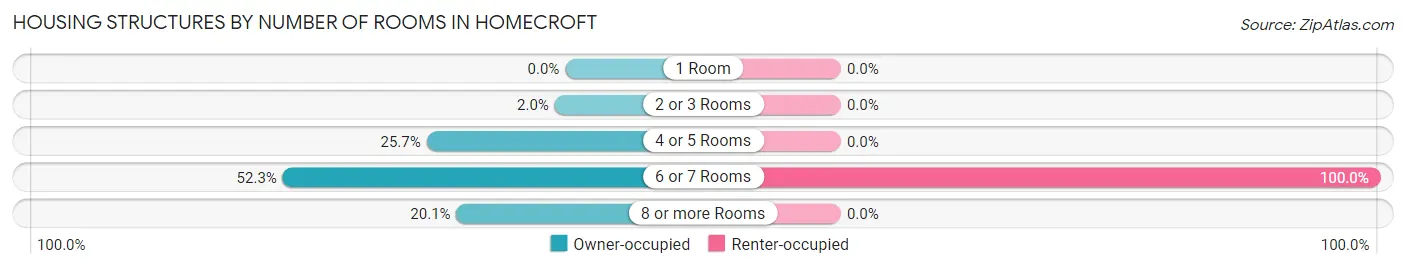
| Number of Rooms | Owner-occupied | Renter-occupied |
| 1 Room | 0 (0.0%) | 0 (0.0%) |
| 2 or 3 Rooms | 6 (1.9%) | 0 (0.0%) |
| 4 or 5 Rooms | 79 (25.7%) | 0 (0.0%) |
| 6 or 7 Rooms | 161 (52.3%) | 31 (100.0%) |
| 8 or more Rooms | 62 (20.1%) | 0 (0.0%) |
| Total | 308 (100.0%) | 31 (100.0%) |
Housing Structure by Heating Type in Homecroft
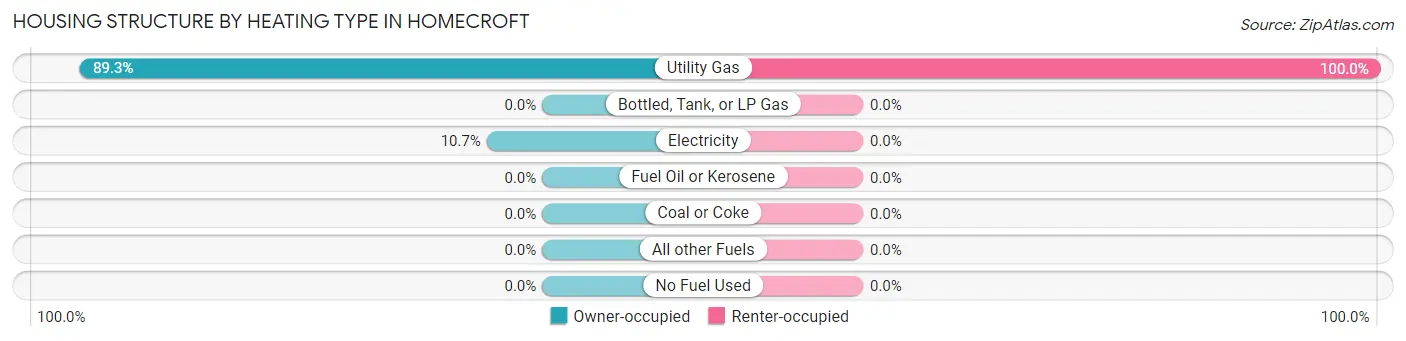
| Heating Type | Owner-occupied | Renter-occupied |
| Utility Gas | 275 (89.3%) | 31 (100.0%) |
| Bottled, Tank, or LP Gas | 0 (0.0%) | 0 (0.0%) |
| Electricity | 33 (10.7%) | 0 (0.0%) |
| Fuel Oil or Kerosene | 0 (0.0%) | 0 (0.0%) |
| Coal or Coke | 0 (0.0%) | 0 (0.0%) |
| All other Fuels | 0 (0.0%) | 0 (0.0%) |
| No Fuel Used | 0 (0.0%) | 0 (0.0%) |
| Total | 308 (100.0%) | 31 (100.0%) |
Household Vehicle Usage in Homecroft
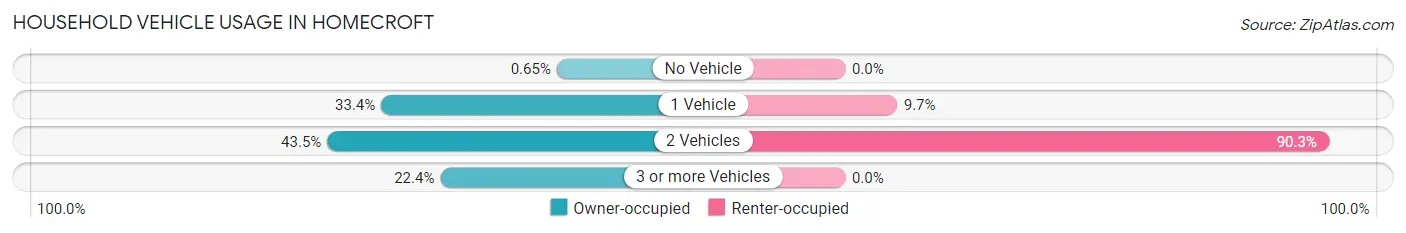
| Vehicles per Household | Owner-occupied | Renter-occupied |
| No Vehicle | 2 (0.6%) | 0 (0.0%) |
| 1 Vehicle | 103 (33.4%) | 3 (9.7%) |
| 2 Vehicles | 134 (43.5%) | 28 (90.3%) |
| 3 or more Vehicles | 69 (22.4%) | 0 (0.0%) |
| Total | 308 (100.0%) | 31 (100.0%) |
Real Estate & Mortgages in Homecroft
Real Estate and Mortgage Overview in Homecroft
| Characteristic | Without Mortgage | With Mortgage |
| Housing Units | 116 | 192 |
| Median Property Value | $157,400 | $191,200 |
| Median Household Income | $49,167 | $39 |
| Monthly Housing Costs | $477 | $0 |
| Real Estate Taxes | $2,100 | $7 |
Property Value by Mortgage Status in Homecroft
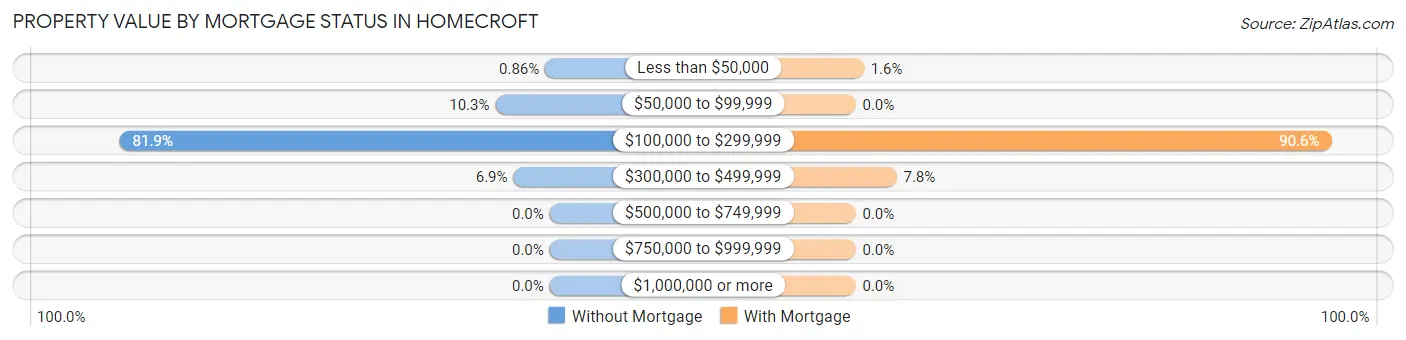
| Property Value | Without Mortgage | With Mortgage |
| Less than $50,000 | 1 (0.9%) | 3 (1.6%) |
| $50,000 to $99,999 | 12 (10.3%) | 0 (0.0%) |
| $100,000 to $299,999 | 95 (81.9%) | 174 (90.6%) |
| $300,000 to $499,999 | 8 (6.9%) | 15 (7.8%) |
| $500,000 to $749,999 | 0 (0.0%) | 0 (0.0%) |
| $750,000 to $999,999 | 0 (0.0%) | 0 (0.0%) |
| $1,000,000 or more | 0 (0.0%) | 0 (0.0%) |
| Total | 116 (100.0%) | 192 (100.0%) |
Household Income by Mortgage Status in Homecroft
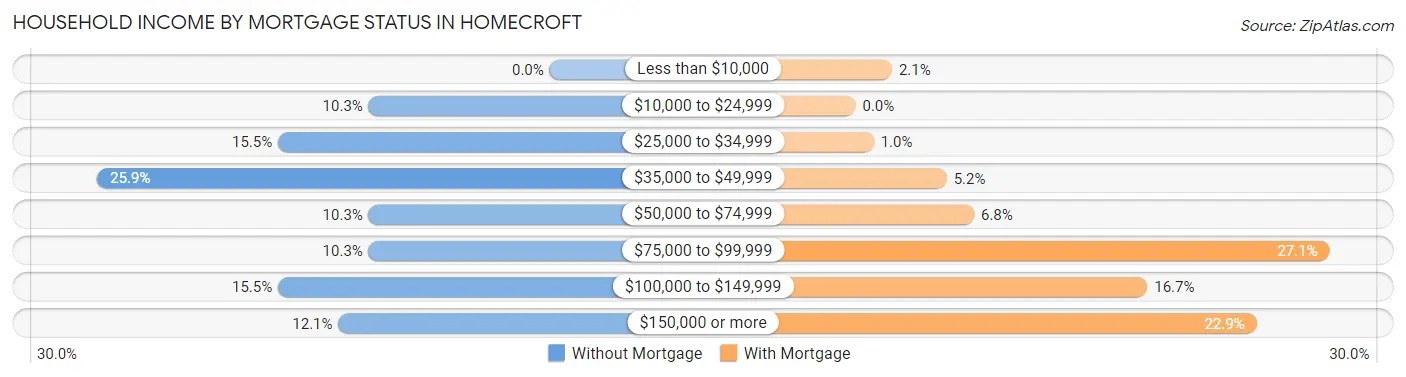
| Household Income | Without Mortgage | With Mortgage |
| Less than $10,000 | 0 (0.0%) | 4 (2.1%) |
| $10,000 to $24,999 | 12 (10.3%) | 0 (0.0%) |
| $25,000 to $34,999 | 18 (15.5%) | 2 (1.0%) |
| $35,000 to $49,999 | 30 (25.9%) | 10 (5.2%) |
| $50,000 to $74,999 | 12 (10.3%) | 13 (6.8%) |
| $75,000 to $99,999 | 12 (10.3%) | 52 (27.1%) |
| $100,000 to $149,999 | 18 (15.5%) | 32 (16.7%) |
| $150,000 or more | 14 (12.1%) | 44 (22.9%) |
| Total | 116 (100.0%) | 192 (100.0%) |
Property Value to Household Income Ratio in Homecroft
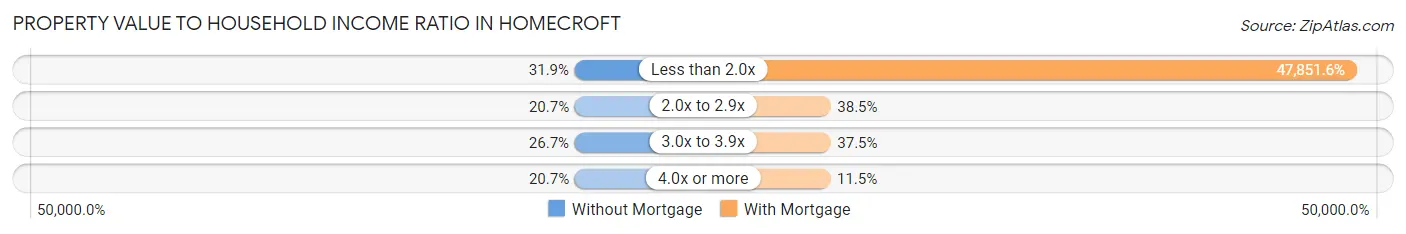
| Value-to-Income Ratio | Without Mortgage | With Mortgage |
| Less than 2.0x | 37 (31.9%) | 91,875 (47,851.6%) |
| 2.0x to 2.9x | 24 (20.7%) | 74 (38.5%) |
| 3.0x to 3.9x | 31 (26.7%) | 72 (37.5%) |
| 4.0x or more | 24 (20.7%) | 22 (11.5%) |
| Total | 116 (100.0%) | 192 (100.0%) |
Real Estate Taxes by Mortgage Status in Homecroft
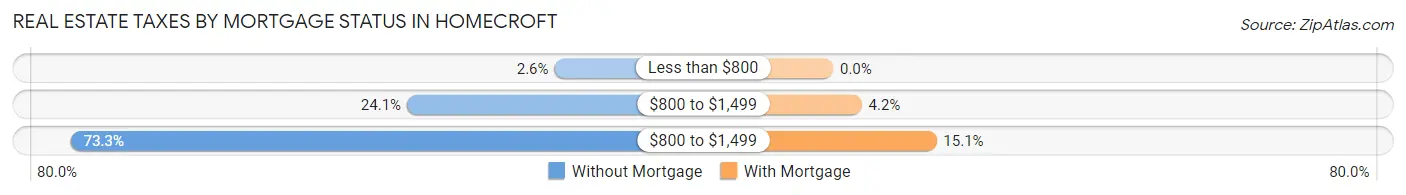
| Property Taxes | Without Mortgage | With Mortgage |
| Less than $800 | 3 (2.6%) | 0 (0.0%) |
| $800 to $1,499 | 28 (24.1%) | 8 (4.2%) |
| $800 to $1,499 | 85 (73.3%) | 29 (15.1%) |
| Total | 116 (100.0%) | 192 (100.0%) |
Health & Disability in Homecroft
Health Insurance Coverage by Age in Homecroft
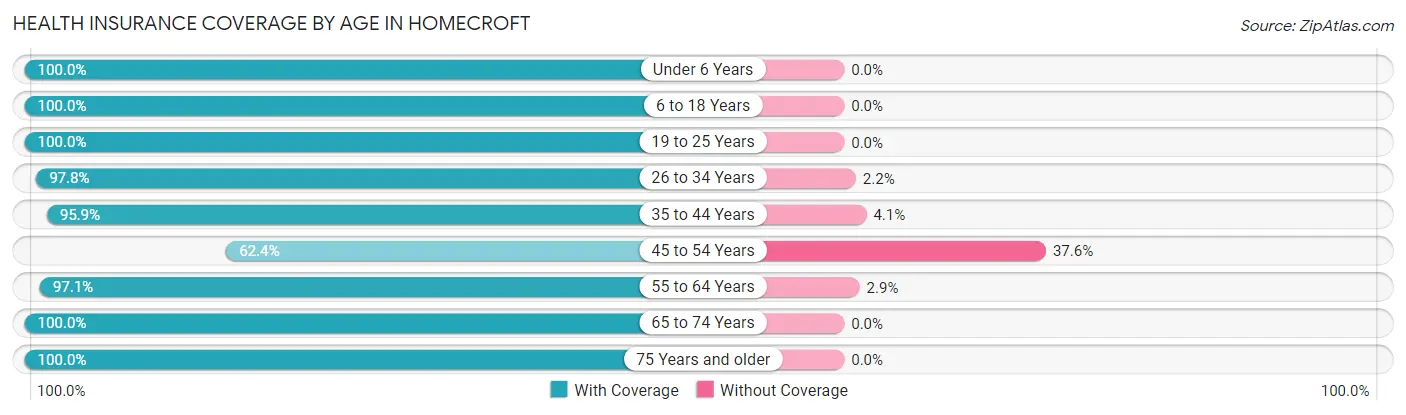
| Age Bracket | With Coverage | Without Coverage |
| Under 6 Years | 49 (100.0%) | 0 (0.0%) |
| 6 to 18 Years | 87 (100.0%) | 0 (0.0%) |
| 19 to 25 Years | 21 (100.0%) | 0 (0.0%) |
| 26 to 34 Years | 90 (97.8%) | 2 (2.2%) |
| 35 to 44 Years | 139 (95.9%) | 6 (4.1%) |
| 45 to 54 Years | 68 (62.4%) | 41 (37.6%) |
| 55 to 64 Years | 102 (97.1%) | 3 (2.9%) |
| 65 to 74 Years | 89 (100.0%) | 0 (0.0%) |
| 75 Years and older | 40 (100.0%) | 0 (0.0%) |
| Total | 685 (92.9%) | 52 (7.1%) |
Health Insurance Coverage by Citizenship Status in Homecroft
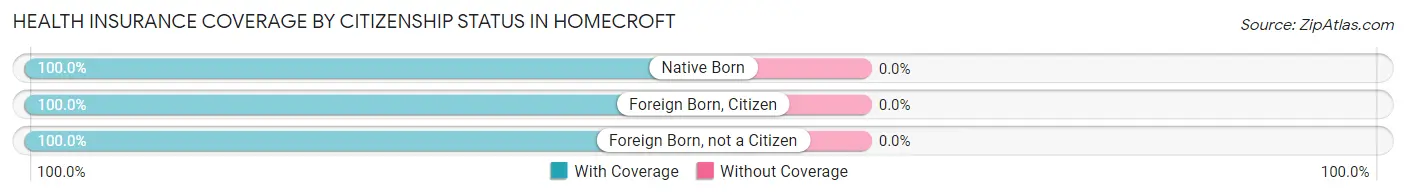
| Citizenship Status | With Coverage | Without Coverage |
| Native Born | 49 (100.0%) | 0 (0.0%) |
| Foreign Born, Citizen | 87 (100.0%) | 0 (0.0%) |
| Foreign Born, not a Citizen | 21 (100.0%) | 0 (0.0%) |
Health Insurance Coverage by Household Income in Homecroft
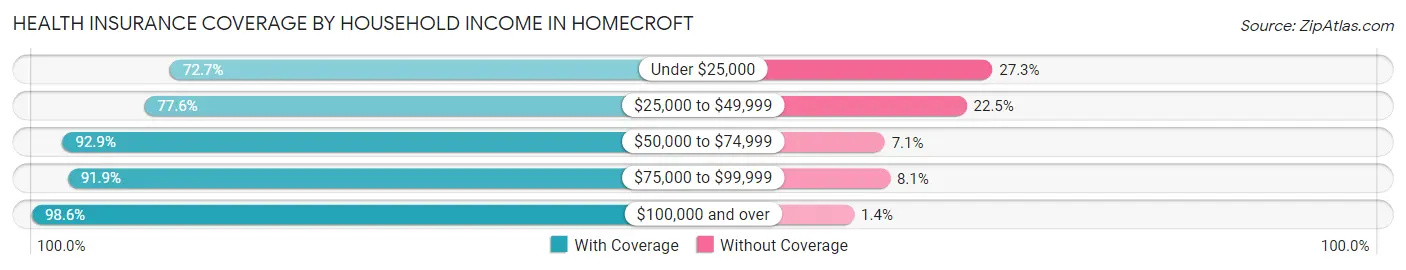
| Household Income | With Coverage | Without Coverage |
| Under $25,000 | 16 (72.7%) | 6 (27.3%) |
| $25,000 to $49,999 | 76 (77.5%) | 22 (22.5%) |
| $50,000 to $74,999 | 144 (92.9%) | 11 (7.1%) |
| $75,000 to $99,999 | 91 (91.9%) | 8 (8.1%) |
| $100,000 and over | 358 (98.6%) | 5 (1.4%) |
Public vs Private Health Insurance Coverage by Age in Homecroft
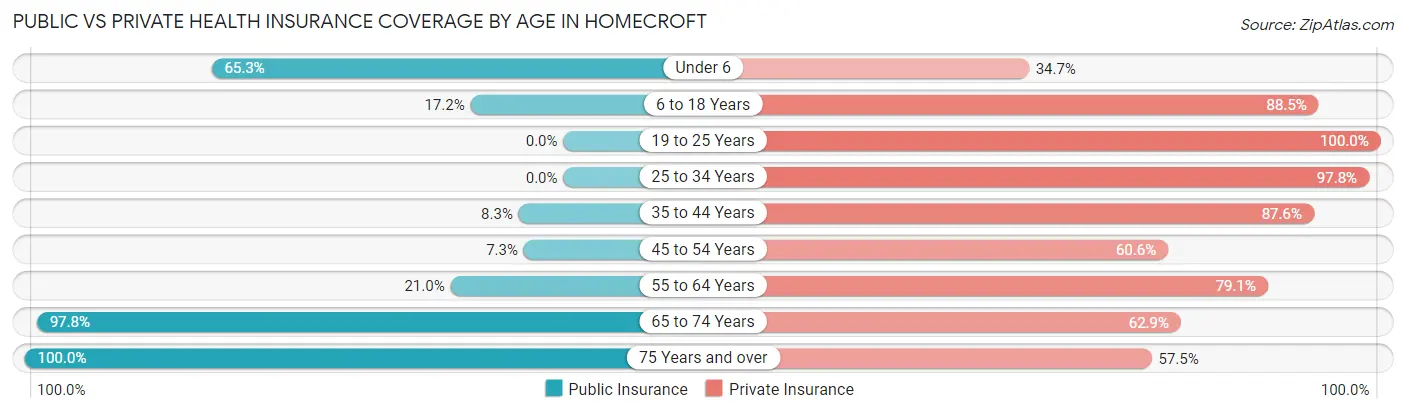
| Age Bracket | Public Insurance | Private Insurance |
| Under 6 | 32 (65.3%) | 17 (34.7%) |
| 6 to 18 Years | 15 (17.2%) | 77 (88.5%) |
| 19 to 25 Years | 0 (0.0%) | 21 (100.0%) |
| 25 to 34 Years | 0 (0.0%) | 90 (97.8%) |
| 35 to 44 Years | 12 (8.3%) | 127 (87.6%) |
| 45 to 54 Years | 8 (7.3%) | 66 (60.6%) |
| 55 to 64 Years | 22 (20.9%) | 83 (79.0%) |
| 65 to 74 Years | 87 (97.8%) | 56 (62.9%) |
| 75 Years and over | 40 (100.0%) | 23 (57.5%) |
| Total | 216 (29.3%) | 560 (76.0%) |
Disability Status by Sex by Age in Homecroft
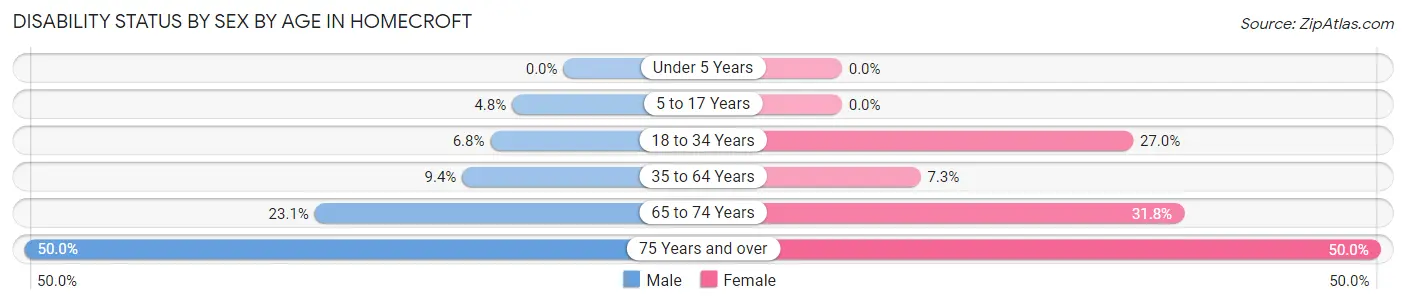
| Age Bracket | Male | Female |
| Under 5 Years | 0 (0.0%) | 0 (0.0%) |
| 5 to 17 Years | 2 (4.8%) | 0 (0.0%) |
| 18 to 34 Years | 4 (6.8%) | 20 (27.0%) |
| 35 to 64 Years | 17 (9.4%) | 13 (7.3%) |
| 65 to 74 Years | 6 (23.1%) | 20 (31.8%) |
| 75 Years and over | 9 (50.0%) | 11 (50.0%) |
Disability Class by Sex by Age in Homecroft
Disability Class: Hearing Difficulty
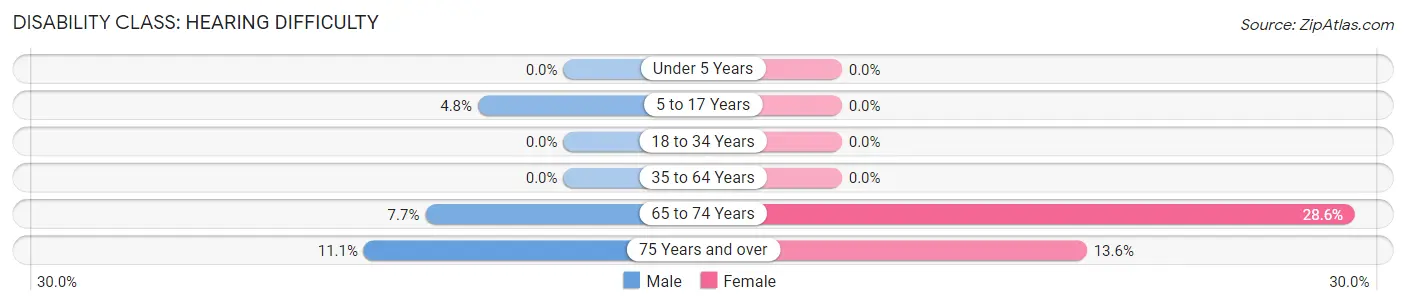
| Age Bracket | Male | Female |
| Under 5 Years | 0 (0.0%) | 0 (0.0%) |
| 5 to 17 Years | 2 (4.8%) | 0 (0.0%) |
| 18 to 34 Years | 0 (0.0%) | 0 (0.0%) |
| 35 to 64 Years | 0 (0.0%) | 0 (0.0%) |
| 65 to 74 Years | 2 (7.7%) | 18 (28.6%) |
| 75 Years and over | 2 (11.1%) | 3 (13.6%) |
Disability Class: Vision Difficulty
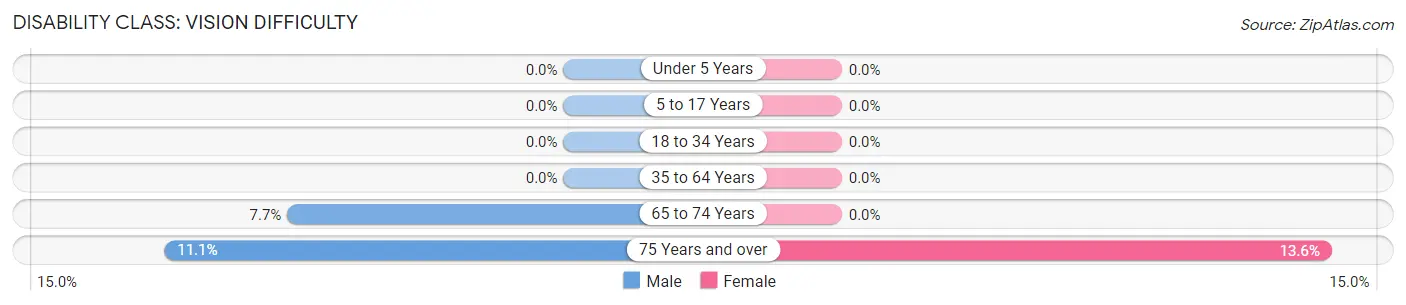
| Age Bracket | Male | Female |
| Under 5 Years | 0 (0.0%) | 0 (0.0%) |
| 5 to 17 Years | 0 (0.0%) | 0 (0.0%) |
| 18 to 34 Years | 0 (0.0%) | 0 (0.0%) |
| 35 to 64 Years | 0 (0.0%) | 0 (0.0%) |
| 65 to 74 Years | 2 (7.7%) | 0 (0.0%) |
| 75 Years and over | 2 (11.1%) | 3 (13.6%) |
Disability Class: Cognitive Difficulty
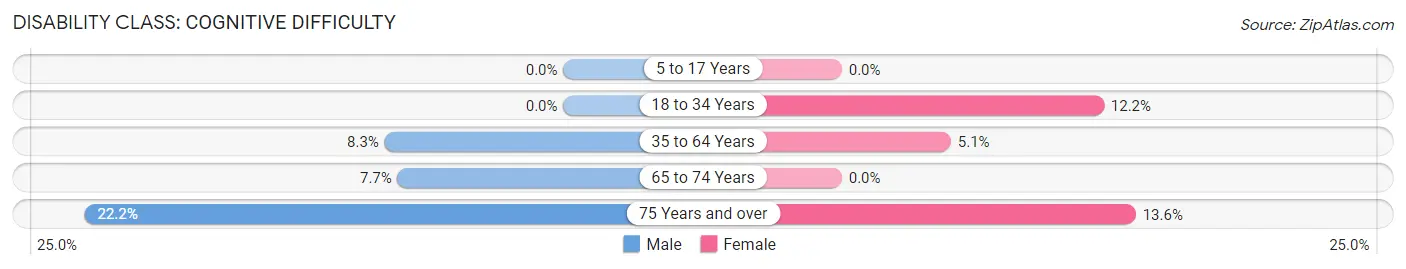
| Age Bracket | Male | Female |
| 5 to 17 Years | 0 (0.0%) | 0 (0.0%) |
| 18 to 34 Years | 0 (0.0%) | 9 (12.2%) |
| 35 to 64 Years | 15 (8.3%) | 9 (5.1%) |
| 65 to 74 Years | 2 (7.7%) | 0 (0.0%) |
| 75 Years and over | 4 (22.2%) | 3 (13.6%) |
Disability Class: Ambulatory Difficulty
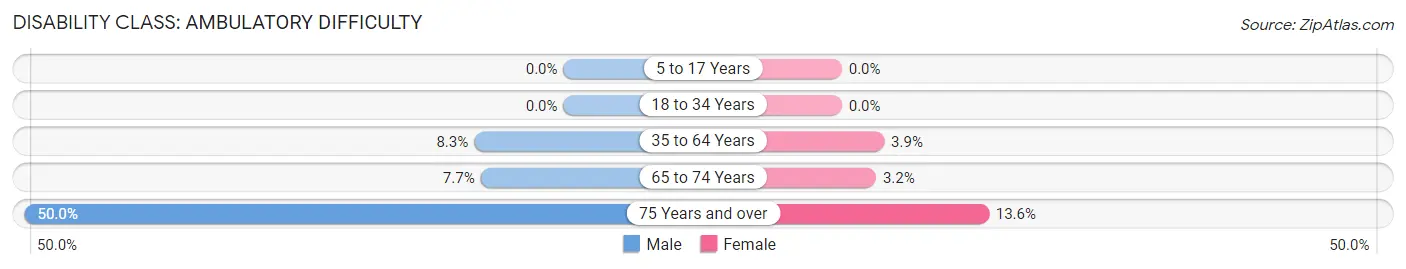
| Age Bracket | Male | Female |
| 5 to 17 Years | 0 (0.0%) | 0 (0.0%) |
| 18 to 34 Years | 0 (0.0%) | 0 (0.0%) |
| 35 to 64 Years | 15 (8.3%) | 7 (3.9%) |
| 65 to 74 Years | 2 (7.7%) | 2 (3.2%) |
| 75 Years and over | 9 (50.0%) | 3 (13.6%) |
Disability Class: Self-Care Difficulty
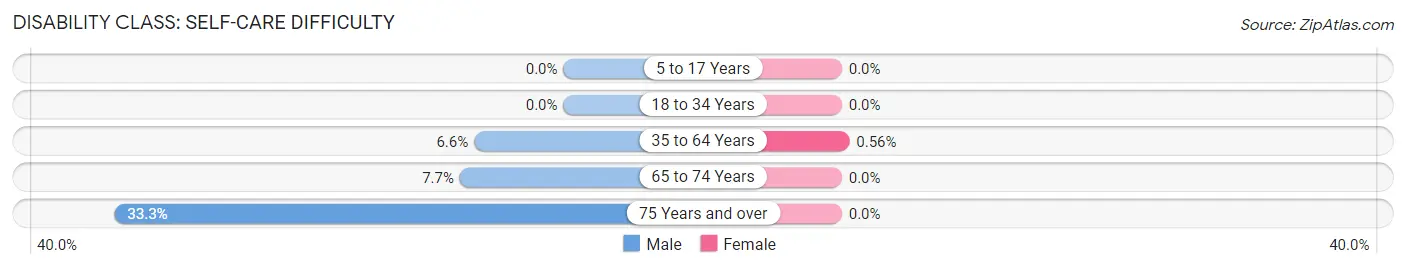
| Age Bracket | Male | Female |
| 5 to 17 Years | 0 (0.0%) | 0 (0.0%) |
| 18 to 34 Years | 0 (0.0%) | 0 (0.0%) |
| 35 to 64 Years | 12 (6.6%) | 1 (0.6%) |
| 65 to 74 Years | 2 (7.7%) | 0 (0.0%) |
| 75 Years and over | 6 (33.3%) | 0 (0.0%) |
Technology Access in Homecroft
Computing Device Access in Homecroft
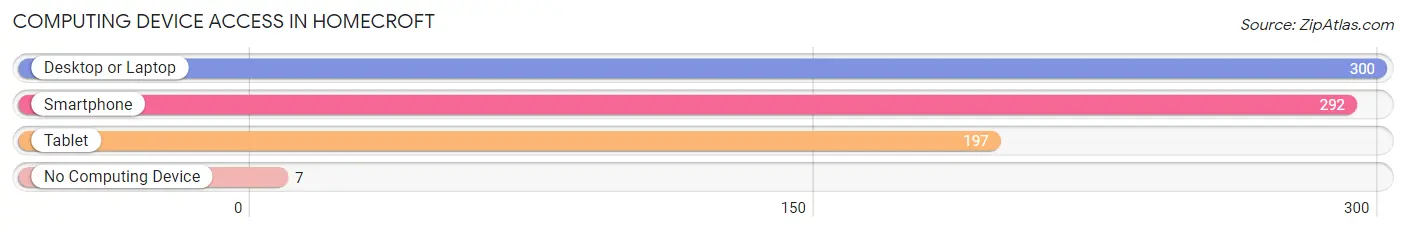
| Device Type | # Households | % Households |
| Desktop or Laptop | 300 | 88.5% |
| Smartphone | 292 | 86.1% |
| Tablet | 197 | 58.1% |
| No Computing Device | 7 | 2.1% |
| Total | 339 | 100.0% |
Internet Access in Homecroft
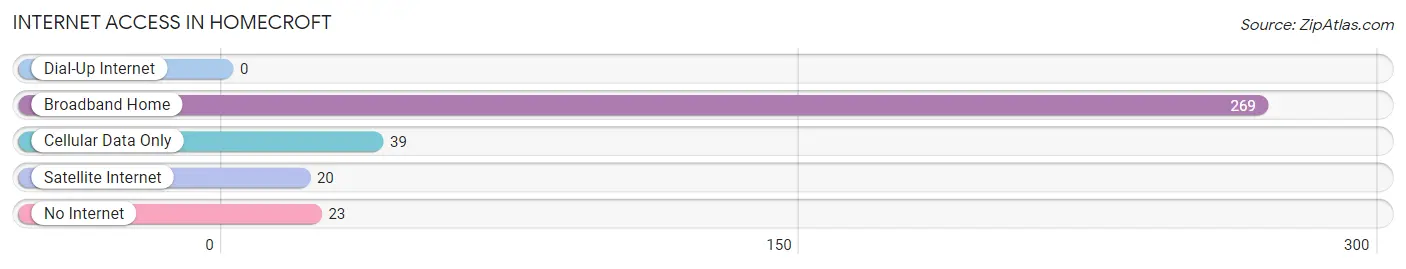
| Internet Type | # Households | % Households |
| Dial-Up Internet | 0 | 0.0% |
| Broadband Home | 269 | 79.3% |
| Cellular Data Only | 39 | 11.5% |
| Satellite Internet | 20 | 5.9% |
| No Internet | 23 | 6.8% |
| Total | 339 | 100.0% |
Homecroft Summary
Homecroft is a small town located in Marion County, Indiana. It is situated just south of Indianapolis, the state capital. Homecroft is a part of the Indianapolis Metropolitan Statistical Area and has a population of approximately 2,000 people.
History
Homecroft was founded in 1871 by a group of settlers from Ohio. The town was named after the Homecroft family, who were among the first settlers. The town was originally a farming community, but it soon developed into a small industrial center. The town was home to several factories, including a paper mill, a brickyard, and a furniture factory.
In the early 1900s, Homecroft was a thriving community with a population of over 1,000 people. The town had a variety of businesses, including a bank, a post office, a grocery store, and a movie theater. The town also had a school, a library, and a fire station.
Geography
Homecroft is located in Marion County, Indiana. It is situated just south of Indianapolis, the state capital. The town is located in the White River Valley, which is part of the Central Lowland region of the United States. The town is situated on the banks of the White River, which is a tributary of the Wabash River.
The town has a total area of 1.2 square miles, all of which is land. The town is located at an elevation of 830 feet above sea level. The climate in Homecroft is classified as humid continental, with hot summers and cold winters.
Economy
Homecroft’s economy is largely based on agriculture and manufacturing. The town is home to several small businesses, including a grocery store, a hardware store, and a restaurant. The town also has a few small industrial plants, including a paper mill and a furniture factory.
The town is also home to a few small farms, which produce a variety of crops, including corn, soybeans, and wheat. The town also has a few small wineries, which produce a variety of wines.
Demographics
As of the 2010 census, Homecroft had a population of 2,000 people. The town has a population density of 1,636 people per square mile. The median age in Homecroft is 38.7 years, and the median household income is $45,000.
The racial makeup of Homecroft is 95.2% White, 1.2% African American, 0.4% Native American, 0.4% Asian, 0.2% Pacific Islander, and 2.6% from other races. The town has a large Hispanic population, with 8.2% of the population being of Hispanic or Latino origin.
Conclusion
Homecroft is a small town located in Marion County, Indiana. It is situated just south of Indianapolis, the state capital. Homecroft was founded in 1871 by a group of settlers from Ohio. The town has a population of approximately 2,000 people and is largely based on agriculture and manufacturing. The town has a population density of 1,636 people per square mile and a median household income of $45,000. The racial makeup of Homecroft is 95.2% White, 1.2% African American, 0.4% Native American, 0.4% Asian, 0.2% Pacific Islander, and 2.6% from other races. The town has a large Hispanic population, with 8.2% of the population being of Hispanic or Latino origin.
Common Questions
What is Per Capita Income in Homecroft?
Per Capita income in Homecroft is $43,766.
What is the Median Family Income in Homecroft?
Median Family Income in Homecroft is $102,321.
What is the Median Household income in Homecroft?
Median Household Income in Homecroft is $83,125.
What is Income or Wage Gap in Homecroft?
Income or Wage Gap in Homecroft is 7.8%.
Women in Homecroft earn 92.2 cents for every dollar earned by a man.
What is Inequality or Gini Index in Homecroft?
Inequality or Gini Index in Homecroft is 0.32.
What is the Total Population of Homecroft?
Total Population of Homecroft is 737.
What is the Total Male Population of Homecroft?
Total Male Population of Homecroft is 335.
What is the Total Female Population of Homecroft?
Total Female Population of Homecroft is 402.
What is the Ratio of Males per 100 Females in Homecroft?
There are 83.33 Males per 100 Females in Homecroft.
What is the Ratio of Females per 100 Males in Homecroft?
There are 120.00 Females per 100 Males in Homecroft.
What is the Median Population Age in Homecroft?
Median Population Age in Homecroft is 42.6 Years.
What is the Average Family Size in Homecroft
Average Family Size in Homecroft is 2.7 People.
What is the Average Household Size in Homecroft
Average Household Size in Homecroft is 2.2 People.
How Large is the Labor Force in Homecroft?
There are 464 People in the Labor Forcein in Homecroft.
What is the Percentage of People in the Labor Force in Homecroft?
73.4% of People are in the Labor Force in Homecroft.
What is the Unemployment Rate in Homecroft?
Unemployment Rate in Homecroft is 0.4%.