Zip Codes with the Highest Percentage of Population Employed in Legal Services & Support in Bloomington, IN
RELATED REPORTS & OPTIONS
Legal Services & Support
Bloomington
Compare Zip Codes
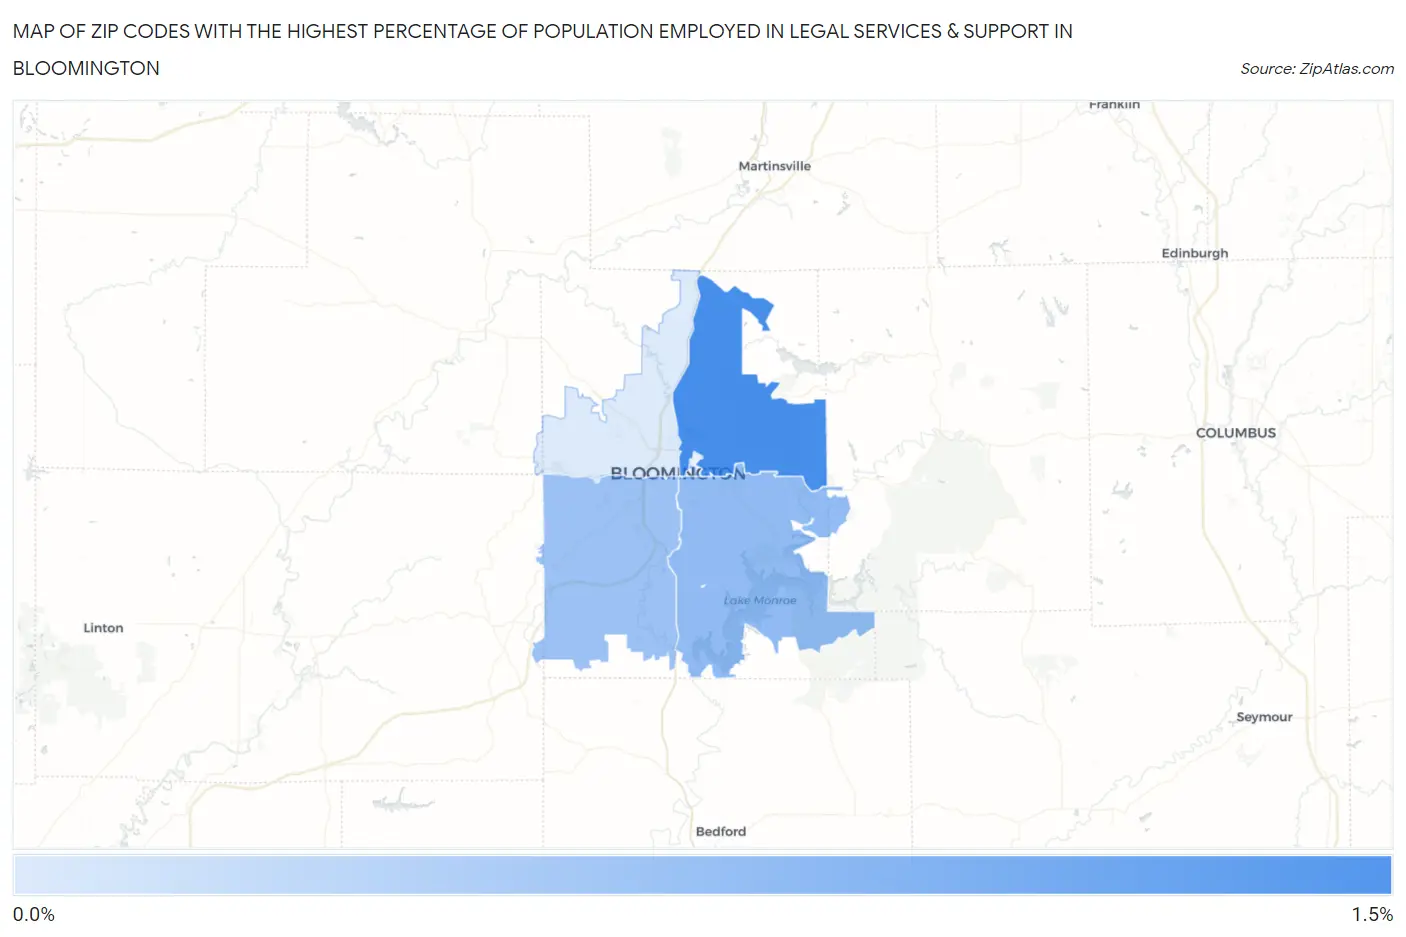
Map of Zip Codes with the Highest Percentage of Population Employed in Legal Services & Support in Bloomington
0.15%
1.1%
Zip Codes with the Highest Percentage of Population Employed in Legal Services & Support in Bloomington, IN
| Zip Code | % Employed | vs State | vs National | |
| 1. | 47408 | 1.1% | 0.76%(+0.339)#103 | 1.2%(-0.083)#7,164 |
| 2. | 47401 | 0.63% | 0.76%(-0.129)#171 | 1.2%(-0.550)#11,083 |
| 3. | 47403 | 0.56% | 0.76%(-0.199)#188 | 1.2%(-0.621)#11,913 |
| 4. | 47404 | 0.15% | 0.76%(-0.614)#344 | 1.2%(-1.04)#16,704 |
1
Common Questions
What are the Top 5 Zip Codes with the Highest Percentage of Population Employed in Legal Services & Support in Bloomington, IN?
Top 5 Zip Codes with the Highest Percentage of Population Employed in Legal Services & Support in Bloomington, IN are:
What zip code has the Highest Percentage of Population Employed in Legal Services & Support in Bloomington, IN?
47408 has the Highest Percentage of Population Employed in Legal Services & Support in Bloomington, IN with 1.1%.
What is the Percentage of Population Employed in Legal Services & Support in Bloomington, IN?
Percentage of Population Employed in Legal Services & Support in Bloomington is 0.67%.
What is the Percentage of Population Employed in Legal Services & Support in Indiana?
Percentage of Population Employed in Legal Services & Support in Indiana is 0.76%.
What is the Percentage of Population Employed in Legal Services & Support in the United States?
Percentage of Population Employed in Legal Services & Support in the United States is 1.2%.