Georgetown, IN Map & Demographics
Georgetown Map
Georgetown Overview
$41,345
PER CAPITA INCOME
$117,841
AVG FAMILY INCOME
$105,368
AVG HOUSEHOLD INCOME
42.9%
WAGE / INCOME GAP [ % ]
57.1¢/ $1
WAGE / INCOME GAP [ $ ]
0.39
INEQUALITY / GINI INDEX
3,749
TOTAL POPULATION
1,919
MALE POPULATION
1,830
FEMALE POPULATION
104.86
MALES / 100 FEMALES
95.36
FEMALES / 100 MALES
31.6
MEDIAN AGE
3.7
AVG FAMILY SIZE
2.9
AVG HOUSEHOLD SIZE
1,693
LABOR FORCE [ PEOPLE ]
64.6%
PERCENT IN LABOR FORCE
1.2%
UNEMPLOYMENT RATE
Georgetown Zip Codes
Georgetown Area Codes
Income in Georgetown
Income Overview in Georgetown
Per Capita Income in Georgetown is $41,345, while median incomes of families and households are $117,841 and $105,368 respectively.
| Characteristic | Number | Measure |
| Per Capita Income | 3,749 | $41,345 |
| Median Family Income | 863 | $117,841 |
| Mean Family Income | 863 | $148,059 |
| Median Household Income | 1,301 | $105,368 |
| Mean Household Income | 1,301 | $116,388 |
| Income Deficit | 863 | $0 |
| Wage / Income Gap (%) | 3,749 | 42.90% |
| Wage / Income Gap ($) | 3,749 | 57.10¢ per $1 |
| Gini / Inequality Index | 3,749 | 0.39 |
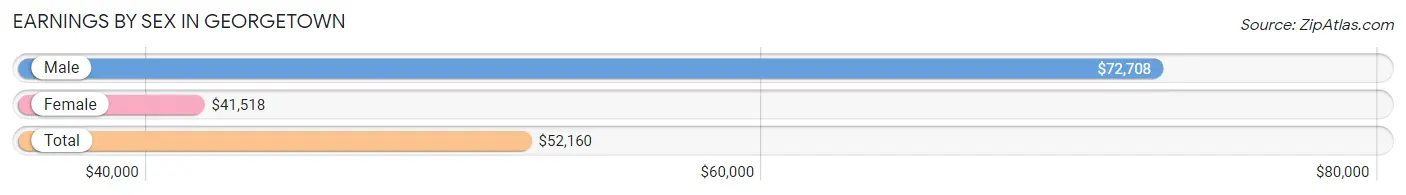
Earnings by Sex in Georgetown
Average Earnings in Georgetown are $52,160, $72,708 for men and $41,518 for women, a difference of 42.9%.
| Sex | Number | Average Earnings |
| Male | 954 (55.3%) | $72,708 |
| Female | 770 (44.7%) | $41,518 |
| Total | 1,724 (100.0%) | $52,160 |
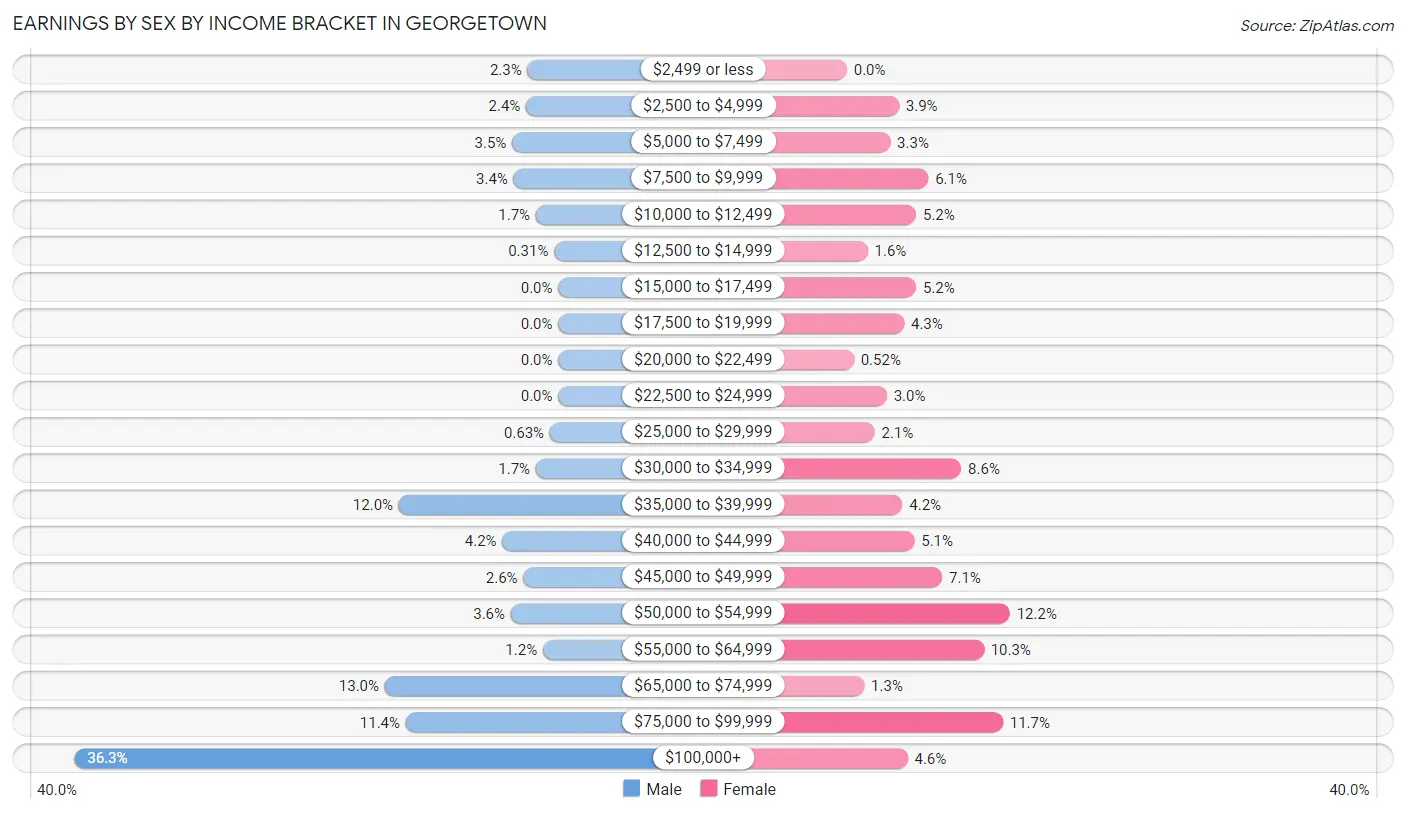
Earnings by Sex by Income Bracket in Georgetown
The most common earnings brackets in Georgetown are $100,000+ for men (346 | 36.3%) and $50,000 to $54,999 for women (94 | 12.2%).
| Income | Male | Female |
| $2,499 or less | 22 (2.3%) | 0 (0.0%) |
| $2,500 to $4,999 | 23 (2.4%) | 30 (3.9%) |
| $5,000 to $7,499 | 33 (3.5%) | 25 (3.3%) |
| $7,500 to $9,999 | 32 (3.4%) | 47 (6.1%) |
| $10,000 to $12,499 | 16 (1.7%) | 40 (5.2%) |
| $12,500 to $14,999 | 3 (0.3%) | 12 (1.6%) |
| $15,000 to $17,499 | 0 (0.0%) | 40 (5.2%) |
| $17,500 to $19,999 | 0 (0.0%) | 33 (4.3%) |
| $20,000 to $22,499 | 0 (0.0%) | 4 (0.5%) |
| $22,500 to $24,999 | 0 (0.0%) | 23 (3.0%) |
| $25,000 to $29,999 | 6 (0.6%) | 16 (2.1%) |
| $30,000 to $34,999 | 16 (1.7%) | 66 (8.6%) |
| $35,000 to $39,999 | 114 (11.9%) | 32 (4.2%) |
| $40,000 to $44,999 | 40 (4.2%) | 39 (5.1%) |
| $45,000 to $49,999 | 25 (2.6%) | 55 (7.1%) |
| $50,000 to $54,999 | 34 (3.6%) | 94 (12.2%) |
| $55,000 to $64,999 | 11 (1.1%) | 79 (10.3%) |
| $65,000 to $74,999 | 124 (13.0%) | 10 (1.3%) |
| $75,000 to $99,999 | 109 (11.4%) | 90 (11.7%) |
| $100,000+ | 346 (36.3%) | 35 (4.5%) |
| Total | 954 (100.0%) | 770 (100.0%) |
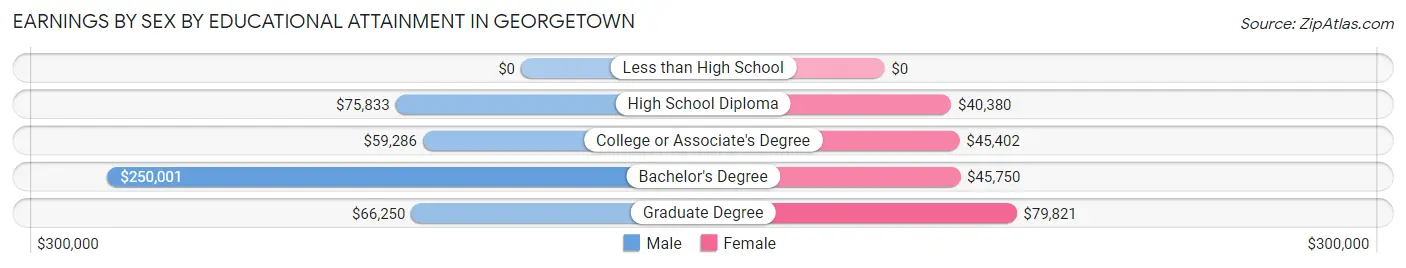
Earnings by Sex by Educational Attainment in Georgetown
Average earnings in Georgetown are $79,857 for men and $46,337 for women, a difference of 42.0%. Men with an educational attainment of bachelor's degree enjoy the highest average annual earnings of $250,001, while those with college or associate's degree education earn the least with $59,286. Women with an educational attainment of graduate degree earn the most with the average annual earnings of $79,821, while those with high school diploma education have the smallest earnings of $40,380.
| Educational Attainment | Male Income | Female Income |
| Less than High School | - | - |
| High School Diploma | $75,833 | $40,380 |
| College or Associate's Degree | $59,286 | $45,402 |
| Bachelor's Degree | $250,001 | $45,750 |
| Graduate Degree | $66,250 | $79,821 |
| Total | $79,857 | $46,337 |
Family Income in Georgetown
Family Income Brackets in Georgetown
According to the Georgetown family income data, there are 340 families falling into the $100,000 to $149,999 income range, which is the most common income bracket and makes up 39.4% of all families.
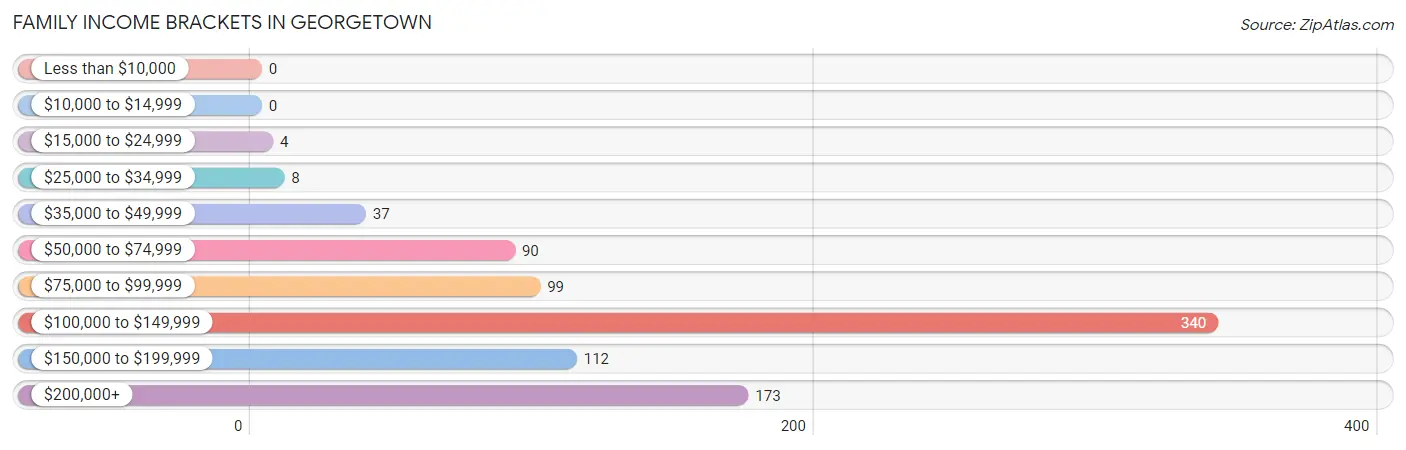
| Income Bracket | # Families | % Families |
| Less than $10,000 | 0 | 0.0% |
| $10,000 to $14,999 | 0 | 0.0% |
| $15,000 to $24,999 | 4 | 0.5% |
| $25,000 to $34,999 | 8 | 0.9% |
| $35,000 to $49,999 | 37 | 4.3% |
| $50,000 to $74,999 | 90 | 10.4% |
| $75,000 to $99,999 | 99 | 11.5% |
| $100,000 to $149,999 | 340 | 39.4% |
| $150,000 to $199,999 | 112 | 13.0% |
| $200,000+ | 173 | 20.0% |
Family Income by Famaliy Size in Georgetown
4-person families (290 | 33.6%) account for the highest median family income in Georgetown with $250,001 per family, while 4-person families (290 | 33.6%) have the highest median income of $62,500 per family member.
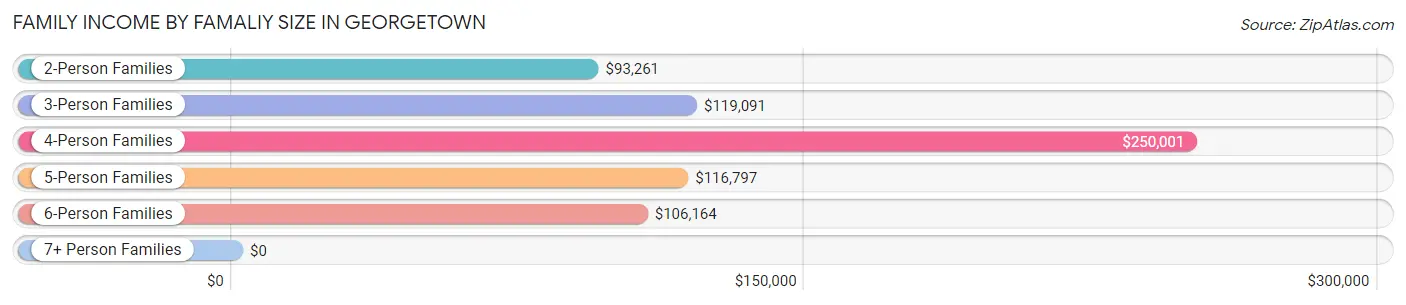
| Income Bracket | # Families | Median Income |
| 2-Person Families | 256 (29.7%) | $93,261 |
| 3-Person Families | 160 (18.5%) | $119,091 |
| 4-Person Families | 290 (33.6%) | $250,001 |
| 5-Person Families | 83 (9.6%) | $116,797 |
| 6-Person Families | 74 (8.6%) | $106,164 |
| 7+ Person Families | 0 (0.0%) | $0 |
| Total | 863 (100.0%) | $117,841 |
Family Income by Number of Earners in Georgetown
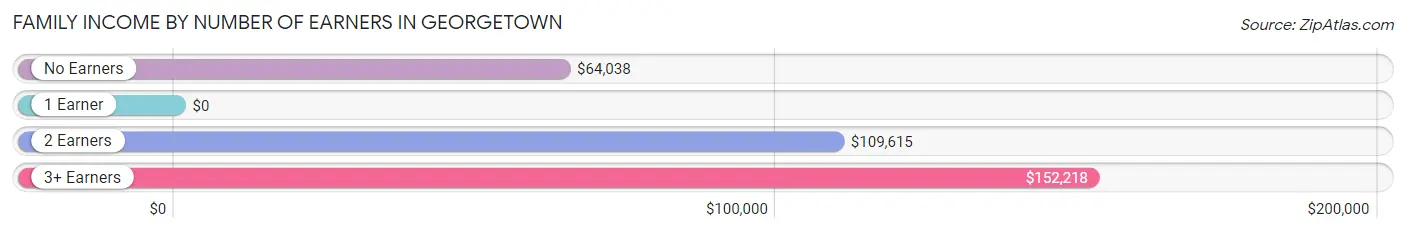
| Number of Earners | # Families | Median Income |
| No Earners | 106 (12.3%) | $64,038 |
| 1 Earner | 320 (37.1%) | $0 |
| 2 Earners | 330 (38.2%) | $109,615 |
| 3+ Earners | 107 (12.4%) | $152,218 |
| Total | 863 (100.0%) | $117,841 |
Household Income in Georgetown
Household Income Brackets in Georgetown
With 402 households falling in the category, the $100,000 to $149,999 income range is the most frequent in Georgetown, accounting for 30.9% of all households. In contrast, only 7 households (0.5%) fall into the $10,000 to $14,999 income bracket, making it the least populous group.
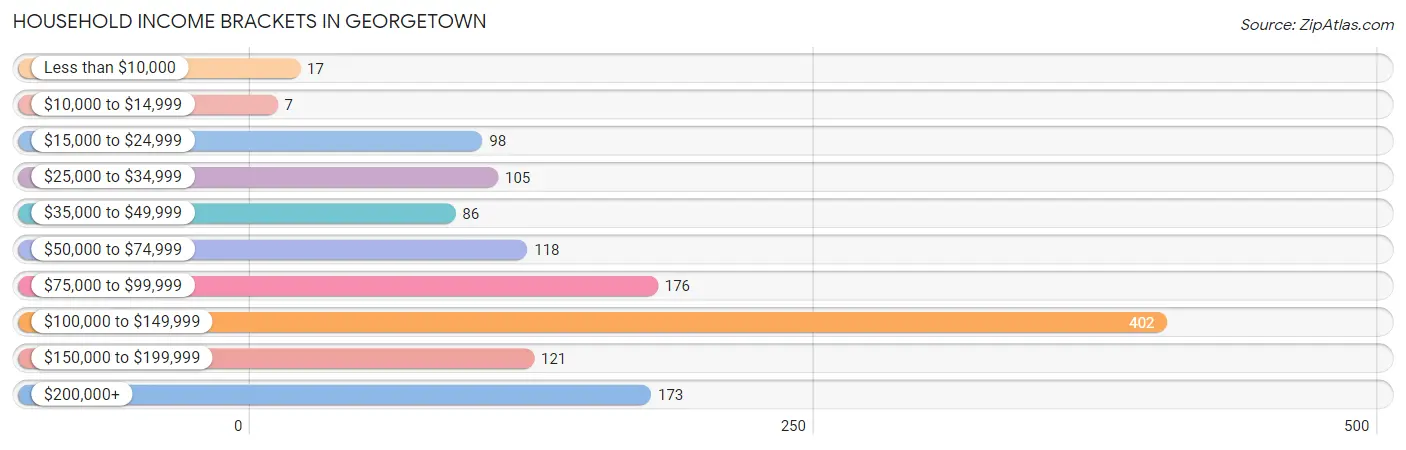
| Income Bracket | # Households | % Households |
| Less than $10,000 | 17 | 1.3% |
| $10,000 to $14,999 | 7 | 0.5% |
| $15,000 to $24,999 | 98 | 7.5% |
| $25,000 to $34,999 | 105 | 8.1% |
| $35,000 to $49,999 | 86 | 6.6% |
| $50,000 to $74,999 | 118 | 9.1% |
| $75,000 to $99,999 | 176 | 13.5% |
| $100,000 to $149,999 | 402 | 30.9% |
| $150,000 to $199,999 | 121 | 9.3% |
| $200,000+ | 173 | 13.3% |
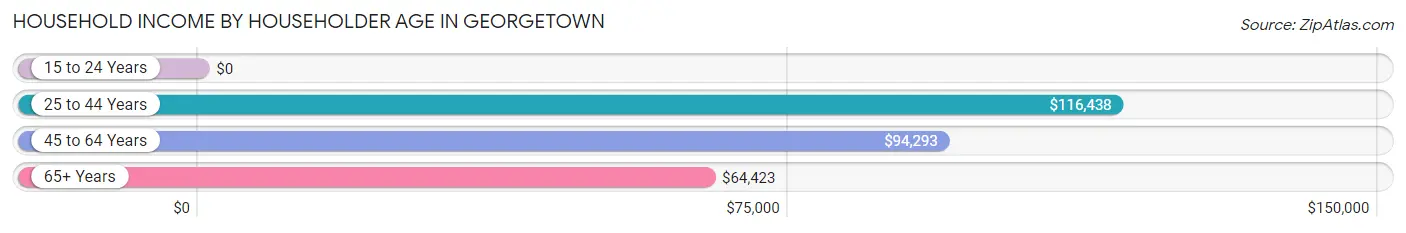
Household Income by Householder Age in Georgetown
The median household income in Georgetown is $105,368, with the highest median household income of $116,438 found in the 25 to 44 years age bracket for the primary householder. A total of 551 households (42.3%) fall into this category. Meanwhile, the 15 to 24 years age bracket for the primary householder has the lowest median household income of $0, with 17 households (1.3%) in this group.
| Income Bracket | # Households | Median Income |
| 15 to 24 Years | 17 (1.3%) | $0 |
| 25 to 44 Years | 551 (42.3%) | $116,438 |
| 45 to 64 Years | 399 (30.7%) | $94,293 |
| 65+ Years | 334 (25.7%) | $64,423 |
| Total | 1,301 (100.0%) | $105,368 |
Poverty in Georgetown
Income Below Poverty by Sex and Age in Georgetown
With 0.5% poverty level for males and 2.7% for females among the residents of Georgetown, 45 to 54 year old males and 45 to 54 year old females are the most vulnerable to poverty, with 9 males (4.2%) and 22 females (9.3%) in their respective age groups living below the poverty level.
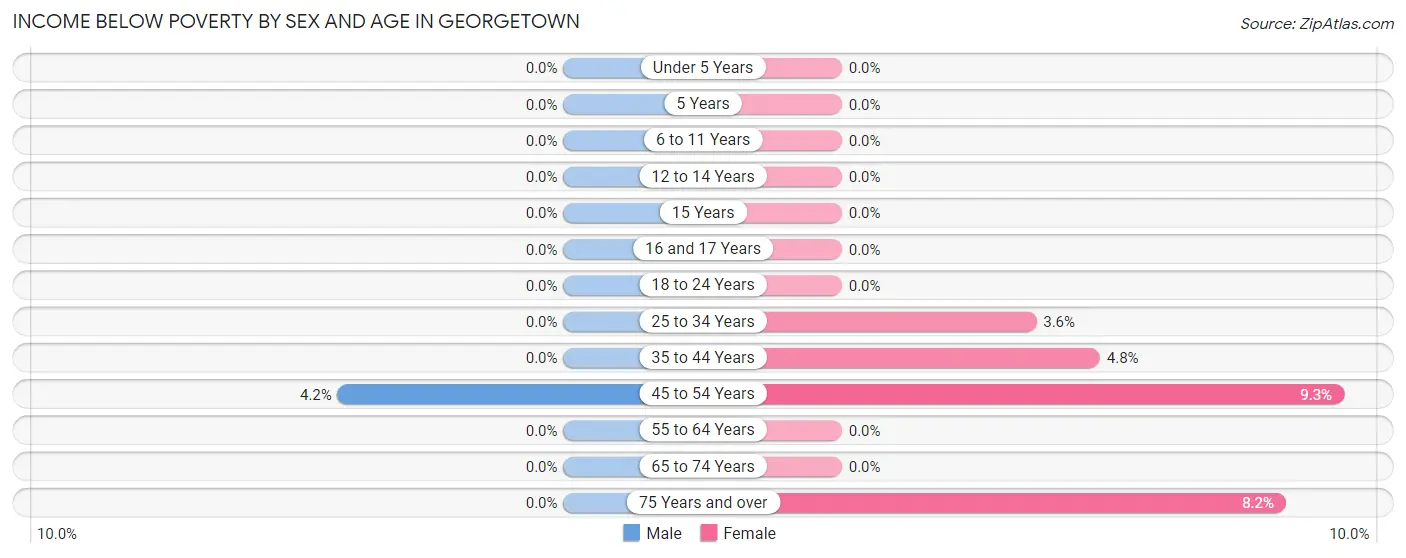
| Age Bracket | Male | Female |
| Under 5 Years | 0 (0.0%) | 0 (0.0%) |
| 5 Years | 0 (0.0%) | 0 (0.0%) |
| 6 to 11 Years | 0 (0.0%) | 0 (0.0%) |
| 12 to 14 Years | 0 (0.0%) | 0 (0.0%) |
| 15 Years | 0 (0.0%) | 0 (0.0%) |
| 16 and 17 Years | 0 (0.0%) | 0 (0.0%) |
| 18 to 24 Years | 0 (0.0%) | 0 (0.0%) |
| 25 to 34 Years | 0 (0.0%) | 7 (3.6%) |
| 35 to 44 Years | 0 (0.0%) | 7 (4.8%) |
| 45 to 54 Years | 9 (4.2%) | 22 (9.3%) |
| 55 to 64 Years | 0 (0.0%) | 0 (0.0%) |
| 65 to 74 Years | 0 (0.0%) | 0 (0.0%) |
| 75 Years and over | 0 (0.0%) | 14 (8.2%) |
| Total | 9 (0.5%) | 50 (2.7%) |
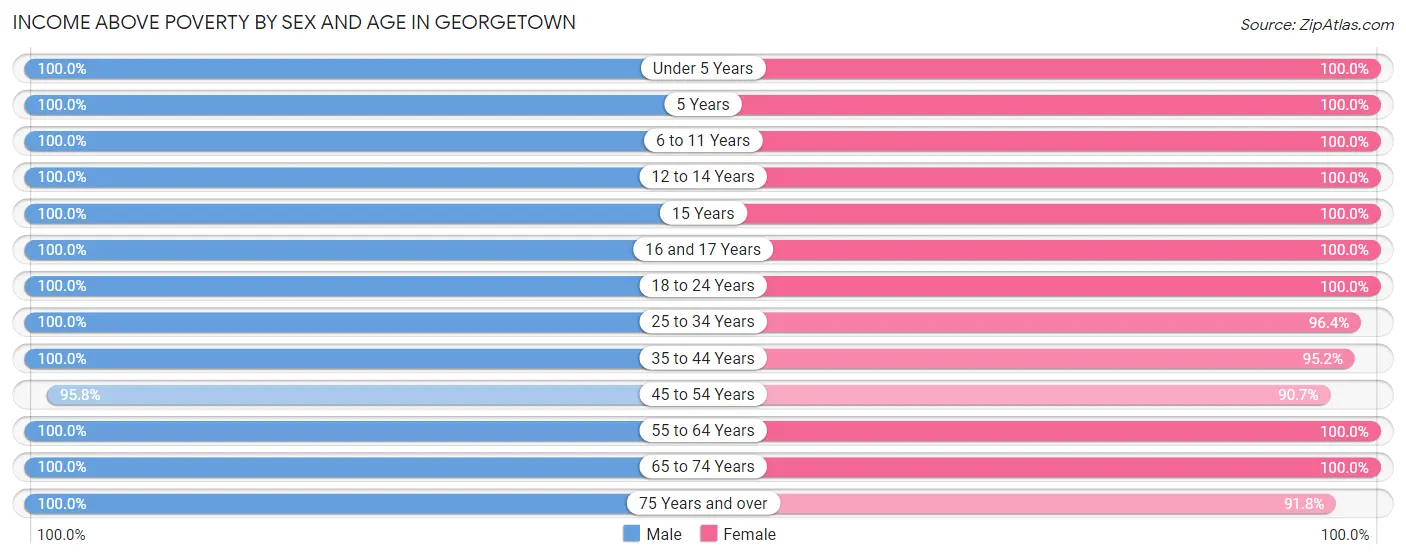
Income Above Poverty by Sex and Age in Georgetown
According to the poverty statistics in Georgetown, males aged under 5 years and females aged under 5 years are the age groups that are most secure financially, with 100.0% of males and 100.0% of females in these age groups living above the poverty line.
| Age Bracket | Male | Female |
| Under 5 Years | 152 (100.0%) | 158 (100.0%) |
| 5 Years | 13 (100.0%) | 7 (100.0%) |
| 6 to 11 Years | 69 (100.0%) | 239 (100.0%) |
| 12 to 14 Years | 233 (100.0%) | 145 (100.0%) |
| 15 Years | 17 (100.0%) | 74 (100.0%) |
| 16 and 17 Years | 162 (100.0%) | 29 (100.0%) |
| 18 to 24 Years | 138 (100.0%) | 131 (100.0%) |
| 25 to 34 Years | 223 (100.0%) | 187 (96.4%) |
| 35 to 44 Years | 347 (100.0%) | 139 (95.2%) |
| 45 to 54 Years | 206 (95.8%) | 214 (90.7%) |
| 55 to 64 Years | 127 (100.0%) | 160 (100.0%) |
| 65 to 74 Years | 126 (100.0%) | 137 (100.0%) |
| 75 Years and over | 62 (100.0%) | 156 (91.8%) |
| Total | 1,875 (99.5%) | 1,776 (97.3%) |
Income Below Poverty Among Married-Couple Families in Georgetown
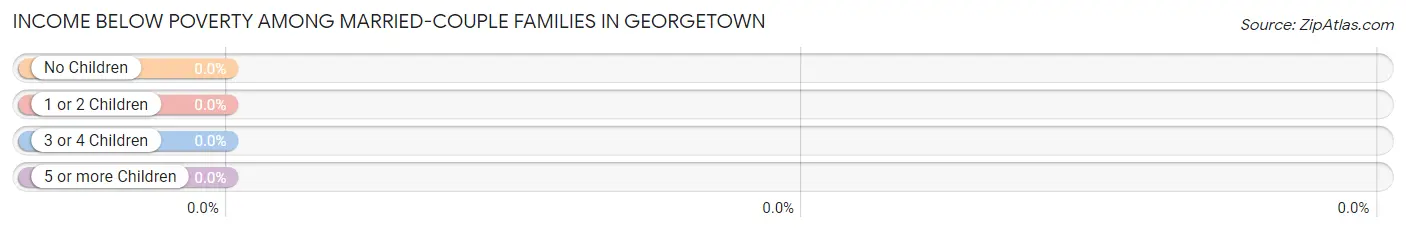
| Children | Above Poverty | Below Poverty |
| No Children | 258 (100.0%) | 0 (0.0%) |
| 1 or 2 Children | 198 (100.0%) | 0 (0.0%) |
| 3 or 4 Children | 147 (100.0%) | 0 (0.0%) |
| 5 or more Children | 0 (0.0%) | 0 (0.0%) |
| Total | 603 (100.0%) | 0 (0.0%) |
Income Below Poverty Among Single-Parent Households in Georgetown
| Children | Single Father | Single Mother |
| No Children | 0 (0.0%) | 0 (0.0%) |
| 1 or 2 Children | 0 (0.0%) | 0 (0.0%) |
| 3 or 4 Children | 0 (0.0%) | 0 (0.0%) |
| 5 or more Children | 0 (0.0%) | 0 (0.0%) |
| Total | 0 (0.0%) | 0 (0.0%) |
Income Below Poverty Among Married-Couple vs Single-Parent Households in Georgetown
| Children | Married-Couple Families | Single-Parent Households |
| No Children | 0 (0.0%) | 0 (0.0%) |
| 1 or 2 Children | 0 (0.0%) | 0 (0.0%) |
| 3 or 4 Children | 0 (0.0%) | 0 (0.0%) |
| 5 or more Children | 0 (0.0%) | 0 (0.0%) |
| Total | 0 (0.0%) | 0 (0.0%) |
Race in Georgetown
The most populous races in Georgetown are White / Caucasian (3,553 | 94.8%), Two or more Races (174 | 4.6%), and Hispanic or Latino (88 | 2.4%).
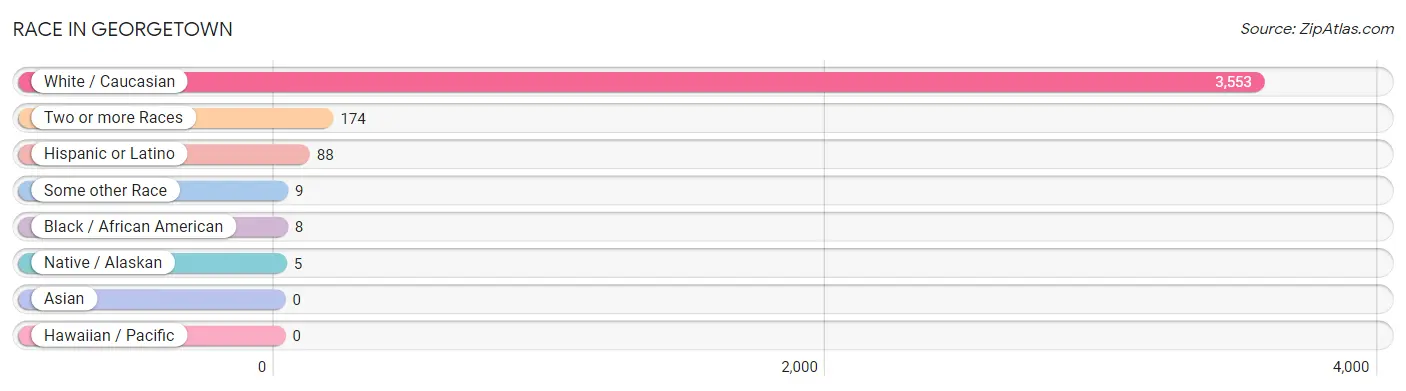
| Race | # Population | % Population |
| Asian | 0 | 0.0% |
| Black / African American | 8 | 0.2% |
| Hawaiian / Pacific | 0 | 0.0% |
| Hispanic or Latino | 88 | 2.4% |
| Native / Alaskan | 5 | 0.1% |
| White / Caucasian | 3,553 | 94.8% |
| Two or more Races | 174 | 4.6% |
| Some other Race | 9 | 0.2% |
| Total | 3,749 | 100.0% |
Ancestry in Georgetown
The most populous ancestries reported in Georgetown are German (881 | 23.5%), English (467 | 12.5%), Irish (463 | 12.3%), American (280 | 7.5%), and Italian (123 | 3.3%), together accounting for 59.1% of all Georgetown residents.
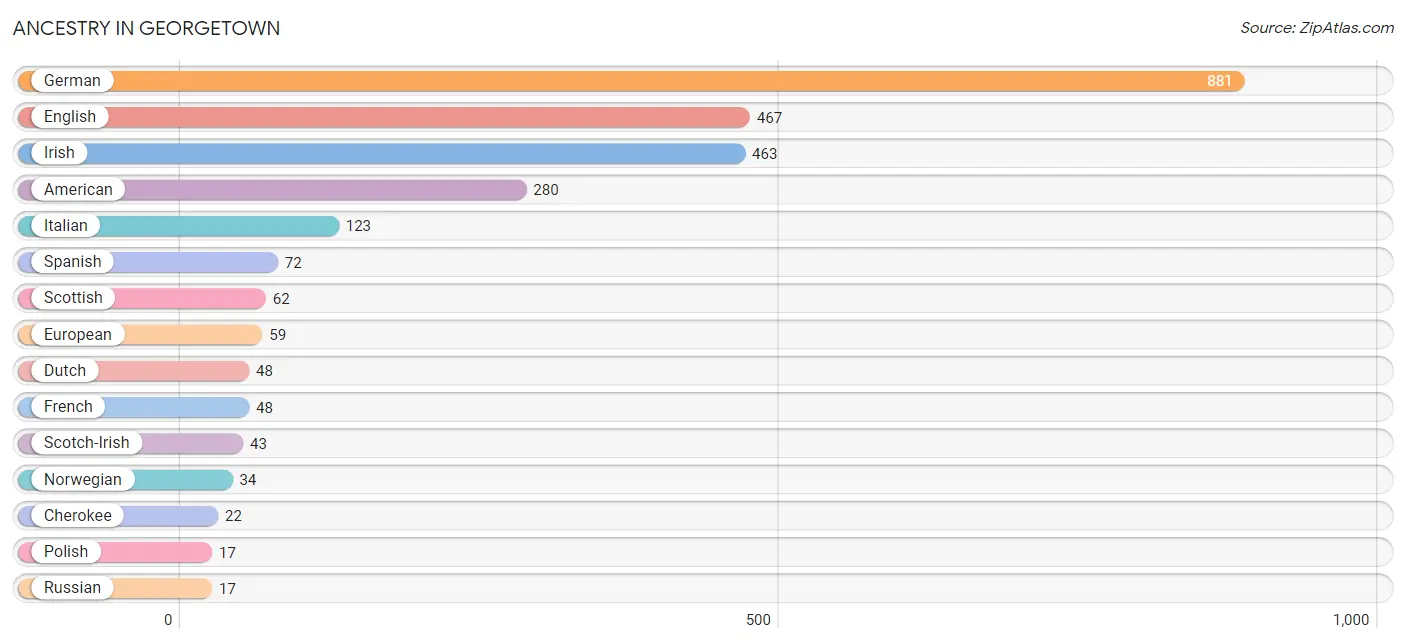
| Ancestry | # Population | % Population |
| American | 280 | 7.5% |
| Armenian | 7 | 0.2% |
| Bhutanese | 13 | 0.4% |
| Cherokee | 22 | 0.6% |
| Dutch | 48 | 1.3% |
| English | 467 | 12.5% |
| European | 59 | 1.6% |
| French | 48 | 1.3% |
| German | 881 | 23.5% |
| Irish | 463 | 12.3% |
| Italian | 123 | 3.3% |
| Norwegian | 34 | 0.9% |
| Polish | 17 | 0.4% |
| Puerto Rican | 16 | 0.4% |
| Russian | 17 | 0.4% |
| Scandinavian | 8 | 0.2% |
| Scotch-Irish | 43 | 1.1% |
| Scottish | 62 | 1.7% |
| Slovak | 15 | 0.4% |
| Spanish | 72 | 1.9% |
| Swedish | 15 | 0.4% |
| Swiss | 13 | 0.4% | View All 22 Rows |
Immigrants in Georgetown
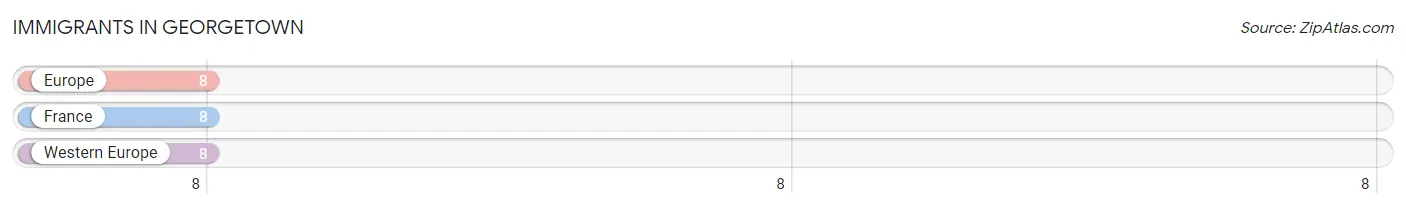
The most numerous immigrant groups reported in Georgetown came from Europe (8 | 0.2%), France (8 | 0.2%), and Western Europe (8 | 0.2%), together accounting for 0.6% of all Georgetown residents.
| Immigration Origin | # Population | % Population |
| Europe | 8 | 0.2% |
| France | 8 | 0.2% |
| Western Europe | 8 | 0.2% | View All 3 Rows |
Sex and Age in Georgetown
Sex and Age in Georgetown
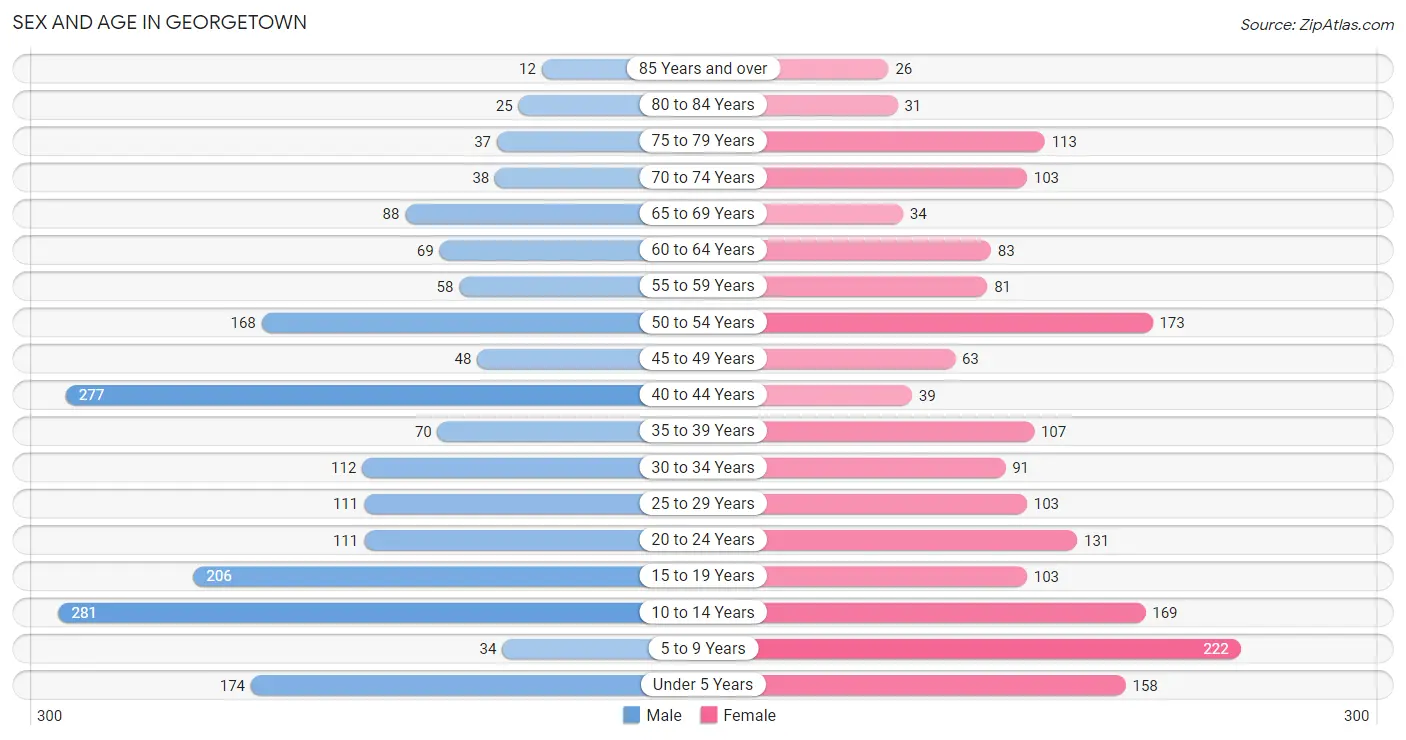
The most populous age groups in Georgetown are 10 to 14 Years (281 | 14.6%) for men and 5 to 9 Years (222 | 12.1%) for women.
| Age Bracket | Male | Female |
| Under 5 Years | 174 (9.1%) | 158 (8.6%) |
| 5 to 9 Years | 34 (1.8%) | 222 (12.1%) |
| 10 to 14 Years | 281 (14.6%) | 169 (9.2%) |
| 15 to 19 Years | 206 (10.7%) | 103 (5.6%) |
| 20 to 24 Years | 111 (5.8%) | 131 (7.2%) |
| 25 to 29 Years | 111 (5.8%) | 103 (5.6%) |
| 30 to 34 Years | 112 (5.8%) | 91 (5.0%) |
| 35 to 39 Years | 70 (3.6%) | 107 (5.9%) |
| 40 to 44 Years | 277 (14.4%) | 39 (2.1%) |
| 45 to 49 Years | 48 (2.5%) | 63 (3.4%) |
| 50 to 54 Years | 168 (8.7%) | 173 (9.5%) |
| 55 to 59 Years | 58 (3.0%) | 81 (4.4%) |
| 60 to 64 Years | 69 (3.6%) | 83 (4.5%) |
| 65 to 69 Years | 88 (4.6%) | 34 (1.9%) |
| 70 to 74 Years | 38 (2.0%) | 103 (5.6%) |
| 75 to 79 Years | 37 (1.9%) | 113 (6.2%) |
| 80 to 84 Years | 25 (1.3%) | 31 (1.7%) |
| 85 Years and over | 12 (0.6%) | 26 (1.4%) |
| Total | 1,919 (100.0%) | 1,830 (100.0%) |
Families and Households in Georgetown
Median Family Size in Georgetown
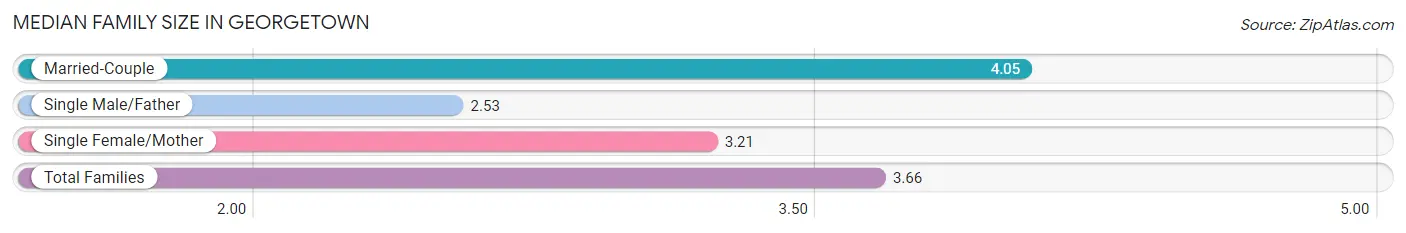
The median family size in Georgetown is 3.66 persons per family, with married-couple families (603 | 69.9%) accounting for the largest median family size of 4.05 persons per family. On the other hand, single male/father families (182 | 21.1%) represent the smallest median family size with 2.53 persons per family.
| Family Type | # Families | Family Size |
| Married-Couple | 603 (69.9%) | 4.05 |
| Single Male/Father | 182 (21.1%) | 2.53 |
| Single Female/Mother | 78 (9.0%) | 3.21 |
| Total Families | 863 (100.0%) | 3.66 |
Median Household Size in Georgetown
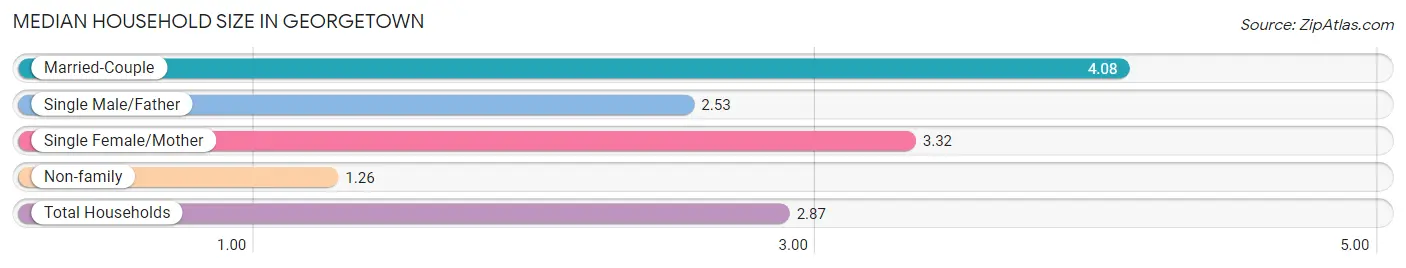
The median household size in Georgetown is 2.87 persons per household, with married-couple households (603 | 46.4%) accounting for the largest median household size of 4.08 persons per household. non-family households (438 | 33.7%) represent the smallest median household size with 1.26 persons per household.
| Household Type | # Households | Household Size |
| Married-Couple | 603 (46.4%) | 4.08 |
| Single Male/Father | 182 (14.0%) | 2.53 |
| Single Female/Mother | 78 (6.0%) | 3.32 |
| Non-family | 438 (33.7%) | 1.26 |
| Total Households | 1,301 (100.0%) | 2.87 |
Household Size by Marriage Status in Georgetown
Out of a total of 1,301 households in Georgetown, 863 (66.3%) are family households, while 438 (33.7%) are nonfamily households. The most numerous type of family households are 4-person households, comprising 299, and the most common type of nonfamily households are 1-person households, comprising 302.
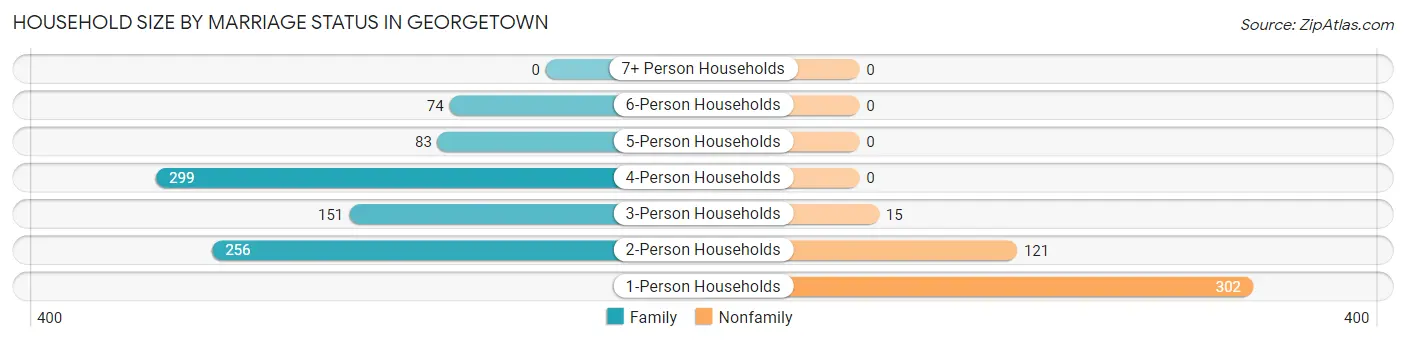
| Household Size | Family Households | Nonfamily Households |
| 1-Person Households | - | 302 (23.2%) |
| 2-Person Households | 256 (19.7%) | 121 (9.3%) |
| 3-Person Households | 151 (11.6%) | 15 (1.1%) |
| 4-Person Households | 299 (23.0%) | 0 (0.0%) |
| 5-Person Households | 83 (6.4%) | 0 (0.0%) |
| 6-Person Households | 74 (5.7%) | 0 (0.0%) |
| 7+ Person Households | 0 (0.0%) | 0 (0.0%) |
| Total | 863 (66.3%) | 438 (33.7%) |
Female Fertility in Georgetown
Fertility by Age in Georgetown
Average fertility rate in Georgetown is 55.0 births per 1,000 women. Women in the age bracket of 20 to 34 years have the highest fertility rate with 105.0 births per 1,000 women. Women in the age bracket of 20 to 34 years acount for 87.2% of all women with births.
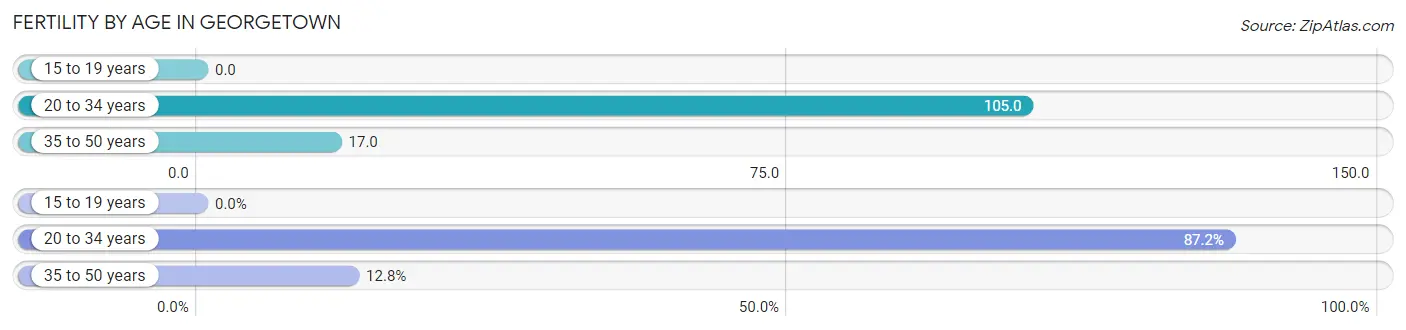
| Age Bracket | Women with Births | Births / 1,000 Women |
| 15 to 19 years | 0 (0.0%) | 0.0 |
| 20 to 34 years | 34 (87.2%) | 105.0 |
| 35 to 50 years | 5 (12.8%) | 17.0 |
| Total | 39 (100.0%) | 55.0 |
Fertility by Age by Marriage Status in Georgetown
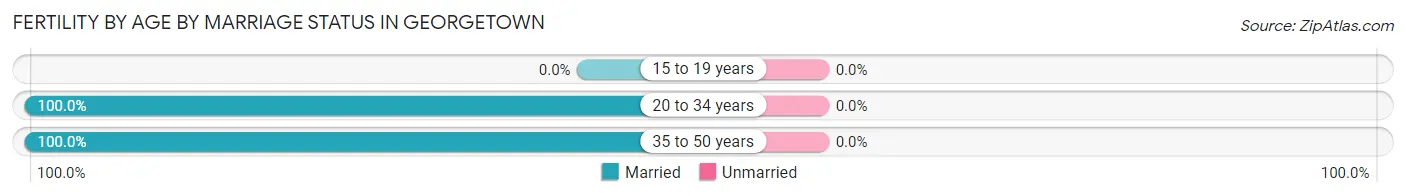
| Age Bracket | Married | Unmarried |
| 15 to 19 years | 0 (0.0%) | 0 (0.0%) |
| 20 to 34 years | 34 (100.0%) | 0 (0.0%) |
| 35 to 50 years | 5 (100.0%) | 0 (0.0%) |
| Total | 39 (100.0%) | 0 (0.0%) |
Fertility by Education in Georgetown
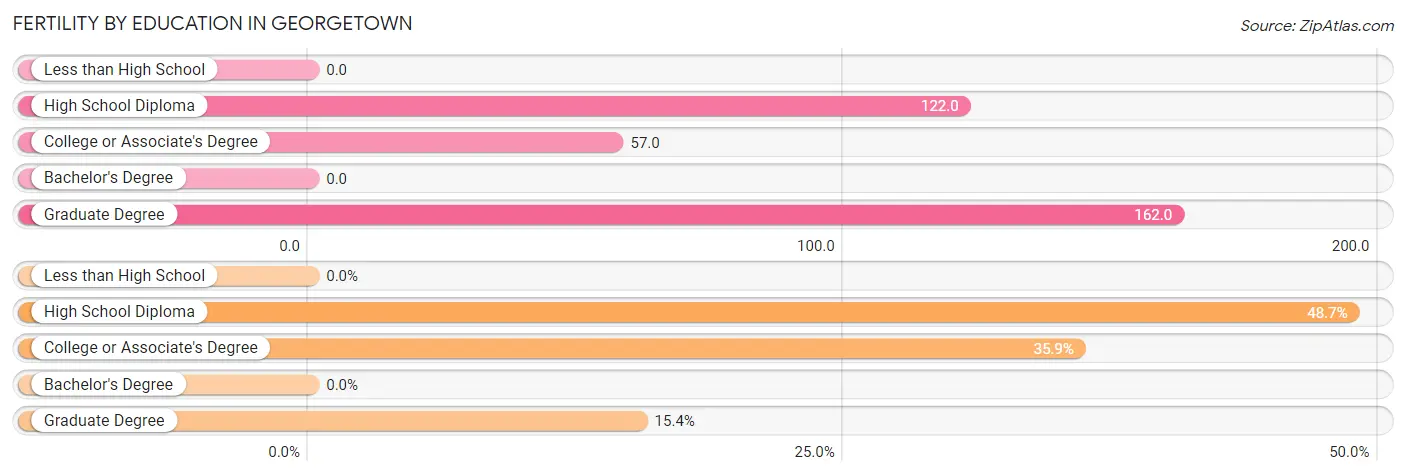
| Educational Attainment | Women with Births | Births / 1,000 Women |
| Less than High School | 0 (0.0%) | 0.0 |
| High School Diploma | 19 (48.7%) | 122.0 |
| College or Associate's Degree | 14 (35.9%) | 57.0 |
| Bachelor's Degree | 0 (0.0%) | 0.0 |
| Graduate Degree | 6 (15.4%) | 162.0 |
| Total | 39 (100.0%) | 55.0 |
Fertility by Education by Marriage Status in Georgetown
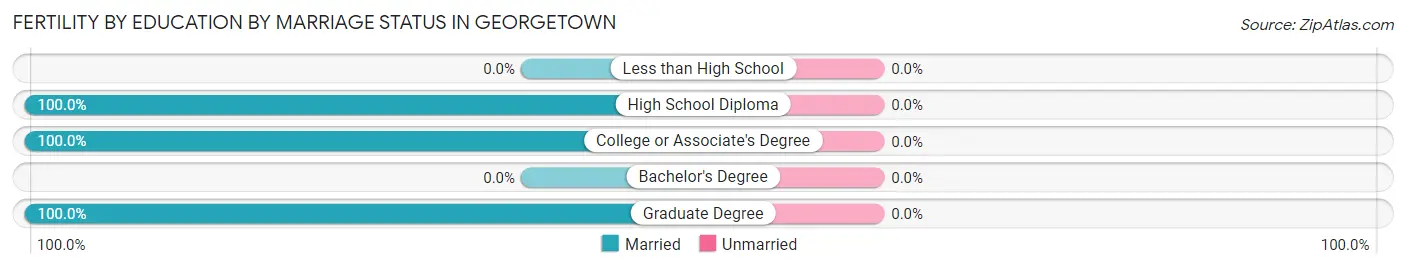
| Educational Attainment | Married | Unmarried |
| Less than High School | 0 (0.0%) | 0 (0.0%) |
| High School Diploma | 19 (100.0%) | 0 (0.0%) |
| College or Associate's Degree | 14 (100.0%) | 0 (0.0%) |
| Bachelor's Degree | 0 (0.0%) | 0 (0.0%) |
| Graduate Degree | 6 (100.0%) | 0 (0.0%) |
| Total | 39 (100.0%) | 0 (0.0%) |
Employment Characteristics in Georgetown
Employment by Class of Employer in Georgetown
Among the 1,632 employed individuals in Georgetown, private company employees (1,332 | 81.6%), local government employees (119 | 7.3%), and not-for-profit organizations (98 | 6.0%) make up the most common classes of employment.
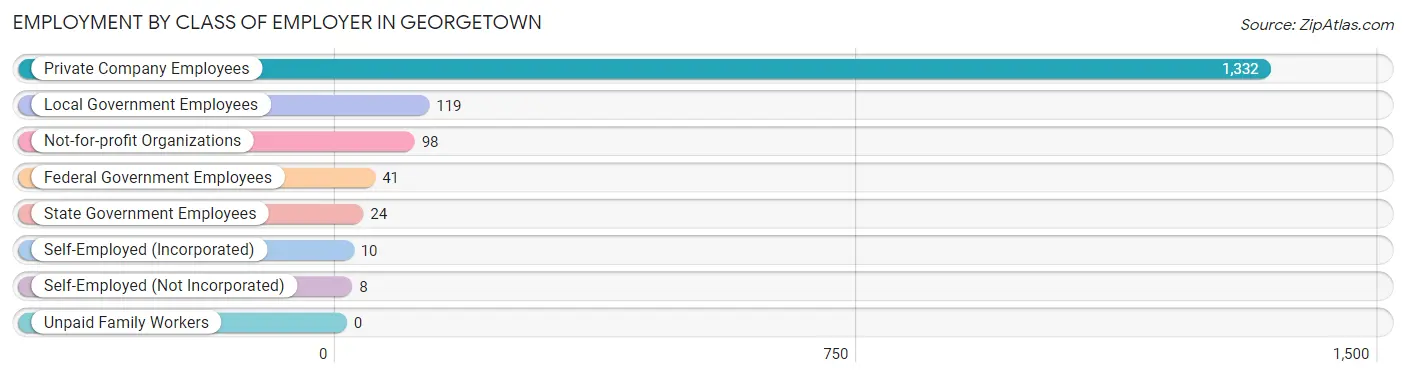
| Employer Class | # Employees | % Employees |
| Private Company Employees | 1,332 | 81.6% |
| Self-Employed (Incorporated) | 10 | 0.6% |
| Self-Employed (Not Incorporated) | 8 | 0.5% |
| Not-for-profit Organizations | 98 | 6.0% |
| Local Government Employees | 119 | 7.3% |
| State Government Employees | 24 | 1.5% |
| Federal Government Employees | 41 | 2.5% |
| Unpaid Family Workers | 0 | 0.0% |
| Total | 1,632 | 100.0% |
Employment Status by Age in Georgetown
According to the labor force statistics for Georgetown, out of the total population over 16 years of age (2,620), 64.6% or 1,693 individuals are in the labor force, with 1.2% or 20 of them unemployed. The age group with the highest labor force participation rate is 25 to 29 years, with 90.2% or 193 individuals in the labor force. Within the labor force, the 30 to 34 years age range has the highest percentage of unemployed individuals, with 5.0% or 8 of them being unemployed.
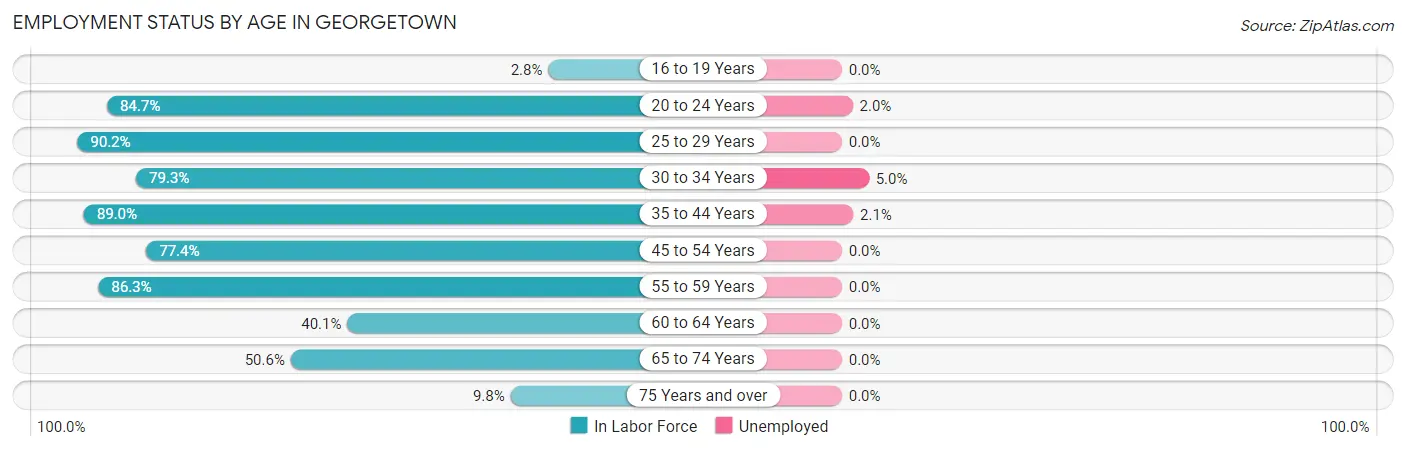
| Age Bracket | In Labor Force | Unemployed |
| 16 to 19 Years | 6 (2.8%) | 0 (0.0%) |
| 20 to 24 Years | 205 (84.7%) | 4 (2.0%) |
| 25 to 29 Years | 193 (90.2%) | 0 (0.0%) |
| 30 to 34 Years | 161 (79.3%) | 8 (5.0%) |
| 35 to 44 Years | 439 (89.0%) | 9 (2.1%) |
| 45 to 54 Years | 350 (77.4%) | 0 (0.0%) |
| 55 to 59 Years | 120 (86.3%) | 0 (0.0%) |
| 60 to 64 Years | 61 (40.1%) | 0 (0.0%) |
| 65 to 74 Years | 133 (50.6%) | 0 (0.0%) |
| 75 Years and over | 24 (9.8%) | 0 (0.0%) |
| Total | 1,693 (64.6%) | 20 (1.2%) |
Employment Status by Educational Attainment in Georgetown
According to labor force statistics for Georgetown, 80.1% of individuals (1,324) out of the total population between 25 and 64 years of age (1,653) are in the labor force, with 1.3% or 17 of them being unemployed. The group with the highest labor force participation rate are those with the educational attainment of bachelor's degree or higher, with 90.8% or 533 individuals in the labor force. Within the labor force, individuals with college / associate degree education have the highest percentage of unemployment, with 3.6% or 17 of them being unemployed.
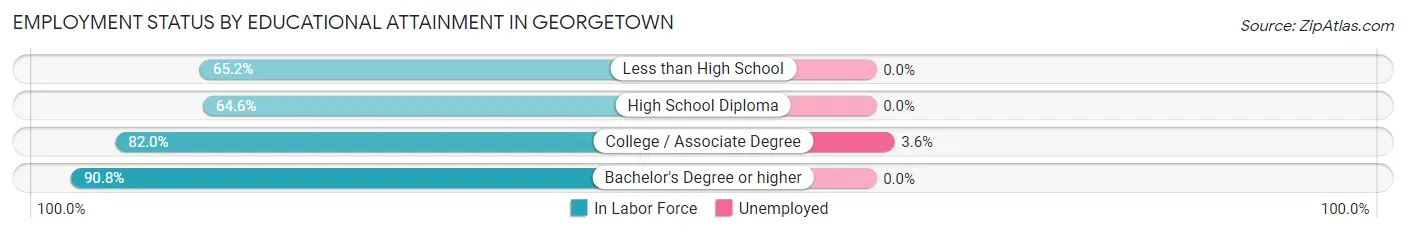
| Educational Attainment | In Labor Force | Unemployed |
| Less than High School | 90 (65.2%) | 0 (0.0%) |
| High School Diploma | 223 (64.6%) | 0 (0.0%) |
| College / Associate Degree | 478 (82.0%) | 21 (3.6%) |
| Bachelor's Degree or higher | 533 (90.8%) | 0 (0.0%) |
| Total | 1,324 (80.1%) | 21 (1.3%) |
Employment Occupations by Sex in Georgetown
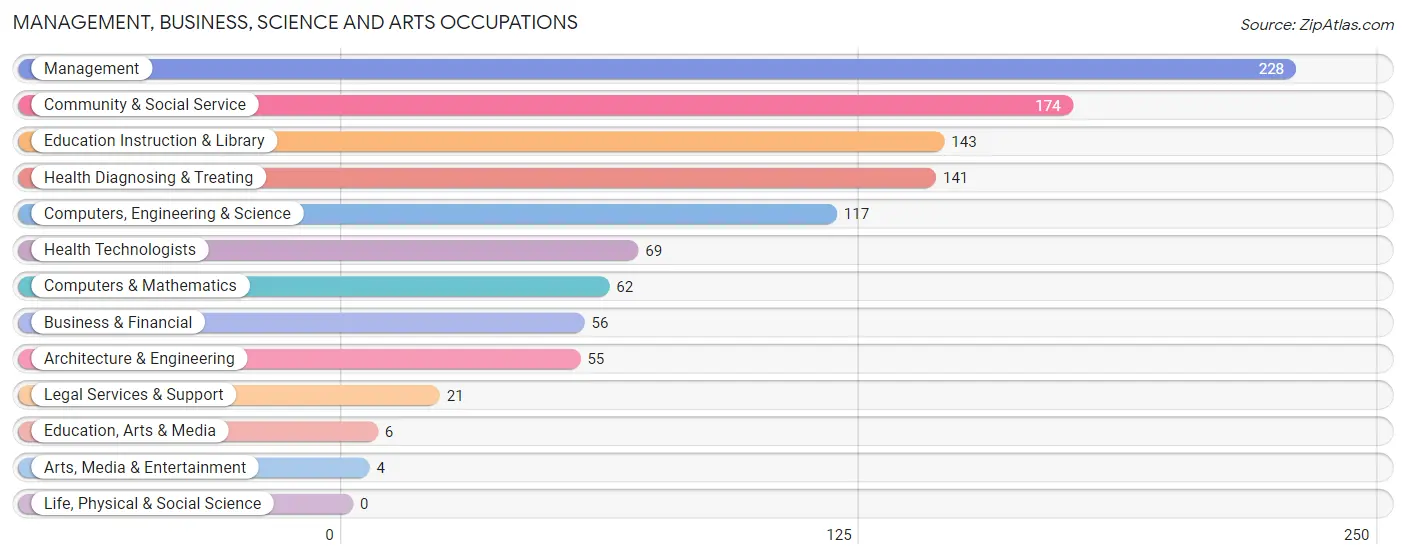
Management, Business, Science and Arts Occupations
The most common Management, Business, Science and Arts occupations in Georgetown are Management (228 | 13.6%), Community & Social Service (174 | 10.4%), Education Instruction & Library (143 | 8.6%), Health Diagnosing & Treating (141 | 8.4%), and Computers, Engineering & Science (117 | 7.0%).
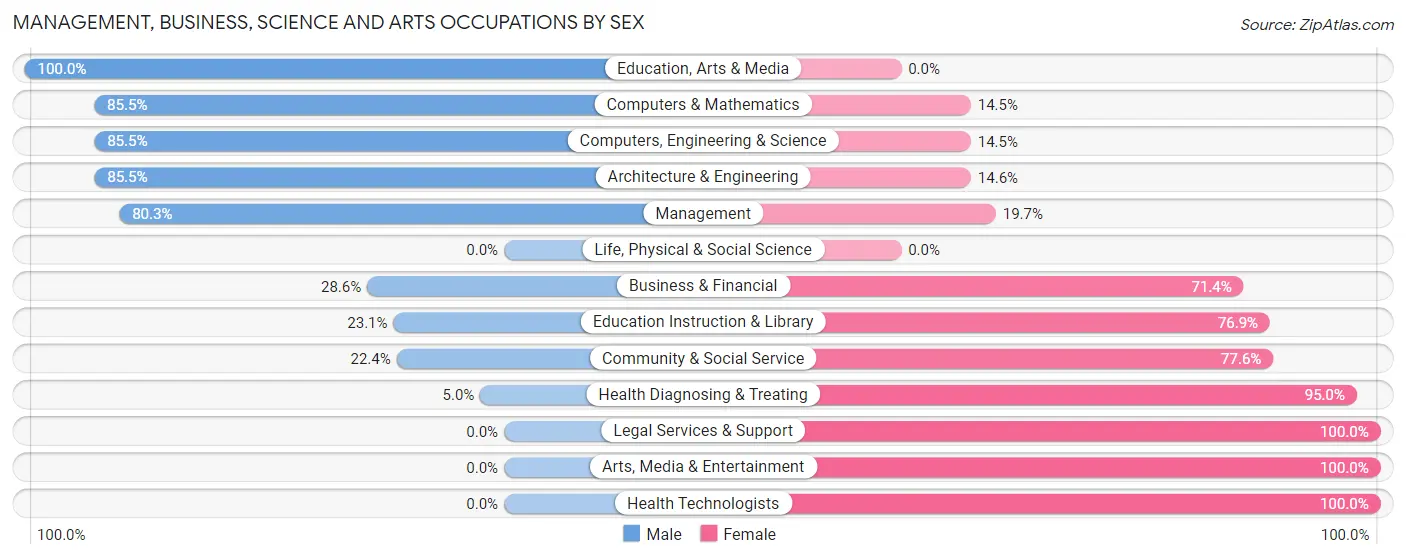
Management, Business, Science and Arts Occupations by Sex
Within the Management, Business, Science and Arts occupations in Georgetown, the most male-oriented occupations are Education, Arts & Media (100.0%), Computers & Mathematics (85.5%), and Computers, Engineering & Science (85.5%), while the most female-oriented occupations are Legal Services & Support (100.0%), Arts, Media & Entertainment (100.0%), and Health Technologists (100.0%).
| Occupation | Male | Female |
| Management | 183 (80.3%) | 45 (19.7%) |
| Business & Financial | 16 (28.6%) | 40 (71.4%) |
| Computers, Engineering & Science | 100 (85.5%) | 17 (14.5%) |
| Computers & Mathematics | 53 (85.5%) | 9 (14.5%) |
| Architecture & Engineering | 47 (85.5%) | 8 (14.5%) |
| Life, Physical & Social Science | 0 (0.0%) | 0 (0.0%) |
| Community & Social Service | 39 (22.4%) | 135 (77.6%) |
| Education, Arts & Media | 6 (100.0%) | 0 (0.0%) |
| Legal Services & Support | 0 (0.0%) | 21 (100.0%) |
| Education Instruction & Library | 33 (23.1%) | 110 (76.9%) |
| Arts, Media & Entertainment | 0 (0.0%) | 4 (100.0%) |
| Health Diagnosing & Treating | 7 (5.0%) | 134 (95.0%) |
| Health Technologists | 0 (0.0%) | 69 (100.0%) |
| Total (Category) | 345 (48.2%) | 371 (51.8%) |
| Total (Overall) | 925 (55.4%) | 746 (44.6%) |
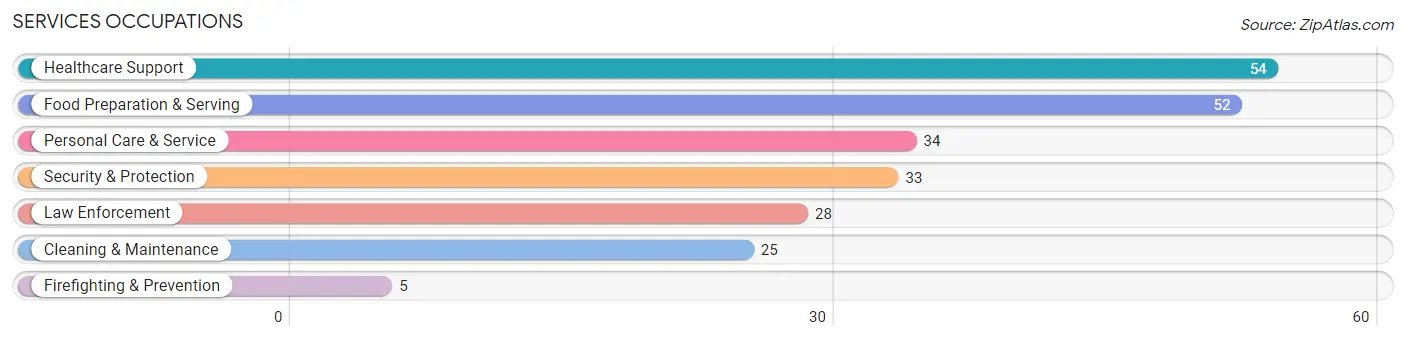
Services Occupations
The most common Services occupations in Georgetown are Healthcare Support (54 | 3.2%), Food Preparation & Serving (52 | 3.1%), Personal Care & Service (34 | 2.0%), Security & Protection (33 | 2.0%), and Law Enforcement (28 | 1.7%).
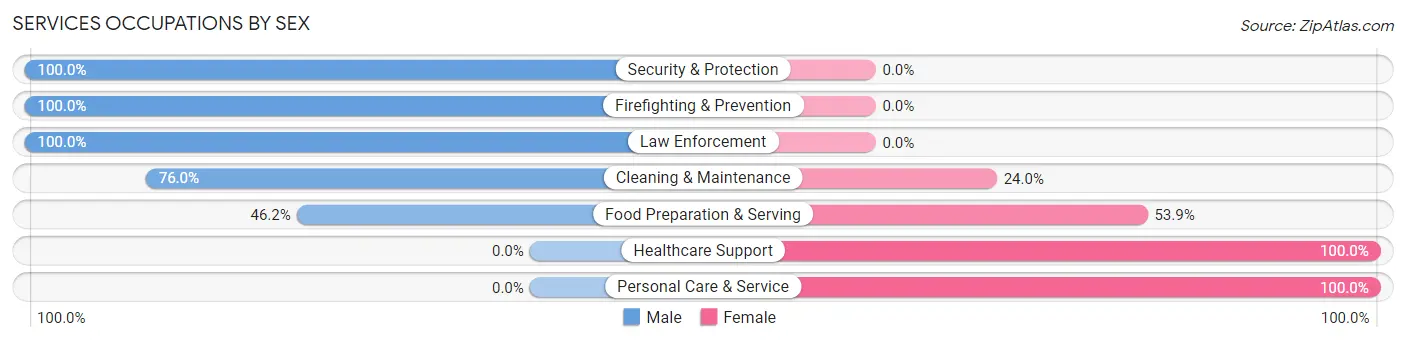
Services Occupations by Sex
Within the Services occupations in Georgetown, the most male-oriented occupations are Security & Protection (100.0%), Firefighting & Prevention (100.0%), and Law Enforcement (100.0%), while the most female-oriented occupations are Healthcare Support (100.0%), Personal Care & Service (100.0%), and Food Preparation & Serving (53.8%).
| Occupation | Male | Female |
| Healthcare Support | 0 (0.0%) | 54 (100.0%) |
| Security & Protection | 33 (100.0%) | 0 (0.0%) |
| Firefighting & Prevention | 5 (100.0%) | 0 (0.0%) |
| Law Enforcement | 28 (100.0%) | 0 (0.0%) |
| Food Preparation & Serving | 24 (46.2%) | 28 (53.8%) |
| Cleaning & Maintenance | 19 (76.0%) | 6 (24.0%) |
| Personal Care & Service | 0 (0.0%) | 34 (100.0%) |
| Total (Category) | 76 (38.4%) | 122 (61.6%) |
| Total (Overall) | 925 (55.4%) | 746 (44.6%) |
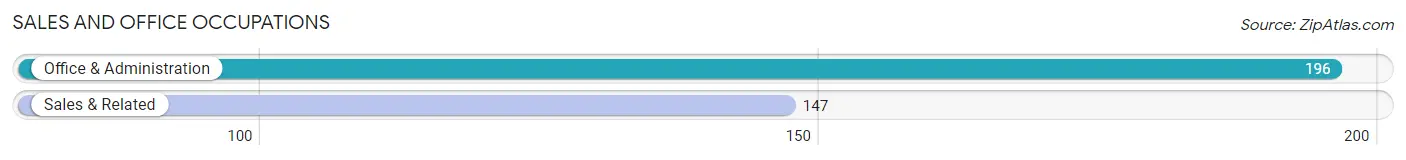
Sales and Office Occupations
The most common Sales and Office occupations in Georgetown are Office & Administration (196 | 11.7%), and Sales & Related (147 | 8.8%).
Sales and Office Occupations by Sex

| Occupation | Male | Female |
| Sales & Related | 92 (62.6%) | 55 (37.4%) |
| Office & Administration | 27 (13.8%) | 169 (86.2%) |
| Total (Category) | 119 (34.7%) | 224 (65.3%) |
| Total (Overall) | 925 (55.4%) | 746 (44.6%) |
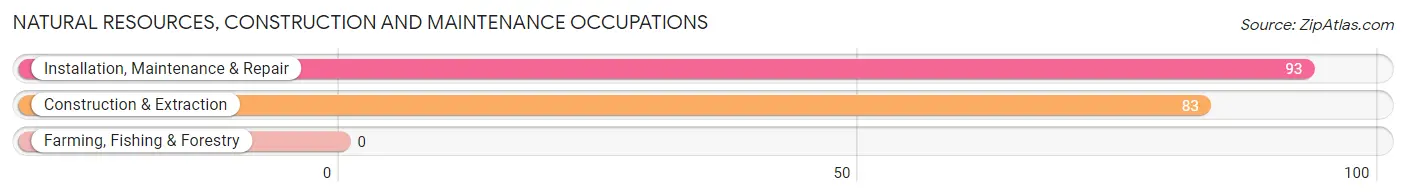
Natural Resources, Construction and Maintenance Occupations
The most common Natural Resources, Construction and Maintenance occupations in Georgetown are Installation, Maintenance & Repair (93 | 5.6%), and Construction & Extraction (83 | 5.0%).
Natural Resources, Construction and Maintenance Occupations by Sex
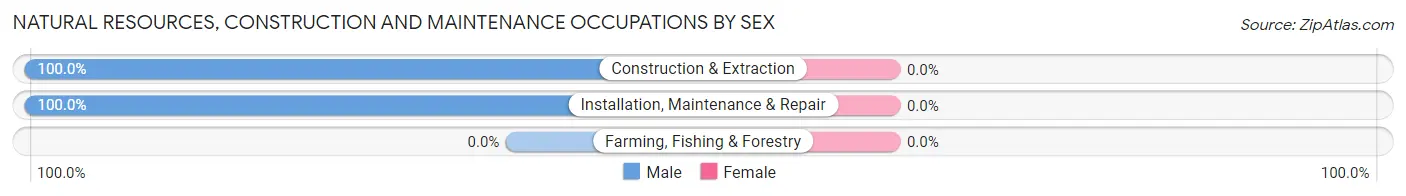
| Occupation | Male | Female |
| Farming, Fishing & Forestry | 0 (0.0%) | 0 (0.0%) |
| Construction & Extraction | 83 (100.0%) | 0 (0.0%) |
| Installation, Maintenance & Repair | 93 (100.0%) | 0 (0.0%) |
| Total (Category) | 176 (100.0%) | 0 (0.0%) |
| Total (Overall) | 925 (55.4%) | 746 (44.6%) |
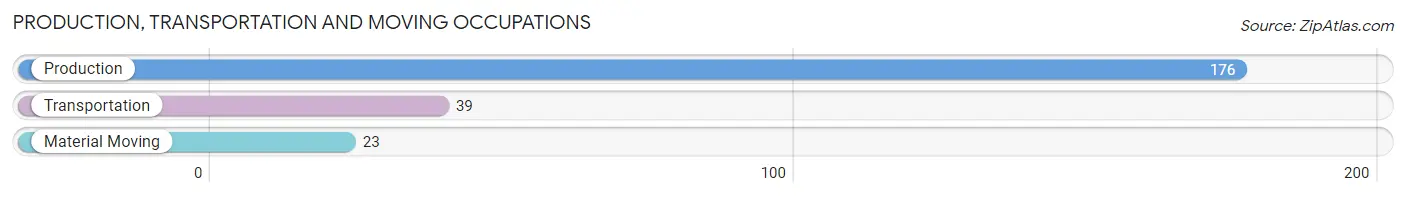
Production, Transportation and Moving Occupations
The most common Production, Transportation and Moving occupations in Georgetown are Production (176 | 10.5%), Transportation (39 | 2.3%), and Material Moving (23 | 1.4%).
Production, Transportation and Moving Occupations by Sex
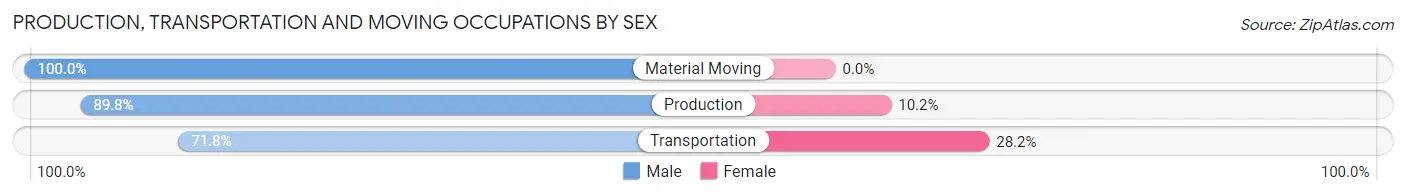
| Occupation | Male | Female |
| Production | 158 (89.8%) | 18 (10.2%) |
| Transportation | 28 (71.8%) | 11 (28.2%) |
| Material Moving | 23 (100.0%) | 0 (0.0%) |
| Total (Category) | 209 (87.8%) | 29 (12.2%) |
| Total (Overall) | 925 (55.4%) | 746 (44.6%) |
Employment Industries by Sex in Georgetown
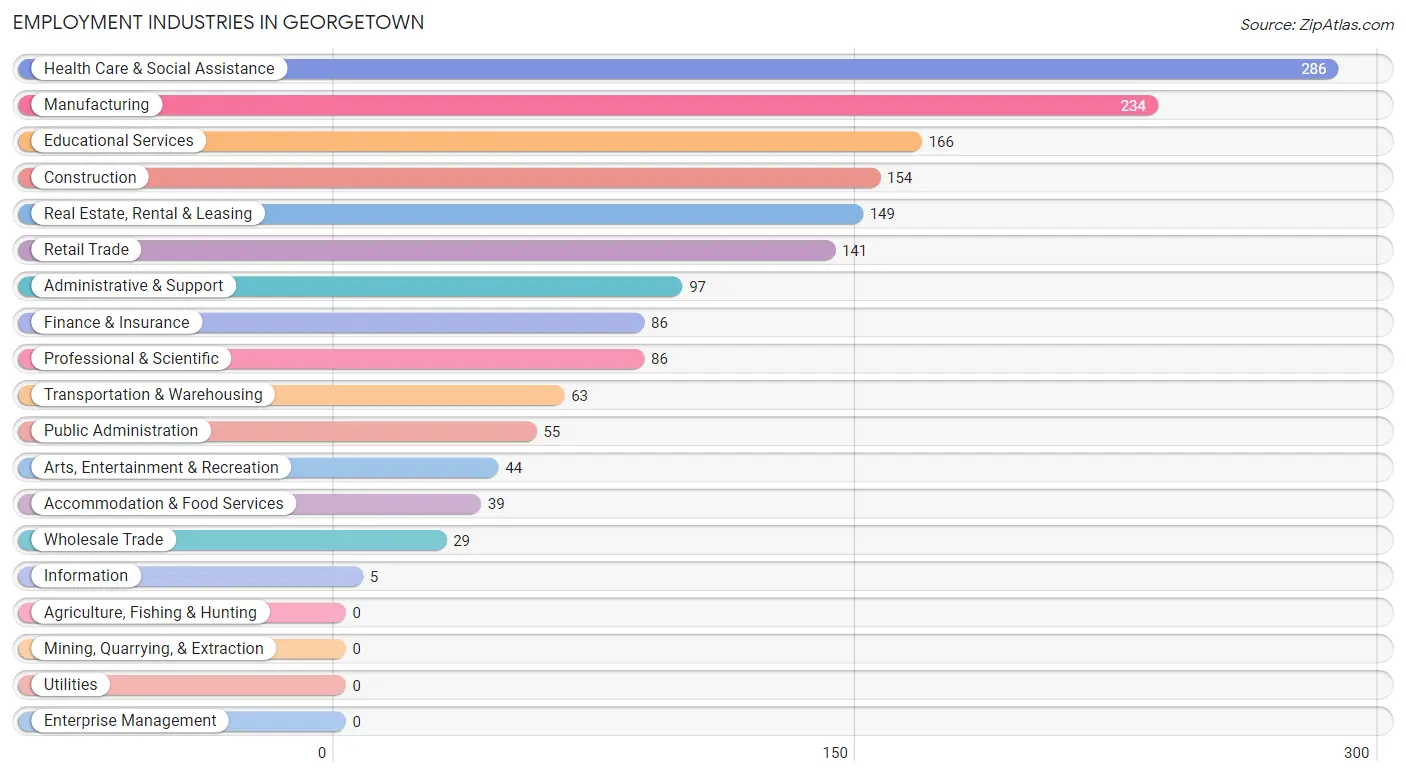
Employment Industries in Georgetown
The major employment industries in Georgetown include Health Care & Social Assistance (286 | 17.1%), Manufacturing (234 | 14.0%), Educational Services (166 | 9.9%), Construction (154 | 9.2%), and Real Estate, Rental & Leasing (149 | 8.9%).
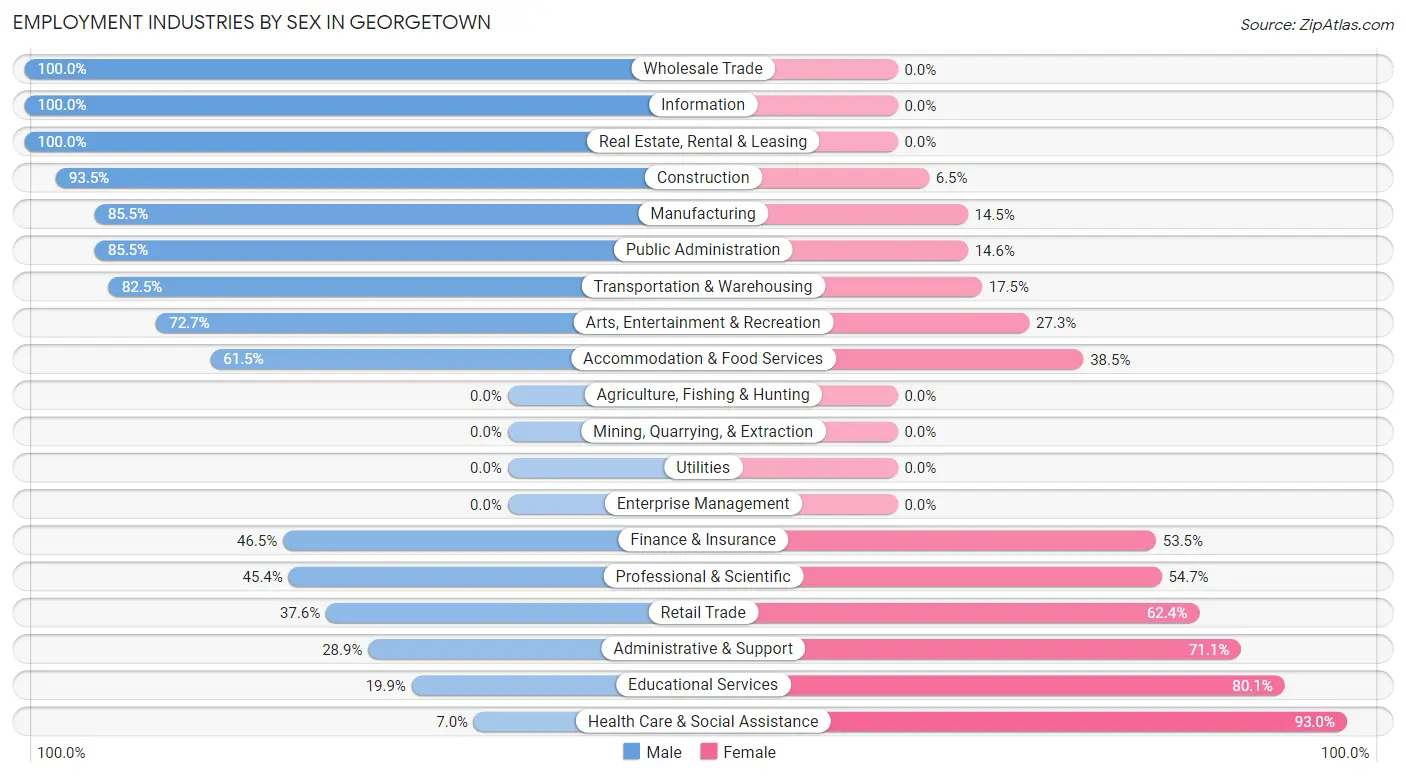
Employment Industries by Sex in Georgetown
The Georgetown industries that see more men than women are Wholesale Trade (100.0%), Information (100.0%), and Real Estate, Rental & Leasing (100.0%), whereas the industries that tend to have a higher number of women are Health Care & Social Assistance (93.0%), Educational Services (80.1%), and Administrative & Support (71.1%).
| Industry | Male | Female |
| Agriculture, Fishing & Hunting | 0 (0.0%) | 0 (0.0%) |
| Mining, Quarrying, & Extraction | 0 (0.0%) | 0 (0.0%) |
| Construction | 144 (93.5%) | 10 (6.5%) |
| Manufacturing | 200 (85.5%) | 34 (14.5%) |
| Wholesale Trade | 29 (100.0%) | 0 (0.0%) |
| Retail Trade | 53 (37.6%) | 88 (62.4%) |
| Transportation & Warehousing | 52 (82.5%) | 11 (17.5%) |
| Utilities | 0 (0.0%) | 0 (0.0%) |
| Information | 5 (100.0%) | 0 (0.0%) |
| Finance & Insurance | 40 (46.5%) | 46 (53.5%) |
| Real Estate, Rental & Leasing | 149 (100.0%) | 0 (0.0%) |
| Professional & Scientific | 39 (45.4%) | 47 (54.6%) |
| Enterprise Management | 0 (0.0%) | 0 (0.0%) |
| Administrative & Support | 28 (28.9%) | 69 (71.1%) |
| Educational Services | 33 (19.9%) | 133 (80.1%) |
| Health Care & Social Assistance | 20 (7.0%) | 266 (93.0%) |
| Arts, Entertainment & Recreation | 32 (72.7%) | 12 (27.3%) |
| Accommodation & Food Services | 24 (61.5%) | 15 (38.5%) |
| Public Administration | 47 (85.5%) | 8 (14.5%) |
| Total | 925 (55.4%) | 746 (44.6%) |
Education in Georgetown
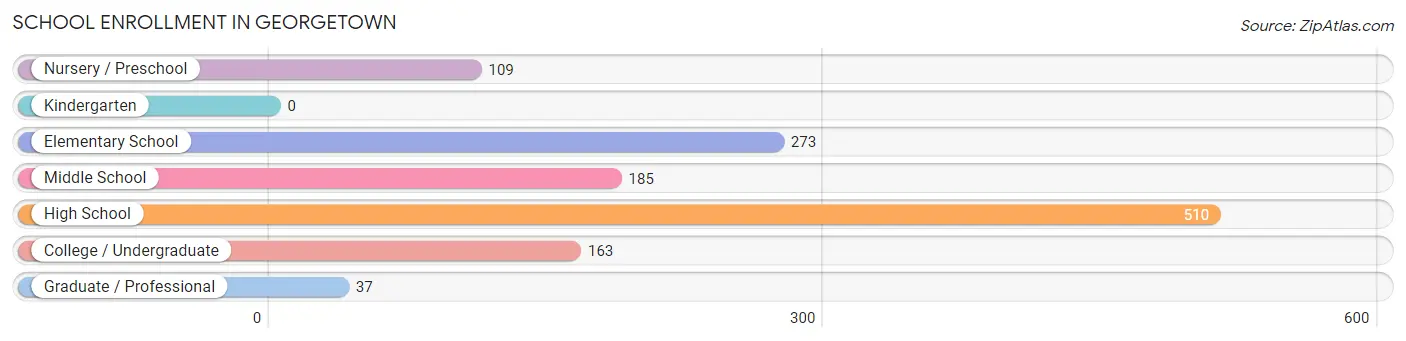
School Enrollment in Georgetown
The most common levels of schooling among the 1,277 students in Georgetown are high school (510 | 39.9%), elementary school (273 | 21.4%), and middle school (185 | 14.5%).
| School Level | # Students | % Students |
| Nursery / Preschool | 109 | 8.5% |
| Kindergarten | 0 | 0.0% |
| Elementary School | 273 | 21.4% |
| Middle School | 185 | 14.5% |
| High School | 510 | 39.9% |
| College / Undergraduate | 163 | 12.8% |
| Graduate / Professional | 37 | 2.9% |
| Total | 1,277 | 100.0% |
School Enrollment by Age by Funding Source in Georgetown
Out of a total of 1,277 students who are enrolled in schools in Georgetown, 153 (12.0%) attend a private institution, while the remaining 1,124 (88.0%) are enrolled in public schools. The age group of 3 to 4 year olds has the highest likelihood of being enrolled in private schools, with 78 (87.6% in the age bracket) enrolled. Conversely, the age group of 10 to 14 year olds has the lowest likelihood of being enrolled in a private school, with 450 (100.0% in the age bracket) attending a public institution.
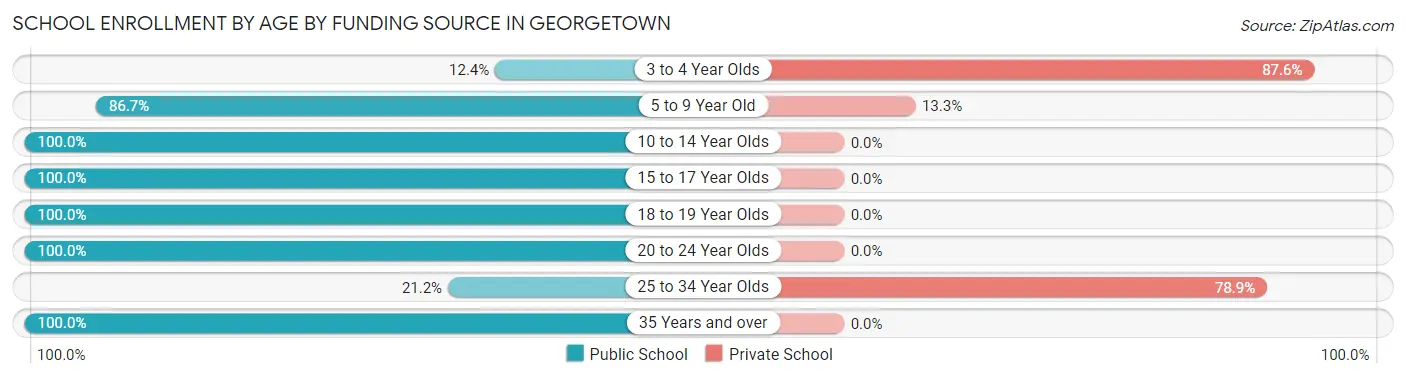
| Age Bracket | Public School | Private School |
| 3 to 4 Year Olds | 11 (12.4%) | 78 (87.6%) |
| 5 to 9 Year Old | 222 (86.7%) | 34 (13.3%) |
| 10 to 14 Year Olds | 450 (100.0%) | 0 (0.0%) |
| 15 to 17 Year Olds | 282 (100.0%) | 0 (0.0%) |
| 18 to 19 Year Olds | 27 (100.0%) | 0 (0.0%) |
| 20 to 24 Year Olds | 61 (100.0%) | 0 (0.0%) |
| 25 to 34 Year Olds | 11 (21.1%) | 41 (78.8%) |
| 35 Years and over | 60 (100.0%) | 0 (0.0%) |
| Total | 1,124 (88.0%) | 153 (12.0%) |
Educational Attainment by Field of Study in Georgetown
Communications (163 | 24.3%), science & technology (138 | 20.6%), education (104 | 15.5%), business (87 | 13.0%), and bio, nature & agricultural (41 | 6.1%) are the most common fields of study among 670 individuals in Georgetown who have obtained a bachelor's degree or higher.
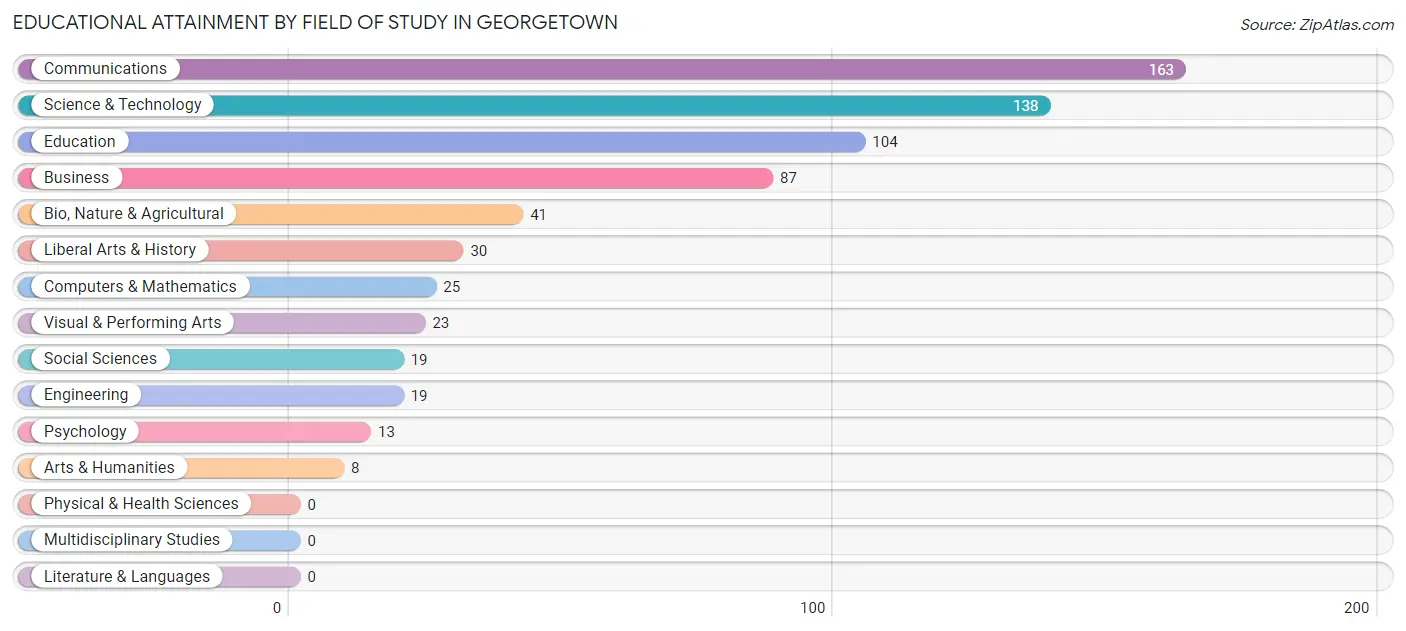
| Field of Study | # Graduates | % Graduates |
| Computers & Mathematics | 25 | 3.7% |
| Bio, Nature & Agricultural | 41 | 6.1% |
| Physical & Health Sciences | 0 | 0.0% |
| Psychology | 13 | 1.9% |
| Social Sciences | 19 | 2.8% |
| Engineering | 19 | 2.8% |
| Multidisciplinary Studies | 0 | 0.0% |
| Science & Technology | 138 | 20.6% |
| Business | 87 | 13.0% |
| Education | 104 | 15.5% |
| Literature & Languages | 0 | 0.0% |
| Liberal Arts & History | 30 | 4.5% |
| Visual & Performing Arts | 23 | 3.4% |
| Communications | 163 | 24.3% |
| Arts & Humanities | 8 | 1.2% |
| Total | 670 | 100.0% |
Transportation & Commute in Georgetown
Vehicle Availability by Sex in Georgetown
The most prevalent vehicle ownership categories in Georgetown are males with 2 vehicles (383, accounting for 43.2%) and females with 2 vehicles (336, making up 51.3%).
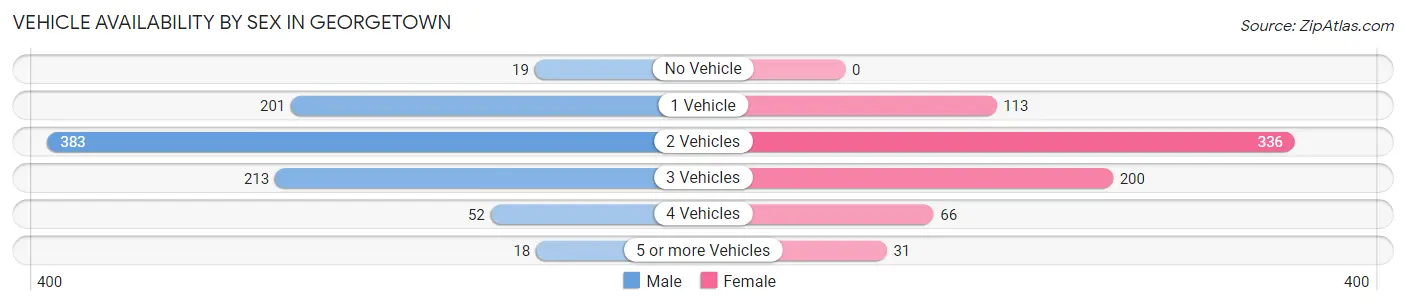
| Vehicles Available | Male | Female |
| No Vehicle | 19 (2.1%) | 0 (0.0%) |
| 1 Vehicle | 201 (22.7%) | 113 (15.1%) |
| 2 Vehicles | 383 (43.2%) | 336 (45.0%) |
| 3 Vehicles | 213 (24.0%) | 200 (26.8%) |
| 4 Vehicles | 52 (5.9%) | 66 (8.8%) |
| 5 or more Vehicles | 18 (2.0%) | 31 (4.2%) |
| Total | 886 (100.0%) | 746 (100.0%) |
Commute Time in Georgetown
The most frequently occuring commute durations in Georgetown are 20 to 24 minutes (308 commuters, 21.8%), 25 to 29 minutes (307 commuters, 21.8%), and 30 to 34 minutes (264 commuters, 18.7%).
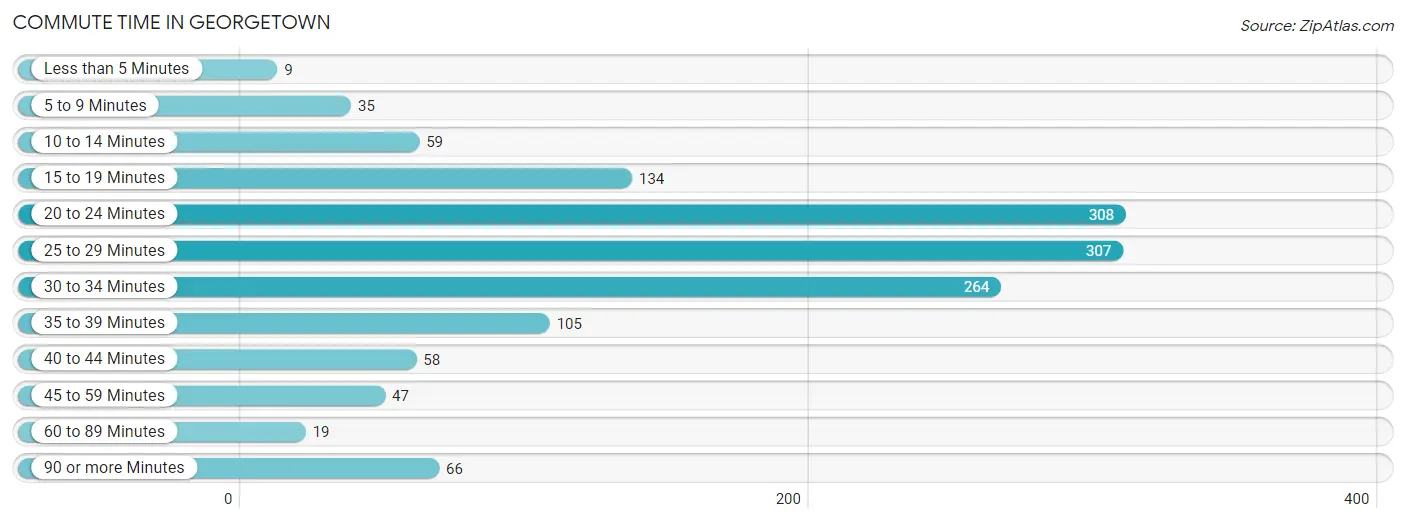
| Commute Time | # Commuters | % Commuters |
| Less than 5 Minutes | 9 | 0.6% |
| 5 to 9 Minutes | 35 | 2.5% |
| 10 to 14 Minutes | 59 | 4.2% |
| 15 to 19 Minutes | 134 | 9.5% |
| 20 to 24 Minutes | 308 | 21.8% |
| 25 to 29 Minutes | 307 | 21.8% |
| 30 to 34 Minutes | 264 | 18.7% |
| 35 to 39 Minutes | 105 | 7.4% |
| 40 to 44 Minutes | 58 | 4.1% |
| 45 to 59 Minutes | 47 | 3.3% |
| 60 to 89 Minutes | 19 | 1.3% |
| 90 or more Minutes | 66 | 4.7% |
Commute Time by Sex in Georgetown
The most common commute times in Georgetown are 25 to 29 minutes (232 commuters, 29.0%) for males and 30 to 34 minutes (149 commuters, 24.3%) for females.
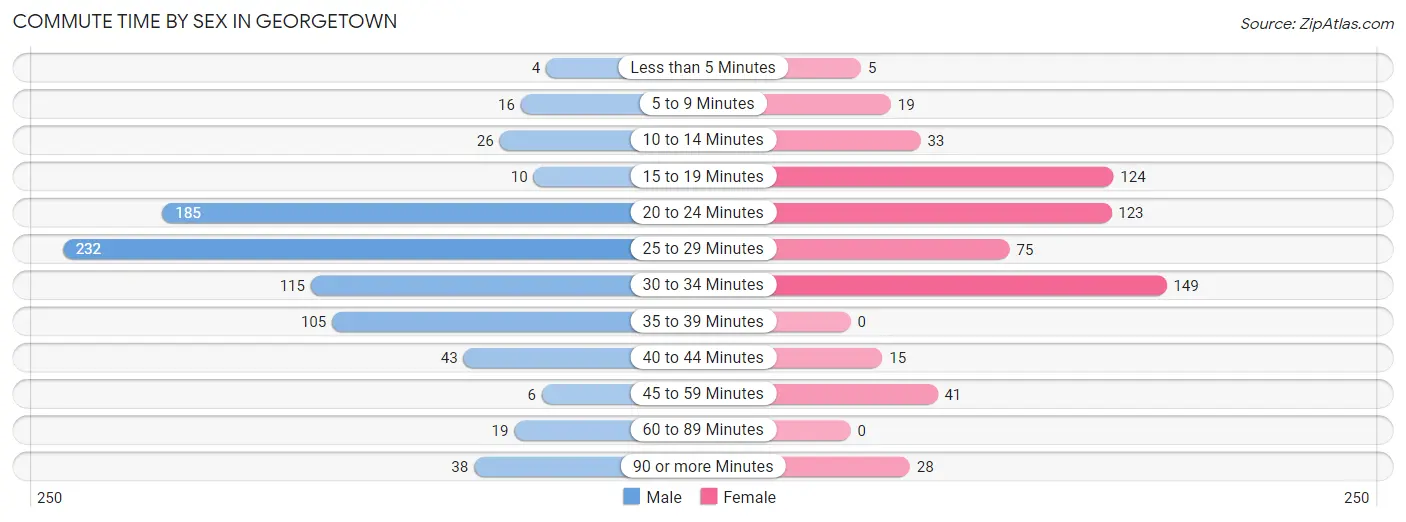
| Commute Time | Male | Female |
| Less than 5 Minutes | 4 (0.5%) | 5 (0.8%) |
| 5 to 9 Minutes | 16 (2.0%) | 19 (3.1%) |
| 10 to 14 Minutes | 26 (3.3%) | 33 (5.4%) |
| 15 to 19 Minutes | 10 (1.3%) | 124 (20.3%) |
| 20 to 24 Minutes | 185 (23.2%) | 123 (20.1%) |
| 25 to 29 Minutes | 232 (29.0%) | 75 (12.2%) |
| 30 to 34 Minutes | 115 (14.4%) | 149 (24.3%) |
| 35 to 39 Minutes | 105 (13.1%) | 0 (0.0%) |
| 40 to 44 Minutes | 43 (5.4%) | 15 (2.5%) |
| 45 to 59 Minutes | 6 (0.7%) | 41 (6.7%) |
| 60 to 89 Minutes | 19 (2.4%) | 0 (0.0%) |
| 90 or more Minutes | 38 (4.8%) | 28 (4.6%) |
Time of Departure to Work by Sex in Georgetown
The most frequent times of departure to work in Georgetown are 9:00 AM to 9:59 AM (169, 21.1%) for males and 7:00 AM to 7:29 AM (141, 23.0%) for females.
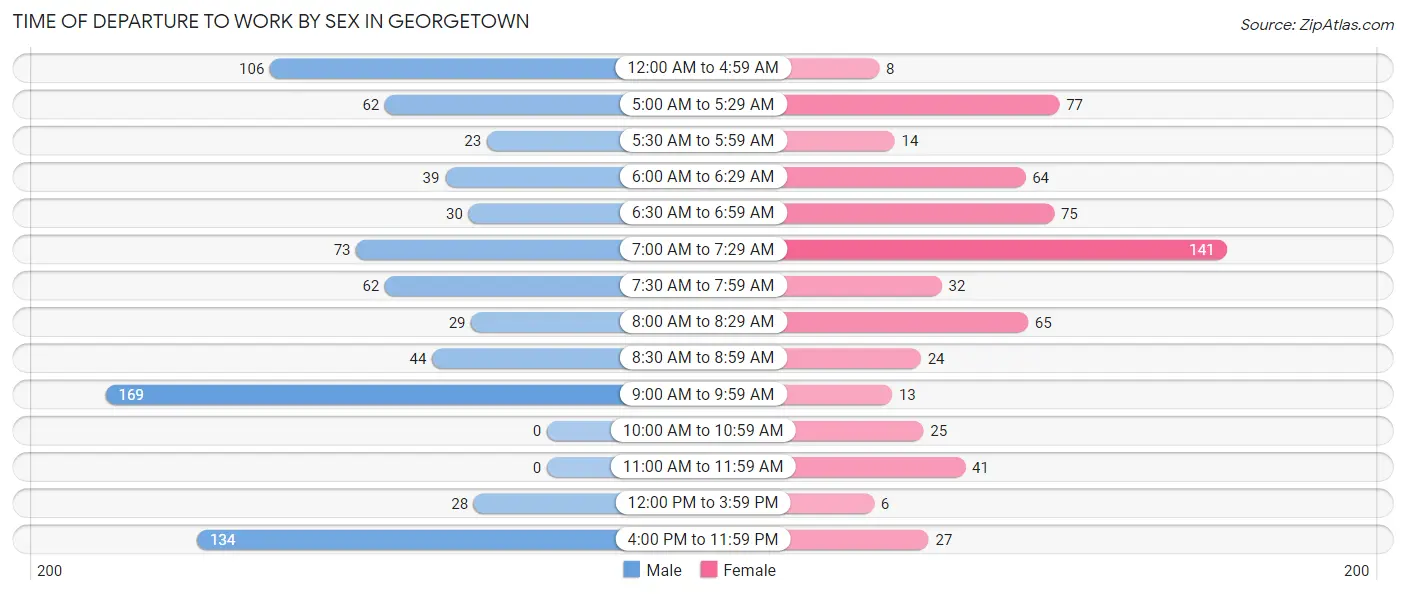
| Time of Departure | Male | Female |
| 12:00 AM to 4:59 AM | 106 (13.3%) | 8 (1.3%) |
| 5:00 AM to 5:29 AM | 62 (7.8%) | 77 (12.6%) |
| 5:30 AM to 5:59 AM | 23 (2.9%) | 14 (2.3%) |
| 6:00 AM to 6:29 AM | 39 (4.9%) | 64 (10.5%) |
| 6:30 AM to 6:59 AM | 30 (3.7%) | 75 (12.2%) |
| 7:00 AM to 7:29 AM | 73 (9.1%) | 141 (23.0%) |
| 7:30 AM to 7:59 AM | 62 (7.8%) | 32 (5.2%) |
| 8:00 AM to 8:29 AM | 29 (3.6%) | 65 (10.6%) |
| 8:30 AM to 8:59 AM | 44 (5.5%) | 24 (3.9%) |
| 9:00 AM to 9:59 AM | 169 (21.1%) | 13 (2.1%) |
| 10:00 AM to 10:59 AM | 0 (0.0%) | 25 (4.1%) |
| 11:00 AM to 11:59 AM | 0 (0.0%) | 41 (6.7%) |
| 12:00 PM to 3:59 PM | 28 (3.5%) | 6 (1.0%) |
| 4:00 PM to 11:59 PM | 134 (16.8%) | 27 (4.4%) |
| Total | 799 (100.0%) | 612 (100.0%) |
Housing Occupancy in Georgetown
Occupancy by Ownership in Georgetown
Of the total 1,301 dwellings in Georgetown, owner-occupied units account for 1,051 (80.8%), while renter-occupied units make up 250 (19.2%).
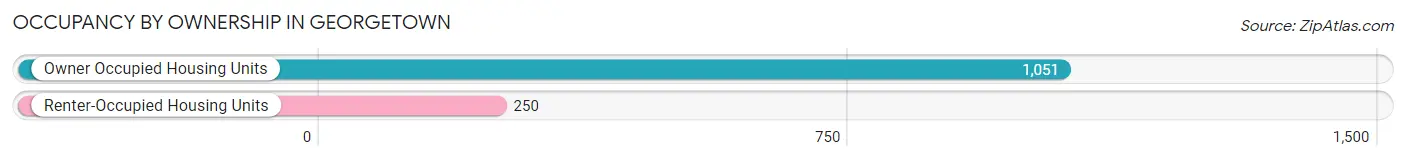
| Occupancy | # Housing Units | % Housing Units |
| Owner Occupied Housing Units | 1,051 | 80.8% |
| Renter-Occupied Housing Units | 250 | 19.2% |
| Total Occupied Housing Units | 1,301 | 100.0% |
Occupancy by Household Size in Georgetown
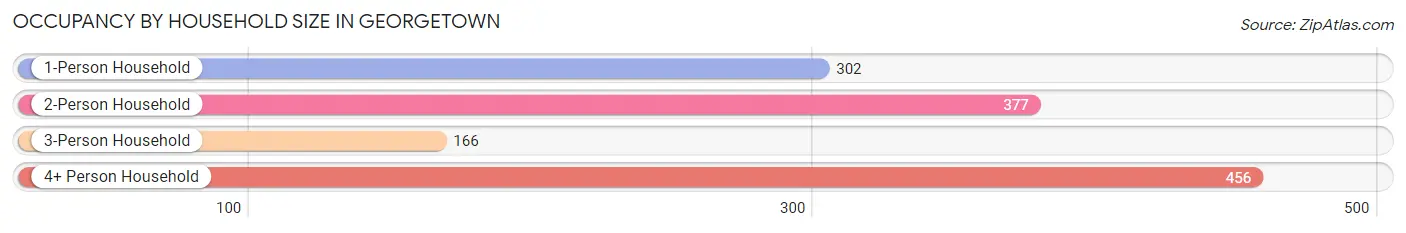
| Household Size | # Housing Units | % Housing Units |
| 1-Person Household | 302 | 23.2% |
| 2-Person Household | 377 | 29.0% |
| 3-Person Household | 166 | 12.8% |
| 4+ Person Household | 456 | 35.0% |
| Total Housing Units | 1,301 | 100.0% |
Occupancy by Ownership by Household Size in Georgetown
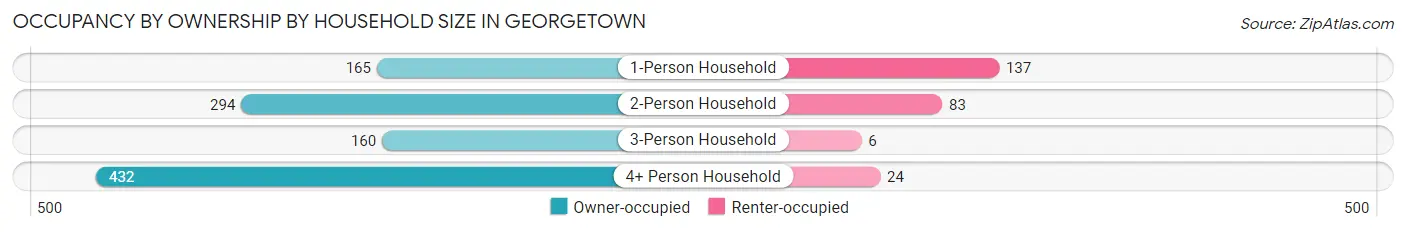
| Household Size | Owner-occupied | Renter-occupied |
| 1-Person Household | 165 (54.6%) | 137 (45.4%) |
| 2-Person Household | 294 (78.0%) | 83 (22.0%) |
| 3-Person Household | 160 (96.4%) | 6 (3.6%) |
| 4+ Person Household | 432 (94.7%) | 24 (5.3%) |
| Total Housing Units | 1,051 (80.8%) | 250 (19.2%) |
Occupancy by Educational Attainment in Georgetown
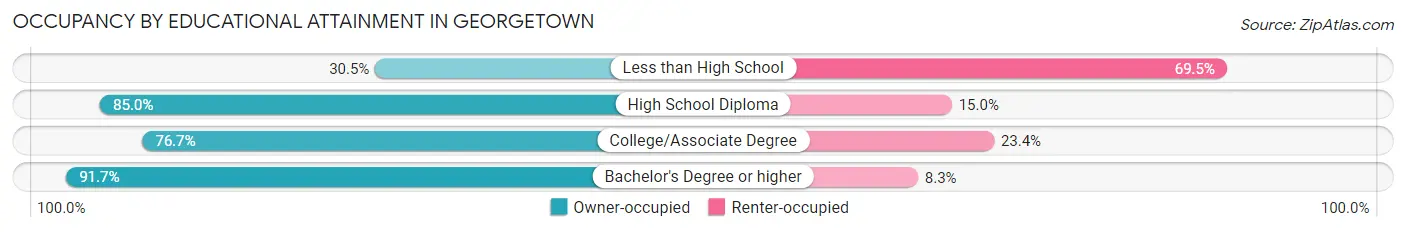
| Household Size | Owner-occupied | Renter-occupied |
| Less than High School | 25 (30.5%) | 57 (69.5%) |
| High School Diploma | 244 (85.0%) | 43 (15.0%) |
| College/Associate Degree | 371 (76.6%) | 113 (23.4%) |
| Bachelor's Degree or higher | 411 (91.7%) | 37 (8.3%) |
Occupancy by Age of Householder in Georgetown
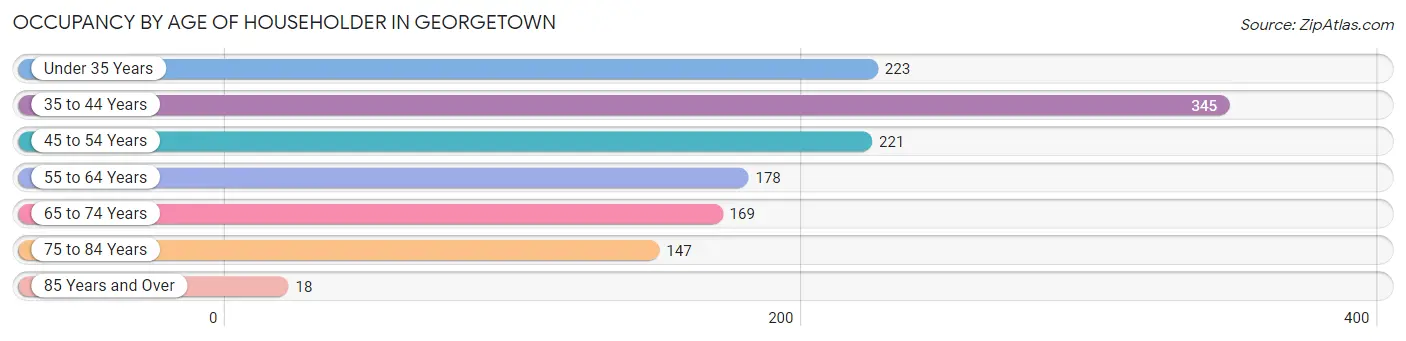
| Age Bracket | # Households | % Households |
| Under 35 Years | 223 | 17.1% |
| 35 to 44 Years | 345 | 26.5% |
| 45 to 54 Years | 221 | 17.0% |
| 55 to 64 Years | 178 | 13.7% |
| 65 to 74 Years | 169 | 13.0% |
| 75 to 84 Years | 147 | 11.3% |
| 85 Years and Over | 18 | 1.4% |
| Total | 1,301 | 100.0% |
Housing Finances in Georgetown
Median Income by Occupancy in Georgetown
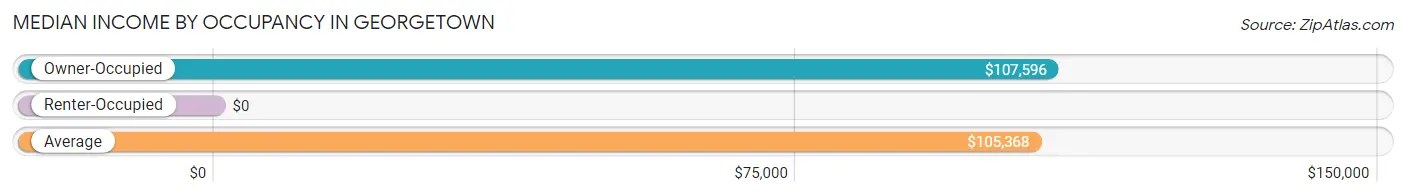
| Occupancy Type | # Households | Median Income |
| Owner-Occupied | 1,051 (80.8%) | $107,596 |
| Renter-Occupied | 250 (19.2%) | $0 |
| Average | 1,301 (100.0%) | $105,368 |
Occupancy by Householder Income Bracket in Georgetown
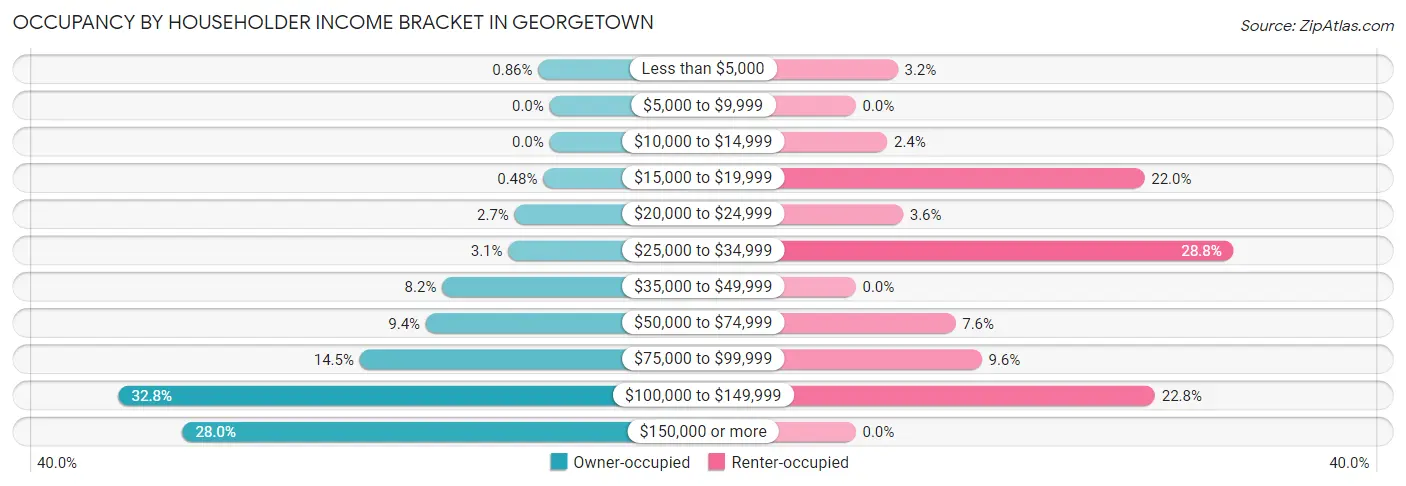
| Income Bracket | Owner-occupied | Renter-occupied |
| Less than $5,000 | 9 (0.9%) | 8 (3.2%) |
| $5,000 to $9,999 | 0 (0.0%) | 0 (0.0%) |
| $10,000 to $14,999 | 0 (0.0%) | 6 (2.4%) |
| $15,000 to $19,999 | 5 (0.5%) | 55 (22.0%) |
| $20,000 to $24,999 | 28 (2.7%) | 9 (3.6%) |
| $25,000 to $34,999 | 33 (3.1%) | 72 (28.8%) |
| $35,000 to $49,999 | 86 (8.2%) | 0 (0.0%) |
| $50,000 to $74,999 | 99 (9.4%) | 19 (7.6%) |
| $75,000 to $99,999 | 152 (14.5%) | 24 (9.6%) |
| $100,000 to $149,999 | 345 (32.8%) | 57 (22.8%) |
| $150,000 or more | 294 (28.0%) | 0 (0.0%) |
| Total | 1,051 (100.0%) | 250 (100.0%) |
Monthly Housing Cost Tiers in Georgetown
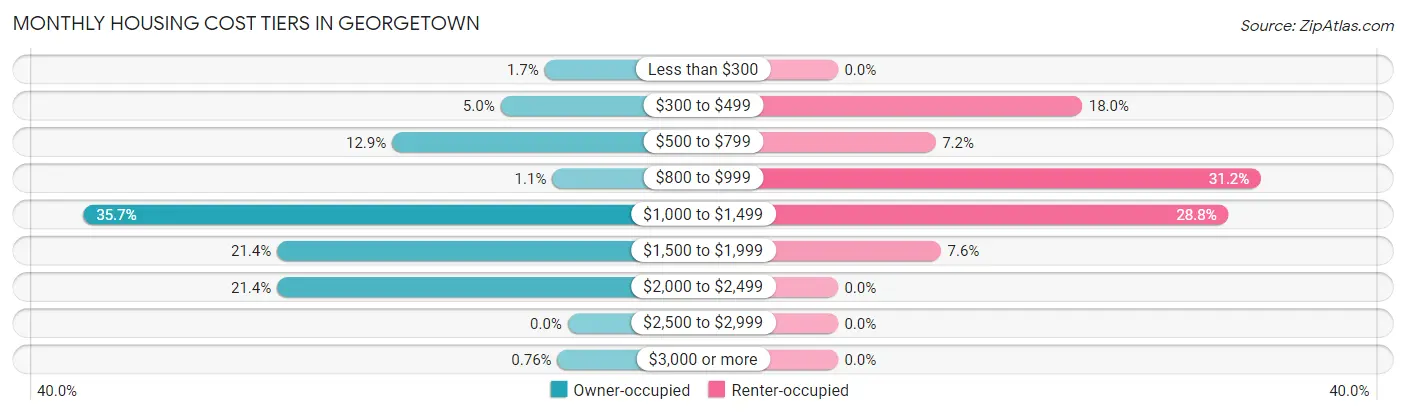
| Monthly Cost | Owner-occupied | Renter-occupied |
| Less than $300 | 18 (1.7%) | 0 (0.0%) |
| $300 to $499 | 52 (5.0%) | 45 (18.0%) |
| $500 to $799 | 136 (12.9%) | 18 (7.2%) |
| $800 to $999 | 12 (1.1%) | 78 (31.2%) |
| $1,000 to $1,499 | 375 (35.7%) | 72 (28.8%) |
| $1,500 to $1,999 | 225 (21.4%) | 19 (7.6%) |
| $2,000 to $2,499 | 225 (21.4%) | 0 (0.0%) |
| $2,500 to $2,999 | 0 (0.0%) | 0 (0.0%) |
| $3,000 or more | 8 (0.8%) | 0 (0.0%) |
| Total | 1,051 (100.0%) | 250 (100.0%) |
Physical Housing Characteristics in Georgetown
Housing Structures in Georgetown
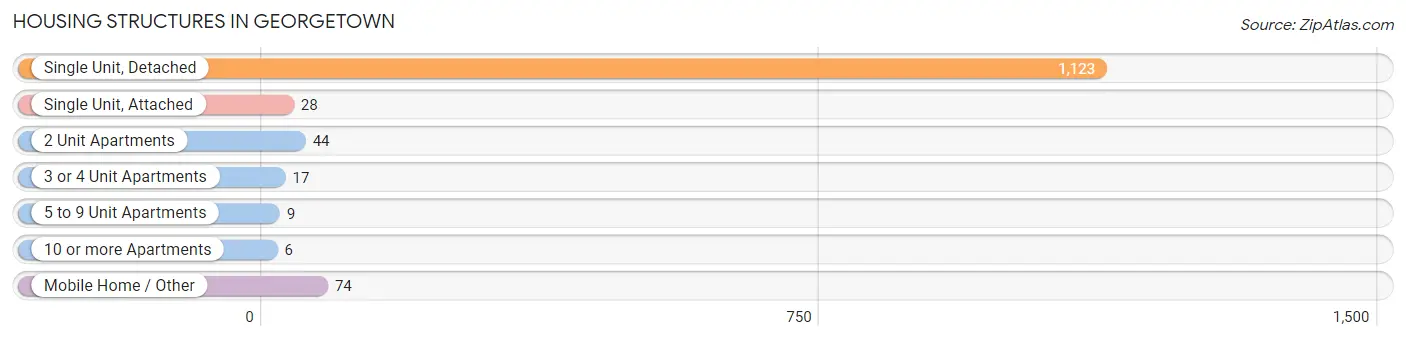
| Structure Type | # Housing Units | % Housing Units |
| Single Unit, Detached | 1,123 | 86.3% |
| Single Unit, Attached | 28 | 2.1% |
| 2 Unit Apartments | 44 | 3.4% |
| 3 or 4 Unit Apartments | 17 | 1.3% |
| 5 to 9 Unit Apartments | 9 | 0.7% |
| 10 or more Apartments | 6 | 0.5% |
| Mobile Home / Other | 74 | 5.7% |
| Total | 1,301 | 100.0% |
Housing Structures by Occupancy in Georgetown
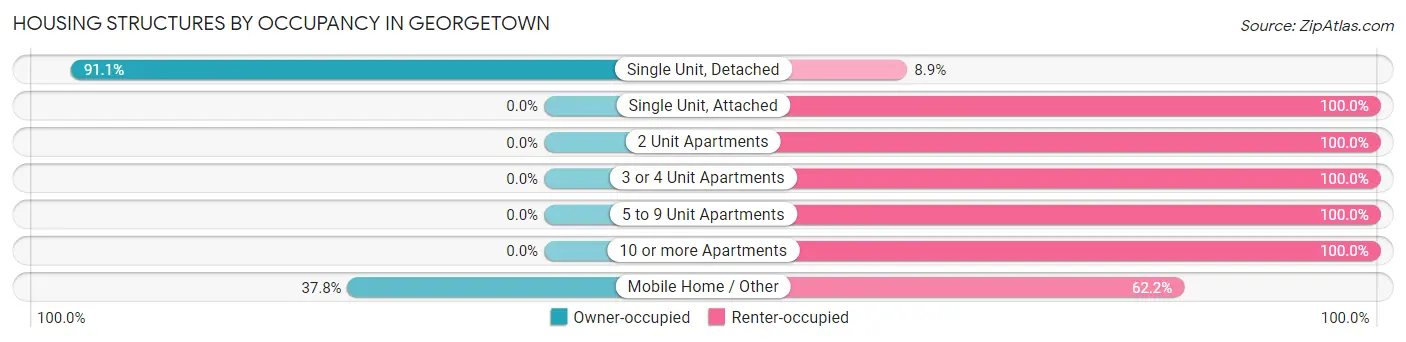
| Structure Type | Owner-occupied | Renter-occupied |
| Single Unit, Detached | 1,023 (91.1%) | 100 (8.9%) |
| Single Unit, Attached | 0 (0.0%) | 28 (100.0%) |
| 2 Unit Apartments | 0 (0.0%) | 44 (100.0%) |
| 3 or 4 Unit Apartments | 0 (0.0%) | 17 (100.0%) |
| 5 to 9 Unit Apartments | 0 (0.0%) | 9 (100.0%) |
| 10 or more Apartments | 0 (0.0%) | 6 (100.0%) |
| Mobile Home / Other | 28 (37.8%) | 46 (62.2%) |
| Total | 1,051 (80.8%) | 250 (19.2%) |
Housing Structures by Number of Rooms in Georgetown
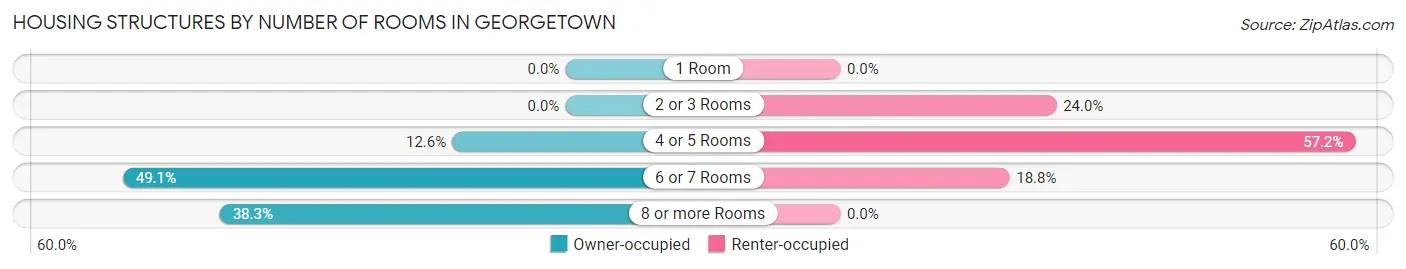
| Number of Rooms | Owner-occupied | Renter-occupied |
| 1 Room | 0 (0.0%) | 0 (0.0%) |
| 2 or 3 Rooms | 0 (0.0%) | 60 (24.0%) |
| 4 or 5 Rooms | 132 (12.6%) | 143 (57.2%) |
| 6 or 7 Rooms | 516 (49.1%) | 47 (18.8%) |
| 8 or more Rooms | 403 (38.3%) | 0 (0.0%) |
| Total | 1,051 (100.0%) | 250 (100.0%) |
Housing Structure by Heating Type in Georgetown
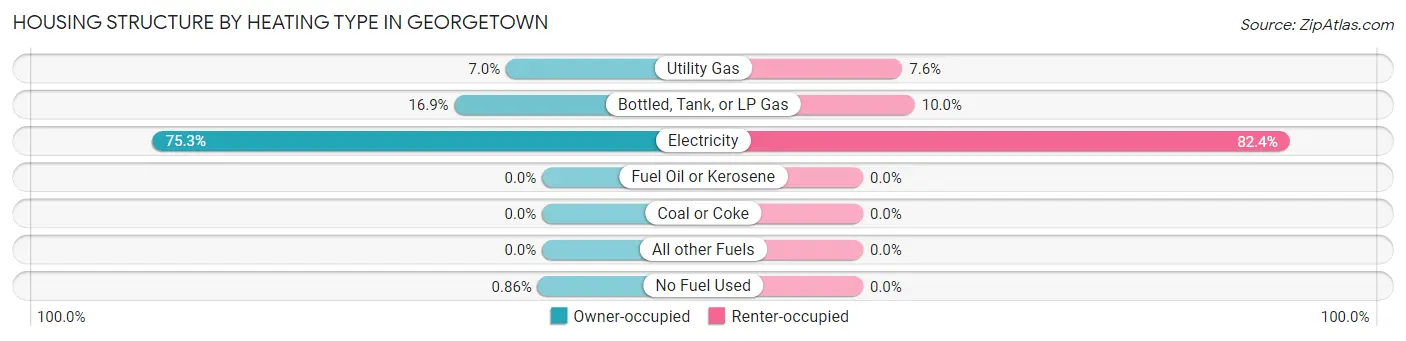
| Heating Type | Owner-occupied | Renter-occupied |
| Utility Gas | 73 (7.0%) | 19 (7.6%) |
| Bottled, Tank, or LP Gas | 178 (16.9%) | 25 (10.0%) |
| Electricity | 791 (75.3%) | 206 (82.4%) |
| Fuel Oil or Kerosene | 0 (0.0%) | 0 (0.0%) |
| Coal or Coke | 0 (0.0%) | 0 (0.0%) |
| All other Fuels | 0 (0.0%) | 0 (0.0%) |
| No Fuel Used | 9 (0.9%) | 0 (0.0%) |
| Total | 1,051 (100.0%) | 250 (100.0%) |
Household Vehicle Usage in Georgetown
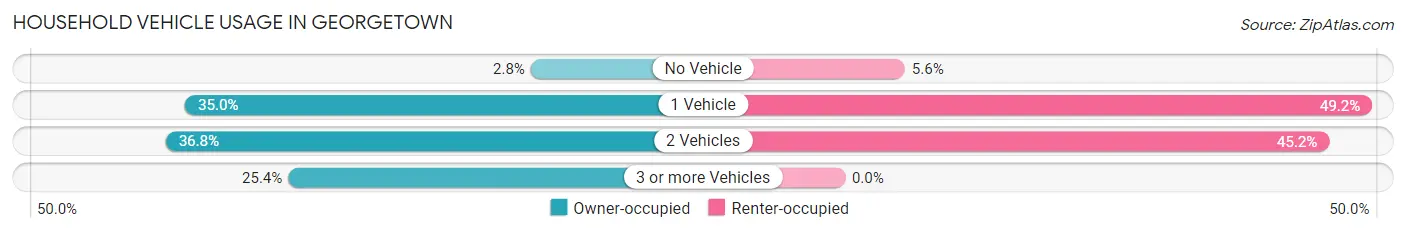
| Vehicles per Household | Owner-occupied | Renter-occupied |
| No Vehicle | 29 (2.8%) | 14 (5.6%) |
| 1 Vehicle | 368 (35.0%) | 123 (49.2%) |
| 2 Vehicles | 387 (36.8%) | 113 (45.2%) |
| 3 or more Vehicles | 267 (25.4%) | 0 (0.0%) |
| Total | 1,051 (100.0%) | 250 (100.0%) |
Real Estate & Mortgages in Georgetown
Real Estate and Mortgage Overview in Georgetown
| Characteristic | Without Mortgage | With Mortgage |
| Housing Units | 191 | 860 |
| Median Property Value | $228,300 | $244,400 |
| Median Household Income | $68,438 | $290 |
| Monthly Housing Costs | $596 | $8 |
| Real Estate Taxes | $1,651 | $17 |
Property Value by Mortgage Status in Georgetown
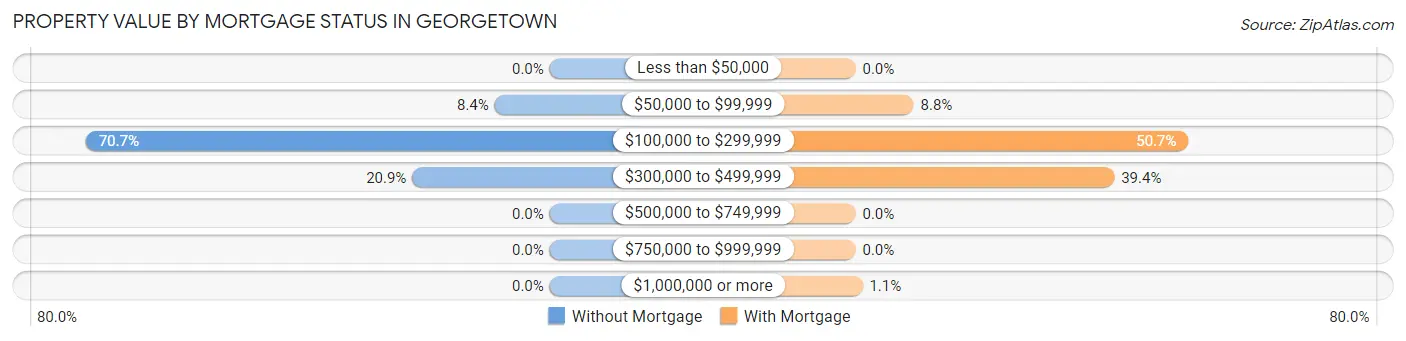
| Property Value | Without Mortgage | With Mortgage |
| Less than $50,000 | 0 (0.0%) | 0 (0.0%) |
| $50,000 to $99,999 | 16 (8.4%) | 76 (8.8%) |
| $100,000 to $299,999 | 135 (70.7%) | 436 (50.7%) |
| $300,000 to $499,999 | 40 (20.9%) | 339 (39.4%) |
| $500,000 to $749,999 | 0 (0.0%) | 0 (0.0%) |
| $750,000 to $999,999 | 0 (0.0%) | 0 (0.0%) |
| $1,000,000 or more | 0 (0.0%) | 9 (1.1%) |
| Total | 191 (100.0%) | 860 (100.0%) |
Household Income by Mortgage Status in Georgetown
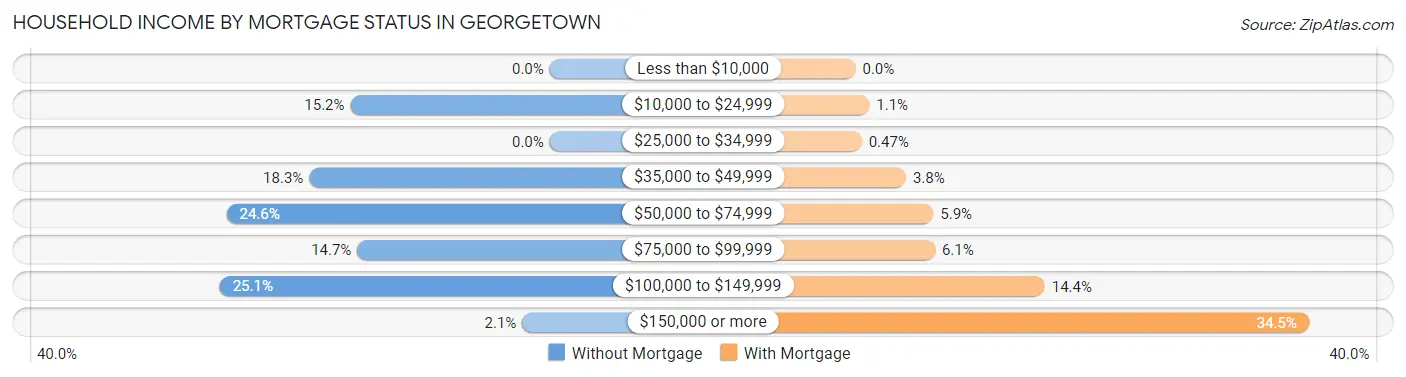
| Household Income | Without Mortgage | With Mortgage |
| Less than $10,000 | 0 (0.0%) | 0 (0.0%) |
| $10,000 to $24,999 | 29 (15.2%) | 9 (1.1%) |
| $25,000 to $34,999 | 0 (0.0%) | 4 (0.5%) |
| $35,000 to $49,999 | 35 (18.3%) | 33 (3.8%) |
| $50,000 to $74,999 | 47 (24.6%) | 51 (5.9%) |
| $75,000 to $99,999 | 28 (14.7%) | 52 (6.0%) |
| $100,000 to $149,999 | 48 (25.1%) | 124 (14.4%) |
| $150,000 or more | 4 (2.1%) | 297 (34.5%) |
| Total | 191 (100.0%) | 860 (100.0%) |
Property Value to Household Income Ratio in Georgetown
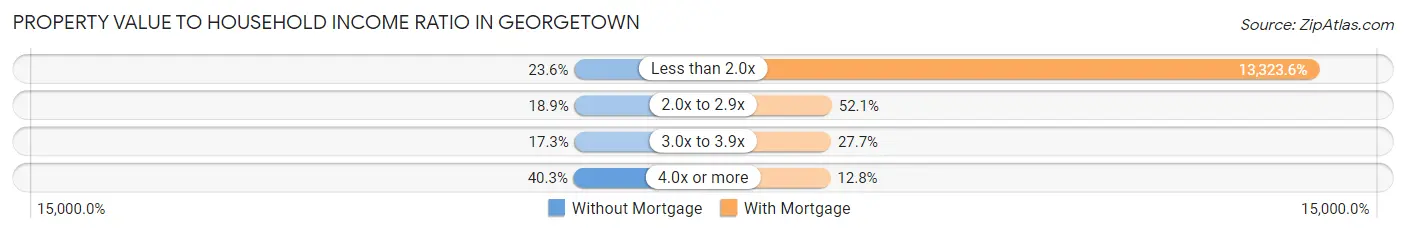
| Value-to-Income Ratio | Without Mortgage | With Mortgage |
| Less than 2.0x | 45 (23.6%) | 114,583 (13,323.6%) |
| 2.0x to 2.9x | 36 (18.9%) | 448 (52.1%) |
| 3.0x to 3.9x | 33 (17.3%) | 238 (27.7%) |
| 4.0x or more | 77 (40.3%) | 110 (12.8%) |
| Total | 191 (100.0%) | 860 (100.0%) |
Real Estate Taxes by Mortgage Status in Georgetown
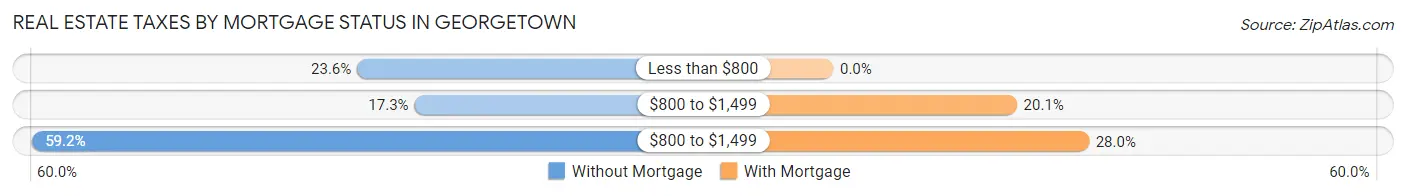
| Property Taxes | Without Mortgage | With Mortgage |
| Less than $800 | 45 (23.6%) | 0 (0.0%) |
| $800 to $1,499 | 33 (17.3%) | 173 (20.1%) |
| $800 to $1,499 | 113 (59.2%) | 241 (28.0%) |
| Total | 191 (100.0%) | 860 (100.0%) |
Health & Disability in Georgetown
Health Insurance Coverage by Age in Georgetown
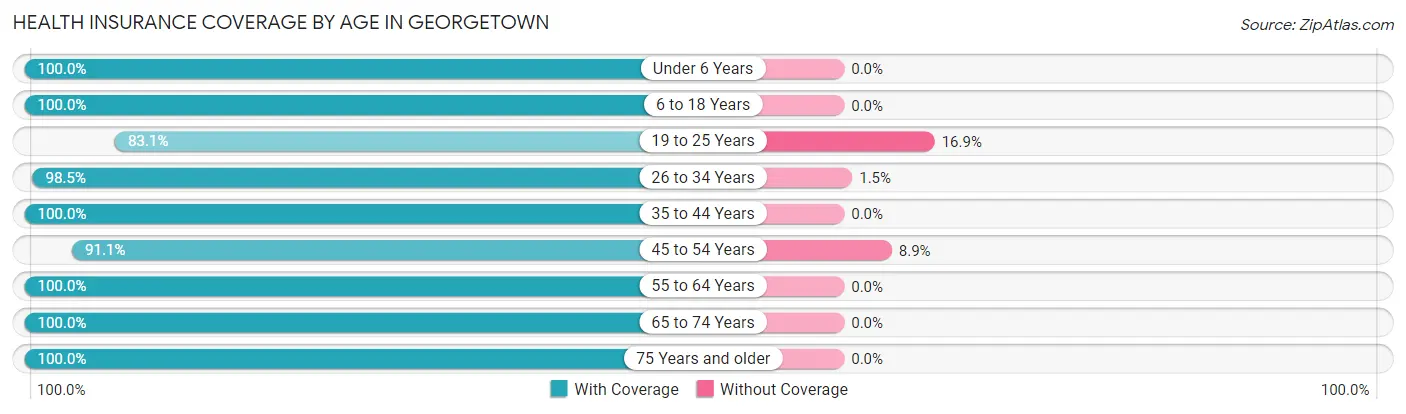
| Age Bracket | With Coverage | Without Coverage |
| Under 6 Years | 352 (100.0%) | 0 (0.0%) |
| 6 to 18 Years | 995 (100.0%) | 0 (0.0%) |
| 19 to 25 Years | 212 (83.1%) | 43 (16.9%) |
| 26 to 34 Years | 398 (98.5%) | 6 (1.5%) |
| 35 to 44 Years | 493 (100.0%) | 0 (0.0%) |
| 45 to 54 Years | 411 (91.1%) | 40 (8.9%) |
| 55 to 64 Years | 287 (100.0%) | 0 (0.0%) |
| 65 to 74 Years | 263 (100.0%) | 0 (0.0%) |
| 75 Years and older | 232 (100.0%) | 0 (0.0%) |
| Total | 3,643 (97.6%) | 89 (2.4%) |
Health Insurance Coverage by Citizenship Status in Georgetown
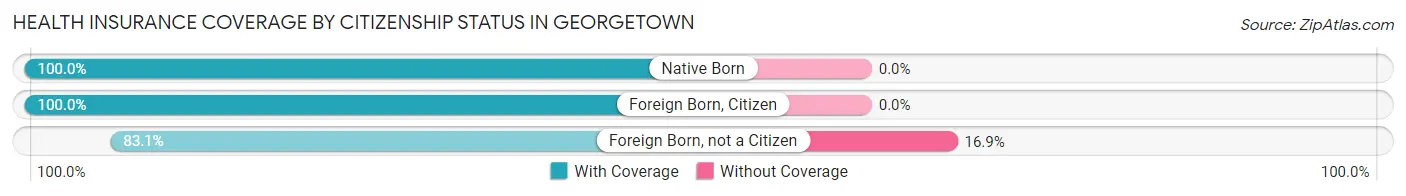
| Citizenship Status | With Coverage | Without Coverage |
| Native Born | 352 (100.0%) | 0 (0.0%) |
| Foreign Born, Citizen | 995 (100.0%) | 0 (0.0%) |
| Foreign Born, not a Citizen | 212 (83.1%) | 43 (16.9%) |
Health Insurance Coverage by Household Income in Georgetown
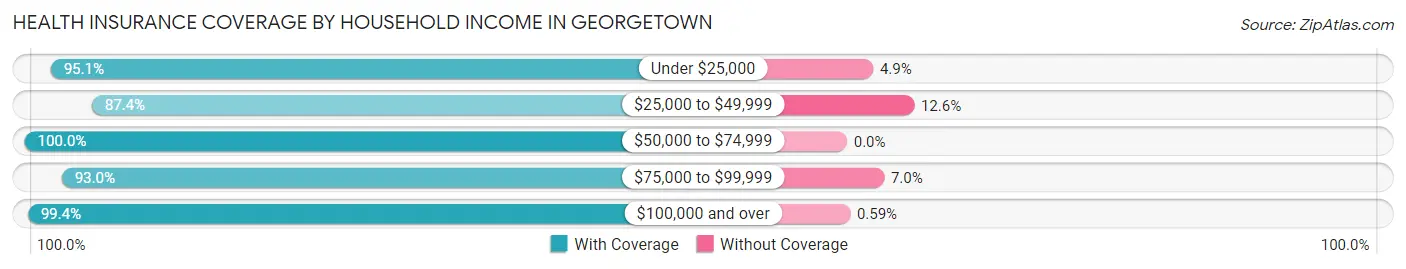
| Household Income | With Coverage | Without Coverage |
| Under $25,000 | 136 (95.1%) | 7 (4.9%) |
| $25,000 to $49,999 | 236 (87.4%) | 34 (12.6%) |
| $50,000 to $74,999 | 312 (100.0%) | 0 (0.0%) |
| $75,000 to $99,999 | 441 (93.0%) | 33 (7.0%) |
| $100,000 and over | 2,518 (99.4%) | 15 (0.6%) |
Public vs Private Health Insurance Coverage by Age in Georgetown
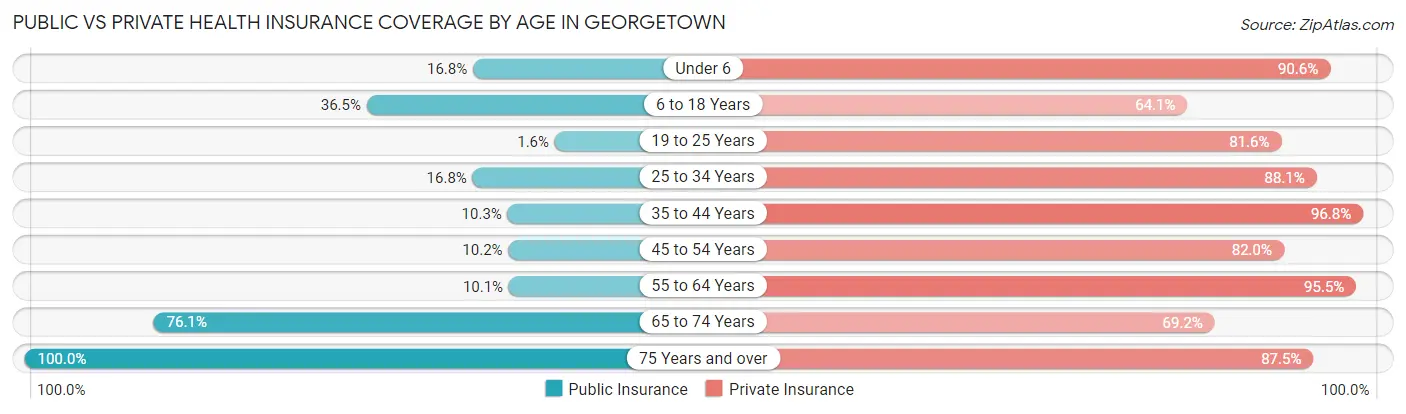
| Age Bracket | Public Insurance | Private Insurance |
| Under 6 | 59 (16.8%) | 319 (90.6%) |
| 6 to 18 Years | 363 (36.5%) | 638 (64.1%) |
| 19 to 25 Years | 4 (1.6%) | 208 (81.6%) |
| 25 to 34 Years | 68 (16.8%) | 356 (88.1%) |
| 35 to 44 Years | 51 (10.3%) | 477 (96.8%) |
| 45 to 54 Years | 46 (10.2%) | 370 (82.0%) |
| 55 to 64 Years | 29 (10.1%) | 274 (95.5%) |
| 65 to 74 Years | 200 (76.0%) | 182 (69.2%) |
| 75 Years and over | 232 (100.0%) | 203 (87.5%) |
| Total | 1,052 (28.2%) | 3,027 (81.1%) |
Disability Status by Sex by Age in Georgetown
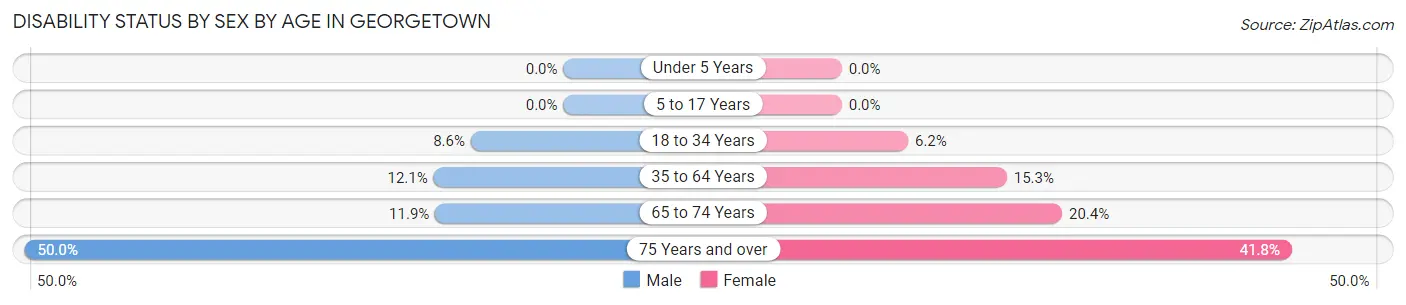
| Age Bracket | Male | Female |
| Under 5 Years | 0 (0.0%) | 0 (0.0%) |
| 5 to 17 Years | 0 (0.0%) | 0 (0.0%) |
| 18 to 34 Years | 31 (8.6%) | 20 (6.1%) |
| 35 to 64 Years | 83 (12.0%) | 83 (15.3%) |
| 65 to 74 Years | 15 (11.9%) | 28 (20.4%) |
| 75 Years and over | 31 (50.0%) | 71 (41.8%) |
Disability Class by Sex by Age in Georgetown
Disability Class: Hearing Difficulty
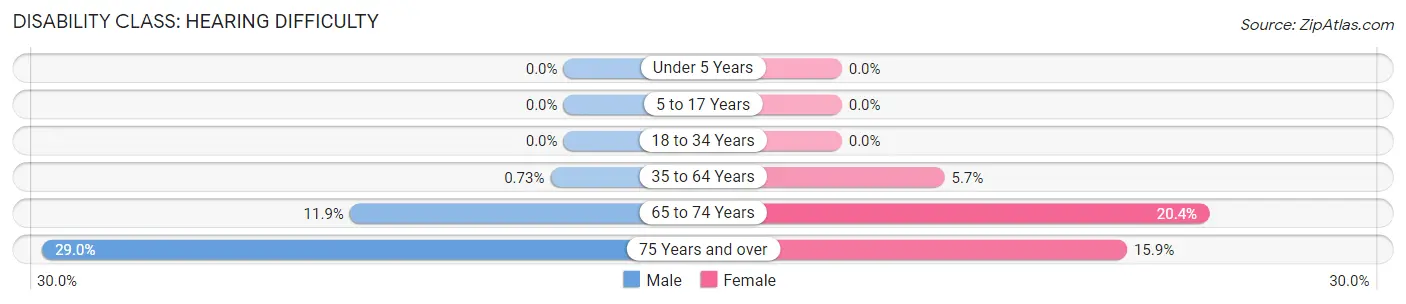
| Age Bracket | Male | Female |
| Under 5 Years | 0 (0.0%) | 0 (0.0%) |
| 5 to 17 Years | 0 (0.0%) | 0 (0.0%) |
| 18 to 34 Years | 0 (0.0%) | 0 (0.0%) |
| 35 to 64 Years | 5 (0.7%) | 31 (5.7%) |
| 65 to 74 Years | 15 (11.9%) | 28 (20.4%) |
| 75 Years and over | 18 (29.0%) | 27 (15.9%) |
Disability Class: Vision Difficulty
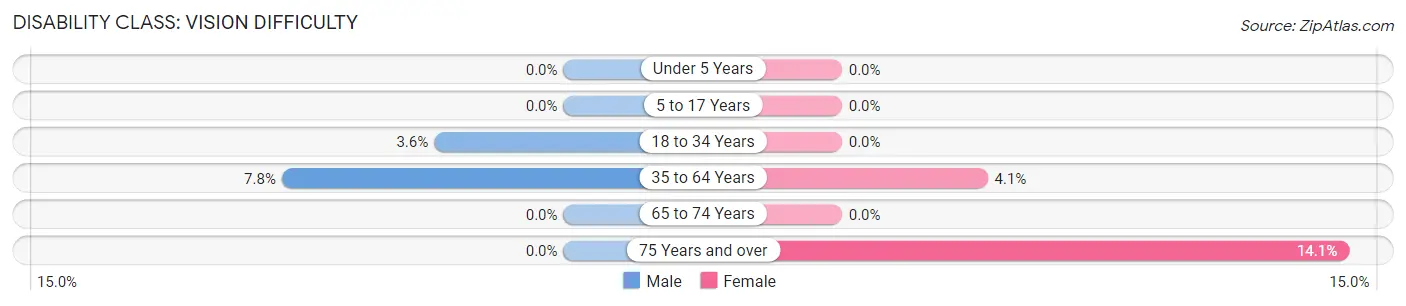
| Age Bracket | Male | Female |
| Under 5 Years | 0 (0.0%) | 0 (0.0%) |
| 5 to 17 Years | 0 (0.0%) | 0 (0.0%) |
| 18 to 34 Years | 13 (3.6%) | 0 (0.0%) |
| 35 to 64 Years | 54 (7.8%) | 22 (4.1%) |
| 65 to 74 Years | 0 (0.0%) | 0 (0.0%) |
| 75 Years and over | 0 (0.0%) | 24 (14.1%) |
Disability Class: Cognitive Difficulty
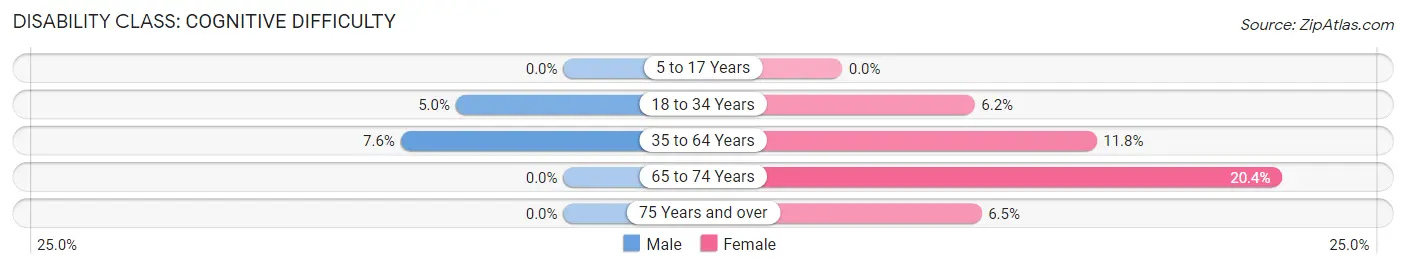
| Age Bracket | Male | Female |
| 5 to 17 Years | 0 (0.0%) | 0 (0.0%) |
| 18 to 34 Years | 18 (5.0%) | 20 (6.1%) |
| 35 to 64 Years | 52 (7.5%) | 64 (11.8%) |
| 65 to 74 Years | 0 (0.0%) | 28 (20.4%) |
| 75 Years and over | 0 (0.0%) | 11 (6.5%) |
Disability Class: Ambulatory Difficulty
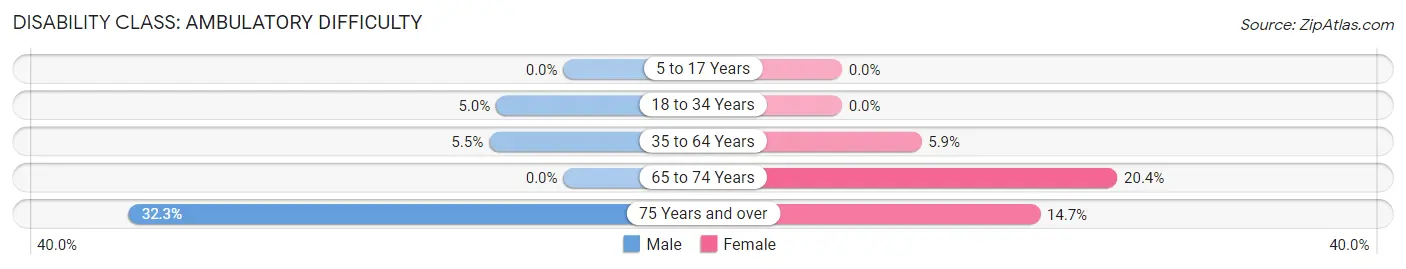
| Age Bracket | Male | Female |
| 5 to 17 Years | 0 (0.0%) | 0 (0.0%) |
| 18 to 34 Years | 18 (5.0%) | 0 (0.0%) |
| 35 to 64 Years | 38 (5.5%) | 32 (5.9%) |
| 65 to 74 Years | 0 (0.0%) | 28 (20.4%) |
| 75 Years and over | 20 (32.3%) | 25 (14.7%) |
Disability Class: Self-Care Difficulty
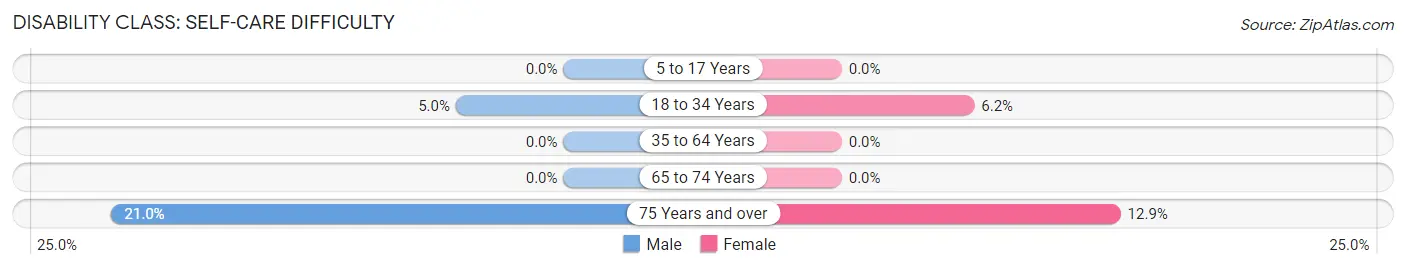
| Age Bracket | Male | Female |
| 5 to 17 Years | 0 (0.0%) | 0 (0.0%) |
| 18 to 34 Years | 18 (5.0%) | 20 (6.1%) |
| 35 to 64 Years | 0 (0.0%) | 0 (0.0%) |
| 65 to 74 Years | 0 (0.0%) | 0 (0.0%) |
| 75 Years and over | 13 (21.0%) | 22 (12.9%) |
Technology Access in Georgetown
Computing Device Access in Georgetown
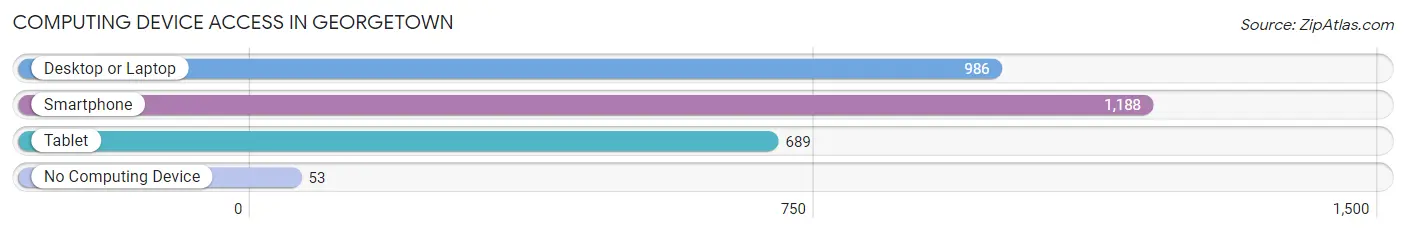
| Device Type | # Households | % Households |
| Desktop or Laptop | 986 | 75.8% |
| Smartphone | 1,188 | 91.3% |
| Tablet | 689 | 53.0% |
| No Computing Device | 53 | 4.1% |
| Total | 1,301 | 100.0% |
Internet Access in Georgetown
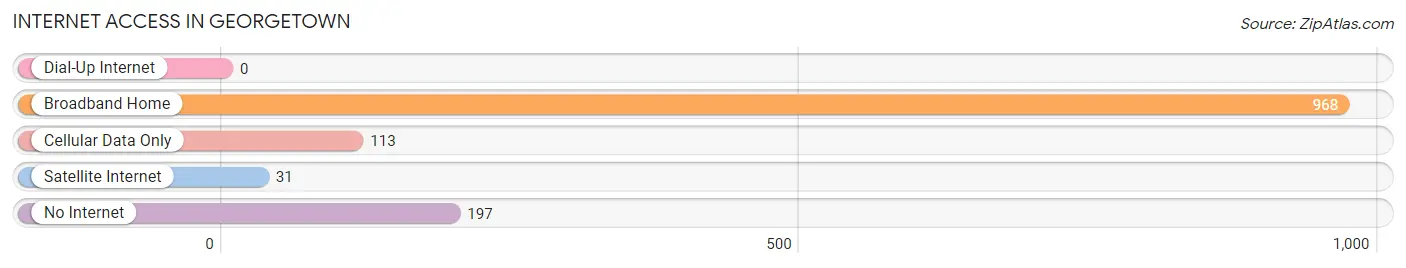
| Internet Type | # Households | % Households |
| Dial-Up Internet | 0 | 0.0% |
| Broadband Home | 968 | 74.4% |
| Cellular Data Only | 113 | 8.7% |
| Satellite Internet | 31 | 2.4% |
| No Internet | 197 | 15.1% |
| Total | 1,301 | 100.0% |
Georgetown Summary
Georgetown, Indiana is a small town located in Floyd County, Indiana. It is situated on the banks of the Ohio River, just south of Louisville, Kentucky. The town has a population of approximately 8,000 people and is part of the Louisville metropolitan area. Georgetown is known for its historic downtown area, which is home to a variety of shops, restaurants, and other businesses.
Geography
Georgetown is located in the southern part of Floyd County, Indiana. It is situated on the banks of the Ohio River, just south of Louisville, Kentucky. The town is located in the Central Till Plains region of Indiana, which is characterized by flat terrain and fertile soil. The town is surrounded by rolling hills and farmland, and is home to several parks and recreational areas.
The climate in Georgetown is humid continental, with hot summers and cold winters. The average temperature in the summer is around 80 degrees Fahrenheit, and the average temperature in the winter is around 30 degrees Fahrenheit. Precipitation is abundant throughout the year, with an average of around 40 inches of rain and snowfall annually.
Economy
Georgetown’s economy is largely based on agriculture and manufacturing. The town is home to several large agricultural operations, including a large dairy farm and a large hog farm. The town is also home to several manufacturing companies, including a large automotive parts manufacturer and a large furniture manufacturer.
The town is also home to several small businesses, including restaurants, retail stores, and other services. The town is also home to several educational institutions, including a community college and a technical school.
Demographics
As of the 2010 census, Georgetown had a population of 8,000 people. The racial makeup of the town was 95.3% White, 1.2% African American, 0.3% Native American, 0.7% Asian, 0.1% Pacific Islander, and 2.4% from other races. Hispanic or Latino of any race were 3.2% of the population.
The median household income in Georgetown was $41,000, and the median family income was $50,000. The per capita income in Georgetown was $20,000. About 11.3% of the population was below the poverty line.
Conclusion
Georgetown, Indiana is a small town located in Floyd County, Indiana. It is situated on the banks of the Ohio River, just south of Louisville, Kentucky. The town has a population of approximately 8,000 people and is part of the Louisville metropolitan area. Georgetown is known for its historic downtown area, which is home to a variety of shops, restaurants, and other businesses. The town’s economy is largely based on agriculture and manufacturing, and the town is home to several educational institutions. The town’s population is largely white, with a small percentage of African American, Native American, Asian, and Pacific Islander residents. The median household income in Georgetown is $41,000, and the per capita income is $20,000.
Common Questions
What is Per Capita Income in Georgetown?
Per Capita income in Georgetown is $41,345.
What is the Median Family Income in Georgetown?
Median Family Income in Georgetown is $117,841.
What is the Median Household income in Georgetown?
Median Household Income in Georgetown is $105,368.
What is Income or Wage Gap in Georgetown?
Income or Wage Gap in Georgetown is 42.9%.
Women in Georgetown earn 57.1 cents for every dollar earned by a man.
What is Inequality or Gini Index in Georgetown?
Inequality or Gini Index in Georgetown is 0.39.
What is the Total Population of Georgetown?
Total Population of Georgetown is 3,749.
What is the Total Male Population of Georgetown?
Total Male Population of Georgetown is 1,919.
What is the Total Female Population of Georgetown?
Total Female Population of Georgetown is 1,830.
What is the Ratio of Males per 100 Females in Georgetown?
There are 104.86 Males per 100 Females in Georgetown.
What is the Ratio of Females per 100 Males in Georgetown?
There are 95.36 Females per 100 Males in Georgetown.
What is the Median Population Age in Georgetown?
Median Population Age in Georgetown is 31.6 Years.
What is the Average Family Size in Georgetown
Average Family Size in Georgetown is 3.7 People.
What is the Average Household Size in Georgetown
Average Household Size in Georgetown is 2.9 People.
How Large is the Labor Force in Georgetown?
There are 1,693 People in the Labor Forcein in Georgetown.
What is the Percentage of People in the Labor Force in Georgetown?
64.6% of People are in the Labor Force in Georgetown.
What is the Unemployment Rate in Georgetown?
Unemployment Rate in Georgetown is 1.2%.