Zip Codes with the Highest Percentage of Population Employed in Legal Services & Support in Anderson, IN
RELATED REPORTS & OPTIONS
Legal Services & Support
Anderson
Compare Zip Codes
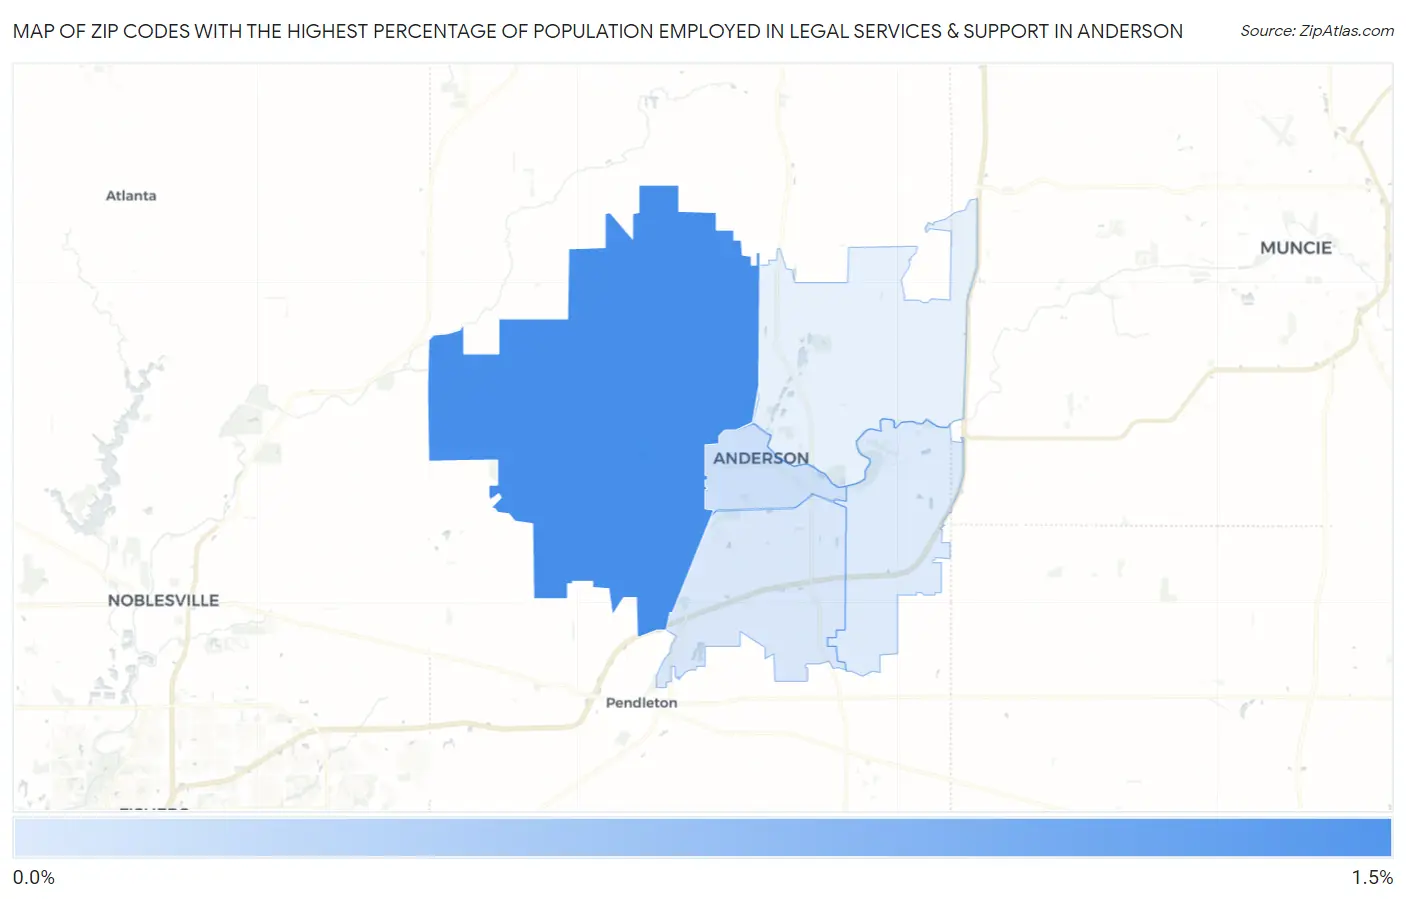
Map of Zip Codes with the Highest Percentage of Population Employed in Legal Services & Support in Anderson
0.036%
1.1%
Zip Codes with the Highest Percentage of Population Employed in Legal Services & Support in Anderson, IN
| Zip Code | % Employed | vs State | vs National | |
| 1. | 46011 | 1.1% | 0.76%(+0.302)#105 | 1.2%(-0.120)#7,401 |
| 2. | 46016 | 0.15% | 0.76%(-0.615)#345 | 1.2%(-1.04)#16,712 |
| 3. | 46013 | 0.065% | 0.76%(-0.697)#374 | 1.2%(-1.12)#17,362 |
| 4. | 46017 | 0.036% | 0.76%(-0.727)#377 | 1.2%(-1.15)#17,469 |
1
Common Questions
What are the Top 3 Zip Codes with the Highest Percentage of Population Employed in Legal Services & Support in Anderson, IN?
Top 3 Zip Codes with the Highest Percentage of Population Employed in Legal Services & Support in Anderson, IN are:
What zip code has the Highest Percentage of Population Employed in Legal Services & Support in Anderson, IN?
46011 has the Highest Percentage of Population Employed in Legal Services & Support in Anderson, IN with 1.1%.
What is the Percentage of Population Employed in Legal Services & Support in Anderson, IN?
Percentage of Population Employed in Legal Services & Support in Anderson is 0.12%.
What is the Percentage of Population Employed in Legal Services & Support in Indiana?
Percentage of Population Employed in Legal Services & Support in Indiana is 0.76%.
What is the Percentage of Population Employed in Legal Services & Support in the United States?
Percentage of Population Employed in Legal Services & Support in the United States is 1.2%.