Zip Codes with the Highest Percentage of Population Employed in Legal Services & Support in Muncie, IN
RELATED REPORTS & OPTIONS
Legal Services & Support
Muncie
Compare Zip Codes
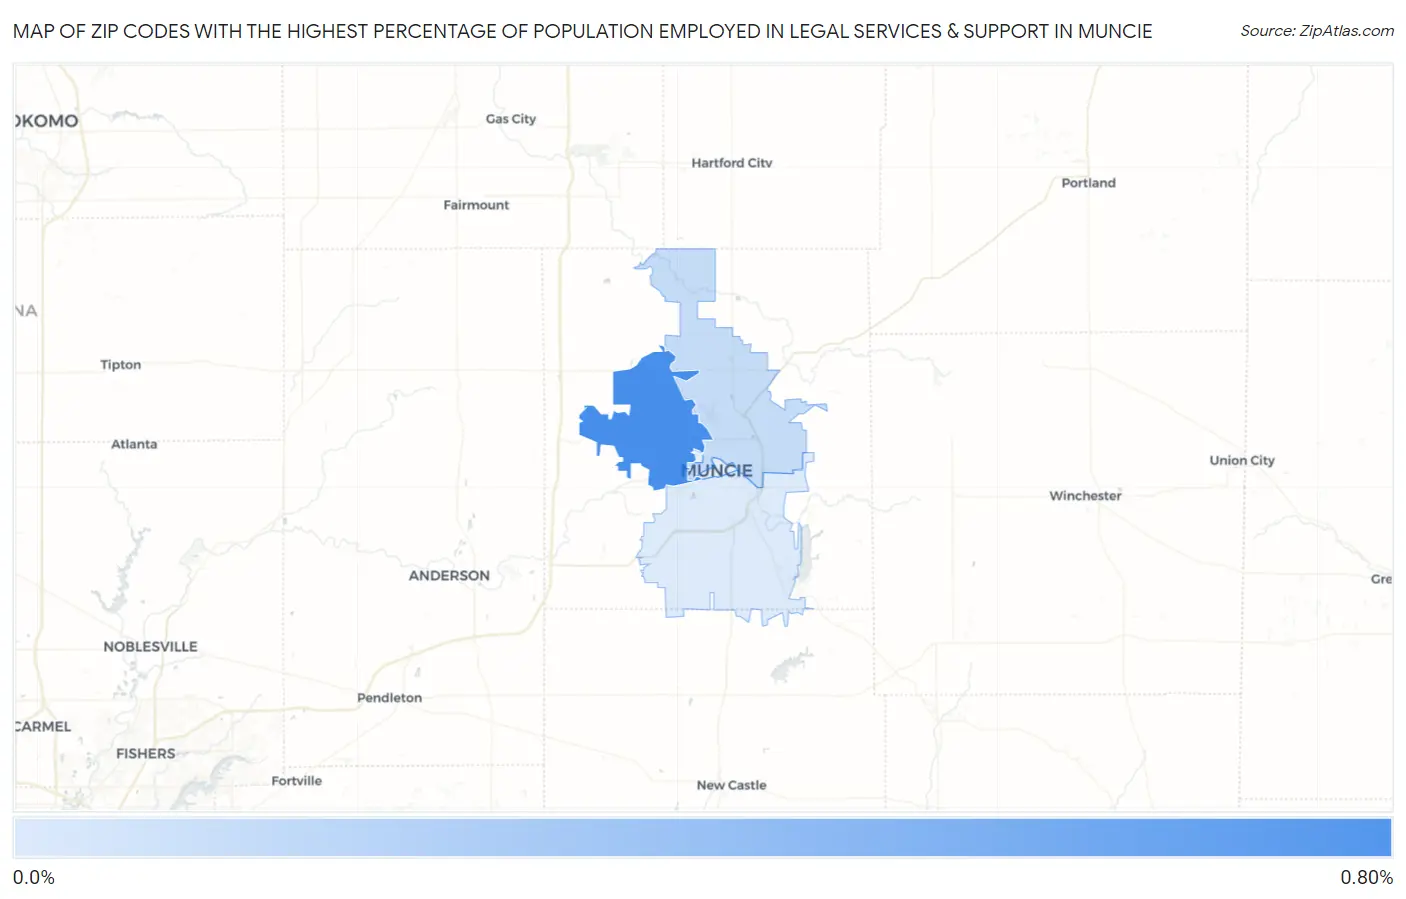
Map of Zip Codes with the Highest Percentage of Population Employed in Legal Services & Support in Muncie
0.079%
0.65%
Zip Codes with the Highest Percentage of Population Employed in Legal Services & Support in Muncie, IN
| Zip Code | % Employed | vs State | vs National | |
| 1. | 47304 | 0.65% | 0.76%(-0.114)#167 | 1.2%(-0.535)#10,959 |
| 2. | 47303 | 0.16% | 0.76%(-0.598)#338 | 1.2%(-1.02)#16,548 |
| 3. | 47302 | 0.079% | 0.76%(-0.683)#368 | 1.2%(-1.11)#17,277 |
1
Common Questions
What are the Top 3 Zip Codes with the Highest Percentage of Population Employed in Legal Services & Support in Muncie, IN?
Top 3 Zip Codes with the Highest Percentage of Population Employed in Legal Services & Support in Muncie, IN are:
What zip code has the Highest Percentage of Population Employed in Legal Services & Support in Muncie, IN?
47304 has the Highest Percentage of Population Employed in Legal Services & Support in Muncie, IN with 0.65%.
What is the Percentage of Population Employed in Legal Services & Support in Muncie, IN?
Percentage of Population Employed in Legal Services & Support in Muncie is 0.25%.
What is the Percentage of Population Employed in Legal Services & Support in Indiana?
Percentage of Population Employed in Legal Services & Support in Indiana is 0.76%.
What is the Percentage of Population Employed in Legal Services & Support in the United States?
Percentage of Population Employed in Legal Services & Support in the United States is 1.2%.