Zip Codes with the Highest Percentage of Population Employed in Legal Services & Support in Greenwood, IN
RELATED REPORTS & OPTIONS
Legal Services & Support
Greenwood
Compare Zip Codes
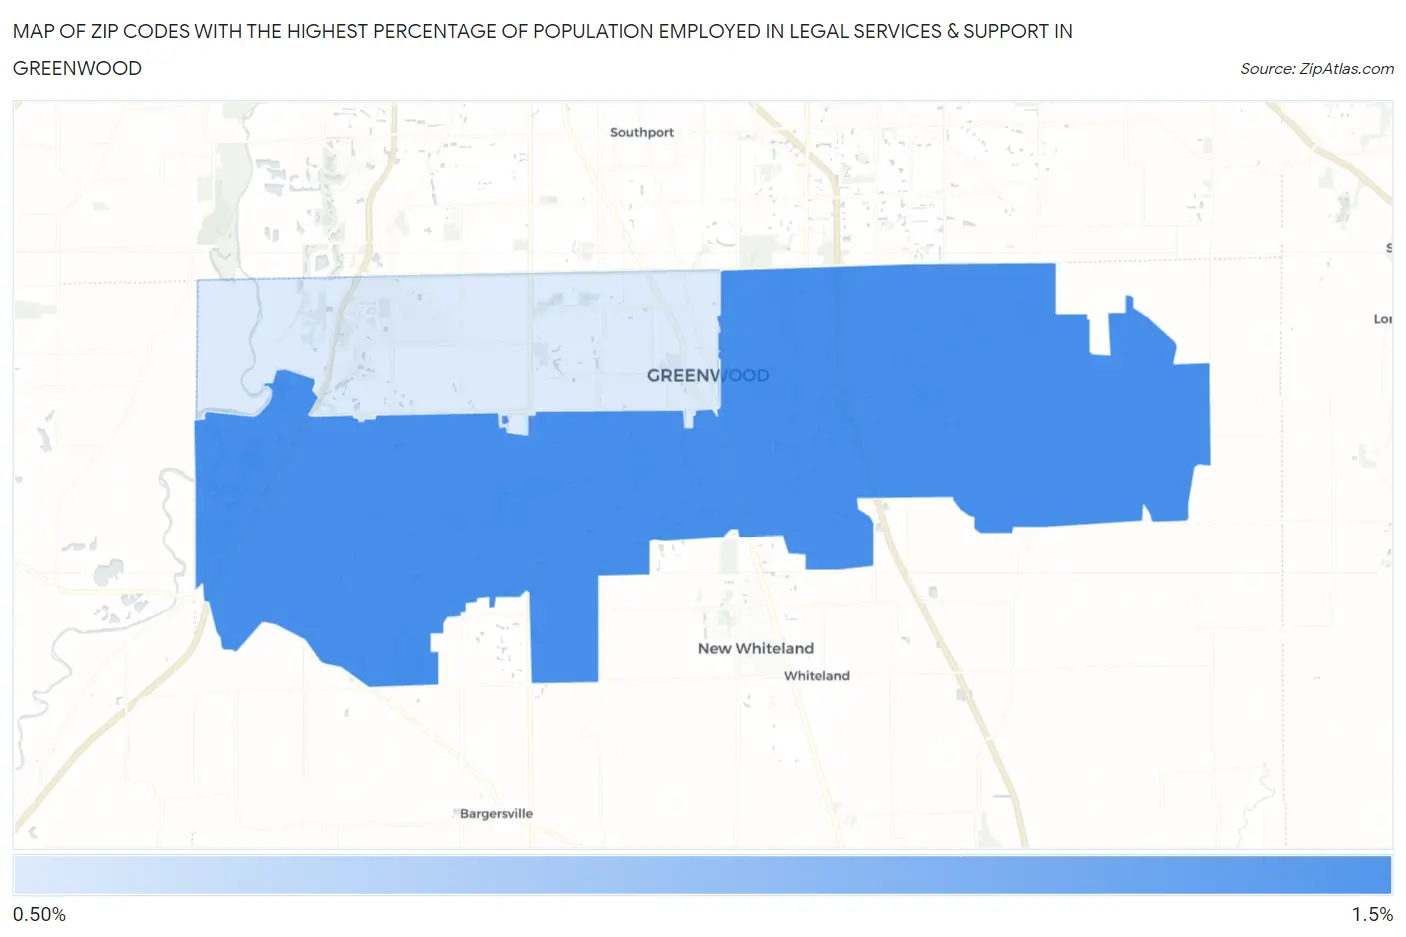
Map of Zip Codes with the Highest Percentage of Population Employed in Legal Services & Support in Greenwood
0.94%
1.2%
Zip Codes with the Highest Percentage of Population Employed in Legal Services & Support in Greenwood, IN
| Zip Code | % Employed | vs State | vs National | |
| 1. | 46143 | 1.2% | 0.76%(+0.474)#83 | 1.2%(+0.052)#6,291 |
| 2. | 46142 | 0.94% | 0.76%(+0.175)#118 | 1.2%(-0.247)#8,302 |
1
Common Questions
What are the Top Zip Codes with the Highest Percentage of Population Employed in Legal Services & Support in Greenwood, IN?
Top Zip Codes with the Highest Percentage of Population Employed in Legal Services & Support in Greenwood, IN are:
What zip code has the Highest Percentage of Population Employed in Legal Services & Support in Greenwood, IN?
46143 has the Highest Percentage of Population Employed in Legal Services & Support in Greenwood, IN with 1.2%.
What is the Percentage of Population Employed in Legal Services & Support in Greenwood, IN?
Percentage of Population Employed in Legal Services & Support in Greenwood is 1.1%.
What is the Percentage of Population Employed in Legal Services & Support in Indiana?
Percentage of Population Employed in Legal Services & Support in Indiana is 0.76%.
What is the Percentage of Population Employed in Legal Services & Support in the United States?
Percentage of Population Employed in Legal Services & Support in the United States is 1.2%.