Dyer, IN Map & Demographics
Dyer Map
Dyer Overview
$49,605
PER CAPITA INCOME
$114,181
AVG FAMILY INCOME
$98,631
AVG HOUSEHOLD INCOME
44.3%
WAGE / INCOME GAP [ % ]
55.7¢/ $1
WAGE / INCOME GAP [ $ ]
0.42
INEQUALITY / GINI INDEX
16,407
TOTAL POPULATION
7,620
MALE POPULATION
8,787
FEMALE POPULATION
86.72
MALES / 100 FEMALES
115.31
FEMALES / 100 MALES
44.1
MEDIAN AGE
2.9
AVG FAMILY SIZE
2.5
AVG HOUSEHOLD SIZE
8,589
LABOR FORCE [ PEOPLE ]
64.0%
PERCENT IN LABOR FORCE
3.6%
UNEMPLOYMENT RATE
Dyer Zip Codes
Dyer Area Codes
Income in Dyer
Income Overview in Dyer
Per Capita Income in Dyer is $49,605, while median incomes of families and households are $114,181 and $98,631 respectively.
| Characteristic | Number | Measure |
| Per Capita Income | 16,407 | $49,605 |
| Median Family Income | 4,607 | $114,181 |
| Mean Family Income | 4,607 | $139,004 |
| Median Household Income | 6,302 | $98,631 |
| Mean Household Income | 6,302 | $122,749 |
| Income Deficit | 4,607 | $0 |
| Wage / Income Gap (%) | 16,407 | 44.26% |
| Wage / Income Gap ($) | 16,407 | 55.74¢ per $1 |
| Gini / Inequality Index | 16,407 | 0.42 |
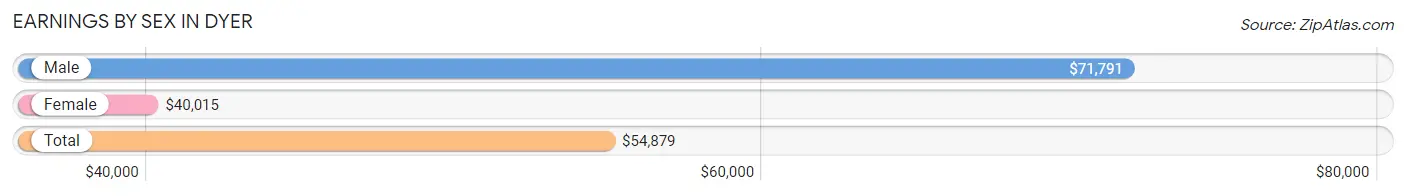
Earnings by Sex in Dyer
Average Earnings in Dyer are $54,879, $71,791 for men and $40,015 for women, a difference of 44.3%.
| Sex | Number | Average Earnings |
| Male | 4,375 (49.9%) | $71,791 |
| Female | 4,391 (50.1%) | $40,015 |
| Total | 8,766 (100.0%) | $54,879 |
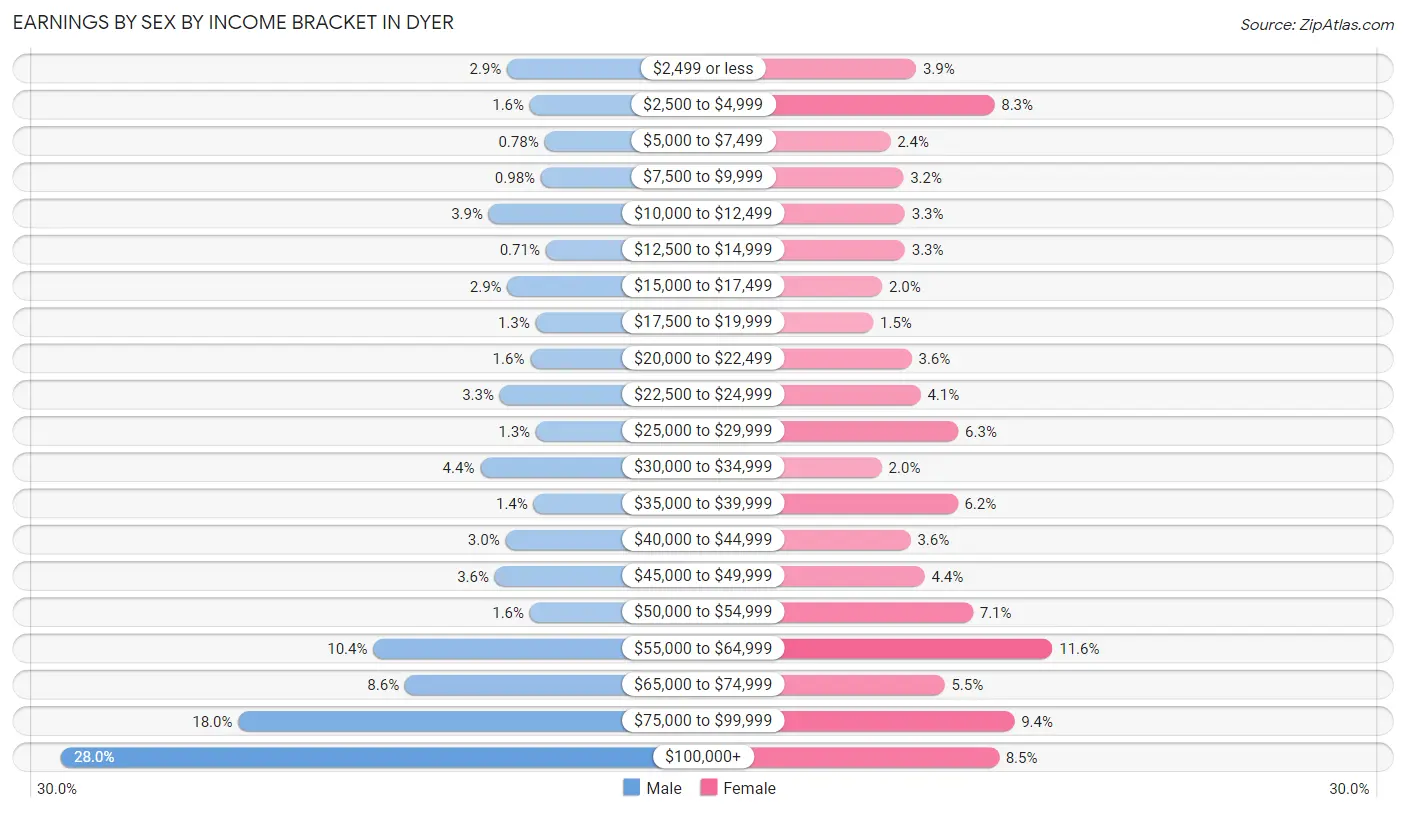
Earnings by Sex by Income Bracket in Dyer
The most common earnings brackets in Dyer are $100,000+ for men (1,223 | 28.0%) and $55,000 to $64,999 for women (507 | 11.6%).
| Income | Male | Female |
| $2,499 or less | 126 (2.9%) | 171 (3.9%) |
| $2,500 to $4,999 | 70 (1.6%) | 364 (8.3%) |
| $5,000 to $7,499 | 34 (0.8%) | 107 (2.4%) |
| $7,500 to $9,999 | 43 (1.0%) | 139 (3.2%) |
| $10,000 to $12,499 | 171 (3.9%) | 143 (3.3%) |
| $12,500 to $14,999 | 31 (0.7%) | 143 (3.3%) |
| $15,000 to $17,499 | 125 (2.9%) | 87 (2.0%) |
| $17,500 to $19,999 | 56 (1.3%) | 65 (1.5%) |
| $20,000 to $22,499 | 69 (1.6%) | 160 (3.6%) |
| $22,500 to $24,999 | 144 (3.3%) | 182 (4.1%) |
| $25,000 to $29,999 | 55 (1.3%) | 275 (6.3%) |
| $30,000 to $34,999 | 192 (4.4%) | 86 (2.0%) |
| $35,000 to $39,999 | 61 (1.4%) | 273 (6.2%) |
| $40,000 to $44,999 | 130 (3.0%) | 157 (3.6%) |
| $45,000 to $49,999 | 156 (3.6%) | 192 (4.4%) |
| $50,000 to $54,999 | 70 (1.6%) | 311 (7.1%) |
| $55,000 to $64,999 | 455 (10.4%) | 507 (11.6%) |
| $65,000 to $74,999 | 377 (8.6%) | 241 (5.5%) |
| $75,000 to $99,999 | 787 (18.0%) | 413 (9.4%) |
| $100,000+ | 1,223 (28.0%) | 375 (8.5%) |
| Total | 4,375 (100.0%) | 4,391 (100.0%) |
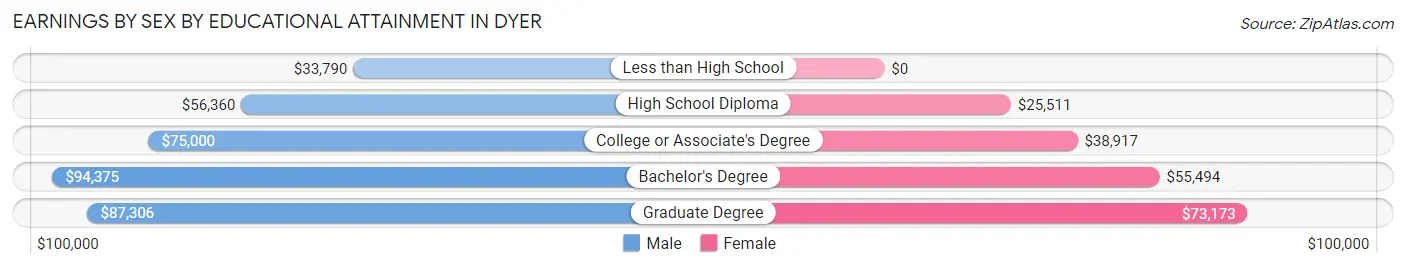
Earnings by Sex by Educational Attainment in Dyer
Average earnings in Dyer are $76,622 for men and $45,625 for women, a difference of 40.5%. Men with an educational attainment of bachelor's degree enjoy the highest average annual earnings of $94,375, while those with less than high school education earn the least with $33,790. Women with an educational attainment of graduate degree earn the most with the average annual earnings of $73,173, while those with high school diploma education have the smallest earnings of $25,511.
| Educational Attainment | Male Income | Female Income |
| Less than High School | $33,790 | $0 |
| High School Diploma | $56,360 | $25,511 |
| College or Associate's Degree | $75,000 | $38,917 |
| Bachelor's Degree | $94,375 | $55,494 |
| Graduate Degree | $87,306 | $73,173 |
| Total | $76,622 | $45,625 |
Family Income in Dyer
Family Income Brackets in Dyer
According to the Dyer family income data, there are 1,055 families falling into the $100,000 to $149,999 income range, which is the most common income bracket and makes up 22.9% of all families. Conversely, the less than $10,000 income bracket is the least frequent group with only 60 families (1.3%) belonging to this category.
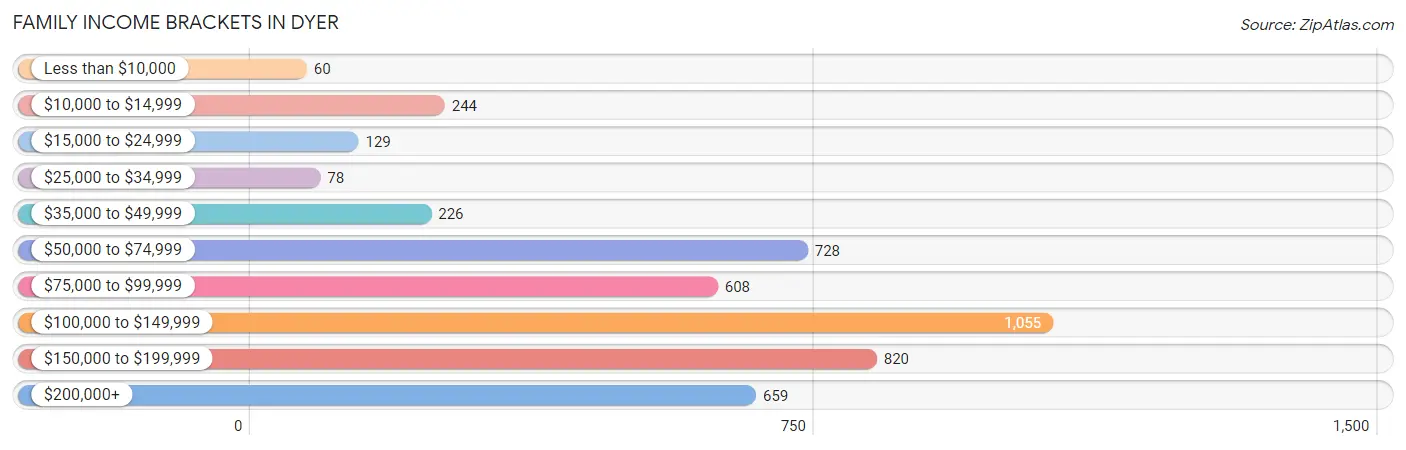
| Income Bracket | # Families | % Families |
| Less than $10,000 | 60 | 1.3% |
| $10,000 to $14,999 | 244 | 5.3% |
| $15,000 to $24,999 | 129 | 2.8% |
| $25,000 to $34,999 | 78 | 1.7% |
| $35,000 to $49,999 | 226 | 4.9% |
| $50,000 to $74,999 | 728 | 15.8% |
| $75,000 to $99,999 | 608 | 13.2% |
| $100,000 to $149,999 | 1,055 | 22.9% |
| $150,000 to $199,999 | 820 | 17.8% |
| $200,000+ | 659 | 14.3% |
Family Income by Famaliy Size in Dyer
6-person families (143 | 3.1%) account for the highest median family income in Dyer with $250,001 per family, while 3-person families (772 | 16.8%) have the highest median income of $47,750 per family member.
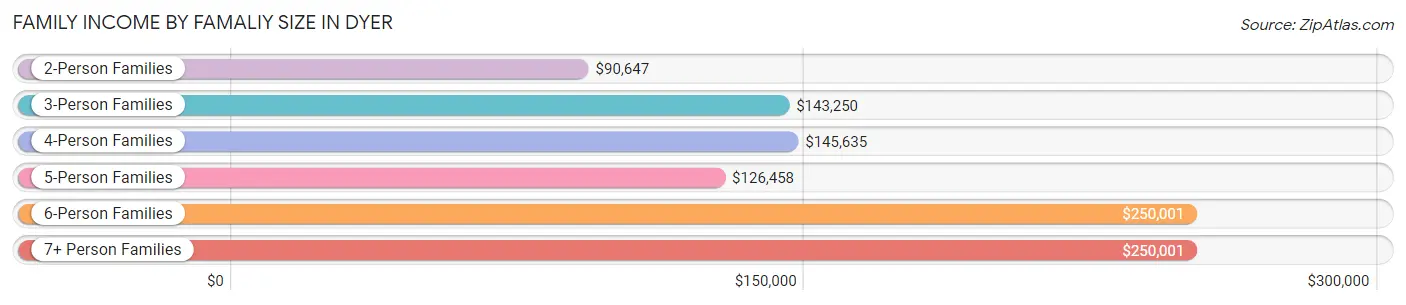
| Income Bracket | # Families | Median Income |
| 2-Person Families | 2,625 (57.0%) | $90,647 |
| 3-Person Families | 772 (16.8%) | $143,250 |
| 4-Person Families | 749 (16.3%) | $145,635 |
| 5-Person Families | 296 (6.4%) | $126,458 |
| 6-Person Families | 143 (3.1%) | $250,001 |
| 7+ Person Families | 22 (0.5%) | $250,001 |
| Total | 4,607 (100.0%) | $114,181 |
Family Income by Number of Earners in Dyer
The median family income in Dyer is $114,181, with families comprising 3+ earners (646) having the highest median family income of $176,190, while families with no earners (934) have the lowest median family income of $51,596, accounting for 14.0% and 20.3% of families, respectively.
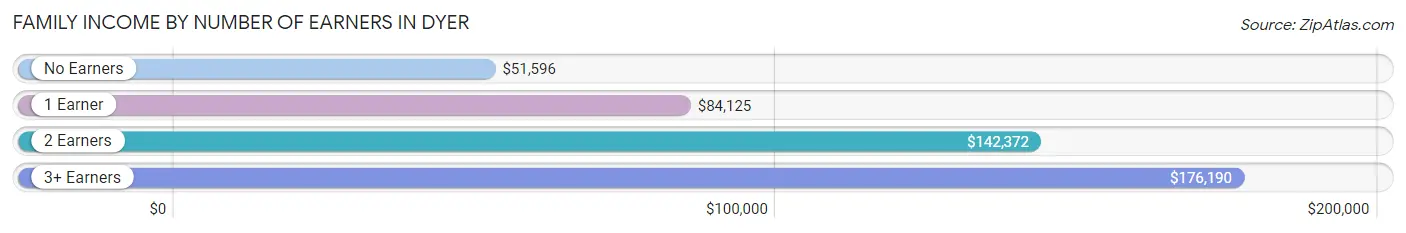
| Number of Earners | # Families | Median Income |
| No Earners | 934 (20.3%) | $51,596 |
| 1 Earner | 1,171 (25.4%) | $84,125 |
| 2 Earners | 1,856 (40.3%) | $142,372 |
| 3+ Earners | 646 (14.0%) | $176,190 |
| Total | 4,607 (100.0%) | $114,181 |
Household Income in Dyer
Household Income Brackets in Dyer
With 1,569 households falling in the category, the $100,000 to $149,999 income range is the most frequent in Dyer, accounting for 24.9% of all households. In contrast, only 76 households (1.2%) fall into the less than $10,000 income bracket, making it the least populous group.
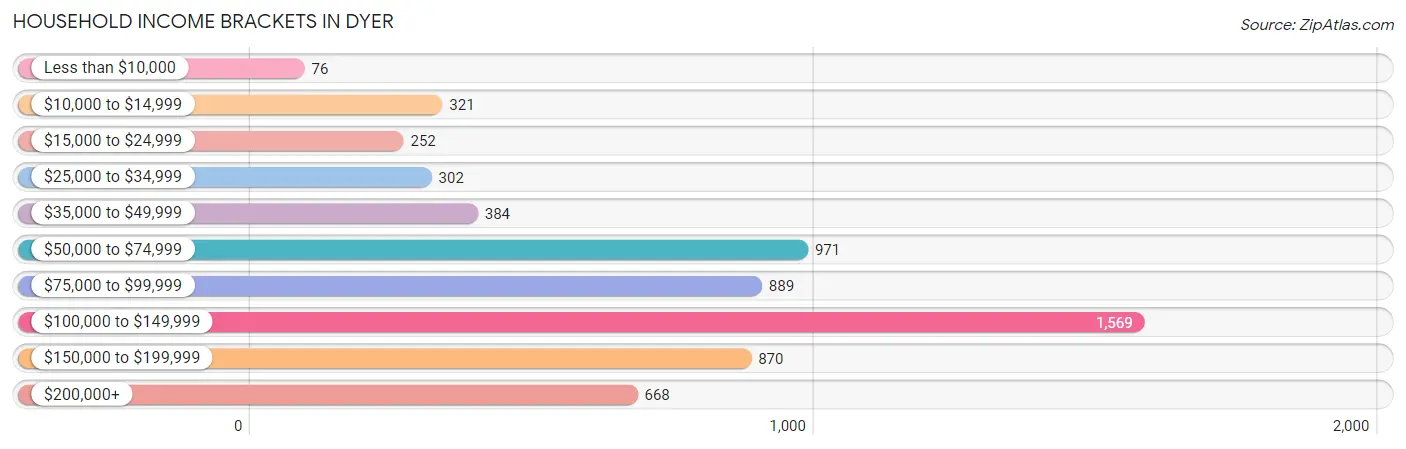
| Income Bracket | # Households | % Households |
| Less than $10,000 | 76 | 1.2% |
| $10,000 to $14,999 | 321 | 5.1% |
| $15,000 to $24,999 | 252 | 4.0% |
| $25,000 to $34,999 | 302 | 4.8% |
| $35,000 to $49,999 | 384 | 6.1% |
| $50,000 to $74,999 | 971 | 15.4% |
| $75,000 to $99,999 | 889 | 14.1% |
| $100,000 to $149,999 | 1,569 | 24.9% |
| $150,000 to $199,999 | 870 | 13.8% |
| $200,000+ | 668 | 10.6% |
Household Income by Householder Age in Dyer
The median household income in Dyer is $98,631, with the highest median household income of $125,781 found in the 45 to 64 years age bracket for the primary householder. A total of 2,098 households (33.3%) fall into this category. Meanwhile, the 15 to 24 years age bracket for the primary householder has the lowest median household income of $0, with 37 households (0.6%) in this group.
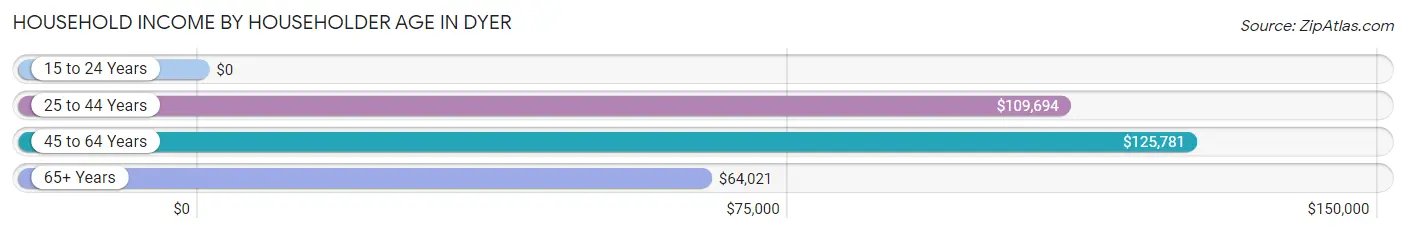
| Income Bracket | # Households | Median Income |
| 15 to 24 Years | 37 (0.6%) | $0 |
| 25 to 44 Years | 1,952 (31.0%) | $109,694 |
| 45 to 64 Years | 2,098 (33.3%) | $125,781 |
| 65+ Years | 2,215 (35.1%) | $64,021 |
| Total | 6,302 (100.0%) | $98,631 |
Poverty in Dyer
Income Below Poverty by Sex and Age in Dyer
With 2.2% poverty level for males and 8.5% for females among the residents of Dyer, 15 year old males and under 5 year old females are the most vulnerable to poverty, with 46 males (29.7%) and 239 females (39.6%) in their respective age groups living below the poverty level.
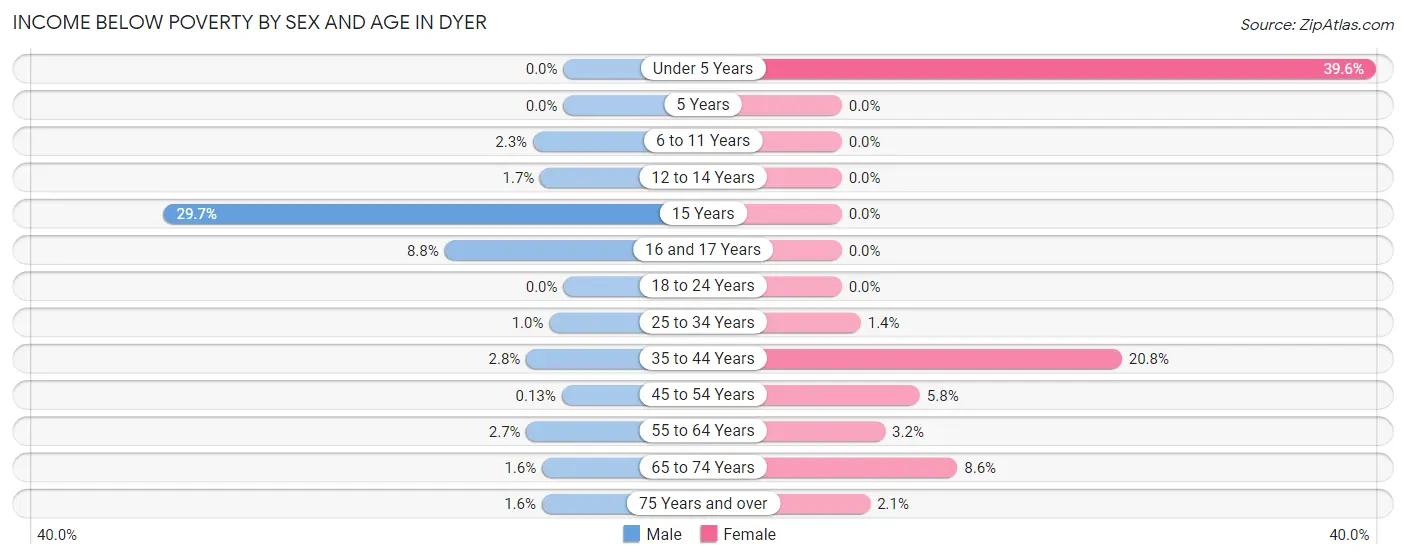
| Age Bracket | Male | Female |
| Under 5 Years | 0 (0.0%) | 239 (39.6%) |
| 5 Years | 0 (0.0%) | 0 (0.0%) |
| 6 to 11 Years | 12 (2.3%) | 0 (0.0%) |
| 12 to 14 Years | 6 (1.7%) | 0 (0.0%) |
| 15 Years | 46 (29.7%) | 0 (0.0%) |
| 16 and 17 Years | 9 (8.8%) | 0 (0.0%) |
| 18 to 24 Years | 0 (0.0%) | 0 (0.0%) |
| 25 to 34 Years | 10 (1.0%) | 13 (1.4%) |
| 35 to 44 Years | 29 (2.8%) | 238 (20.8%) |
| 45 to 54 Years | 1 (0.1%) | 74 (5.8%) |
| 55 to 64 Years | 29 (2.7%) | 33 (3.2%) |
| 65 to 74 Years | 13 (1.6%) | 122 (8.6%) |
| 75 Years and over | 12 (1.6%) | 13 (2.1%) |
| Total | 167 (2.2%) | 732 (8.5%) |
Income Above Poverty by Sex and Age in Dyer
According to the poverty statistics in Dyer, males aged under 5 years and females aged 5 years are the age groups that are most secure financially, with 100.0% of males and 100.0% of females in these age groups living above the poverty line.
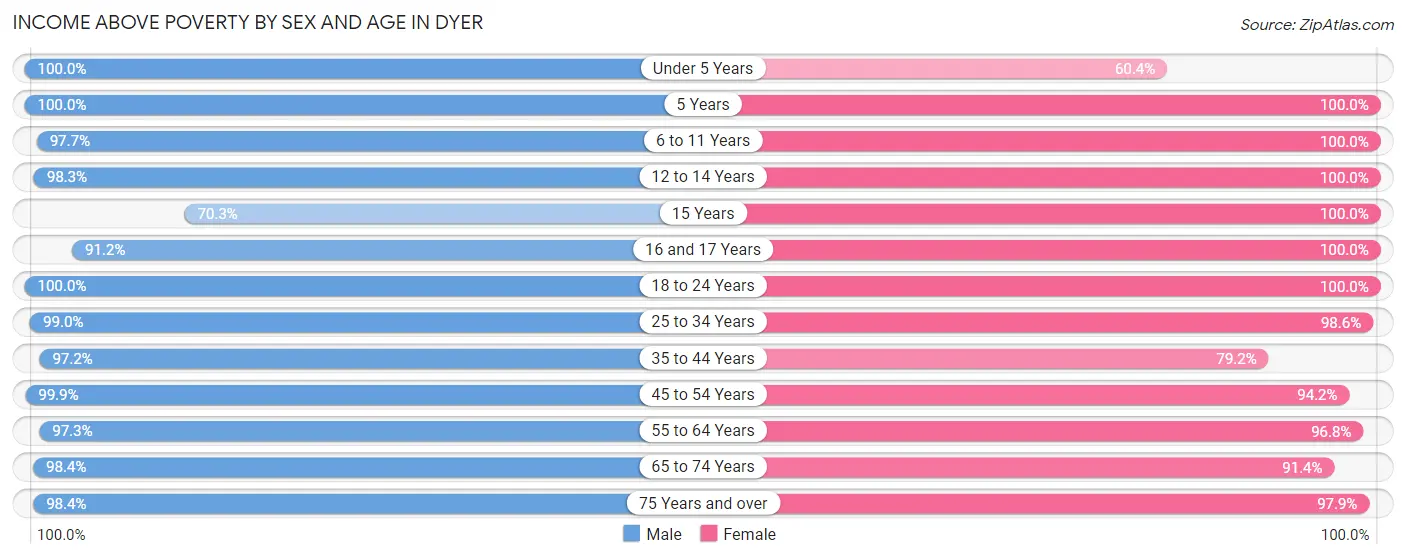
| Age Bracket | Male | Female |
| Under 5 Years | 472 (100.0%) | 364 (60.4%) |
| 5 Years | 46 (100.0%) | 101 (100.0%) |
| 6 to 11 Years | 519 (97.7%) | 337 (100.0%) |
| 12 to 14 Years | 343 (98.3%) | 297 (100.0%) |
| 15 Years | 109 (70.3%) | 66 (100.0%) |
| 16 and 17 Years | 93 (91.2%) | 144 (100.0%) |
| 18 to 24 Years | 440 (100.0%) | 632 (100.0%) |
| 25 to 34 Years | 947 (99.0%) | 908 (98.6%) |
| 35 to 44 Years | 1,023 (97.2%) | 907 (79.2%) |
| 45 to 54 Years | 768 (99.9%) | 1,201 (94.2%) |
| 55 to 64 Years | 1,030 (97.3%) | 992 (96.8%) |
| 65 to 74 Years | 809 (98.4%) | 1,300 (91.4%) |
| 75 Years and over | 739 (98.4%) | 603 (97.9%) |
| Total | 7,338 (97.8%) | 7,852 (91.5%) |
Income Below Poverty Among Married-Couple Families in Dyer
The poverty statistics for married-couple families in Dyer show that 0.7% or 25 of the total 3,529 families live below the poverty line. Families with no children have the highest poverty rate of 1.1%, comprising of 25 families. On the other hand, families with 1 or 2 children have the lowest poverty rate of 0.0%, which includes 0 families.
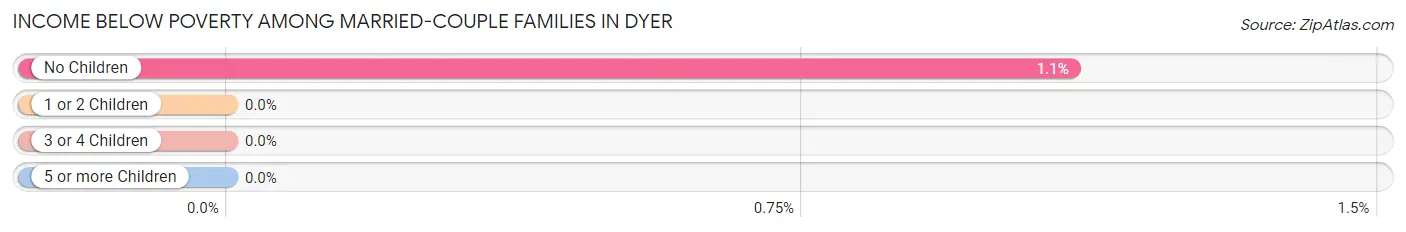
| Children | Above Poverty | Below Poverty |
| No Children | 2,252 (98.9%) | 25 (1.1%) |
| 1 or 2 Children | 1,036 (100.0%) | 0 (0.0%) |
| 3 or 4 Children | 216 (100.0%) | 0 (0.0%) |
| 5 or more Children | 0 (0.0%) | 0 (0.0%) |
| Total | 3,504 (99.3%) | 25 (0.7%) |
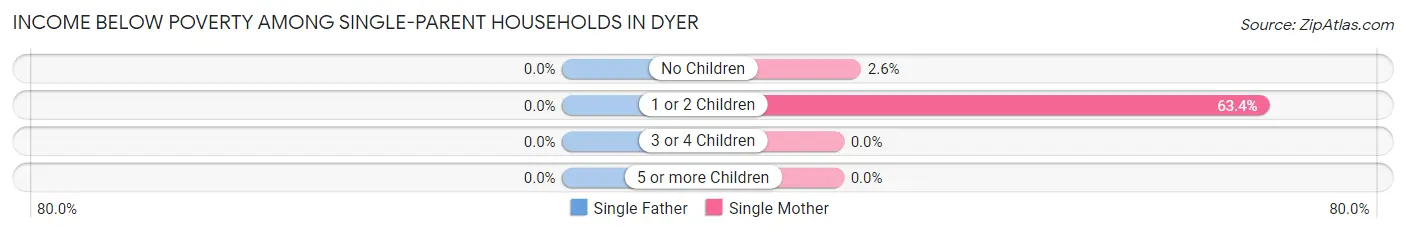
Income Below Poverty Among Single-Parent Households in Dyer
| Children | Single Father | Single Mother |
| No Children | 0 (0.0%) | 9 (2.6%) |
| 1 or 2 Children | 0 (0.0%) | 295 (63.4%) |
| 3 or 4 Children | 0 (0.0%) | 0 (0.0%) |
| 5 or more Children | 0 (0.0%) | 0 (0.0%) |
| Total | 0 (0.0%) | 304 (35.5%) |
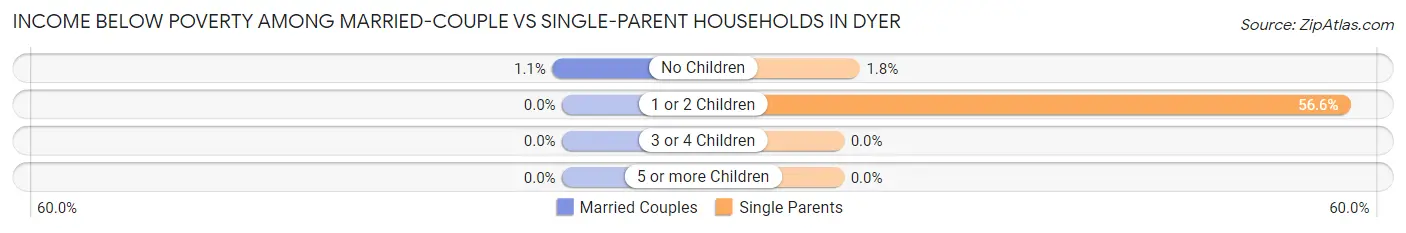
Income Below Poverty Among Married-Couple vs Single-Parent Households in Dyer
The poverty data for Dyer shows that 25 of the married-couple family households (0.7%) and 304 of the single-parent households (28.2%) are living below the poverty level. Within the married-couple family households, those with no children have the highest poverty rate, with 25 households (1.1%) falling below the poverty line. Among the single-parent households, those with 1 or 2 children have the highest poverty rate, with 295 household (56.6%) living below poverty.
| Children | Married-Couple Families | Single-Parent Households |
| No Children | 25 (1.1%) | 9 (1.8%) |
| 1 or 2 Children | 0 (0.0%) | 295 (56.6%) |
| 3 or 4 Children | 0 (0.0%) | 0 (0.0%) |
| 5 or more Children | 0 (0.0%) | 0 (0.0%) |
| Total | 25 (0.7%) | 304 (28.2%) |
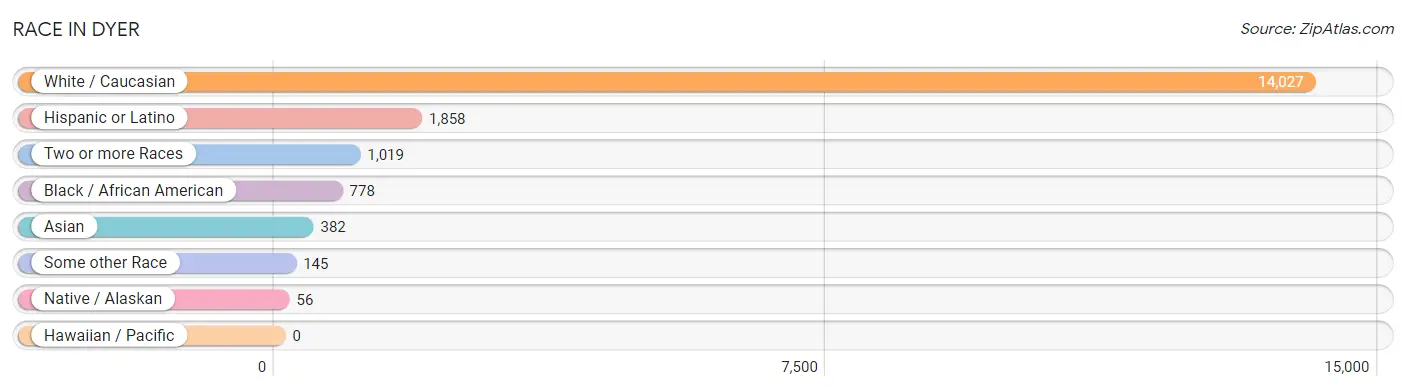
Race in Dyer
The most populous races in Dyer are White / Caucasian (14,027 | 85.5%), Hispanic or Latino (1,858 | 11.3%), and Two or more Races (1,019 | 6.2%).
| Race | # Population | % Population |
| Asian | 382 | 2.3% |
| Black / African American | 778 | 4.7% |
| Hawaiian / Pacific | 0 | 0.0% |
| Hispanic or Latino | 1,858 | 11.3% |
| Native / Alaskan | 56 | 0.3% |
| White / Caucasian | 14,027 | 85.5% |
| Two or more Races | 1,019 | 6.2% |
| Some other Race | 145 | 0.9% |
| Total | 16,407 | 100.0% |
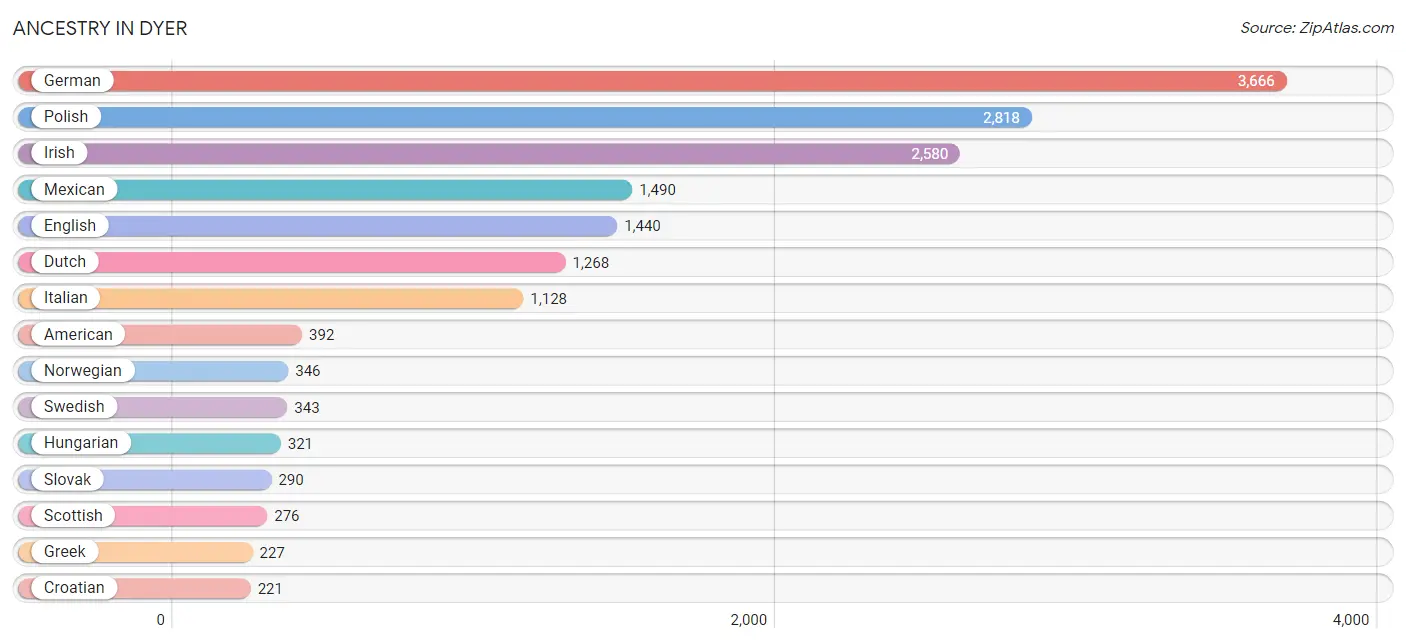
Ancestry in Dyer
The most populous ancestries reported in Dyer are German (3,666 | 22.3%), Polish (2,818 | 17.2%), Irish (2,580 | 15.7%), Mexican (1,490 | 9.1%), and English (1,440 | 8.8%), together accounting for 73.1% of all Dyer residents.
| Ancestry | # Population | % Population |
| African | 20 | 0.1% |
| American | 392 | 2.4% |
| Apache | 23 | 0.1% |
| Arab | 43 | 0.3% |
| Austrian | 60 | 0.4% |
| Belgian | 13 | 0.1% |
| Bhutanese | 34 | 0.2% |
| Blackfeet | 23 | 0.1% |
| British | 54 | 0.3% |
| Burmese | 32 | 0.2% |
| Canadian | 19 | 0.1% |
| Central American | 35 | 0.2% |
| Cherokee | 55 | 0.3% |
| Croatian | 221 | 1.3% |
| Cuban | 22 | 0.1% |
| Czech | 169 | 1.0% |
| Czechoslovakian | 18 | 0.1% |
| Dutch | 1,268 | 7.7% |
| English | 1,440 | 8.8% |
| European | 99 | 0.6% |
| Filipino | 21 | 0.1% |
| French | 189 | 1.1% |
| German | 3,666 | 22.3% |
| Ghanaian | 37 | 0.2% |
| Greek | 227 | 1.4% |
| Hungarian | 321 | 2.0% |
| Irish | 2,580 | 15.7% |
| Israeli | 45 | 0.3% |
| Italian | 1,128 | 6.9% |
| Jamaican | 10 | 0.1% |
| Korean | 211 | 1.3% |
| Lebanese | 17 | 0.1% |
| Lithuanian | 113 | 0.7% |
| Luxembourger | 39 | 0.2% |
| Macedonian | 15 | 0.1% |
| Mexican | 1,490 | 9.1% |
| Mexican American Indian | 15 | 0.1% |
| Nicaraguan | 18 | 0.1% |
| Nigerian | 6 | 0.0% |
| Norwegian | 346 | 2.1% |
| Panamanian | 17 | 0.1% |
| Polish | 2,818 | 17.2% |
| Puerto Rican | 151 | 0.9% |
| Romanian | 19 | 0.1% |
| Russian | 77 | 0.5% |
| Scotch-Irish | 133 | 0.8% |
| Scottish | 276 | 1.7% |
| Serbian | 104 | 0.6% |
| Slovak | 290 | 1.8% |
| Slovene | 16 | 0.1% |
| South American | 17 | 0.1% |
| Spaniard | 38 | 0.2% |
| Spanish | 94 | 0.6% |
| Sri Lankan | 56 | 0.3% |
| Subsaharan African | 63 | 0.4% |
| Swedish | 343 | 2.1% |
| Swiss | 52 | 0.3% |
| Thai | 157 | 1.0% |
| Ukrainian | 81 | 0.5% |
| Venezuelan | 17 | 0.1% |
| Welsh | 137 | 0.8% |
| Yugoslavian | 31 | 0.2% | View All 62 Rows |
Immigrants in Dyer
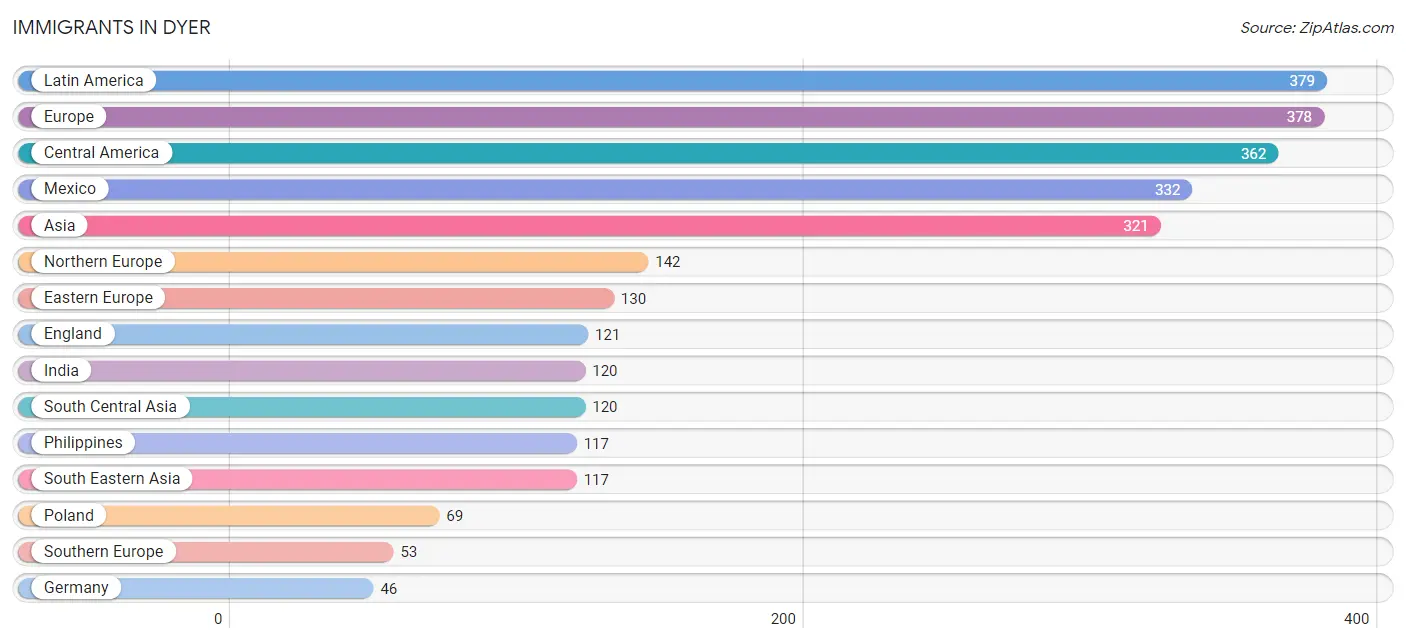
The most numerous immigrant groups reported in Dyer came from Latin America (379 | 2.3%), Europe (378 | 2.3%), Central America (362 | 2.2%), Mexico (332 | 2.0%), and Asia (321 | 2.0%), together accounting for 10.8% of all Dyer residents.
| Immigration Origin | # Population | % Population |
| Africa | 44 | 0.3% |
| Asia | 321 | 2.0% |
| Central America | 362 | 2.2% |
| China | 7 | 0.0% |
| Croatia | 9 | 0.1% |
| Eastern Africa | 20 | 0.1% |
| Eastern Asia | 39 | 0.2% |
| Eastern Europe | 130 | 0.8% |
| England | 121 | 0.7% |
| Europe | 378 | 2.3% |
| Germany | 46 | 0.3% |
| Ghana | 24 | 0.2% |
| Greece | 18 | 0.1% |
| Honduras | 20 | 0.1% |
| India | 120 | 0.7% |
| Ireland | 21 | 0.1% |
| Israel | 45 | 0.3% |
| Italy | 16 | 0.1% |
| Korea | 32 | 0.2% |
| Latin America | 379 | 2.3% |
| Mexico | 332 | 2.0% |
| Nicaragua | 10 | 0.1% |
| Northern Europe | 142 | 0.9% |
| Philippines | 117 | 0.7% |
| Poland | 69 | 0.4% |
| Romania | 35 | 0.2% |
| Serbia | 17 | 0.1% |
| South America | 17 | 0.1% |
| South Central Asia | 120 | 0.7% |
| South Eastern Asia | 117 | 0.7% |
| Southern Europe | 53 | 0.3% |
| Spain | 19 | 0.1% |
| Taiwan | 7 | 0.0% |
| Venezuela | 17 | 0.1% |
| Western Africa | 24 | 0.2% |
| Western Asia | 45 | 0.3% |
| Western Europe | 46 | 0.3% | View All 37 Rows |
Sex and Age in Dyer
Sex and Age in Dyer
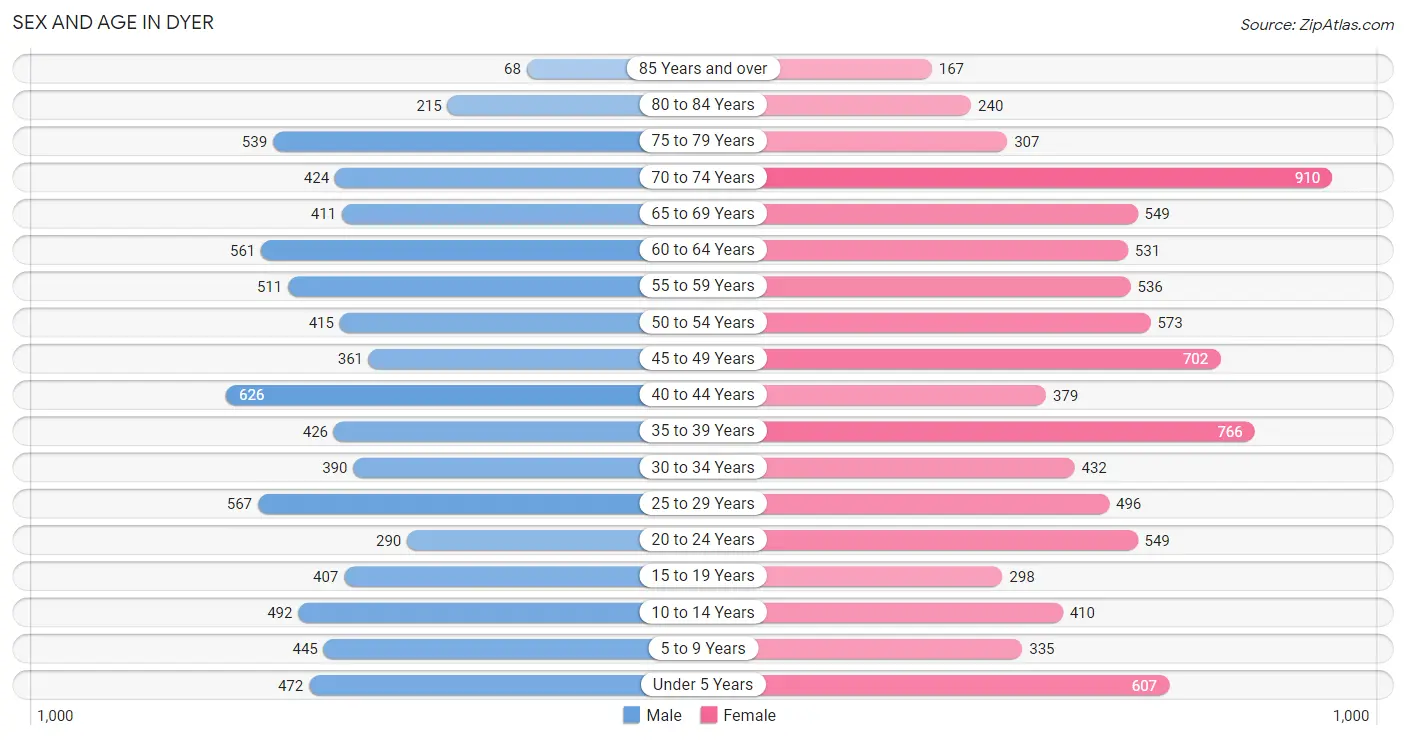
The most populous age groups in Dyer are 40 to 44 Years (626 | 8.2%) for men and 70 to 74 Years (910 | 10.4%) for women.
| Age Bracket | Male | Female |
| Under 5 Years | 472 (6.2%) | 607 (6.9%) |
| 5 to 9 Years | 445 (5.8%) | 335 (3.8%) |
| 10 to 14 Years | 492 (6.5%) | 410 (4.7%) |
| 15 to 19 Years | 407 (5.3%) | 298 (3.4%) |
| 20 to 24 Years | 290 (3.8%) | 549 (6.2%) |
| 25 to 29 Years | 567 (7.4%) | 496 (5.6%) |
| 30 to 34 Years | 390 (5.1%) | 432 (4.9%) |
| 35 to 39 Years | 426 (5.6%) | 766 (8.7%) |
| 40 to 44 Years | 626 (8.2%) | 379 (4.3%) |
| 45 to 49 Years | 361 (4.7%) | 702 (8.0%) |
| 50 to 54 Years | 415 (5.4%) | 573 (6.5%) |
| 55 to 59 Years | 511 (6.7%) | 536 (6.1%) |
| 60 to 64 Years | 561 (7.4%) | 531 (6.0%) |
| 65 to 69 Years | 411 (5.4%) | 549 (6.2%) |
| 70 to 74 Years | 424 (5.6%) | 910 (10.4%) |
| 75 to 79 Years | 539 (7.1%) | 307 (3.5%) |
| 80 to 84 Years | 215 (2.8%) | 240 (2.7%) |
| 85 Years and over | 68 (0.9%) | 167 (1.9%) |
| Total | 7,620 (100.0%) | 8,787 (100.0%) |
Families and Households in Dyer
Median Family Size in Dyer
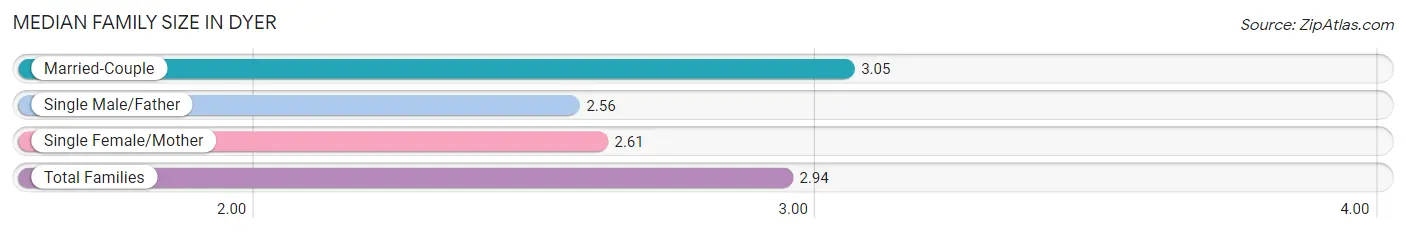
The median family size in Dyer is 2.94 persons per family, with married-couple families (3,529 | 76.6%) accounting for the largest median family size of 3.05 persons per family. On the other hand, single male/father families (222 | 4.8%) represent the smallest median family size with 2.56 persons per family.
| Family Type | # Families | Family Size |
| Married-Couple | 3,529 (76.6%) | 3.05 |
| Single Male/Father | 222 (4.8%) | 2.56 |
| Single Female/Mother | 856 (18.6%) | 2.61 |
| Total Families | 4,607 (100.0%) | 2.94 |
Median Household Size in Dyer
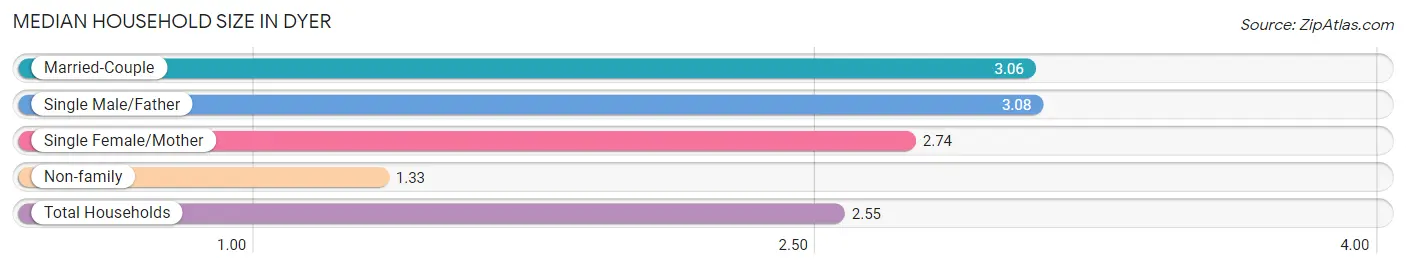
The median household size in Dyer is 2.55 persons per household, with single male/father households (222 | 3.5%) accounting for the largest median household size of 3.08 persons per household. non-family households (1,695 | 26.9%) represent the smallest median household size with 1.33 persons per household.
| Household Type | # Households | Household Size |
| Married-Couple | 3,529 (56.0%) | 3.06 |
| Single Male/Father | 222 (3.5%) | 3.08 |
| Single Female/Mother | 856 (13.6%) | 2.74 |
| Non-family | 1,695 (26.9%) | 1.33 |
| Total Households | 6,302 (100.0%) | 2.55 |
Household Size by Marriage Status in Dyer
Out of a total of 6,302 households in Dyer, 4,607 (73.1%) are family households, while 1,695 (26.9%) are nonfamily households. The most numerous type of family households are 2-person households, comprising 2,528, and the most common type of nonfamily households are 1-person households, comprising 1,304.
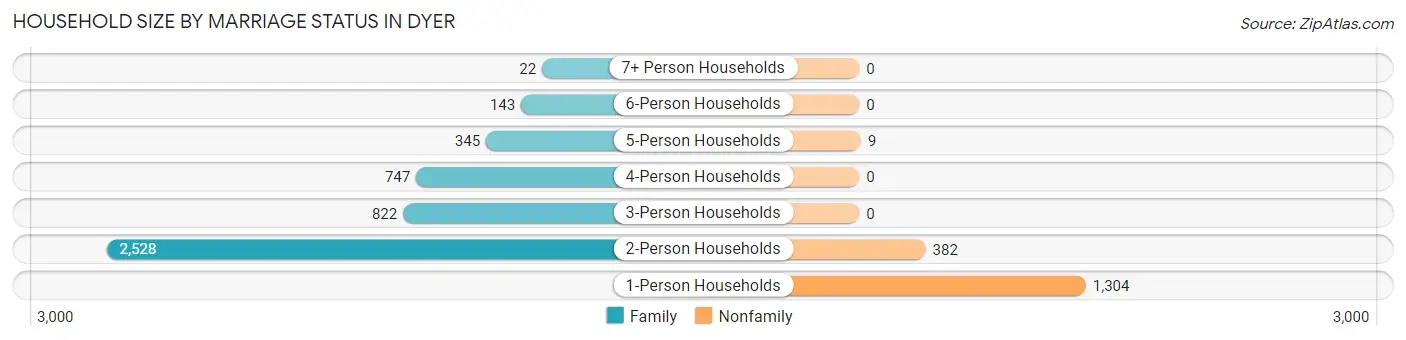
| Household Size | Family Households | Nonfamily Households |
| 1-Person Households | - | 1,304 (20.7%) |
| 2-Person Households | 2,528 (40.1%) | 382 (6.1%) |
| 3-Person Households | 822 (13.0%) | 0 (0.0%) |
| 4-Person Households | 747 (11.8%) | 0 (0.0%) |
| 5-Person Households | 345 (5.5%) | 9 (0.1%) |
| 6-Person Households | 143 (2.3%) | 0 (0.0%) |
| 7+ Person Households | 22 (0.4%) | 0 (0.0%) |
| Total | 4,607 (73.1%) | 1,695 (26.9%) |
Female Fertility in Dyer
Fertility by Age in Dyer
Average fertility rate in Dyer is 62.0 births per 1,000 women. Women in the age bracket of 20 to 34 years have the highest fertility rate with 131.0 births per 1,000 women. Women in the age bracket of 20 to 34 years acount for 84.0% of all women with births.
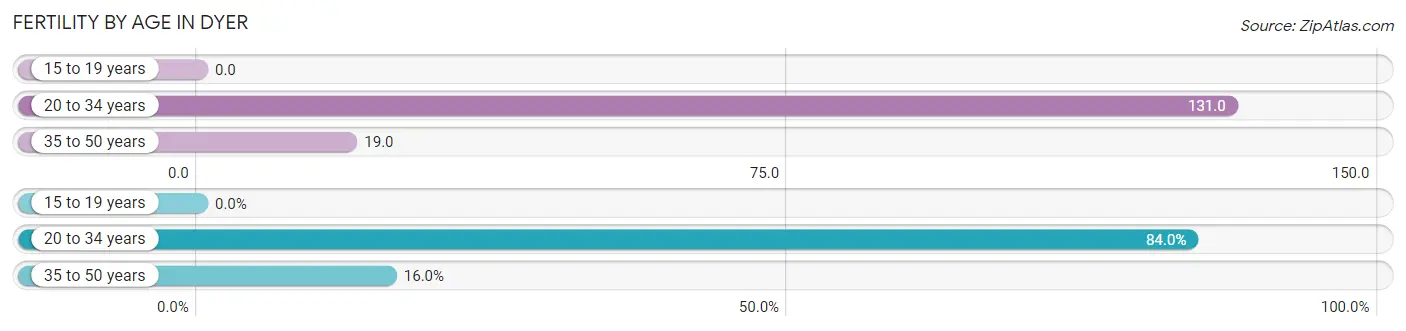
| Age Bracket | Women with Births | Births / 1,000 Women |
| 15 to 19 years | 0 (0.0%) | 0.0 |
| 20 to 34 years | 194 (84.0%) | 131.0 |
| 35 to 50 years | 37 (16.0%) | 19.0 |
| Total | 231 (100.0%) | 62.0 |
Fertility by Age by Marriage Status in Dyer
95.7% of women with births (231) in Dyer are married. The highest percentage of unmarried women with births falls into 20 to 34 years age bracket with 5.1% of them unmarried at the time of birth, while the lowest percentage of unmarried women with births belong to 35 to 50 years age bracket with 0.0% of them unmarried.
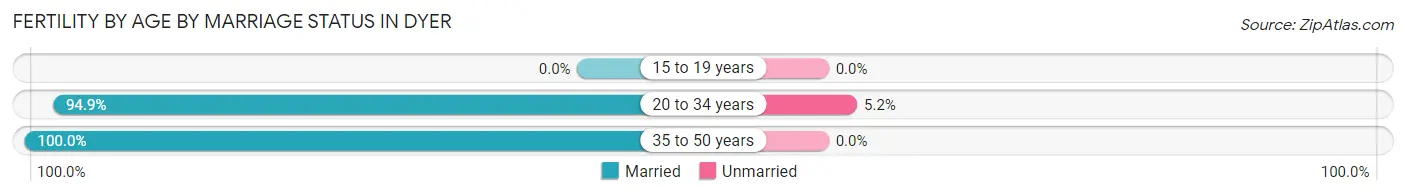
| Age Bracket | Married | Unmarried |
| 15 to 19 years | 0 (0.0%) | 0 (0.0%) |
| 20 to 34 years | 184 (94.9%) | 10 (5.1%) |
| 35 to 50 years | 37 (100.0%) | 0 (0.0%) |
| Total | 221 (95.7%) | 10 (4.3%) |
Fertility by Education in Dyer
Average fertility rate in Dyer is 62.0 births per 1,000 women. Women with the education attainment of bachelor's degree have the highest fertility rate of 155.0 births per 1,000 women, while women with the education attainment of high school diploma have the lowest fertility at 6.0 births per 1,000 women. Women with the education attainment of bachelor's degree represent 74.5% of all women with births.
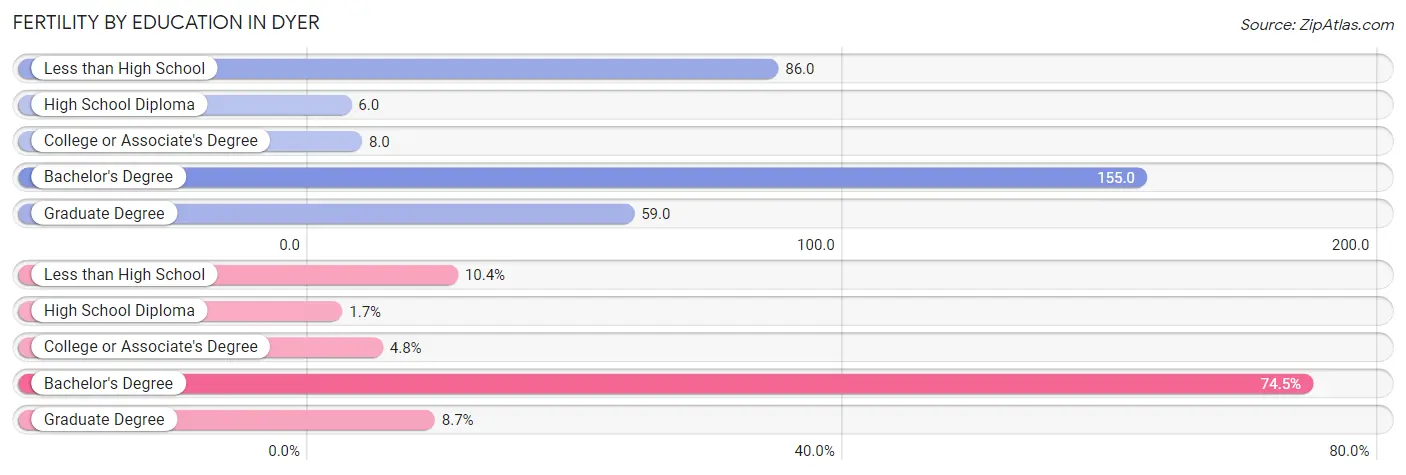
| Educational Attainment | Women with Births | Births / 1,000 Women |
| Less than High School | 24 (10.4%) | 86.0 |
| High School Diploma | 4 (1.7%) | 6.0 |
| College or Associate's Degree | 11 (4.8%) | 8.0 |
| Bachelor's Degree | 172 (74.5%) | 155.0 |
| Graduate Degree | 20 (8.7%) | 59.0 |
| Total | 231 (100.0%) | 62.0 |
Fertility by Education by Marriage Status in Dyer
4.3% of women with births in Dyer are unmarried. Women with the educational attainment of less than high school are most likely to be married with 100.0% of them married at childbirth, while women with the educational attainment of bachelor's degree are least likely to be married with 5.8% of them unmarried at childbirth.
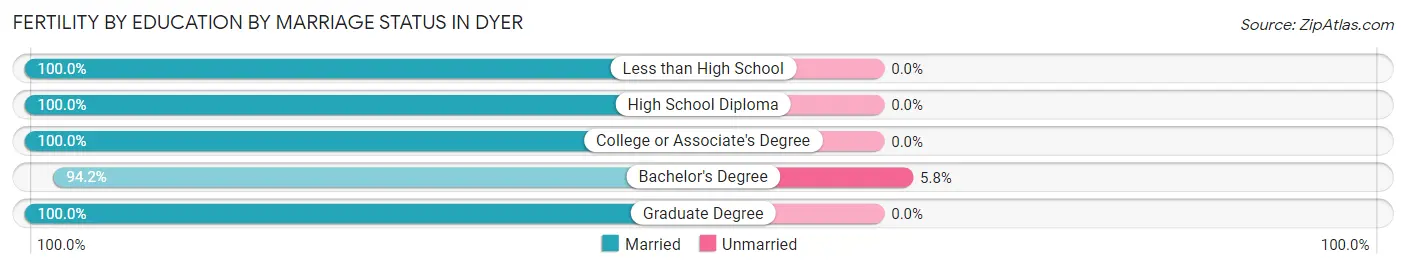
| Educational Attainment | Married | Unmarried |
| Less than High School | 24 (100.0%) | 0 (0.0%) |
| High School Diploma | 4 (100.0%) | 0 (0.0%) |
| College or Associate's Degree | 11 (100.0%) | 0 (0.0%) |
| Bachelor's Degree | 162 (94.2%) | 10 (5.8%) |
| Graduate Degree | 20 (100.0%) | 0 (0.0%) |
| Total | 221 (95.7%) | 10 (4.3%) |
Employment Characteristics in Dyer
Employment by Class of Employer in Dyer
Among the 8,211 employed individuals in Dyer, private company employees (5,923 | 72.1%), not-for-profit organizations (726 | 8.8%), and local government employees (548 | 6.7%) make up the most common classes of employment.
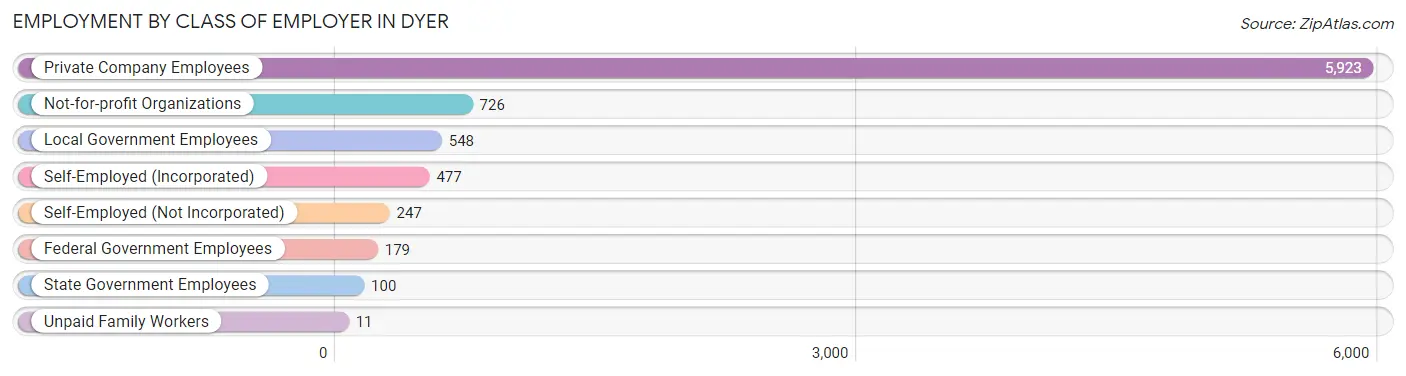
| Employer Class | # Employees | % Employees |
| Private Company Employees | 5,923 | 72.1% |
| Self-Employed (Incorporated) | 477 | 5.8% |
| Self-Employed (Not Incorporated) | 247 | 3.0% |
| Not-for-profit Organizations | 726 | 8.8% |
| Local Government Employees | 548 | 6.7% |
| State Government Employees | 100 | 1.2% |
| Federal Government Employees | 179 | 2.2% |
| Unpaid Family Workers | 11 | 0.1% |
| Total | 8,211 | 100.0% |
Employment Status by Age in Dyer
According to the labor force statistics for Dyer, out of the total population over 16 years of age (13,420), 64.0% or 8,589 individuals are in the labor force, with 3.6% or 309 of them unemployed. The age group with the highest labor force participation rate is 20 to 24 years, with 95.7% or 803 individuals in the labor force. Within the labor force, the 60 to 64 years age range has the highest percentage of unemployed individuals, with 11.7% or 79 of them being unemployed.
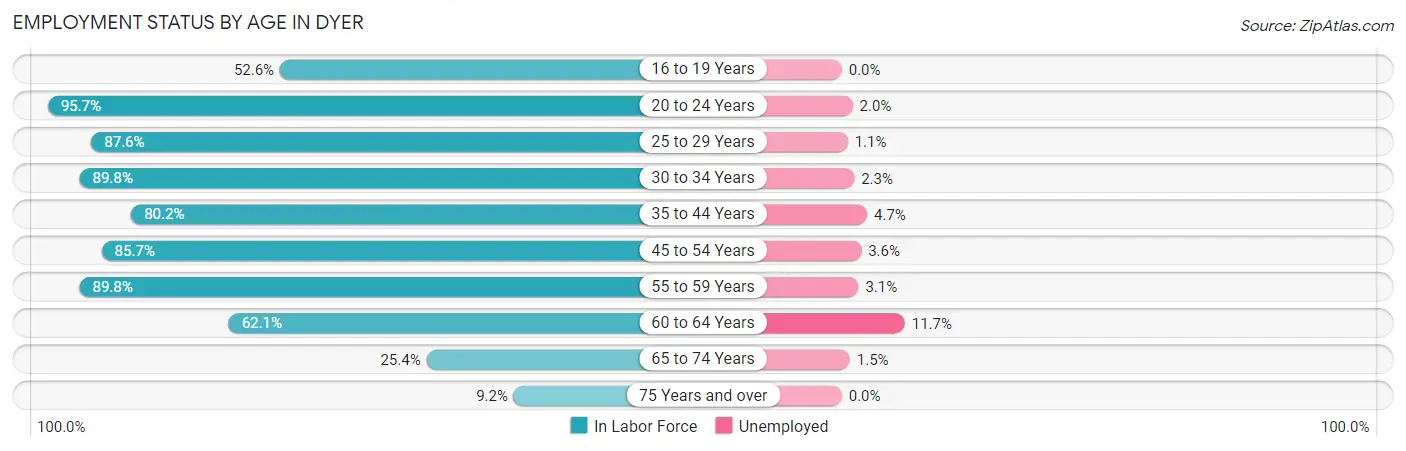
| Age Bracket | In Labor Force | Unemployed |
| 16 to 19 Years | 252 (52.6%) | 0 (0.0%) |
| 20 to 24 Years | 803 (95.7%) | 16 (2.0%) |
| 25 to 29 Years | 931 (87.6%) | 10 (1.1%) |
| 30 to 34 Years | 738 (89.8%) | 17 (2.3%) |
| 35 to 44 Years | 1,762 (80.2%) | 83 (4.7%) |
| 45 to 54 Years | 1,758 (85.7%) | 63 (3.6%) |
| 55 to 59 Years | 940 (89.8%) | 29 (3.1%) |
| 60 to 64 Years | 678 (62.1%) | 79 (11.7%) |
| 65 to 74 Years | 583 (25.4%) | 9 (1.5%) |
| 75 Years and over | 141 (9.2%) | 0 (0.0%) |
| Total | 8,589 (64.0%) | 309 (3.6%) |
Employment Status by Educational Attainment in Dyer
According to labor force statistics for Dyer, 82.3% of individuals (6,808) out of the total population between 25 and 64 years of age (8,272) are in the labor force, with 4.1% or 279 of them being unemployed. The group with the highest labor force participation rate are those with the educational attainment of bachelor's degree or higher, with 89.7% or 2,989 individuals in the labor force. Within the labor force, individuals with high school diploma education have the highest percentage of unemployment, with 6.4% or 96 of them being unemployed.
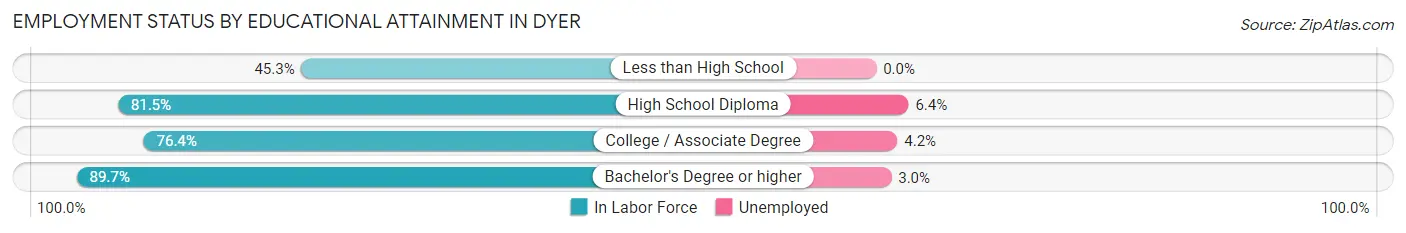
| Educational Attainment | In Labor Force | Unemployed |
| Less than High School | 72 (45.3%) | 0 (0.0%) |
| High School Diploma | 1,499 (81.5%) | 118 (6.4%) |
| College / Associate Degree | 2,248 (76.4%) | 124 (4.2%) |
| Bachelor's Degree or higher | 2,989 (89.7%) | 100 (3.0%) |
| Total | 6,808 (82.3%) | 339 (4.1%) |
Employment Occupations by Sex in Dyer
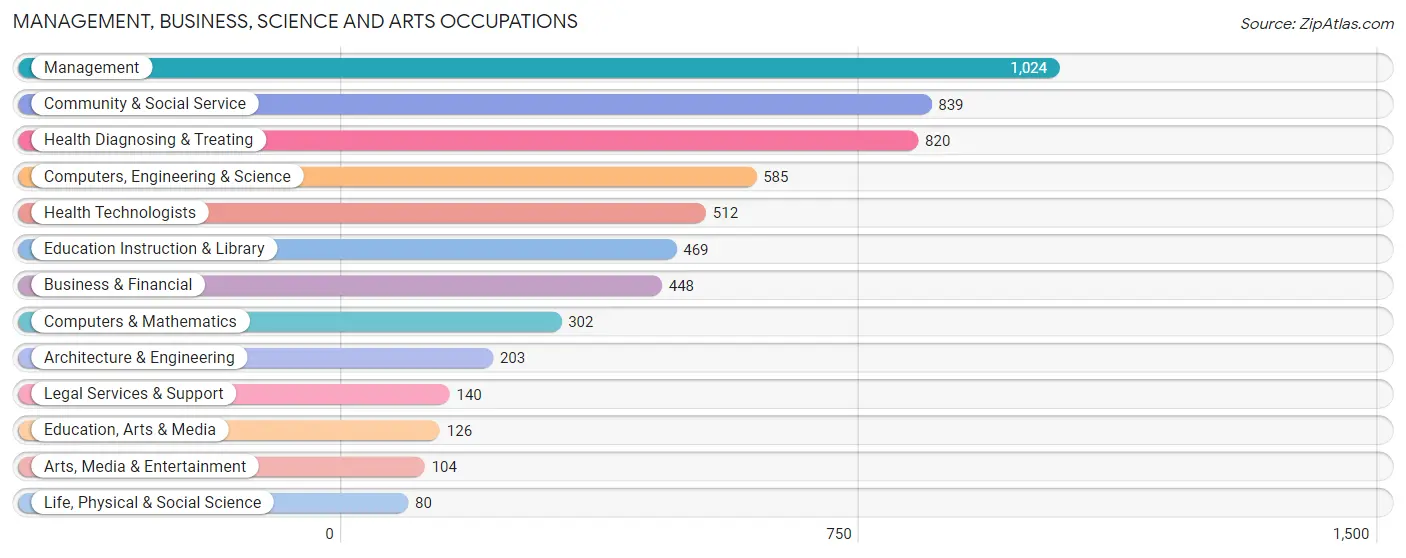
Management, Business, Science and Arts Occupations
The most common Management, Business, Science and Arts occupations in Dyer are Management (1,024 | 12.4%), Community & Social Service (839 | 10.1%), Health Diagnosing & Treating (820 | 9.9%), Computers, Engineering & Science (585 | 7.1%), and Health Technologists (512 | 6.2%).
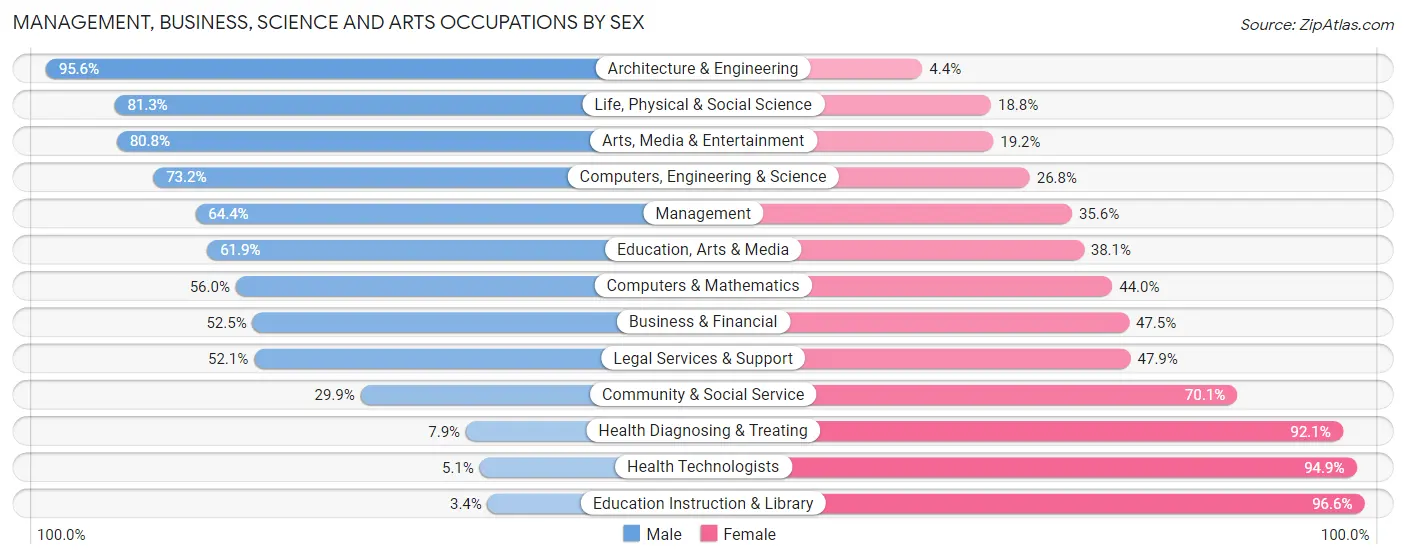
Management, Business, Science and Arts Occupations by Sex
Within the Management, Business, Science and Arts occupations in Dyer, the most male-oriented occupations are Architecture & Engineering (95.6%), Life, Physical & Social Science (81.2%), and Arts, Media & Entertainment (80.8%), while the most female-oriented occupations are Education Instruction & Library (96.6%), Health Technologists (94.9%), and Health Diagnosing & Treating (92.1%).
| Occupation | Male | Female |
| Management | 659 (64.4%) | 365 (35.6%) |
| Business & Financial | 235 (52.5%) | 213 (47.5%) |
| Computers, Engineering & Science | 428 (73.2%) | 157 (26.8%) |
| Computers & Mathematics | 169 (56.0%) | 133 (44.0%) |
| Architecture & Engineering | 194 (95.6%) | 9 (4.4%) |
| Life, Physical & Social Science | 65 (81.2%) | 15 (18.8%) |
| Community & Social Service | 251 (29.9%) | 588 (70.1%) |
| Education, Arts & Media | 78 (61.9%) | 48 (38.1%) |
| Legal Services & Support | 73 (52.1%) | 67 (47.9%) |
| Education Instruction & Library | 16 (3.4%) | 453 (96.6%) |
| Arts, Media & Entertainment | 84 (80.8%) | 20 (19.2%) |
| Health Diagnosing & Treating | 65 (7.9%) | 755 (92.1%) |
| Health Technologists | 26 (5.1%) | 486 (94.9%) |
| Total (Category) | 1,638 (44.1%) | 2,078 (55.9%) |
| Total (Overall) | 4,133 (49.9%) | 4,147 (50.1%) |
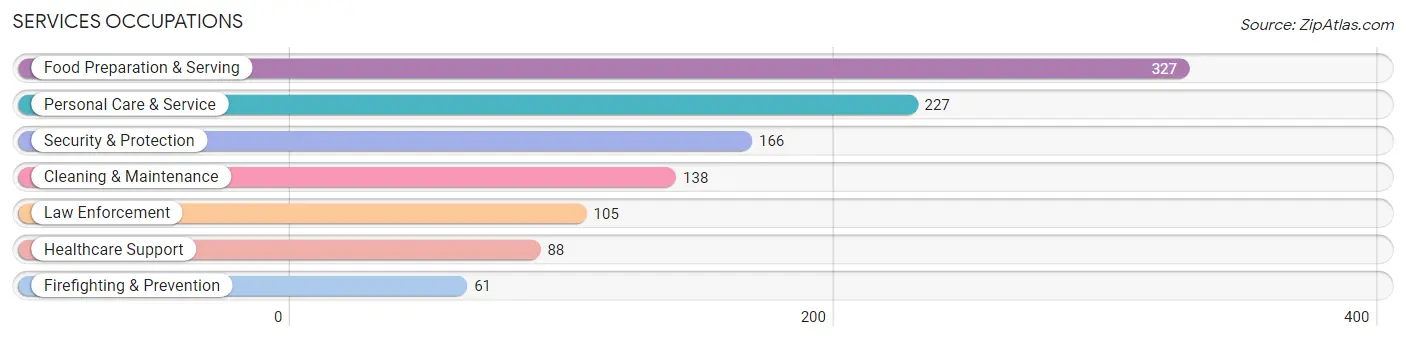
Services Occupations
The most common Services occupations in Dyer are Food Preparation & Serving (327 | 4.0%), Personal Care & Service (227 | 2.7%), Security & Protection (166 | 2.0%), Cleaning & Maintenance (138 | 1.7%), and Law Enforcement (105 | 1.3%).
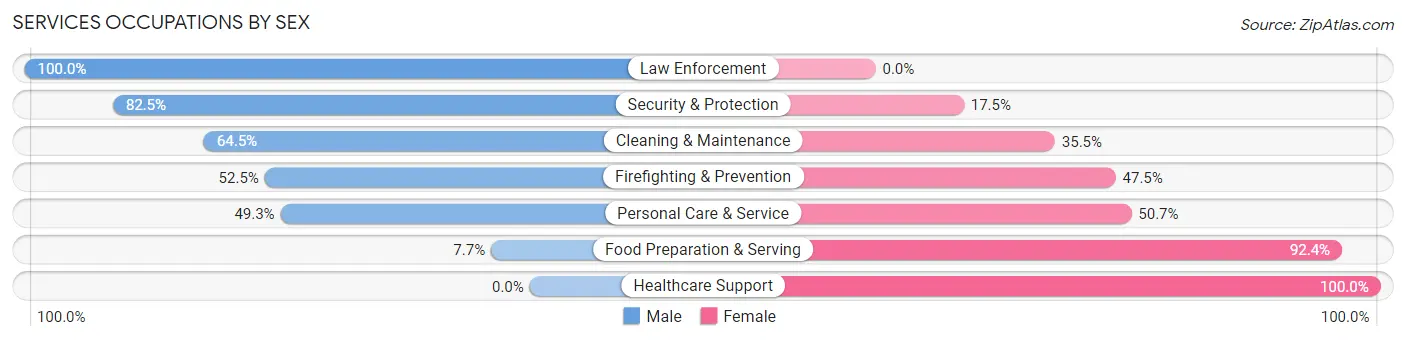
Services Occupations by Sex
Within the Services occupations in Dyer, the most male-oriented occupations are Law Enforcement (100.0%), Security & Protection (82.5%), and Cleaning & Maintenance (64.5%), while the most female-oriented occupations are Healthcare Support (100.0%), Food Preparation & Serving (92.3%), and Personal Care & Service (50.7%).
| Occupation | Male | Female |
| Healthcare Support | 0 (0.0%) | 88 (100.0%) |
| Security & Protection | 137 (82.5%) | 29 (17.5%) |
| Firefighting & Prevention | 32 (52.5%) | 29 (47.5%) |
| Law Enforcement | 105 (100.0%) | 0 (0.0%) |
| Food Preparation & Serving | 25 (7.6%) | 302 (92.3%) |
| Cleaning & Maintenance | 89 (64.5%) | 49 (35.5%) |
| Personal Care & Service | 112 (49.3%) | 115 (50.7%) |
| Total (Category) | 363 (38.4%) | 583 (61.6%) |
| Total (Overall) | 4,133 (49.9%) | 4,147 (50.1%) |
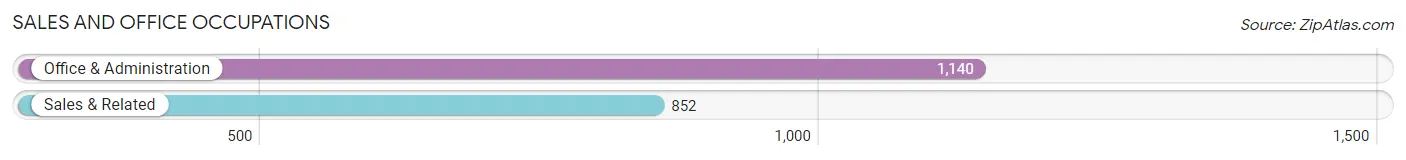
Sales and Office Occupations
The most common Sales and Office occupations in Dyer are Office & Administration (1,140 | 13.8%), and Sales & Related (852 | 10.3%).
Sales and Office Occupations by Sex
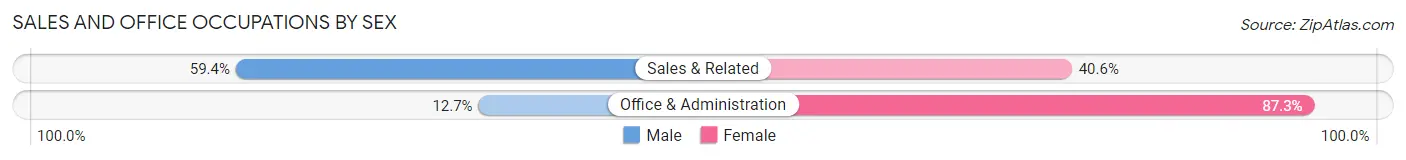
| Occupation | Male | Female |
| Sales & Related | 506 (59.4%) | 346 (40.6%) |
| Office & Administration | 145 (12.7%) | 995 (87.3%) |
| Total (Category) | 651 (32.7%) | 1,341 (67.3%) |
| Total (Overall) | 4,133 (49.9%) | 4,147 (50.1%) |
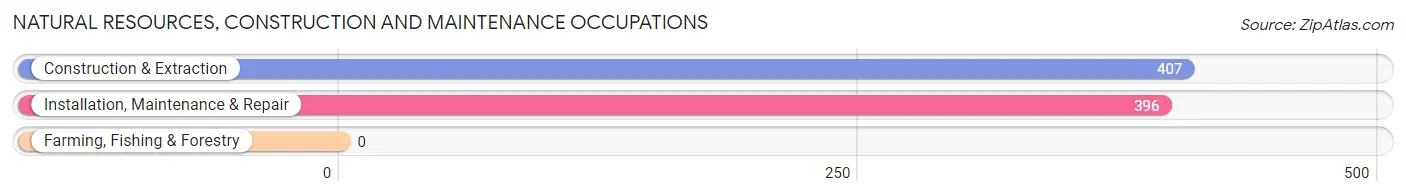
Natural Resources, Construction and Maintenance Occupations
The most common Natural Resources, Construction and Maintenance occupations in Dyer are Construction & Extraction (407 | 4.9%), and Installation, Maintenance & Repair (396 | 4.8%).
Natural Resources, Construction and Maintenance Occupations by Sex
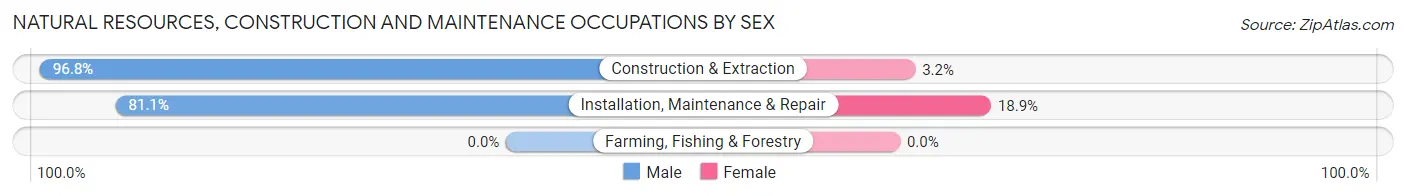
| Occupation | Male | Female |
| Farming, Fishing & Forestry | 0 (0.0%) | 0 (0.0%) |
| Construction & Extraction | 394 (96.8%) | 13 (3.2%) |
| Installation, Maintenance & Repair | 321 (81.1%) | 75 (18.9%) |
| Total (Category) | 715 (89.0%) | 88 (11.0%) |
| Total (Overall) | 4,133 (49.9%) | 4,147 (50.1%) |
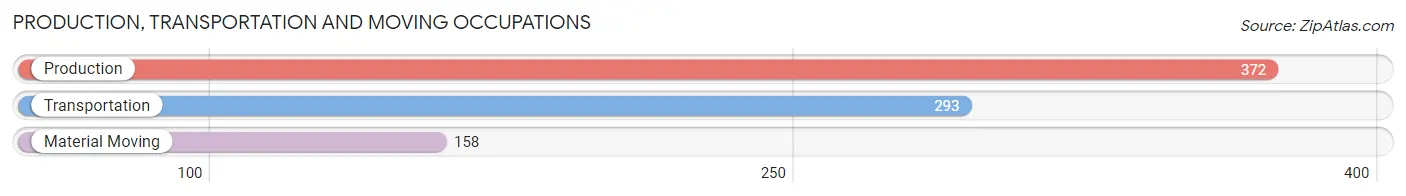
Production, Transportation and Moving Occupations
The most common Production, Transportation and Moving occupations in Dyer are Production (372 | 4.5%), Transportation (293 | 3.5%), and Material Moving (158 | 1.9%).
Production, Transportation and Moving Occupations by Sex
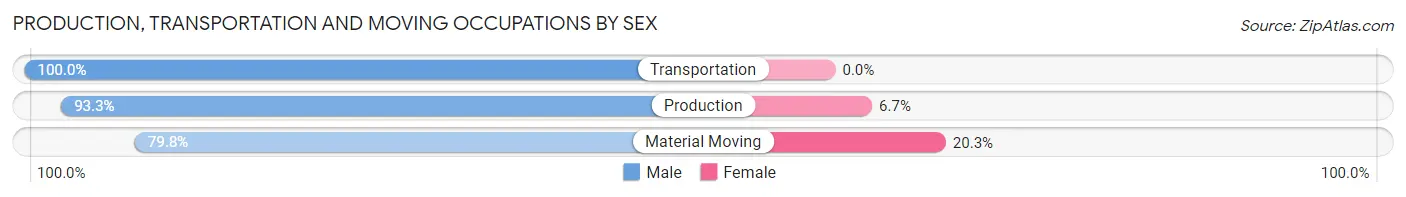
| Occupation | Male | Female |
| Production | 347 (93.3%) | 25 (6.7%) |
| Transportation | 293 (100.0%) | 0 (0.0%) |
| Material Moving | 126 (79.7%) | 32 (20.3%) |
| Total (Category) | 766 (93.1%) | 57 (6.9%) |
| Total (Overall) | 4,133 (49.9%) | 4,147 (50.1%) |
Employment Industries by Sex in Dyer
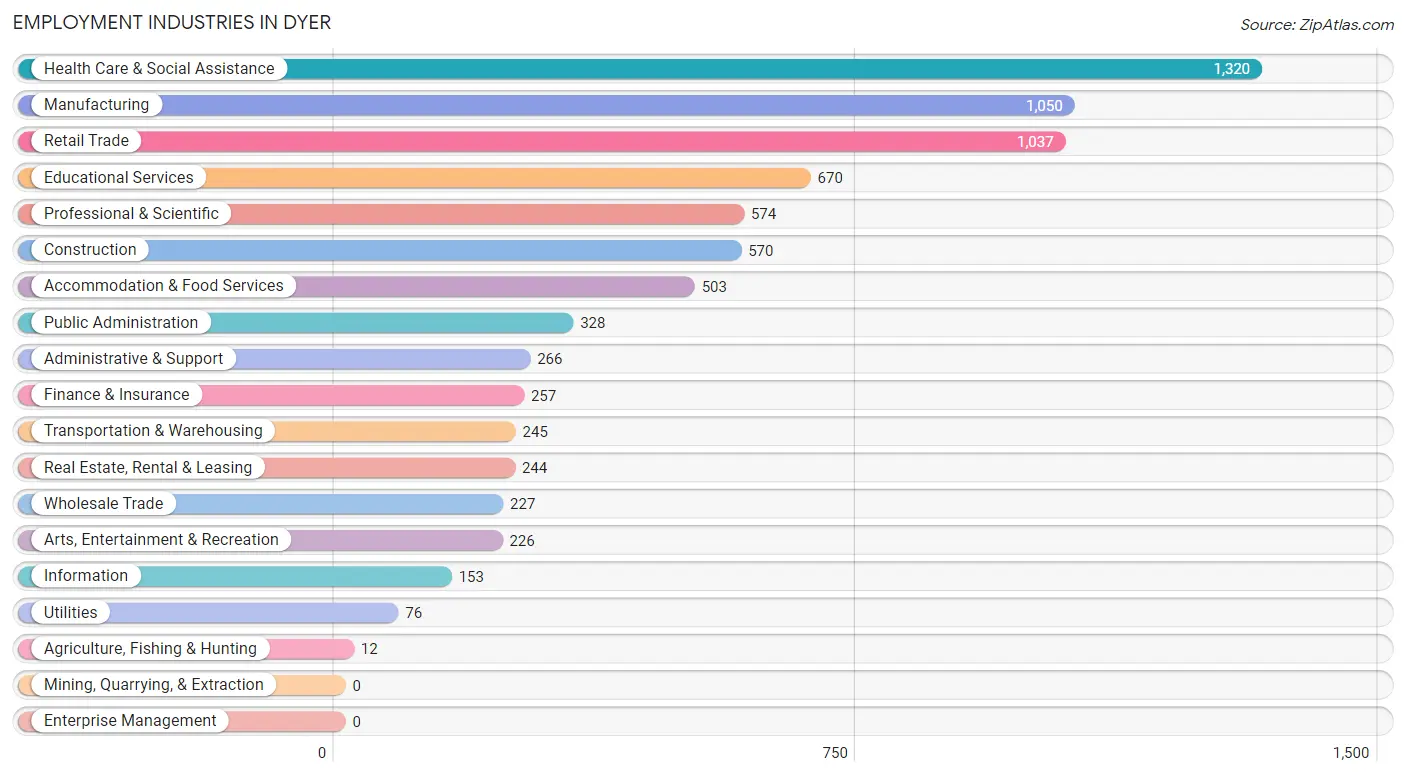
Employment Industries in Dyer
The major employment industries in Dyer include Health Care & Social Assistance (1,320 | 15.9%), Manufacturing (1,050 | 12.7%), Retail Trade (1,037 | 12.5%), Educational Services (670 | 8.1%), and Professional & Scientific (574 | 6.9%).
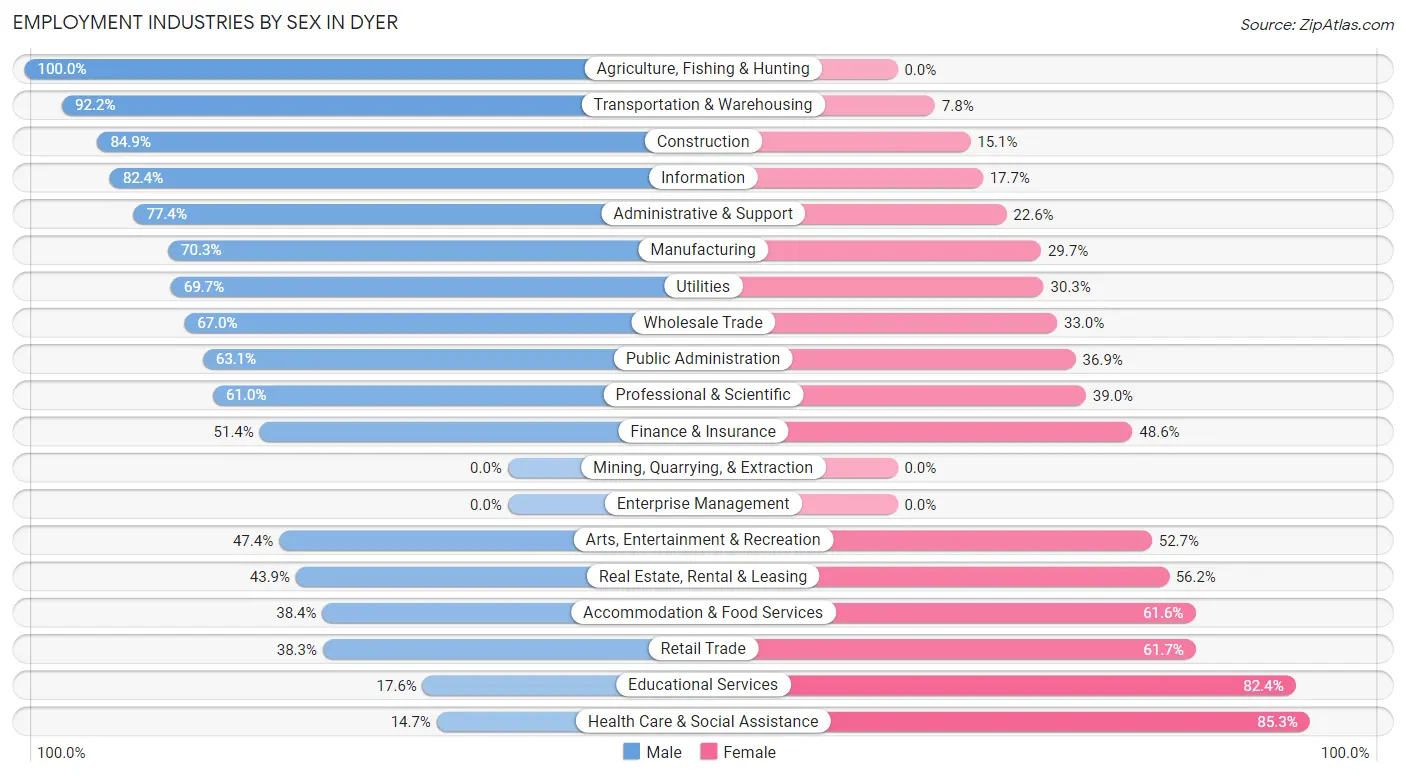
Employment Industries by Sex in Dyer
The Dyer industries that see more men than women are Agriculture, Fishing & Hunting (100.0%), Transportation & Warehousing (92.2%), and Construction (84.9%), whereas the industries that tend to have a higher number of women are Health Care & Social Assistance (85.3%), Educational Services (82.4%), and Retail Trade (61.7%).
| Industry | Male | Female |
| Agriculture, Fishing & Hunting | 12 (100.0%) | 0 (0.0%) |
| Mining, Quarrying, & Extraction | 0 (0.0%) | 0 (0.0%) |
| Construction | 484 (84.9%) | 86 (15.1%) |
| Manufacturing | 738 (70.3%) | 312 (29.7%) |
| Wholesale Trade | 152 (67.0%) | 75 (33.0%) |
| Retail Trade | 397 (38.3%) | 640 (61.7%) |
| Transportation & Warehousing | 226 (92.2%) | 19 (7.8%) |
| Utilities | 53 (69.7%) | 23 (30.3%) |
| Information | 126 (82.4%) | 27 (17.6%) |
| Finance & Insurance | 132 (51.4%) | 125 (48.6%) |
| Real Estate, Rental & Leasing | 107 (43.9%) | 137 (56.1%) |
| Professional & Scientific | 350 (61.0%) | 224 (39.0%) |
| Enterprise Management | 0 (0.0%) | 0 (0.0%) |
| Administrative & Support | 206 (77.4%) | 60 (22.6%) |
| Educational Services | 118 (17.6%) | 552 (82.4%) |
| Health Care & Social Assistance | 194 (14.7%) | 1,126 (85.3%) |
| Arts, Entertainment & Recreation | 107 (47.3%) | 119 (52.6%) |
| Accommodation & Food Services | 193 (38.4%) | 310 (61.6%) |
| Public Administration | 207 (63.1%) | 121 (36.9%) |
| Total | 4,133 (49.9%) | 4,147 (50.1%) |
Education in Dyer
School Enrollment in Dyer
The most common levels of schooling among the 3,332 students in Dyer are high school (764 | 22.9%), middle school (649 | 19.5%), and college / undergraduate (612 | 18.4%).
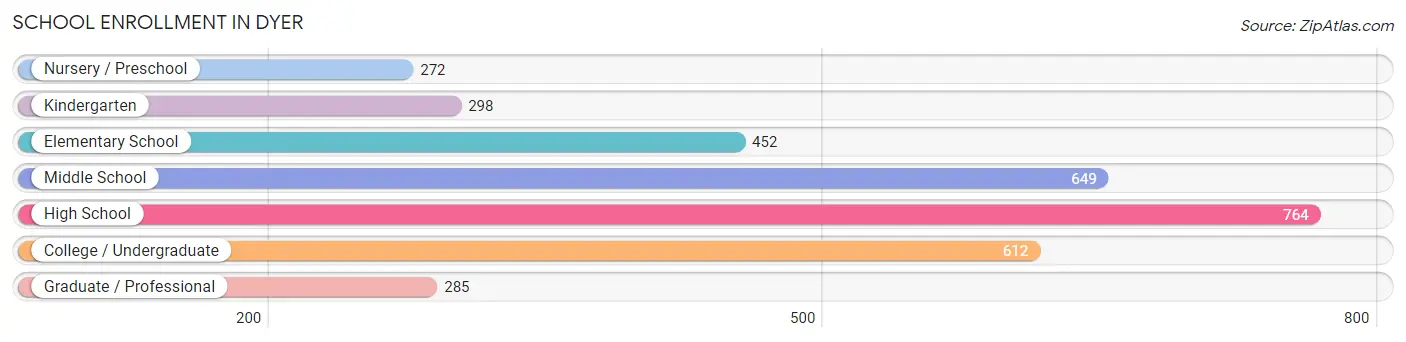
| School Level | # Students | % Students |
| Nursery / Preschool | 272 | 8.2% |
| Kindergarten | 298 | 8.9% |
| Elementary School | 452 | 13.6% |
| Middle School | 649 | 19.5% |
| High School | 764 | 22.9% |
| College / Undergraduate | 612 | 18.4% |
| Graduate / Professional | 285 | 8.6% |
| Total | 3,332 | 100.0% |
School Enrollment by Age by Funding Source in Dyer
Out of a total of 3,332 students who are enrolled in schools in Dyer, 733 (22.0%) attend a private institution, while the remaining 2,599 (78.0%) are enrolled in public schools. The age group of 3 to 4 year olds has the highest likelihood of being enrolled in private schools, with 119 (49.0% in the age bracket) enrolled. Conversely, the age group of 10 to 14 year olds has the lowest likelihood of being enrolled in a private school, with 796 (88.2% in the age bracket) attending a public institution.
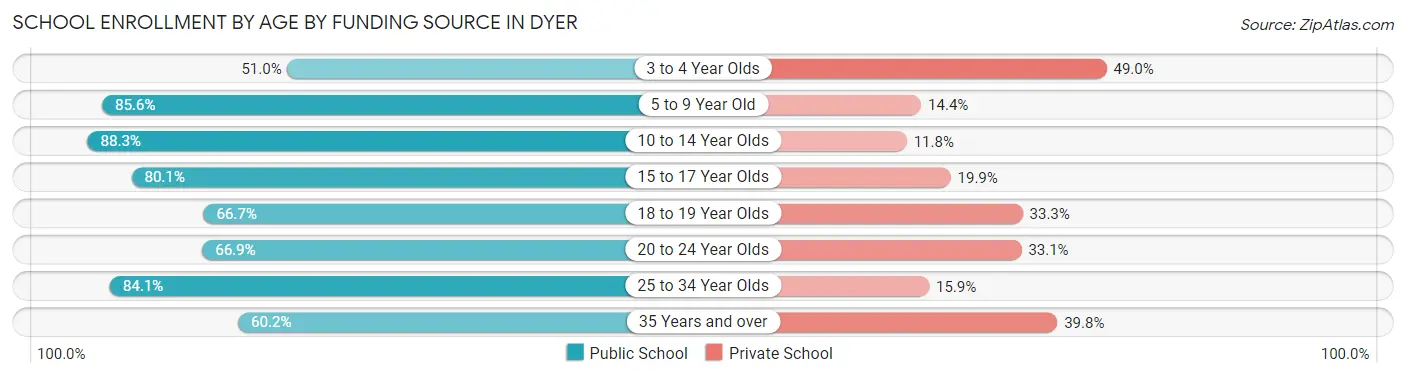
| Age Bracket | Public School | Private School |
| 3 to 4 Year Olds | 124 (51.0%) | 119 (49.0%) |
| 5 to 9 Year Old | 605 (85.6%) | 102 (14.4%) |
| 10 to 14 Year Olds | 796 (88.2%) | 106 (11.7%) |
| 15 to 17 Year Olds | 378 (80.1%) | 94 (19.9%) |
| 18 to 19 Year Olds | 134 (66.7%) | 67 (33.3%) |
| 20 to 24 Year Olds | 200 (66.9%) | 99 (33.1%) |
| 25 to 34 Year Olds | 201 (84.1%) | 38 (15.9%) |
| 35 Years and over | 162 (60.2%) | 107 (39.8%) |
| Total | 2,599 (78.0%) | 733 (22.0%) |
Educational Attainment by Field of Study in Dyer
Business (1,020 | 20.9%), science & technology (703 | 14.4%), education (600 | 12.3%), literature & languages (380 | 7.8%), and arts & humanities (321 | 6.6%) are the most common fields of study among 4,873 individuals in Dyer who have obtained a bachelor's degree or higher.
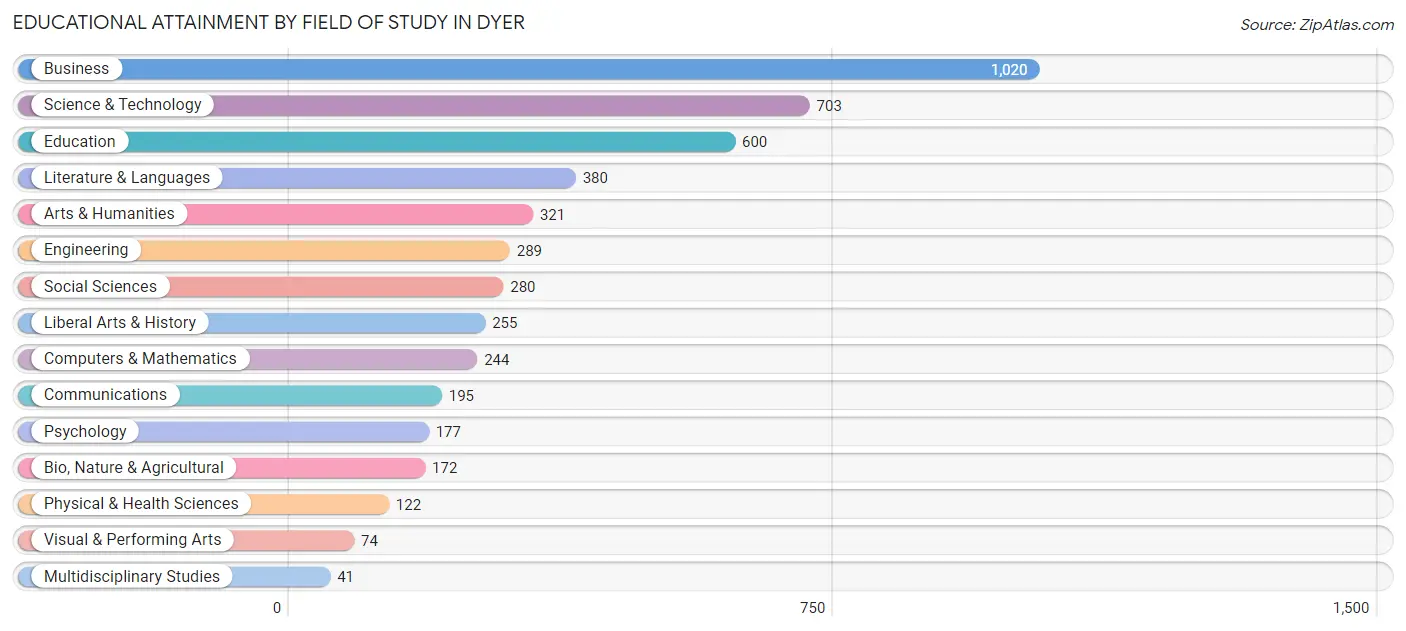
| Field of Study | # Graduates | % Graduates |
| Computers & Mathematics | 244 | 5.0% |
| Bio, Nature & Agricultural | 172 | 3.5% |
| Physical & Health Sciences | 122 | 2.5% |
| Psychology | 177 | 3.6% |
| Social Sciences | 280 | 5.8% |
| Engineering | 289 | 5.9% |
| Multidisciplinary Studies | 41 | 0.8% |
| Science & Technology | 703 | 14.4% |
| Business | 1,020 | 20.9% |
| Education | 600 | 12.3% |
| Literature & Languages | 380 | 7.8% |
| Liberal Arts & History | 255 | 5.2% |
| Visual & Performing Arts | 74 | 1.5% |
| Communications | 195 | 4.0% |
| Arts & Humanities | 321 | 6.6% |
| Total | 4,873 | 100.0% |
Transportation & Commute in Dyer
Vehicle Availability by Sex in Dyer
The most prevalent vehicle ownership categories in Dyer are males with 2 vehicles (1,956, accounting for 47.7%) and females with 2 vehicles (2,297, making up 47.5%).
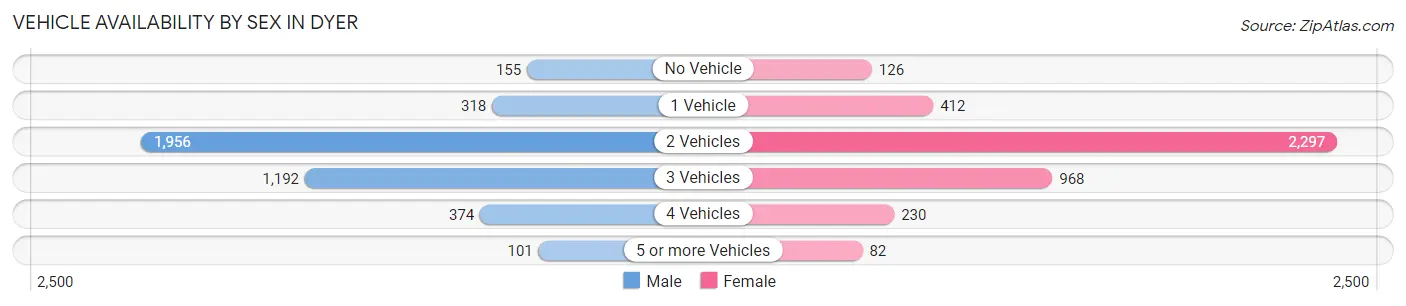
| Vehicles Available | Male | Female |
| No Vehicle | 155 (3.8%) | 126 (3.1%) |
| 1 Vehicle | 318 (7.8%) | 412 (10.0%) |
| 2 Vehicles | 1,956 (47.7%) | 2,297 (55.8%) |
| 3 Vehicles | 1,192 (29.1%) | 968 (23.5%) |
| 4 Vehicles | 374 (9.1%) | 230 (5.6%) |
| 5 or more Vehicles | 101 (2.5%) | 82 (2.0%) |
| Total | 4,096 (100.0%) | 4,115 (100.0%) |
Commute Time in Dyer
The most frequently occuring commute durations in Dyer are 15 to 19 minutes (1,088 commuters, 14.6%), 20 to 24 minutes (976 commuters, 13.1%), and 30 to 34 minutes (932 commuters, 12.6%).
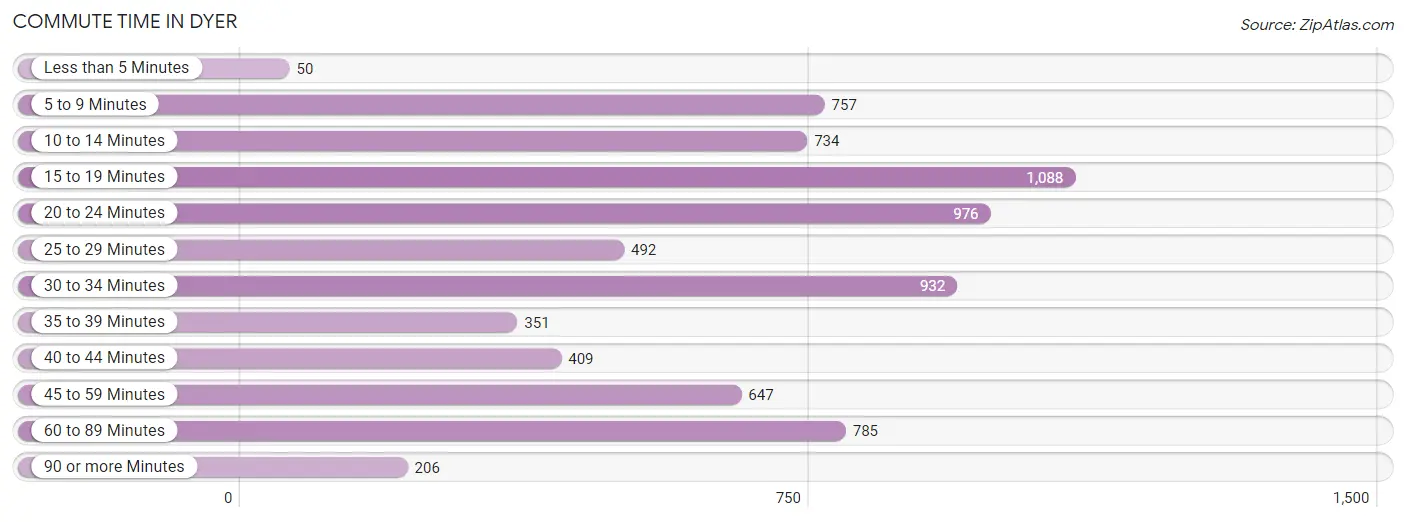
| Commute Time | # Commuters | % Commuters |
| Less than 5 Minutes | 50 | 0.7% |
| 5 to 9 Minutes | 757 | 10.2% |
| 10 to 14 Minutes | 734 | 9.9% |
| 15 to 19 Minutes | 1,088 | 14.6% |
| 20 to 24 Minutes | 976 | 13.1% |
| 25 to 29 Minutes | 492 | 6.6% |
| 30 to 34 Minutes | 932 | 12.6% |
| 35 to 39 Minutes | 351 | 4.7% |
| 40 to 44 Minutes | 409 | 5.5% |
| 45 to 59 Minutes | 647 | 8.7% |
| 60 to 89 Minutes | 785 | 10.6% |
| 90 or more Minutes | 206 | 2.8% |
Commute Time by Sex in Dyer
The most common commute times in Dyer are 20 to 24 minutes (532 commuters, 14.3%) for males and 15 to 19 minutes (712 commuters, 19.2%) for females.
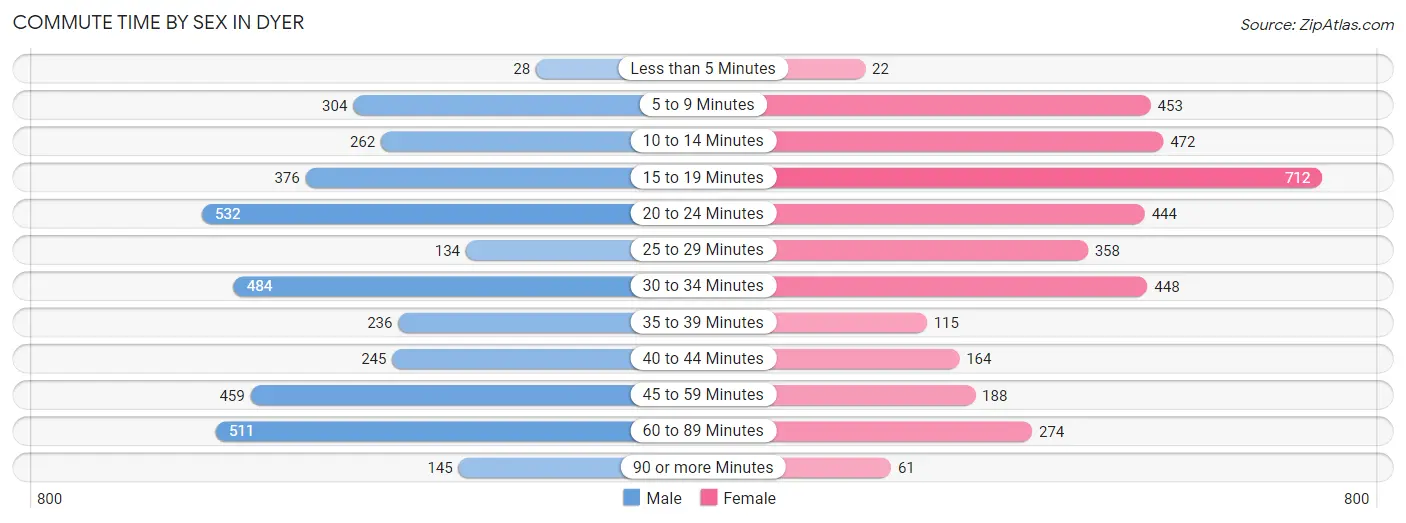
| Commute Time | Male | Female |
| Less than 5 Minutes | 28 (0.7%) | 22 (0.6%) |
| 5 to 9 Minutes | 304 (8.2%) | 453 (12.2%) |
| 10 to 14 Minutes | 262 (7.0%) | 472 (12.7%) |
| 15 to 19 Minutes | 376 (10.1%) | 712 (19.2%) |
| 20 to 24 Minutes | 532 (14.3%) | 444 (12.0%) |
| 25 to 29 Minutes | 134 (3.6%) | 358 (9.7%) |
| 30 to 34 Minutes | 484 (13.0%) | 448 (12.1%) |
| 35 to 39 Minutes | 236 (6.4%) | 115 (3.1%) |
| 40 to 44 Minutes | 245 (6.6%) | 164 (4.4%) |
| 45 to 59 Minutes | 459 (12.3%) | 188 (5.1%) |
| 60 to 89 Minutes | 511 (13.8%) | 274 (7.4%) |
| 90 or more Minutes | 145 (3.9%) | 61 (1.6%) |
Time of Departure to Work by Sex in Dyer
The most frequent times of departure to work in Dyer are 6:00 AM to 6:29 AM (586, 15.8%) for males and 7:00 AM to 7:29 AM (583, 15.7%) for females.
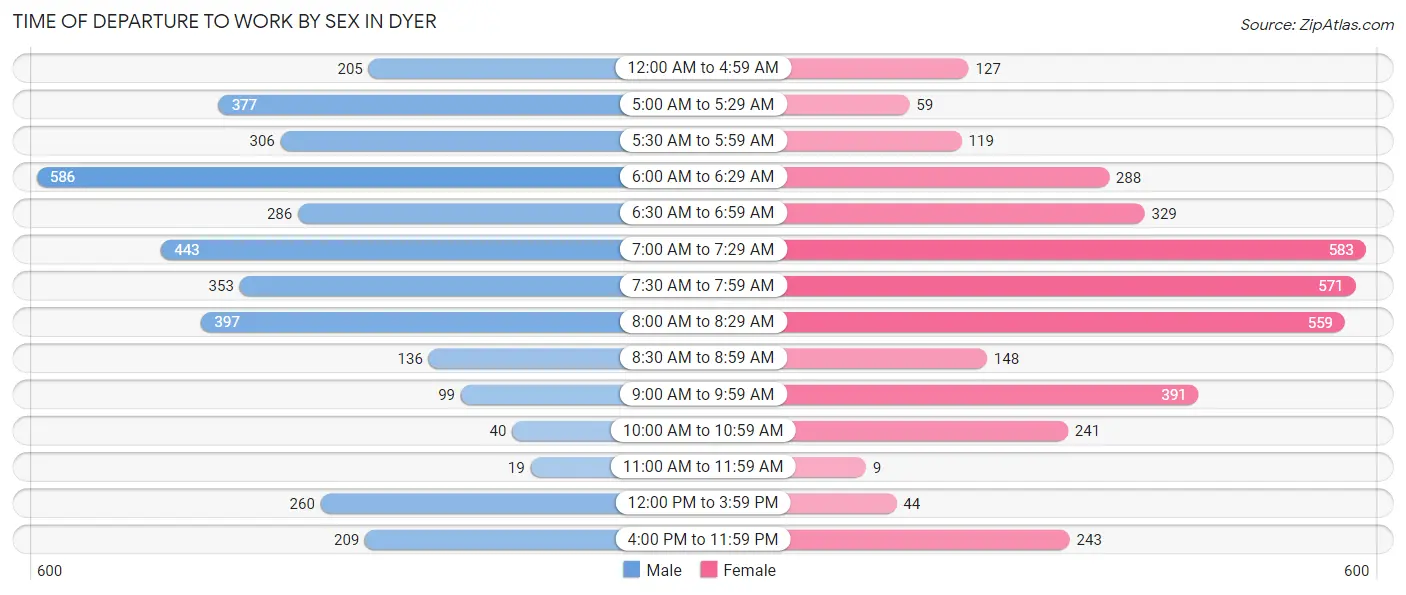
| Time of Departure | Male | Female |
| 12:00 AM to 4:59 AM | 205 (5.5%) | 127 (3.4%) |
| 5:00 AM to 5:29 AM | 377 (10.2%) | 59 (1.6%) |
| 5:30 AM to 5:59 AM | 306 (8.2%) | 119 (3.2%) |
| 6:00 AM to 6:29 AM | 586 (15.8%) | 288 (7.8%) |
| 6:30 AM to 6:59 AM | 286 (7.7%) | 329 (8.9%) |
| 7:00 AM to 7:29 AM | 443 (11.9%) | 583 (15.7%) |
| 7:30 AM to 7:59 AM | 353 (9.5%) | 571 (15.4%) |
| 8:00 AM to 8:29 AM | 397 (10.7%) | 559 (15.1%) |
| 8:30 AM to 8:59 AM | 136 (3.7%) | 148 (4.0%) |
| 9:00 AM to 9:59 AM | 99 (2.7%) | 391 (10.5%) |
| 10:00 AM to 10:59 AM | 40 (1.1%) | 241 (6.5%) |
| 11:00 AM to 11:59 AM | 19 (0.5%) | 9 (0.2%) |
| 12:00 PM to 3:59 PM | 260 (7.0%) | 44 (1.2%) |
| 4:00 PM to 11:59 PM | 209 (5.6%) | 243 (6.6%) |
| Total | 3,716 (100.0%) | 3,711 (100.0%) |
Housing Occupancy in Dyer
Occupancy by Ownership in Dyer
Of the total 6,302 dwellings in Dyer, owner-occupied units account for 5,601 (88.9%), while renter-occupied units make up 701 (11.1%).
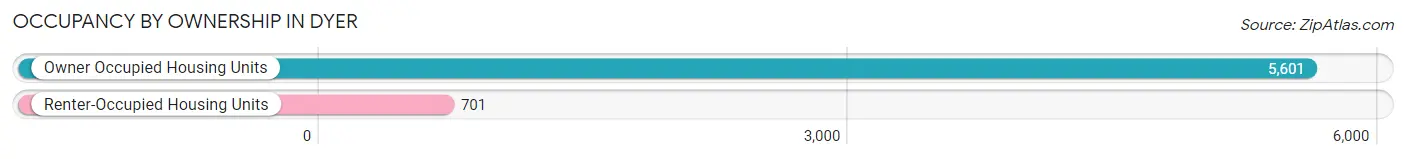
| Occupancy | # Housing Units | % Housing Units |
| Owner Occupied Housing Units | 5,601 | 88.9% |
| Renter-Occupied Housing Units | 701 | 11.1% |
| Total Occupied Housing Units | 6,302 | 100.0% |
Occupancy by Household Size in Dyer
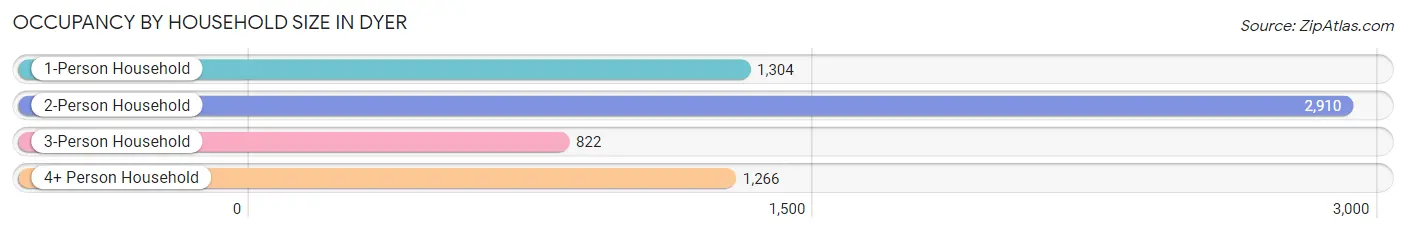
| Household Size | # Housing Units | % Housing Units |
| 1-Person Household | 1,304 | 20.7% |
| 2-Person Household | 2,910 | 46.2% |
| 3-Person Household | 822 | 13.0% |
| 4+ Person Household | 1,266 | 20.1% |
| Total Housing Units | 6,302 | 100.0% |
Occupancy by Ownership by Household Size in Dyer
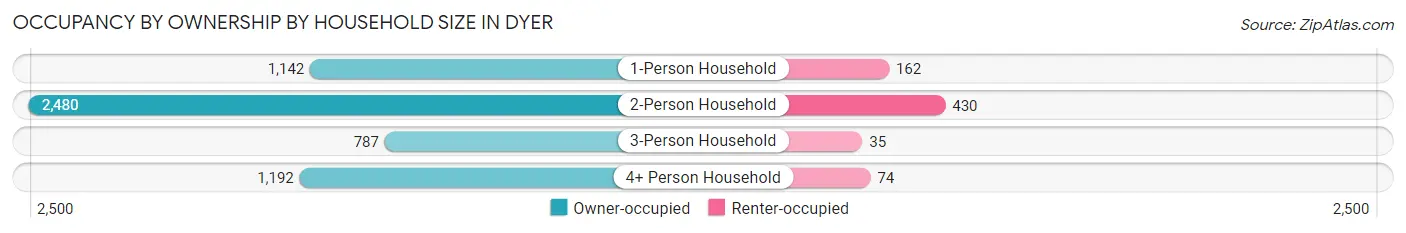
| Household Size | Owner-occupied | Renter-occupied |
| 1-Person Household | 1,142 (87.6%) | 162 (12.4%) |
| 2-Person Household | 2,480 (85.2%) | 430 (14.8%) |
| 3-Person Household | 787 (95.7%) | 35 (4.3%) |
| 4+ Person Household | 1,192 (94.2%) | 74 (5.9%) |
| Total Housing Units | 5,601 (88.9%) | 701 (11.1%) |
Occupancy by Educational Attainment in Dyer
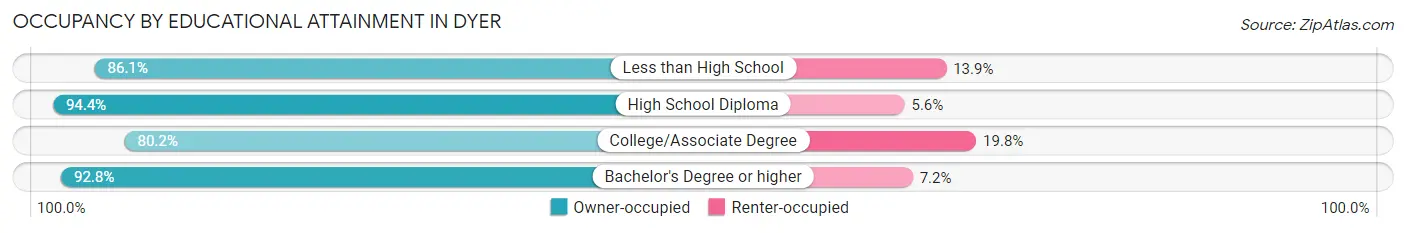
| Household Size | Owner-occupied | Renter-occupied |
| Less than High School | 124 (86.1%) | 20 (13.9%) |
| High School Diploma | 1,474 (94.4%) | 88 (5.6%) |
| College/Associate Degree | 1,659 (80.2%) | 410 (19.8%) |
| Bachelor's Degree or higher | 2,344 (92.8%) | 183 (7.2%) |
Occupancy by Age of Householder in Dyer
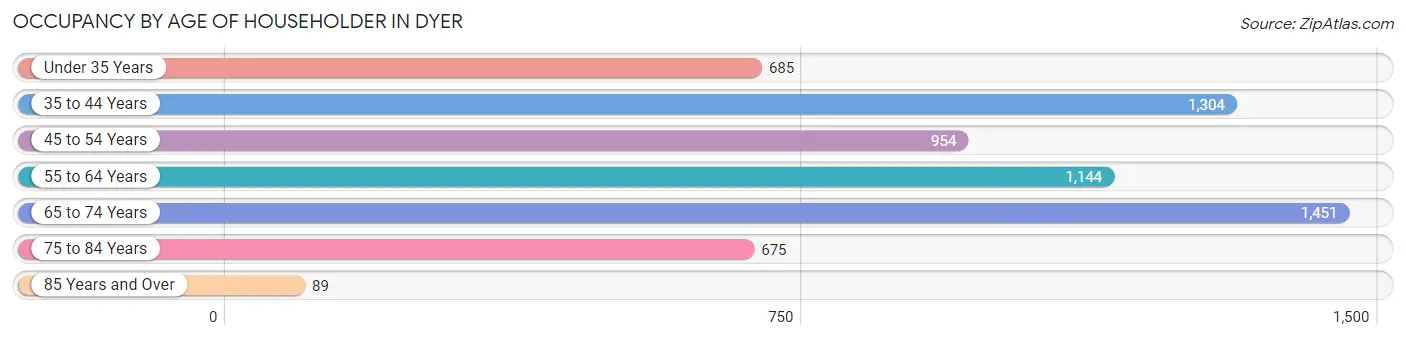
| Age Bracket | # Households | % Households |
| Under 35 Years | 685 | 10.9% |
| 35 to 44 Years | 1,304 | 20.7% |
| 45 to 54 Years | 954 | 15.1% |
| 55 to 64 Years | 1,144 | 18.1% |
| 65 to 74 Years | 1,451 | 23.0% |
| 75 to 84 Years | 675 | 10.7% |
| 85 Years and Over | 89 | 1.4% |
| Total | 6,302 | 100.0% |
Housing Finances in Dyer
Median Income by Occupancy in Dyer
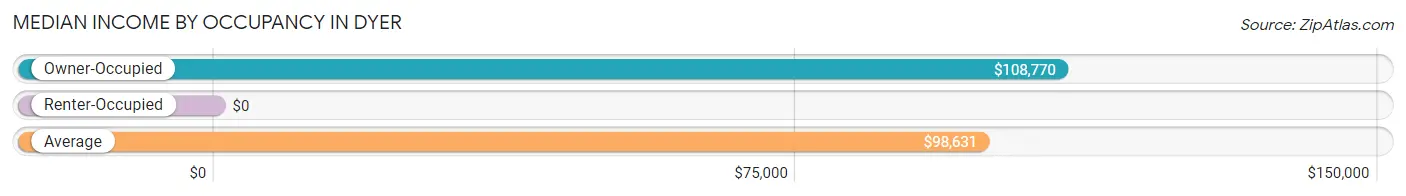
| Occupancy Type | # Households | Median Income |
| Owner-Occupied | 5,601 (88.9%) | $108,770 |
| Renter-Occupied | 701 (11.1%) | $0 |
| Average | 6,302 (100.0%) | $98,631 |
Occupancy by Householder Income Bracket in Dyer
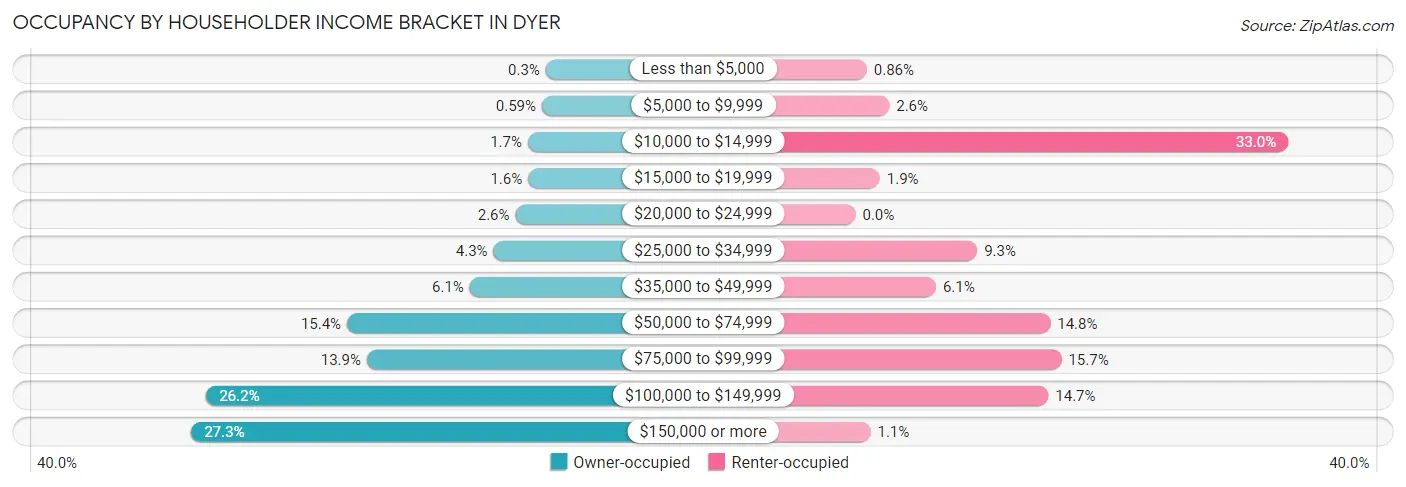
| Income Bracket | Owner-occupied | Renter-occupied |
| Less than $5,000 | 17 (0.3%) | 6 (0.9%) |
| $5,000 to $9,999 | 33 (0.6%) | 18 (2.6%) |
| $10,000 to $14,999 | 93 (1.7%) | 231 (33.0%) |
| $15,000 to $19,999 | 92 (1.6%) | 13 (1.8%) |
| $20,000 to $24,999 | 146 (2.6%) | 0 (0.0%) |
| $25,000 to $34,999 | 240 (4.3%) | 65 (9.3%) |
| $35,000 to $49,999 | 341 (6.1%) | 43 (6.1%) |
| $50,000 to $74,999 | 865 (15.4%) | 104 (14.8%) |
| $75,000 to $99,999 | 780 (13.9%) | 110 (15.7%) |
| $100,000 to $149,999 | 1,465 (26.2%) | 103 (14.7%) |
| $150,000 or more | 1,529 (27.3%) | 8 (1.1%) |
| Total | 5,601 (100.0%) | 701 (100.0%) |
Monthly Housing Cost Tiers in Dyer
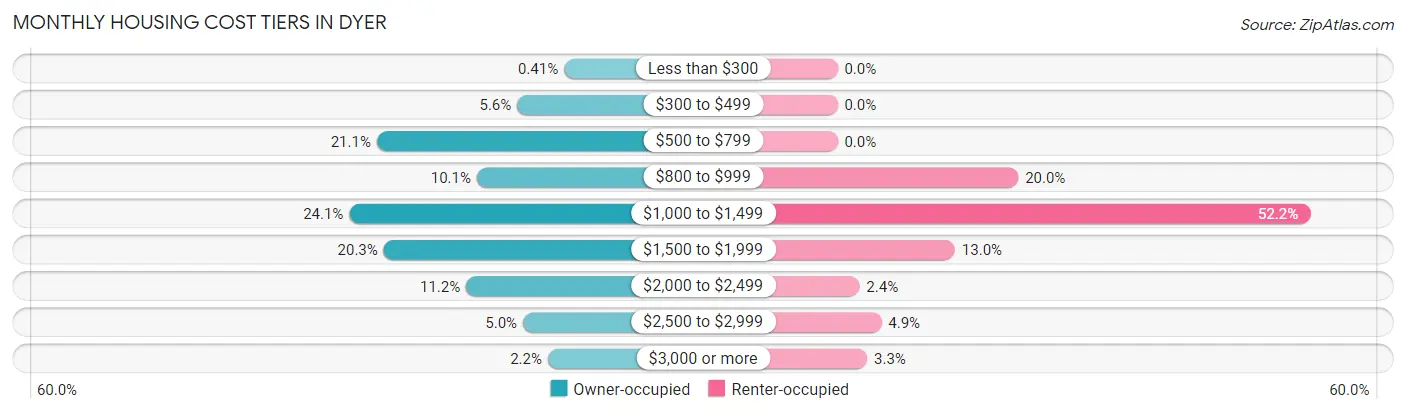
| Monthly Cost | Owner-occupied | Renter-occupied |
| Less than $300 | 23 (0.4%) | 0 (0.0%) |
| $300 to $499 | 313 (5.6%) | 0 (0.0%) |
| $500 to $799 | 1,182 (21.1%) | 0 (0.0%) |
| $800 to $999 | 563 (10.1%) | 140 (20.0%) |
| $1,000 to $1,499 | 1,352 (24.1%) | 366 (52.2%) |
| $1,500 to $1,999 | 1,139 (20.3%) | 91 (13.0%) |
| $2,000 to $2,499 | 629 (11.2%) | 17 (2.4%) |
| $2,500 to $2,999 | 277 (5.0%) | 34 (4.9%) |
| $3,000 or more | 123 (2.2%) | 23 (3.3%) |
| Total | 5,601 (100.0%) | 701 (100.0%) |
Physical Housing Characteristics in Dyer
Housing Structures in Dyer
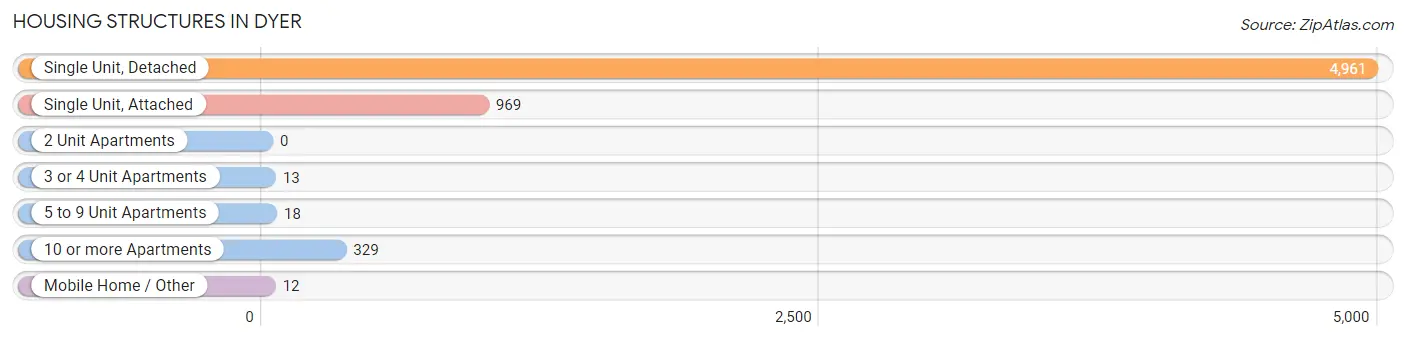
| Structure Type | # Housing Units | % Housing Units |
| Single Unit, Detached | 4,961 | 78.7% |
| Single Unit, Attached | 969 | 15.4% |
| 2 Unit Apartments | 0 | 0.0% |
| 3 or 4 Unit Apartments | 13 | 0.2% |
| 5 to 9 Unit Apartments | 18 | 0.3% |
| 10 or more Apartments | 329 | 5.2% |
| Mobile Home / Other | 12 | 0.2% |
| Total | 6,302 | 100.0% |
Housing Structures by Occupancy in Dyer
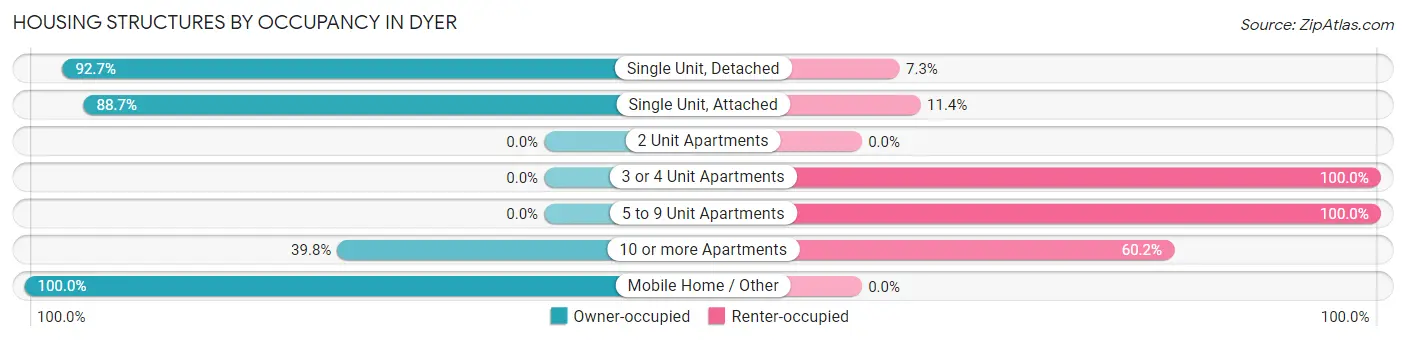
| Structure Type | Owner-occupied | Renter-occupied |
| Single Unit, Detached | 4,599 (92.7%) | 362 (7.3%) |
| Single Unit, Attached | 859 (88.6%) | 110 (11.4%) |
| 2 Unit Apartments | 0 (0.0%) | 0 (0.0%) |
| 3 or 4 Unit Apartments | 0 (0.0%) | 13 (100.0%) |
| 5 to 9 Unit Apartments | 0 (0.0%) | 18 (100.0%) |
| 10 or more Apartments | 131 (39.8%) | 198 (60.2%) |
| Mobile Home / Other | 12 (100.0%) | 0 (0.0%) |
| Total | 5,601 (88.9%) | 701 (11.1%) |
Housing Structures by Number of Rooms in Dyer
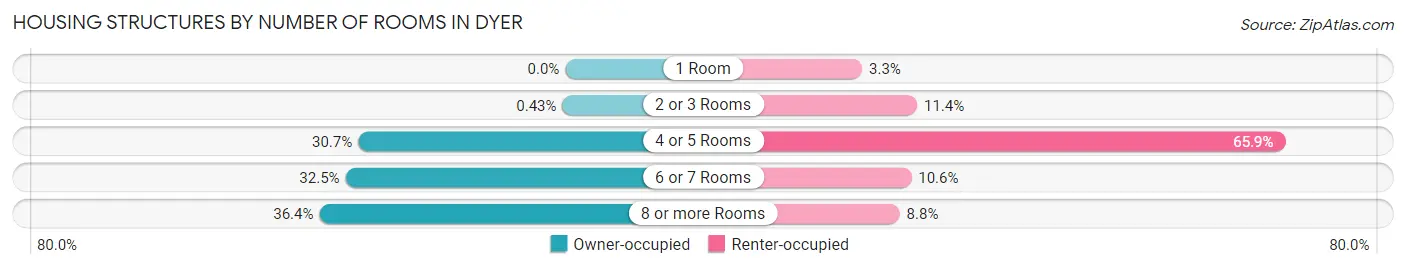
| Number of Rooms | Owner-occupied | Renter-occupied |
| 1 Room | 0 (0.0%) | 23 (3.3%) |
| 2 or 3 Rooms | 24 (0.4%) | 80 (11.4%) |
| 4 or 5 Rooms | 1,717 (30.7%) | 462 (65.9%) |
| 6 or 7 Rooms | 1,822 (32.5%) | 74 (10.6%) |
| 8 or more Rooms | 2,038 (36.4%) | 62 (8.8%) |
| Total | 5,601 (100.0%) | 701 (100.0%) |
Housing Structure by Heating Type in Dyer
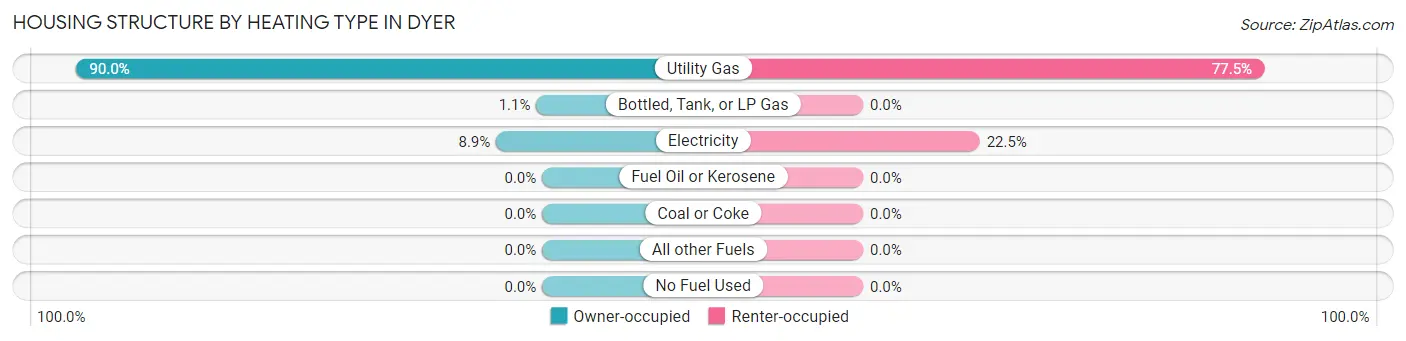
| Heating Type | Owner-occupied | Renter-occupied |
| Utility Gas | 5,040 (90.0%) | 543 (77.5%) |
| Bottled, Tank, or LP Gas | 63 (1.1%) | 0 (0.0%) |
| Electricity | 498 (8.9%) | 158 (22.5%) |
| Fuel Oil or Kerosene | 0 (0.0%) | 0 (0.0%) |
| Coal or Coke | 0 (0.0%) | 0 (0.0%) |
| All other Fuels | 0 (0.0%) | 0 (0.0%) |
| No Fuel Used | 0 (0.0%) | 0 (0.0%) |
| Total | 5,601 (100.0%) | 701 (100.0%) |
Household Vehicle Usage in Dyer
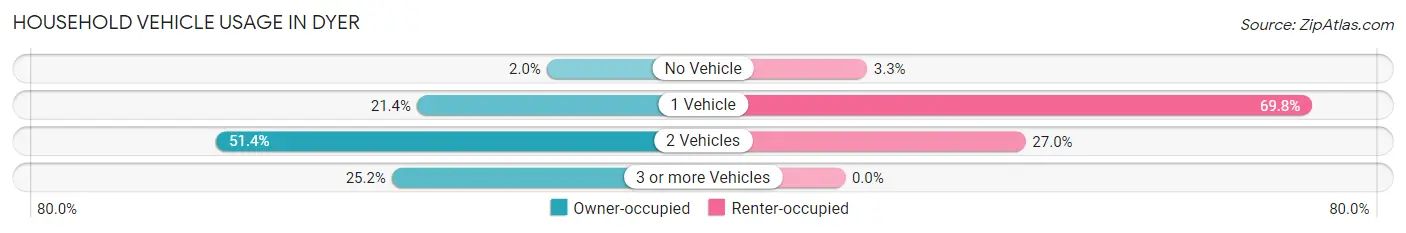
| Vehicles per Household | Owner-occupied | Renter-occupied |
| No Vehicle | 113 (2.0%) | 23 (3.3%) |
| 1 Vehicle | 1,200 (21.4%) | 489 (69.8%) |
| 2 Vehicles | 2,878 (51.4%) | 189 (27.0%) |
| 3 or more Vehicles | 1,410 (25.2%) | 0 (0.0%) |
| Total | 5,601 (100.0%) | 701 (100.0%) |
Real Estate & Mortgages in Dyer
Real Estate and Mortgage Overview in Dyer
| Characteristic | Without Mortgage | With Mortgage |
| Housing Units | 2,051 | 3,550 |
| Median Property Value | $269,900 | $274,800 |
| Median Household Income | $82,052 | $1,140 |
| Monthly Housing Costs | $682 | $123 |
| Real Estate Taxes | $2,917 | $38 |
Property Value by Mortgage Status in Dyer
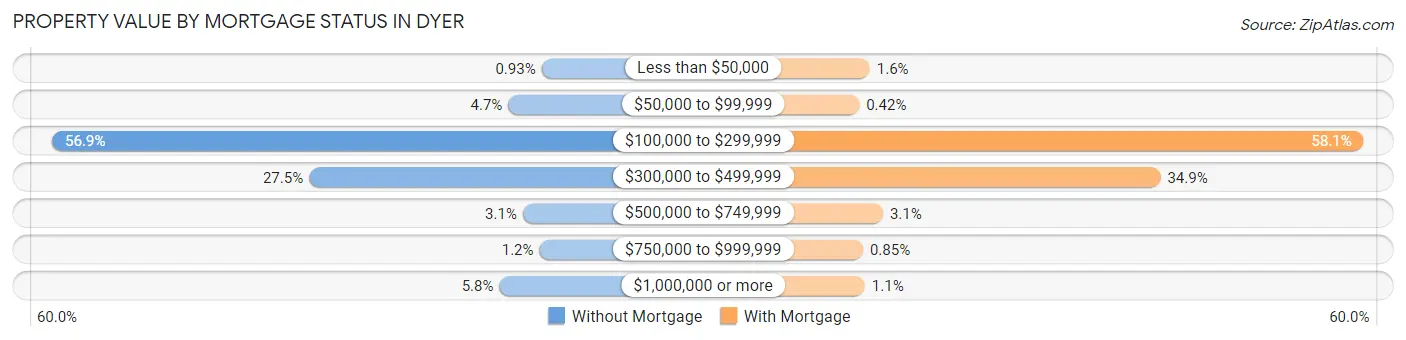
| Property Value | Without Mortgage | With Mortgage |
| Less than $50,000 | 19 (0.9%) | 58 (1.6%) |
| $50,000 to $99,999 | 97 (4.7%) | 15 (0.4%) |
| $100,000 to $299,999 | 1,166 (56.9%) | 2,061 (58.1%) |
| $300,000 to $499,999 | 564 (27.5%) | 1,237 (34.8%) |
| $500,000 to $749,999 | 63 (3.1%) | 111 (3.1%) |
| $750,000 to $999,999 | 24 (1.2%) | 30 (0.9%) |
| $1,000,000 or more | 118 (5.8%) | 38 (1.1%) |
| Total | 2,051 (100.0%) | 3,550 (100.0%) |
Household Income by Mortgage Status in Dyer
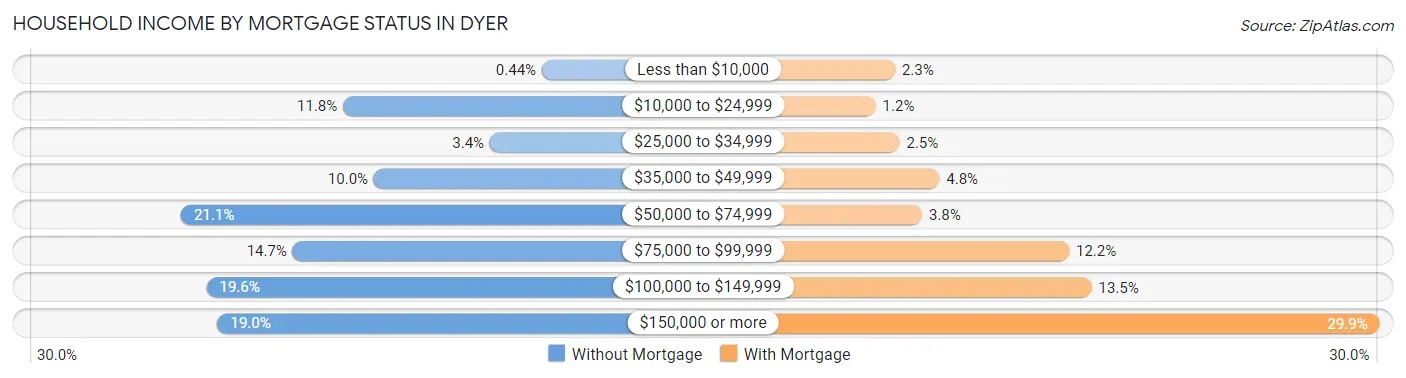
| Household Income | Without Mortgage | With Mortgage |
| Less than $10,000 | 9 (0.4%) | 80 (2.2%) |
| $10,000 to $24,999 | 242 (11.8%) | 41 (1.1%) |
| $25,000 to $34,999 | 70 (3.4%) | 89 (2.5%) |
| $35,000 to $49,999 | 206 (10.0%) | 170 (4.8%) |
| $50,000 to $74,999 | 432 (21.1%) | 135 (3.8%) |
| $75,000 to $99,999 | 301 (14.7%) | 433 (12.2%) |
| $100,000 to $149,999 | 402 (19.6%) | 479 (13.5%) |
| $150,000 or more | 389 (19.0%) | 1,063 (29.9%) |
| Total | 2,051 (100.0%) | 3,550 (100.0%) |
Property Value to Household Income Ratio in Dyer
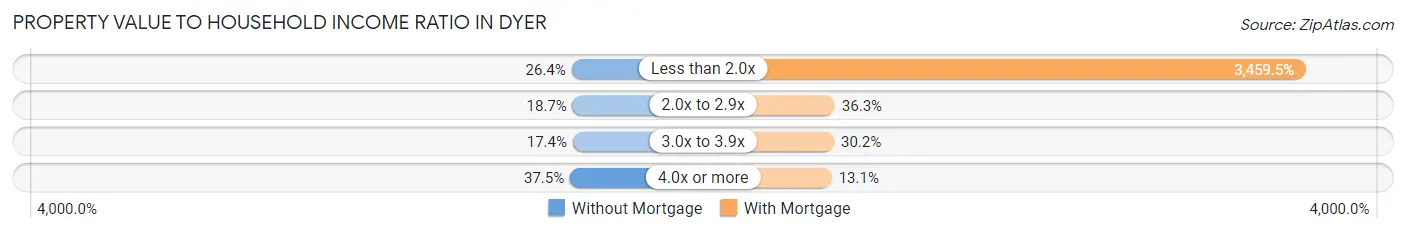
| Value-to-Income Ratio | Without Mortgage | With Mortgage |
| Less than 2.0x | 541 (26.4%) | 122,813 (3,459.5%) |
| 2.0x to 2.9x | 383 (18.7%) | 1,289 (36.3%) |
| 3.0x to 3.9x | 357 (17.4%) | 1,072 (30.2%) |
| 4.0x or more | 770 (37.5%) | 464 (13.1%) |
| Total | 2,051 (100.0%) | 3,550 (100.0%) |
Real Estate Taxes by Mortgage Status in Dyer
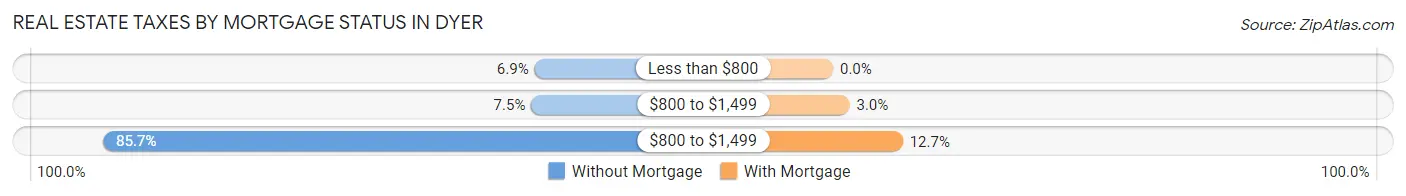
| Property Taxes | Without Mortgage | With Mortgage |
| Less than $800 | 141 (6.9%) | 0 (0.0%) |
| $800 to $1,499 | 153 (7.5%) | 107 (3.0%) |
| $800 to $1,499 | 1,757 (85.7%) | 452 (12.7%) |
| Total | 2,051 (100.0%) | 3,550 (100.0%) |
Health & Disability in Dyer
Health Insurance Coverage by Age in Dyer
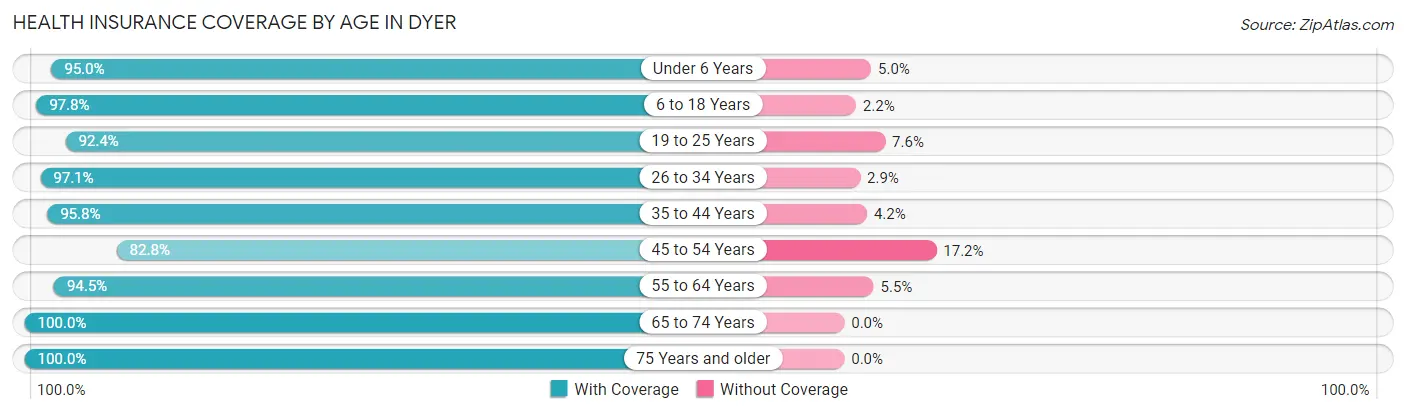
| Age Bracket | With Coverage | Without Coverage |
| Under 6 Years | 1,161 (95.0%) | 61 (5.0%) |
| 6 to 18 Years | 2,070 (97.8%) | 46 (2.2%) |
| 19 to 25 Years | 1,104 (92.4%) | 91 (7.6%) |
| 26 to 34 Years | 1,582 (97.1%) | 48 (2.9%) |
| 35 to 44 Years | 2,104 (95.8%) | 93 (4.2%) |
| 45 to 54 Years | 1,693 (82.8%) | 351 (17.2%) |
| 55 to 64 Years | 1,970 (94.5%) | 114 (5.5%) |
| 65 to 74 Years | 2,244 (100.0%) | 0 (0.0%) |
| 75 Years and older | 1,367 (100.0%) | 0 (0.0%) |
| Total | 15,295 (95.0%) | 804 (5.0%) |
Health Insurance Coverage by Citizenship Status in Dyer
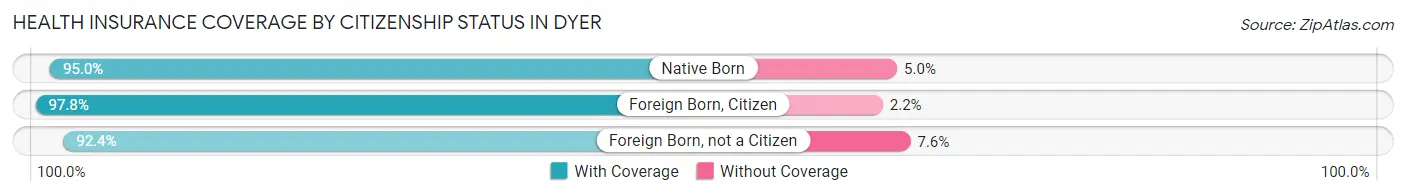
| Citizenship Status | With Coverage | Without Coverage |
| Native Born | 1,161 (95.0%) | 61 (5.0%) |
| Foreign Born, Citizen | 2,070 (97.8%) | 46 (2.2%) |
| Foreign Born, not a Citizen | 1,104 (92.4%) | 91 (7.6%) |
Health Insurance Coverage by Household Income in Dyer
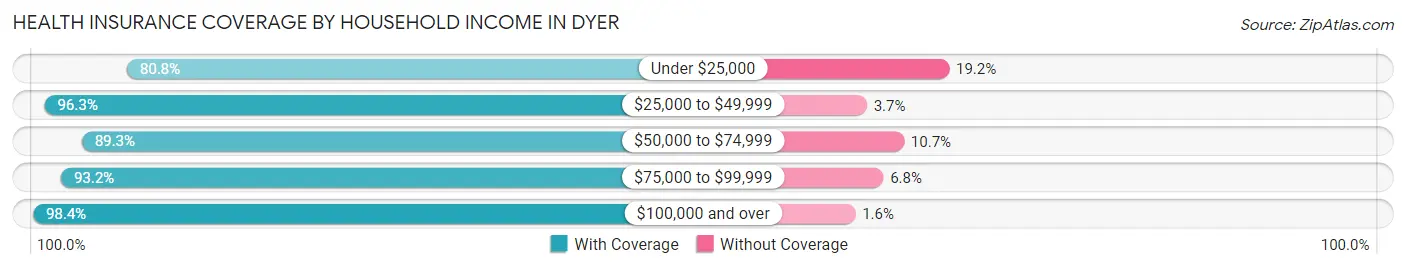
| Household Income | With Coverage | Without Coverage |
| Under $25,000 | 945 (80.8%) | 224 (19.2%) |
| $25,000 to $49,999 | 1,007 (96.3%) | 39 (3.7%) |
| $50,000 to $74,999 | 2,120 (89.3%) | 254 (10.7%) |
| $75,000 to $99,999 | 1,884 (93.2%) | 138 (6.8%) |
| $100,000 and over | 9,330 (98.4%) | 149 (1.6%) |
Public vs Private Health Insurance Coverage by Age in Dyer
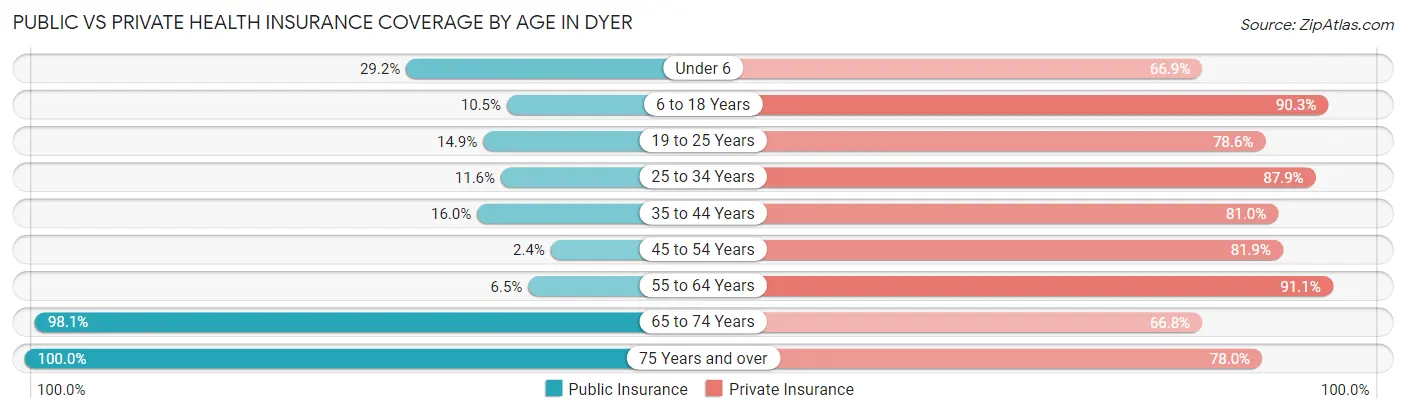
| Age Bracket | Public Insurance | Private Insurance |
| Under 6 | 357 (29.2%) | 817 (66.9%) |
| 6 to 18 Years | 222 (10.5%) | 1,910 (90.3%) |
| 19 to 25 Years | 178 (14.9%) | 939 (78.6%) |
| 25 to 34 Years | 189 (11.6%) | 1,433 (87.9%) |
| 35 to 44 Years | 352 (16.0%) | 1,779 (81.0%) |
| 45 to 54 Years | 48 (2.4%) | 1,673 (81.9%) |
| 55 to 64 Years | 136 (6.5%) | 1,898 (91.1%) |
| 65 to 74 Years | 2,201 (98.1%) | 1,500 (66.8%) |
| 75 Years and over | 1,367 (100.0%) | 1,066 (78.0%) |
| Total | 5,050 (31.4%) | 13,015 (80.8%) |
Disability Status by Sex by Age in Dyer
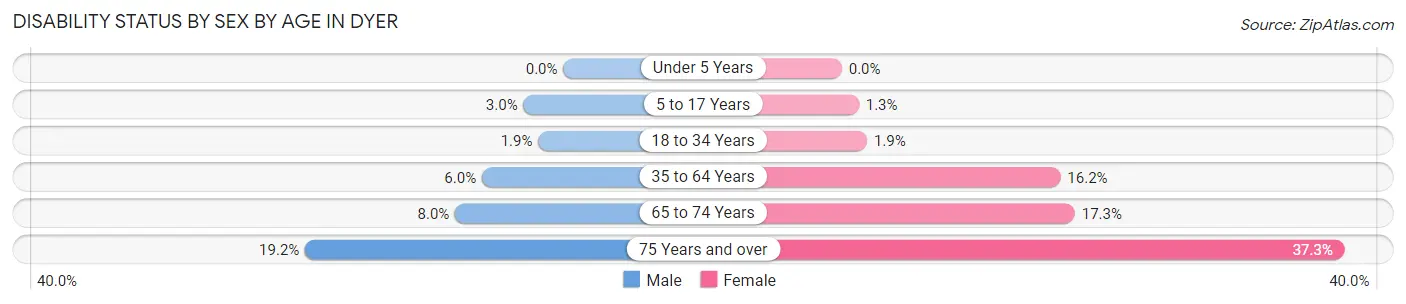
| Age Bracket | Male | Female |
| Under 5 Years | 0 (0.0%) | 0 (0.0%) |
| 5 to 17 Years | 35 (3.0%) | 12 (1.3%) |
| 18 to 34 Years | 26 (1.9%) | 29 (1.9%) |
| 35 to 64 Years | 174 (6.0%) | 559 (16.2%) |
| 65 to 74 Years | 66 (8.0%) | 246 (17.3%) |
| 75 Years and over | 144 (19.2%) | 230 (37.3%) |
Disability Class by Sex by Age in Dyer
Disability Class: Hearing Difficulty
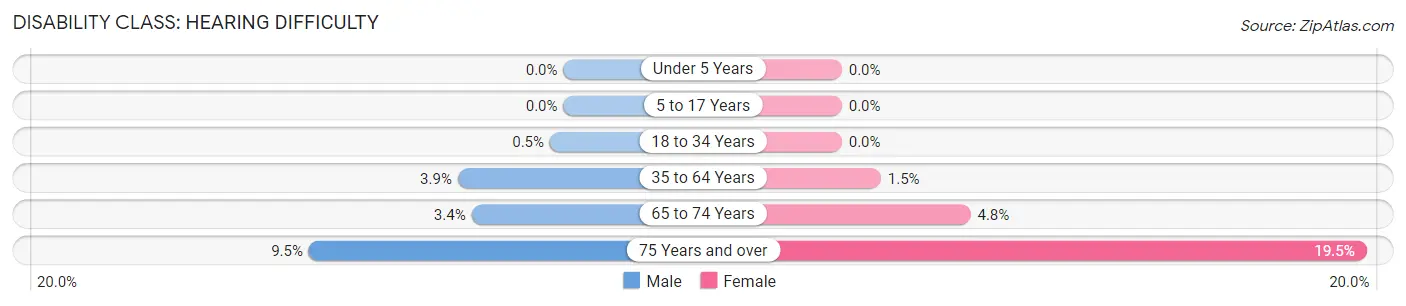
| Age Bracket | Male | Female |
| Under 5 Years | 0 (0.0%) | 0 (0.0%) |
| 5 to 17 Years | 0 (0.0%) | 0 (0.0%) |
| 18 to 34 Years | 7 (0.5%) | 0 (0.0%) |
| 35 to 64 Years | 113 (3.9%) | 50 (1.5%) |
| 65 to 74 Years | 28 (3.4%) | 68 (4.8%) |
| 75 Years and over | 71 (9.5%) | 120 (19.5%) |
Disability Class: Vision Difficulty
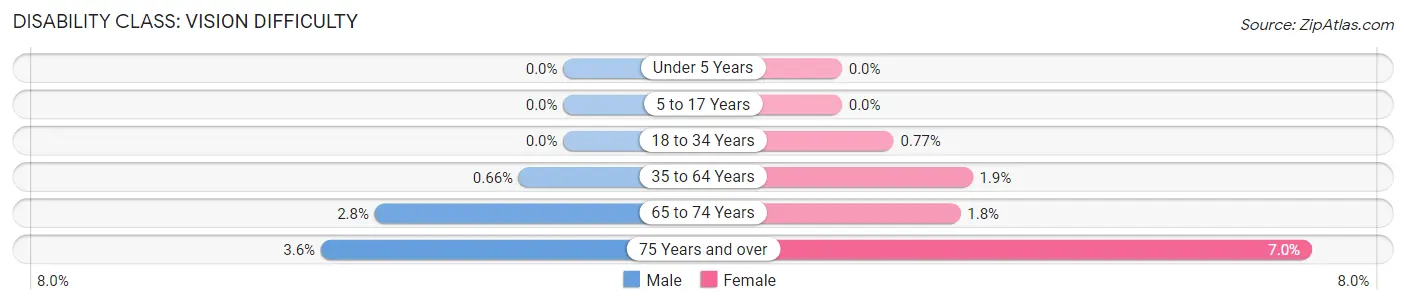
| Age Bracket | Male | Female |
| Under 5 Years | 0 (0.0%) | 0 (0.0%) |
| 5 to 17 Years | 0 (0.0%) | 0 (0.0%) |
| 18 to 34 Years | 0 (0.0%) | 12 (0.8%) |
| 35 to 64 Years | 19 (0.7%) | 67 (1.9%) |
| 65 to 74 Years | 23 (2.8%) | 25 (1.8%) |
| 75 Years and over | 27 (3.6%) | 43 (7.0%) |
Disability Class: Cognitive Difficulty
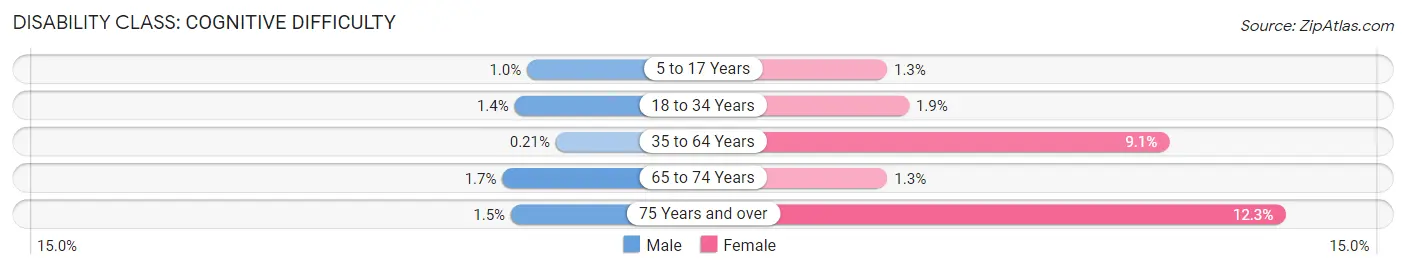
| Age Bracket | Male | Female |
| 5 to 17 Years | 12 (1.0%) | 12 (1.3%) |
| 18 to 34 Years | 19 (1.4%) | 29 (1.9%) |
| 35 to 64 Years | 6 (0.2%) | 314 (9.1%) |
| 65 to 74 Years | 14 (1.7%) | 18 (1.3%) |
| 75 Years and over | 11 (1.5%) | 76 (12.3%) |
Disability Class: Ambulatory Difficulty
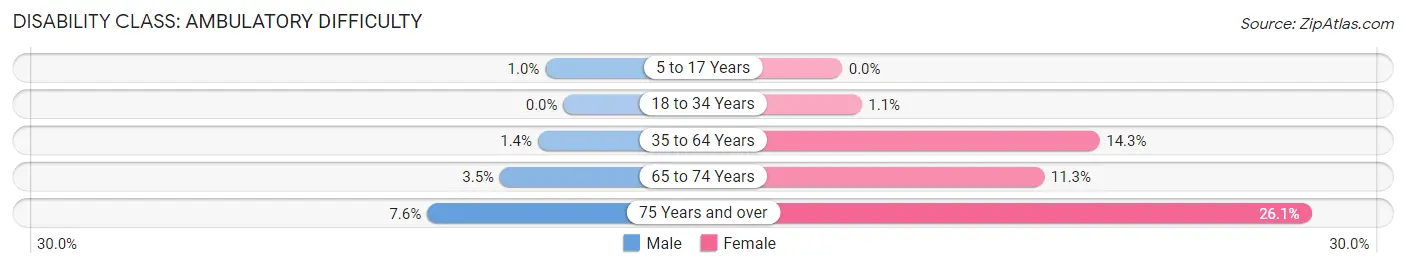
| Age Bracket | Male | Female |
| 5 to 17 Years | 12 (1.0%) | 0 (0.0%) |
| 18 to 34 Years | 0 (0.0%) | 17 (1.1%) |
| 35 to 64 Years | 41 (1.4%) | 494 (14.3%) |
| 65 to 74 Years | 29 (3.5%) | 160 (11.3%) |
| 75 Years and over | 57 (7.6%) | 161 (26.1%) |
Disability Class: Self-Care Difficulty
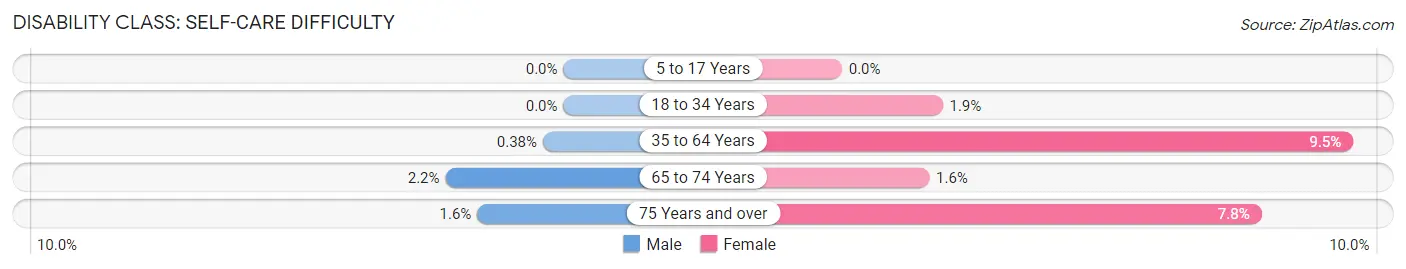
| Age Bracket | Male | Female |
| 5 to 17 Years | 0 (0.0%) | 0 (0.0%) |
| 18 to 34 Years | 0 (0.0%) | 29 (1.9%) |
| 35 to 64 Years | 11 (0.4%) | 327 (9.5%) |
| 65 to 74 Years | 18 (2.2%) | 23 (1.6%) |
| 75 Years and over | 12 (1.6%) | 48 (7.8%) |
Technology Access in Dyer
Computing Device Access in Dyer
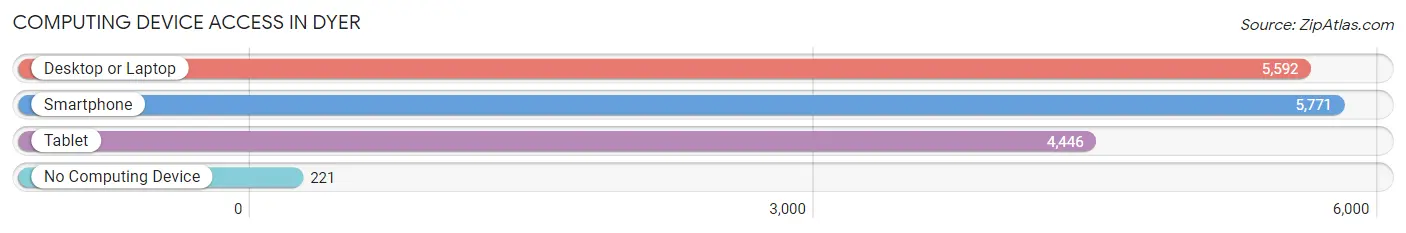
| Device Type | # Households | % Households |
| Desktop or Laptop | 5,592 | 88.7% |
| Smartphone | 5,771 | 91.6% |
| Tablet | 4,446 | 70.6% |
| No Computing Device | 221 | 3.5% |
| Total | 6,302 | 100.0% |
Internet Access in Dyer
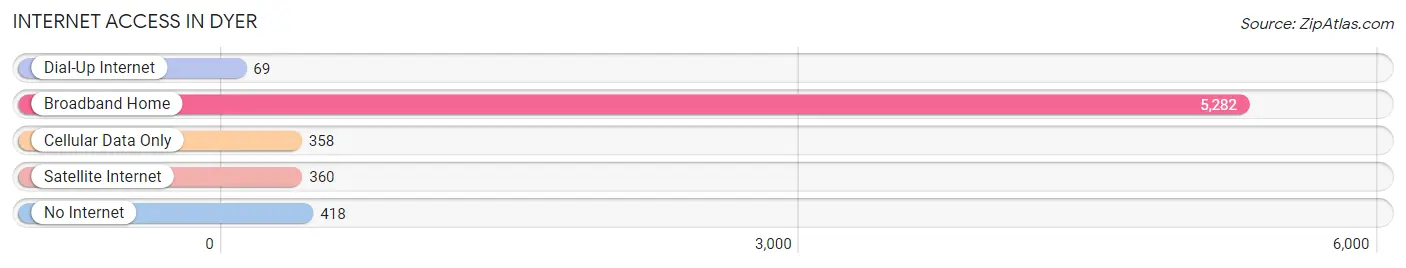
| Internet Type | # Households | % Households |
| Dial-Up Internet | 69 | 1.1% |
| Broadband Home | 5,282 | 83.8% |
| Cellular Data Only | 358 | 5.7% |
| Satellite Internet | 360 | 5.7% |
| No Internet | 418 | 6.6% |
| Total | 6,302 | 100.0% |
Dyer Summary
Dyer is a town located in Lake County, Indiana, United States. The population was 16,390 at the 2010 census. It is a part of the Chicago metropolitan area and is located on the Illinois border.
History
Dyer was first settled in 1851 by William Dyer, a farmer from New York. He purchased land from the government and built a log cabin. The town was originally known as Dyer's Settlement. In 1853, the first post office was established and the town was officially named Dyer.
In 1854, the first school was built and the first church was established in 1855. The town was incorporated in 1868.
In 1871, the first railroad was built through Dyer, connecting it to Chicago. This allowed for the growth of the town and the development of industry.
In the late 19th century, Dyer became a popular summer resort for wealthy Chicagoans. The town was known for its beautiful lakefront and its many resorts.
In the early 20th century, Dyer became a popular destination for auto racing. The first auto race was held in Dyer in 1909.
Geography
Dyer is located at 41°25'25" North, 87°30'17" West (41.423, -87.505). According to the United States Census Bureau, the town has a total area of 8.2 square miles (21.2 km2), of which 8.1 square miles (21.0 km2) is land and 0.1 square miles (0.2 km2) is water.
Economy
Dyer's economy is largely based on manufacturing and retail. The town is home to several large manufacturing companies, including Dyer Manufacturing, which produces automotive parts, and Dyer Plastics, which produces plastic products.
The town is also home to several retail stores, including a Walmart Supercenter, a Target, and a Kohl's.
Demographics
As of the census of 2010, there were 16,390 people, 6,541 households, and 4,541 families residing in the town. The population density was 2,019.3 people per square mile (779.2/km2). There were 6,945 housing units at an average density of 854.3 per square mile (330.2/km2). The racial makeup of the town was 87.2% White, 4.3% African American, 0.3% Native American, 3.2% Asian, 2.7% from other races, and 2.5% from two or more races. Hispanic or Latino of any race were 8.2% of the population.
There were 6,541 households, out of which 33.2% had children under the age of 18 living with them, 54.2% were married couples living together, 11.2% had a female householder with no husband present, and 30.2% were non-families. 24.7% of all households were made up of individuals, and 8.3% had someone living alone who was 65 years of age or older. The average household size was 2.50 and the average family size was 3.00.
In the town, the population was spread out, with 24.2% under the age of 18, 8.2% from 18 to 24, 30.2% from 25 to 44, 24.2% from 45 to 64, and 13.2% who were 65 years of age or older. The median age was 37 years. For every 100 females, there were 95.2 males. For every 100 females age 18 and over, there were 92.2 males.
The median income for a household in the town was $60,945, and the median income for a family was $71,945. Males had a median income of $50,945 versus $35,945 for females. The per capita income for the town was $27,945. About 4.2% of families and 5.2% of the population were below the poverty line, including 6.2% of those under age 18 and 4.2% of those age 65 or over.
Common Questions
What is Per Capita Income in Dyer?
Per Capita income in Dyer is $49,605.
What is the Median Family Income in Dyer?
Median Family Income in Dyer is $114,181.
What is the Median Household income in Dyer?
Median Household Income in Dyer is $98,631.
What is Income or Wage Gap in Dyer?
Income or Wage Gap in Dyer is 44.3%.
Women in Dyer earn 55.7 cents for every dollar earned by a man.
What is Inequality or Gini Index in Dyer?
Inequality or Gini Index in Dyer is 0.42.
What is the Total Population of Dyer?
Total Population of Dyer is 16,407.
What is the Total Male Population of Dyer?
Total Male Population of Dyer is 7,620.
What is the Total Female Population of Dyer?
Total Female Population of Dyer is 8,787.
What is the Ratio of Males per 100 Females in Dyer?
There are 86.72 Males per 100 Females in Dyer.
What is the Ratio of Females per 100 Males in Dyer?
There are 115.31 Females per 100 Males in Dyer.
What is the Median Population Age in Dyer?
Median Population Age in Dyer is 44.1 Years.
What is the Average Family Size in Dyer
Average Family Size in Dyer is 2.9 People.
What is the Average Household Size in Dyer
Average Household Size in Dyer is 2.5 People.
How Large is the Labor Force in Dyer?
There are 8,589 People in the Labor Forcein in Dyer.
What is the Percentage of People in the Labor Force in Dyer?
64.0% of People are in the Labor Force in Dyer.
What is the Unemployment Rate in Dyer?
Unemployment Rate in Dyer is 3.6%.