Zip Codes with the Highest Percentage of Population Employed in Arts, Media & Entertainment in the United States
RELATED REPORTS & OPTIONS
Arts, Media & Entertainment
United States
Compare Zip Codes
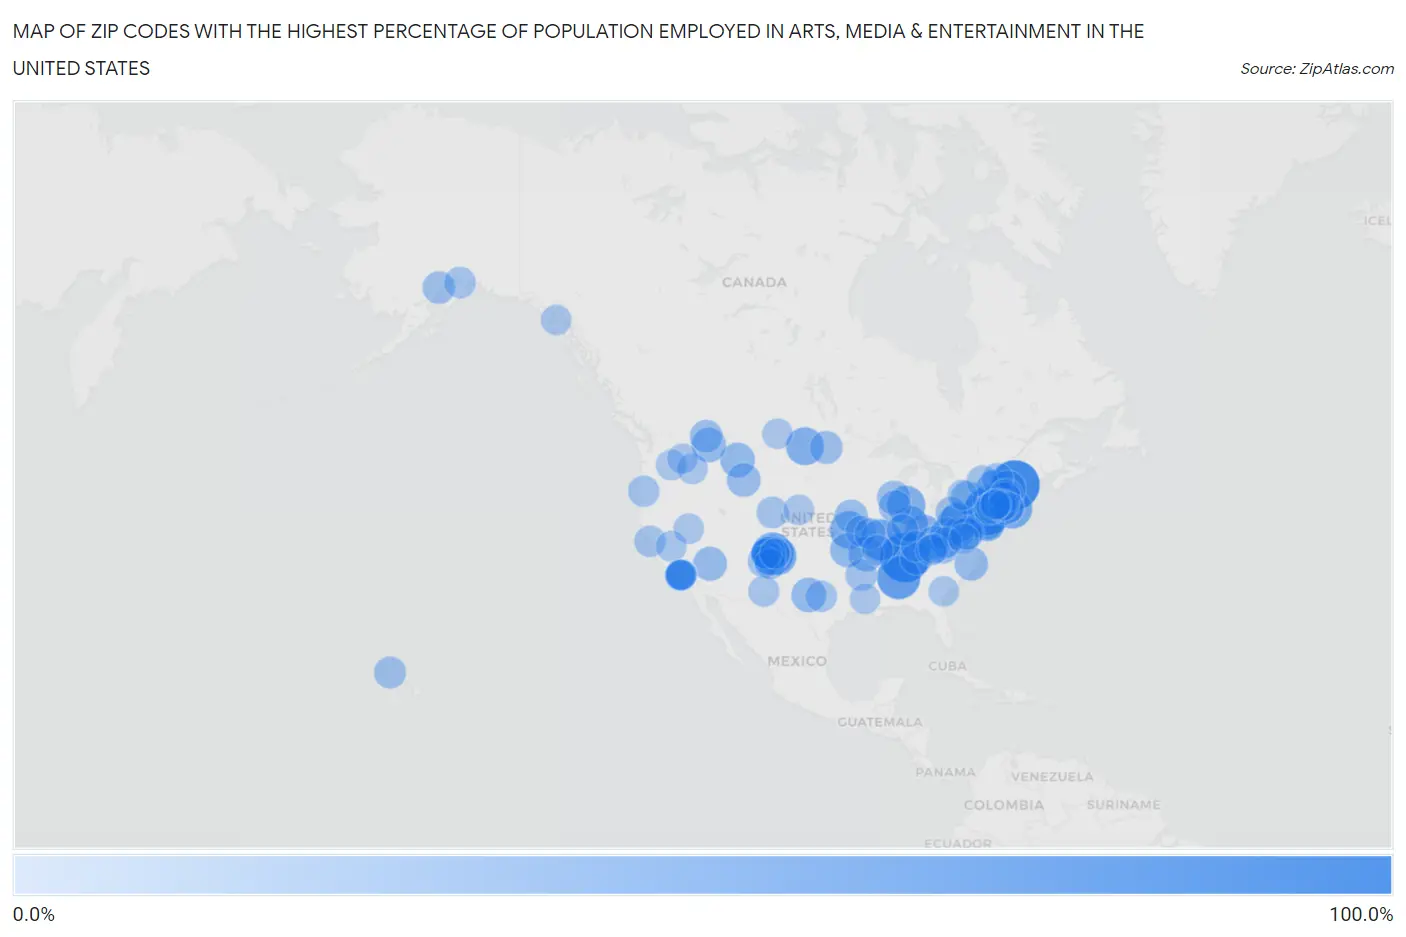
Map of Zip Codes with the Highest Percentage of Population Employed in Arts, Media & Entertainment in the United States
0.0%
100.0%
Zip Codes with the Highest Percentage of Population Employed in Arts, Media & Entertainment in the United States
| Zip Code | % Employed | vs State | vs National | |
| 1. | 37213 | 100.0% | 1.9%(+98.1)#1 | 2.1%(+97.9)#1 |
| 2. | 03897 | 100.0% | 1.8%(+98.2)#1 | 2.1%(+97.9)#2 |
| 3. | 18357 | 91.7% | 1.8%(+89.9)#1 | 2.1%(+89.6)#3 |
| 4. | 35559 | 73.3% | 1.3%(+72.1)#1 | 2.1%(+71.3)#4 |
| 5. | 87525 | 68.9% | 1.9%(+67.0)#1 | 2.1%(+66.8)#5 |
| 6. | 62279 | 64.7% | 1.9%(+62.8)#1 | 2.1%(+62.6)#6 |
| 7. | 02873 | 57.1% | 2.4%(+54.8)#1 | 2.1%(+55.1)#7 |
| 8. | 87580 | 52.5% | 1.9%(+50.6)#2 | 2.1%(+50.4)#8 |
| 9. | 15421 | 52.1% | 1.8%(+50.3)#2 | 2.1%(+50.0)#9 |
| 10. | 49115 | 51.9% | 1.7%(+50.2)#1 | 2.1%(+49.9)#10 |
| 11. | 87729 | 51.4% | 1.9%(+49.5)#3 | 2.1%(+49.3)#11 |
| 12. | 58778 | 50.6% | 1.4%(+49.3)#1 | 2.1%(+48.6)#12 |
| 13. | 64092 | 50.0% | 1.7%(+48.3)#1 | 2.1%(+47.9)#13 |
| 14. | 45112 | 50.0% | 1.6%(+48.4)#1 | 2.1%(+47.9)#14 |
| 15. | 12856 | 49.3% | 3.3%(+46.0)#1 | 2.1%(+47.2)#15 |
| 16. | 19490 | 45.7% | 1.8%(+43.9)#3 | 2.1%(+43.6)#16 |
| 17. | 05073 | 45.5% | 2.7%(+42.8)#1 | 2.1%(+43.4)#17 |
| 18. | 46290 | 44.8% | 1.4%(+43.4)#1 | 2.1%(+42.8)#18 |
| 19. | 87513 | 43.3% | 1.9%(+41.4)#4 | 2.1%(+41.2)#19 |
| 20. | 12115 | 41.5% | 3.3%(+38.2)#2 | 2.1%(+39.4)#20 |
| 21. | 12416 | 40.6% | 3.3%(+37.3)#3 | 2.1%(+38.6)#21 |
| 22. | 65760 | 39.5% | 1.7%(+37.8)#2 | 2.1%(+37.4)#22 |
| 23. | 19108 | 39.1% | 1.8%(+37.4)#4 | 2.1%(+37.1)#23 |
| 24. | 59053 | 38.0% | 2.0%(+36.0)#1 | 2.1%(+35.9)#24 |
| 25. | 59915 | 37.5% | 2.0%(+35.5)#2 | 2.1%(+35.4)#25 |
| 26. | 76953 | 37.5% | 1.7%(+35.8)#1 | 2.1%(+35.4)#26 |
| 27. | 74360 | 37.5% | 1.4%(+36.1)#1 | 2.1%(+35.4)#27 |
| 28. | 87577 | 37.2% | 1.9%(+35.4)#5 | 2.1%(+35.2)#28 |
| 29. | 06414 | 37.2% | 2.2%(+35.1)#1 | 2.1%(+35.2)#29 |
| 30. | 15693 | 37.1% | 1.8%(+35.4)#5 | 2.1%(+35.1)#30 |
| 31. | 86431 | 35.5% | 1.8%(+33.7)#1 | 2.1%(+33.4)#31 |
| 32. | 82450 | 33.9% | 1.5%(+32.3)#1 | 2.1%(+31.8)#32 |
| 33. | 05362 | 33.3% | 2.7%(+30.7)#2 | 2.1%(+31.3)#33 |
| 34. | 28554 | 33.3% | 1.7%(+31.6)#1 | 2.1%(+31.3)#34 |
| 35. | 14549 | 32.8% | 3.3%(+29.5)#4 | 2.1%(+30.7)#35 |
| 36. | 53176 | 32.6% | 1.7%(+30.9)#1 | 2.1%(+30.5)#36 |
| 37. | 22643 | 32.2% | 2.1%(+30.1)#1 | 2.1%(+30.1)#37 |
| 38. | 50835 | 31.6% | 1.5%(+30.1)#1 | 2.1%(+29.5)#38 |
| 39. | 25208 | 30.4% | 1.2%(+29.2)#1 | 2.1%(+28.4)#39 |
| 40. | 58277 | 30.4% | 1.4%(+29.0)#2 | 2.1%(+28.3)#40 |
| 41. | 59933 | 30.0% | 2.0%(+28.0)#3 | 2.1%(+27.9)#41 |
| 42. | 41271 | 29.8% | 1.4%(+28.4)#1 | 2.1%(+27.7)#42 |
| 43. | 99635 | 28.7% | 1.7%(+27.0)#1 | 2.1%(+26.6)#43 |
| 44. | 60519 | 28.6% | 1.9%(+26.7)#2 | 2.1%(+26.5)#44 |
| 45. | 24830 | 28.6% | 1.2%(+27.4)#2 | 2.1%(+26.5)#45 |
| 46. | 26638 | 28.3% | 1.2%(+27.1)#3 | 2.1%(+26.2)#46 |
| 47. | 13806 | 27.7% | 3.3%(+24.4)#5 | 2.1%(+25.7)#47 |
| 48. | 26884 | 27.3% | 1.2%(+26.1)#4 | 2.1%(+25.3)#48 |
| 49. | 38578 | 27.3% | 1.9%(+25.3)#2 | 2.1%(+25.2)#49 |
| 50. | 87578 | 27.0% | 1.9%(+25.2)#6 | 2.1%(+25.0)#50 |
| 51. | 96751 | 26.9% | 2.3%(+24.6)#1 | 2.1%(+24.8)#51 |
| 52. | 90068 | 26.9% | 3.0%(+23.9)#1 | 2.1%(+24.8)#52 |
| 53. | 87044 | 26.9% | 1.9%(+25.0)#7 | 2.1%(+24.8)#53 |
| 54. | 22627 | 26.6% | 2.1%(+24.5)#2 | 2.1%(+24.5)#54 |
| 55. | 71999 | 25.9% | 1.3%(+24.6)#1 | 2.1%(+23.9)#55 |
| 56. | 13692 | 25.7% | 3.3%(+22.5)#6 | 2.1%(+23.7)#56 |
| 57. | 82073 | 25.6% | 1.5%(+24.1)#2 | 2.1%(+23.6)#57 |
| 58. | 47858 | 25.6% | 1.4%(+24.1)#2 | 2.1%(+23.5)#58 |
| 59. | 16172 | 25.3% | 1.8%(+23.6)#6 | 2.1%(+23.3)#59 |
| 60. | 12743 | 25.3% | 3.3%(+22.0)#7 | 2.1%(+23.2)#60 |
| 61. | 12763 | 25.2% | 3.3%(+21.9)#8 | 2.1%(+23.2)#61 |
| 62. | 99540 | 25.0% | 1.7%(+23.3)#2 | 2.1%(+22.9)#62 |
| 63. | 12978 | 24.7% | 3.3%(+21.4)#9 | 2.1%(+22.6)#63 |
| 64. | 97486 | 24.4% | 2.5%(+21.9)#1 | 2.1%(+22.3)#64 |
| 65. | 94963 | 24.4% | 3.0%(+21.4)#2 | 2.1%(+22.3)#65 |
| 66. | 76870 | 24.3% | 1.7%(+22.7)#2 | 2.1%(+22.3)#66 |
| 67. | 25907 | 23.5% | 1.2%(+22.3)#5 | 2.1%(+21.5)#67 |
| 68. | 42758 | 23.5% | 1.4%(+22.1)#2 | 2.1%(+21.5)#68 |
| 69. | 65320 | 23.5% | 1.7%(+21.9)#3 | 2.1%(+21.5)#69 |
| 70. | 65077 | 23.2% | 1.7%(+21.5)#4 | 2.1%(+21.1)#70 |
| 71. | 88003 | 23.1% | 1.9%(+21.2)#8 | 2.1%(+21.0)#71 |
| 72. | 01346 | 22.8% | 2.4%(+20.4)#1 | 2.1%(+20.7)#72 |
| 73. | 41763 | 22.5% | 1.4%(+21.2)#3 | 2.1%(+20.5)#73 |
| 74. | 87540 | 22.3% | 1.9%(+20.4)#9 | 2.1%(+20.2)#74 |
| 75. | 93601 | 22.2% | 3.0%(+19.2)#3 | 2.1%(+20.1)#75 |
| 76. | 05351 | 22.0% | 2.7%(+19.3)#3 | 2.1%(+19.9)#76 |
| 77. | 06336 | 21.7% | 2.2%(+19.6)#2 | 2.1%(+19.7)#77 |
| 78. | 99345 | 21.4% | 2.1%(+19.3)#1 | 2.1%(+19.4)#78 |
| 79. | 97842 | 21.4% | 2.5%(+18.9)#2 | 2.1%(+19.4)#79 |
| 80. | 06753 | 21.4% | 2.2%(+19.3)#3 | 2.1%(+19.4)#80 |
| 81. | 69146 | 21.3% | 1.5%(+19.8)#1 | 2.1%(+19.2)#81 |
| 82. | 89310 | 21.1% | 2.1%(+19.0)#1 | 2.1%(+19.0)#82 |
| 83. | 99359 | 21.1% | 2.1%(+19.0)#2 | 2.1%(+19.0)#83 |
| 84. | 63952 | 20.8% | 1.7%(+19.2)#5 | 2.1%(+18.8)#84 |
| 85. | 99826 | 20.8% | 1.7%(+19.1)#3 | 2.1%(+18.7)#85 |
| 86. | 71359 | 20.7% | 1.6%(+19.2)#1 | 2.1%(+18.7)#86 |
| 87. | 59252 | 20.6% | 2.0%(+18.6)#4 | 2.1%(+18.5)#87 |
| 88. | 90039 | 20.6% | 3.0%(+17.6)#4 | 2.1%(+18.5)#88 |
| 89. | 90027 | 20.5% | 3.0%(+17.6)#5 | 2.1%(+18.5)#89 |
| 90. | 31307 | 20.5% | 2.0%(+18.6)#1 | 2.1%(+18.5)#90 |
| 91. | 06061 | 20.4% | 2.2%(+18.2)#4 | 2.1%(+18.3)#91 |
| 92. | 12432 | 20.3% | 3.3%(+17.1)#10 | 2.1%(+18.3)#92 |
| 93. | 91602 | 20.3% | 3.0%(+17.3)#6 | 2.1%(+18.2)#93 |
| 94. | 22940 | 20.2% | 2.1%(+18.1)#3 | 2.1%(+18.1)#94 |
| 95. | 87515 | 20.1% | 1.9%(+18.3)#10 | 2.1%(+18.1)#95 |
| 96. | 12419 | 20.1% | 3.3%(+16.8)#11 | 2.1%(+18.0)#96 |
| 97. | 41815 | 19.9% | 1.4%(+18.6)#4 | 2.1%(+17.9)#97 |
| 98. | 91604 | 19.9% | 3.0%(+17.0)#7 | 2.1%(+17.9)#98 |
| 99. | 87718 | 19.7% | 1.9%(+17.9)#11 | 2.1%(+17.7)#99 |
| 100. | 14260 | 19.5% | 3.3%(+16.2)#12 | 2.1%(+17.4)#100 |
Common Questions
What are the Top 10 Zip Codes with the Highest Percentage of Population Employed in Arts, Media & Entertainment in the United States?
Top 10 Zip Codes with the Highest Percentage of Population Employed in Arts, Media & Entertainment in the United States are:
#1
100.0%
#2
100.0%
#3
91.7%
#4
73.3%
#5
68.9%
#6
64.7%
#7
57.1%
#8
52.5%
#9
52.1%
#10
51.9%
What zip code has the Highest Percentage of Population Employed in Arts, Media & Entertainment in the United States?
37213 has the Highest Percentage of Population Employed in Arts, Media & Entertainment in the United States with 100.0%.
What is the Percentage of Population Employed in Arts, Media & Entertainment in the United States?
Percentage of Population Employed in Arts, Media & Entertainment in the United States is 2.1%.