St Mary s, CO Map & Demographics
St Mary s Map
St Mary s Overview
$34,134
PER CAPITA INCOME
$67,348
AVG HOUSEHOLD INCOME
43.9%
WAGE / INCOME GAP [ % ]
56.1¢/ $1
WAGE / INCOME GAP [ $ ]
0.17
INEQUALITY / GINI INDEX
228
TOTAL POPULATION
150
MALE POPULATION
78
FEMALE POPULATION
192.31
MALES / 100 FEMALES
52.00
FEMALES / 100 MALES
34.0
MEDIAN AGE
2.8
AVG FAMILY SIZE
2.2
AVG HOUSEHOLD SIZE
162
LABOR FORCE [ PEOPLE ]
92.6%
PERCENT IN LABOR FORCE
30.2%
UNEMPLOYMENT RATE
Income in St Mary s
Income Overview in St Mary s
| Characteristic | Number | Measure |
| Per Capita Income | 228 | $34,134 |
| Median Family Income | 70 | $0 |
| Mean Family Income | 70 | $0 |
| Median Household Income | 103 | $67,348 |
| Mean Household Income | 103 | $73,905 |
| Income Deficit | 70 | $0 |
| Wage / Income Gap (%) | 228 | 43.86% |
| Wage / Income Gap ($) | 228 | 56.14¢ per $1 |
| Gini / Inequality Index | 228 | 0.17 |
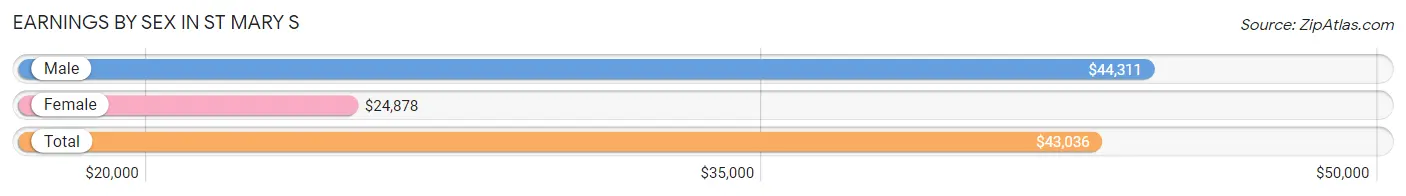
Earnings by Sex in St Mary s
Average Earnings in St Mary s are $43,036, $44,311 for men and $24,878 for women, a difference of 43.9%.
| Sex | Number | Average Earnings |
| Male | 97 (55.4%) | $44,311 |
| Female | 78 (44.6%) | $24,878 |
| Total | 175 (100.0%) | $43,036 |
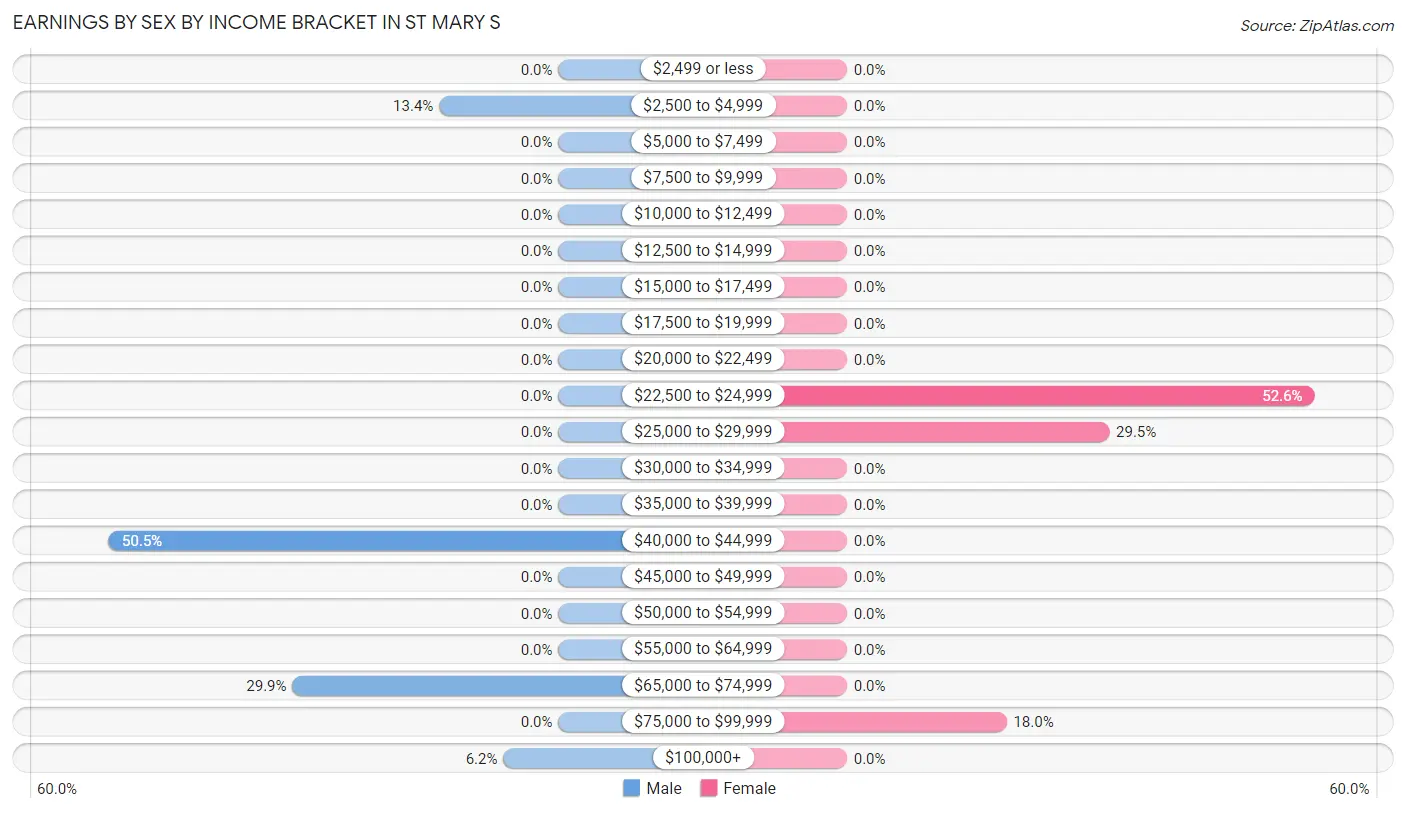
Earnings by Sex by Income Bracket in St Mary s
The most common earnings brackets in St Mary s are $40,000 to $44,999 for men (49 | 50.5%) and $22,500 to $24,999 for women (41 | 52.6%).
| Income | Male | Female |
| $2,499 or less | 0 (0.0%) | 0 (0.0%) |
| $2,500 to $4,999 | 13 (13.4%) | 0 (0.0%) |
| $5,000 to $7,499 | 0 (0.0%) | 0 (0.0%) |
| $7,500 to $9,999 | 0 (0.0%) | 0 (0.0%) |
| $10,000 to $12,499 | 0 (0.0%) | 0 (0.0%) |
| $12,500 to $14,999 | 0 (0.0%) | 0 (0.0%) |
| $15,000 to $17,499 | 0 (0.0%) | 0 (0.0%) |
| $17,500 to $19,999 | 0 (0.0%) | 0 (0.0%) |
| $20,000 to $22,499 | 0 (0.0%) | 0 (0.0%) |
| $22,500 to $24,999 | 0 (0.0%) | 41 (52.6%) |
| $25,000 to $29,999 | 0 (0.0%) | 23 (29.5%) |
| $30,000 to $34,999 | 0 (0.0%) | 0 (0.0%) |
| $35,000 to $39,999 | 0 (0.0%) | 0 (0.0%) |
| $40,000 to $44,999 | 49 (50.5%) | 0 (0.0%) |
| $45,000 to $49,999 | 0 (0.0%) | 0 (0.0%) |
| $50,000 to $54,999 | 0 (0.0%) | 0 (0.0%) |
| $55,000 to $64,999 | 0 (0.0%) | 0 (0.0%) |
| $65,000 to $74,999 | 29 (29.9%) | 0 (0.0%) |
| $75,000 to $99,999 | 0 (0.0%) | 14 (17.9%) |
| $100,000+ | 6 (6.2%) | 0 (0.0%) |
| Total | 97 (100.0%) | 78 (100.0%) |
Earnings by Sex by Educational Attainment in St Mary s
| Educational Attainment | Male Income | Female Income |
| Less than High School | - | - |
| High School Diploma | - | - |
| College or Associate's Degree | - | - |
| Bachelor's Degree | - | - |
| Graduate Degree | - | - |
| Total | $44,311 | $24,878 |
Family Income in St Mary s
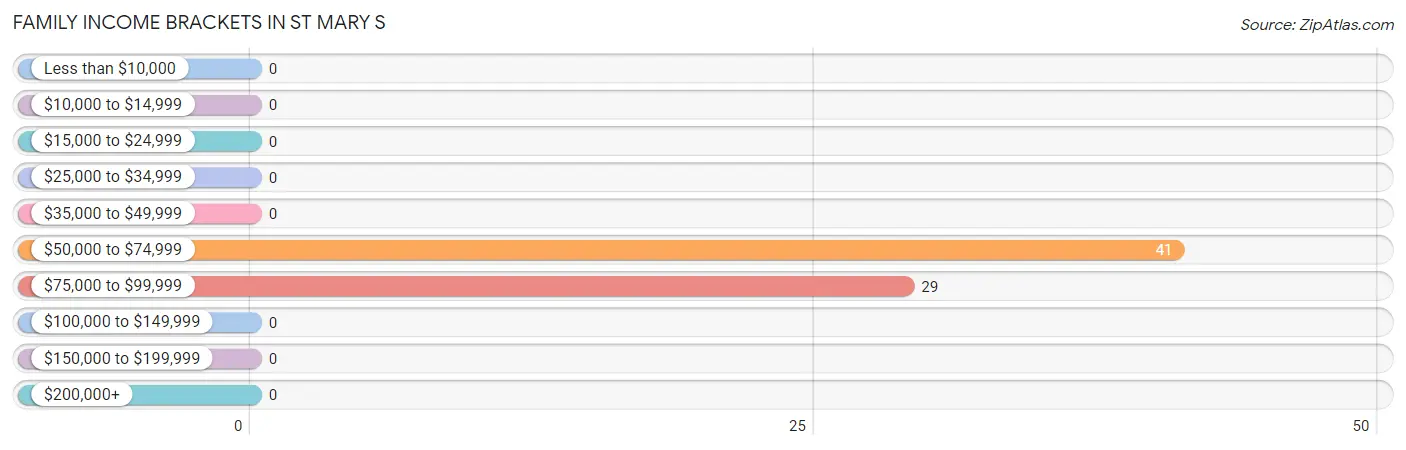
Family Income Brackets in St Mary s
According to the St Mary s family income data, there are 41 families falling into the $50,000 to $74,999 income range, which is the most common income bracket and makes up 58.6% of all families.
| Income Bracket | # Families | % Families |
| Less than $10,000 | 0 | 0.0% |
| $10,000 to $14,999 | 0 | 0.0% |
| $15,000 to $24,999 | 0 | 0.0% |
| $25,000 to $34,999 | 0 | 0.0% |
| $35,000 to $49,999 | 0 | 0.0% |
| $50,000 to $74,999 | 41 | 58.6% |
| $75,000 to $99,999 | 29 | 41.4% |
| $100,000 to $149,999 | 0 | 0.0% |
| $150,000 to $199,999 | 0 | 0.0% |
| $200,000+ | 0 | 0.0% |
Family Income by Famaliy Size in St Mary s
| Income Bracket | # Families | Median Income |
| 2-Person Families | 41 (58.6%) | $0 |
| 3-Person Families | 0 (0.0%) | $0 |
| 4-Person Families | 29 (41.4%) | $0 |
| 5-Person Families | 0 (0.0%) | $0 |
| 6-Person Families | 0 (0.0%) | $0 |
| 7+ Person Families | 0 (0.0%) | $0 |
| Total | 70 (100.0%) | $0 |
Family Income by Number of Earners in St Mary s
| Number of Earners | # Families | Median Income |
| No Earners | 0 (0.0%) | $0 |
| 1 Earner | 0 (0.0%) | $0 |
| 2 Earners | 70 (100.0%) | $0 |
| 3+ Earners | 0 (0.0%) | $0 |
| Total | 70 (100.0%) | $0 |
Household Income in St Mary s
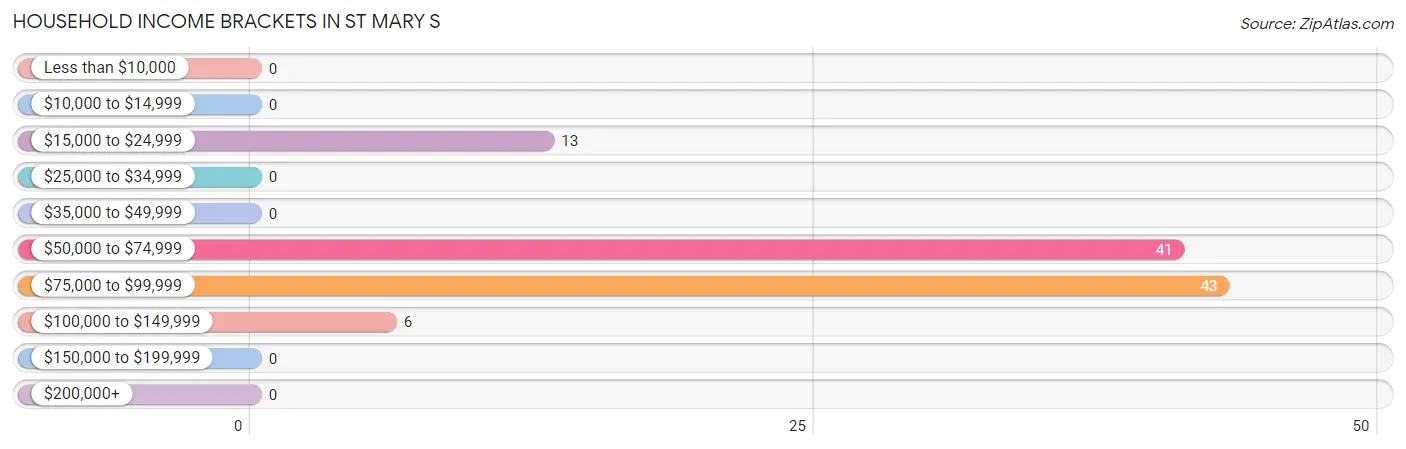
Household Income Brackets in St Mary s
With 43 households falling in the category, the $75,000 to $99,999 income range is the most frequent in St Mary s, accounting for 41.7% of all households.
| Income Bracket | # Households | % Households |
| Less than $10,000 | 0 | 0.0% |
| $10,000 to $14,999 | 0 | 0.0% |
| $15,000 to $24,999 | 13 | 12.6% |
| $25,000 to $34,999 | 0 | 0.0% |
| $35,000 to $49,999 | 0 | 0.0% |
| $50,000 to $74,999 | 41 | 39.8% |
| $75,000 to $99,999 | 43 | 41.7% |
| $100,000 to $149,999 | 6 | 5.8% |
| $150,000 to $199,999 | 0 | 0.0% |
| $200,000+ | 0 | 0.0% |
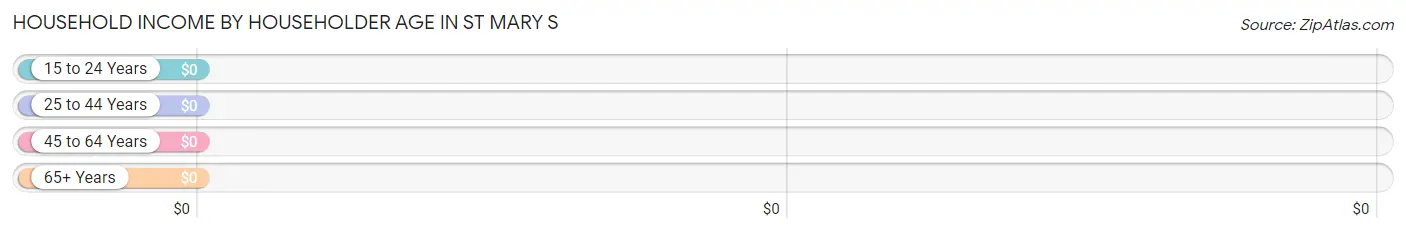
Household Income by Householder Age in St Mary s
| Income Bracket | # Households | Median Income |
| 15 to 24 Years | 0 (0.0%) | $0 |
| 25 to 44 Years | 43 (41.7%) | $0 |
| 45 to 64 Years | 47 (45.6%) | $0 |
| 65+ Years | 13 (12.6%) | $0 |
| Total | 103 (100.0%) | $67,348 |
Poverty in St Mary s
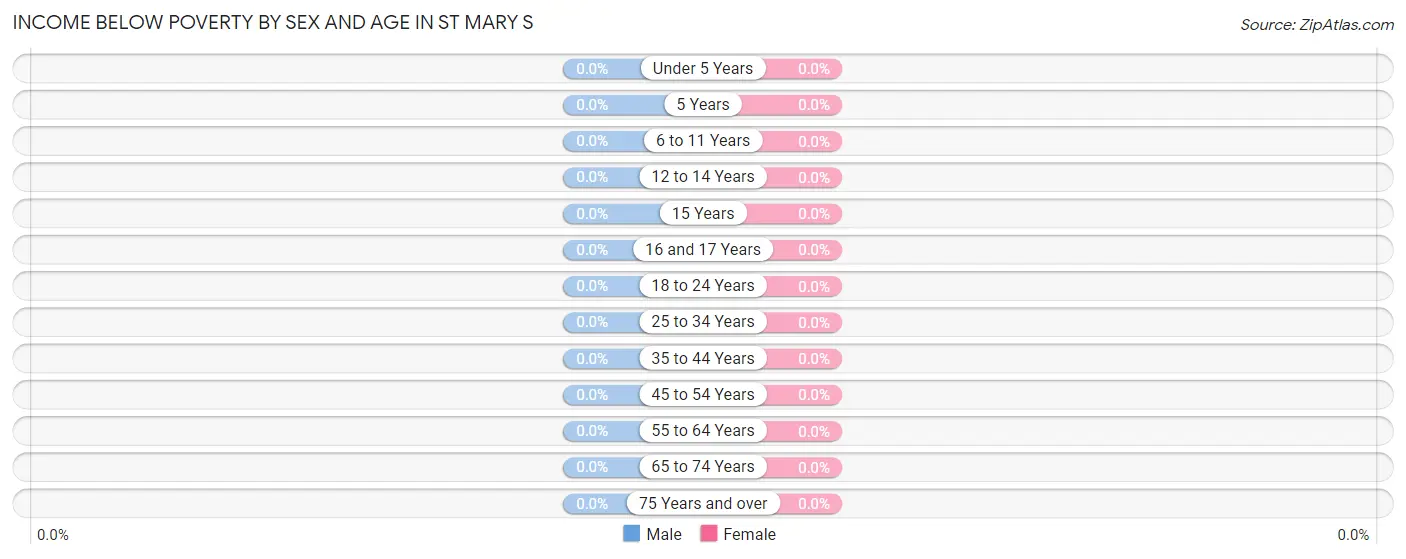
Income Below Poverty by Sex and Age in St Mary s
| Age Bracket | Male | Female |
| Under 5 Years | 0 (0.0%) | 0 (0.0%) |
| 5 Years | 0 (0.0%) | 0 (0.0%) |
| 6 to 11 Years | 0 (0.0%) | 0 (0.0%) |
| 12 to 14 Years | 0 (0.0%) | 0 (0.0%) |
| 15 Years | 0 (0.0%) | 0 (0.0%) |
| 16 and 17 Years | 0 (0.0%) | 0 (0.0%) |
| 18 to 24 Years | 0 (0.0%) | 0 (0.0%) |
| 25 to 34 Years | 0 (0.0%) | 0 (0.0%) |
| 35 to 44 Years | 0 (0.0%) | 0 (0.0%) |
| 45 to 54 Years | 0 (0.0%) | 0 (0.0%) |
| 55 to 64 Years | 0 (0.0%) | 0 (0.0%) |
| 65 to 74 Years | 0 (0.0%) | 0 (0.0%) |
| 75 Years and over | 0 (0.0%) | 0 (0.0%) |
| Total | 0 (0.0%) | 0 (0.0%) |
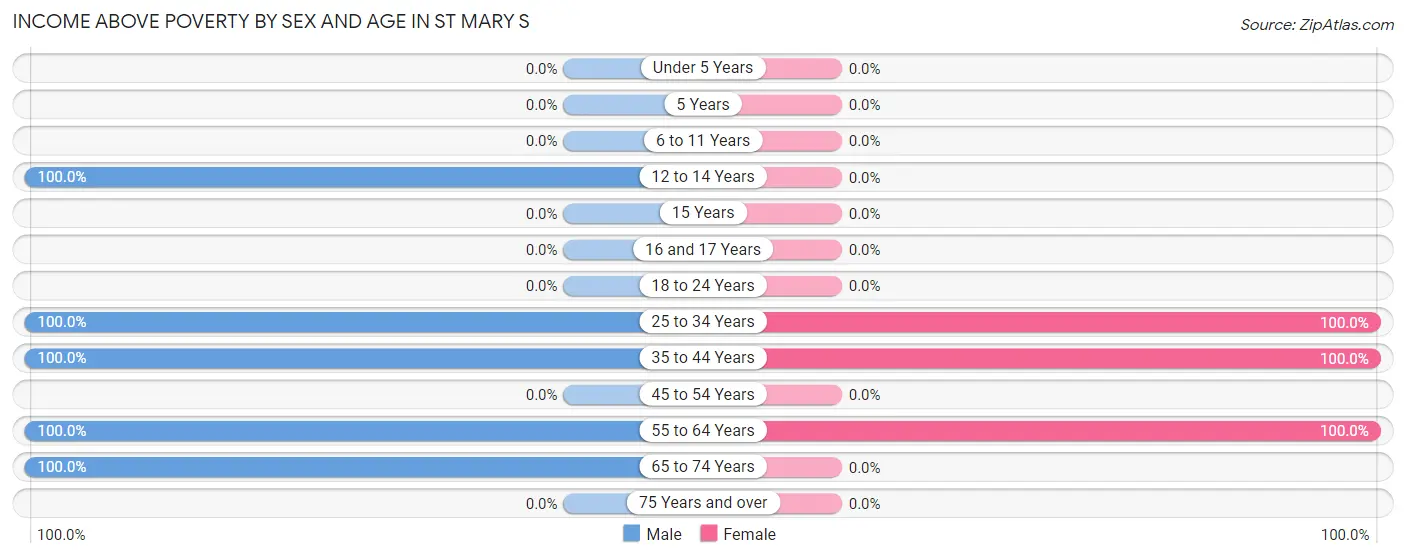
Income Above Poverty by Sex and Age in St Mary s
According to the poverty statistics in St Mary s, males aged 12 to 14 years and females aged 25 to 34 years are the age groups that are most secure financially, with 100.0% of males and 100.0% of females in these age groups living above the poverty line.
| Age Bracket | Male | Female |
| Under 5 Years | 0 (0.0%) | 0 (0.0%) |
| 5 Years | 0 (0.0%) | 0 (0.0%) |
| 6 to 11 Years | 0 (0.0%) | 0 (0.0%) |
| 12 to 14 Years | 53 (100.0%) | 0 (0.0%) |
| 15 Years | 0 (0.0%) | 0 (0.0%) |
| 16 and 17 Years | 0 (0.0%) | 0 (0.0%) |
| 18 to 24 Years | 0 (0.0%) | 0 (0.0%) |
| 25 to 34 Years | 49 (100.0%) | 14 (100.0%) |
| 35 to 44 Years | 29 (100.0%) | 23 (100.0%) |
| 45 to 54 Years | 0 (0.0%) | 0 (0.0%) |
| 55 to 64 Years | 6 (100.0%) | 41 (100.0%) |
| 65 to 74 Years | 13 (100.0%) | 0 (0.0%) |
| 75 Years and over | 0 (0.0%) | 0 (0.0%) |
| Total | 150 (100.0%) | 78 (100.0%) |
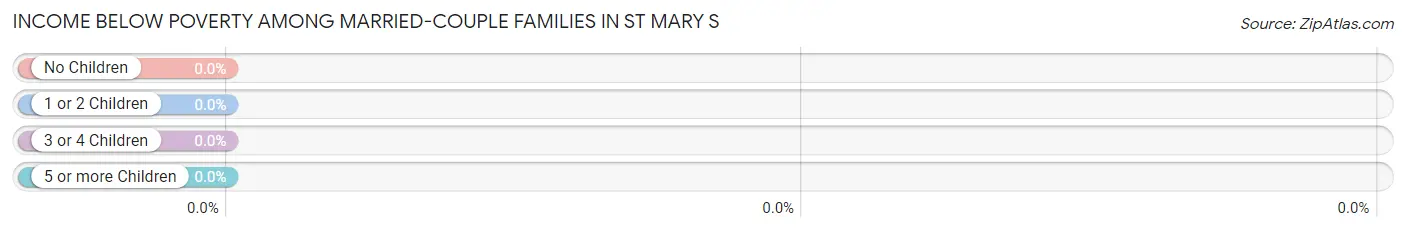
Income Below Poverty Among Married-Couple Families in St Mary s
| Children | Above Poverty | Below Poverty |
| No Children | 0 (0.0%) | 0 (0.0%) |
| 1 or 2 Children | 29 (100.0%) | 0 (0.0%) |
| 3 or 4 Children | 0 (0.0%) | 0 (0.0%) |
| 5 or more Children | 0 (0.0%) | 0 (0.0%) |
| Total | 29 (100.0%) | 0 (0.0%) |
Income Below Poverty Among Single-Parent Households in St Mary s

| Children | Single Father | Single Mother |
| No Children | 0 (0.0%) | 0 (0.0%) |
| 1 or 2 Children | 0 (0.0%) | 0 (0.0%) |
| 3 or 4 Children | 0 (0.0%) | 0 (0.0%) |
| 5 or more Children | 0 (0.0%) | 0 (0.0%) |
| Total | 0 (0.0%) | 0 (0.0%) |
Income Below Poverty Among Married-Couple vs Single-Parent Households in St Mary s
| Children | Married-Couple Families | Single-Parent Households |
| No Children | 0 (0.0%) | 0 (0.0%) |
| 1 or 2 Children | 0 (0.0%) | 0 (0.0%) |
| 3 or 4 Children | 0 (0.0%) | 0 (0.0%) |
| 5 or more Children | 0 (0.0%) | 0 (0.0%) |
| Total | 0 (0.0%) | 0 (0.0%) |
Race in St Mary s
The most populous races in St Mary s are , and White / Caucasian (228 | 100.0%).
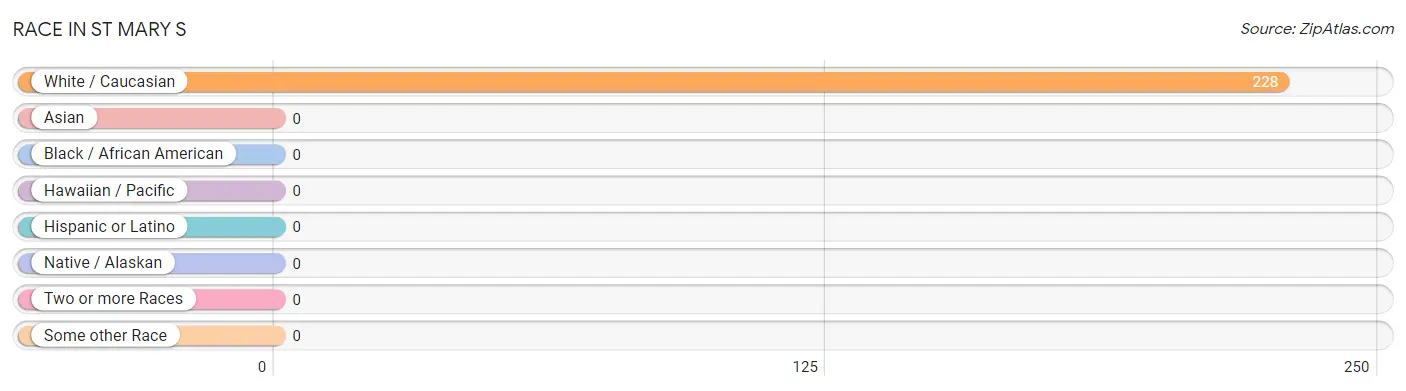
| Race | # Population | % Population |
| Asian | 0 | 0.0% |
| Black / African American | 0 | 0.0% |
| Hawaiian / Pacific | 0 | 0.0% |
| Hispanic or Latino | 0 | 0.0% |
| Native / Alaskan | 0 | 0.0% |
| White / Caucasian | 228 | 100.0% |
| Two or more Races | 0 | 0.0% |
| Some other Race | 0 | 0.0% |
| Total | 228 | 100.0% |
Ancestry in St Mary s
The most populous ancestries reported in St Mary s are Scottish (90 | 39.5%), German (62 | 27.2%), Scandinavian (14 | 6.1%), and English (6 | 2.6%), together accounting for 75.4% of all St Mary s residents.
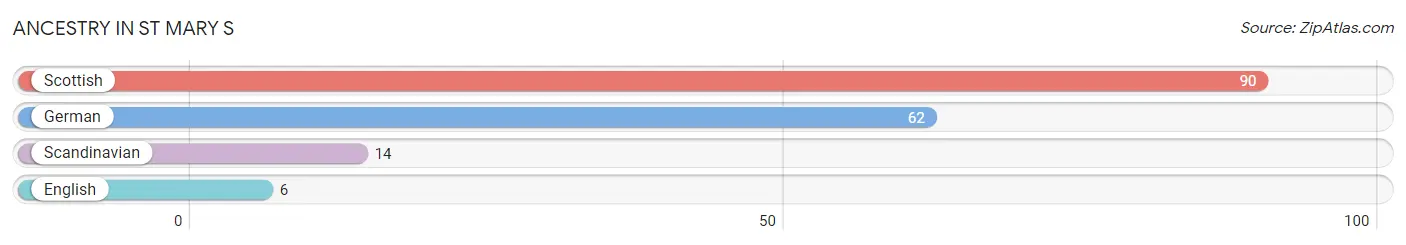
| Ancestry | # Population | % Population |
| English | 6 | 2.6% |
| German | 62 | 27.2% |
| Scandinavian | 14 | 6.1% |
| Scottish | 90 | 39.5% | View All 4 Rows |
Immigrants in St Mary s

| Immigration Origin | # Population | % Population | View All 0 Rows |
Sex and Age in St Mary s
Sex and Age in St Mary s
The most populous age groups in St Mary s are 10 to 14 Years (53 | 35.3%) for men and 55 to 59 Years (41 | 52.6%) for women.
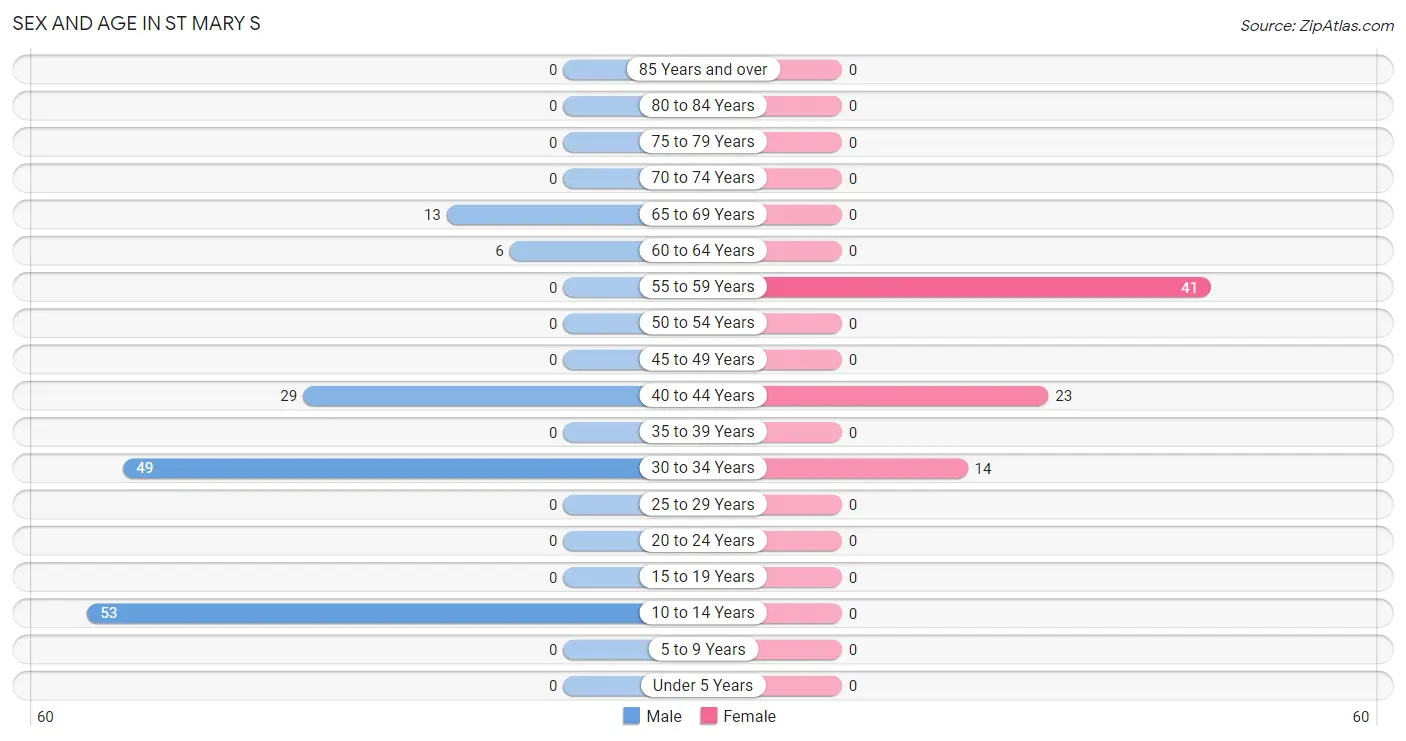
| Age Bracket | Male | Female |
| Under 5 Years | 0 (0.0%) | 0 (0.0%) |
| 5 to 9 Years | 0 (0.0%) | 0 (0.0%) |
| 10 to 14 Years | 53 (35.3%) | 0 (0.0%) |
| 15 to 19 Years | 0 (0.0%) | 0 (0.0%) |
| 20 to 24 Years | 0 (0.0%) | 0 (0.0%) |
| 25 to 29 Years | 0 (0.0%) | 0 (0.0%) |
| 30 to 34 Years | 49 (32.7%) | 14 (17.9%) |
| 35 to 39 Years | 0 (0.0%) | 0 (0.0%) |
| 40 to 44 Years | 29 (19.3%) | 23 (29.5%) |
| 45 to 49 Years | 0 (0.0%) | 0 (0.0%) |
| 50 to 54 Years | 0 (0.0%) | 0 (0.0%) |
| 55 to 59 Years | 0 (0.0%) | 41 (52.6%) |
| 60 to 64 Years | 6 (4.0%) | 0 (0.0%) |
| 65 to 69 Years | 13 (8.7%) | 0 (0.0%) |
| 70 to 74 Years | 0 (0.0%) | 0 (0.0%) |
| 75 to 79 Years | 0 (0.0%) | 0 (0.0%) |
| 80 to 84 Years | 0 (0.0%) | 0 (0.0%) |
| 85 Years and over | 0 (0.0%) | 0 (0.0%) |
| Total | 150 (100.0%) | 78 (100.0%) |
Families and Households in St Mary s
Median Family Size in St Mary s
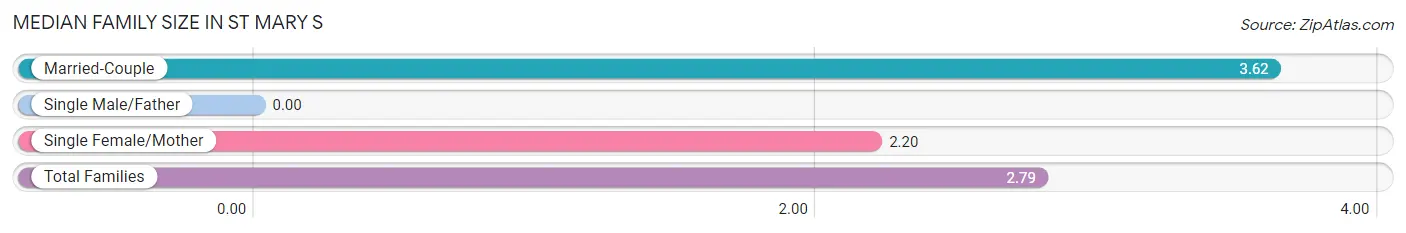
| Family Type | # Families | Family Size |
| Married-Couple | 29 (41.4%) | 3.62 |
| Single Male/Father | 0 (0.0%) | - |
| Single Female/Mother | 41 (58.6%) | 2.20 |
| Total Families | 70 (100.0%) | 2.79 |
Median Household Size in St Mary s
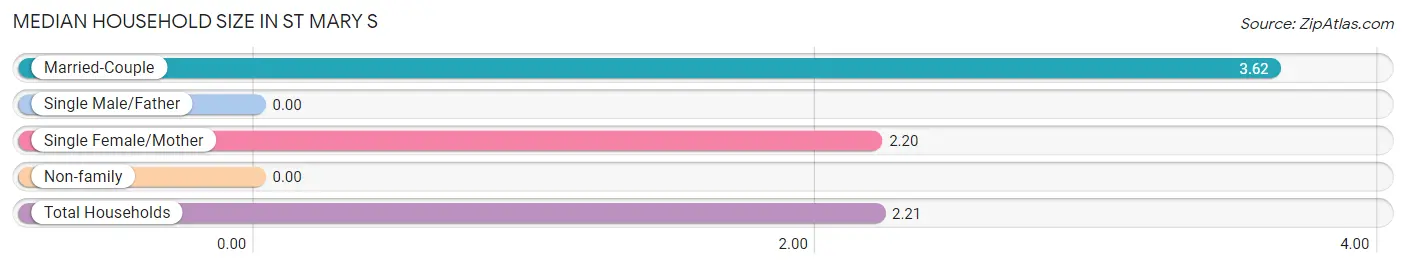
| Household Type | # Households | Household Size |
| Married-Couple | 29 (28.2%) | 3.62 |
| Single Male/Father | 0 (0.0%) | - |
| Single Female/Mother | 41 (39.8%) | 2.20 |
| Non-family | 33 (32.0%) | - |
| Total Households | 103 (100.0%) | 2.21 |
Household Size by Marriage Status in St Mary s
Out of a total of 103 households in St Mary s, 70 (68.0%) are family households, while 33 (32.0%) are nonfamily households. The most numerous type of family households are 2-person households, comprising 41, and the most common type of nonfamily households are 1-person households, comprising 33.
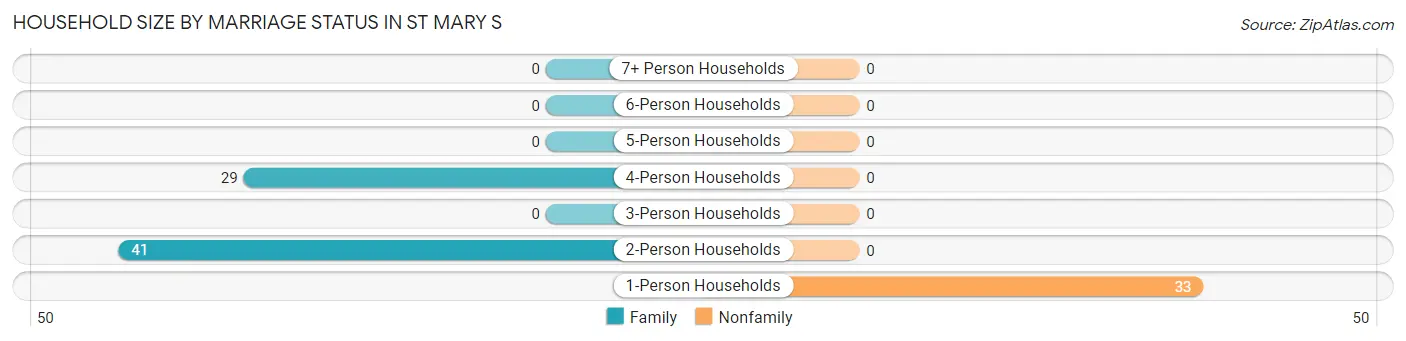
| Household Size | Family Households | Nonfamily Households |
| 1-Person Households | - | 33 (32.0%) |
| 2-Person Households | 41 (39.8%) | 0 (0.0%) |
| 3-Person Households | 0 (0.0%) | 0 (0.0%) |
| 4-Person Households | 29 (28.2%) | 0 (0.0%) |
| 5-Person Households | 0 (0.0%) | 0 (0.0%) |
| 6-Person Households | 0 (0.0%) | 0 (0.0%) |
| 7+ Person Households | 0 (0.0%) | 0 (0.0%) |
| Total | 70 (68.0%) | 33 (32.0%) |
Female Fertility in St Mary s
Fertility by Age in St Mary s
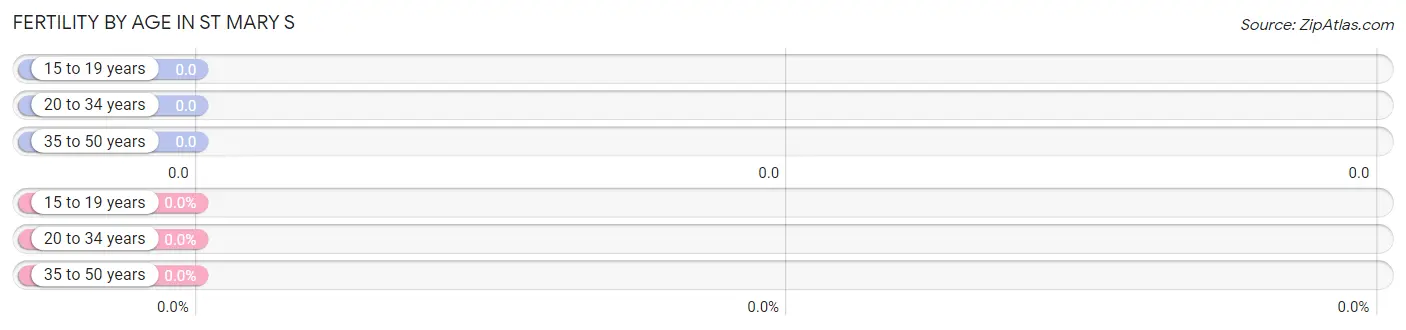
| Age Bracket | Women with Births | Births / 1,000 Women |
| 15 to 19 years | 0 (0.0%) | 0.0 |
| 20 to 34 years | 0 (0.0%) | 0.0 |
| 35 to 50 years | 0 (0.0%) | 0.0 |
| Total | 0 (0.0%) | 0.0 |
Fertility by Age by Marriage Status in St Mary s
| Age Bracket | Married | Unmarried |
| 15 to 19 years | 0 (0.0%) | 0 (0.0%) |
| 20 to 34 years | 0 (0.0%) | 0 (0.0%) |
| 35 to 50 years | 0 (0.0%) | 0 (0.0%) |
| Total | 0 (0.0%) | 0 (0.0%) |
Fertility by Education in St Mary s
| Educational Attainment | Women with Births | Births / 1,000 Women |
| Less than High School | 0 (0.0%) | 0.0 |
| High School Diploma | 0 (0.0%) | 0.0 |
| College or Associate's Degree | 0 (0.0%) | 0.0 |
| Bachelor's Degree | 0 (0.0%) | 0.0 |
| Graduate Degree | 0 (0.0%) | 0.0 |
| Total | 0 (0.0%) | 0.0 |
Fertility by Education by Marriage Status in St Mary s
| Educational Attainment | Married | Unmarried |
| Less than High School | 0 (0.0%) | 0 (0.0%) |
| High School Diploma | 0 (0.0%) | 0 (0.0%) |
| College or Associate's Degree | 0 (0.0%) | 0 (0.0%) |
| Bachelor's Degree | 0 (0.0%) | 0 (0.0%) |
| Graduate Degree | 0 (0.0%) | 0 (0.0%) |
| Total | 0 (0.0%) | 0 (0.0%) |
Employment Characteristics in St Mary s
Employment by Class of Employer in St Mary s
Among the 113 employed individuals in St Mary s, private company employees (70 | 62.0%), not-for-profit organizations (29 | 25.7%), and local government employees (14 | 12.4%) make up the most common classes of employment.
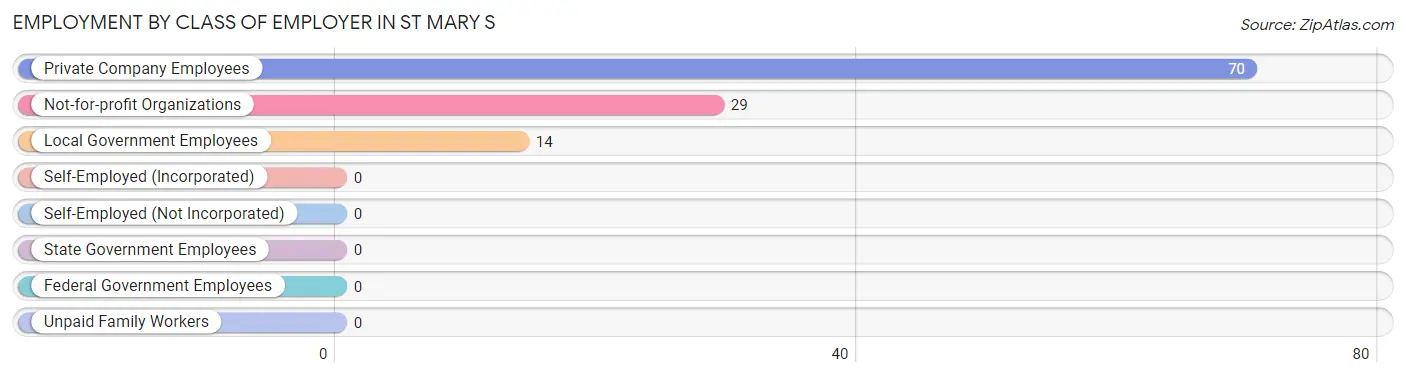
| Employer Class | # Employees | % Employees |
| Private Company Employees | 70 | 62.0% |
| Self-Employed (Incorporated) | 0 | 0.0% |
| Self-Employed (Not Incorporated) | 0 | 0.0% |
| Not-for-profit Organizations | 29 | 25.7% |
| Local Government Employees | 14 | 12.4% |
| State Government Employees | 0 | 0.0% |
| Federal Government Employees | 0 | 0.0% |
| Unpaid Family Workers | 0 | 0.0% |
| Total | 113 | 100.0% |
Employment Status by Age in St Mary s
According to the labor force statistics for St Mary s, out of the total population over 16 years of age (175), 92.6% or 162 individuals are in the labor force, with 30.2% or 49 of them unemployed. The age group with the highest labor force participation rate is 30 to 34 years, with 100.0% or 63 individuals in the labor force. Within the labor force, the 30 to 34 years age range has the highest percentage of unemployed individuals, with 77.8% or 49 of them being unemployed.
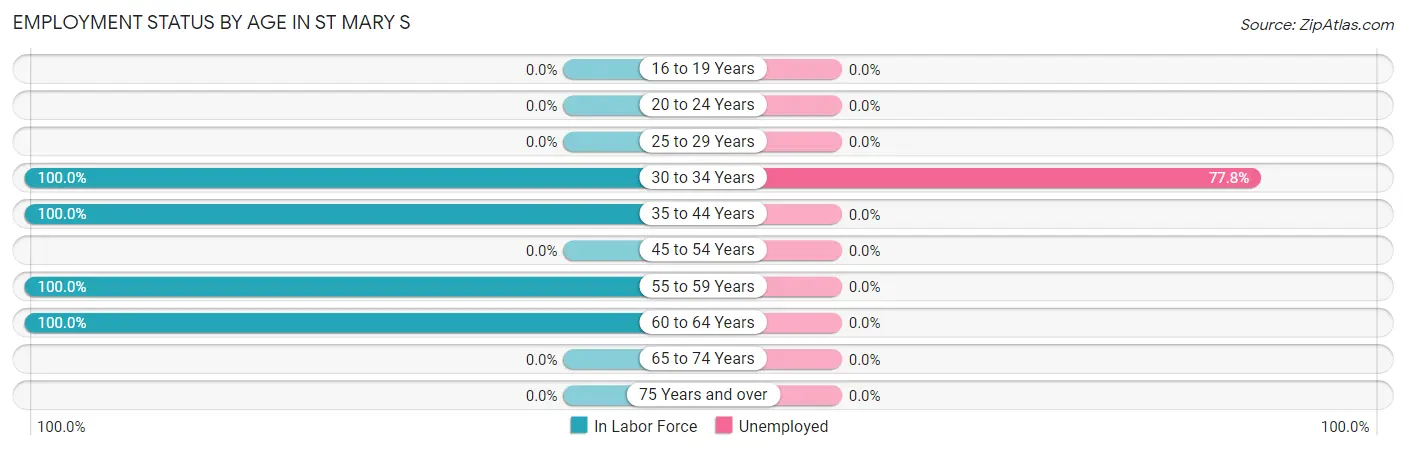
| Age Bracket | In Labor Force | Unemployed |
| 16 to 19 Years | 0 (0.0%) | 0 (0.0%) |
| 20 to 24 Years | 0 (0.0%) | 0 (0.0%) |
| 25 to 29 Years | 0 (0.0%) | 0 (0.0%) |
| 30 to 34 Years | 63 (100.0%) | 49 (77.8%) |
| 35 to 44 Years | 52 (100.0%) | 0 (0.0%) |
| 45 to 54 Years | 0 (0.0%) | 0 (0.0%) |
| 55 to 59 Years | 41 (100.0%) | 0 (0.0%) |
| 60 to 64 Years | 6 (100.0%) | 0 (0.0%) |
| 65 to 74 Years | 0 (0.0%) | 0 (0.0%) |
| 75 Years and over | 0 (0.0%) | 0 (0.0%) |
| Total | 162 (92.6%) | 49 (30.2%) |
Employment Status by Educational Attainment in St Mary s
According to labor force statistics for St Mary s, 100.0% of individuals (162) out of the total population between 25 and 64 years of age (162) are in the labor force, with 30.2% or 49 of them being unemployed. The group with the highest labor force participation rate are those with the educational attainment of high school diploma, with 100.0% or 49 individuals in the labor force. Within the labor force, individuals with high school diploma education have the highest percentage of unemployment, with 100.0% or 49 of them being unemployed.
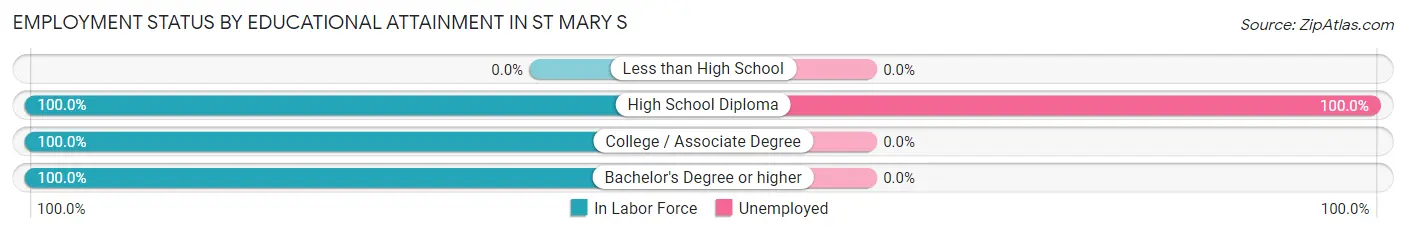
| Educational Attainment | In Labor Force | Unemployed |
| Less than High School | 0 (0.0%) | 0 (0.0%) |
| High School Diploma | 49 (100.0%) | 49 (100.0%) |
| College / Associate Degree | 93 (100.0%) | 0 (0.0%) |
| Bachelor's Degree or higher | 20 (100.0%) | 0 (0.0%) |
| Total | 162 (100.0%) | 49 (30.2%) |
Employment Occupations by Sex in St Mary s
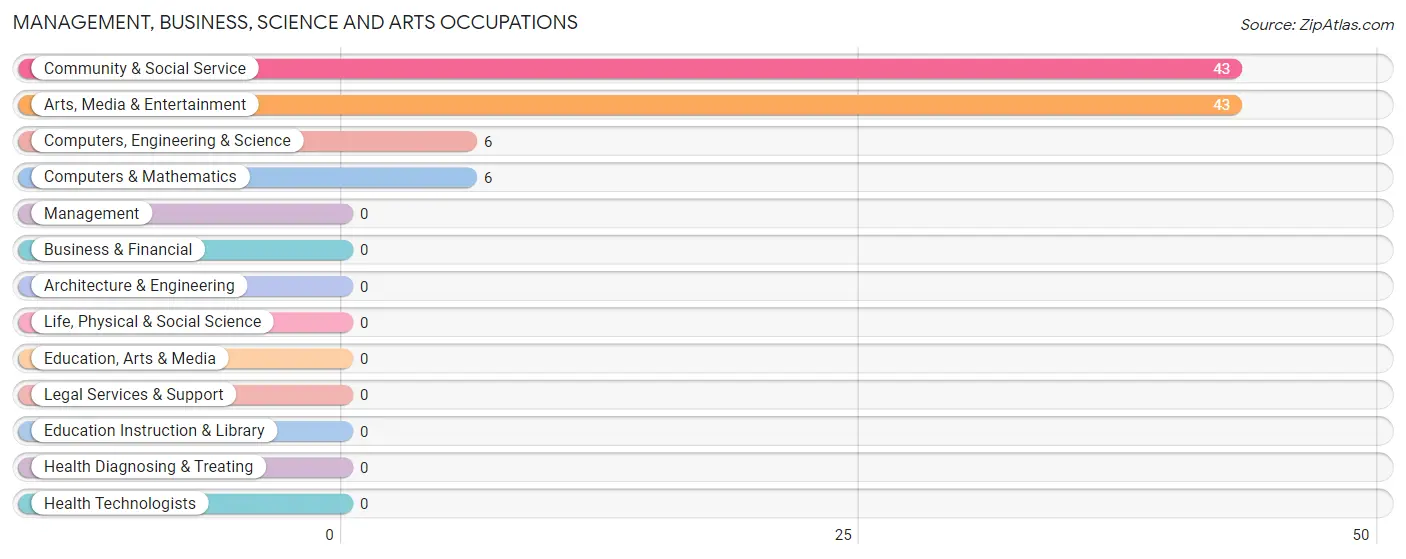
Management, Business, Science and Arts Occupations
The most common Management, Business, Science and Arts occupations in St Mary s are Community & Social Service (43 | 38.1%), Arts, Media & Entertainment (43 | 38.1%), Computers, Engineering & Science (6 | 5.3%), and Computers & Mathematics (6 | 5.3%).
Management, Business, Science and Arts Occupations by Sex
Within the Management, Business, Science and Arts occupations in St Mary s, the most male-oriented occupations are Computers, Engineering & Science (100.0%), Computers & Mathematics (100.0%), and Community & Social Service (67.4%), while the most female-oriented occupations are Community & Social Service (32.6%), and Arts, Media & Entertainment (32.6%).
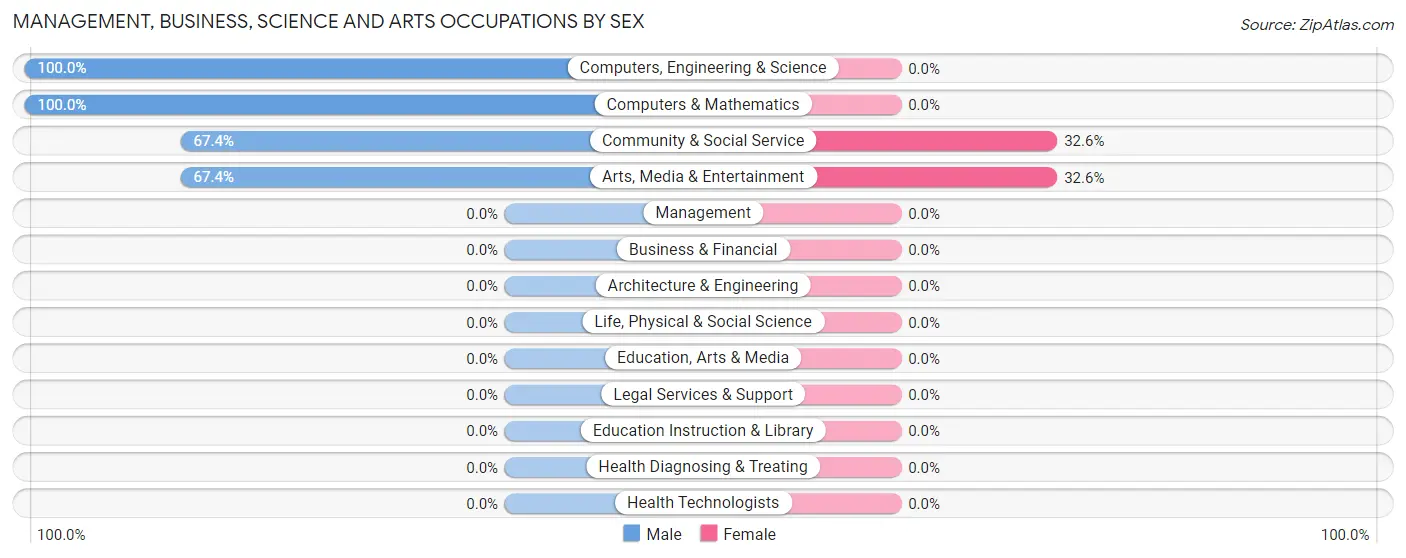
| Occupation | Male | Female |
| Management | 0 (0.0%) | 0 (0.0%) |
| Business & Financial | 0 (0.0%) | 0 (0.0%) |
| Computers, Engineering & Science | 6 (100.0%) | 0 (0.0%) |
| Computers & Mathematics | 6 (100.0%) | 0 (0.0%) |
| Architecture & Engineering | 0 (0.0%) | 0 (0.0%) |
| Life, Physical & Social Science | 0 (0.0%) | 0 (0.0%) |
| Community & Social Service | 29 (67.4%) | 14 (32.6%) |
| Education, Arts & Media | 0 (0.0%) | 0 (0.0%) |
| Legal Services & Support | 0 (0.0%) | 0 (0.0%) |
| Education Instruction & Library | 0 (0.0%) | 0 (0.0%) |
| Arts, Media & Entertainment | 29 (67.4%) | 14 (32.6%) |
| Health Diagnosing & Treating | 0 (0.0%) | 0 (0.0%) |
| Health Technologists | 0 (0.0%) | 0 (0.0%) |
| Total (Category) | 35 (71.4%) | 14 (28.6%) |
| Total (Overall) | 35 (31.0%) | 78 (69.0%) |
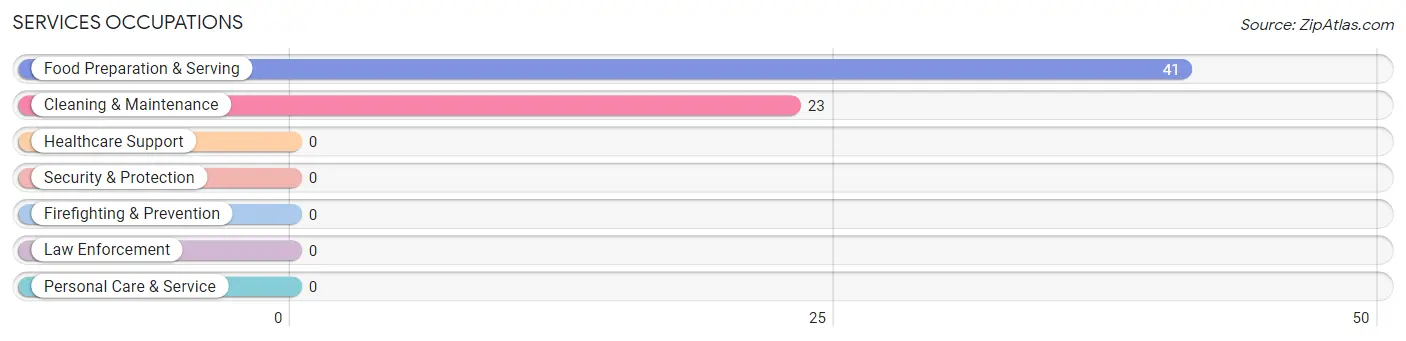
Services Occupations
The most common Services occupations in St Mary s are Food Preparation & Serving (41 | 36.3%), and Cleaning & Maintenance (23 | 20.3%).
Services Occupations by Sex
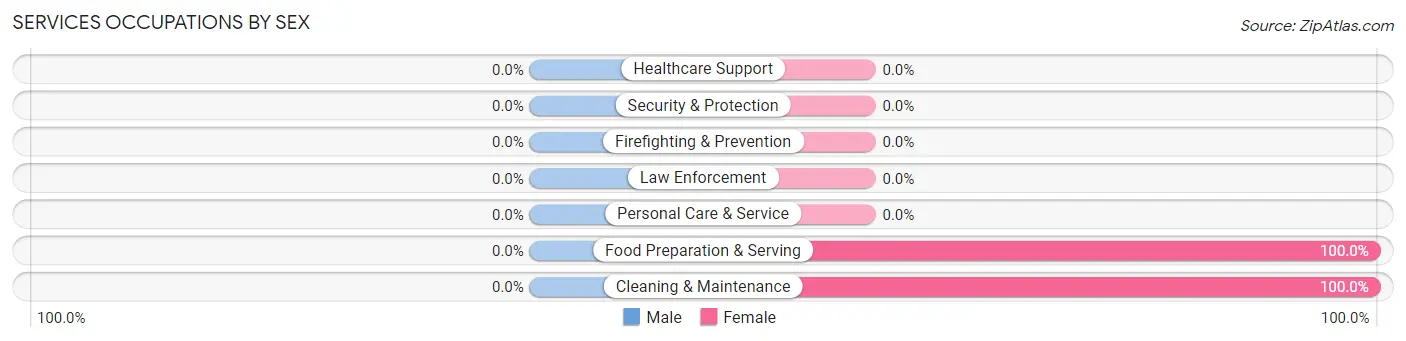
| Occupation | Male | Female |
| Healthcare Support | 0 (0.0%) | 0 (0.0%) |
| Security & Protection | 0 (0.0%) | 0 (0.0%) |
| Firefighting & Prevention | 0 (0.0%) | 0 (0.0%) |
| Law Enforcement | 0 (0.0%) | 0 (0.0%) |
| Food Preparation & Serving | 0 (0.0%) | 41 (100.0%) |
| Cleaning & Maintenance | 0 (0.0%) | 23 (100.0%) |
| Personal Care & Service | 0 (0.0%) | 0 (0.0%) |
| Total (Category) | 0 (0.0%) | 64 (100.0%) |
| Total (Overall) | 35 (31.0%) | 78 (69.0%) |
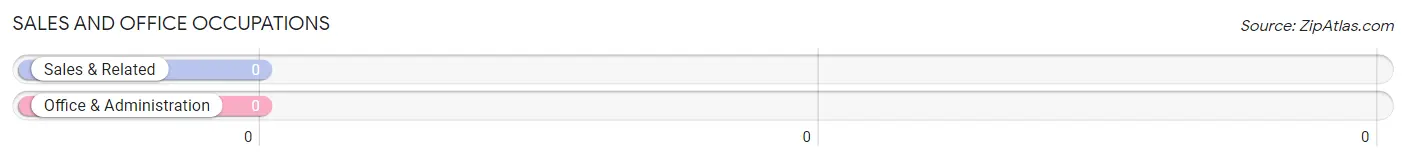
Sales and Office Occupations
Sales and Office Occupations by Sex
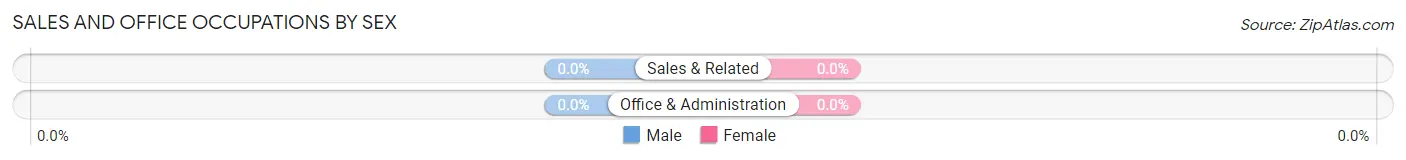
| Occupation | Male | Female |
| Sales & Related | 0 (0.0%) | 0 (0.0%) |
| Office & Administration | 0 (0.0%) | 0 (0.0%) |
| Total (Category) | 0 (0.0%) | 0 (0.0%) |
| Total (Overall) | 35 (31.0%) | 78 (69.0%) |
Natural Resources, Construction and Maintenance Occupations
Natural Resources, Construction and Maintenance Occupations by Sex
| Occupation | Male | Female |
| Farming, Fishing & Forestry | 0 (0.0%) | 0 (0.0%) |
| Construction & Extraction | 0 (0.0%) | 0 (0.0%) |
| Installation, Maintenance & Repair | 0 (0.0%) | 0 (0.0%) |
| Total (Category) | 0 (0.0%) | 0 (0.0%) |
| Total (Overall) | 35 (31.0%) | 78 (69.0%) |
Production, Transportation and Moving Occupations
Production, Transportation and Moving Occupations by Sex
| Occupation | Male | Female |
| Production | 0 (0.0%) | 0 (0.0%) |
| Transportation | 0 (0.0%) | 0 (0.0%) |
| Material Moving | 0 (0.0%) | 0 (0.0%) |
| Total (Category) | 0 (0.0%) | 0 (0.0%) |
| Total (Overall) | 35 (31.0%) | 78 (69.0%) |
Employment Industries by Sex in St Mary s
Employment Industries in St Mary s
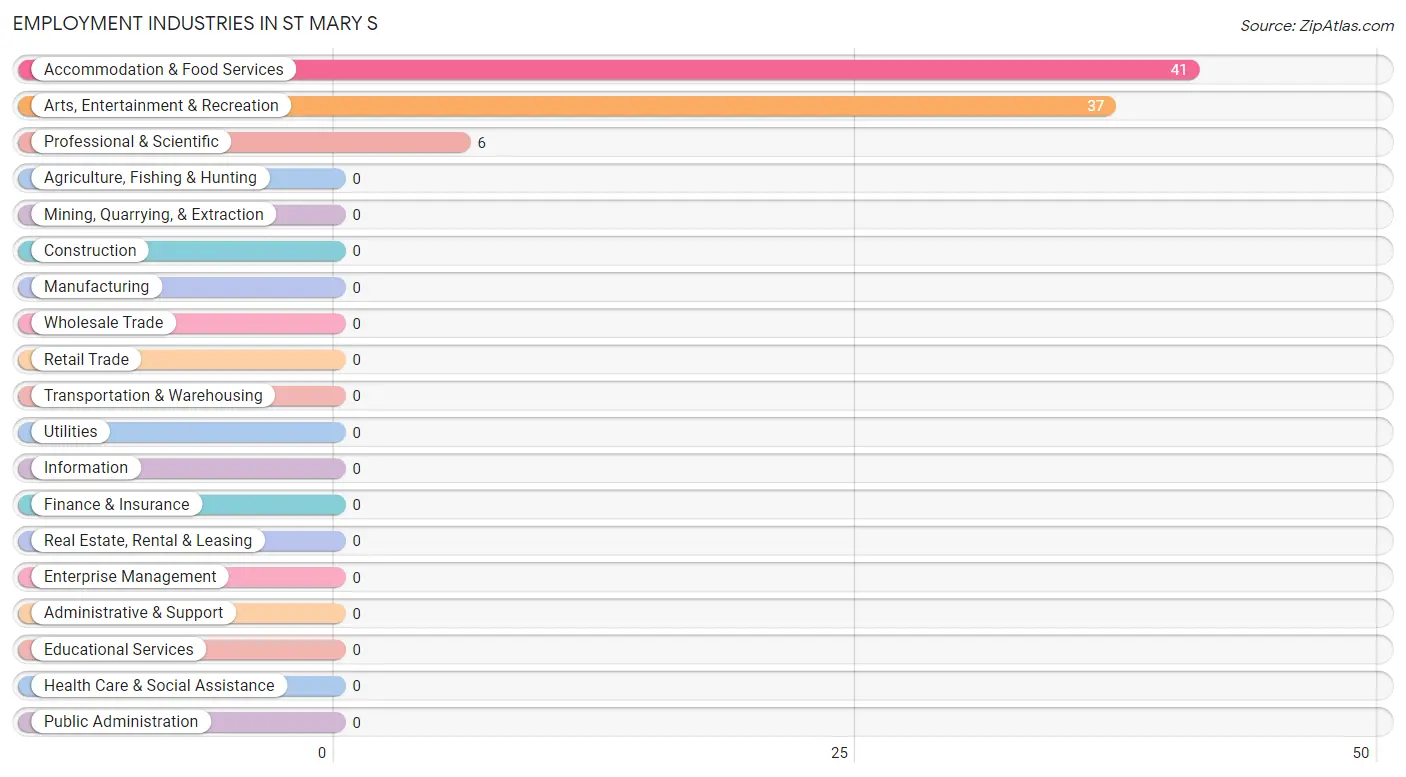
The major employment industries in St Mary s include Accommodation & Food Services (41 | 36.3%), Arts, Entertainment & Recreation (37 | 32.7%), and Professional & Scientific (6 | 5.3%).
Employment Industries by Sex in St Mary s
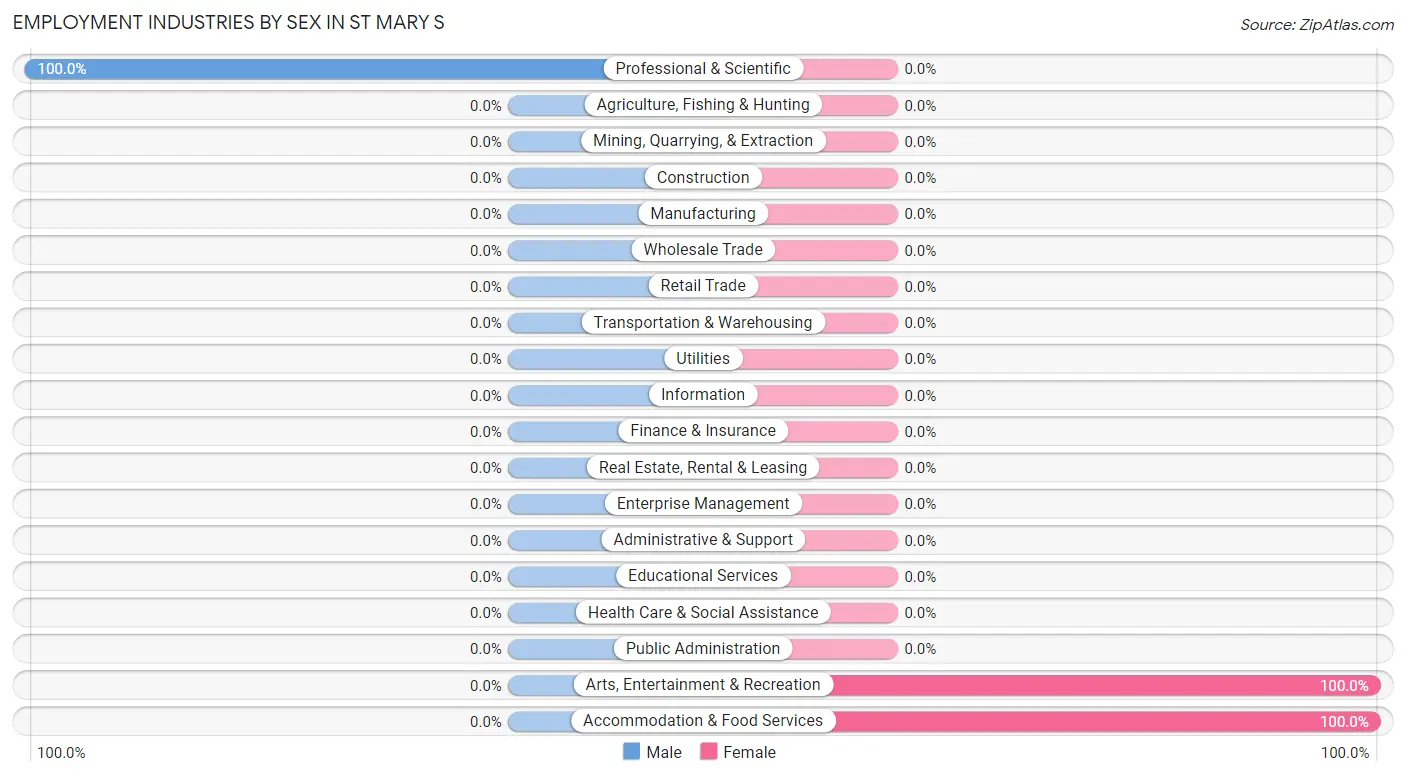
| Industry | Male | Female |
| Agriculture, Fishing & Hunting | 0 (0.0%) | 0 (0.0%) |
| Mining, Quarrying, & Extraction | 0 (0.0%) | 0 (0.0%) |
| Construction | 0 (0.0%) | 0 (0.0%) |
| Manufacturing | 0 (0.0%) | 0 (0.0%) |
| Wholesale Trade | 0 (0.0%) | 0 (0.0%) |
| Retail Trade | 0 (0.0%) | 0 (0.0%) |
| Transportation & Warehousing | 0 (0.0%) | 0 (0.0%) |
| Utilities | 0 (0.0%) | 0 (0.0%) |
| Information | 0 (0.0%) | 0 (0.0%) |
| Finance & Insurance | 0 (0.0%) | 0 (0.0%) |
| Real Estate, Rental & Leasing | 0 (0.0%) | 0 (0.0%) |
| Professional & Scientific | 6 (100.0%) | 0 (0.0%) |
| Enterprise Management | 0 (0.0%) | 0 (0.0%) |
| Administrative & Support | 0 (0.0%) | 0 (0.0%) |
| Educational Services | 0 (0.0%) | 0 (0.0%) |
| Health Care & Social Assistance | 0 (0.0%) | 0 (0.0%) |
| Arts, Entertainment & Recreation | 0 (0.0%) | 37 (100.0%) |
| Accommodation & Food Services | 0 (0.0%) | 41 (100.0%) |
| Public Administration | 0 (0.0%) | 0 (0.0%) |
| Total | 35 (31.0%) | 78 (69.0%) |
Education in St Mary s
School Enrollment in St Mary s
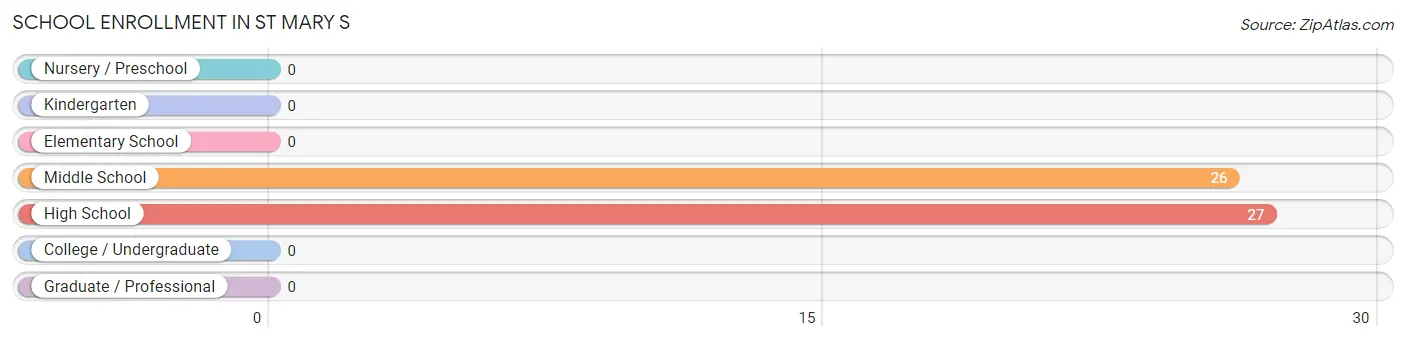
The most common levels of schooling among the 53 students in St Mary s are high school (27 | 50.9%), and middle school (26 | 49.1%).
| School Level | # Students | % Students |
| Nursery / Preschool | 0 | 0.0% |
| Kindergarten | 0 | 0.0% |
| Elementary School | 0 | 0.0% |
| Middle School | 26 | 49.1% |
| High School | 27 | 50.9% |
| College / Undergraduate | 0 | 0.0% |
| Graduate / Professional | 0 | 0.0% |
| Total | 53 | 100.0% |
School Enrollment by Age by Funding Source in St Mary s
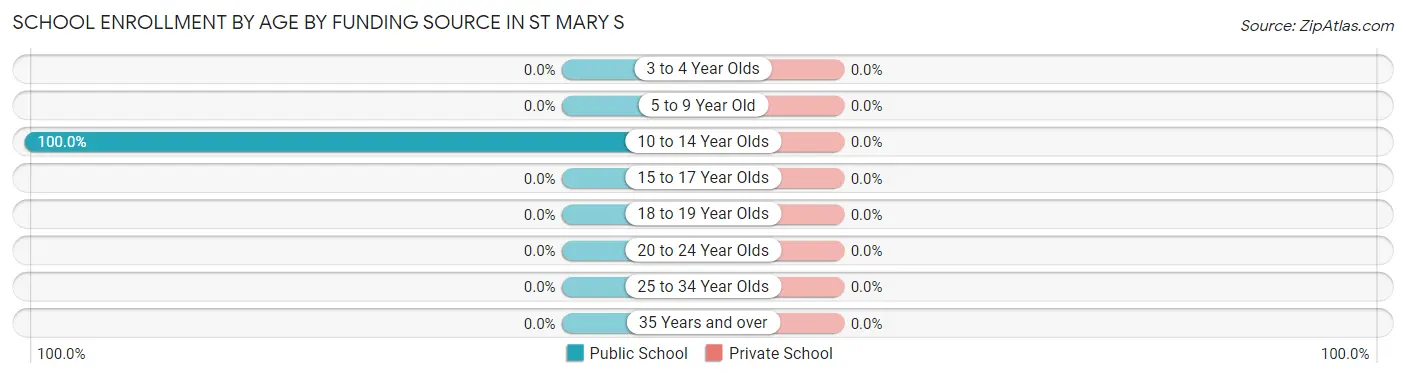
| Age Bracket | Public School | Private School |
| 3 to 4 Year Olds | 0 (0.0%) | 0 (0.0%) |
| 5 to 9 Year Old | 0 (0.0%) | 0 (0.0%) |
| 10 to 14 Year Olds | 53 (100.0%) | 0 (0.0%) |
| 15 to 17 Year Olds | 0 (0.0%) | 0 (0.0%) |
| 18 to 19 Year Olds | 0 (0.0%) | 0 (0.0%) |
| 20 to 24 Year Olds | 0 (0.0%) | 0 (0.0%) |
| 25 to 34 Year Olds | 0 (0.0%) | 0 (0.0%) |
| 35 Years and over | 0 (0.0%) | 0 (0.0%) |
| Total | 53 (100.0%) | 0 (0.0%) |
Educational Attainment by Field of Study in St Mary s
Bio, nature & agricultural (14 | 29.8%), literature & languages (14 | 29.8%), engineering (13 | 27.7%), and multidisciplinary studies (6 | 12.8%) are the most common fields of study among 47 individuals in St Mary s who have obtained a bachelor's degree or higher.
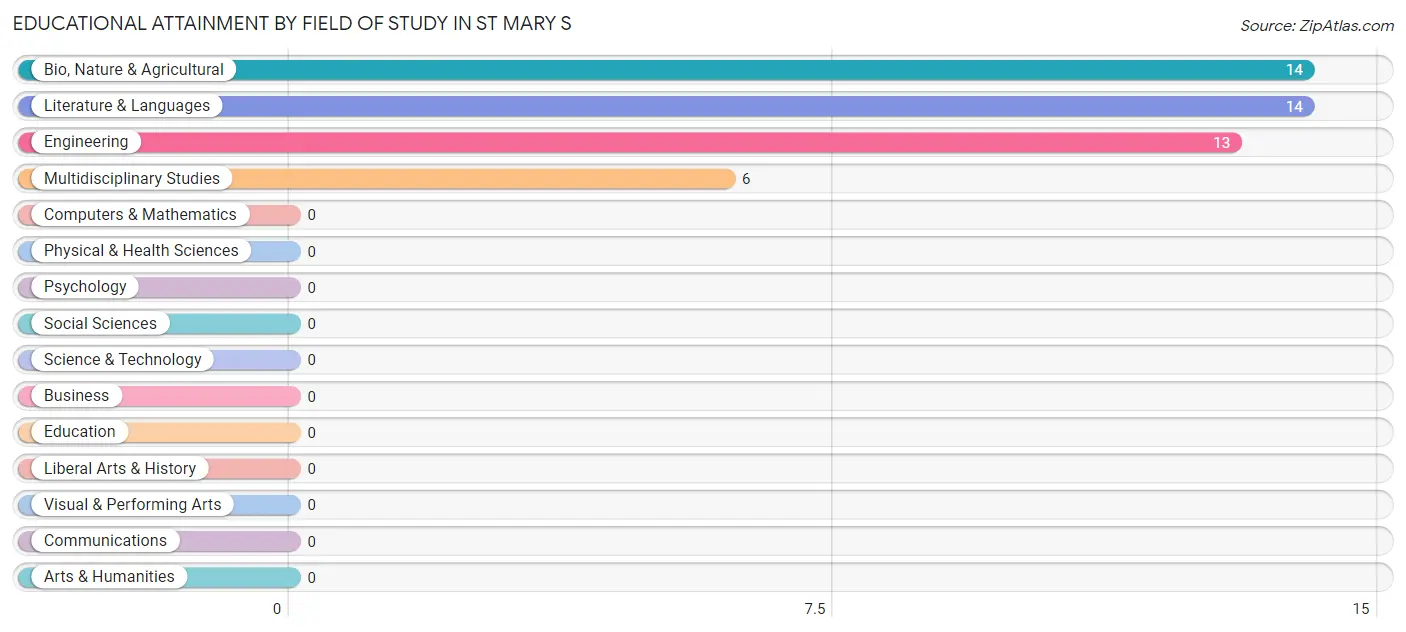
| Field of Study | # Graduates | % Graduates |
| Computers & Mathematics | 0 | 0.0% |
| Bio, Nature & Agricultural | 14 | 29.8% |
| Physical & Health Sciences | 0 | 0.0% |
| Psychology | 0 | 0.0% |
| Social Sciences | 0 | 0.0% |
| Engineering | 13 | 27.7% |
| Multidisciplinary Studies | 6 | 12.8% |
| Science & Technology | 0 | 0.0% |
| Business | 0 | 0.0% |
| Education | 0 | 0.0% |
| Literature & Languages | 14 | 29.8% |
| Liberal Arts & History | 0 | 0.0% |
| Visual & Performing Arts | 0 | 0.0% |
| Communications | 0 | 0.0% |
| Arts & Humanities | 0 | 0.0% |
| Total | 47 | 100.0% |
Transportation & Commute in St Mary s
Vehicle Availability by Sex in St Mary s
The most prevalent vehicle ownership categories in St Mary s are males with 2 vehicles (29, accounting for 82.9%) and females with 2 vehicles (23, making up 37.2%).
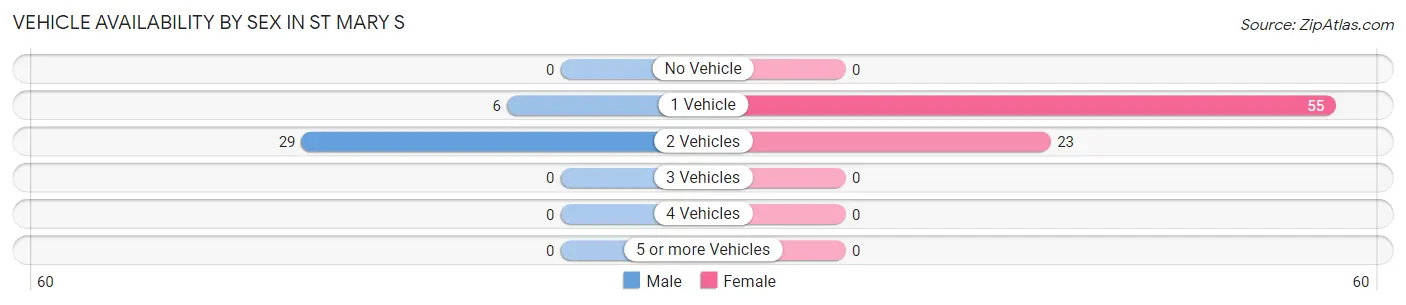
| Vehicles Available | Male | Female |
| No Vehicle | 0 (0.0%) | 0 (0.0%) |
| 1 Vehicle | 6 (17.1%) | 55 (70.5%) |
| 2 Vehicles | 29 (82.9%) | 23 (29.5%) |
| 3 Vehicles | 0 (0.0%) | 0 (0.0%) |
| 4 Vehicles | 0 (0.0%) | 0 (0.0%) |
| 5 or more Vehicles | 0 (0.0%) | 0 (0.0%) |
| Total | 35 (100.0%) | 78 (100.0%) |
Commute Time in St Mary s
The most frequently occuring commute durations in St Mary s are 60 to 89 minutes (41 commuters, 38.3%), 40 to 44 minutes (37 commuters, 34.6%), and 10 to 14 minutes (29 commuters, 27.1%).
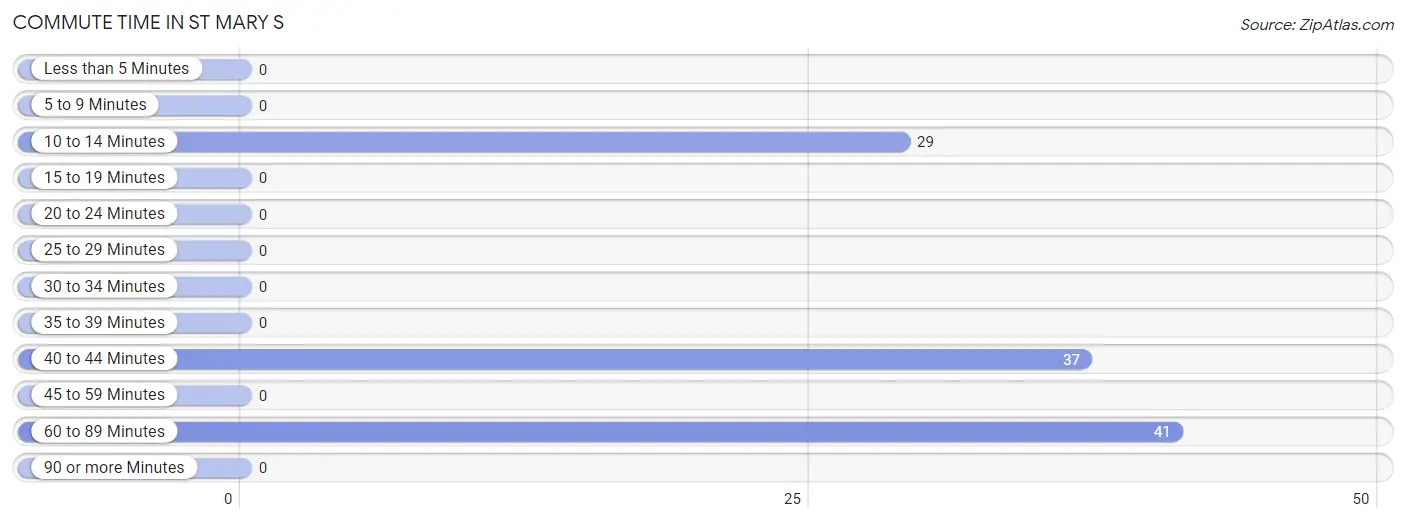
| Commute Time | # Commuters | % Commuters |
| Less than 5 Minutes | 0 | 0.0% |
| 5 to 9 Minutes | 0 | 0.0% |
| 10 to 14 Minutes | 29 | 27.1% |
| 15 to 19 Minutes | 0 | 0.0% |
| 20 to 24 Minutes | 0 | 0.0% |
| 25 to 29 Minutes | 0 | 0.0% |
| 30 to 34 Minutes | 0 | 0.0% |
| 35 to 39 Minutes | 0 | 0.0% |
| 40 to 44 Minutes | 37 | 34.6% |
| 45 to 59 Minutes | 0 | 0.0% |
| 60 to 89 Minutes | 41 | 38.3% |
| 90 or more Minutes | 0 | 0.0% |
Commute Time by Sex in St Mary s
The most common commute times in St Mary s are 10 to 14 minutes (29 commuters, 100.0%) for males and 60 to 89 minutes (41 commuters, 52.6%) for females.
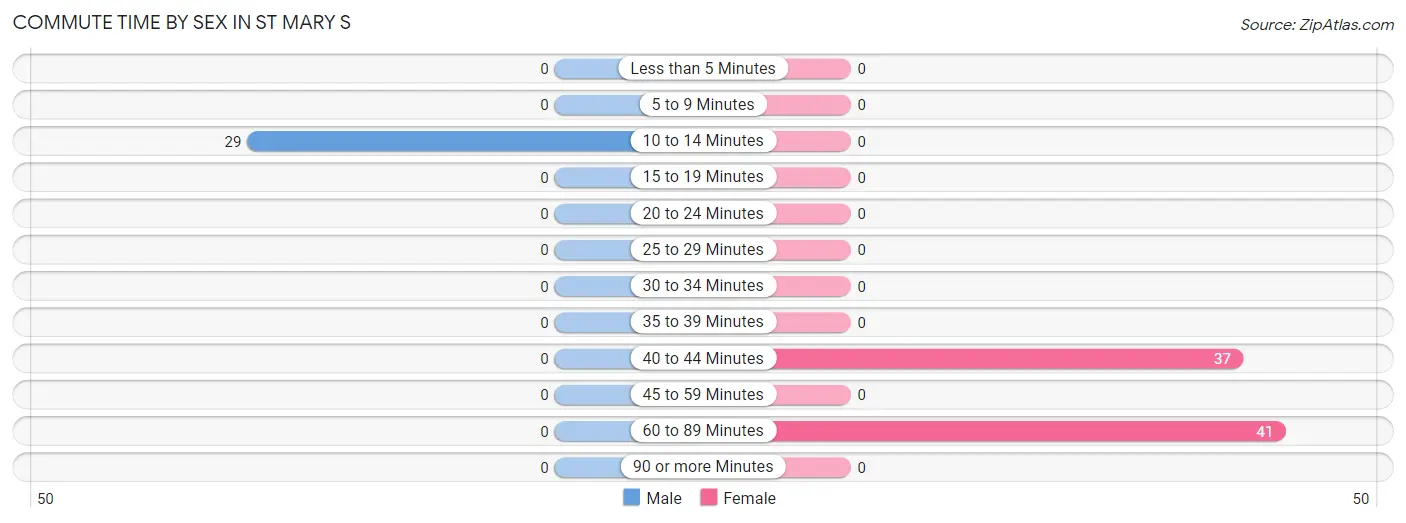
| Commute Time | Male | Female |
| Less than 5 Minutes | 0 (0.0%) | 0 (0.0%) |
| 5 to 9 Minutes | 0 (0.0%) | 0 (0.0%) |
| 10 to 14 Minutes | 29 (100.0%) | 0 (0.0%) |
| 15 to 19 Minutes | 0 (0.0%) | 0 (0.0%) |
| 20 to 24 Minutes | 0 (0.0%) | 0 (0.0%) |
| 25 to 29 Minutes | 0 (0.0%) | 0 (0.0%) |
| 30 to 34 Minutes | 0 (0.0%) | 0 (0.0%) |
| 35 to 39 Minutes | 0 (0.0%) | 0 (0.0%) |
| 40 to 44 Minutes | 0 (0.0%) | 37 (47.4%) |
| 45 to 59 Minutes | 0 (0.0%) | 0 (0.0%) |
| 60 to 89 Minutes | 0 (0.0%) | 41 (52.6%) |
| 90 or more Minutes | 0 (0.0%) | 0 (0.0%) |
Time of Departure to Work by Sex in St Mary s
The most frequent times of departure to work in St Mary s are 12:00 PM to 3:59 PM (29, 100.0%) for males and 6:00 AM to 6:29 AM (41, 52.6%) for females.
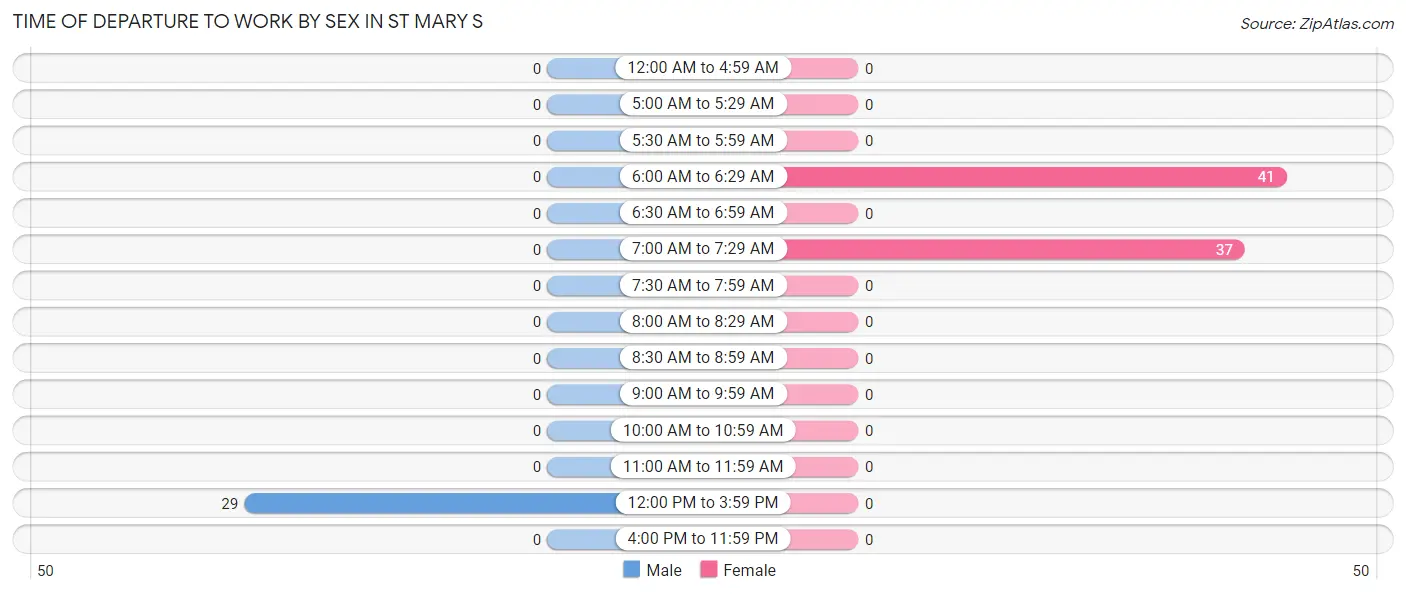
| Time of Departure | Male | Female |
| 12:00 AM to 4:59 AM | 0 (0.0%) | 0 (0.0%) |
| 5:00 AM to 5:29 AM | 0 (0.0%) | 0 (0.0%) |
| 5:30 AM to 5:59 AM | 0 (0.0%) | 0 (0.0%) |
| 6:00 AM to 6:29 AM | 0 (0.0%) | 41 (52.6%) |
| 6:30 AM to 6:59 AM | 0 (0.0%) | 0 (0.0%) |
| 7:00 AM to 7:29 AM | 0 (0.0%) | 37 (47.4%) |
| 7:30 AM to 7:59 AM | 0 (0.0%) | 0 (0.0%) |
| 8:00 AM to 8:29 AM | 0 (0.0%) | 0 (0.0%) |
| 8:30 AM to 8:59 AM | 0 (0.0%) | 0 (0.0%) |
| 9:00 AM to 9:59 AM | 0 (0.0%) | 0 (0.0%) |
| 10:00 AM to 10:59 AM | 0 (0.0%) | 0 (0.0%) |
| 11:00 AM to 11:59 AM | 0 (0.0%) | 0 (0.0%) |
| 12:00 PM to 3:59 PM | 29 (100.0%) | 0 (0.0%) |
| 4:00 PM to 11:59 PM | 0 (0.0%) | 0 (0.0%) |
| Total | 29 (100.0%) | 78 (100.0%) |
Housing Occupancy in St Mary s
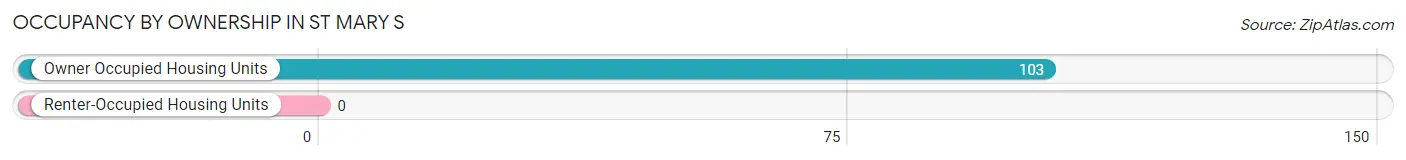
Occupancy by Ownership in St Mary s
Of the total 103 dwellings in St Mary s, owner-occupied units account for 103 (100.0%), while renter-occupied units make up 0 (0.0%).
| Occupancy | # Housing Units | % Housing Units |
| Owner Occupied Housing Units | 103 | 100.0% |
| Renter-Occupied Housing Units | 0 | 0.0% |
| Total Occupied Housing Units | 103 | 100.0% |
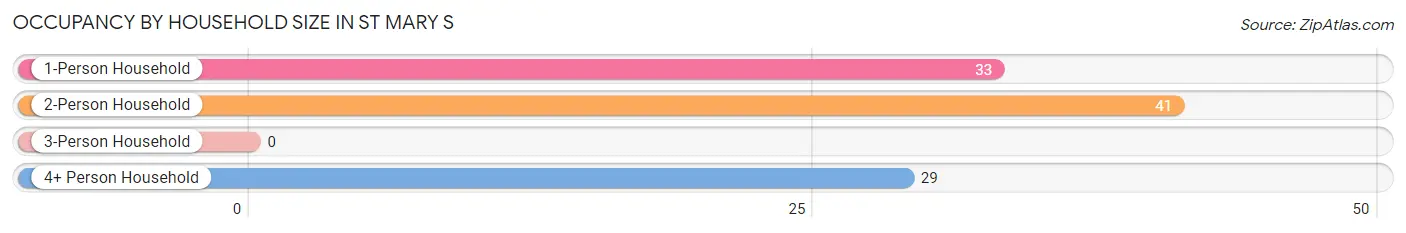
Occupancy by Household Size in St Mary s
| Household Size | # Housing Units | % Housing Units |
| 1-Person Household | 33 | 32.0% |
| 2-Person Household | 41 | 39.8% |
| 3-Person Household | 0 | 0.0% |
| 4+ Person Household | 29 | 28.2% |
| Total Housing Units | 103 | 100.0% |
Occupancy by Ownership by Household Size in St Mary s
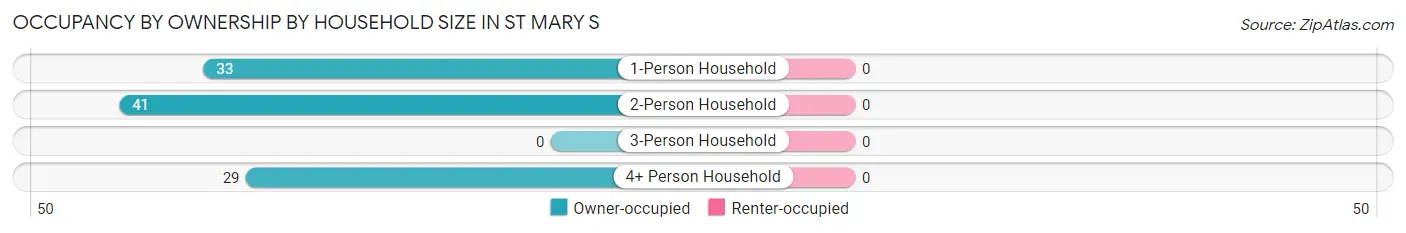
| Household Size | Owner-occupied | Renter-occupied |
| 1-Person Household | 33 (100.0%) | 0 (0.0%) |
| 2-Person Household | 41 (100.0%) | 0 (0.0%) |
| 3-Person Household | 0 (0.0%) | 0 (0.0%) |
| 4+ Person Household | 29 (100.0%) | 0 (0.0%) |
| Total Housing Units | 103 (100.0%) | 0 (0.0%) |
Occupancy by Educational Attainment in St Mary s
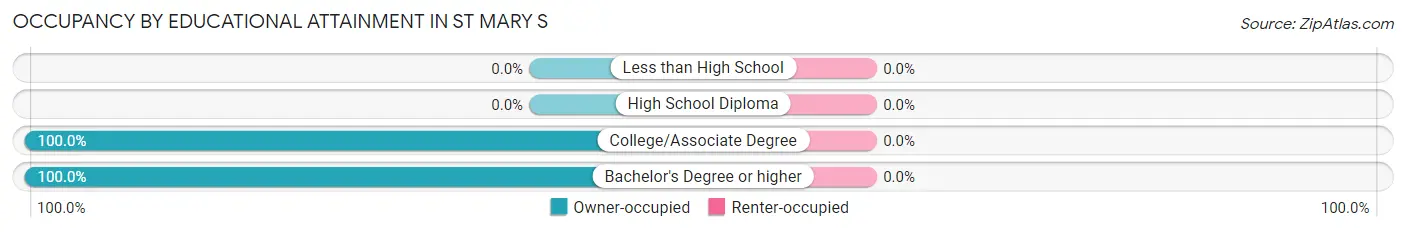
| Household Size | Owner-occupied | Renter-occupied |
| Less than High School | 0 (0.0%) | 0 (0.0%) |
| High School Diploma | 0 (0.0%) | 0 (0.0%) |
| College/Associate Degree | 70 (100.0%) | 0 (0.0%) |
| Bachelor's Degree or higher | 33 (100.0%) | 0 (0.0%) |
Occupancy by Age of Householder in St Mary s
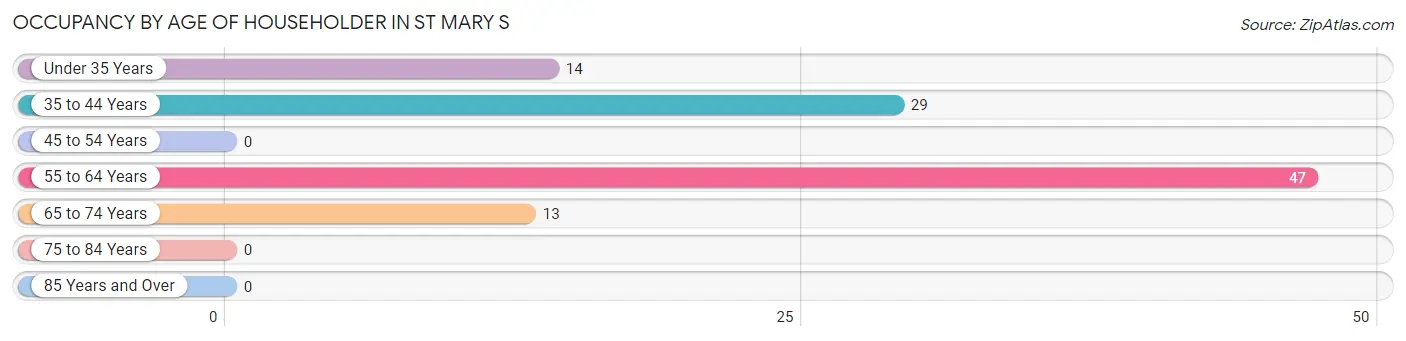
| Age Bracket | # Households | % Households |
| Under 35 Years | 14 | 13.6% |
| 35 to 44 Years | 29 | 28.2% |
| 45 to 54 Years | 0 | 0.0% |
| 55 to 64 Years | 47 | 45.6% |
| 65 to 74 Years | 13 | 12.6% |
| 75 to 84 Years | 0 | 0.0% |
| 85 Years and Over | 0 | 0.0% |
| Total | 103 | 100.0% |
Housing Finances in St Mary s
Median Income by Occupancy in St Mary s
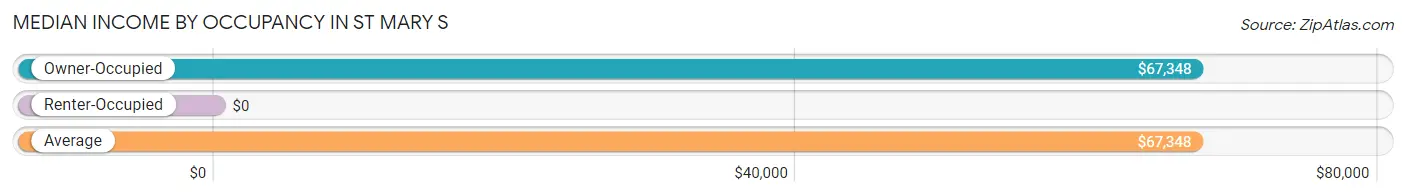
| Occupancy Type | # Households | Median Income |
| Owner-Occupied | 103 (100.0%) | $67,348 |
| Renter-Occupied | 0 (0.0%) | $0 |
| Average | 103 (100.0%) | $67,348 |
Occupancy by Householder Income Bracket in St Mary s
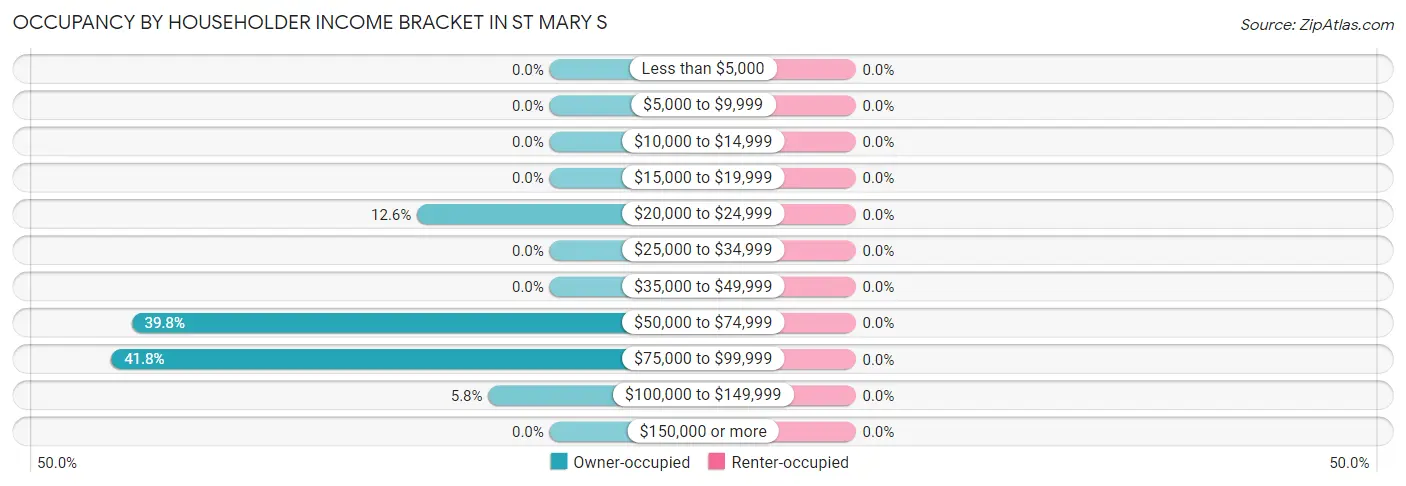
| Income Bracket | Owner-occupied | Renter-occupied |
| Less than $5,000 | 0 (0.0%) | 0 (0.0%) |
| $5,000 to $9,999 | 0 (0.0%) | 0 (0.0%) |
| $10,000 to $14,999 | 0 (0.0%) | 0 (0.0%) |
| $15,000 to $19,999 | 0 (0.0%) | 0 (0.0%) |
| $20,000 to $24,999 | 13 (12.6%) | 0 (0.0%) |
| $25,000 to $34,999 | 0 (0.0%) | 0 (0.0%) |
| $35,000 to $49,999 | 0 (0.0%) | 0 (0.0%) |
| $50,000 to $74,999 | 41 (39.8%) | 0 (0.0%) |
| $75,000 to $99,999 | 43 (41.7%) | 0 (0.0%) |
| $100,000 to $149,999 | 6 (5.8%) | 0 (0.0%) |
| $150,000 or more | 0 (0.0%) | 0 (0.0%) |
| Total | 103 (100.0%) | 0 (0.0%) |
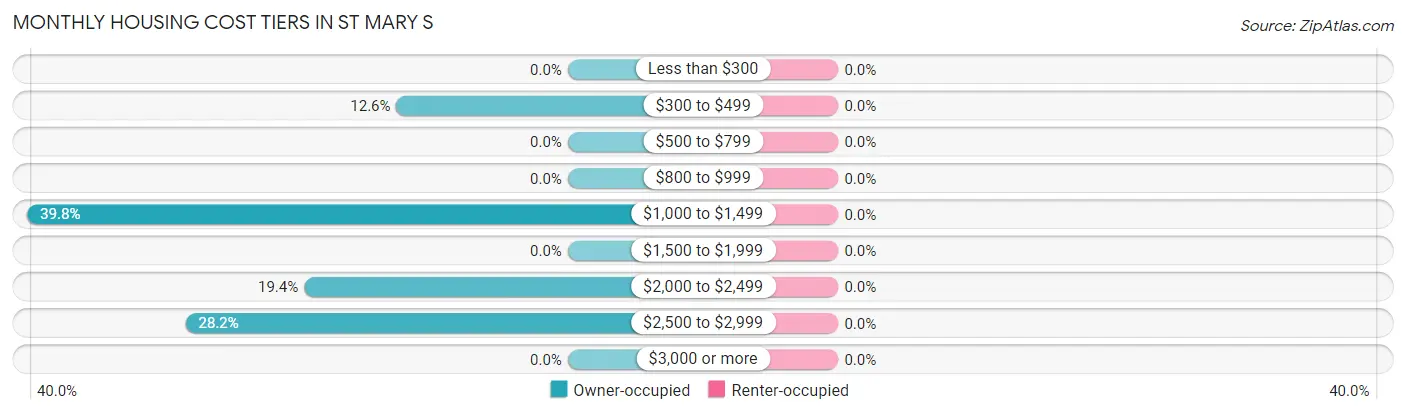
Monthly Housing Cost Tiers in St Mary s
| Monthly Cost | Owner-occupied | Renter-occupied |
| Less than $300 | 0 (0.0%) | 0 (0.0%) |
| $300 to $499 | 13 (12.6%) | 0 (0.0%) |
| $500 to $799 | 0 (0.0%) | 0 (0.0%) |
| $800 to $999 | 0 (0.0%) | 0 (0.0%) |
| $1,000 to $1,499 | 41 (39.8%) | 0 (0.0%) |
| $1,500 to $1,999 | 0 (0.0%) | 0 (0.0%) |
| $2,000 to $2,499 | 20 (19.4%) | 0 (0.0%) |
| $2,500 to $2,999 | 29 (28.2%) | 0 (0.0%) |
| $3,000 or more | 0 (0.0%) | 0 (0.0%) |
| Total | 103 (100.0%) | 0 (0.0%) |
Physical Housing Characteristics in St Mary s
Housing Structures in St Mary s
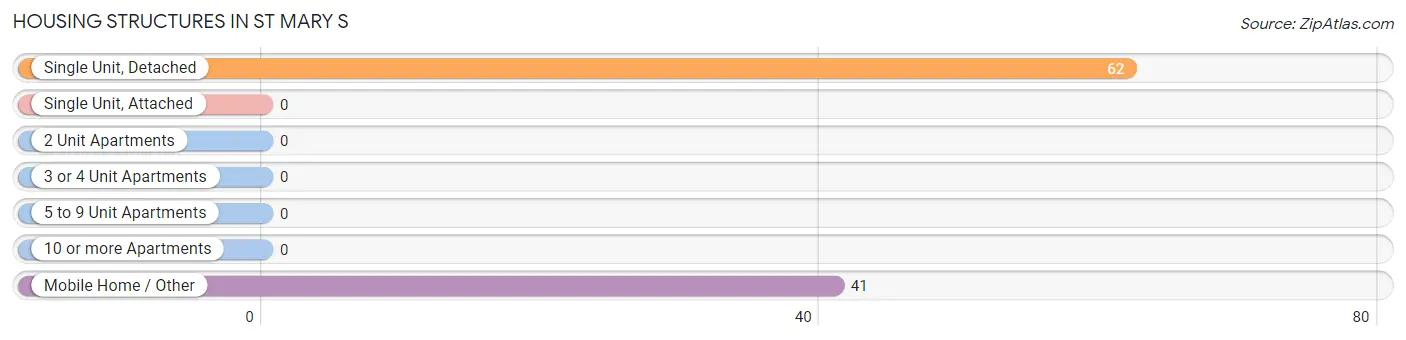
| Structure Type | # Housing Units | % Housing Units |
| Single Unit, Detached | 62 | 60.2% |
| Single Unit, Attached | 0 | 0.0% |
| 2 Unit Apartments | 0 | 0.0% |
| 3 or 4 Unit Apartments | 0 | 0.0% |
| 5 to 9 Unit Apartments | 0 | 0.0% |
| 10 or more Apartments | 0 | 0.0% |
| Mobile Home / Other | 41 | 39.8% |
| Total | 103 | 100.0% |
Housing Structures by Occupancy in St Mary s
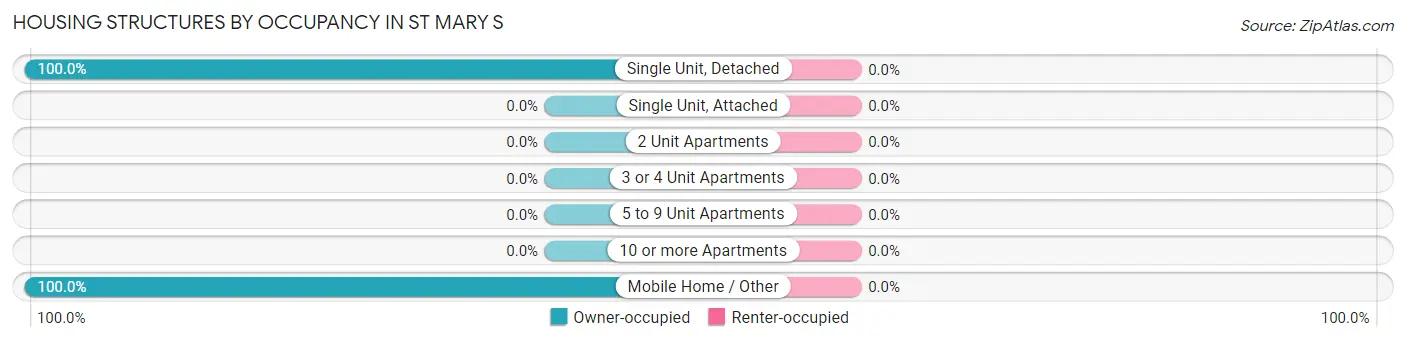
| Structure Type | Owner-occupied | Renter-occupied |
| Single Unit, Detached | 62 (100.0%) | 0 (0.0%) |
| Single Unit, Attached | 0 (0.0%) | 0 (0.0%) |
| 2 Unit Apartments | 0 (0.0%) | 0 (0.0%) |
| 3 or 4 Unit Apartments | 0 (0.0%) | 0 (0.0%) |
| 5 to 9 Unit Apartments | 0 (0.0%) | 0 (0.0%) |
| 10 or more Apartments | 0 (0.0%) | 0 (0.0%) |
| Mobile Home / Other | 41 (100.0%) | 0 (0.0%) |
| Total | 103 (100.0%) | 0 (0.0%) |
Housing Structures by Number of Rooms in St Mary s
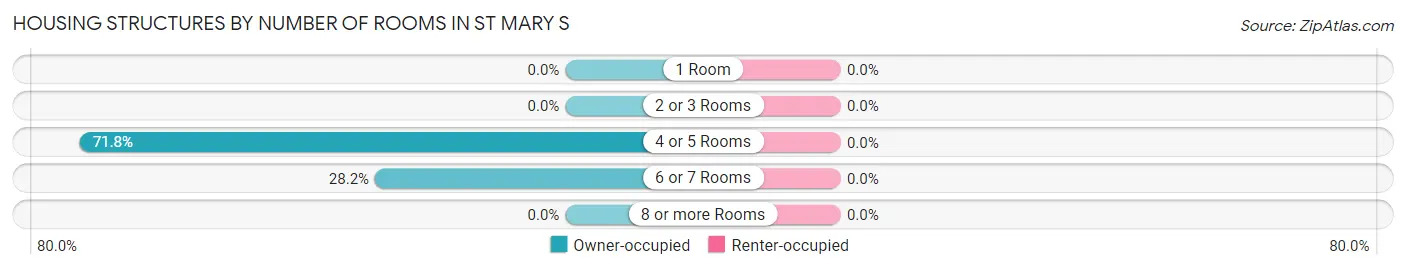
| Number of Rooms | Owner-occupied | Renter-occupied |
| 1 Room | 0 (0.0%) | 0 (0.0%) |
| 2 or 3 Rooms | 0 (0.0%) | 0 (0.0%) |
| 4 or 5 Rooms | 74 (71.8%) | 0 (0.0%) |
| 6 or 7 Rooms | 29 (28.2%) | 0 (0.0%) |
| 8 or more Rooms | 0 (0.0%) | 0 (0.0%) |
| Total | 103 (100.0%) | 0 (0.0%) |
Housing Structure by Heating Type in St Mary s
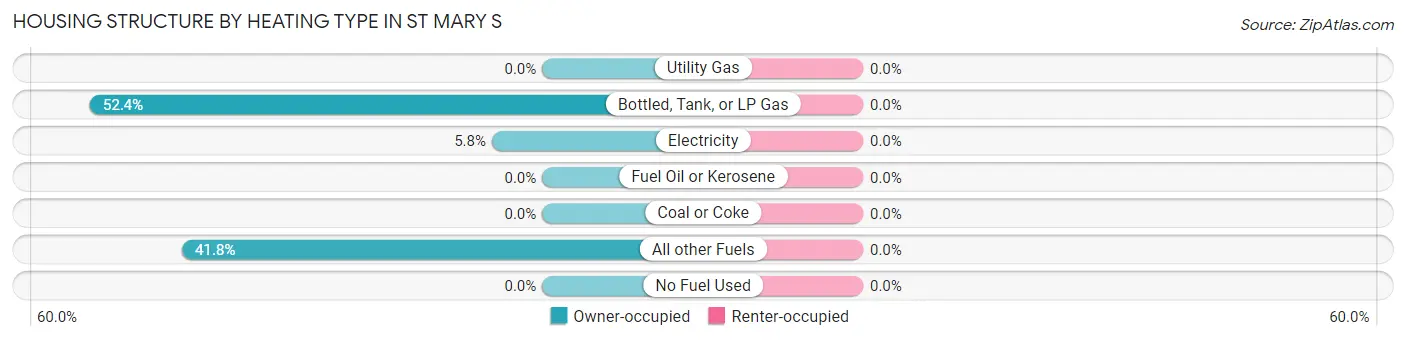
| Heating Type | Owner-occupied | Renter-occupied |
| Utility Gas | 0 (0.0%) | 0 (0.0%) |
| Bottled, Tank, or LP Gas | 54 (52.4%) | 0 (0.0%) |
| Electricity | 6 (5.8%) | 0 (0.0%) |
| Fuel Oil or Kerosene | 0 (0.0%) | 0 (0.0%) |
| Coal or Coke | 0 (0.0%) | 0 (0.0%) |
| All other Fuels | 43 (41.7%) | 0 (0.0%) |
| No Fuel Used | 0 (0.0%) | 0 (0.0%) |
| Total | 103 (100.0%) | 0 (0.0%) |
Household Vehicle Usage in St Mary s
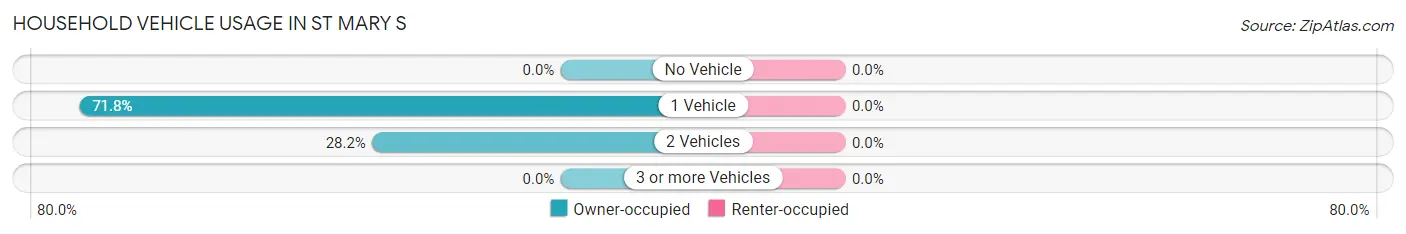
| Vehicles per Household | Owner-occupied | Renter-occupied |
| No Vehicle | 0 (0.0%) | 0 (0.0%) |
| 1 Vehicle | 74 (71.8%) | 0 (0.0%) |
| 2 Vehicles | 29 (28.2%) | 0 (0.0%) |
| 3 or more Vehicles | 0 (0.0%) | 0 (0.0%) |
| Total | 103 (100.0%) | 0 (0.0%) |
Real Estate & Mortgages in St Mary s
Real Estate and Mortgage Overview in St Mary s
| Characteristic | Without Mortgage | With Mortgage |
| Housing Units | 54 | 49 |
| Median Property Value | - | - |
| Median Household Income | - | - |
| Monthly Housing Costs | - | - |
| Real Estate Taxes | - | - |
Property Value by Mortgage Status in St Mary s
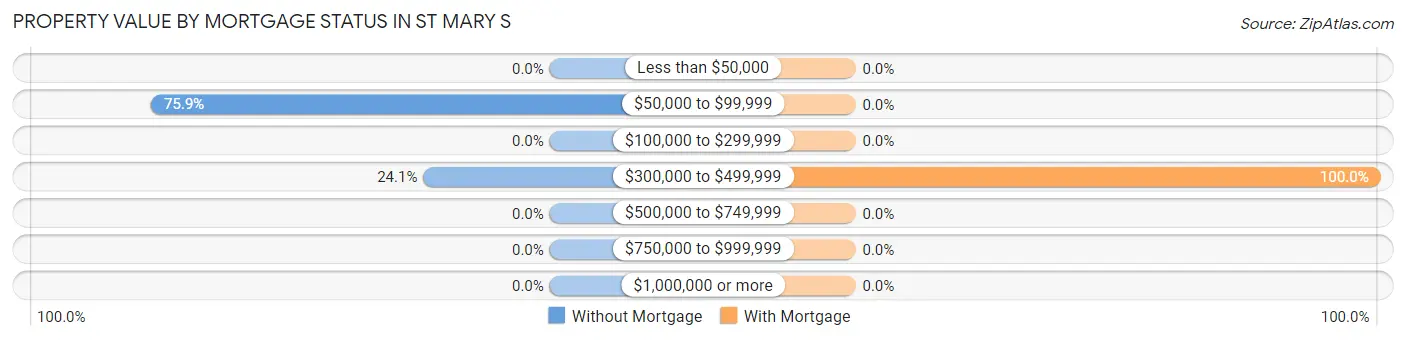
| Property Value | Without Mortgage | With Mortgage |
| Less than $50,000 | 0 (0.0%) | 0 (0.0%) |
| $50,000 to $99,999 | 41 (75.9%) | 0 (0.0%) |
| $100,000 to $299,999 | 0 (0.0%) | 0 (0.0%) |
| $300,000 to $499,999 | 13 (24.1%) | 49 (100.0%) |
| $500,000 to $749,999 | 0 (0.0%) | 0 (0.0%) |
| $750,000 to $999,999 | 0 (0.0%) | 0 (0.0%) |
| $1,000,000 or more | 0 (0.0%) | 0 (0.0%) |
| Total | 54 (100.0%) | 49 (100.0%) |
Household Income by Mortgage Status in St Mary s
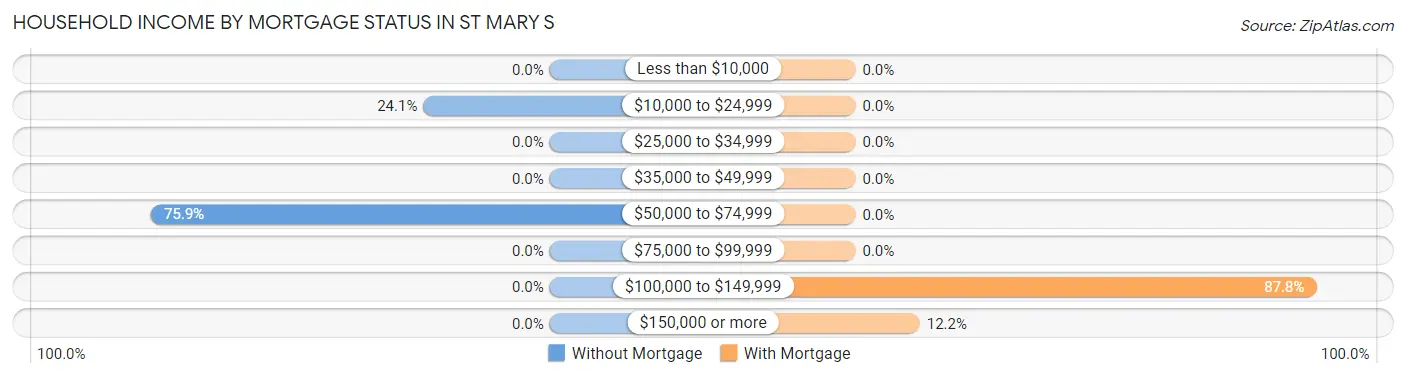
| Household Income | Without Mortgage | With Mortgage |
| Less than $10,000 | 0 (0.0%) | 0 (0.0%) |
| $10,000 to $24,999 | 13 (24.1%) | 0 (0.0%) |
| $25,000 to $34,999 | 0 (0.0%) | 0 (0.0%) |
| $35,000 to $49,999 | 0 (0.0%) | 0 (0.0%) |
| $50,000 to $74,999 | 41 (75.9%) | 0 (0.0%) |
| $75,000 to $99,999 | 0 (0.0%) | 0 (0.0%) |
| $100,000 to $149,999 | 0 (0.0%) | 43 (87.8%) |
| $150,000 or more | 0 (0.0%) | 6 (12.2%) |
| Total | 54 (100.0%) | 49 (100.0%) |
Property Value to Household Income Ratio in St Mary s
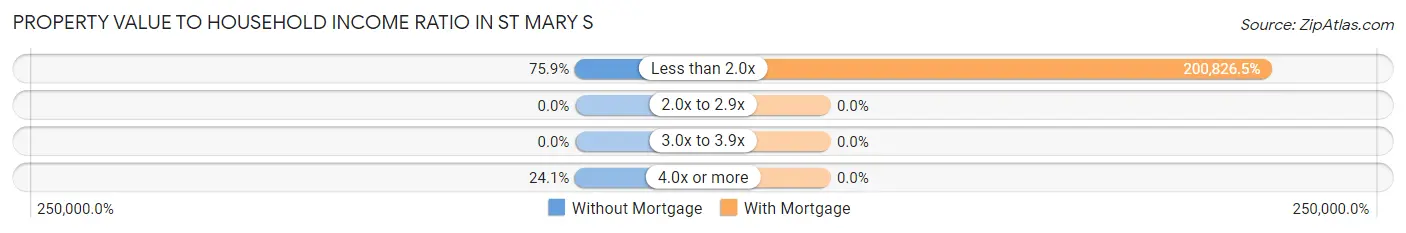
| Value-to-Income Ratio | Without Mortgage | With Mortgage |
| Less than 2.0x | 41 (75.9%) | 98,405 (200,826.5%) |
| 2.0x to 2.9x | 0 (0.0%) | 0 (0.0%) |
| 3.0x to 3.9x | 0 (0.0%) | 0 (0.0%) |
| 4.0x or more | 13 (24.1%) | 0 (0.0%) |
| Total | 54 (100.0%) | 49 (100.0%) |
Real Estate Taxes by Mortgage Status in St Mary s
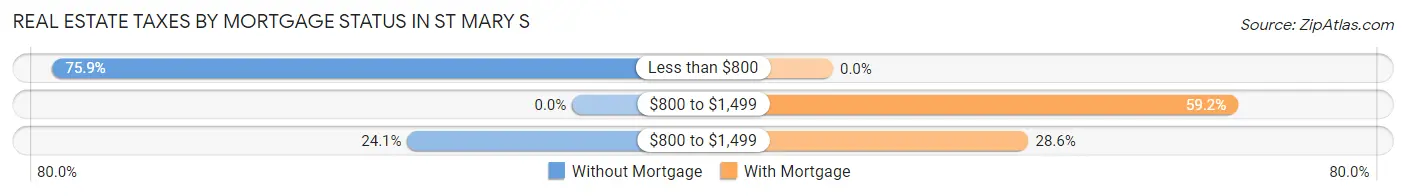
| Property Taxes | Without Mortgage | With Mortgage |
| Less than $800 | 41 (75.9%) | 0 (0.0%) |
| $800 to $1,499 | 0 (0.0%) | 29 (59.2%) |
| $800 to $1,499 | 13 (24.1%) | 14 (28.6%) |
| Total | 54 (100.0%) | 49 (100.0%) |
Health & Disability in St Mary s
Health Insurance Coverage by Age in St Mary s
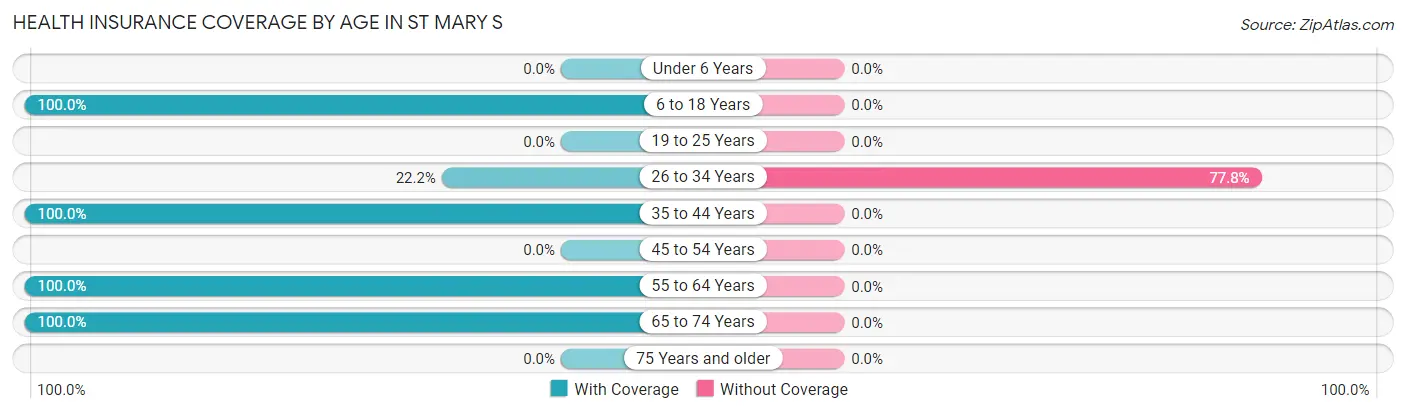
| Age Bracket | With Coverage | Without Coverage |
| Under 6 Years | 0 (0.0%) | 0 (0.0%) |
| 6 to 18 Years | 53 (100.0%) | 0 (0.0%) |
| 19 to 25 Years | 0 (0.0%) | 0 (0.0%) |
| 26 to 34 Years | 14 (22.2%) | 49 (77.8%) |
| 35 to 44 Years | 52 (100.0%) | 0 (0.0%) |
| 45 to 54 Years | 0 (0.0%) | 0 (0.0%) |
| 55 to 64 Years | 47 (100.0%) | 0 (0.0%) |
| 65 to 74 Years | 13 (100.0%) | 0 (0.0%) |
| 75 Years and older | 0 (0.0%) | 0 (0.0%) |
| Total | 179 (78.5%) | 49 (21.5%) |
Health Insurance Coverage by Citizenship Status in St Mary s
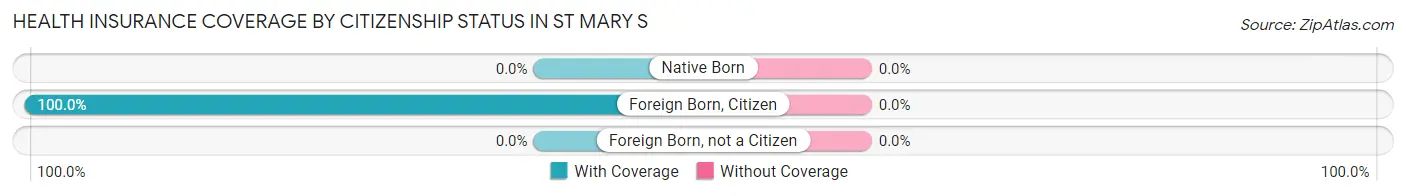
| Citizenship Status | With Coverage | Without Coverage |
| Native Born | 0 (0.0%) | 0 (0.0%) |
| Foreign Born, Citizen | 53 (100.0%) | 0 (0.0%) |
| Foreign Born, not a Citizen | 0 (0.0%) | 0 (0.0%) |
Health Insurance Coverage by Household Income in St Mary s
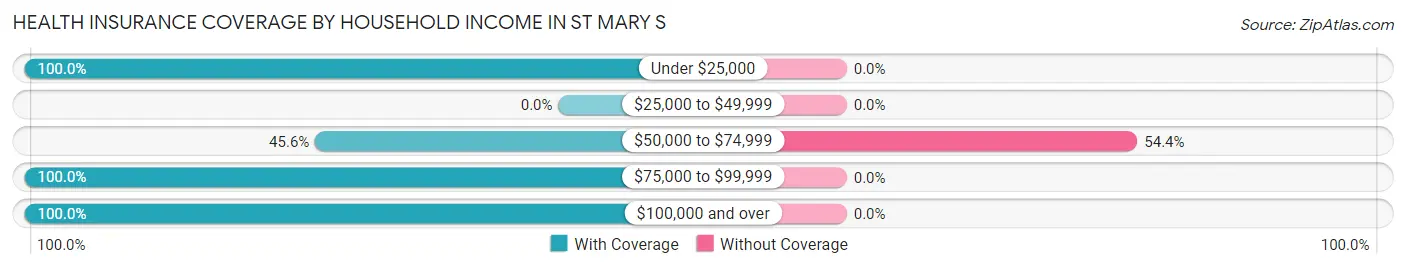
| Household Income | With Coverage | Without Coverage |
| Under $25,000 | 13 (100.0%) | 0 (0.0%) |
| $25,000 to $49,999 | 0 (0.0%) | 0 (0.0%) |
| $50,000 to $74,999 | 41 (45.6%) | 49 (54.4%) |
| $75,000 to $99,999 | 119 (100.0%) | 0 (0.0%) |
| $100,000 and over | 6 (100.0%) | 0 (0.0%) |
Public vs Private Health Insurance Coverage by Age in St Mary s
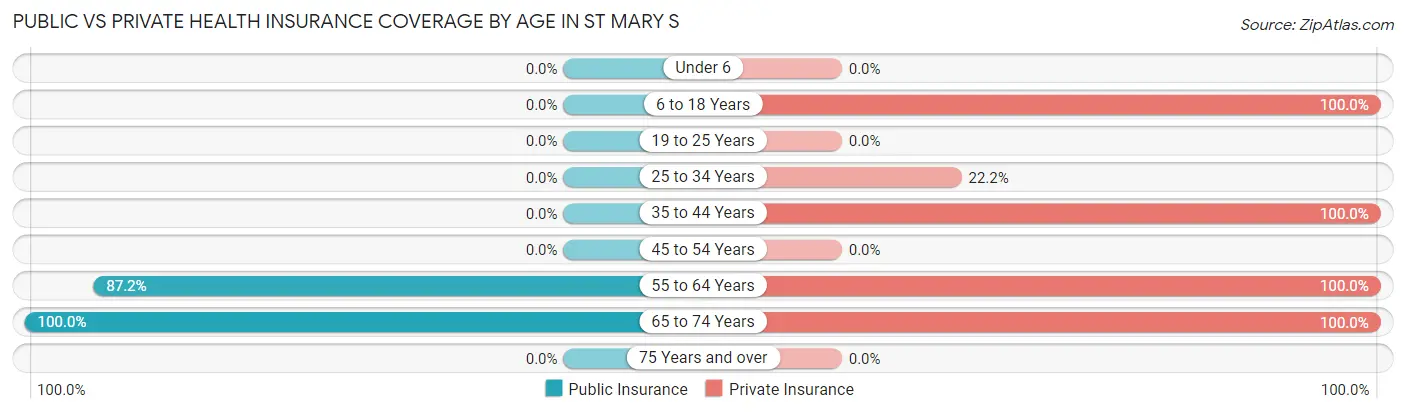
| Age Bracket | Public Insurance | Private Insurance |
| Under 6 | 0 (0.0%) | 0 (0.0%) |
| 6 to 18 Years | 0 (0.0%) | 53 (100.0%) |
| 19 to 25 Years | 0 (0.0%) | 0 (0.0%) |
| 25 to 34 Years | 0 (0.0%) | 14 (22.2%) |
| 35 to 44 Years | 0 (0.0%) | 52 (100.0%) |
| 45 to 54 Years | 0 (0.0%) | 0 (0.0%) |
| 55 to 64 Years | 41 (87.2%) | 47 (100.0%) |
| 65 to 74 Years | 13 (100.0%) | 13 (100.0%) |
| 75 Years and over | 0 (0.0%) | 0 (0.0%) |
| Total | 54 (23.7%) | 179 (78.5%) |
Disability Status by Sex by Age in St Mary s
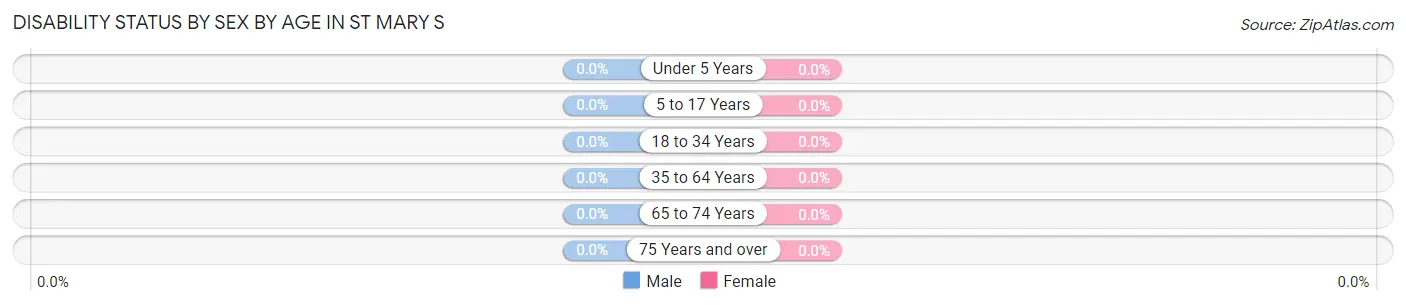
| Age Bracket | Male | Female |
| Under 5 Years | 0 (0.0%) | 0 (0.0%) |
| 5 to 17 Years | 0 (0.0%) | 0 (0.0%) |
| 18 to 34 Years | 0 (0.0%) | 0 (0.0%) |
| 35 to 64 Years | 0 (0.0%) | 0 (0.0%) |
| 65 to 74 Years | 0 (0.0%) | 0 (0.0%) |
| 75 Years and over | 0 (0.0%) | 0 (0.0%) |
Disability Class by Sex by Age in St Mary s
Disability Class: Hearing Difficulty
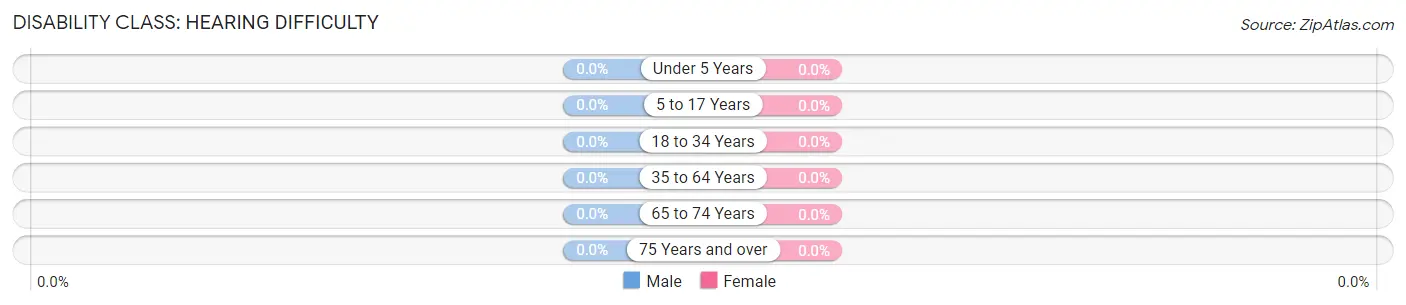
| Age Bracket | Male | Female |
| Under 5 Years | 0 (0.0%) | 0 (0.0%) |
| 5 to 17 Years | 0 (0.0%) | 0 (0.0%) |
| 18 to 34 Years | 0 (0.0%) | 0 (0.0%) |
| 35 to 64 Years | 0 (0.0%) | 0 (0.0%) |
| 65 to 74 Years | 0 (0.0%) | 0 (0.0%) |
| 75 Years and over | 0 (0.0%) | 0 (0.0%) |
Disability Class: Vision Difficulty
| Age Bracket | Male | Female |
| Under 5 Years | 0 (0.0%) | 0 (0.0%) |
| 5 to 17 Years | 0 (0.0%) | 0 (0.0%) |
| 18 to 34 Years | 0 (0.0%) | 0 (0.0%) |
| 35 to 64 Years | 0 (0.0%) | 0 (0.0%) |
| 65 to 74 Years | 0 (0.0%) | 0 (0.0%) |
| 75 Years and over | 0 (0.0%) | 0 (0.0%) |
Disability Class: Cognitive Difficulty

| Age Bracket | Male | Female |
| 5 to 17 Years | 0 (0.0%) | 0 (0.0%) |
| 18 to 34 Years | 0 (0.0%) | 0 (0.0%) |
| 35 to 64 Years | 0 (0.0%) | 0 (0.0%) |
| 65 to 74 Years | 0 (0.0%) | 0 (0.0%) |
| 75 Years and over | 0 (0.0%) | 0 (0.0%) |
Disability Class: Ambulatory Difficulty
| Age Bracket | Male | Female |
| 5 to 17 Years | 0 (0.0%) | 0 (0.0%) |
| 18 to 34 Years | 0 (0.0%) | 0 (0.0%) |
| 35 to 64 Years | 0 (0.0%) | 0 (0.0%) |
| 65 to 74 Years | 0 (0.0%) | 0 (0.0%) |
| 75 Years and over | 0 (0.0%) | 0 (0.0%) |
Disability Class: Self-Care Difficulty
| Age Bracket | Male | Female |
| 5 to 17 Years | 0 (0.0%) | 0 (0.0%) |
| 18 to 34 Years | 0 (0.0%) | 0 (0.0%) |
| 35 to 64 Years | 0 (0.0%) | 0 (0.0%) |
| 65 to 74 Years | 0 (0.0%) | 0 (0.0%) |
| 75 Years and over | 0 (0.0%) | 0 (0.0%) |
Technology Access in St Mary s
Computing Device Access in St Mary s
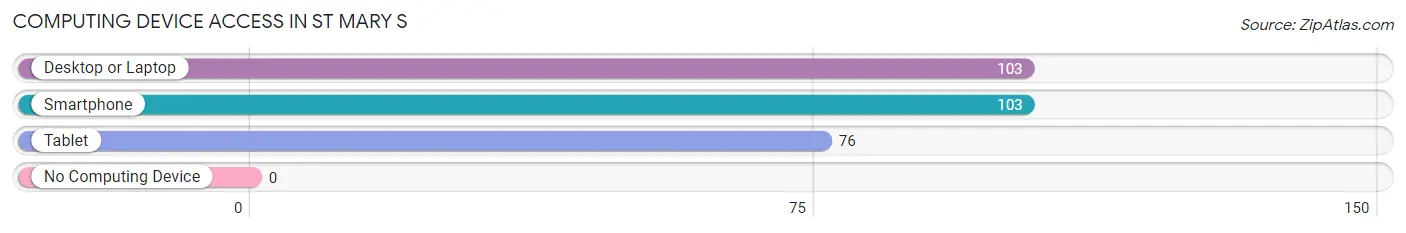
| Device Type | # Households | % Households |
| Desktop or Laptop | 103 | 100.0% |
| Smartphone | 103 | 100.0% |
| Tablet | 76 | 73.8% |
| No Computing Device | 0 | 0.0% |
| Total | 103 | 100.0% |
Internet Access in St Mary s
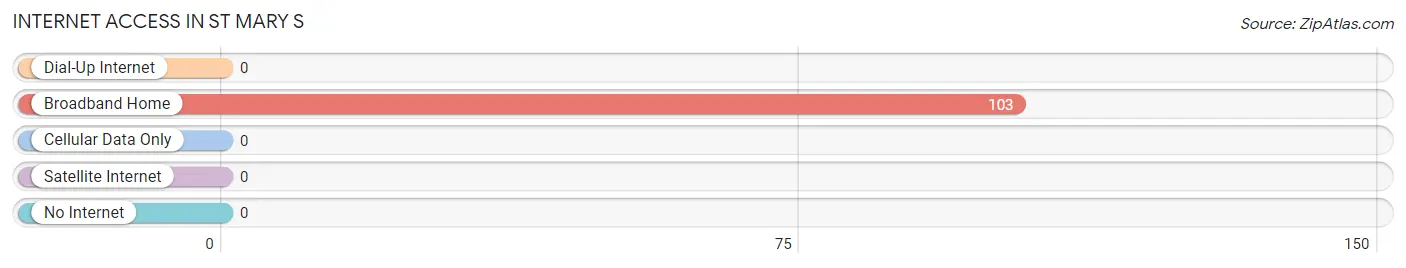
| Internet Type | # Households | % Households |
| Dial-Up Internet | 0 | 0.0% |
| Broadband Home | 103 | 100.0% |
| Cellular Data Only | 0 | 0.0% |
| Satellite Internet | 0 | 0.0% |
| No Internet | 0 | 0.0% |
| Total | 103 | 100.0% |
St Mary s Summary
St Marys is a small town located in Colorado, United States. It is situated in the San Luis Valley, which is the largest alpine valley in the world. The town is located at an elevation of 7,500 feet and has a population of approximately 2,000 people.
Geography
St Marys is located in the San Luis Valley, which is a large intermontane basin located in south-central Colorado. The valley is surrounded by the Sangre de Cristo Mountains to the east and the San Juan Mountains to the west. The valley is approximately 120 miles long and 40 miles wide, and is the largest alpine valley in the world. The valley is home to several rivers, including the Rio Grande, which is the longest river in the United States.
The town of St Marys is located at an elevation of 7,500 feet, and is situated on the banks of the Rio Grande. The town is surrounded by mountains, and is located in a semi-arid climate. The average annual temperature is approximately 50 degrees Fahrenheit, and the average annual precipitation is approximately 10 inches.
Economy
The economy of St Marys is largely based on agriculture and tourism. The town is home to several farms, which produce a variety of crops, including potatoes, alfalfa, and hay. The town is also home to several tourist attractions, including the Great Sand Dunes National Park and the Rio Grande National Forest.
The town is also home to several businesses, including restaurants, hotels, and retail stores. The town is also home to several manufacturing companies, which produce a variety of products, including furniture, clothing, and electronics.
Demographics
As of the 2010 census, the population of St Marys was 2,000 people. The town is predominantly white, with approximately 95% of the population being white. The remaining 5% of the population is made up of African Americans, Hispanics, and Native Americans. The median household income in the town is approximately $35,000, and the median home value is approximately $150,000.
Conclusion
St Marys is a small town located in Colorado, United States. It is situated in the San Luis Valley, which is the largest alpine valley in the world. The town is located at an elevation of 7,500 feet and has a population of approximately 2,000 people. The economy of St Marys is largely based on agriculture and tourism, and the town is home to several businesses, including restaurants, hotels, and retail stores. The town is predominantly white, with approximately 95% of the population being white. The median household income in the town is approximately $35,000, and the median home value is approximately $150,000.
Common Questions
What is Per Capita Income in St Mary s?
Per Capita income in St Mary s is $34,134.
What is the Median Household income in St Mary s?
Median Household Income in St Mary s is $67,348.
What is Income or Wage Gap in St Mary s?
Income or Wage Gap in St Mary s is 43.9%.
Women in St Mary s earn 56.1 cents for every dollar earned by a man.
What is Inequality or Gini Index in St Mary s?
Inequality or Gini Index in St Mary s is 0.17.
What is the Total Population of St Mary s?
Total Population of St Mary s is 228.
What is the Total Male Population of St Mary s?
Total Male Population of St Mary s is 150.
What is the Total Female Population of St Mary s?
Total Female Population of St Mary s is 78.
What is the Ratio of Males per 100 Females in St Mary s?
There are 192.31 Males per 100 Females in St Mary s.
What is the Ratio of Females per 100 Males in St Mary s?
There are 52.00 Females per 100 Males in St Mary s.
What is the Median Population Age in St Mary s?
Median Population Age in St Mary s is 34.0 Years.
What is the Average Family Size in St Mary s
Average Family Size in St Mary s is 2.8 People.
What is the Average Household Size in St Mary s
Average Household Size in St Mary s is 2.2 People.
How Large is the Labor Force in St Mary s?
There are 162 People in the Labor Forcein in St Mary s.
What is the Percentage of People in the Labor Force in St Mary s?
92.6% of People are in the Labor Force in St Mary s.
What is the Unemployment Rate in St Mary s?
Unemployment Rate in St Mary s is 30.2%.