Chloride, AZ Map & Demographics
Chloride Map
Chloride Overview
$21,741
PER CAPITA INCOME
$30,625
AVG HOUSEHOLD INCOME
0.40
INEQUALITY / GINI INDEX
287
TOTAL POPULATION
197
MALE POPULATION
90
FEMALE POPULATION
218.89
MALES / 100 FEMALES
45.69
FEMALES / 100 MALES
60.0
MEDIAN AGE
2.3
AVG FAMILY SIZE
1.6
AVG HOUSEHOLD SIZE
62
LABOR FORCE [ PEOPLE ]
21.6%
PERCENT IN LABOR FORCE
Chloride Zip Codes
Chloride Area Codes
Income in Chloride
Income Overview in Chloride
| Characteristic | Number | Measure |
| Per Capita Income | 287 | $21,741 |
| Median Family Income | 58 | $0 |
| Mean Family Income | 58 | $30,891 |
| Median Household Income | 184 | $30,625 |
| Mean Household Income | 184 | $34,230 |
| Income Deficit | 58 | $0 |
| Wage / Income Gap (%) | 287 | 0.00% |
| Wage / Income Gap ($) | 287 | 100.00¢ per $1 |
| Gini / Inequality Index | 287 | 0.40 |
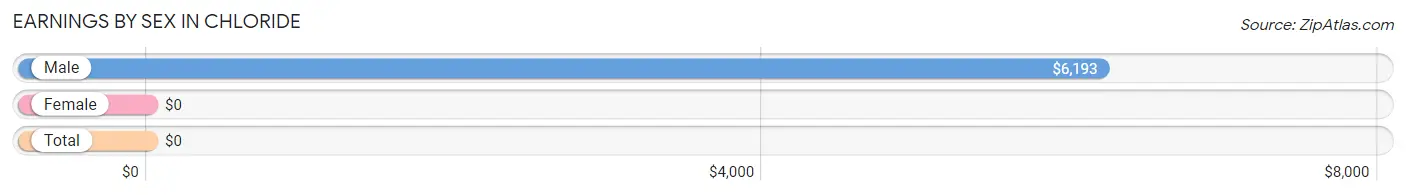
Earnings by Sex in Chloride
| Sex | Number | Average Earnings |
| Male | 41 (66.1%) | $6,193 |
| Female | 21 (33.9%) | $0 |
| Total | 62 (100.0%) | $0 |
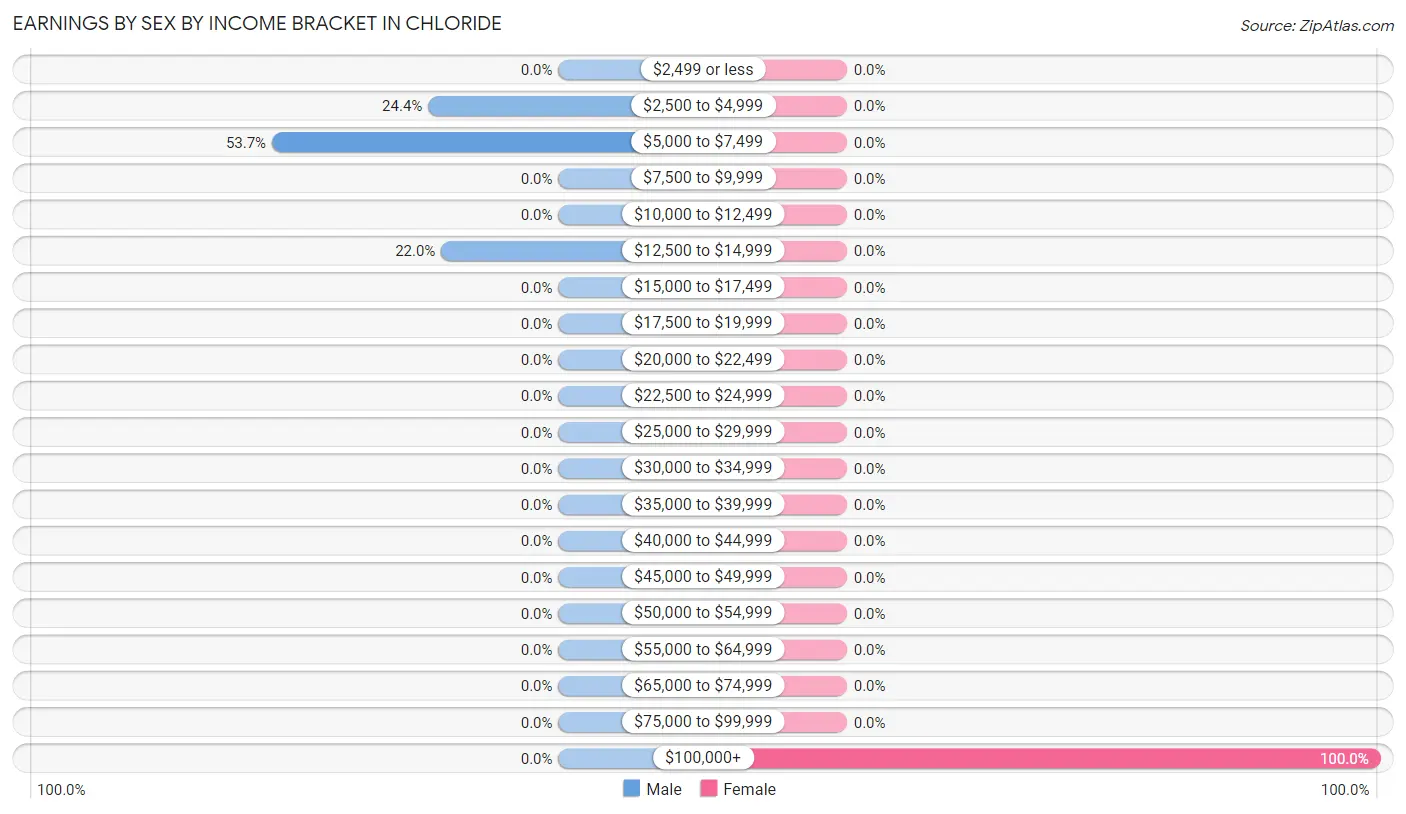
Earnings by Sex by Income Bracket in Chloride
The most common earnings brackets in Chloride are $5,000 to $7,499 for men (22 | 53.7%) and $100,000+ for women (21 | 100.0%).
| Income | Male | Female |
| $2,499 or less | 0 (0.0%) | 0 (0.0%) |
| $2,500 to $4,999 | 10 (24.4%) | 0 (0.0%) |
| $5,000 to $7,499 | 22 (53.7%) | 0 (0.0%) |
| $7,500 to $9,999 | 0 (0.0%) | 0 (0.0%) |
| $10,000 to $12,499 | 0 (0.0%) | 0 (0.0%) |
| $12,500 to $14,999 | 9 (22.0%) | 0 (0.0%) |
| $15,000 to $17,499 | 0 (0.0%) | 0 (0.0%) |
| $17,500 to $19,999 | 0 (0.0%) | 0 (0.0%) |
| $20,000 to $22,499 | 0 (0.0%) | 0 (0.0%) |
| $22,500 to $24,999 | 0 (0.0%) | 0 (0.0%) |
| $25,000 to $29,999 | 0 (0.0%) | 0 (0.0%) |
| $30,000 to $34,999 | 0 (0.0%) | 0 (0.0%) |
| $35,000 to $39,999 | 0 (0.0%) | 0 (0.0%) |
| $40,000 to $44,999 | 0 (0.0%) | 0 (0.0%) |
| $45,000 to $49,999 | 0 (0.0%) | 0 (0.0%) |
| $50,000 to $54,999 | 0 (0.0%) | 0 (0.0%) |
| $55,000 to $64,999 | 0 (0.0%) | 0 (0.0%) |
| $65,000 to $74,999 | 0 (0.0%) | 0 (0.0%) |
| $75,000 to $99,999 | 0 (0.0%) | 0 (0.0%) |
| $100,000+ | 0 (0.0%) | 21 (100.0%) |
| Total | 41 (100.0%) | 21 (100.0%) |
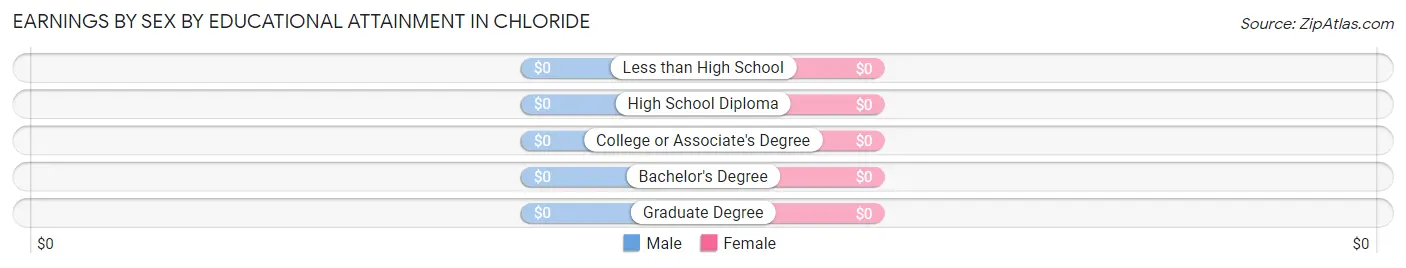
Earnings by Sex by Educational Attainment in Chloride
| Educational Attainment | Male Income | Female Income |
| Less than High School | - | - |
| High School Diploma | - | - |
| College or Associate's Degree | - | - |
| Bachelor's Degree | - | - |
| Graduate Degree | - | - |
| Total | $6,193 | $0 |
Family Income in Chloride
Family Income Brackets in Chloride
According to the Chloride family income data, there are 35 families falling into the $35,000 to $49,999 income range, which is the most common income bracket and makes up 60.3% of all families.
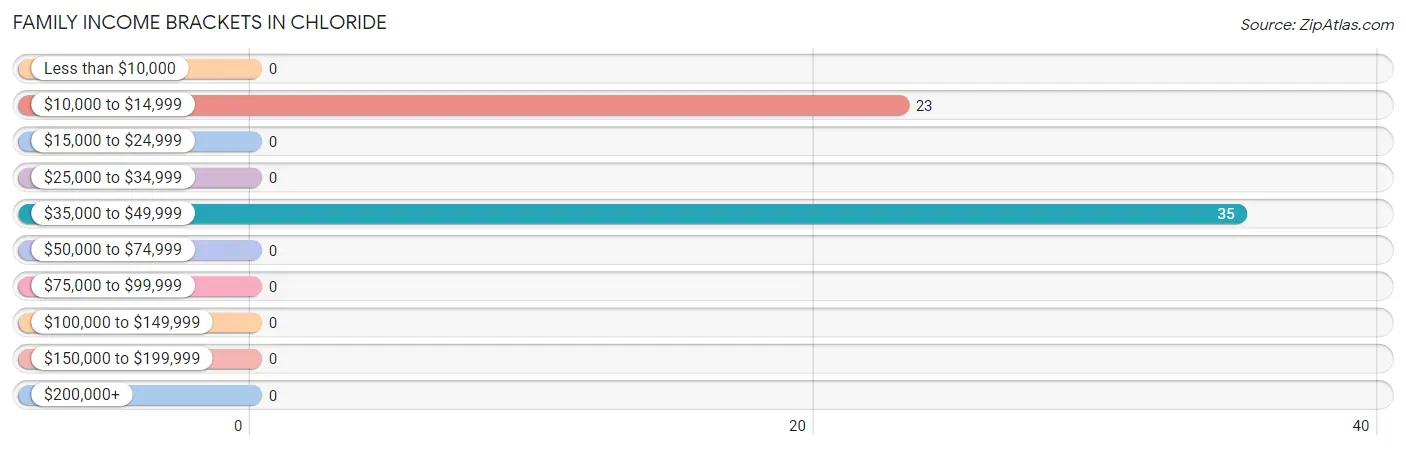
| Income Bracket | # Families | % Families |
| Less than $10,000 | 0 | 0.0% |
| $10,000 to $14,999 | 23 | 39.7% |
| $15,000 to $24,999 | 0 | 0.0% |
| $25,000 to $34,999 | 0 | 0.0% |
| $35,000 to $49,999 | 35 | 60.3% |
| $50,000 to $74,999 | 0 | 0.0% |
| $75,000 to $99,999 | 0 | 0.0% |
| $100,000 to $149,999 | 0 | 0.0% |
| $150,000 to $199,999 | 0 | 0.0% |
| $200,000+ | 0 | 0.0% |
Family Income by Famaliy Size in Chloride
| Income Bracket | # Families | Median Income |
| 2-Person Families | 58 (100.0%) | $0 |
| 3-Person Families | 0 (0.0%) | $0 |
| 4-Person Families | 0 (0.0%) | $0 |
| 5-Person Families | 0 (0.0%) | $0 |
| 6-Person Families | 0 (0.0%) | $0 |
| 7+ Person Families | 0 (0.0%) | $0 |
| Total | 58 (100.0%) | $0 |
Family Income by Number of Earners in Chloride
| Number of Earners | # Families | Median Income |
| No Earners | 58 (100.0%) | $0 |
| 1 Earner | 0 (0.0%) | $0 |
| 2 Earners | 0 (0.0%) | $0 |
| 3+ Earners | 0 (0.0%) | $0 |
| Total | 58 (100.0%) | $0 |
Household Income in Chloride
Household Income Brackets in Chloride
With 53 households falling in the category, the $35,000 to $49,999 income range is the most frequent in Chloride, accounting for 28.8% of all households.
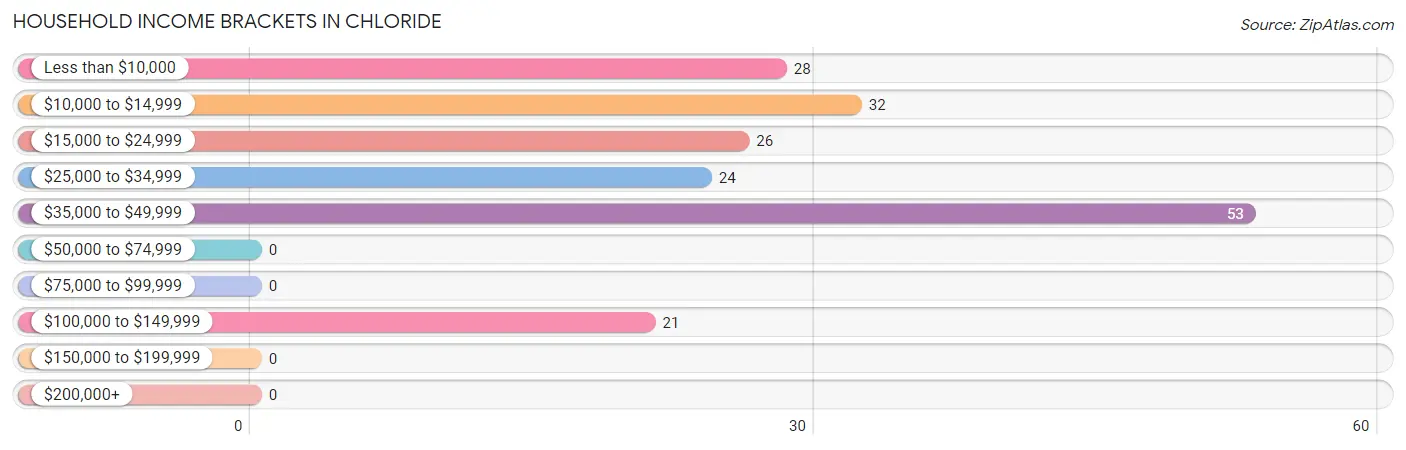
| Income Bracket | # Households | % Households |
| Less than $10,000 | 28 | 15.2% |
| $10,000 to $14,999 | 32 | 17.4% |
| $15,000 to $24,999 | 26 | 14.1% |
| $25,000 to $34,999 | 24 | 13.0% |
| $35,000 to $49,999 | 53 | 28.8% |
| $50,000 to $74,999 | 0 | 0.0% |
| $75,000 to $99,999 | 0 | 0.0% |
| $100,000 to $149,999 | 21 | 11.4% |
| $150,000 to $199,999 | 0 | 0.0% |
| $200,000+ | 0 | 0.0% |
Household Income by Householder Age in Chloride
The median household income in Chloride is $30,625, with the highest median household income of $37,375 found in the 65+ years age bracket for the primary householder. A total of 71 households (38.6%) fall into this category.
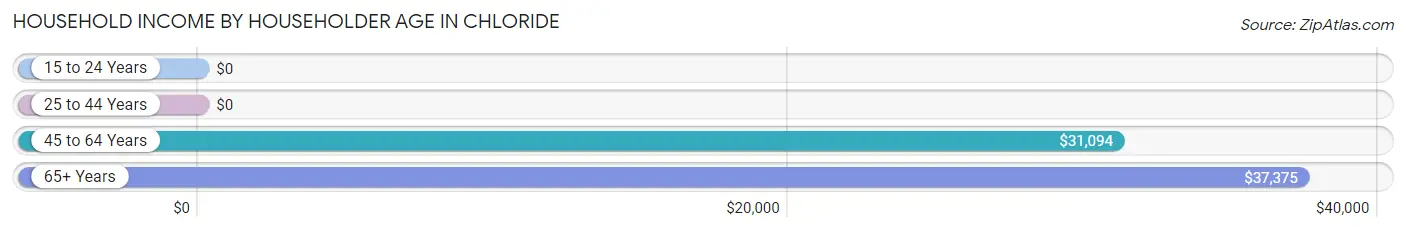
| Income Bracket | # Households | Median Income |
| 15 to 24 Years | 0 (0.0%) | $0 |
| 25 to 44 Years | 28 (15.2%) | $0 |
| 45 to 64 Years | 85 (46.2%) | $31,094 |
| 65+ Years | 71 (38.6%) | $37,375 |
| Total | 184 (100.0%) | $30,625 |
Poverty in Chloride
Income Below Poverty by Sex and Age in Chloride
With 47.7% poverty level for males and 40.0% for females among the residents of Chloride, 25 to 34 year old males and 25 to 34 year old females are the most vulnerable to poverty, with 40 males (100.0%) and 28 females (100.0%) in their respective age groups living below the poverty level.
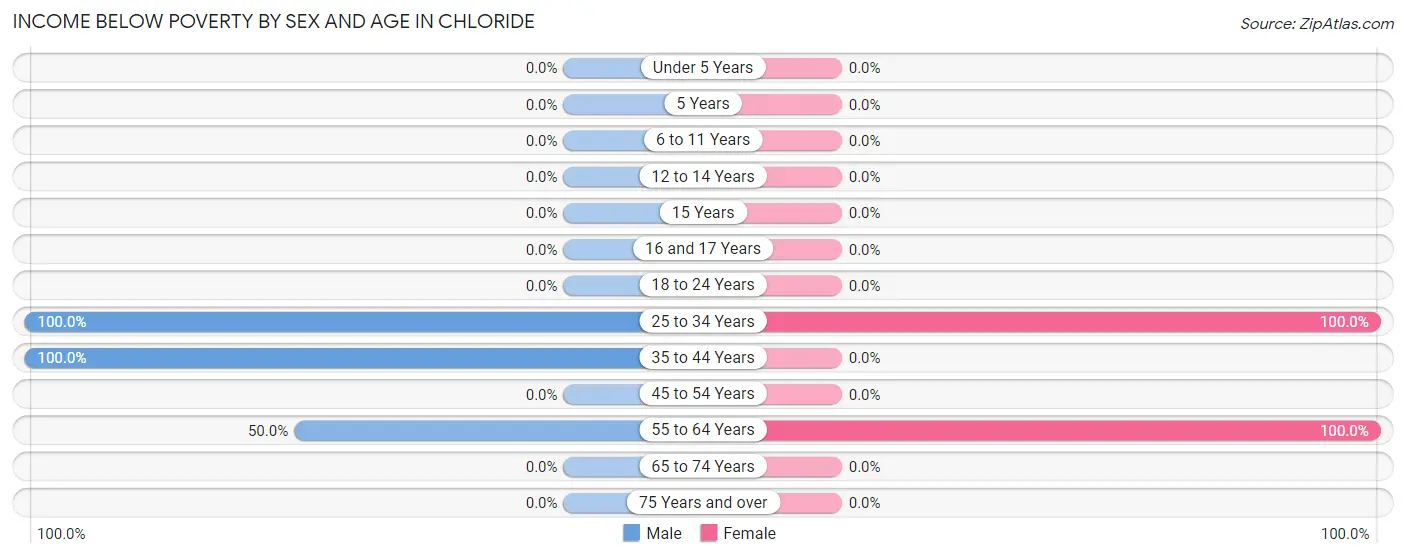
| Age Bracket | Male | Female |
| Under 5 Years | 0 (0.0%) | 0 (0.0%) |
| 5 Years | 0 (0.0%) | 0 (0.0%) |
| 6 to 11 Years | 0 (0.0%) | 0 (0.0%) |
| 12 to 14 Years | 0 (0.0%) | 0 (0.0%) |
| 15 Years | 0 (0.0%) | 0 (0.0%) |
| 16 and 17 Years | 0 (0.0%) | 0 (0.0%) |
| 18 to 24 Years | 0 (0.0%) | 0 (0.0%) |
| 25 to 34 Years | 40 (100.0%) | 28 (100.0%) |
| 35 to 44 Years | 22 (100.0%) | 0 (0.0%) |
| 45 to 54 Years | 0 (0.0%) | 0 (0.0%) |
| 55 to 64 Years | 32 (50.0%) | 8 (100.0%) |
| 65 to 74 Years | 0 (0.0%) | 0 (0.0%) |
| 75 Years and over | 0 (0.0%) | 0 (0.0%) |
| Total | 94 (47.7%) | 36 (40.0%) |
Income Above Poverty by Sex and Age in Chloride
According to the poverty statistics in Chloride, males aged 65 to 74 years and females aged 45 to 54 years are the age groups that are most secure financially, with 100.0% of males and 100.0% of females in these age groups living above the poverty line.
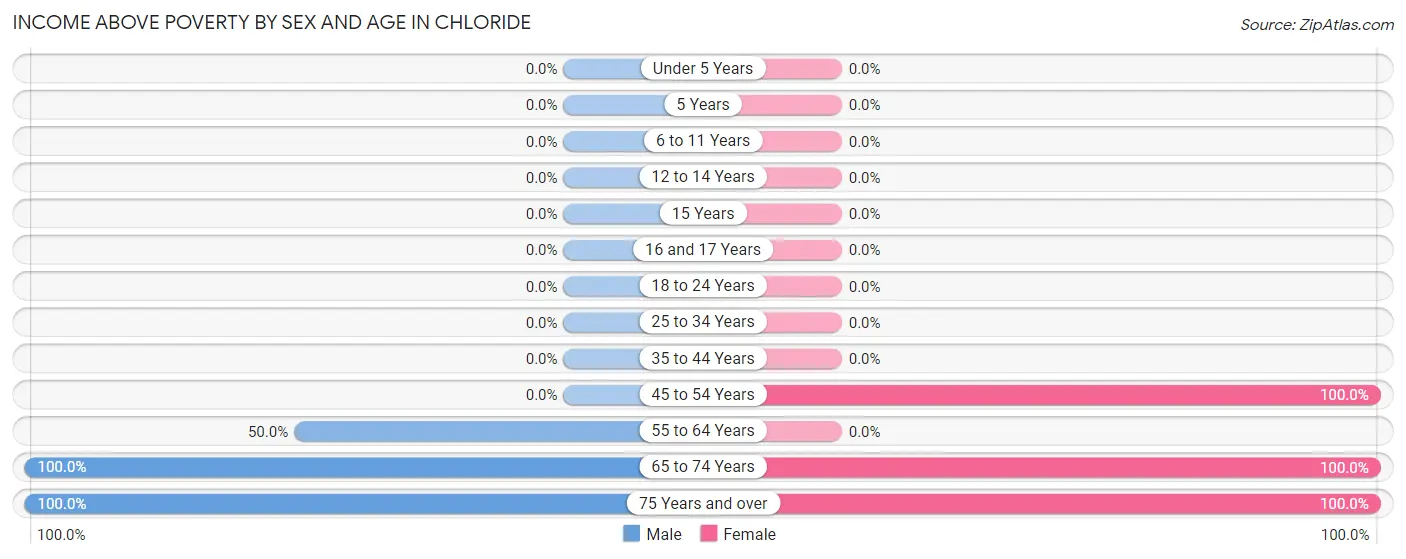
| Age Bracket | Male | Female |
| Under 5 Years | 0 (0.0%) | 0 (0.0%) |
| 5 Years | 0 (0.0%) | 0 (0.0%) |
| 6 to 11 Years | 0 (0.0%) | 0 (0.0%) |
| 12 to 14 Years | 0 (0.0%) | 0 (0.0%) |
| 15 Years | 0 (0.0%) | 0 (0.0%) |
| 16 and 17 Years | 0 (0.0%) | 0 (0.0%) |
| 18 to 24 Years | 0 (0.0%) | 0 (0.0%) |
| 25 to 34 Years | 0 (0.0%) | 0 (0.0%) |
| 35 to 44 Years | 0 (0.0%) | 0 (0.0%) |
| 45 to 54 Years | 0 (0.0%) | 21 (100.0%) |
| 55 to 64 Years | 32 (50.0%) | 0 (0.0%) |
| 65 to 74 Years | 8 (100.0%) | 8 (100.0%) |
| 75 Years and over | 63 (100.0%) | 25 (100.0%) |
| Total | 103 (52.3%) | 54 (60.0%) |
Income Below Poverty Among Married-Couple Families in Chloride
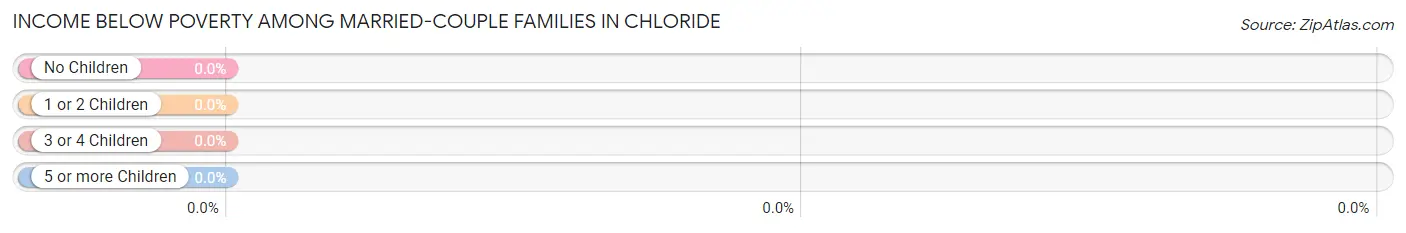
| Children | Above Poverty | Below Poverty |
| No Children | 35 (100.0%) | 0 (0.0%) |
| 1 or 2 Children | 0 (0.0%) | 0 (0.0%) |
| 3 or 4 Children | 0 (0.0%) | 0 (0.0%) |
| 5 or more Children | 0 (0.0%) | 0 (0.0%) |
| Total | 35 (100.0%) | 0 (0.0%) |
Income Below Poverty Among Single-Parent Households in Chloride
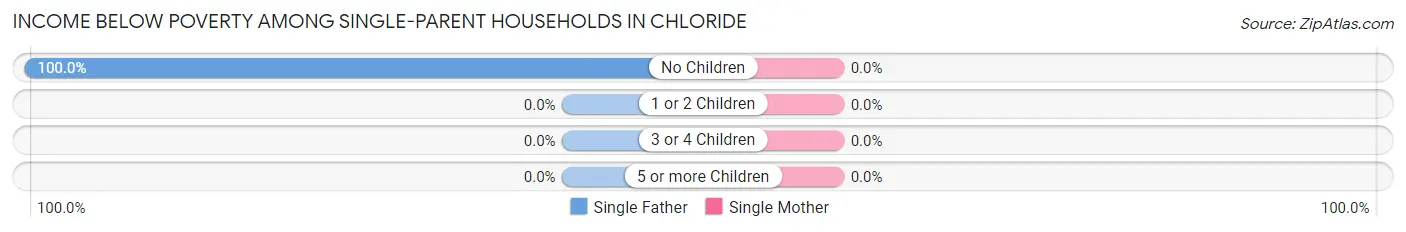
| Children | Single Father | Single Mother |
| No Children | 23 (100.0%) | 0 (0.0%) |
| 1 or 2 Children | 0 (0.0%) | 0 (0.0%) |
| 3 or 4 Children | 0 (0.0%) | 0 (0.0%) |
| 5 or more Children | 0 (0.0%) | 0 (0.0%) |
| Total | 23 (100.0%) | 0 (0.0%) |
Income Below Poverty Among Married-Couple vs Single-Parent Households in Chloride
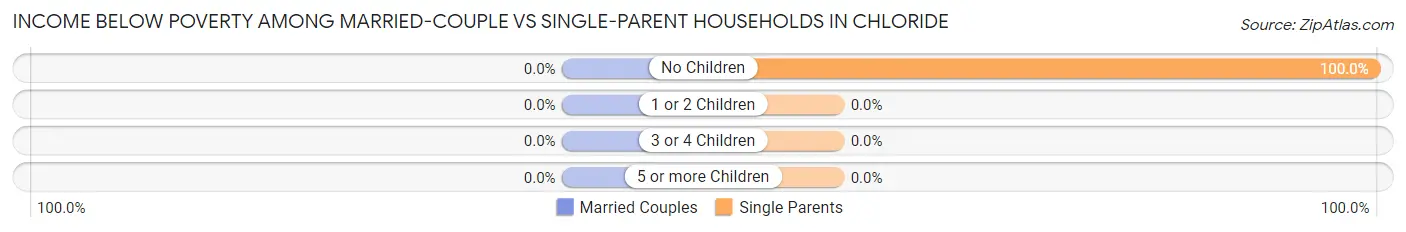
| Children | Married-Couple Families | Single-Parent Households |
| No Children | 0 (0.0%) | 23 (100.0%) |
| 1 or 2 Children | 0 (0.0%) | 0 (0.0%) |
| 3 or 4 Children | 0 (0.0%) | 0 (0.0%) |
| 5 or more Children | 0 (0.0%) | 0 (0.0%) |
| Total | 0 (0.0%) | 23 (100.0%) |
Race in Chloride
The most populous races in Chloride are White / Caucasian (287 | 100.0%), and Hispanic or Latino (28 | 9.8%).
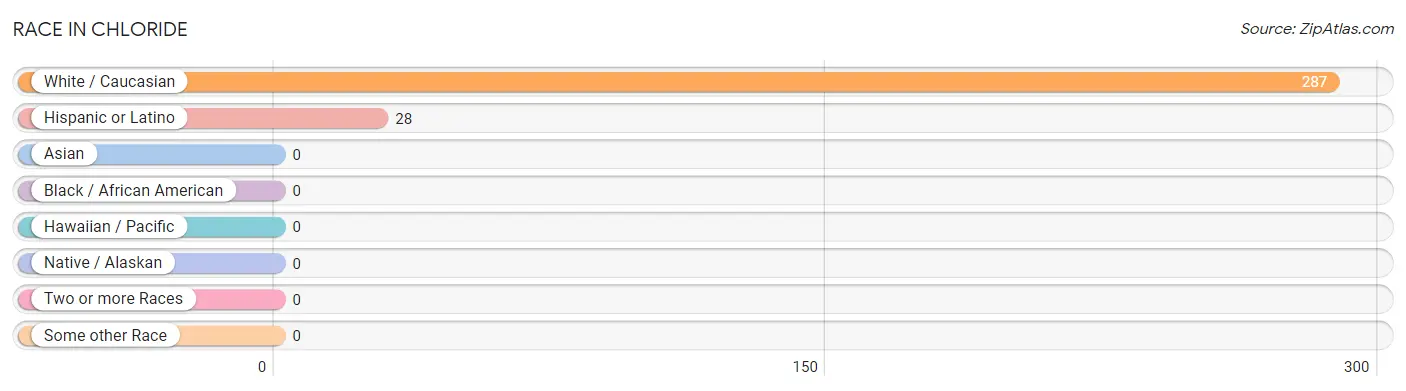
| Race | # Population | % Population |
| Asian | 0 | 0.0% |
| Black / African American | 0 | 0.0% |
| Hawaiian / Pacific | 0 | 0.0% |
| Hispanic or Latino | 28 | 9.8% |
| Native / Alaskan | 0 | 0.0% |
| White / Caucasian | 287 | 100.0% |
| Two or more Races | 0 | 0.0% |
| Some other Race | 0 | 0.0% |
| Total | 287 | 100.0% |
Ancestry in Chloride
The most populous ancestries reported in Chloride are French (63 | 22.0%), English (42 | 14.6%), Mexican (28 | 9.8%), Hungarian (26 | 9.1%), and European (21 | 7.3%), together accounting for 62.7% of all Chloride residents.
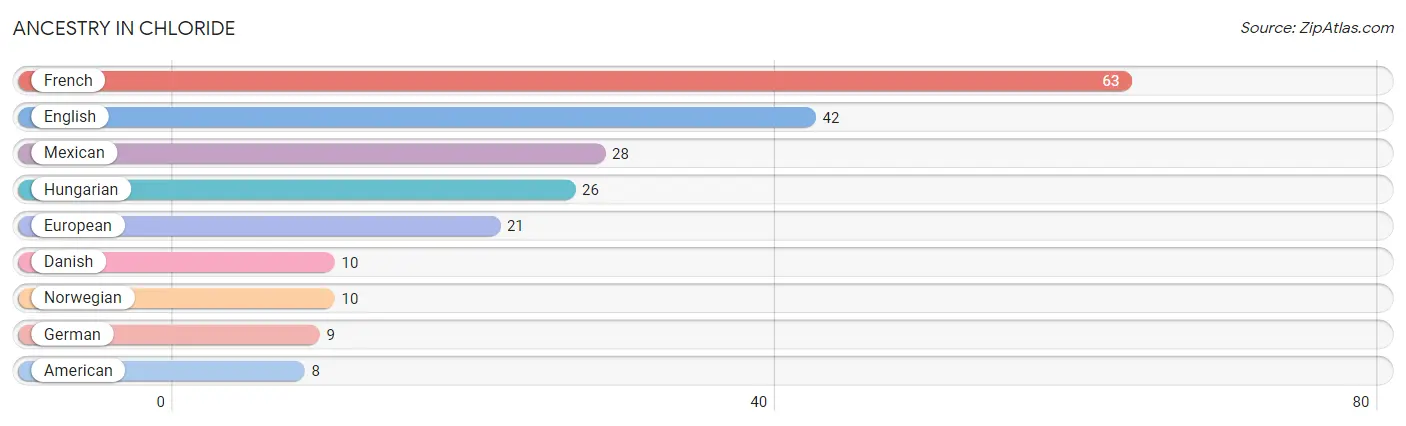
| Ancestry | # Population | % Population |
| American | 8 | 2.8% |
| Danish | 10 | 3.5% |
| English | 42 | 14.6% |
| European | 21 | 7.3% |
| French | 63 | 22.0% |
| German | 9 | 3.1% |
| Hungarian | 26 | 9.1% |
| Mexican | 28 | 9.8% |
| Norwegian | 10 | 3.5% | View All 9 Rows |
Immigrants in Chloride

| Immigration Origin | # Population | % Population | View All 0 Rows |
Sex and Age in Chloride
Sex and Age in Chloride
The most populous age groups in Chloride are 60 to 64 Years (41 | 20.8%) for men and 30 to 34 Years (28 | 31.1%) for women.
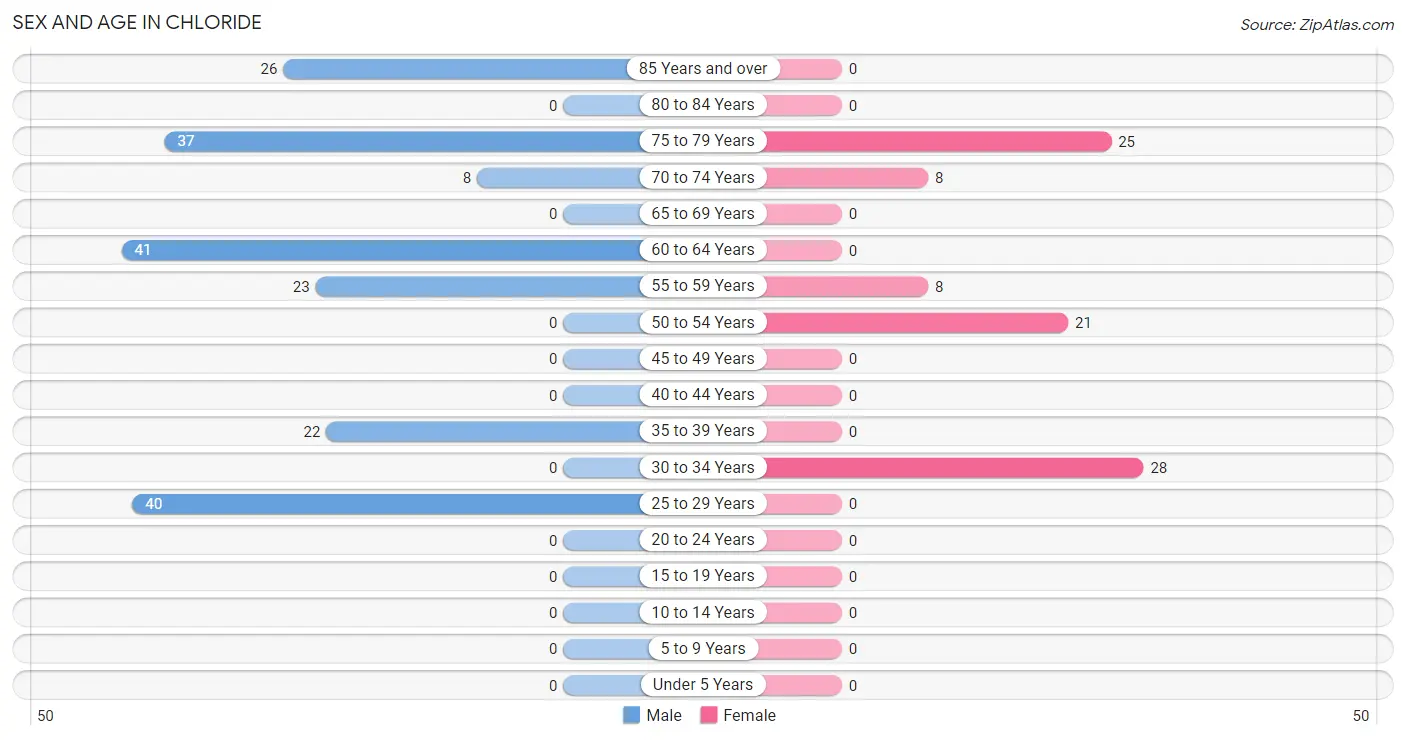
| Age Bracket | Male | Female |
| Under 5 Years | 0 (0.0%) | 0 (0.0%) |
| 5 to 9 Years | 0 (0.0%) | 0 (0.0%) |
| 10 to 14 Years | 0 (0.0%) | 0 (0.0%) |
| 15 to 19 Years | 0 (0.0%) | 0 (0.0%) |
| 20 to 24 Years | 0 (0.0%) | 0 (0.0%) |
| 25 to 29 Years | 40 (20.3%) | 0 (0.0%) |
| 30 to 34 Years | 0 (0.0%) | 28 (31.1%) |
| 35 to 39 Years | 22 (11.2%) | 0 (0.0%) |
| 40 to 44 Years | 0 (0.0%) | 0 (0.0%) |
| 45 to 49 Years | 0 (0.0%) | 0 (0.0%) |
| 50 to 54 Years | 0 (0.0%) | 21 (23.3%) |
| 55 to 59 Years | 23 (11.7%) | 8 (8.9%) |
| 60 to 64 Years | 41 (20.8%) | 0 (0.0%) |
| 65 to 69 Years | 0 (0.0%) | 0 (0.0%) |
| 70 to 74 Years | 8 (4.1%) | 8 (8.9%) |
| 75 to 79 Years | 37 (18.8%) | 25 (27.8%) |
| 80 to 84 Years | 0 (0.0%) | 0 (0.0%) |
| 85 Years and over | 26 (13.2%) | 0 (0.0%) |
| Total | 197 (100.0%) | 90 (100.0%) |
Families and Households in Chloride
Median Family Size in Chloride
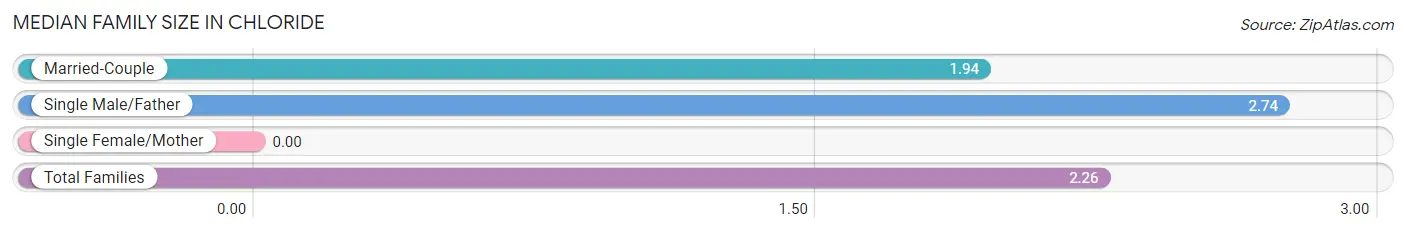
| Family Type | # Families | Family Size |
| Married-Couple | 35 (60.3%) | 1.94 |
| Single Male/Father | 23 (39.7%) | 2.74 |
| Single Female/Mother | 0 (0.0%) | - |
| Total Families | 58 (100.0%) | 2.26 |
Median Household Size in Chloride
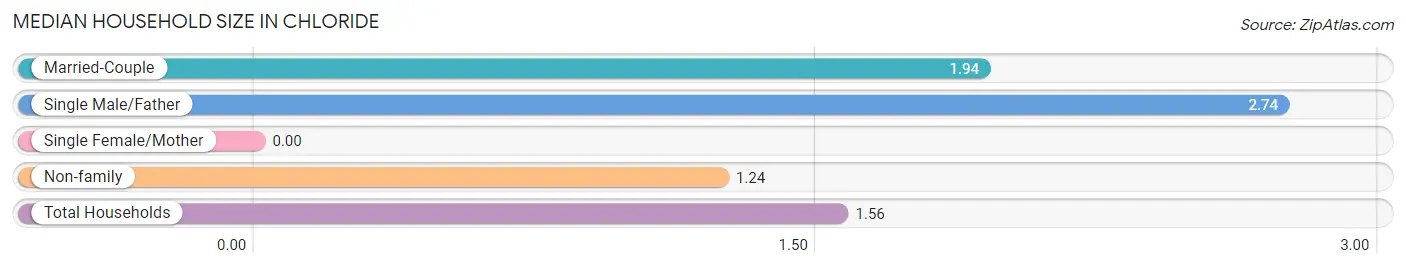
| Household Type | # Households | Household Size |
| Married-Couple | 35 (19.0%) | 1.94 |
| Single Male/Father | 23 (12.5%) | 2.74 |
| Single Female/Mother | 0 (0.0%) | - |
| Non-family | 126 (68.5%) | 1.24 |
| Total Households | 184 (100.0%) | 1.56 |
Household Size by Marriage Status in Chloride
Out of a total of 184 households in Chloride, 58 (31.5%) are family households, while 126 (68.5%) are nonfamily households. The most numerous type of family households are 2-person households, comprising 58, and the most common type of nonfamily households are 1-person households, comprising 88.
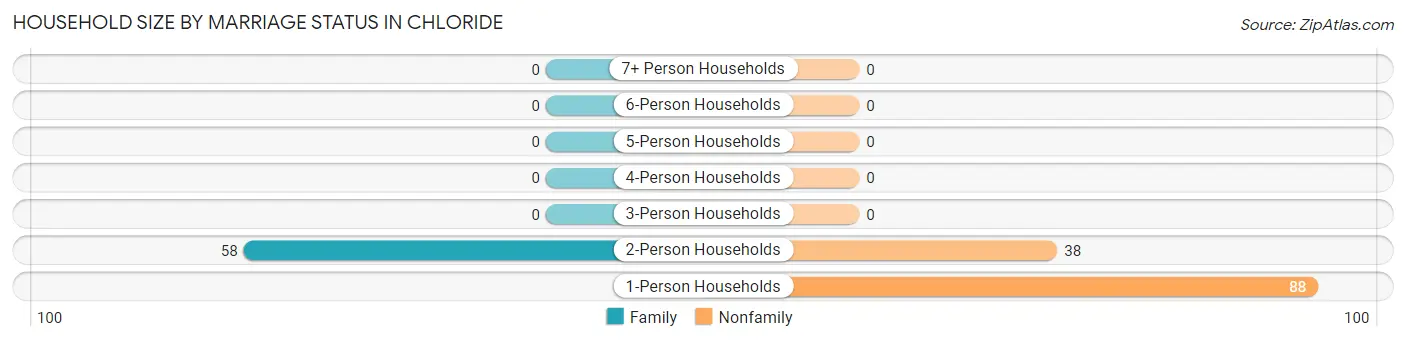
| Household Size | Family Households | Nonfamily Households |
| 1-Person Households | - | 88 (47.8%) |
| 2-Person Households | 58 (31.5%) | 38 (20.6%) |
| 3-Person Households | 0 (0.0%) | 0 (0.0%) |
| 4-Person Households | 0 (0.0%) | 0 (0.0%) |
| 5-Person Households | 0 (0.0%) | 0 (0.0%) |
| 6-Person Households | 0 (0.0%) | 0 (0.0%) |
| 7+ Person Households | 0 (0.0%) | 0 (0.0%) |
| Total | 58 (31.5%) | 126 (68.5%) |
Female Fertility in Chloride
Fertility by Age in Chloride
| Age Bracket | Women with Births | Births / 1,000 Women |
| 15 to 19 years | 0 (0.0%) | 0.0 |
| 20 to 34 years | 0 (0.0%) | 0.0 |
| 35 to 50 years | 0 (0.0%) | 0.0 |
| Total | 0 (0.0%) | 0.0 |
Fertility by Age by Marriage Status in Chloride

| Age Bracket | Married | Unmarried |
| 15 to 19 years | 0 (0.0%) | 0 (0.0%) |
| 20 to 34 years | 0 (0.0%) | 0 (0.0%) |
| 35 to 50 years | 0 (0.0%) | 0 (0.0%) |
| Total | 0 (0.0%) | 0 (0.0%) |
Fertility by Education in Chloride
| Educational Attainment | Women with Births | Births / 1,000 Women |
| Less than High School | 0 (0.0%) | 0.0 |
| High School Diploma | 0 (0.0%) | 0.0 |
| College or Associate's Degree | 0 (0.0%) | 0.0 |
| Bachelor's Degree | 0 (0.0%) | 0.0 |
| Graduate Degree | 0 (0.0%) | 0.0 |
| Total | 0 (0.0%) | 0.0 |
Fertility by Education by Marriage Status in Chloride
| Educational Attainment | Married | Unmarried |
| Less than High School | 0 (0.0%) | 0 (0.0%) |
| High School Diploma | 0 (0.0%) | 0 (0.0%) |
| College or Associate's Degree | 0 (0.0%) | 0 (0.0%) |
| Bachelor's Degree | 0 (0.0%) | 0 (0.0%) |
| Graduate Degree | 0 (0.0%) | 0 (0.0%) |
| Total | 0 (0.0%) | 0 (0.0%) |
Employment Characteristics in Chloride
Employment by Class of Employer in Chloride
Among the 62 employed individuals in Chloride, self-employed (not incorporated) (22 | 35.5%), federal government employees (21 | 33.9%), and not-for-profit organizations (10 | 16.1%) make up the most common classes of employment.
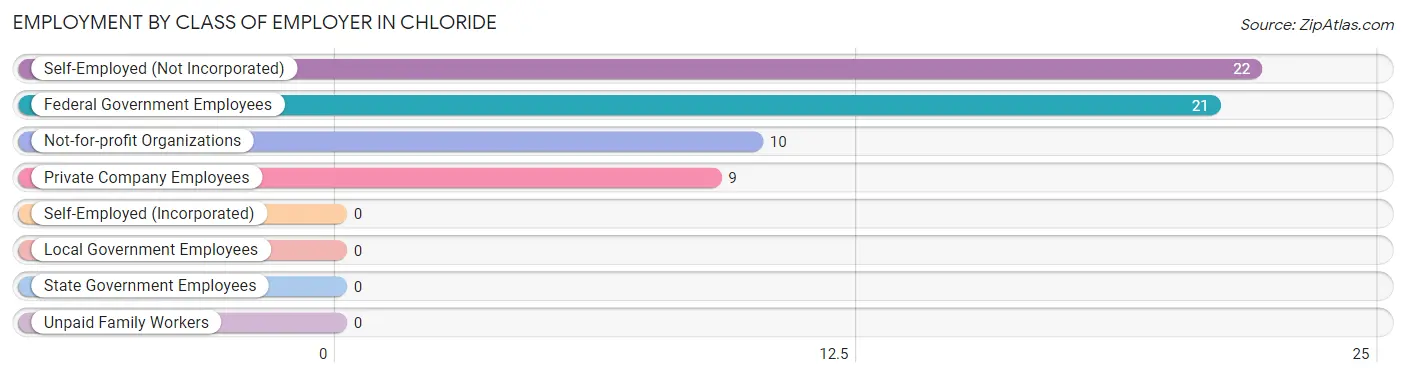
| Employer Class | # Employees | % Employees |
| Private Company Employees | 9 | 14.5% |
| Self-Employed (Incorporated) | 0 | 0.0% |
| Self-Employed (Not Incorporated) | 22 | 35.5% |
| Not-for-profit Organizations | 10 | 16.1% |
| Local Government Employees | 0 | 0.0% |
| State Government Employees | 0 | 0.0% |
| Federal Government Employees | 21 | 33.9% |
| Unpaid Family Workers | 0 | 0.0% |
| Total | 62 | 100.0% |
Employment Status by Age in Chloride
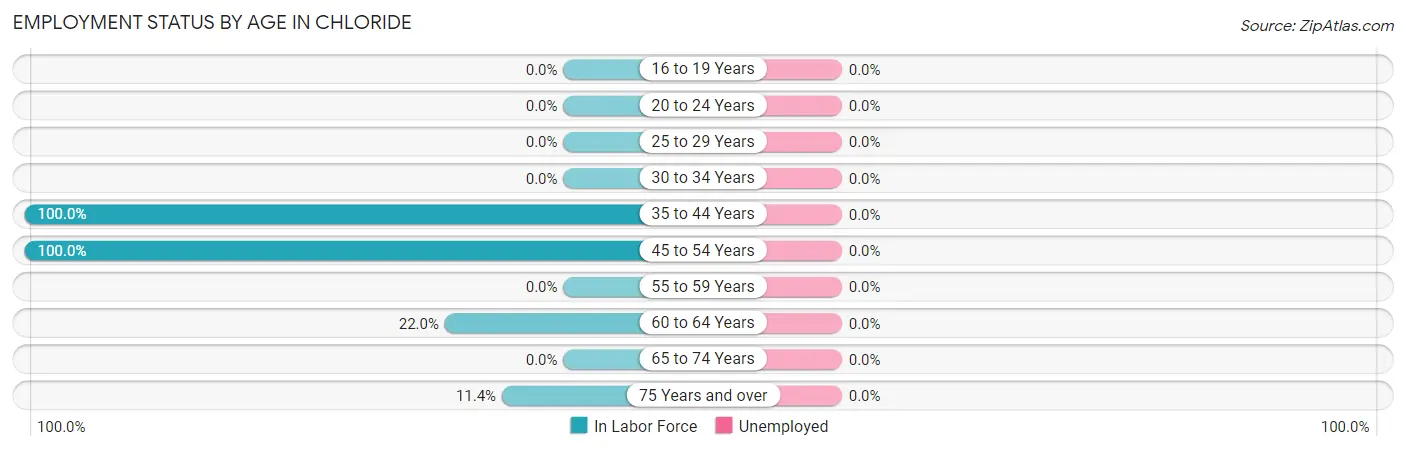
| Age Bracket | In Labor Force | Unemployed |
| 16 to 19 Years | 0 (0.0%) | 0 (0.0%) |
| 20 to 24 Years | 0 (0.0%) | 0 (0.0%) |
| 25 to 29 Years | 0 (0.0%) | 0 (0.0%) |
| 30 to 34 Years | 0 (0.0%) | 0 (0.0%) |
| 35 to 44 Years | 22 (100.0%) | 0 (0.0%) |
| 45 to 54 Years | 21 (100.0%) | 0 (0.0%) |
| 55 to 59 Years | 0 (0.0%) | 0 (0.0%) |
| 60 to 64 Years | 9 (22.0%) | 0 (0.0%) |
| 65 to 74 Years | 0 (0.0%) | 0 (0.0%) |
| 75 Years and over | 10 (11.4%) | 0 (0.0%) |
| Total | 62 (21.6%) | 0 (0.0%) |
Employment Status by Educational Attainment in Chloride
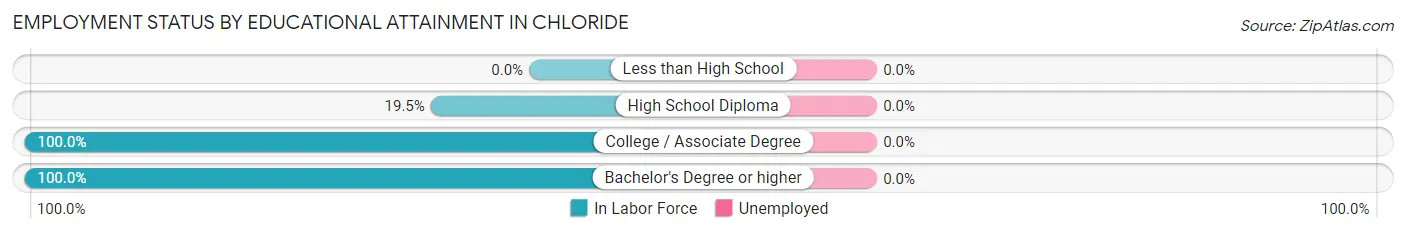
| Educational Attainment | In Labor Force | Unemployed |
| Less than High School | 0 (0.0%) | 0 (0.0%) |
| High School Diploma | 22 (19.5%) | 0 (0.0%) |
| College / Associate Degree | 9 (100.0%) | 0 (0.0%) |
| Bachelor's Degree or higher | 21 (100.0%) | 0 (0.0%) |
| Total | 52 (28.4%) | 0 (0.0%) |
Employment Occupations by Sex in Chloride
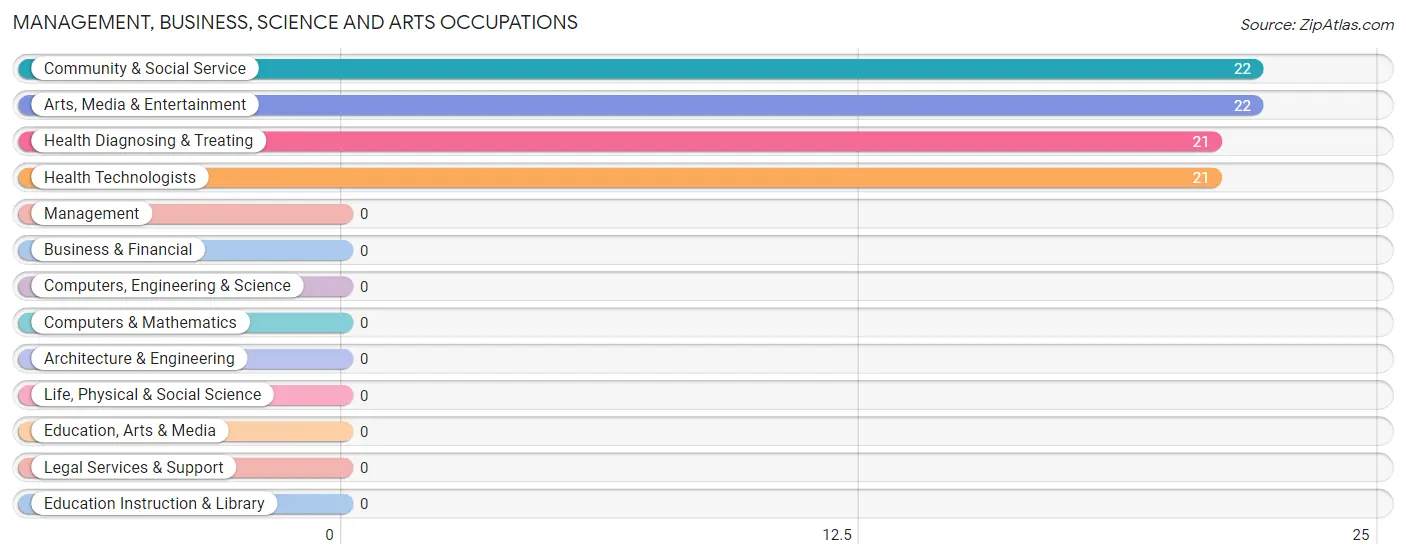
Management, Business, Science and Arts Occupations
The most common Management, Business, Science and Arts occupations in Chloride are Community & Social Service (22 | 35.5%), Arts, Media & Entertainment (22 | 35.5%), Health Diagnosing & Treating (21 | 33.9%), and Health Technologists (21 | 33.9%).
Management, Business, Science and Arts Occupations by Sex
Within the Management, Business, Science and Arts occupations in Chloride, the most male-oriented occupations are Community & Social Service (100.0%), and Arts, Media & Entertainment (100.0%), while the most female-oriented occupations are Health Diagnosing & Treating (100.0%), and Health Technologists (100.0%).
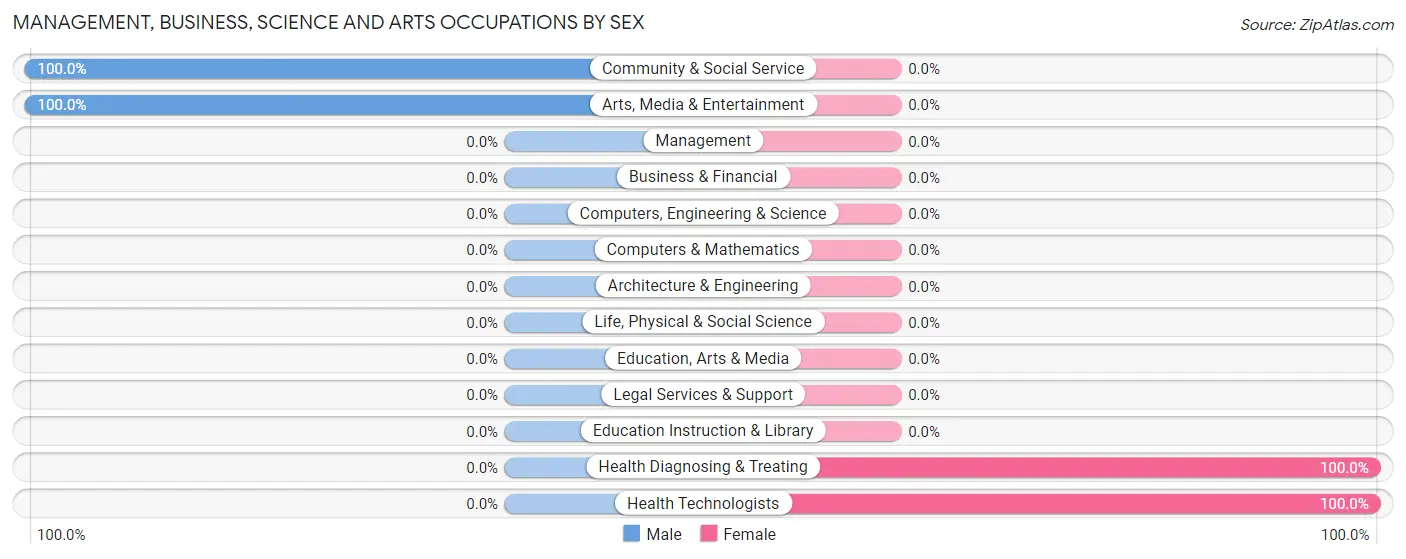
| Occupation | Male | Female |
| Management | 0 (0.0%) | 0 (0.0%) |
| Business & Financial | 0 (0.0%) | 0 (0.0%) |
| Computers, Engineering & Science | 0 (0.0%) | 0 (0.0%) |
| Computers & Mathematics | 0 (0.0%) | 0 (0.0%) |
| Architecture & Engineering | 0 (0.0%) | 0 (0.0%) |
| Life, Physical & Social Science | 0 (0.0%) | 0 (0.0%) |
| Community & Social Service | 22 (100.0%) | 0 (0.0%) |
| Education, Arts & Media | 0 (0.0%) | 0 (0.0%) |
| Legal Services & Support | 0 (0.0%) | 0 (0.0%) |
| Education Instruction & Library | 0 (0.0%) | 0 (0.0%) |
| Arts, Media & Entertainment | 22 (100.0%) | 0 (0.0%) |
| Health Diagnosing & Treating | 0 (0.0%) | 21 (100.0%) |
| Health Technologists | 0 (0.0%) | 21 (100.0%) |
| Total (Category) | 22 (51.2%) | 21 (48.8%) |
| Total (Overall) | 41 (66.1%) | 21 (33.9%) |
Services Occupations
The most common Services occupations in Chloride are , and Cleaning & Maintenance (9 | 14.5%).
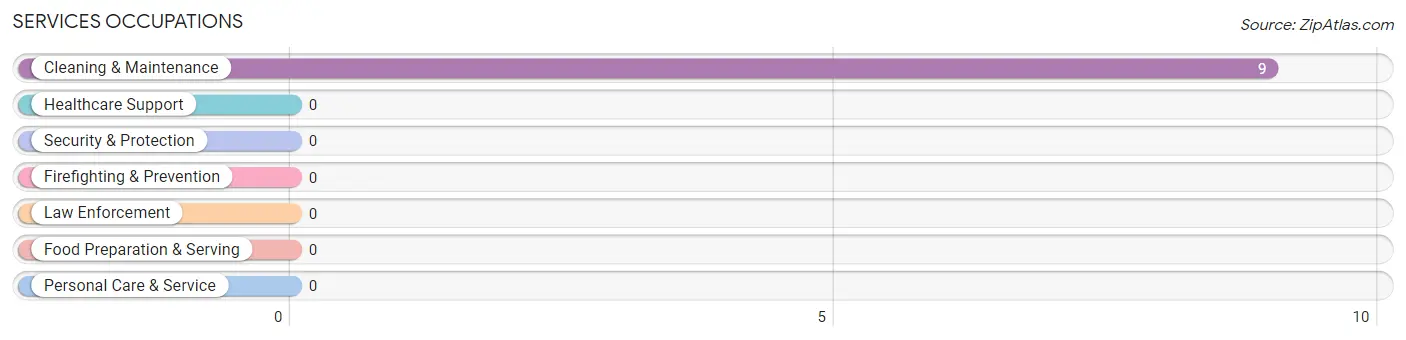
Services Occupations by Sex
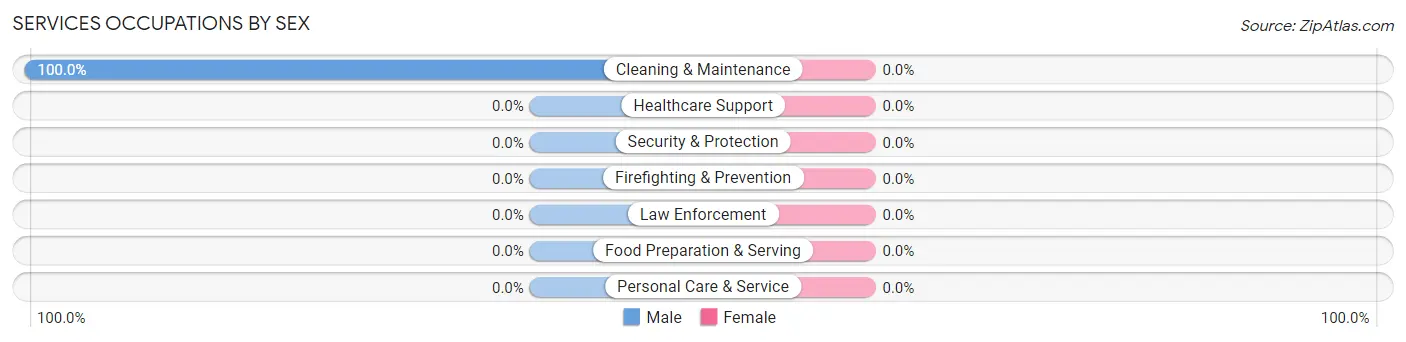
| Occupation | Male | Female |
| Healthcare Support | 0 (0.0%) | 0 (0.0%) |
| Security & Protection | 0 (0.0%) | 0 (0.0%) |
| Firefighting & Prevention | 0 (0.0%) | 0 (0.0%) |
| Law Enforcement | 0 (0.0%) | 0 (0.0%) |
| Food Preparation & Serving | 0 (0.0%) | 0 (0.0%) |
| Cleaning & Maintenance | 9 (100.0%) | 0 (0.0%) |
| Personal Care & Service | 0 (0.0%) | 0 (0.0%) |
| Total (Category) | 9 (100.0%) | 0 (0.0%) |
| Total (Overall) | 41 (66.1%) | 21 (33.9%) |
Sales and Office Occupations
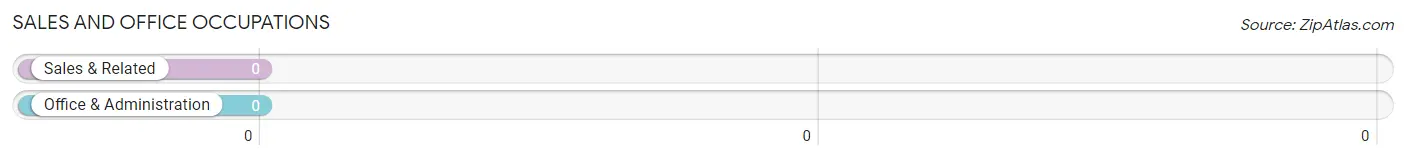
Sales and Office Occupations by Sex
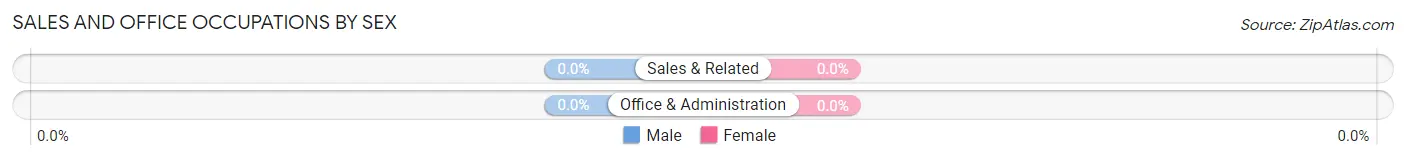
| Occupation | Male | Female |
| Sales & Related | 0 (0.0%) | 0 (0.0%) |
| Office & Administration | 0 (0.0%) | 0 (0.0%) |
| Total (Category) | 0 (0.0%) | 0 (0.0%) |
| Total (Overall) | 41 (66.1%) | 21 (33.9%) |
Natural Resources, Construction and Maintenance Occupations
Natural Resources, Construction and Maintenance Occupations by Sex
| Occupation | Male | Female |
| Farming, Fishing & Forestry | 0 (0.0%) | 0 (0.0%) |
| Construction & Extraction | 0 (0.0%) | 0 (0.0%) |
| Installation, Maintenance & Repair | 0 (0.0%) | 0 (0.0%) |
| Total (Category) | 0 (0.0%) | 0 (0.0%) |
| Total (Overall) | 41 (66.1%) | 21 (33.9%) |
Production, Transportation and Moving Occupations
The most common Production, Transportation and Moving occupations in Chloride are , and Transportation (10 | 16.1%).
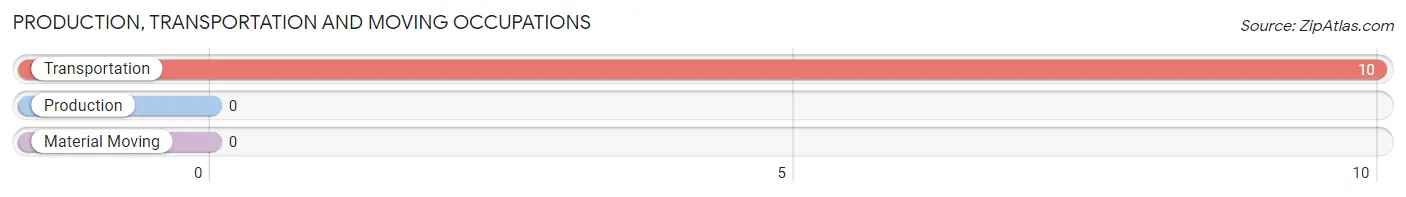
Production, Transportation and Moving Occupations by Sex
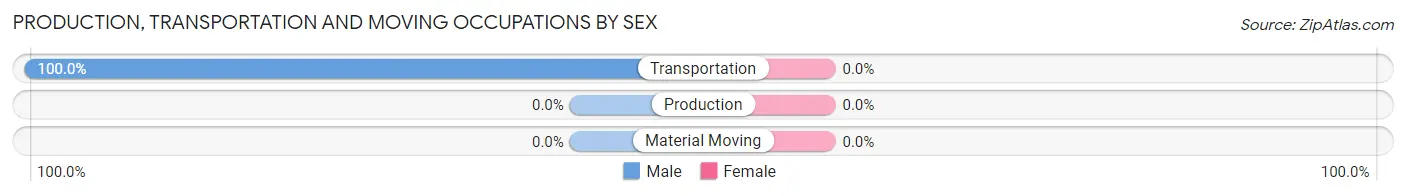
| Occupation | Male | Female |
| Production | 0 (0.0%) | 0 (0.0%) |
| Transportation | 10 (100.0%) | 0 (0.0%) |
| Material Moving | 0 (0.0%) | 0 (0.0%) |
| Total (Category) | 10 (100.0%) | 0 (0.0%) |
| Total (Overall) | 41 (66.1%) | 21 (33.9%) |
Employment Industries by Sex in Chloride
Employment Industries in Chloride
The major employment industries in Chloride include Health Care & Social Assistance (21 | 33.9%), and Mining, Quarrying, & Extraction (9 | 14.5%).
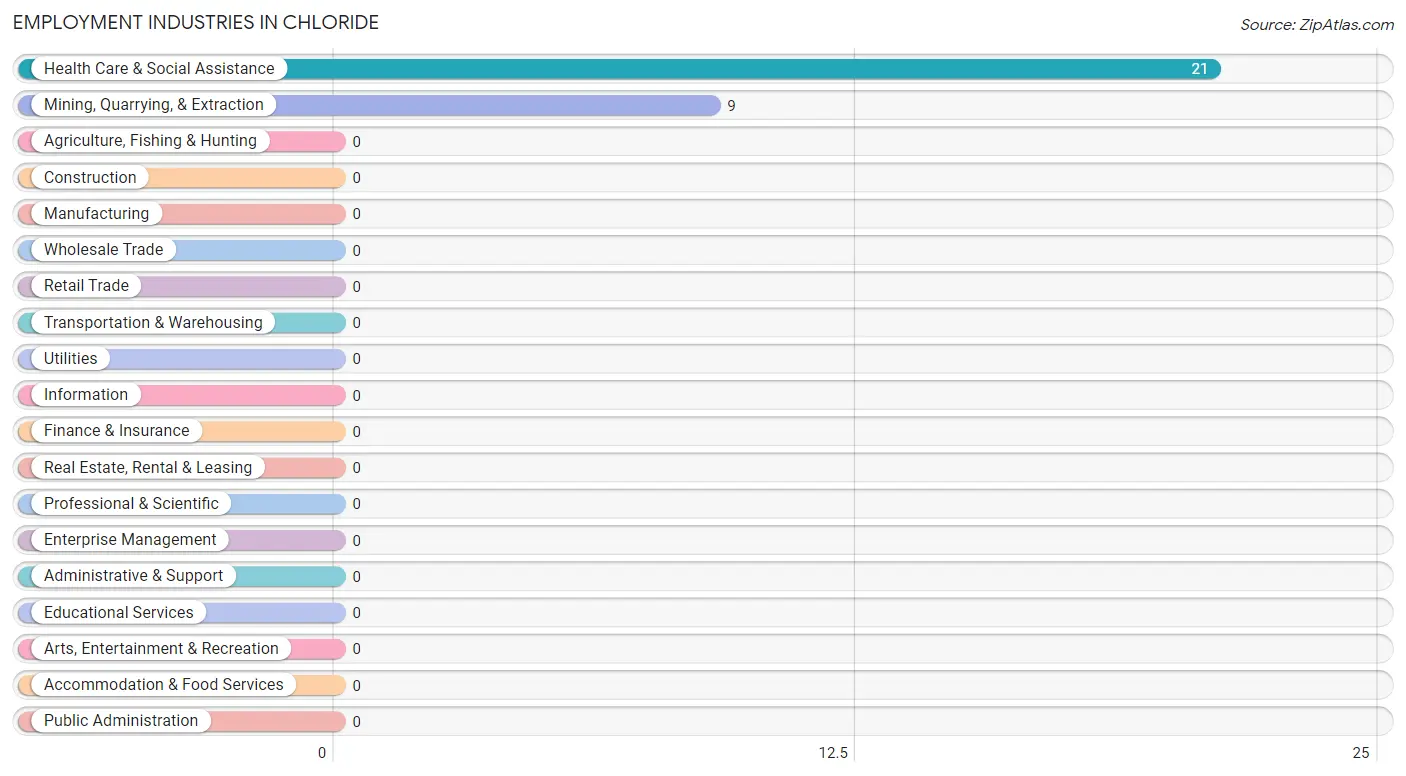
Employment Industries by Sex in Chloride
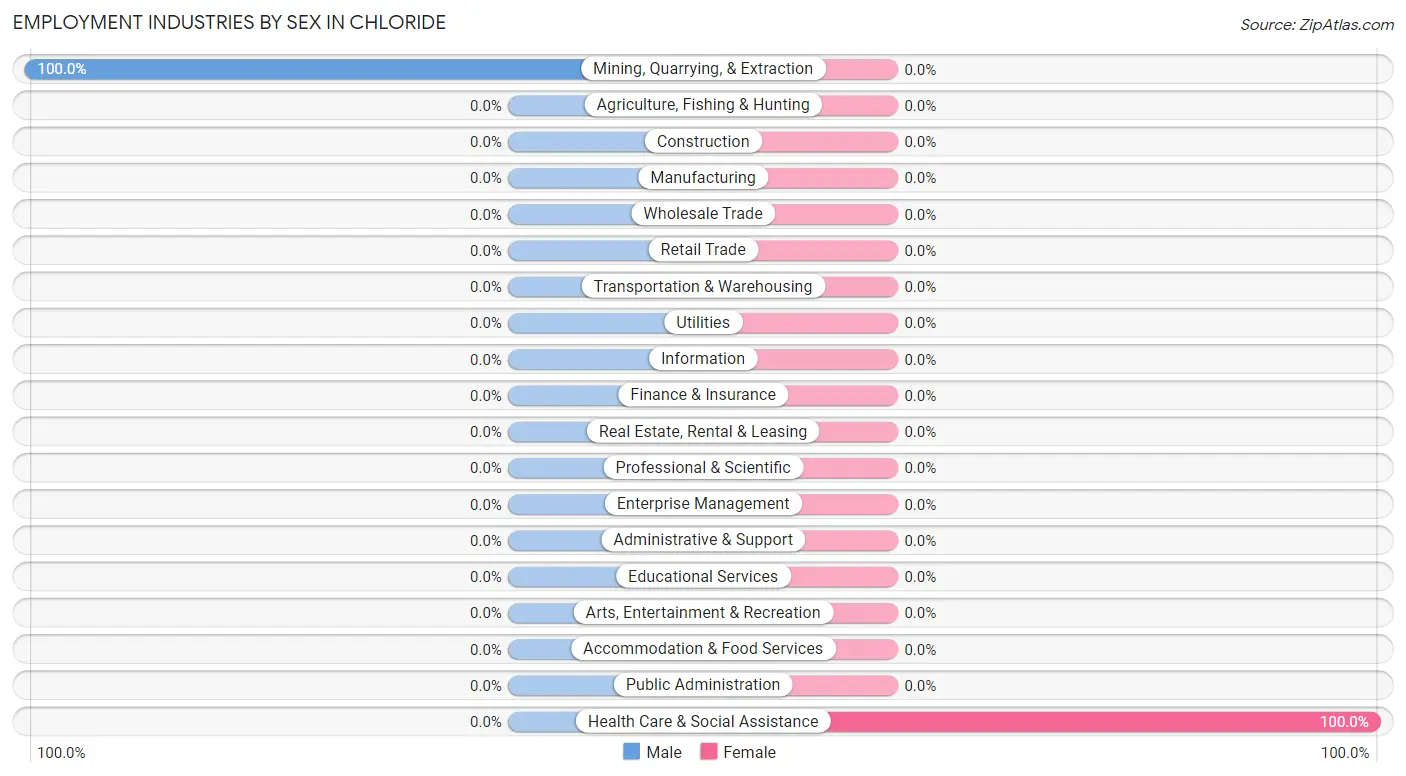
| Industry | Male | Female |
| Agriculture, Fishing & Hunting | 0 (0.0%) | 0 (0.0%) |
| Mining, Quarrying, & Extraction | 9 (100.0%) | 0 (0.0%) |
| Construction | 0 (0.0%) | 0 (0.0%) |
| Manufacturing | 0 (0.0%) | 0 (0.0%) |
| Wholesale Trade | 0 (0.0%) | 0 (0.0%) |
| Retail Trade | 0 (0.0%) | 0 (0.0%) |
| Transportation & Warehousing | 0 (0.0%) | 0 (0.0%) |
| Utilities | 0 (0.0%) | 0 (0.0%) |
| Information | 0 (0.0%) | 0 (0.0%) |
| Finance & Insurance | 0 (0.0%) | 0 (0.0%) |
| Real Estate, Rental & Leasing | 0 (0.0%) | 0 (0.0%) |
| Professional & Scientific | 0 (0.0%) | 0 (0.0%) |
| Enterprise Management | 0 (0.0%) | 0 (0.0%) |
| Administrative & Support | 0 (0.0%) | 0 (0.0%) |
| Educational Services | 0 (0.0%) | 0 (0.0%) |
| Health Care & Social Assistance | 0 (0.0%) | 21 (100.0%) |
| Arts, Entertainment & Recreation | 0 (0.0%) | 0 (0.0%) |
| Accommodation & Food Services | 0 (0.0%) | 0 (0.0%) |
| Public Administration | 0 (0.0%) | 0 (0.0%) |
| Total | 41 (66.1%) | 21 (33.9%) |
Education in Chloride
School Enrollment in Chloride
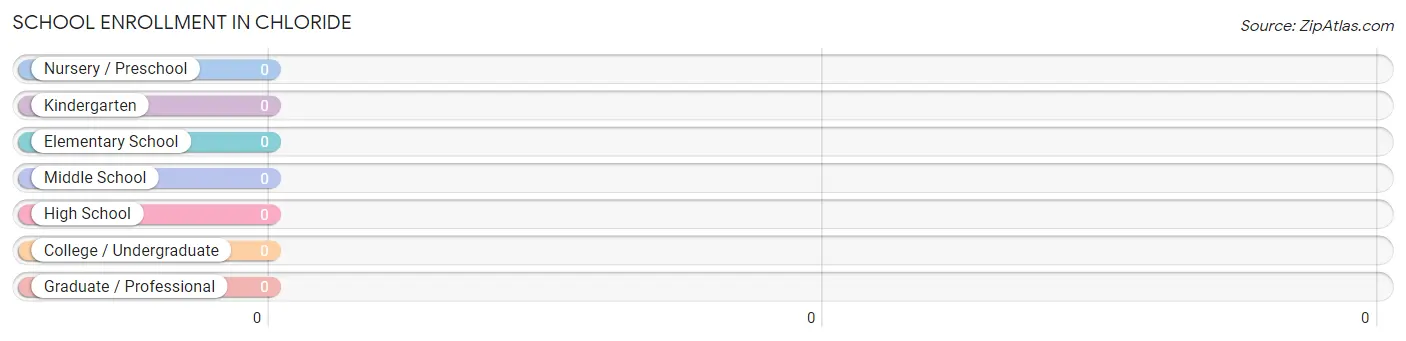
| School Level | # Students | % Students |
| Nursery / Preschool | 0 | 0.0% |
| Kindergarten | 0 | 0.0% |
| Elementary School | 0 | 0.0% |
| Middle School | 0 | 0.0% |
| High School | 0 | 0.0% |
| College / Undergraduate | 0 | 0.0% |
| Graduate / Professional | 0 | 0.0% |
| Total | 0 | 0.0% |
School Enrollment by Age by Funding Source in Chloride
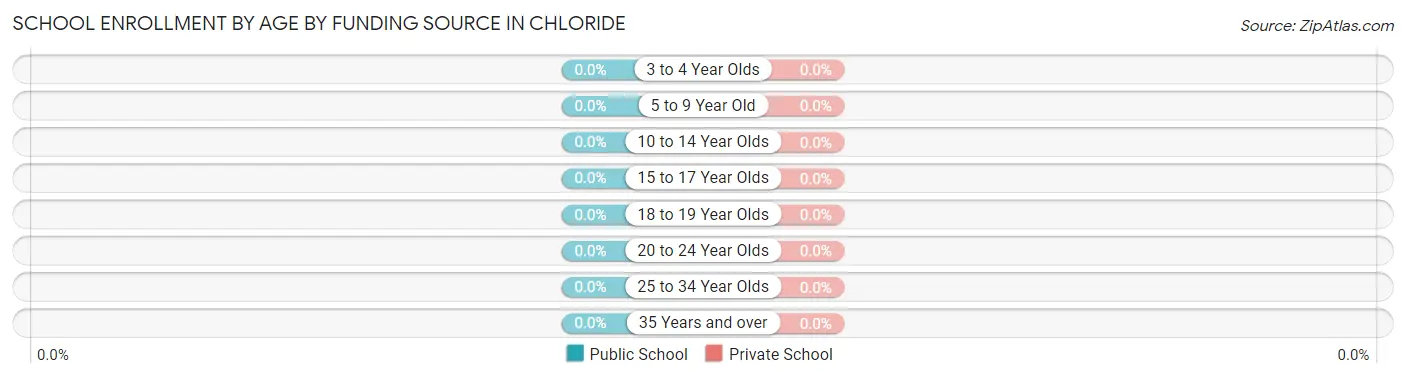
| Age Bracket | Public School | Private School |
| 3 to 4 Year Olds | 0 (0.0%) | 0 (0.0%) |
| 5 to 9 Year Old | 0 (0.0%) | 0 (0.0%) |
| 10 to 14 Year Olds | 0 (0.0%) | 0 (0.0%) |
| 15 to 17 Year Olds | 0 (0.0%) | 0 (0.0%) |
| 18 to 19 Year Olds | 0 (0.0%) | 0 (0.0%) |
| 20 to 24 Year Olds | 0 (0.0%) | 0 (0.0%) |
| 25 to 34 Year Olds | 0 (0.0%) | 0 (0.0%) |
| 35 Years and over | 0 (0.0%) | 0 (0.0%) |
| Total | 0 (0.0%) | 0 (0.0%) |
Educational Attainment by Field of Study in Chloride
Science & technology (21 | 50.0%), and liberal arts & history (21 | 50.0%) are the most common fields of study among 42 individuals in Chloride who have obtained a bachelor's degree or higher.
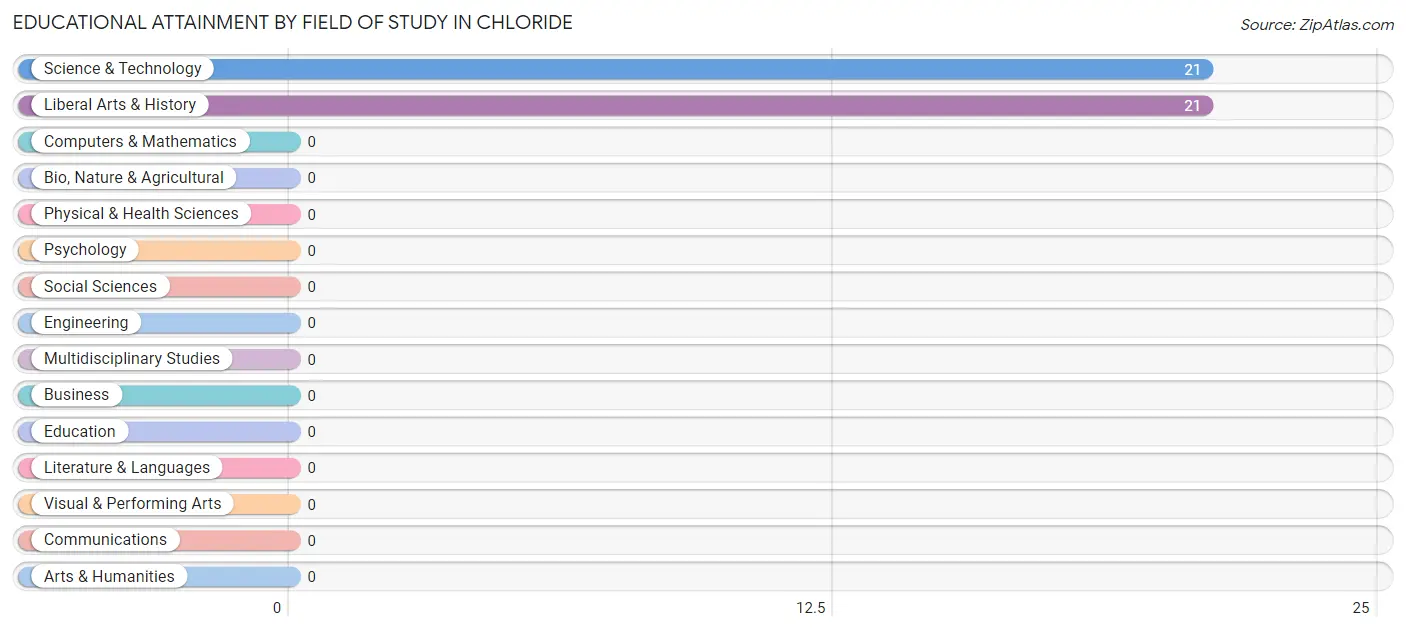
| Field of Study | # Graduates | % Graduates |
| Computers & Mathematics | 0 | 0.0% |
| Bio, Nature & Agricultural | 0 | 0.0% |
| Physical & Health Sciences | 0 | 0.0% |
| Psychology | 0 | 0.0% |
| Social Sciences | 0 | 0.0% |
| Engineering | 0 | 0.0% |
| Multidisciplinary Studies | 0 | 0.0% |
| Science & Technology | 21 | 50.0% |
| Business | 0 | 0.0% |
| Education | 0 | 0.0% |
| Literature & Languages | 0 | 0.0% |
| Liberal Arts & History | 21 | 50.0% |
| Visual & Performing Arts | 0 | 0.0% |
| Communications | 0 | 0.0% |
| Arts & Humanities | 0 | 0.0% |
| Total | 42 | 100.0% |
Transportation & Commute in Chloride
Vehicle Availability by Sex in Chloride
The most prevalent vehicle ownership categories in Chloride are males with no vehicle (22, accounting for 53.7%) and females with no vehicle (0, making up 104.8%).
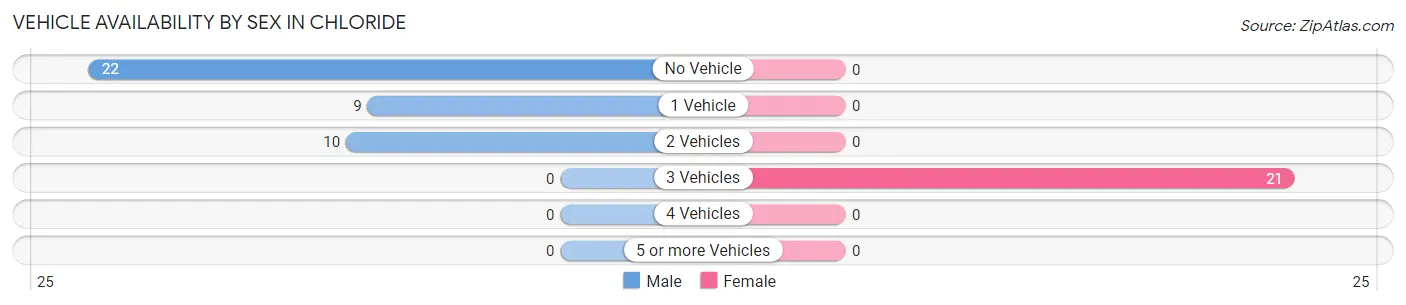
| Vehicles Available | Male | Female |
| No Vehicle | 22 (53.7%) | 0 (0.0%) |
| 1 Vehicle | 9 (22.0%) | 0 (0.0%) |
| 2 Vehicles | 10 (24.4%) | 0 (0.0%) |
| 3 Vehicles | 0 (0.0%) | 21 (100.0%) |
| 4 Vehicles | 0 (0.0%) | 0 (0.0%) |
| 5 or more Vehicles | 0 (0.0%) | 0 (0.0%) |
| Total | 41 (100.0%) | 21 (100.0%) |
Commute Time in Chloride
The most frequently occuring commute durations in Chloride are 30 to 34 minutes (21 commuters, 52.5%), 5 to 9 minutes (10 commuters, 25.0%), and 15 to 19 minutes (9 commuters, 22.5%).
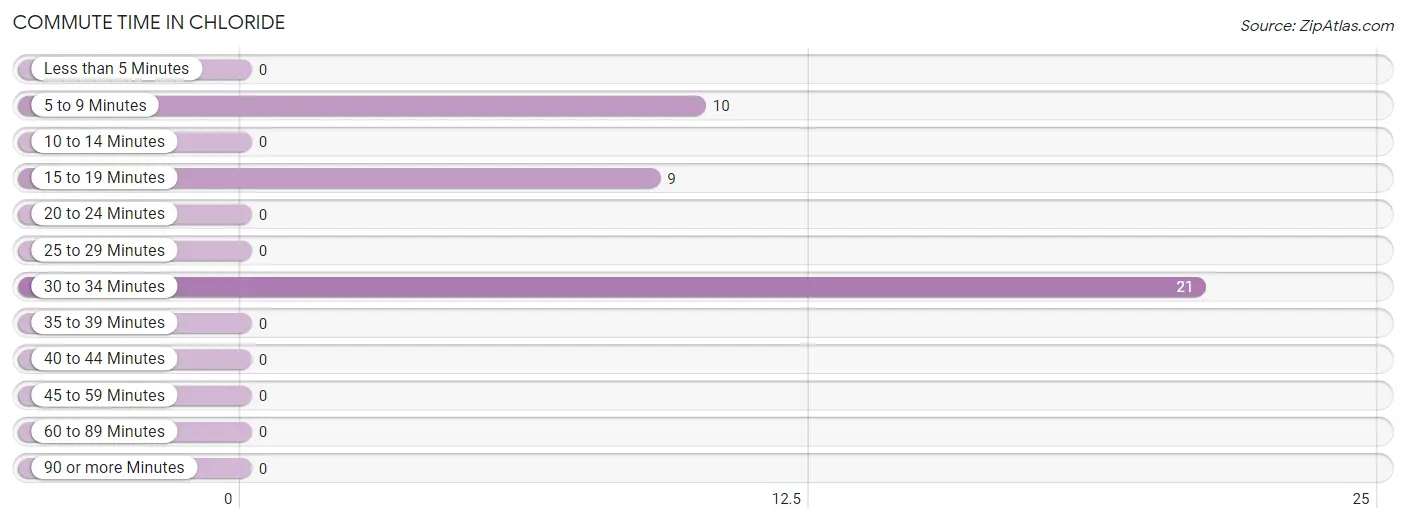
| Commute Time | # Commuters | % Commuters |
| Less than 5 Minutes | 0 | 0.0% |
| 5 to 9 Minutes | 10 | 25.0% |
| 10 to 14 Minutes | 0 | 0.0% |
| 15 to 19 Minutes | 9 | 22.5% |
| 20 to 24 Minutes | 0 | 0.0% |
| 25 to 29 Minutes | 0 | 0.0% |
| 30 to 34 Minutes | 21 | 52.5% |
| 35 to 39 Minutes | 0 | 0.0% |
| 40 to 44 Minutes | 0 | 0.0% |
| 45 to 59 Minutes | 0 | 0.0% |
| 60 to 89 Minutes | 0 | 0.0% |
| 90 or more Minutes | 0 | 0.0% |
Commute Time by Sex in Chloride
The most common commute times in Chloride are 5 to 9 minutes (10 commuters, 52.6%) for males and 30 to 34 minutes (21 commuters, 100.0%) for females.
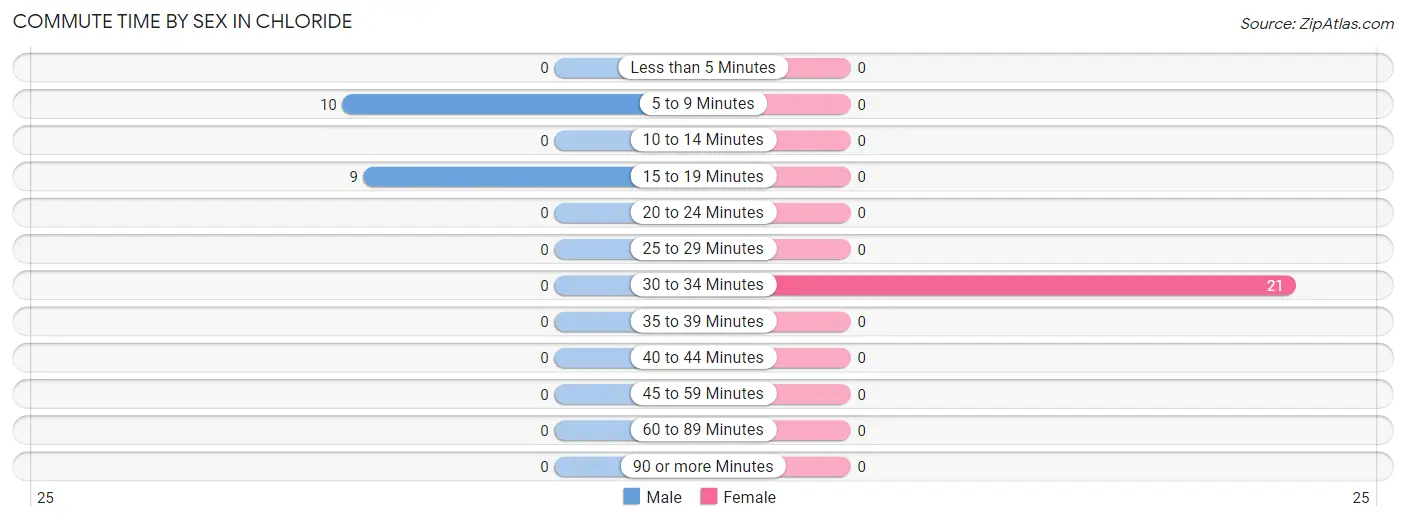
| Commute Time | Male | Female |
| Less than 5 Minutes | 0 (0.0%) | 0 (0.0%) |
| 5 to 9 Minutes | 10 (52.6%) | 0 (0.0%) |
| 10 to 14 Minutes | 0 (0.0%) | 0 (0.0%) |
| 15 to 19 Minutes | 9 (47.4%) | 0 (0.0%) |
| 20 to 24 Minutes | 0 (0.0%) | 0 (0.0%) |
| 25 to 29 Minutes | 0 (0.0%) | 0 (0.0%) |
| 30 to 34 Minutes | 0 (0.0%) | 21 (100.0%) |
| 35 to 39 Minutes | 0 (0.0%) | 0 (0.0%) |
| 40 to 44 Minutes | 0 (0.0%) | 0 (0.0%) |
| 45 to 59 Minutes | 0 (0.0%) | 0 (0.0%) |
| 60 to 89 Minutes | 0 (0.0%) | 0 (0.0%) |
| 90 or more Minutes | 0 (0.0%) | 0 (0.0%) |
Time of Departure to Work by Sex in Chloride
The most frequent times of departure to work in Chloride are 9:00 AM to 9:59 AM (10, 52.6%) for males and 7:00 AM to 7:29 AM (21, 100.0%) for females.
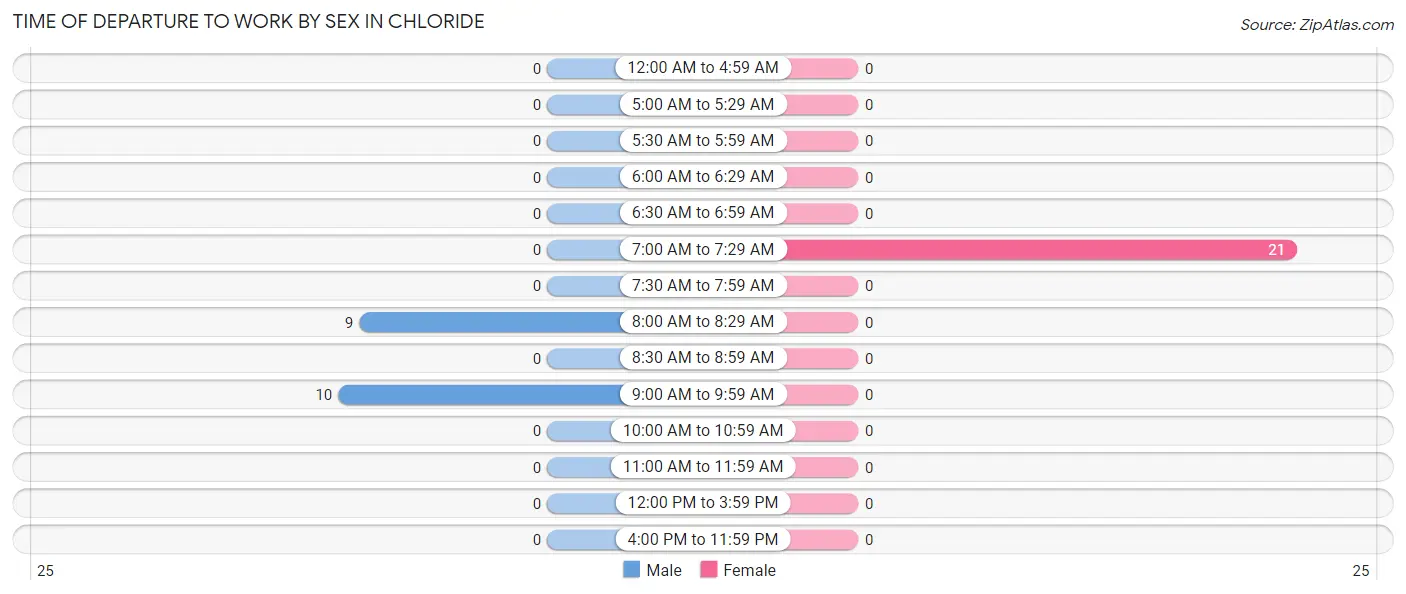
| Time of Departure | Male | Female |
| 12:00 AM to 4:59 AM | 0 (0.0%) | 0 (0.0%) |
| 5:00 AM to 5:29 AM | 0 (0.0%) | 0 (0.0%) |
| 5:30 AM to 5:59 AM | 0 (0.0%) | 0 (0.0%) |
| 6:00 AM to 6:29 AM | 0 (0.0%) | 0 (0.0%) |
| 6:30 AM to 6:59 AM | 0 (0.0%) | 0 (0.0%) |
| 7:00 AM to 7:29 AM | 0 (0.0%) | 21 (100.0%) |
| 7:30 AM to 7:59 AM | 0 (0.0%) | 0 (0.0%) |
| 8:00 AM to 8:29 AM | 9 (47.4%) | 0 (0.0%) |
| 8:30 AM to 8:59 AM | 0 (0.0%) | 0 (0.0%) |
| 9:00 AM to 9:59 AM | 10 (52.6%) | 0 (0.0%) |
| 10:00 AM to 10:59 AM | 0 (0.0%) | 0 (0.0%) |
| 11:00 AM to 11:59 AM | 0 (0.0%) | 0 (0.0%) |
| 12:00 PM to 3:59 PM | 0 (0.0%) | 0 (0.0%) |
| 4:00 PM to 11:59 PM | 0 (0.0%) | 0 (0.0%) |
| Total | 19 (100.0%) | 21 (100.0%) |
Housing Occupancy in Chloride
Occupancy by Ownership in Chloride
Of the total 184 dwellings in Chloride, owner-occupied units account for 109 (59.2%), while renter-occupied units make up 75 (40.8%).
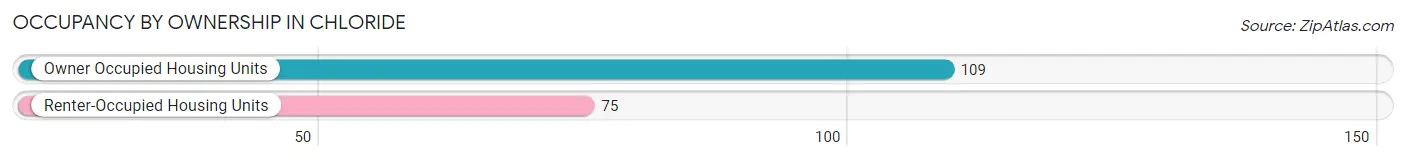
| Occupancy | # Housing Units | % Housing Units |
| Owner Occupied Housing Units | 109 | 59.2% |
| Renter-Occupied Housing Units | 75 | 40.8% |
| Total Occupied Housing Units | 184 | 100.0% |
Occupancy by Household Size in Chloride
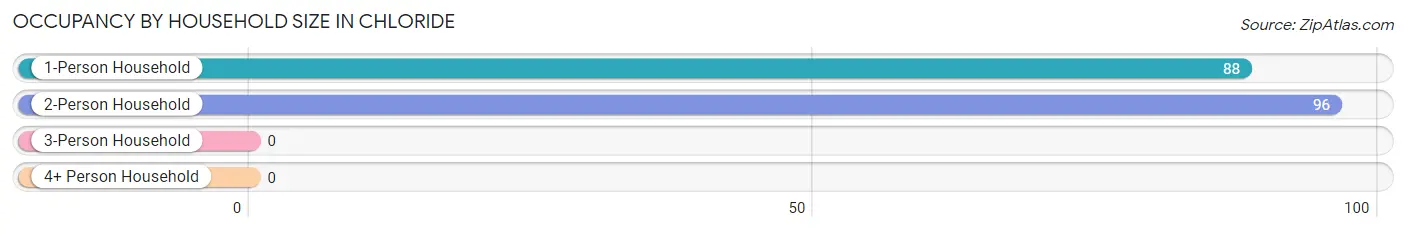
| Household Size | # Housing Units | % Housing Units |
| 1-Person Household | 88 | 47.8% |
| 2-Person Household | 96 | 52.2% |
| 3-Person Household | 0 | 0.0% |
| 4+ Person Household | 0 | 0.0% |
| Total Housing Units | 184 | 100.0% |
Occupancy by Ownership by Household Size in Chloride
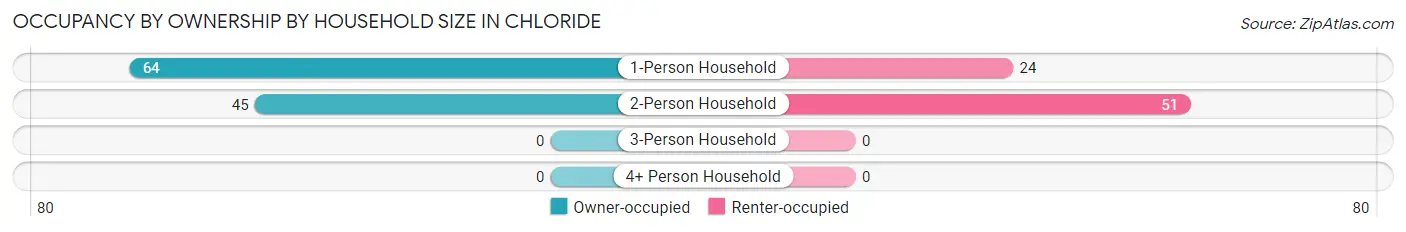
| Household Size | Owner-occupied | Renter-occupied |
| 1-Person Household | 64 (72.7%) | 24 (27.3%) |
| 2-Person Household | 45 (46.9%) | 51 (53.1%) |
| 3-Person Household | 0 (0.0%) | 0 (0.0%) |
| 4+ Person Household | 0 (0.0%) | 0 (0.0%) |
| Total Housing Units | 109 (59.2%) | 75 (40.8%) |
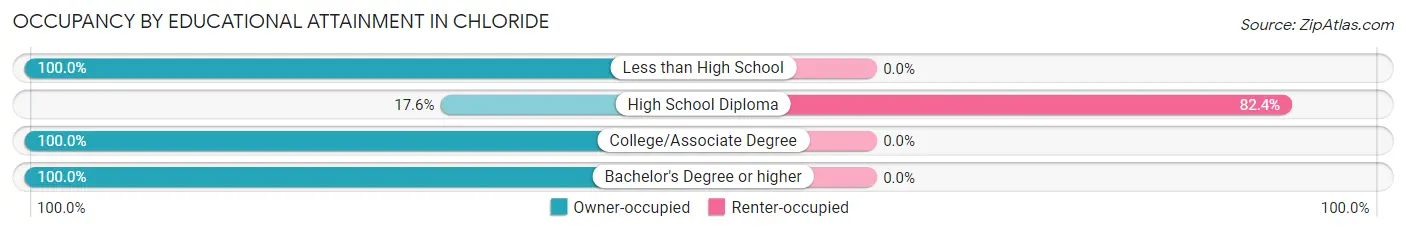
Occupancy by Educational Attainment in Chloride
| Household Size | Owner-occupied | Renter-occupied |
| Less than High School | 26 (100.0%) | 0 (0.0%) |
| High School Diploma | 16 (17.6%) | 75 (82.4%) |
| College/Associate Degree | 46 (100.0%) | 0 (0.0%) |
| Bachelor's Degree or higher | 21 (100.0%) | 0 (0.0%) |
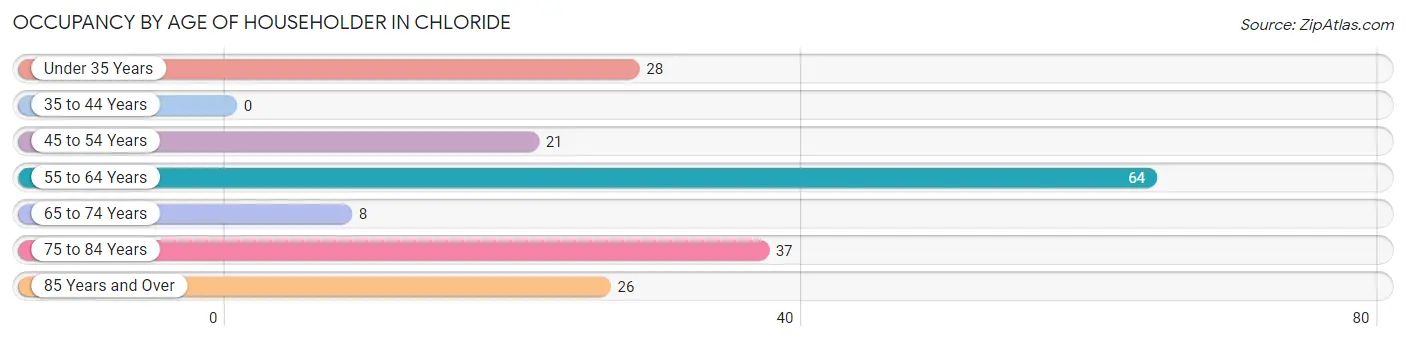
Occupancy by Age of Householder in Chloride
| Age Bracket | # Households | % Households |
| Under 35 Years | 28 | 15.2% |
| 35 to 44 Years | 0 | 0.0% |
| 45 to 54 Years | 21 | 11.4% |
| 55 to 64 Years | 64 | 34.8% |
| 65 to 74 Years | 8 | 4.3% |
| 75 to 84 Years | 37 | 20.1% |
| 85 Years and Over | 26 | 14.1% |
| Total | 184 | 100.0% |
Housing Finances in Chloride
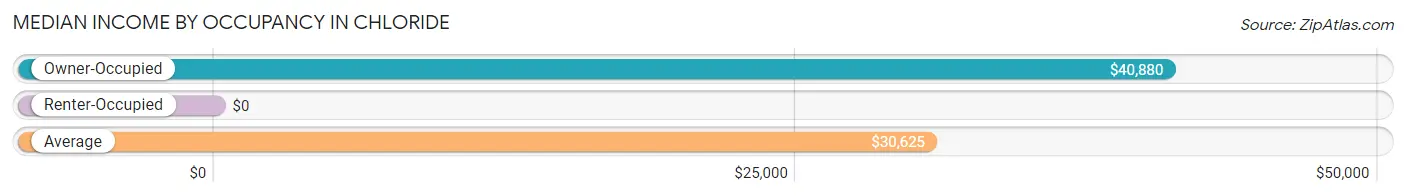
Median Income by Occupancy in Chloride
| Occupancy Type | # Households | Median Income |
| Owner-Occupied | 109 (59.2%) | $40,880 |
| Renter-Occupied | 75 (40.8%) | $0 |
| Average | 184 (100.0%) | $30,625 |
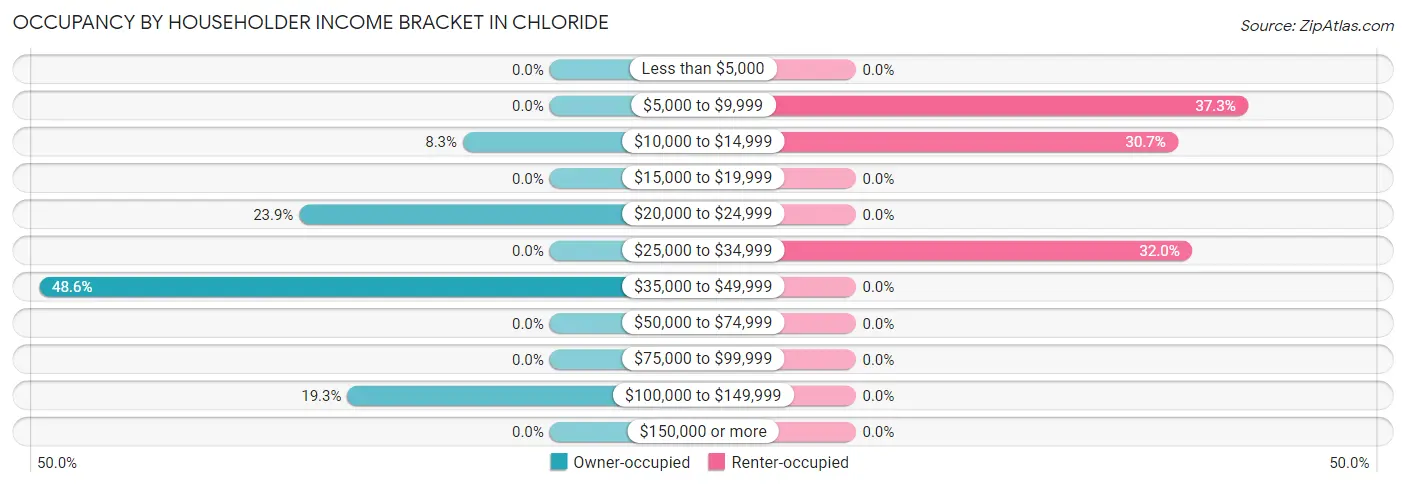
Occupancy by Householder Income Bracket in Chloride
| Income Bracket | Owner-occupied | Renter-occupied |
| Less than $5,000 | 0 (0.0%) | 0 (0.0%) |
| $5,000 to $9,999 | 0 (0.0%) | 28 (37.3%) |
| $10,000 to $14,999 | 9 (8.3%) | 23 (30.7%) |
| $15,000 to $19,999 | 0 (0.0%) | 0 (0.0%) |
| $20,000 to $24,999 | 26 (23.8%) | 0 (0.0%) |
| $25,000 to $34,999 | 0 (0.0%) | 24 (32.0%) |
| $35,000 to $49,999 | 53 (48.6%) | 0 (0.0%) |
| $50,000 to $74,999 | 0 (0.0%) | 0 (0.0%) |
| $75,000 to $99,999 | 0 (0.0%) | 0 (0.0%) |
| $100,000 to $149,999 | 21 (19.3%) | 0 (0.0%) |
| $150,000 or more | 0 (0.0%) | 0 (0.0%) |
| Total | 109 (100.0%) | 75 (100.0%) |
Monthly Housing Cost Tiers in Chloride
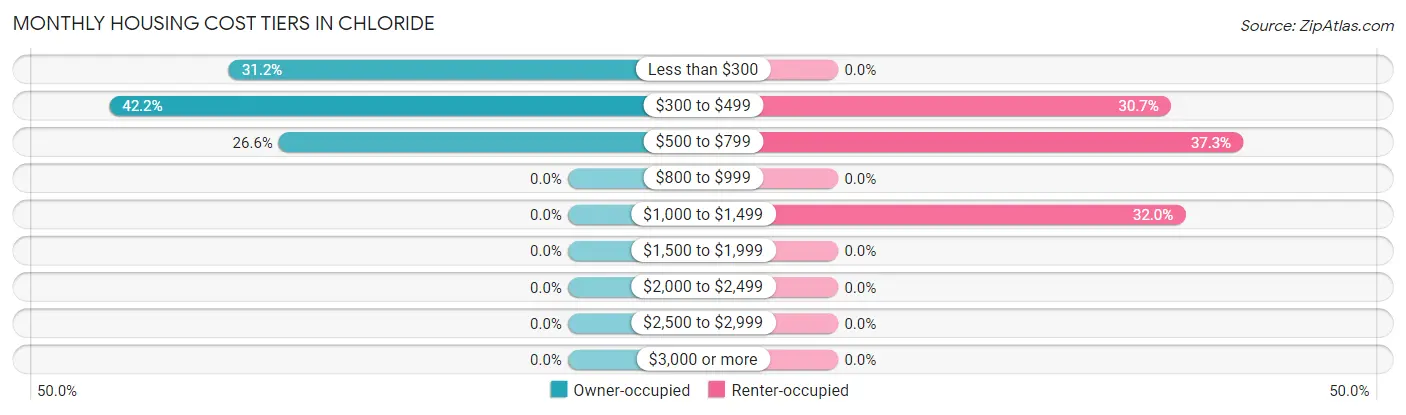
| Monthly Cost | Owner-occupied | Renter-occupied |
| Less than $300 | 34 (31.2%) | 0 (0.0%) |
| $300 to $499 | 46 (42.2%) | 23 (30.7%) |
| $500 to $799 | 29 (26.6%) | 28 (37.3%) |
| $800 to $999 | 0 (0.0%) | 0 (0.0%) |
| $1,000 to $1,499 | 0 (0.0%) | 24 (32.0%) |
| $1,500 to $1,999 | 0 (0.0%) | 0 (0.0%) |
| $2,000 to $2,499 | 0 (0.0%) | 0 (0.0%) |
| $2,500 to $2,999 | 0 (0.0%) | 0 (0.0%) |
| $3,000 or more | 0 (0.0%) | 0 (0.0%) |
| Total | 109 (100.0%) | 75 (100.0%) |
Physical Housing Characteristics in Chloride
Housing Structures in Chloride
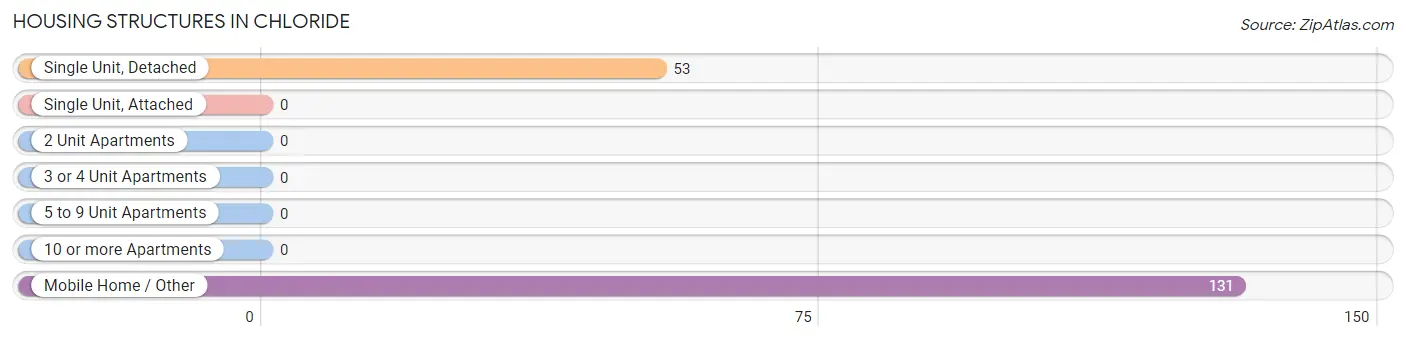
| Structure Type | # Housing Units | % Housing Units |
| Single Unit, Detached | 53 | 28.8% |
| Single Unit, Attached | 0 | 0.0% |
| 2 Unit Apartments | 0 | 0.0% |
| 3 or 4 Unit Apartments | 0 | 0.0% |
| 5 to 9 Unit Apartments | 0 | 0.0% |
| 10 or more Apartments | 0 | 0.0% |
| Mobile Home / Other | 131 | 71.2% |
| Total | 184 | 100.0% |
Housing Structures by Occupancy in Chloride
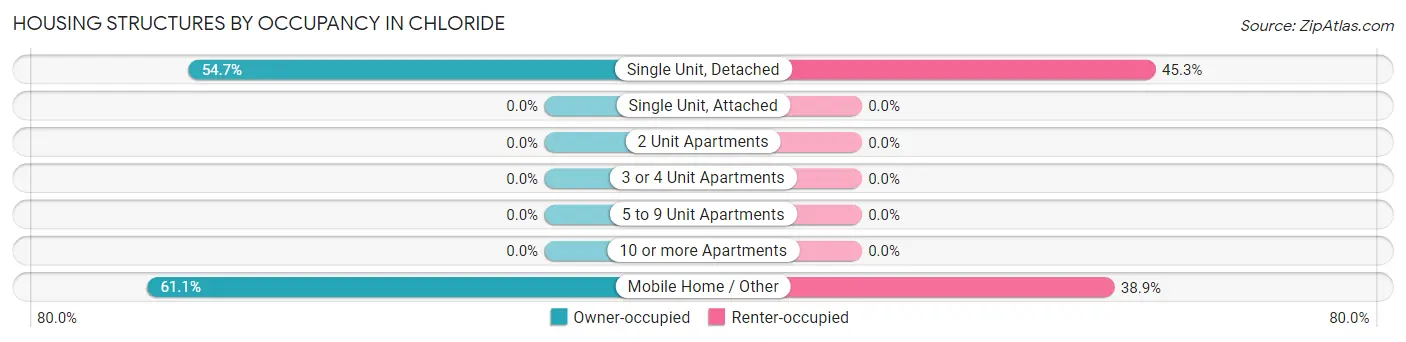
| Structure Type | Owner-occupied | Renter-occupied |
| Single Unit, Detached | 29 (54.7%) | 24 (45.3%) |
| Single Unit, Attached | 0 (0.0%) | 0 (0.0%) |
| 2 Unit Apartments | 0 (0.0%) | 0 (0.0%) |
| 3 or 4 Unit Apartments | 0 (0.0%) | 0 (0.0%) |
| 5 to 9 Unit Apartments | 0 (0.0%) | 0 (0.0%) |
| 10 or more Apartments | 0 (0.0%) | 0 (0.0%) |
| Mobile Home / Other | 80 (61.1%) | 51 (38.9%) |
| Total | 109 (59.2%) | 75 (40.8%) |
Housing Structures by Number of Rooms in Chloride
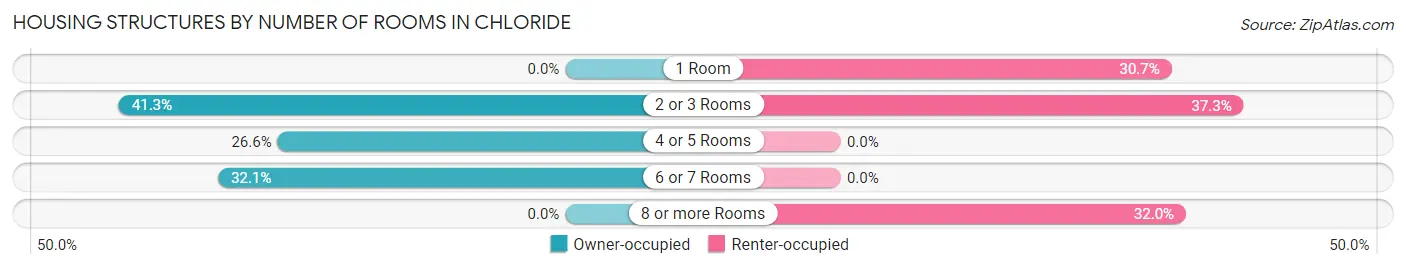
| Number of Rooms | Owner-occupied | Renter-occupied |
| 1 Room | 0 (0.0%) | 23 (30.7%) |
| 2 or 3 Rooms | 45 (41.3%) | 28 (37.3%) |
| 4 or 5 Rooms | 29 (26.6%) | 0 (0.0%) |
| 6 or 7 Rooms | 35 (32.1%) | 0 (0.0%) |
| 8 or more Rooms | 0 (0.0%) | 24 (32.0%) |
| Total | 109 (100.0%) | 75 (100.0%) |
Housing Structure by Heating Type in Chloride
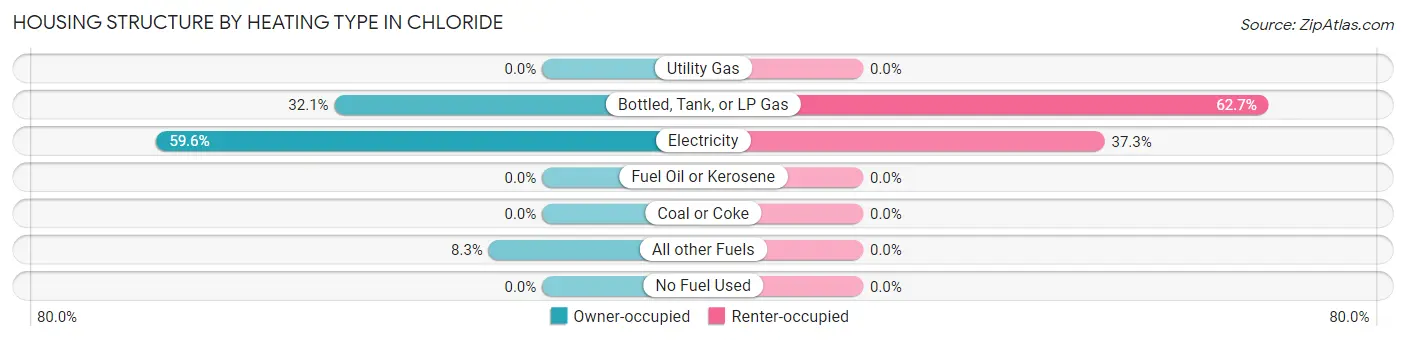
| Heating Type | Owner-occupied | Renter-occupied |
| Utility Gas | 0 (0.0%) | 0 (0.0%) |
| Bottled, Tank, or LP Gas | 35 (32.1%) | 47 (62.7%) |
| Electricity | 65 (59.6%) | 28 (37.3%) |
| Fuel Oil or Kerosene | 0 (0.0%) | 0 (0.0%) |
| Coal or Coke | 0 (0.0%) | 0 (0.0%) |
| All other Fuels | 9 (8.3%) | 0 (0.0%) |
| No Fuel Used | 0 (0.0%) | 0 (0.0%) |
| Total | 109 (100.0%) | 75 (100.0%) |
Household Vehicle Usage in Chloride
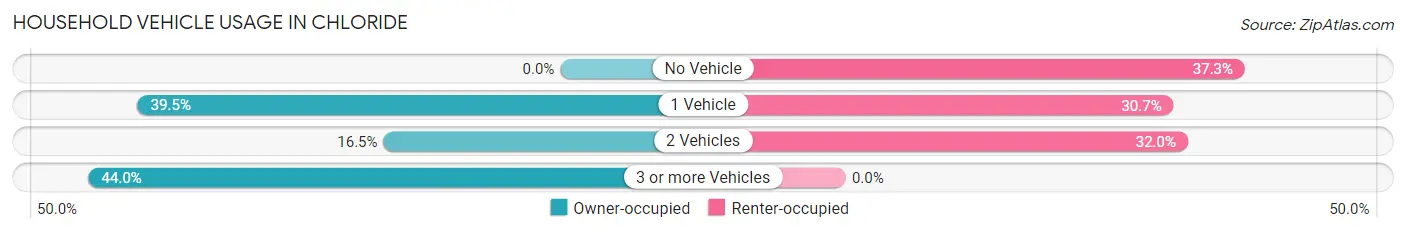
| Vehicles per Household | Owner-occupied | Renter-occupied |
| No Vehicle | 0 (0.0%) | 28 (37.3%) |
| 1 Vehicle | 43 (39.5%) | 23 (30.7%) |
| 2 Vehicles | 18 (16.5%) | 24 (32.0%) |
| 3 or more Vehicles | 48 (44.0%) | 0 (0.0%) |
| Total | 109 (100.0%) | 75 (100.0%) |
Real Estate & Mortgages in Chloride
Real Estate and Mortgage Overview in Chloride
| Characteristic | Without Mortgage | With Mortgage |
| Housing Units | 88 | 21 |
| Median Property Value | - | - |
| Median Household Income | $37,250 | $0 |
| Monthly Housing Costs | $375 | $0 |
| Real Estate Taxes | $1,250 | $0 |
Property Value by Mortgage Status in Chloride
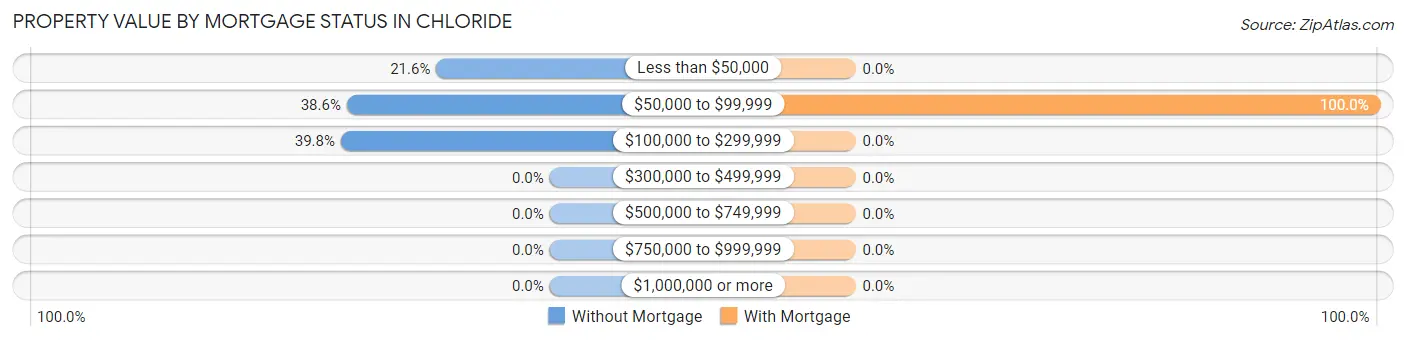
| Property Value | Without Mortgage | With Mortgage |
| Less than $50,000 | 19 (21.6%) | 0 (0.0%) |
| $50,000 to $99,999 | 34 (38.6%) | 21 (100.0%) |
| $100,000 to $299,999 | 35 (39.8%) | 0 (0.0%) |
| $300,000 to $499,999 | 0 (0.0%) | 0 (0.0%) |
| $500,000 to $749,999 | 0 (0.0%) | 0 (0.0%) |
| $750,000 to $999,999 | 0 (0.0%) | 0 (0.0%) |
| $1,000,000 or more | 0 (0.0%) | 0 (0.0%) |
| Total | 88 (100.0%) | 21 (100.0%) |
Household Income by Mortgage Status in Chloride
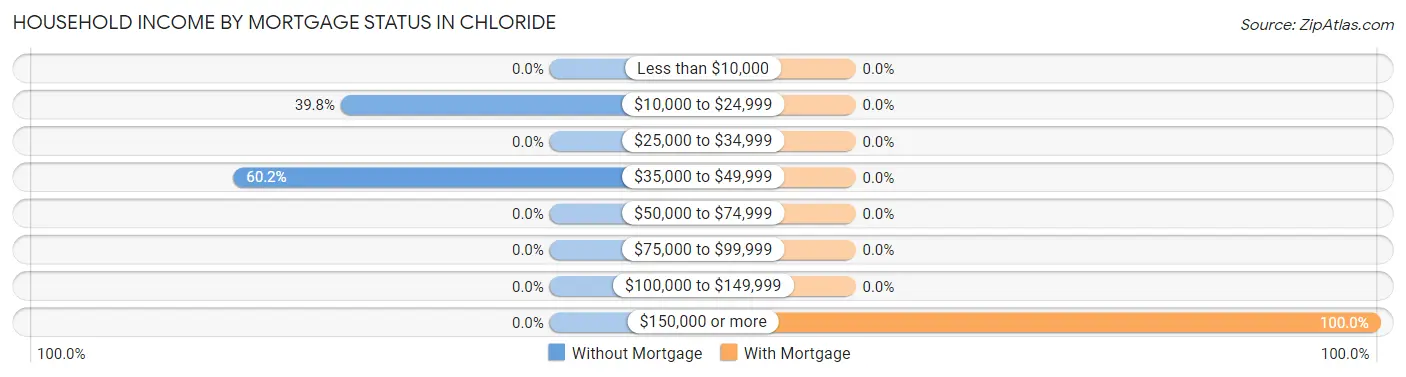
| Household Income | Without Mortgage | With Mortgage |
| Less than $10,000 | 0 (0.0%) | 0 (0.0%) |
| $10,000 to $24,999 | 35 (39.8%) | 0 (0.0%) |
| $25,000 to $34,999 | 0 (0.0%) | 0 (0.0%) |
| $35,000 to $49,999 | 53 (60.2%) | 0 (0.0%) |
| $50,000 to $74,999 | 0 (0.0%) | 0 (0.0%) |
| $75,000 to $99,999 | 0 (0.0%) | 0 (0.0%) |
| $100,000 to $149,999 | 0 (0.0%) | 0 (0.0%) |
| $150,000 or more | 0 (0.0%) | 21 (100.0%) |
| Total | 88 (100.0%) | 21 (100.0%) |
Property Value to Household Income Ratio in Chloride
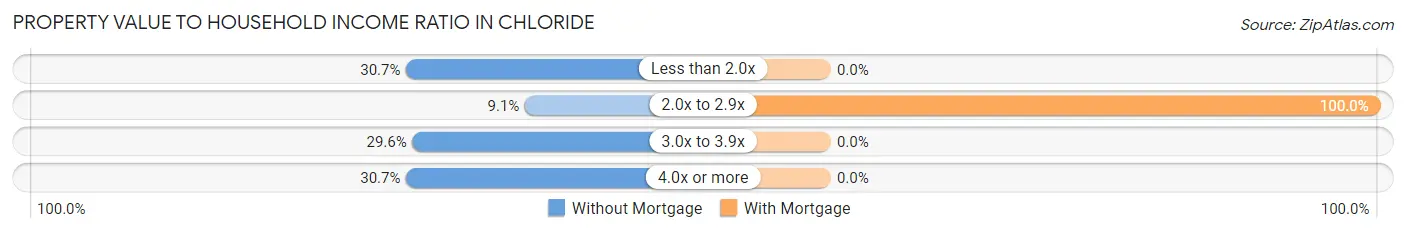
| Value-to-Income Ratio | Without Mortgage | With Mortgage |
| Less than 2.0x | 27 (30.7%) | 0 (0.0%) |
| 2.0x to 2.9x | 8 (9.1%) | 21 (100.0%) |
| 3.0x to 3.9x | 26 (29.5%) | 0 (0.0%) |
| 4.0x or more | 27 (30.7%) | 0 (0.0%) |
| Total | 88 (100.0%) | 21 (100.0%) |
Real Estate Taxes by Mortgage Status in Chloride
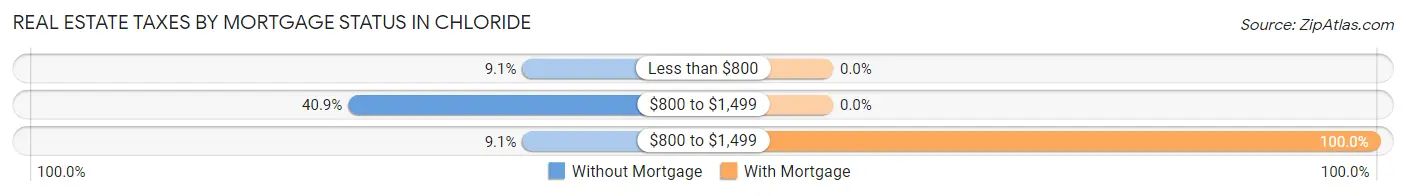
| Property Taxes | Without Mortgage | With Mortgage |
| Less than $800 | 8 (9.1%) | 0 (0.0%) |
| $800 to $1,499 | 36 (40.9%) | 0 (0.0%) |
| $800 to $1,499 | 8 (9.1%) | 21 (100.0%) |
| Total | 88 (100.0%) | 21 (100.0%) |
Health & Disability in Chloride
Health Insurance Coverage by Age in Chloride
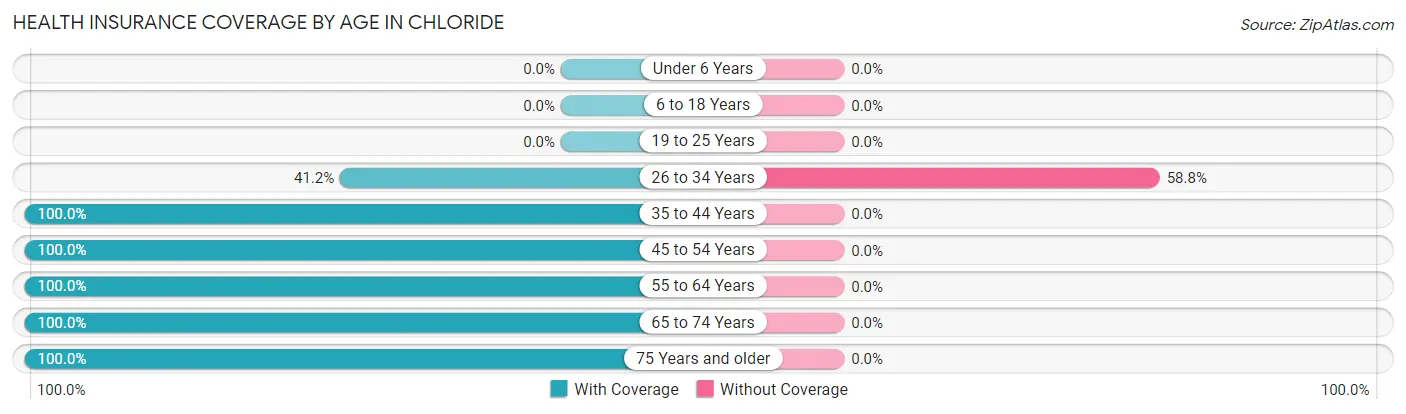
| Age Bracket | With Coverage | Without Coverage |
| Under 6 Years | 0 (0.0%) | 0 (0.0%) |
| 6 to 18 Years | 0 (0.0%) | 0 (0.0%) |
| 19 to 25 Years | 0 (0.0%) | 0 (0.0%) |
| 26 to 34 Years | 28 (41.2%) | 40 (58.8%) |
| 35 to 44 Years | 22 (100.0%) | 0 (0.0%) |
| 45 to 54 Years | 21 (100.0%) | 0 (0.0%) |
| 55 to 64 Years | 72 (100.0%) | 0 (0.0%) |
| 65 to 74 Years | 16 (100.0%) | 0 (0.0%) |
| 75 Years and older | 88 (100.0%) | 0 (0.0%) |
| Total | 247 (86.1%) | 40 (13.9%) |
Health Insurance Coverage by Citizenship Status in Chloride
| Citizenship Status | With Coverage | Without Coverage |
| Native Born | 0 (0.0%) | 0 (0.0%) |
| Foreign Born, Citizen | 0 (0.0%) | 0 (0.0%) |
| Foreign Born, not a Citizen | 0 (0.0%) | 0 (0.0%) |
Health Insurance Coverage by Household Income in Chloride
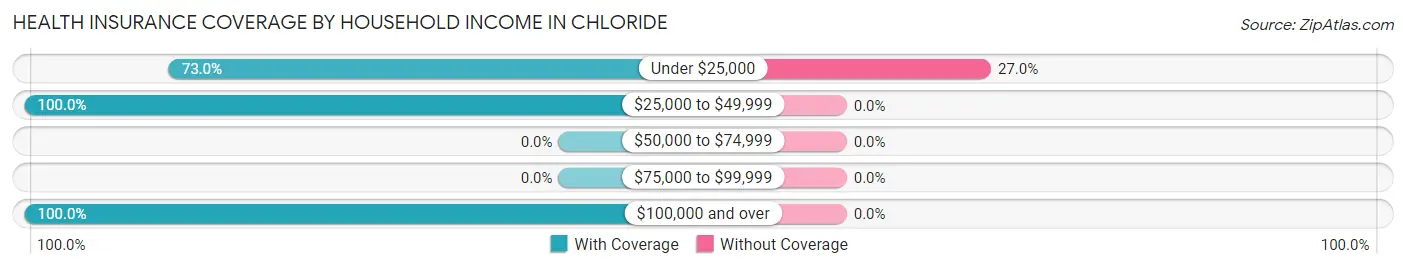
| Household Income | With Coverage | Without Coverage |
| Under $25,000 | 108 (73.0%) | 40 (27.0%) |
| $25,000 to $49,999 | 118 (100.0%) | 0 (0.0%) |
| $50,000 to $74,999 | 0 (0.0%) | 0 (0.0%) |
| $75,000 to $99,999 | 0 (0.0%) | 0 (0.0%) |
| $100,000 and over | 21 (100.0%) | 0 (0.0%) |
Public vs Private Health Insurance Coverage by Age in Chloride
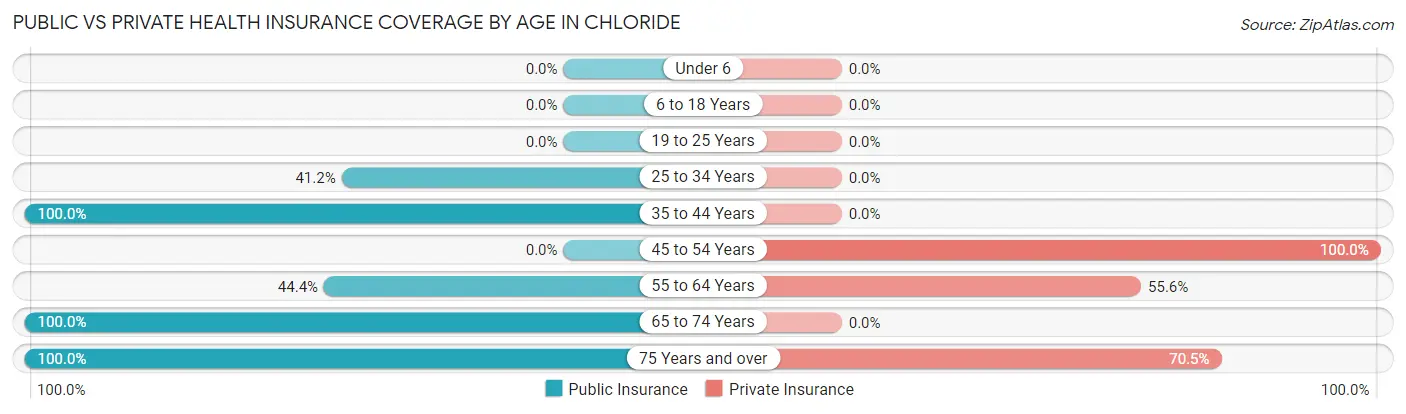
| Age Bracket | Public Insurance | Private Insurance |
| Under 6 | 0 (0.0%) | 0 (0.0%) |
| 6 to 18 Years | 0 (0.0%) | 0 (0.0%) |
| 19 to 25 Years | 0 (0.0%) | 0 (0.0%) |
| 25 to 34 Years | 28 (41.2%) | 0 (0.0%) |
| 35 to 44 Years | 22 (100.0%) | 0 (0.0%) |
| 45 to 54 Years | 0 (0.0%) | 21 (100.0%) |
| 55 to 64 Years | 32 (44.4%) | 40 (55.6%) |
| 65 to 74 Years | 16 (100.0%) | 0 (0.0%) |
| 75 Years and over | 88 (100.0%) | 62 (70.5%) |
| Total | 186 (64.8%) | 123 (42.9%) |
Disability Status by Sex by Age in Chloride
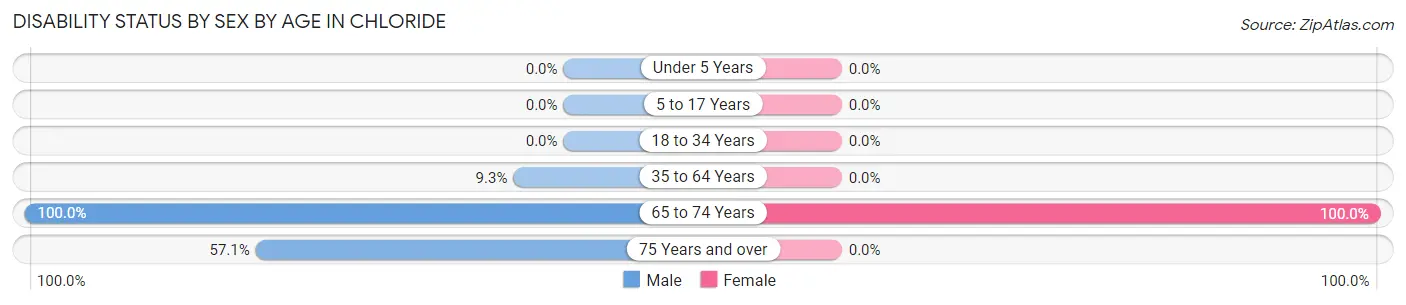
| Age Bracket | Male | Female |
| Under 5 Years | 0 (0.0%) | 0 (0.0%) |
| 5 to 17 Years | 0 (0.0%) | 0 (0.0%) |
| 18 to 34 Years | 0 (0.0%) | 0 (0.0%) |
| 35 to 64 Years | 8 (9.3%) | 0 (0.0%) |
| 65 to 74 Years | 8 (100.0%) | 8 (100.0%) |
| 75 Years and over | 36 (57.1%) | 0 (0.0%) |
Disability Class by Sex by Age in Chloride
Disability Class: Hearing Difficulty
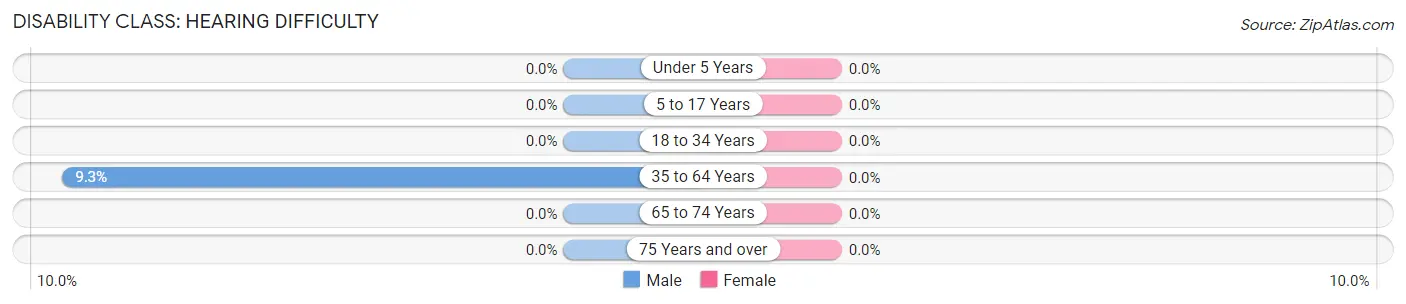
| Age Bracket | Male | Female |
| Under 5 Years | 0 (0.0%) | 0 (0.0%) |
| 5 to 17 Years | 0 (0.0%) | 0 (0.0%) |
| 18 to 34 Years | 0 (0.0%) | 0 (0.0%) |
| 35 to 64 Years | 8 (9.3%) | 0 (0.0%) |
| 65 to 74 Years | 0 (0.0%) | 0 (0.0%) |
| 75 Years and over | 0 (0.0%) | 0 (0.0%) |
Disability Class: Vision Difficulty
| Age Bracket | Male | Female |
| Under 5 Years | 0 (0.0%) | 0 (0.0%) |
| 5 to 17 Years | 0 (0.0%) | 0 (0.0%) |
| 18 to 34 Years | 0 (0.0%) | 0 (0.0%) |
| 35 to 64 Years | 0 (0.0%) | 0 (0.0%) |
| 65 to 74 Years | 0 (0.0%) | 0 (0.0%) |
| 75 Years and over | 0 (0.0%) | 0 (0.0%) |
Disability Class: Cognitive Difficulty
| Age Bracket | Male | Female |
| 5 to 17 Years | 0 (0.0%) | 0 (0.0%) |
| 18 to 34 Years | 0 (0.0%) | 0 (0.0%) |
| 35 to 64 Years | 0 (0.0%) | 0 (0.0%) |
| 65 to 74 Years | 0 (0.0%) | 0 (0.0%) |
| 75 Years and over | 0 (0.0%) | 0 (0.0%) |
Disability Class: Ambulatory Difficulty
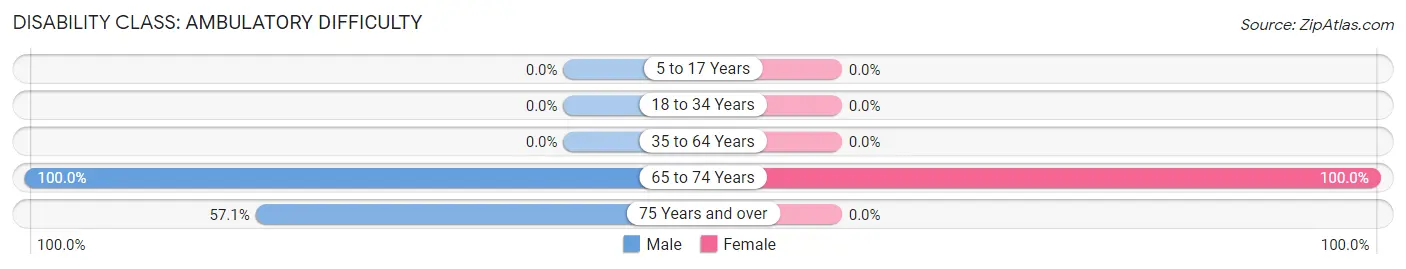
| Age Bracket | Male | Female |
| 5 to 17 Years | 0 (0.0%) | 0 (0.0%) |
| 18 to 34 Years | 0 (0.0%) | 0 (0.0%) |
| 35 to 64 Years | 0 (0.0%) | 0 (0.0%) |
| 65 to 74 Years | 8 (100.0%) | 8 (100.0%) |
| 75 Years and over | 36 (57.1%) | 0 (0.0%) |
Disability Class: Self-Care Difficulty
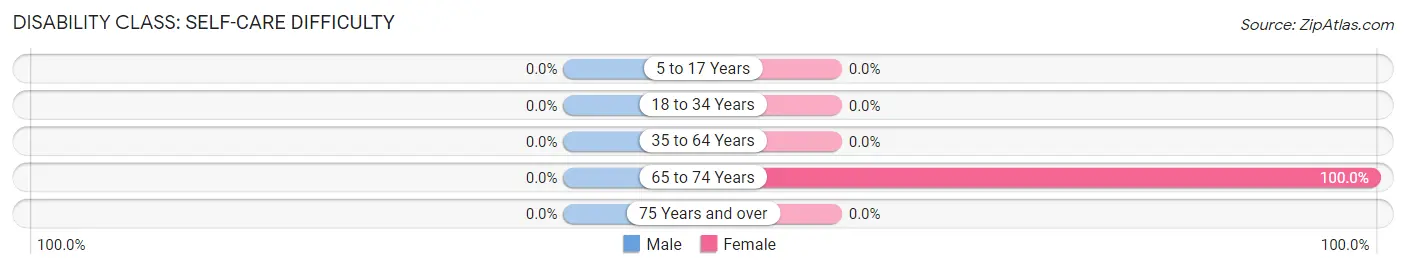
| Age Bracket | Male | Female |
| 5 to 17 Years | 0 (0.0%) | 0 (0.0%) |
| 18 to 34 Years | 0 (0.0%) | 0 (0.0%) |
| 35 to 64 Years | 0 (0.0%) | 0 (0.0%) |
| 65 to 74 Years | 0 (0.0%) | 8 (100.0%) |
| 75 Years and over | 0 (0.0%) | 0 (0.0%) |
Technology Access in Chloride
Computing Device Access in Chloride
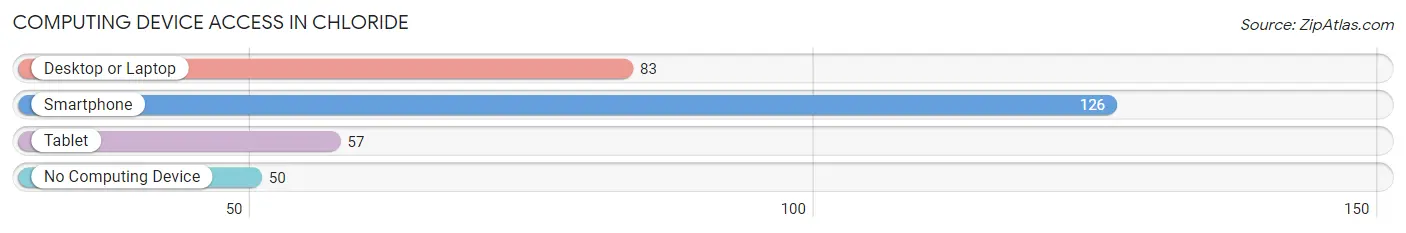
| Device Type | # Households | % Households |
| Desktop or Laptop | 83 | 45.1% |
| Smartphone | 126 | 68.5% |
| Tablet | 57 | 31.0% |
| No Computing Device | 50 | 27.2% |
| Total | 184 | 100.0% |
Internet Access in Chloride
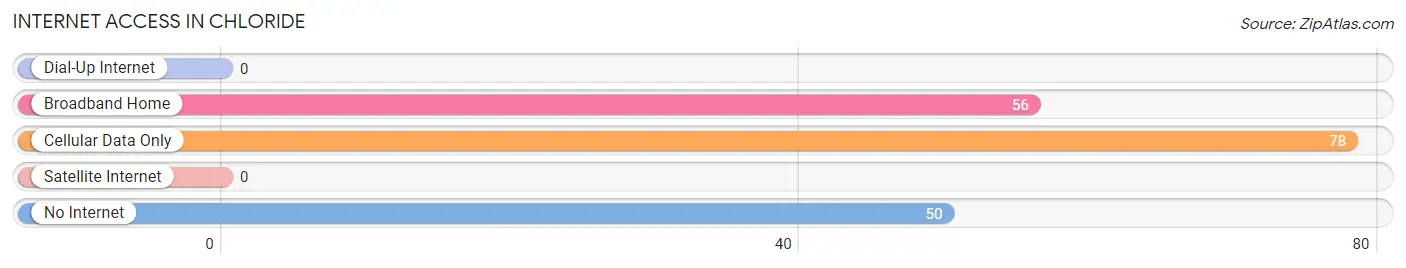
| Internet Type | # Households | % Households |
| Dial-Up Internet | 0 | 0.0% |
| Broadband Home | 56 | 30.4% |
| Cellular Data Only | 78 | 42.4% |
| Satellite Internet | 0 | 0.0% |
| No Internet | 50 | 27.2% |
| Total | 184 | 100.0% |
Chloride Summary
Chloride, Arizona is a small unincorporated community located in Mohave County, Arizona. It is situated in the northwest corner of the state, approximately 25 miles south of Kingman and about 90 miles southeast of Las Vegas, Nevada. The town is located in the Hualapai Valley, which is part of the larger Colorado Plateau. The population of Chloride was estimated to be around 200 people in 2020.
History
Chloride was founded in 1863 by a group of prospectors who were searching for silver and other minerals in the area. The town was named after the chloride of silver that was found in the area. The town quickly grew and by the late 1800s, it had become a bustling mining town with a population of over 1,000 people. The town was home to several saloons, stores, and a post office.
In the early 1900s, the mining industry began to decline and the population of Chloride began to dwindle. By the 1950s, the population had dropped to around 200 people. Despite the decline in population, the town has managed to remain a vibrant community.
Geography
Chloride is located in the Hualapai Valley, which is part of the larger Colorado Plateau. The town is situated at an elevation of 3,400 feet and is surrounded by the Hualapai Mountains. The climate in Chloride is arid and semi-arid, with hot summers and mild winters. The average annual precipitation is around 8 inches.
Economy
The economy of Chloride is largely based on tourism. The town is home to several tourist attractions, including the Chloride Historical Museum, the Chloride Ghost Town, and the Chloride Mine. The town also has several restaurants, shops, and art galleries.
Demographics
As of the 2020 census, the population of Chloride was estimated to be around 200 people. The racial makeup of the town was 94.5% White, 0.5% African American, 0.5% Native American, 0.5% Asian, and 4% from other races. The median household income was $30,000 and the median home value was $90,000.
Conclusion
Chloride, Arizona is a small unincorporated community located in Mohave County, Arizona. It is situated in the northwest corner of the state, approximately 25 miles south of Kingman and about 90 miles southeast of Las Vegas, Nevada. The town is located in the Hualapai Valley, which is part of the larger Colorado Plateau. The population of Chloride was estimated to be around 200 people in 2020. The economy of Chloride is largely based on tourism and the town is home to several tourist attractions. The racial makeup of the town was 94.5% White, 0.5% African American, 0.5% Native American, 0.5% Asian, and 4% from other races. The median household income was $30,000 and the median home value was $90,000.
Common Questions
What is Per Capita Income in Chloride?
Per Capita income in Chloride is $21,741.
What is the Median Household income in Chloride?
Median Household Income in Chloride is $30,625.
What is Inequality or Gini Index in Chloride?
Inequality or Gini Index in Chloride is 0.40.
What is the Total Population of Chloride?
Total Population of Chloride is 287.
What is the Total Male Population of Chloride?
Total Male Population of Chloride is 197.
What is the Total Female Population of Chloride?
Total Female Population of Chloride is 90.
What is the Ratio of Males per 100 Females in Chloride?
There are 218.89 Males per 100 Females in Chloride.
What is the Ratio of Females per 100 Males in Chloride?
There are 45.69 Females per 100 Males in Chloride.
What is the Median Population Age in Chloride?
Median Population Age in Chloride is 60.0 Years.
What is the Average Family Size in Chloride
Average Family Size in Chloride is 2.3 People.
What is the Average Household Size in Chloride
Average Household Size in Chloride is 1.6 People.
How Large is the Labor Force in Chloride?
There are 62 People in the Labor Forcein in Chloride.
What is the Percentage of People in the Labor Force in Chloride?
21.6% of People are in the Labor Force in Chloride.