Gumbranch, GA Map & Demographics
Gumbranch Map
Gumbranch Overview
$17,089
PER CAPITA INCOME
$112,525
AVG FAMILY INCOME
$88,750
AVG HOUSEHOLD INCOME
61.9%
WAGE / INCOME GAP [ % ]
38.1¢/ $1
WAGE / INCOME GAP [ $ ]
0.32
INEQUALITY / GINI INDEX
648
TOTAL POPULATION
380
MALE POPULATION
268
FEMALE POPULATION
141.79
MALES / 100 FEMALES
70.53
FEMALES / 100 MALES
16.2
MEDIAN AGE
5.4
AVG FAMILY SIZE
4.6
AVG HOUSEHOLD SIZE
198
LABOR FORCE [ PEOPLE ]
58.6%
PERCENT IN LABOR FORCE
2.0%
UNEMPLOYMENT RATE
Income in Gumbranch
Income Overview in Gumbranch
Per Capita Income in Gumbranch is $17,089, while median incomes of families and households are $112,525 and $88,750 respectively.
| Characteristic | Number | Measure |
| Per Capita Income | 648 | $17,089 |
| Median Family Income | 111 | $112,525 |
| Mean Family Income | 111 | $84,165 |
| Median Household Income | 142 | $88,750 |
| Mean Household Income | 142 | $74,369 |
| Income Deficit | 111 | $0 |
| Wage / Income Gap (%) | 648 | 61.89% |
| Wage / Income Gap ($) | 648 | 38.11¢ per $1 |
| Gini / Inequality Index | 648 | 0.32 |
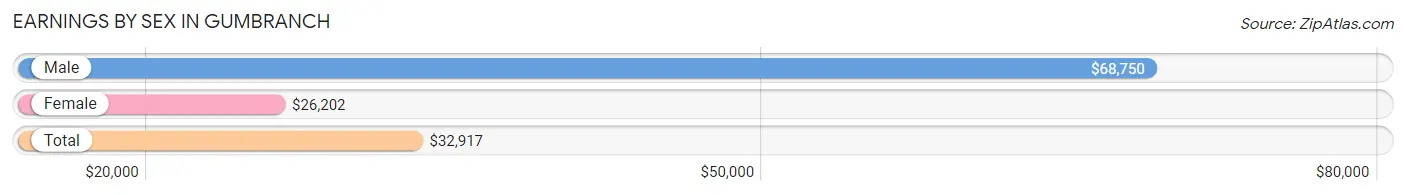
Earnings by Sex in Gumbranch
Average Earnings in Gumbranch are $32,917, $68,750 for men and $26,202 for women, a difference of 61.9%.
| Sex | Number | Average Earnings |
| Male | 114 (58.2%) | $68,750 |
| Female | 82 (41.8%) | $26,202 |
| Total | 196 (100.0%) | $32,917 |
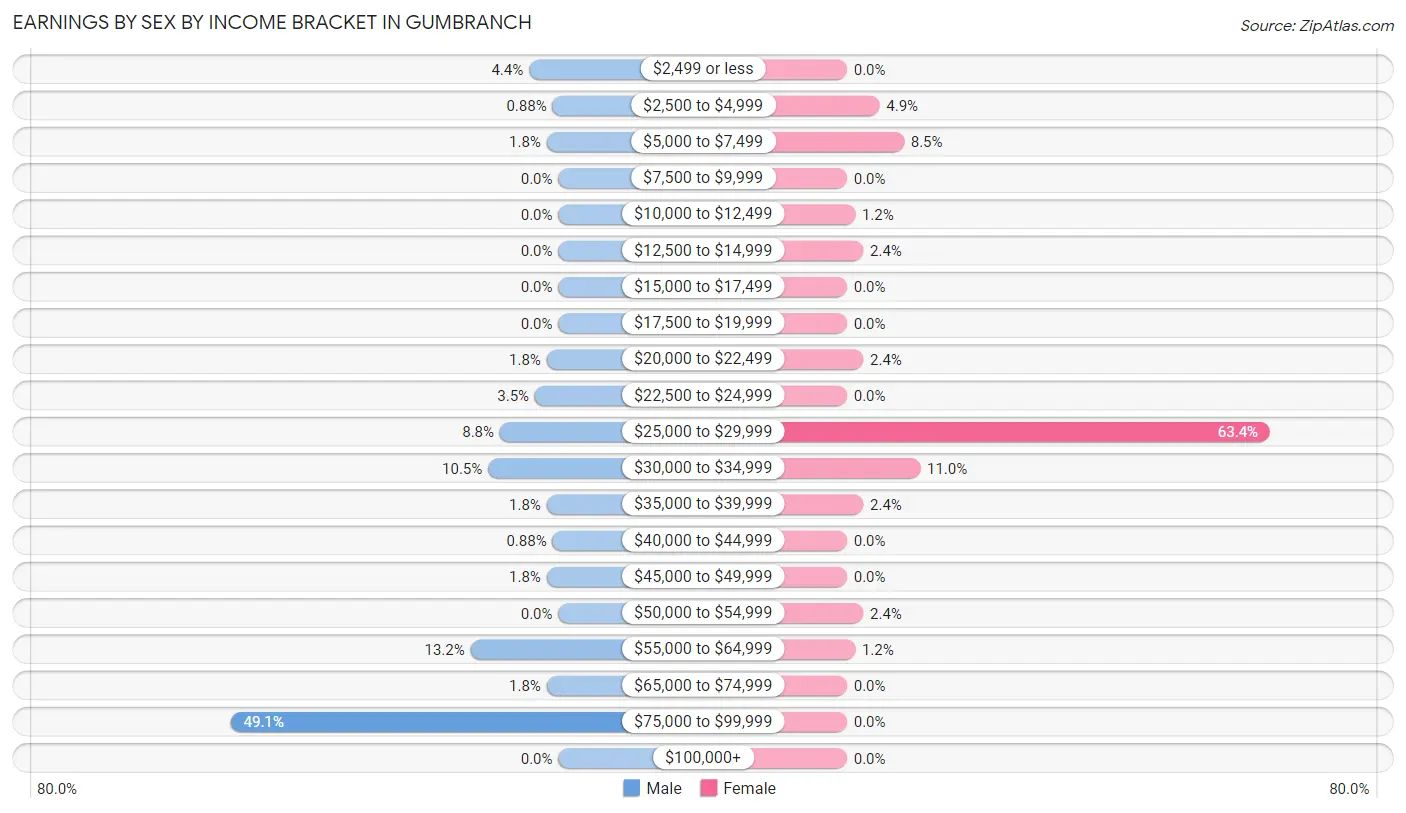
Earnings by Sex by Income Bracket in Gumbranch
The most common earnings brackets in Gumbranch are $75,000 to $99,999 for men (56 | 49.1%) and $25,000 to $29,999 for women (52 | 63.4%).
| Income | Male | Female |
| $2,499 or less | 5 (4.4%) | 0 (0.0%) |
| $2,500 to $4,999 | 1 (0.9%) | 4 (4.9%) |
| $5,000 to $7,499 | 2 (1.8%) | 7 (8.5%) |
| $7,500 to $9,999 | 0 (0.0%) | 0 (0.0%) |
| $10,000 to $12,499 | 0 (0.0%) | 1 (1.2%) |
| $12,500 to $14,999 | 0 (0.0%) | 2 (2.4%) |
| $15,000 to $17,499 | 0 (0.0%) | 0 (0.0%) |
| $17,500 to $19,999 | 0 (0.0%) | 0 (0.0%) |
| $20,000 to $22,499 | 2 (1.8%) | 2 (2.4%) |
| $22,500 to $24,999 | 4 (3.5%) | 0 (0.0%) |
| $25,000 to $29,999 | 10 (8.8%) | 52 (63.4%) |
| $30,000 to $34,999 | 12 (10.5%) | 9 (11.0%) |
| $35,000 to $39,999 | 2 (1.8%) | 2 (2.4%) |
| $40,000 to $44,999 | 1 (0.9%) | 0 (0.0%) |
| $45,000 to $49,999 | 2 (1.8%) | 0 (0.0%) |
| $50,000 to $54,999 | 0 (0.0%) | 2 (2.4%) |
| $55,000 to $64,999 | 15 (13.2%) | 1 (1.2%) |
| $65,000 to $74,999 | 2 (1.8%) | 0 (0.0%) |
| $75,000 to $99,999 | 56 (49.1%) | 0 (0.0%) |
| $100,000+ | 0 (0.0%) | 0 (0.0%) |
| Total | 114 (100.0%) | 82 (100.0%) |
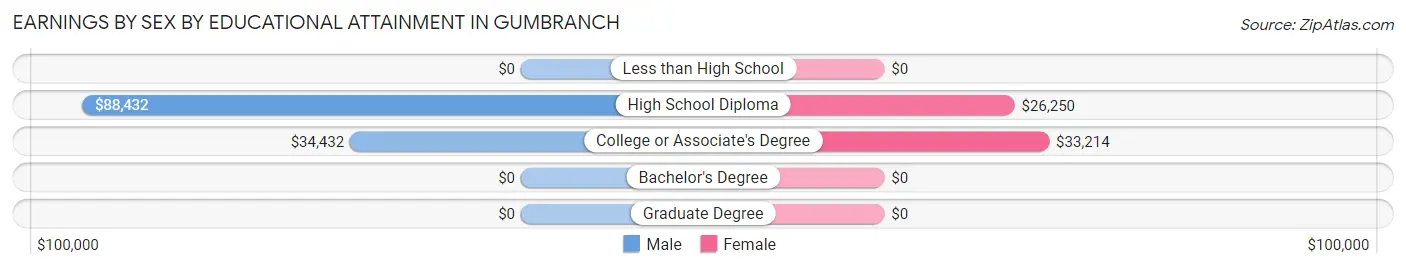
Earnings by Sex by Educational Attainment in Gumbranch
Average earnings in Gumbranch are $87,841 for men and $26,370 for women, a difference of 70.0%. Men with an educational attainment of high school diploma enjoy the highest average annual earnings of $88,432, while those with college or associate's degree education earn the least with $34,432. Women with an educational attainment of college or associate's degree earn the most with the average annual earnings of $33,214, while those with high school diploma education have the smallest earnings of $26,250.
| Educational Attainment | Male Income | Female Income |
| Less than High School | - | - |
| High School Diploma | $88,432 | $26,250 |
| College or Associate's Degree | $34,432 | $33,214 |
| Bachelor's Degree | - | - |
| Graduate Degree | - | - |
| Total | $87,841 | $26,370 |
Family Income in Gumbranch
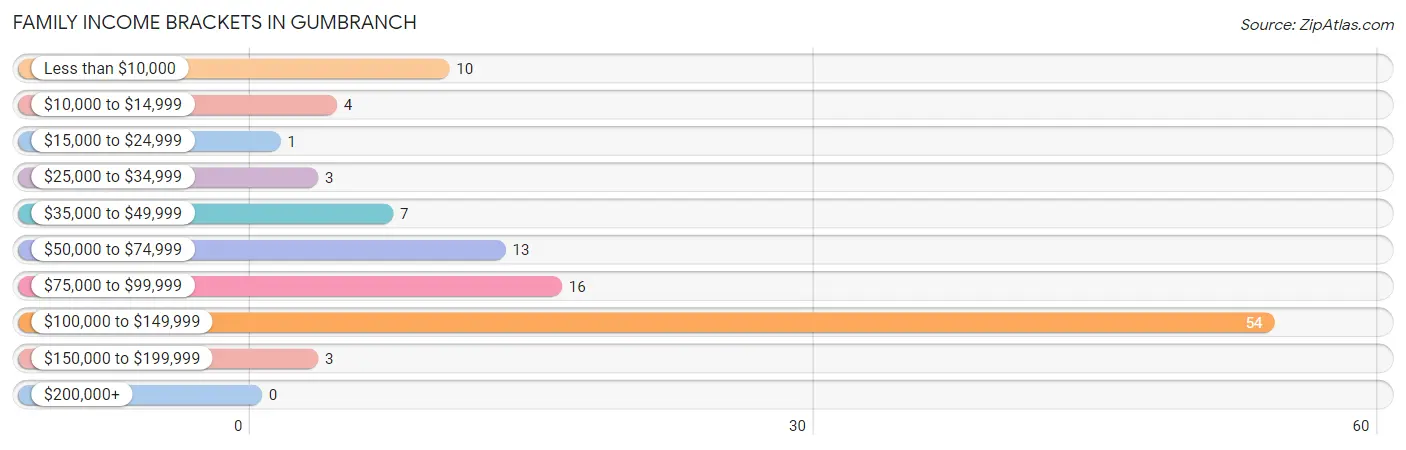
Family Income Brackets in Gumbranch
According to the Gumbranch family income data, there are 54 families falling into the $100,000 to $149,999 income range, which is the most common income bracket and makes up 48.6% of all families.
| Income Bracket | # Families | % Families |
| Less than $10,000 | 10 | 9.0% |
| $10,000 to $14,999 | 4 | 3.6% |
| $15,000 to $24,999 | 1 | 0.9% |
| $25,000 to $34,999 | 3 | 2.7% |
| $35,000 to $49,999 | 7 | 6.3% |
| $50,000 to $74,999 | 13 | 11.7% |
| $75,000 to $99,999 | 16 | 14.4% |
| $100,000 to $149,999 | 54 | 48.6% |
| $150,000 to $199,999 | 3 | 2.7% |
| $200,000+ | 0 | 0.0% |
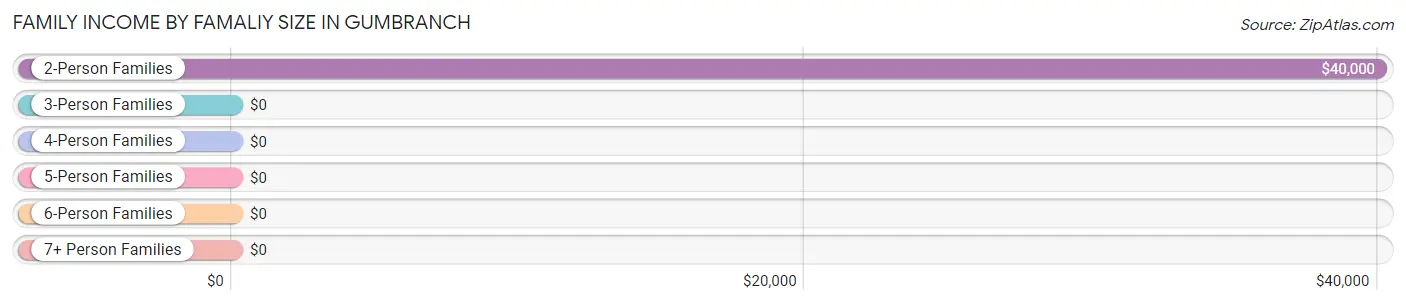
Family Income by Famaliy Size in Gumbranch
2-person families (46 | 41.4%) account for the highest median family income in Gumbranch with $40,000 per family, while 2-person families (46 | 41.4%) have the highest median income of $20,000 per family member.
| Income Bracket | # Families | Median Income |
| 2-Person Families | 46 (41.4%) | $40,000 |
| 3-Person Families | 11 (9.9%) | $0 |
| 4-Person Families | 3 (2.7%) | $0 |
| 5-Person Families | 0 (0.0%) | $0 |
| 6-Person Families | 0 (0.0%) | $0 |
| 7+ Person Families | 51 (46.0%) | $0 |
| Total | 111 (100.0%) | $112,525 |
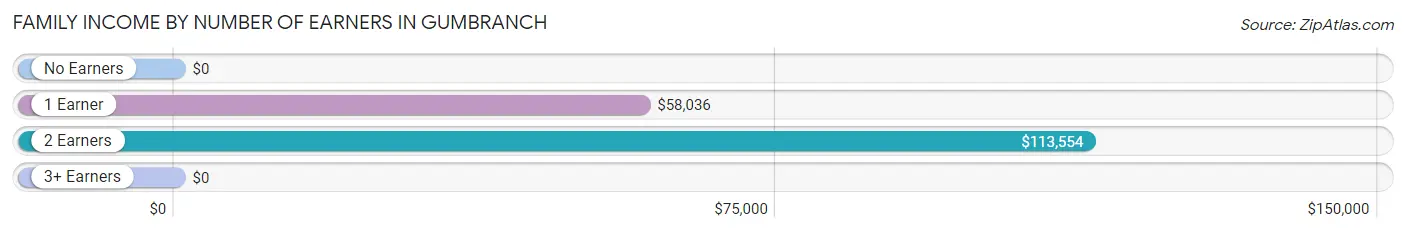
Family Income by Number of Earners in Gumbranch
| Number of Earners | # Families | Median Income |
| No Earners | 20 (18.0%) | $0 |
| 1 Earner | 21 (18.9%) | $58,036 |
| 2 Earners | 59 (53.1%) | $113,554 |
| 3+ Earners | 11 (9.9%) | $0 |
| Total | 111 (100.0%) | $112,525 |
Household Income in Gumbranch
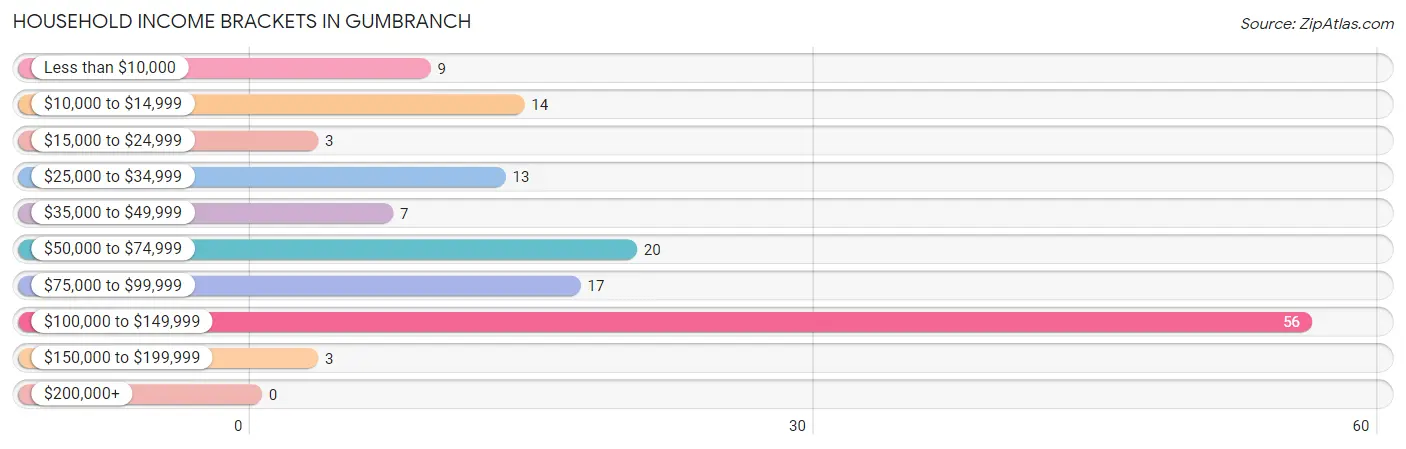
Household Income Brackets in Gumbranch
With 56 households falling in the category, the $100,000 to $149,999 income range is the most frequent in Gumbranch, accounting for 39.4% of all households.
| Income Bracket | # Households | % Households |
| Less than $10,000 | 9 | 6.3% |
| $10,000 to $14,999 | 14 | 9.9% |
| $15,000 to $24,999 | 3 | 2.1% |
| $25,000 to $34,999 | 13 | 9.2% |
| $35,000 to $49,999 | 7 | 4.9% |
| $50,000 to $74,999 | 20 | 14.1% |
| $75,000 to $99,999 | 17 | 12.0% |
| $100,000 to $149,999 | 56 | 39.4% |
| $150,000 to $199,999 | 3 | 2.1% |
| $200,000+ | 0 | 0.0% |
Household Income by Householder Age in Gumbranch
The median household income in Gumbranch is $88,750, with the highest median household income of $112,941 found in the 25 to 44 years age bracket for the primary householder. A total of 84 households (59.2%) fall into this category.
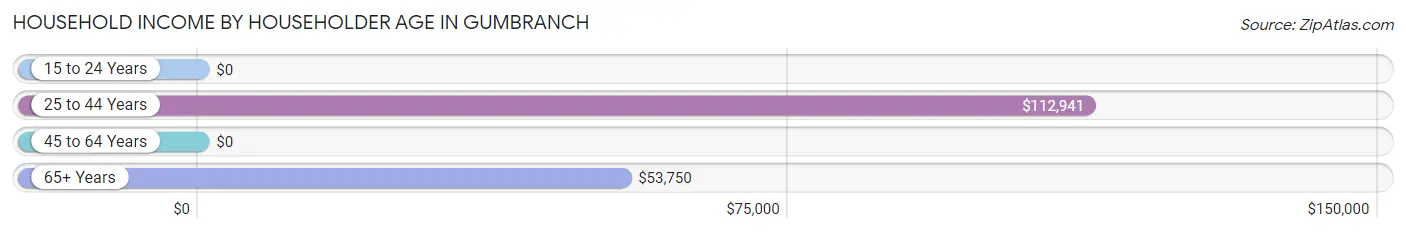
| Income Bracket | # Households | Median Income |
| 15 to 24 Years | 0 (0.0%) | $0 |
| 25 to 44 Years | 84 (59.2%) | $112,941 |
| 45 to 64 Years | 33 (23.2%) | $0 |
| 65+ Years | 25 (17.6%) | $53,750 |
| Total | 142 (100.0%) | $88,750 |
Poverty in Gumbranch
Income Below Poverty by Sex and Age in Gumbranch
With 4.7% poverty level for males and 13.4% for females among the residents of Gumbranch, under 5 year old males and 16 and 17 year old females are the most vulnerable to poverty, with 12 males (80.0%) and 1 females (100.0%) in their respective age groups living below the poverty level.
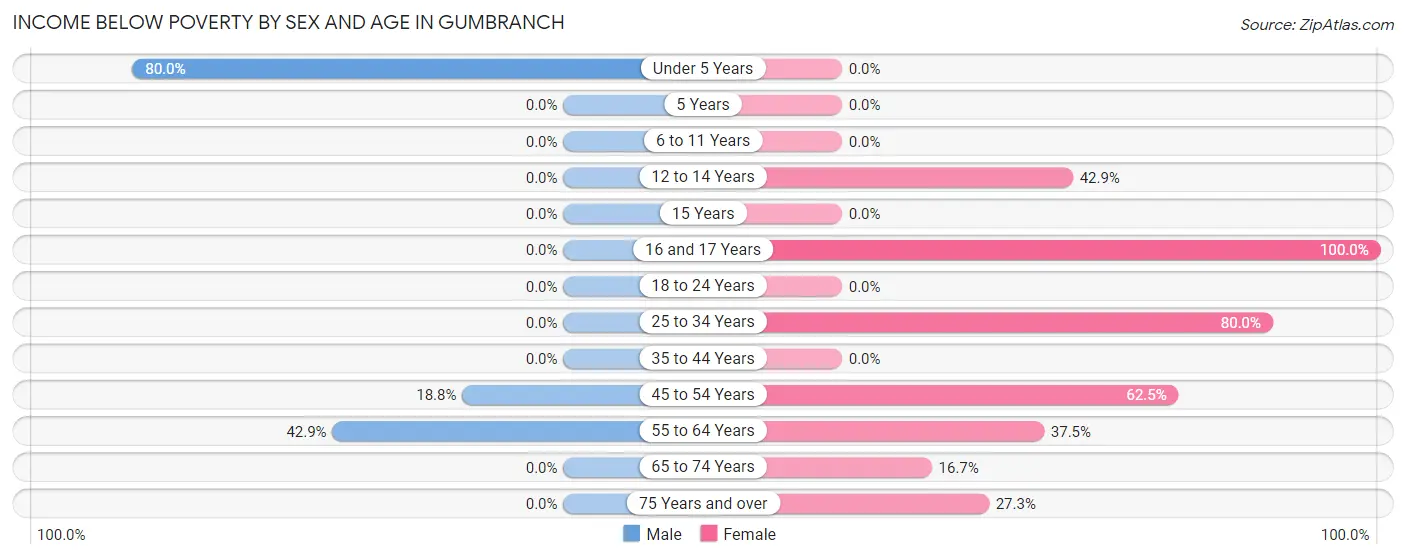
| Age Bracket | Male | Female |
| Under 5 Years | 12 (80.0%) | 0 (0.0%) |
| 5 Years | 0 (0.0%) | 0 (0.0%) |
| 6 to 11 Years | 0 (0.0%) | 0 (0.0%) |
| 12 to 14 Years | 0 (0.0%) | 3 (42.9%) |
| 15 Years | 0 (0.0%) | 0 (0.0%) |
| 16 and 17 Years | 0 (0.0%) | 1 (100.0%) |
| 18 to 24 Years | 0 (0.0%) | 0 (0.0%) |
| 25 to 34 Years | 0 (0.0%) | 8 (80.0%) |
| 35 to 44 Years | 0 (0.0%) | 0 (0.0%) |
| 45 to 54 Years | 3 (18.8%) | 15 (62.5%) |
| 55 to 64 Years | 3 (42.9%) | 3 (37.5%) |
| 65 to 74 Years | 0 (0.0%) | 3 (16.7%) |
| 75 Years and over | 0 (0.0%) | 3 (27.3%) |
| Total | 18 (4.7%) | 36 (13.4%) |
Income Above Poverty by Sex and Age in Gumbranch
According to the poverty statistics in Gumbranch, males aged 6 to 11 years and females aged under 5 years are the age groups that are most secure financially, with 100.0% of males and 100.0% of females in these age groups living above the poverty line.
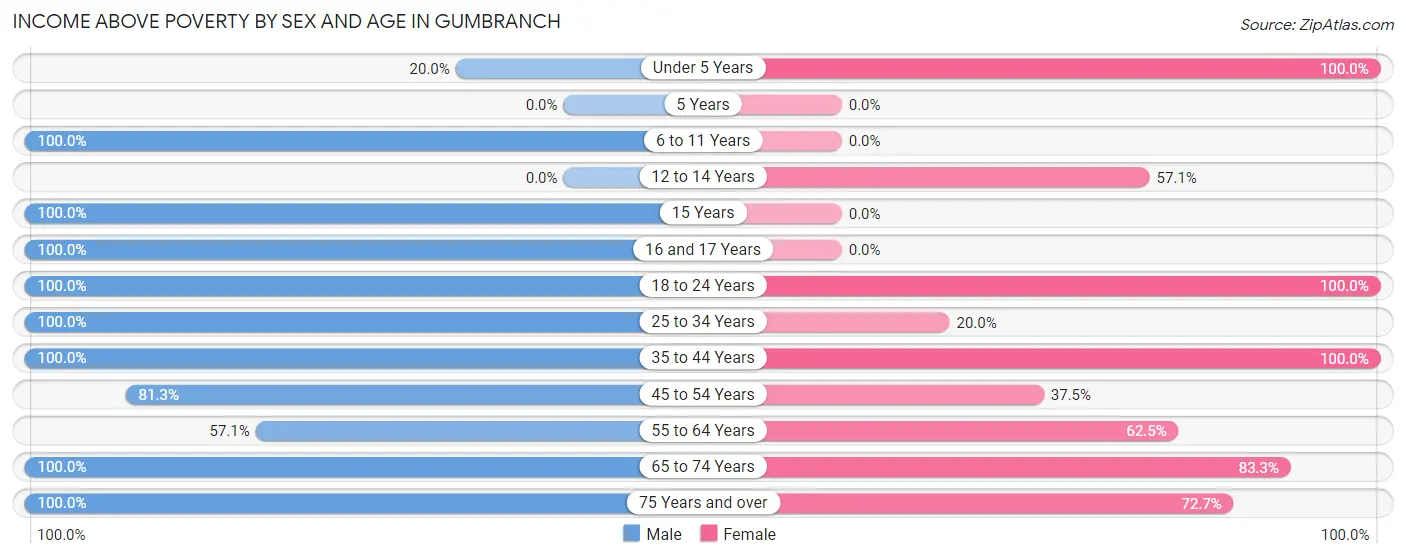
| Age Bracket | Male | Female |
| Under 5 Years | 3 (20.0%) | 126 (100.0%) |
| 5 Years | 0 (0.0%) | 0 (0.0%) |
| 6 to 11 Years | 160 (100.0%) | 0 (0.0%) |
| 12 to 14 Years | 0 (0.0%) | 4 (57.1%) |
| 15 Years | 2 (100.0%) | 0 (0.0%) |
| 16 and 17 Years | 73 (100.0%) | 0 (0.0%) |
| 18 to 24 Years | 19 (100.0%) | 7 (100.0%) |
| 25 to 34 Years | 5 (100.0%) | 2 (20.0%) |
| 35 to 44 Years | 75 (100.0%) | 56 (100.0%) |
| 45 to 54 Years | 13 (81.2%) | 9 (37.5%) |
| 55 to 64 Years | 4 (57.1%) | 5 (62.5%) |
| 65 to 74 Years | 5 (100.0%) | 15 (83.3%) |
| 75 Years and over | 3 (100.0%) | 8 (72.7%) |
| Total | 362 (95.3%) | 232 (86.6%) |
Income Below Poverty Among Married-Couple Families in Gumbranch
The poverty statistics for married-couple families in Gumbranch show that 4.8% or 4 of the total 84 families live below the poverty line. Families with no children have the highest poverty rate of 13.3%, comprising of 4 families. On the other hand, families with 1 or 2 children have the lowest poverty rate of 0.0%, which includes 0 families.
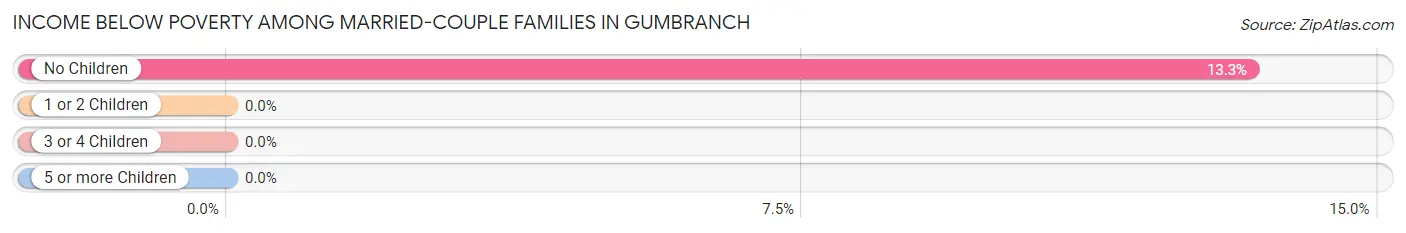
| Children | Above Poverty | Below Poverty |
| No Children | 26 (86.7%) | 4 (13.3%) |
| 1 or 2 Children | 3 (100.0%) | 0 (0.0%) |
| 3 or 4 Children | 0 (0.0%) | 0 (0.0%) |
| 5 or more Children | 51 (100.0%) | 0 (0.0%) |
| Total | 80 (95.2%) | 4 (4.8%) |
Income Below Poverty Among Single-Parent Households in Gumbranch
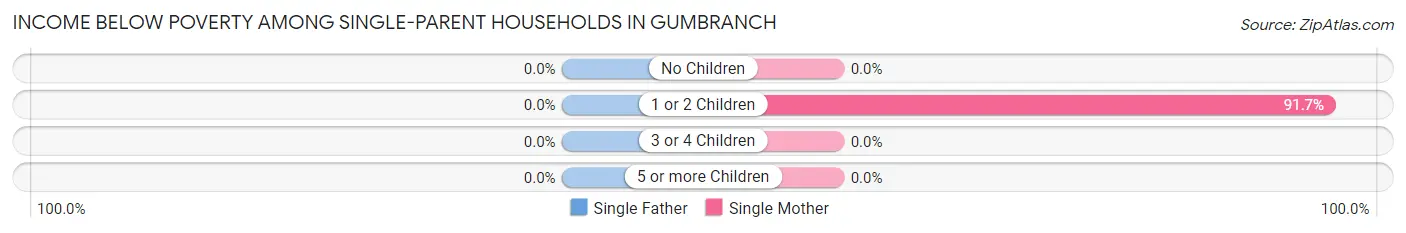
| Children | Single Father | Single Mother |
| No Children | 0 (0.0%) | 0 (0.0%) |
| 1 or 2 Children | 0 (0.0%) | 11 (91.7%) |
| 3 or 4 Children | 0 (0.0%) | 0 (0.0%) |
| 5 or more Children | 0 (0.0%) | 0 (0.0%) |
| Total | 0 (0.0%) | 11 (57.9%) |
Income Below Poverty Among Married-Couple vs Single-Parent Households in Gumbranch
The poverty data for Gumbranch shows that 4 of the married-couple family households (4.8%) and 11 of the single-parent households (40.7%) are living below the poverty level. Within the married-couple family households, those with no children have the highest poverty rate, with 4 households (13.3%) falling below the poverty line. Among the single-parent households, those with 1 or 2 children have the highest poverty rate, with 11 household (57.9%) living below poverty.
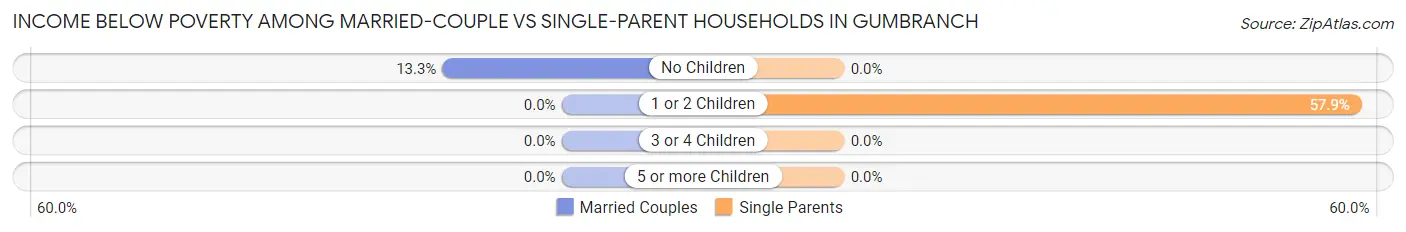
| Children | Married-Couple Families | Single-Parent Households |
| No Children | 4 (13.3%) | 0 (0.0%) |
| 1 or 2 Children | 0 (0.0%) | 11 (57.9%) |
| 3 or 4 Children | 0 (0.0%) | 0 (0.0%) |
| 5 or more Children | 0 (0.0%) | 0 (0.0%) |
| Total | 4 (4.8%) | 11 (40.7%) |
Race in Gumbranch
The most populous races in Gumbranch are White / Caucasian (646 | 99.7%), Hispanic or Latino (5 | 0.8%), and Two or more Races (2 | 0.3%).
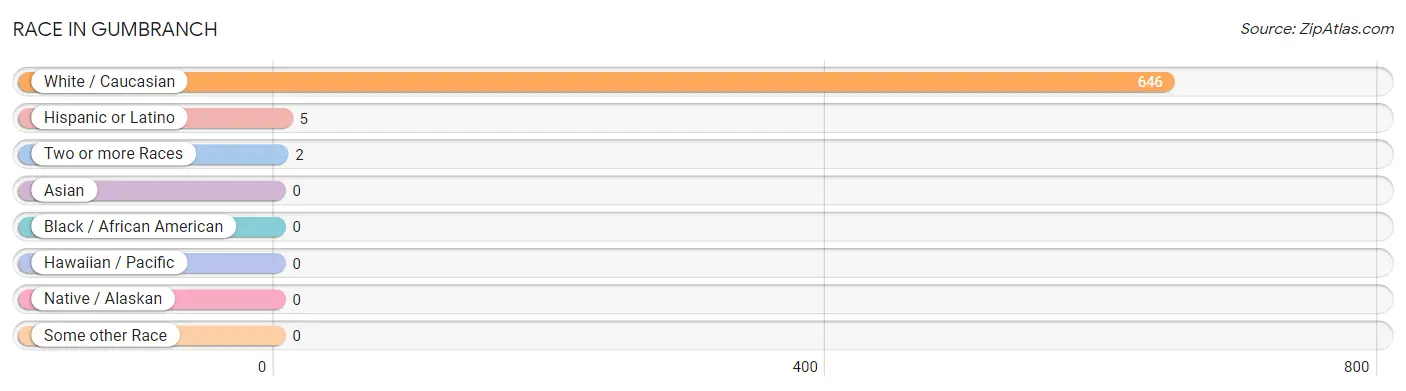
| Race | # Population | % Population |
| Asian | 0 | 0.0% |
| Black / African American | 0 | 0.0% |
| Hawaiian / Pacific | 0 | 0.0% |
| Hispanic or Latino | 5 | 0.8% |
| Native / Alaskan | 0 | 0.0% |
| White / Caucasian | 646 | 99.7% |
| Two or more Races | 2 | 0.3% |
| Some other Race | 0 | 0.0% |
| Total | 648 | 100.0% |
Ancestry in Gumbranch
The most populous ancestries reported in Gumbranch are English (22 | 3.4%), Irish (18 | 2.8%), American (17 | 2.6%), German (14 | 2.2%), and Mexican (5 | 0.8%), together accounting for 11.7% of all Gumbranch residents.
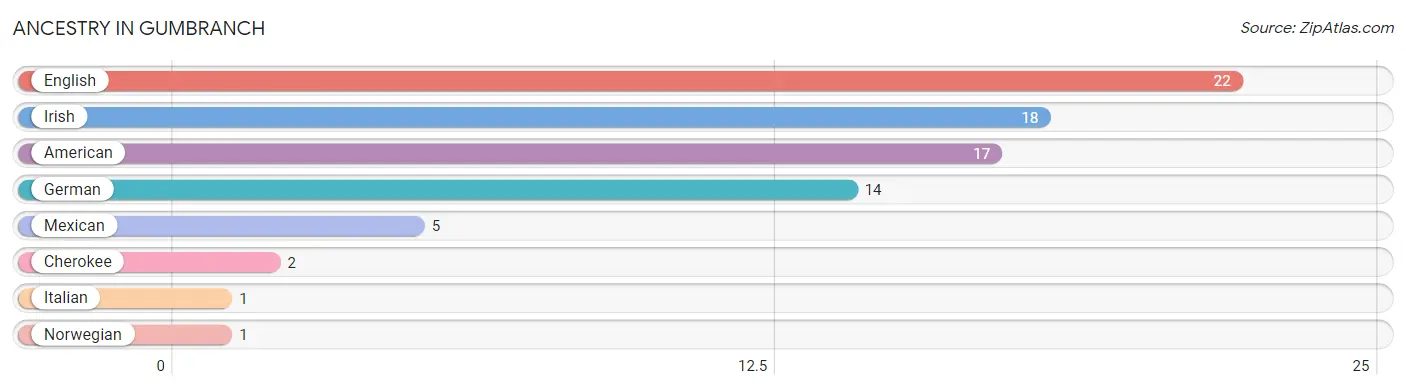
| Ancestry | # Population | % Population |
| American | 17 | 2.6% |
| Cherokee | 2 | 0.3% |
| English | 22 | 3.4% |
| German | 14 | 2.2% |
| Irish | 18 | 2.8% |
| Italian | 1 | 0.2% |
| Mexican | 5 | 0.8% |
| Norwegian | 1 | 0.2% | View All 8 Rows |
Immigrants in Gumbranch
The most numerous immigrant groups reported in Gumbranch came from , and Canada (2 | 0.3%), together accounting for 0.3% of all Gumbranch residents.

| Immigration Origin | # Population | % Population |
| Canada | 2 | 0.3% | View All 1 Rows |
Sex and Age in Gumbranch
Sex and Age in Gumbranch
The most populous age groups in Gumbranch are 10 to 14 Years (148 | 39.0%) for men and Under 5 Years (126 | 47.0%) for women.
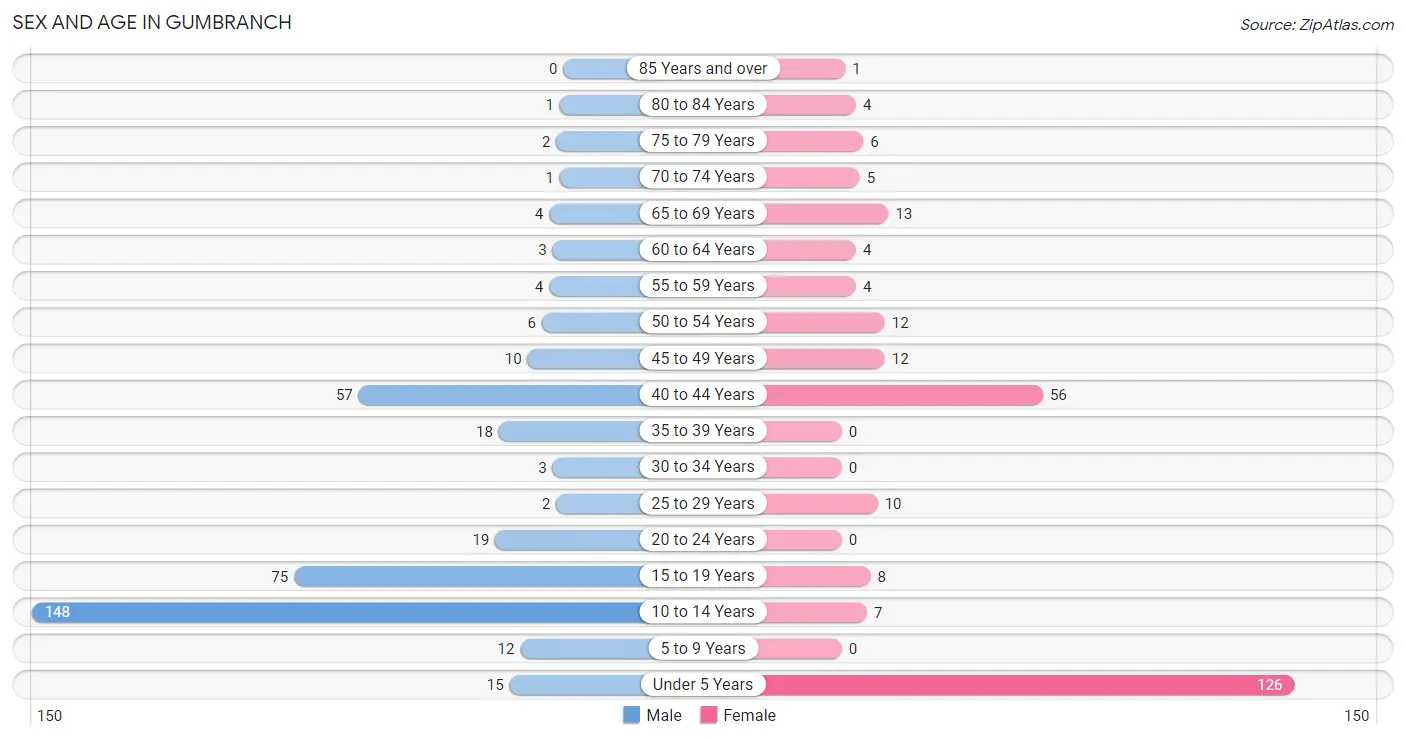
| Age Bracket | Male | Female |
| Under 5 Years | 15 (4.0%) | 126 (47.0%) |
| 5 to 9 Years | 12 (3.2%) | 0 (0.0%) |
| 10 to 14 Years | 148 (39.0%) | 7 (2.6%) |
| 15 to 19 Years | 75 (19.7%) | 8 (3.0%) |
| 20 to 24 Years | 19 (5.0%) | 0 (0.0%) |
| 25 to 29 Years | 2 (0.5%) | 10 (3.7%) |
| 30 to 34 Years | 3 (0.8%) | 0 (0.0%) |
| 35 to 39 Years | 18 (4.7%) | 0 (0.0%) |
| 40 to 44 Years | 57 (15.0%) | 56 (20.9%) |
| 45 to 49 Years | 10 (2.6%) | 12 (4.5%) |
| 50 to 54 Years | 6 (1.6%) | 12 (4.5%) |
| 55 to 59 Years | 4 (1.1%) | 4 (1.5%) |
| 60 to 64 Years | 3 (0.8%) | 4 (1.5%) |
| 65 to 69 Years | 4 (1.1%) | 13 (4.9%) |
| 70 to 74 Years | 1 (0.3%) | 5 (1.9%) |
| 75 to 79 Years | 2 (0.5%) | 6 (2.2%) |
| 80 to 84 Years | 1 (0.3%) | 4 (1.5%) |
| 85 Years and over | 0 (0.0%) | 1 (0.4%) |
| Total | 380 (100.0%) | 268 (100.0%) |
Families and Households in Gumbranch
Median Family Size in Gumbranch
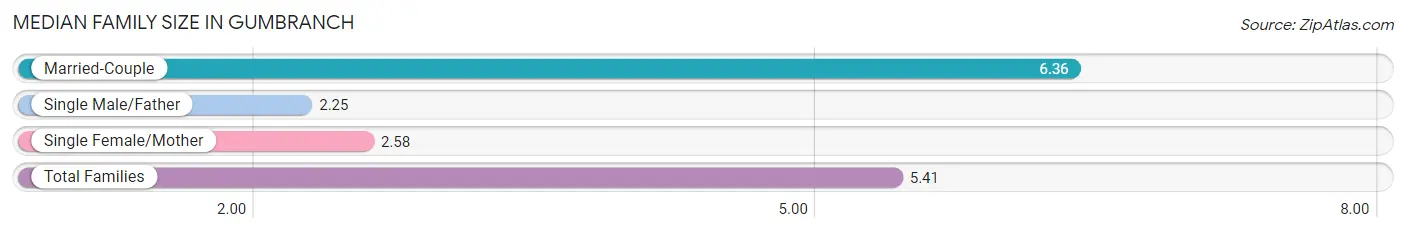
The median family size in Gumbranch is 5.41 persons per family, with married-couple families (84 | 75.7%) accounting for the largest median family size of 6.36 persons per family. On the other hand, single male/father families (8 | 7.2%) represent the smallest median family size with 2.25 persons per family.
| Family Type | # Families | Family Size |
| Married-Couple | 84 (75.7%) | 6.36 |
| Single Male/Father | 8 (7.2%) | 2.25 |
| Single Female/Mother | 19 (17.1%) | 2.58 |
| Total Families | 111 (100.0%) | 5.41 |
Median Household Size in Gumbranch
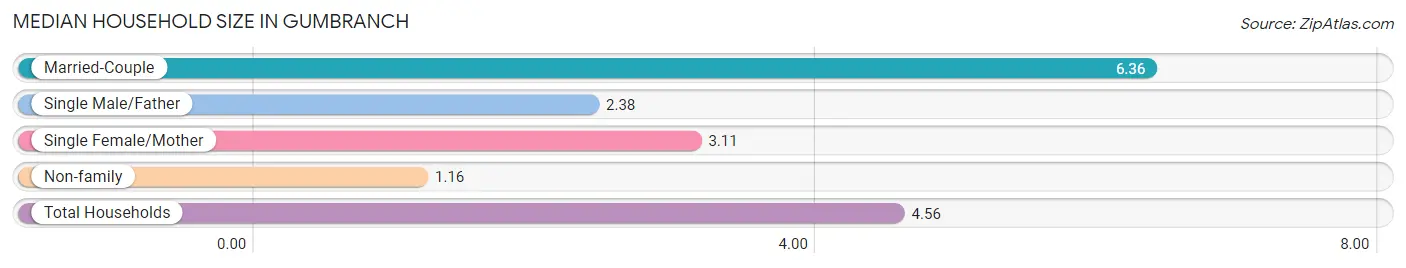
The median household size in Gumbranch is 4.56 persons per household, with married-couple households (84 | 59.2%) accounting for the largest median household size of 6.36 persons per household. non-family households (31 | 21.8%) represent the smallest median household size with 1.16 persons per household.
| Household Type | # Households | Household Size |
| Married-Couple | 84 (59.2%) | 6.36 |
| Single Male/Father | 8 (5.6%) | 2.38 |
| Single Female/Mother | 19 (13.4%) | 3.11 |
| Non-family | 31 (21.8%) | 1.16 |
| Total Households | 142 (100.0%) | 4.56 |
Household Size by Marriage Status in Gumbranch
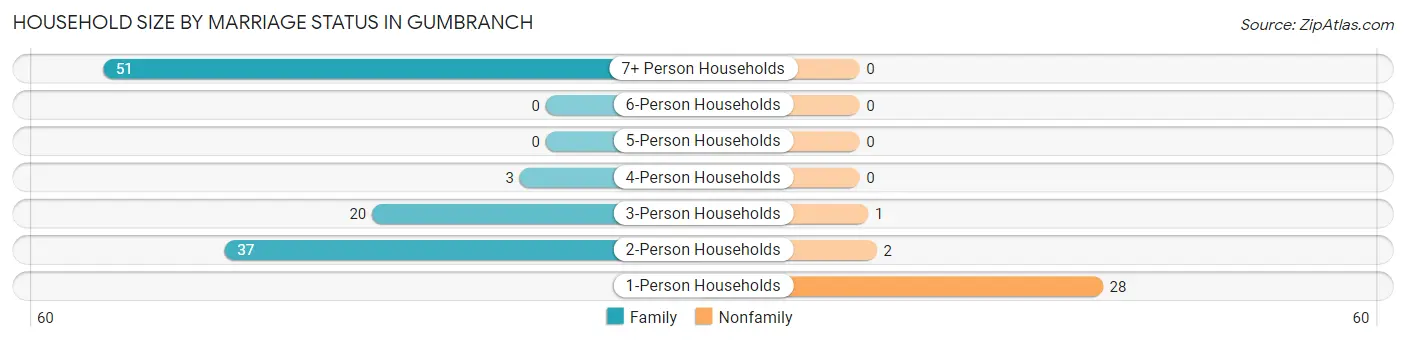
Out of a total of 142 households in Gumbranch, 111 (78.2%) are family households, while 31 (21.8%) are nonfamily households. The most numerous type of family households are 7+ person households, comprising 51, and the most common type of nonfamily households are 1-person households, comprising 28.
| Household Size | Family Households | Nonfamily Households |
| 1-Person Households | - | 28 (19.7%) |
| 2-Person Households | 37 (26.1%) | 2 (1.4%) |
| 3-Person Households | 20 (14.1%) | 1 (0.7%) |
| 4-Person Households | 3 (2.1%) | 0 (0.0%) |
| 5-Person Households | 0 (0.0%) | 0 (0.0%) |
| 6-Person Households | 0 (0.0%) | 0 (0.0%) |
| 7+ Person Households | 51 (35.9%) | 0 (0.0%) |
| Total | 111 (78.2%) | 31 (21.8%) |
Female Fertility in Gumbranch
Fertility by Age in Gumbranch
| Age Bracket | Women with Births | Births / 1,000 Women |
| 15 to 19 years | 0 (0.0%) | 0.0 |
| 20 to 34 years | 0 (0.0%) | 0.0 |
| 35 to 50 years | 0 (0.0%) | 0.0 |
| Total | 0 (0.0%) | 0.0 |
Fertility by Age by Marriage Status in Gumbranch
| Age Bracket | Married | Unmarried |
| 15 to 19 years | 0 (0.0%) | 0 (0.0%) |
| 20 to 34 years | 0 (0.0%) | 0 (0.0%) |
| 35 to 50 years | 0 (0.0%) | 0 (0.0%) |
| Total | 0 (0.0%) | 0 (0.0%) |
Fertility by Education in Gumbranch
| Educational Attainment | Women with Births | Births / 1,000 Women |
| Less than High School | 0 (0.0%) | 0.0 |
| High School Diploma | 0 (0.0%) | 0.0 |
| College or Associate's Degree | 0 (0.0%) | 0.0 |
| Bachelor's Degree | 0 (0.0%) | 0.0 |
| Graduate Degree | 0 (0.0%) | 0.0 |
| Total | 0 (0.0%) | 0.0 |
Fertility by Education by Marriage Status in Gumbranch
| Educational Attainment | Married | Unmarried |
| Less than High School | 0 (0.0%) | 0 (0.0%) |
| High School Diploma | 0 (0.0%) | 0 (0.0%) |
| College or Associate's Degree | 0 (0.0%) | 0 (0.0%) |
| Bachelor's Degree | 0 (0.0%) | 0 (0.0%) |
| Graduate Degree | 0 (0.0%) | 0 (0.0%) |
| Total | 0 (0.0%) | 0 (0.0%) |
Employment Characteristics in Gumbranch
Employment by Class of Employer in Gumbranch
Among the 194 employed individuals in Gumbranch, federal government employees (71 | 36.6%), self-employed (incorporated) (55 | 28.3%), and private company employees (39 | 20.1%) make up the most common classes of employment.
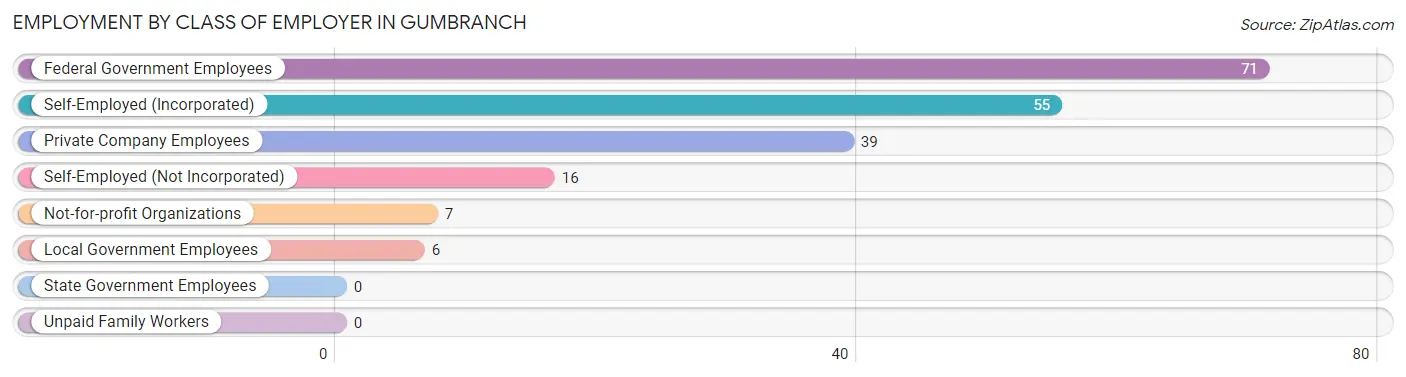
| Employer Class | # Employees | % Employees |
| Private Company Employees | 39 | 20.1% |
| Self-Employed (Incorporated) | 55 | 28.3% |
| Self-Employed (Not Incorporated) | 16 | 8.3% |
| Not-for-profit Organizations | 7 | 3.6% |
| Local Government Employees | 6 | 3.1% |
| State Government Employees | 0 | 0.0% |
| Federal Government Employees | 71 | 36.6% |
| Unpaid Family Workers | 0 | 0.0% |
| Total | 194 | 100.0% |
Employment Status by Age in Gumbranch
According to the labor force statistics for Gumbranch, out of the total population over 16 years of age (338), 58.6% or 198 individuals are in the labor force, with 2.0% or 4 of them unemployed. The age group with the highest labor force participation rate is 20 to 24 years, with 100.0% or 19 individuals in the labor force. Within the labor force, the 45 to 54 years age range has the highest percentage of unemployed individuals, with 16.0% or 4 of them being unemployed.
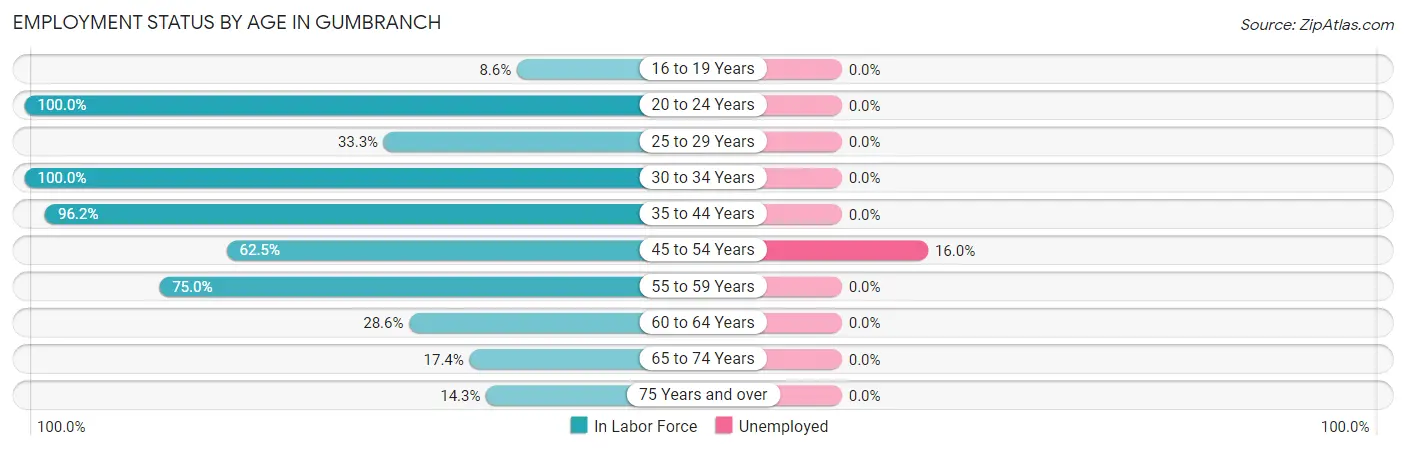
| Age Bracket | In Labor Force | Unemployed |
| 16 to 19 Years | 7 (8.6%) | 0 (0.0%) |
| 20 to 24 Years | 19 (100.0%) | 0 (0.0%) |
| 25 to 29 Years | 4 (33.3%) | 0 (0.0%) |
| 30 to 34 Years | 3 (100.0%) | 0 (0.0%) |
| 35 to 44 Years | 126 (96.2%) | 0 (0.0%) |
| 45 to 54 Years | 25 (62.5%) | 4 (16.0%) |
| 55 to 59 Years | 6 (75.0%) | 0 (0.0%) |
| 60 to 64 Years | 2 (28.6%) | 0 (0.0%) |
| 65 to 74 Years | 4 (17.4%) | 0 (0.0%) |
| 75 Years and over | 2 (14.3%) | 0 (0.0%) |
| Total | 198 (58.6%) | 4 (2.0%) |
Employment Status by Educational Attainment in Gumbranch
According to labor force statistics for Gumbranch, 82.6% of individuals (166) out of the total population between 25 and 64 years of age (201) are in the labor force, with 2.4% or 4 of them being unemployed. The group with the highest labor force participation rate are those with the educational attainment of bachelor's degree or higher, with 93.0% or 53 individuals in the labor force. Within the labor force, individuals with college / associate degree education have the highest percentage of unemployment, with 11.4% or 4 of them being unemployed.
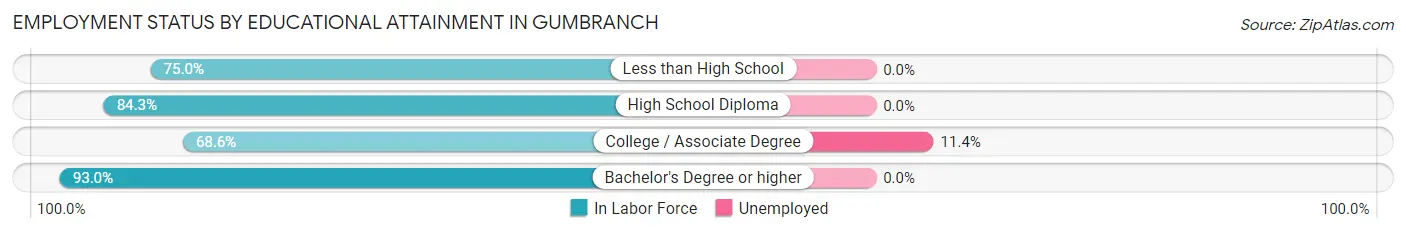
| Educational Attainment | In Labor Force | Unemployed |
| Less than High School | 3 (75.0%) | 0 (0.0%) |
| High School Diploma | 75 (84.3%) | 0 (0.0%) |
| College / Associate Degree | 35 (68.6%) | 6 (11.4%) |
| Bachelor's Degree or higher | 53 (93.0%) | 0 (0.0%) |
| Total | 166 (82.6%) | 5 (2.4%) |
Employment Occupations by Sex in Gumbranch
Management, Business, Science and Arts Occupations
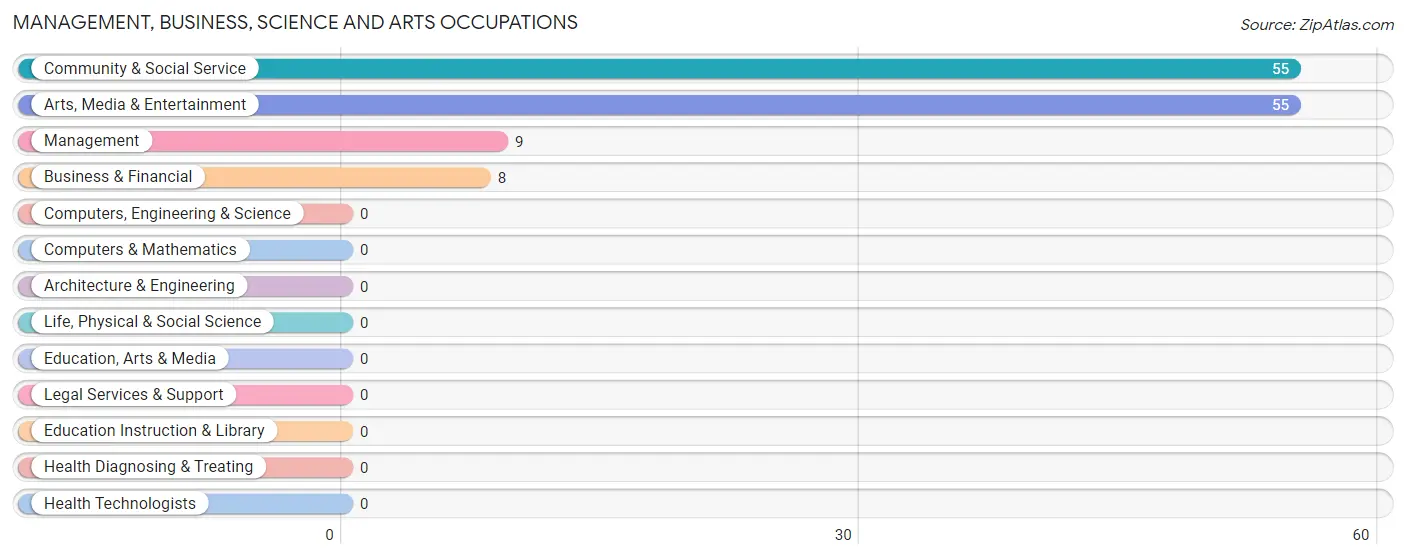
The most common Management, Business, Science and Arts occupations in Gumbranch are Community & Social Service (55 | 28.3%), Arts, Media & Entertainment (55 | 28.3%), Management (9 | 4.6%), and Business & Financial (8 | 4.1%).
Management, Business, Science and Arts Occupations by Sex
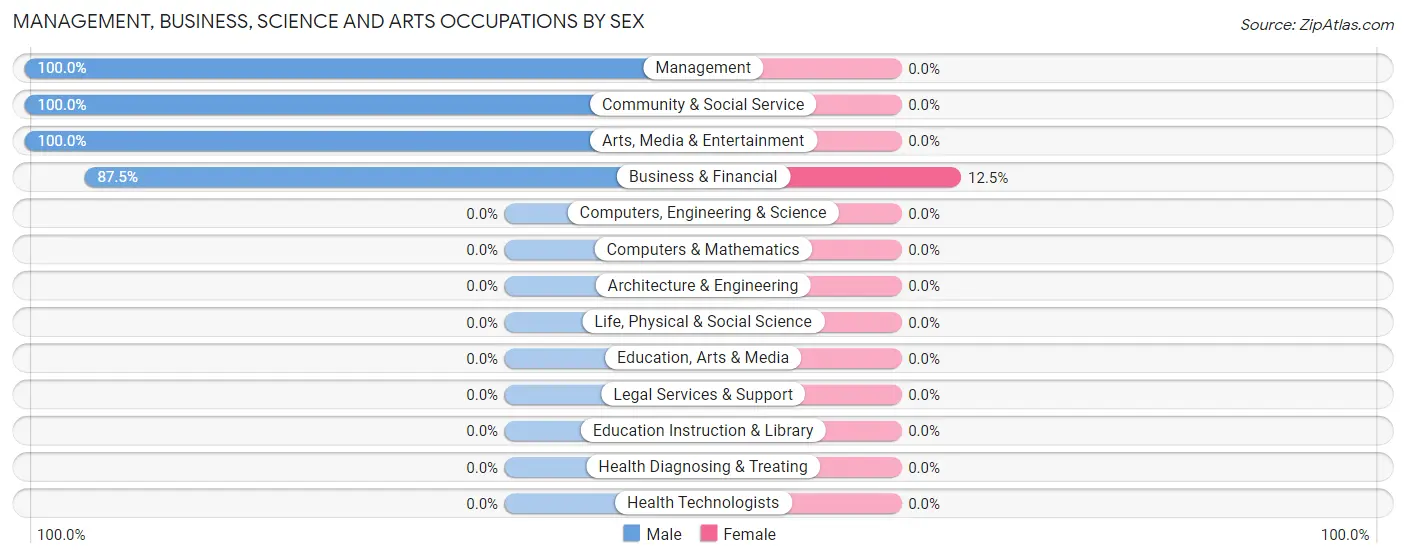
| Occupation | Male | Female |
| Management | 9 (100.0%) | 0 (0.0%) |
| Business & Financial | 7 (87.5%) | 1 (12.5%) |
| Computers, Engineering & Science | 0 (0.0%) | 0 (0.0%) |
| Computers & Mathematics | 0 (0.0%) | 0 (0.0%) |
| Architecture & Engineering | 0 (0.0%) | 0 (0.0%) |
| Life, Physical & Social Science | 0 (0.0%) | 0 (0.0%) |
| Community & Social Service | 55 (100.0%) | 0 (0.0%) |
| Education, Arts & Media | 0 (0.0%) | 0 (0.0%) |
| Legal Services & Support | 0 (0.0%) | 0 (0.0%) |
| Education Instruction & Library | 0 (0.0%) | 0 (0.0%) |
| Arts, Media & Entertainment | 55 (100.0%) | 0 (0.0%) |
| Health Diagnosing & Treating | 0 (0.0%) | 0 (0.0%) |
| Health Technologists | 0 (0.0%) | 0 (0.0%) |
| Total (Category) | 71 (98.6%) | 1 (1.4%) |
| Total (Overall) | 112 (57.7%) | 82 (42.3%) |
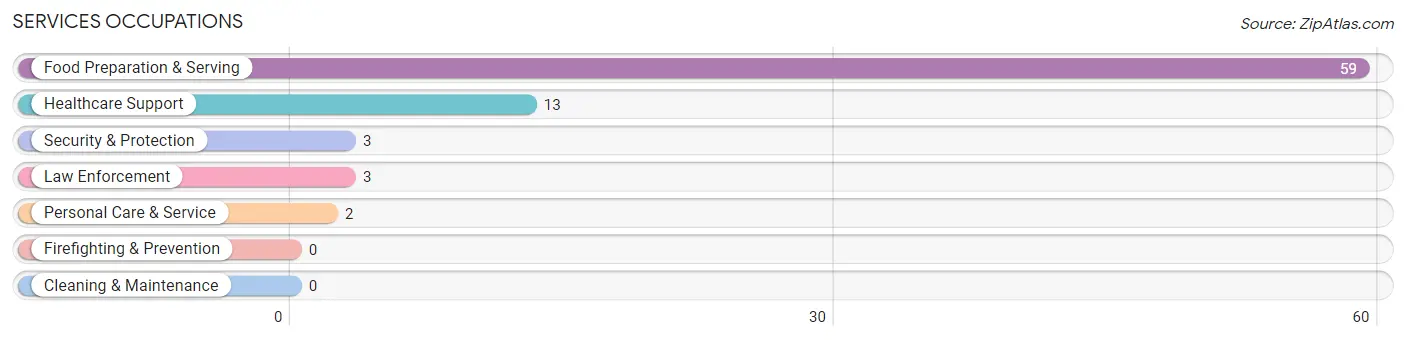
Services Occupations
The most common Services occupations in Gumbranch are Food Preparation & Serving (59 | 30.4%), Healthcare Support (13 | 6.7%), Security & Protection (3 | 1.5%), Law Enforcement (3 | 1.5%), and Personal Care & Service (2 | 1.0%).
Services Occupations by Sex
Within the Services occupations in Gumbranch, the most male-oriented occupations are Security & Protection (100.0%), Law Enforcement (100.0%), and Personal Care & Service (50.0%), while the most female-oriented occupations are Healthcare Support (100.0%), Food Preparation & Serving (100.0%), and Personal Care & Service (50.0%).
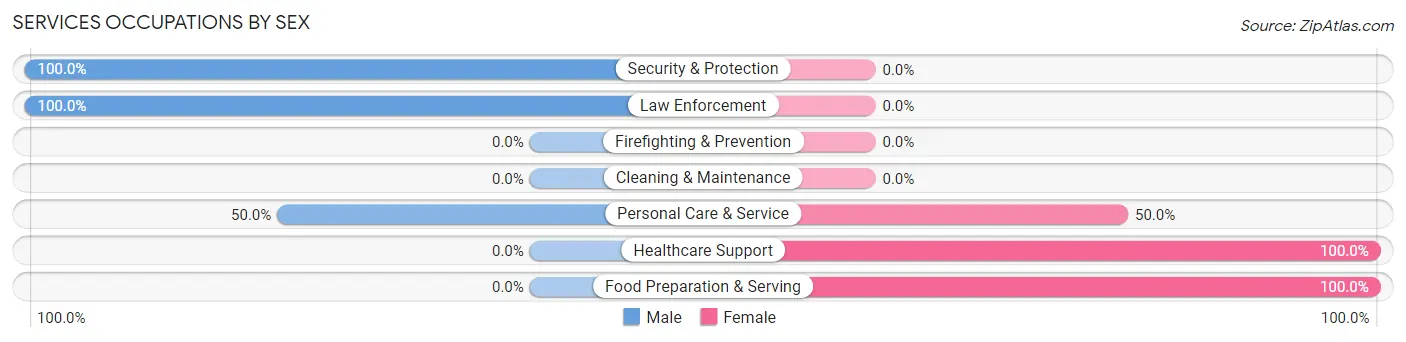
| Occupation | Male | Female |
| Healthcare Support | 0 (0.0%) | 13 (100.0%) |
| Security & Protection | 3 (100.0%) | 0 (0.0%) |
| Firefighting & Prevention | 0 (0.0%) | 0 (0.0%) |
| Law Enforcement | 3 (100.0%) | 0 (0.0%) |
| Food Preparation & Serving | 0 (0.0%) | 59 (100.0%) |
| Cleaning & Maintenance | 0 (0.0%) | 0 (0.0%) |
| Personal Care & Service | 1 (50.0%) | 1 (50.0%) |
| Total (Category) | 4 (5.2%) | 73 (94.8%) |
| Total (Overall) | 112 (57.7%) | 82 (42.3%) |
Sales and Office Occupations
The most common Sales and Office occupations in Gumbranch are , and Office & Administration (6 | 3.1%).
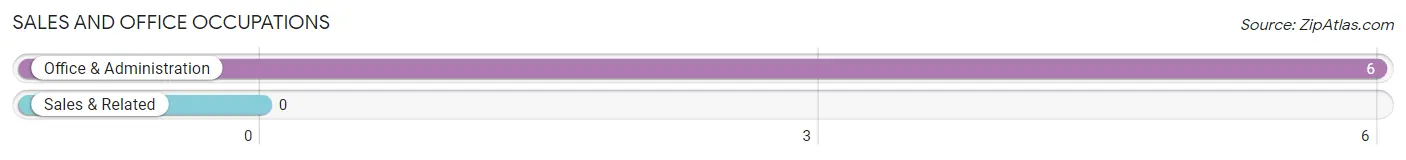
Sales and Office Occupations by Sex

| Occupation | Male | Female |
| Sales & Related | 0 (0.0%) | 0 (0.0%) |
| Office & Administration | 0 (0.0%) | 6 (100.0%) |
| Total (Category) | 0 (0.0%) | 6 (100.0%) |
| Total (Overall) | 112 (57.7%) | 82 (42.3%) |
Natural Resources, Construction and Maintenance Occupations
The most common Natural Resources, Construction and Maintenance occupations in Gumbranch are Construction & Extraction (12 | 6.2%), Installation, Maintenance & Repair (12 | 6.2%), and Farming, Fishing & Forestry (4 | 2.1%).
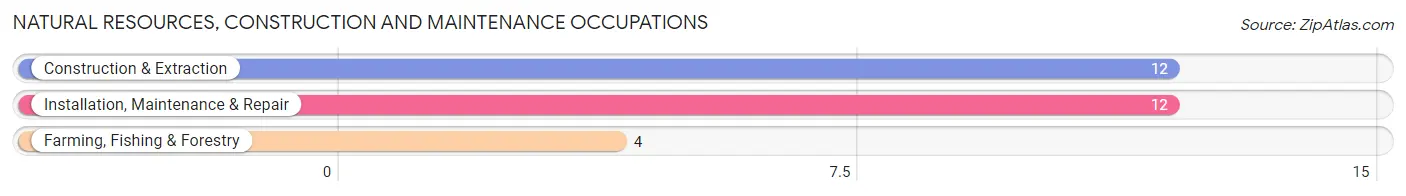
Natural Resources, Construction and Maintenance Occupations by Sex
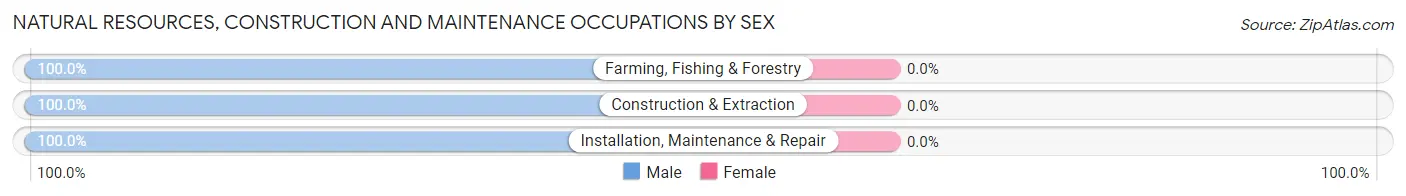
| Occupation | Male | Female |
| Farming, Fishing & Forestry | 4 (100.0%) | 0 (0.0%) |
| Construction & Extraction | 12 (100.0%) | 0 (0.0%) |
| Installation, Maintenance & Repair | 12 (100.0%) | 0 (0.0%) |
| Total (Category) | 28 (100.0%) | 0 (0.0%) |
| Total (Overall) | 112 (57.7%) | 82 (42.3%) |
Production, Transportation and Moving Occupations
The most common Production, Transportation and Moving occupations in Gumbranch are Transportation (7 | 3.6%), and Production (4 | 2.1%).
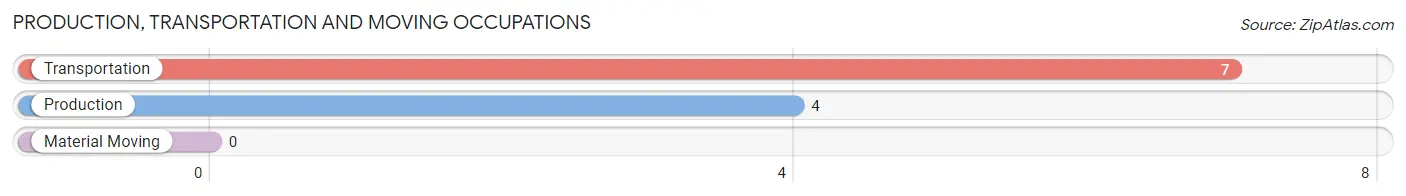
Production, Transportation and Moving Occupations by Sex
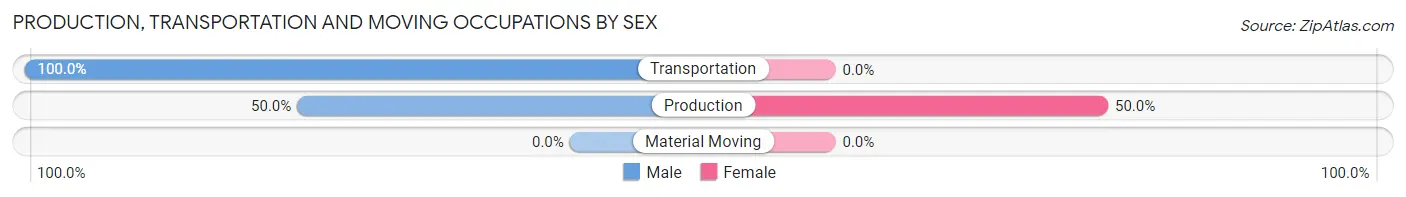
| Occupation | Male | Female |
| Production | 2 (50.0%) | 2 (50.0%) |
| Transportation | 7 (100.0%) | 0 (0.0%) |
| Material Moving | 0 (0.0%) | 0 (0.0%) |
| Total (Category) | 9 (81.8%) | 2 (18.2%) |
| Total (Overall) | 112 (57.7%) | 82 (42.3%) |
Employment Industries by Sex in Gumbranch
Employment Industries in Gumbranch
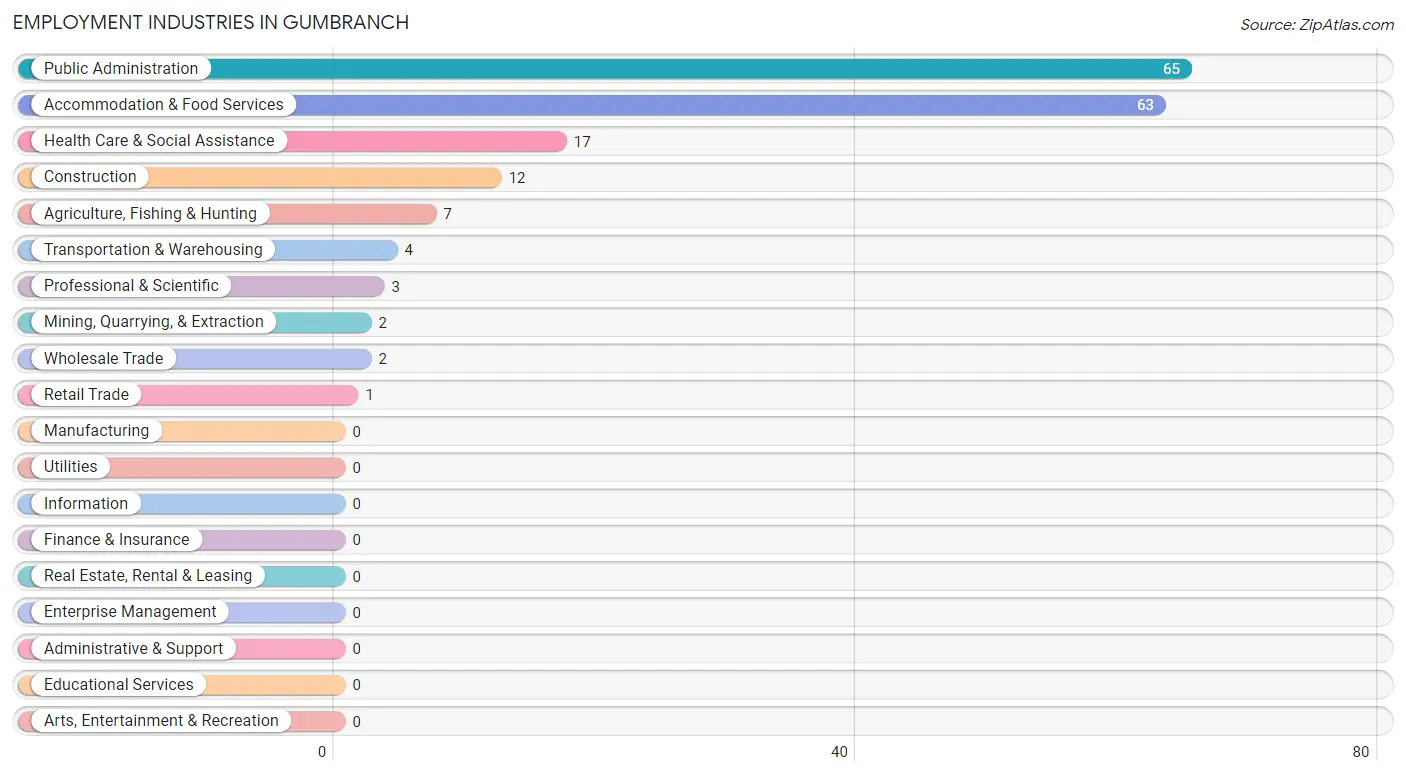
The major employment industries in Gumbranch include Public Administration (65 | 33.5%), Accommodation & Food Services (63 | 32.5%), Health Care & Social Assistance (17 | 8.8%), Construction (12 | 6.2%), and Agriculture, Fishing & Hunting (7 | 3.6%).
Employment Industries by Sex in Gumbranch
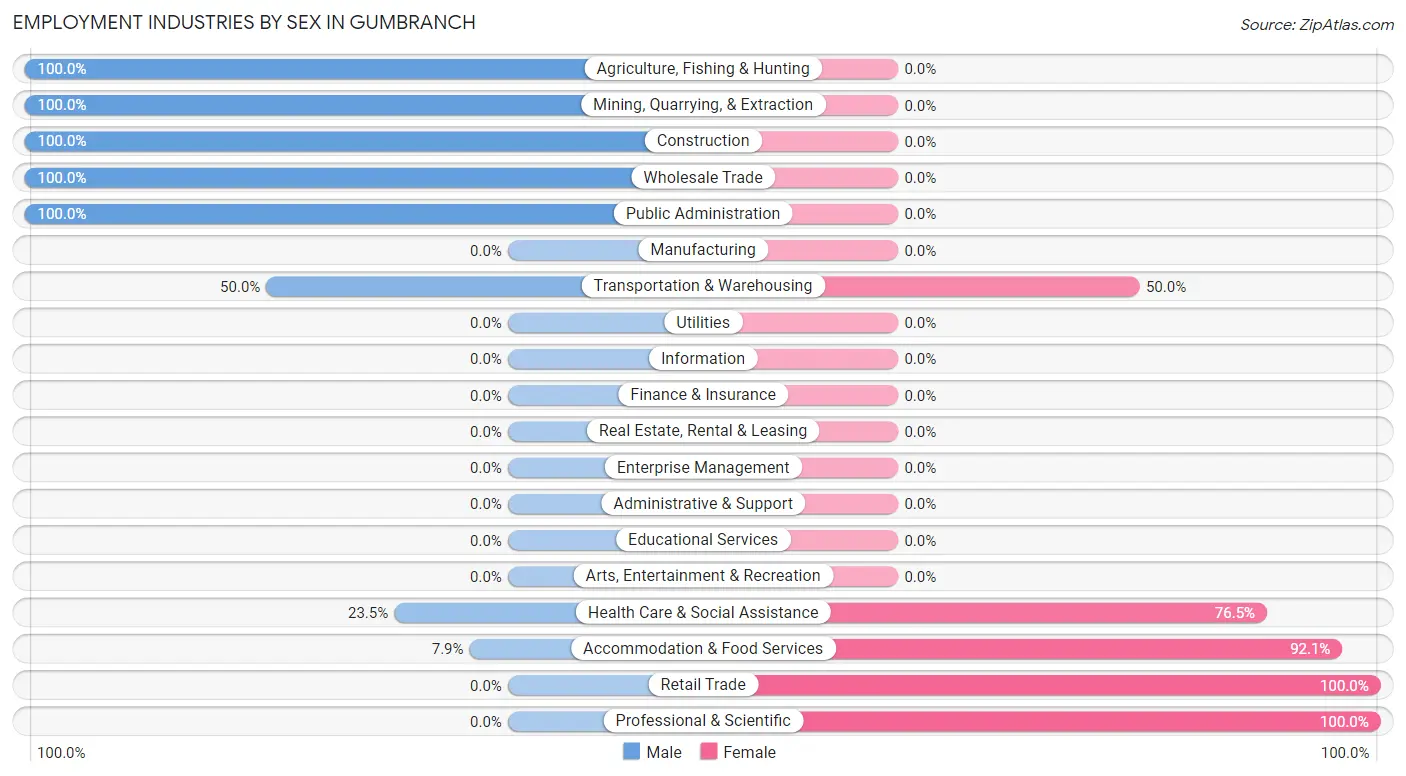
The Gumbranch industries that see more men than women are Agriculture, Fishing & Hunting (100.0%), Mining, Quarrying, & Extraction (100.0%), and Construction (100.0%), whereas the industries that tend to have a higher number of women are Retail Trade (100.0%), Professional & Scientific (100.0%), and Accommodation & Food Services (92.1%).
| Industry | Male | Female |
| Agriculture, Fishing & Hunting | 7 (100.0%) | 0 (0.0%) |
| Mining, Quarrying, & Extraction | 2 (100.0%) | 0 (0.0%) |
| Construction | 12 (100.0%) | 0 (0.0%) |
| Manufacturing | 0 (0.0%) | 0 (0.0%) |
| Wholesale Trade | 2 (100.0%) | 0 (0.0%) |
| Retail Trade | 0 (0.0%) | 1 (100.0%) |
| Transportation & Warehousing | 2 (50.0%) | 2 (50.0%) |
| Utilities | 0 (0.0%) | 0 (0.0%) |
| Information | 0 (0.0%) | 0 (0.0%) |
| Finance & Insurance | 0 (0.0%) | 0 (0.0%) |
| Real Estate, Rental & Leasing | 0 (0.0%) | 0 (0.0%) |
| Professional & Scientific | 0 (0.0%) | 3 (100.0%) |
| Enterprise Management | 0 (0.0%) | 0 (0.0%) |
| Administrative & Support | 0 (0.0%) | 0 (0.0%) |
| Educational Services | 0 (0.0%) | 0 (0.0%) |
| Health Care & Social Assistance | 4 (23.5%) | 13 (76.5%) |
| Arts, Entertainment & Recreation | 0 (0.0%) | 0 (0.0%) |
| Accommodation & Food Services | 5 (7.9%) | 58 (92.1%) |
| Public Administration | 65 (100.0%) | 0 (0.0%) |
| Total | 112 (57.7%) | 82 (42.3%) |
Education in Gumbranch
School Enrollment in Gumbranch
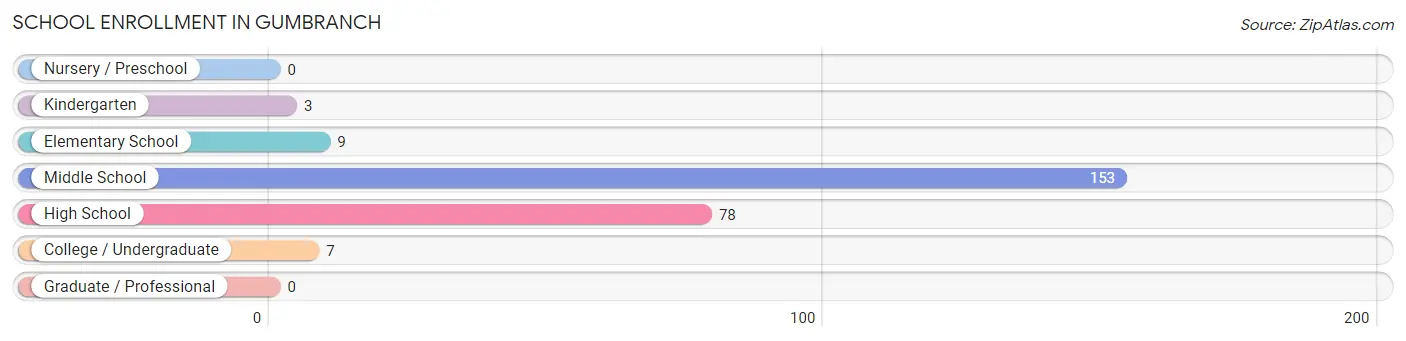
The most common levels of schooling among the 250 students in Gumbranch are middle school (153 | 61.2%), high school (78 | 31.2%), and elementary school (9 | 3.6%).
| School Level | # Students | % Students |
| Nursery / Preschool | 0 | 0.0% |
| Kindergarten | 3 | 1.2% |
| Elementary School | 9 | 3.6% |
| Middle School | 153 | 61.2% |
| High School | 78 | 31.2% |
| College / Undergraduate | 7 | 2.8% |
| Graduate / Professional | 0 | 0.0% |
| Total | 250 | 100.0% |
School Enrollment by Age by Funding Source in Gumbranch
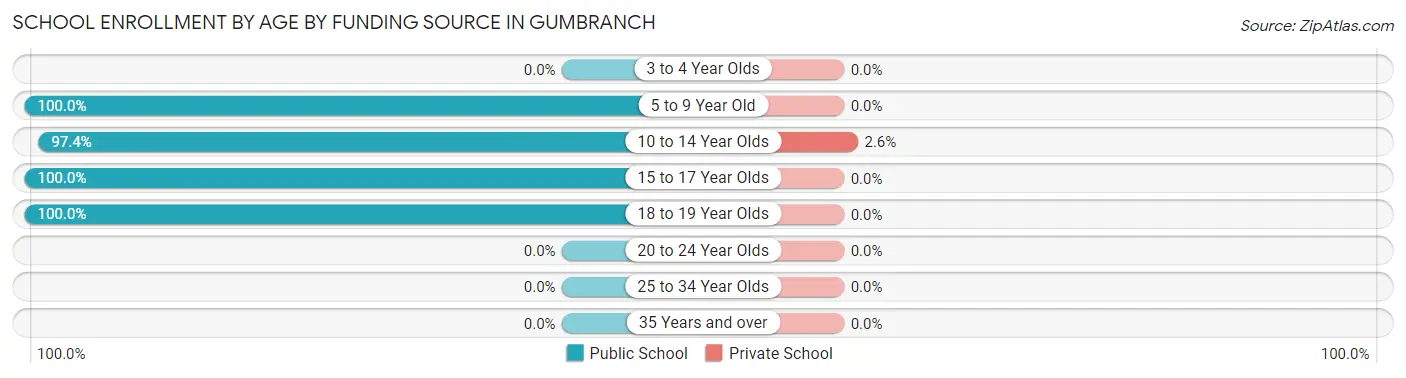
Out of a total of 250 students who are enrolled in schools in Gumbranch, 4 (1.6%) attend a private institution, while the remaining 246 (98.4%) are enrolled in public schools. The age group of 10 to 14 year olds has the highest likelihood of being enrolled in private schools, with 4 (2.6% in the age bracket) enrolled. Conversely, the age group of 5 to 9 year old has the lowest likelihood of being enrolled in a private school, with 12 (100.0% in the age bracket) attending a public institution.
| Age Bracket | Public School | Private School |
| 3 to 4 Year Olds | 0 (0.0%) | 0 (0.0%) |
| 5 to 9 Year Old | 12 (100.0%) | 0 (0.0%) |
| 10 to 14 Year Olds | 151 (97.4%) | 4 (2.6%) |
| 15 to 17 Year Olds | 76 (100.0%) | 0 (0.0%) |
| 18 to 19 Year Olds | 7 (100.0%) | 0 (0.0%) |
| 20 to 24 Year Olds | 0 (0.0%) | 0 (0.0%) |
| 25 to 34 Year Olds | 0 (0.0%) | 0 (0.0%) |
| 35 Years and over | 0 (0.0%) | 0 (0.0%) |
| Total | 246 (98.4%) | 4 (1.6%) |
Educational Attainment by Field of Study in Gumbranch
Business (53 | 93.0%), education (2 | 3.5%), and arts & humanities (2 | 3.5%) are the most common fields of study among 57 individuals in Gumbranch who have obtained a bachelor's degree or higher.
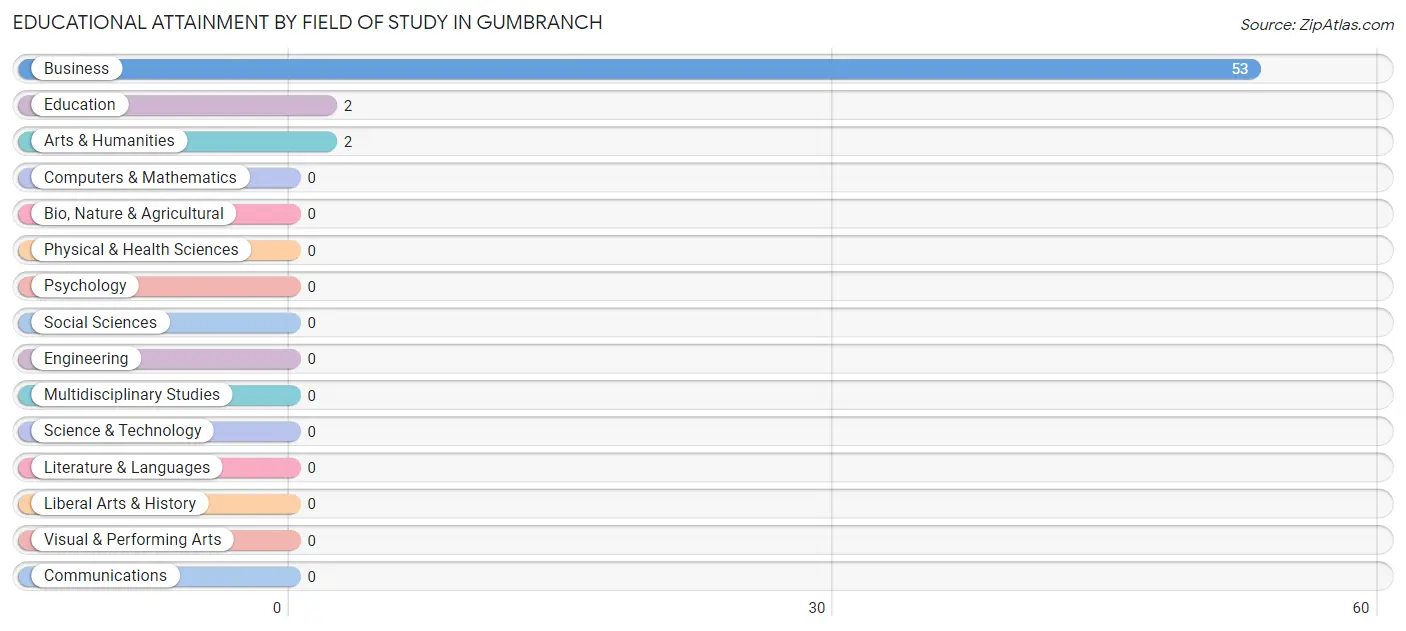
| Field of Study | # Graduates | % Graduates |
| Computers & Mathematics | 0 | 0.0% |
| Bio, Nature & Agricultural | 0 | 0.0% |
| Physical & Health Sciences | 0 | 0.0% |
| Psychology | 0 | 0.0% |
| Social Sciences | 0 | 0.0% |
| Engineering | 0 | 0.0% |
| Multidisciplinary Studies | 0 | 0.0% |
| Science & Technology | 0 | 0.0% |
| Business | 53 | 93.0% |
| Education | 2 | 3.5% |
| Literature & Languages | 0 | 0.0% |
| Liberal Arts & History | 0 | 0.0% |
| Visual & Performing Arts | 0 | 0.0% |
| Communications | 0 | 0.0% |
| Arts & Humanities | 2 | 3.5% |
| Total | 57 | 100.0% |
Transportation & Commute in Gumbranch
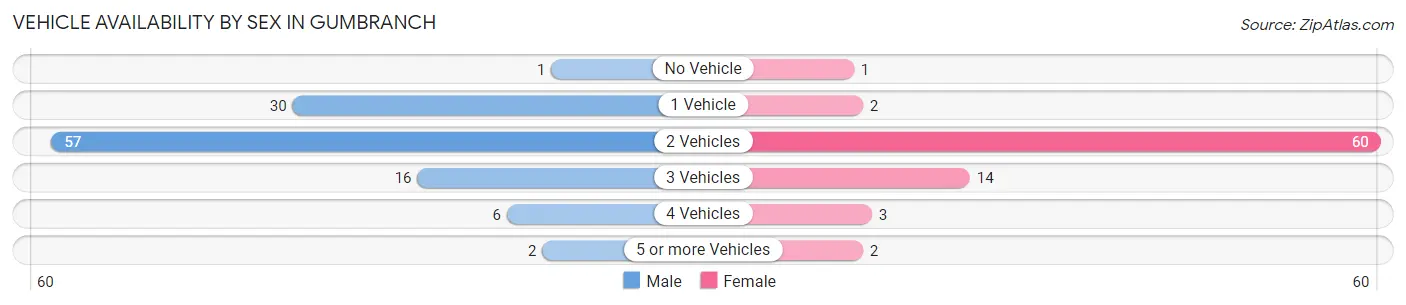
Vehicle Availability by Sex in Gumbranch
The most prevalent vehicle ownership categories in Gumbranch are males with 2 vehicles (57, accounting for 50.9%) and females with 2 vehicles (60, making up 69.5%).
| Vehicles Available | Male | Female |
| No Vehicle | 1 (0.9%) | 1 (1.2%) |
| 1 Vehicle | 30 (26.8%) | 2 (2.4%) |
| 2 Vehicles | 57 (50.9%) | 60 (73.2%) |
| 3 Vehicles | 16 (14.3%) | 14 (17.1%) |
| 4 Vehicles | 6 (5.4%) | 3 (3.7%) |
| 5 or more Vehicles | 2 (1.8%) | 2 (2.4%) |
| Total | 112 (100.0%) | 82 (100.0%) |
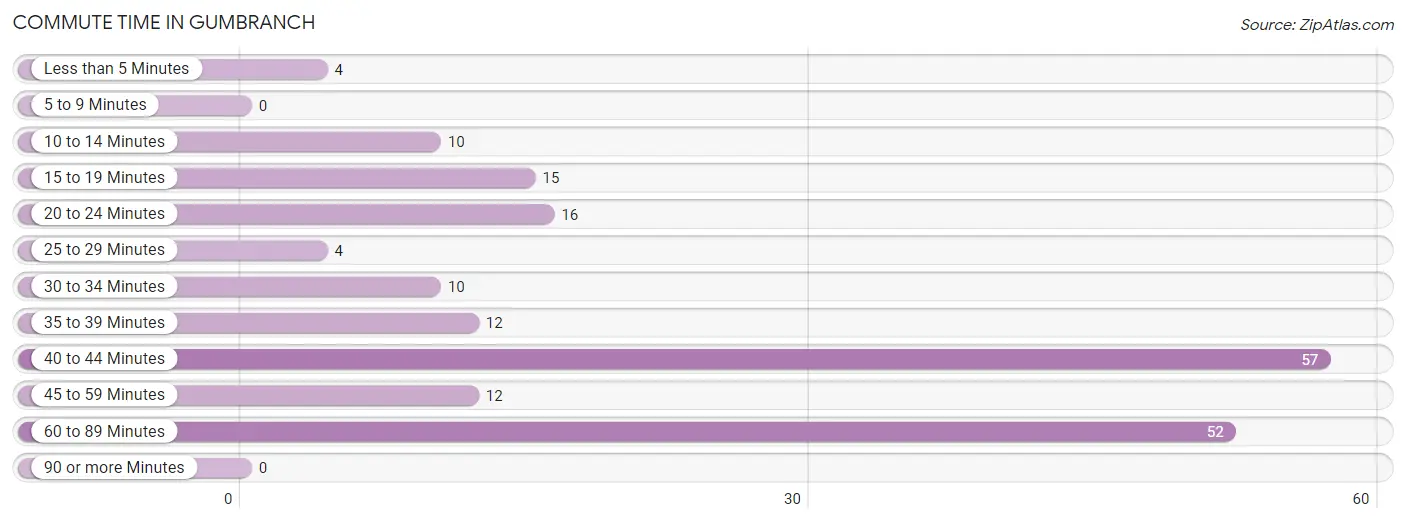
Commute Time in Gumbranch
The most frequently occuring commute durations in Gumbranch are 40 to 44 minutes (57 commuters, 29.7%), 60 to 89 minutes (52 commuters, 27.1%), and 20 to 24 minutes (16 commuters, 8.3%).
| Commute Time | # Commuters | % Commuters |
| Less than 5 Minutes | 4 | 2.1% |
| 5 to 9 Minutes | 0 | 0.0% |
| 10 to 14 Minutes | 10 | 5.2% |
| 15 to 19 Minutes | 15 | 7.8% |
| 20 to 24 Minutes | 16 | 8.3% |
| 25 to 29 Minutes | 4 | 2.1% |
| 30 to 34 Minutes | 10 | 5.2% |
| 35 to 39 Minutes | 12 | 6.2% |
| 40 to 44 Minutes | 57 | 29.7% |
| 45 to 59 Minutes | 12 | 6.2% |
| 60 to 89 Minutes | 52 | 27.1% |
| 90 or more Minutes | 0 | 0.0% |
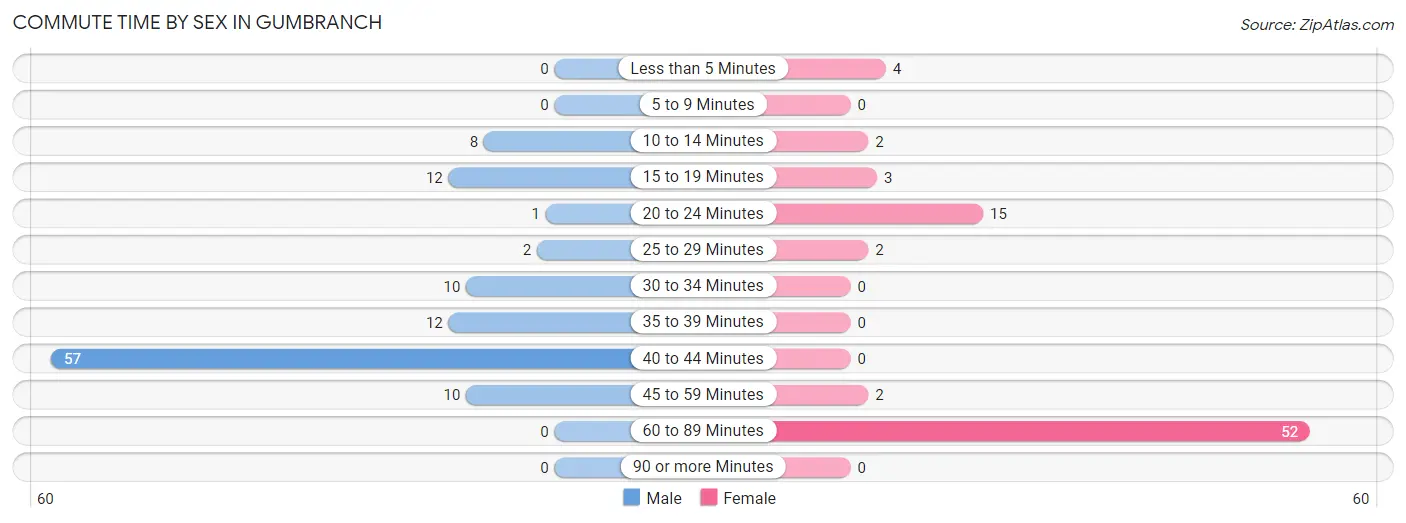
Commute Time by Sex in Gumbranch
The most common commute times in Gumbranch are 40 to 44 minutes (57 commuters, 50.9%) for males and 60 to 89 minutes (52 commuters, 65.0%) for females.
| Commute Time | Male | Female |
| Less than 5 Minutes | 0 (0.0%) | 4 (5.0%) |
| 5 to 9 Minutes | 0 (0.0%) | 0 (0.0%) |
| 10 to 14 Minutes | 8 (7.1%) | 2 (2.5%) |
| 15 to 19 Minutes | 12 (10.7%) | 3 (3.7%) |
| 20 to 24 Minutes | 1 (0.9%) | 15 (18.8%) |
| 25 to 29 Minutes | 2 (1.8%) | 2 (2.5%) |
| 30 to 34 Minutes | 10 (8.9%) | 0 (0.0%) |
| 35 to 39 Minutes | 12 (10.7%) | 0 (0.0%) |
| 40 to 44 Minutes | 57 (50.9%) | 0 (0.0%) |
| 45 to 59 Minutes | 10 (8.9%) | 2 (2.5%) |
| 60 to 89 Minutes | 0 (0.0%) | 52 (65.0%) |
| 90 or more Minutes | 0 (0.0%) | 0 (0.0%) |
Time of Departure to Work by Sex in Gumbranch
The most frequent times of departure to work in Gumbranch are 7:00 AM to 7:29 AM (78, 69.6%) for males and 7:00 AM to 7:29 AM (66, 82.5%) for females.
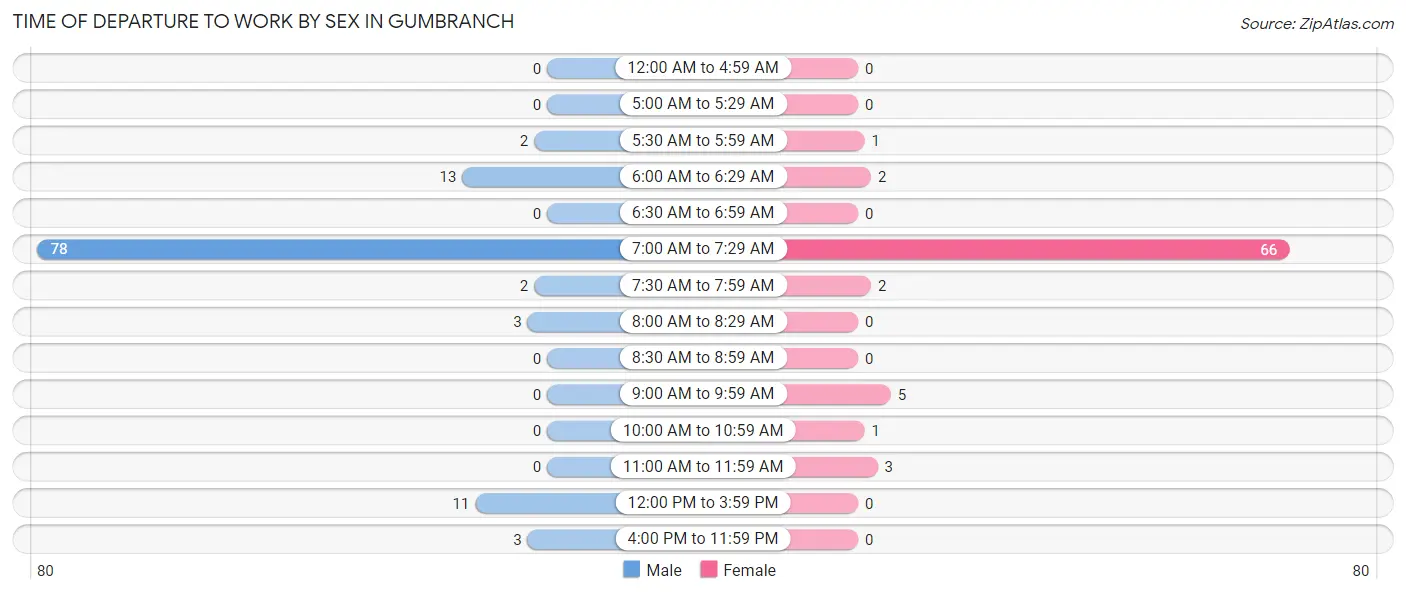
| Time of Departure | Male | Female |
| 12:00 AM to 4:59 AM | 0 (0.0%) | 0 (0.0%) |
| 5:00 AM to 5:29 AM | 0 (0.0%) | 0 (0.0%) |
| 5:30 AM to 5:59 AM | 2 (1.8%) | 1 (1.3%) |
| 6:00 AM to 6:29 AM | 13 (11.6%) | 2 (2.5%) |
| 6:30 AM to 6:59 AM | 0 (0.0%) | 0 (0.0%) |
| 7:00 AM to 7:29 AM | 78 (69.6%) | 66 (82.5%) |
| 7:30 AM to 7:59 AM | 2 (1.8%) | 2 (2.5%) |
| 8:00 AM to 8:29 AM | 3 (2.7%) | 0 (0.0%) |
| 8:30 AM to 8:59 AM | 0 (0.0%) | 0 (0.0%) |
| 9:00 AM to 9:59 AM | 0 (0.0%) | 5 (6.2%) |
| 10:00 AM to 10:59 AM | 0 (0.0%) | 1 (1.3%) |
| 11:00 AM to 11:59 AM | 0 (0.0%) | 3 (3.7%) |
| 12:00 PM to 3:59 PM | 11 (9.8%) | 0 (0.0%) |
| 4:00 PM to 11:59 PM | 3 (2.7%) | 0 (0.0%) |
| Total | 112 (100.0%) | 80 (100.0%) |
Housing Occupancy in Gumbranch
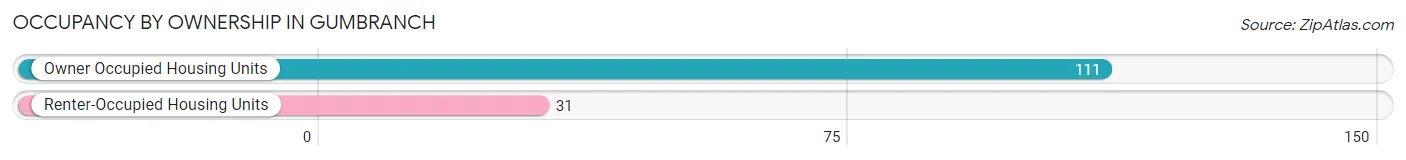
Occupancy by Ownership in Gumbranch
Of the total 142 dwellings in Gumbranch, owner-occupied units account for 111 (78.2%), while renter-occupied units make up 31 (21.8%).
| Occupancy | # Housing Units | % Housing Units |
| Owner Occupied Housing Units | 111 | 78.2% |
| Renter-Occupied Housing Units | 31 | 21.8% |
| Total Occupied Housing Units | 142 | 100.0% |
Occupancy by Household Size in Gumbranch
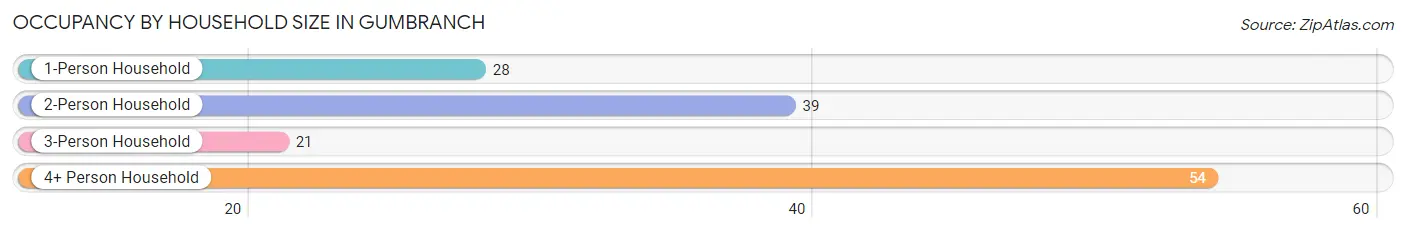
| Household Size | # Housing Units | % Housing Units |
| 1-Person Household | 28 | 19.7% |
| 2-Person Household | 39 | 27.5% |
| 3-Person Household | 21 | 14.8% |
| 4+ Person Household | 54 | 38.0% |
| Total Housing Units | 142 | 100.0% |
Occupancy by Ownership by Household Size in Gumbranch
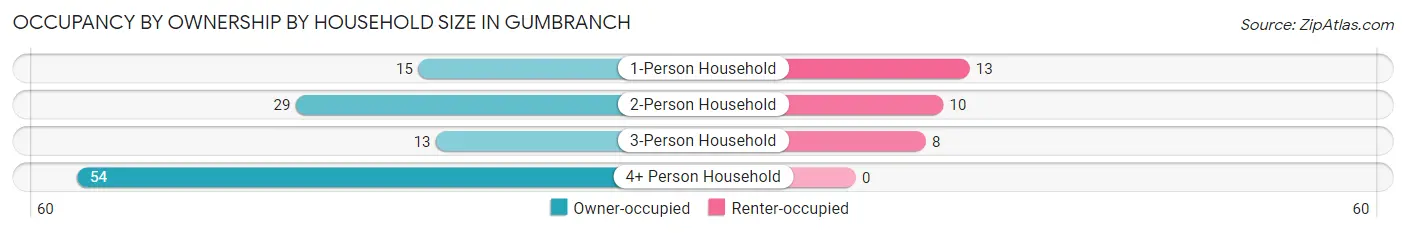
| Household Size | Owner-occupied | Renter-occupied |
| 1-Person Household | 15 (53.6%) | 13 (46.4%) |
| 2-Person Household | 29 (74.4%) | 10 (25.6%) |
| 3-Person Household | 13 (61.9%) | 8 (38.1%) |
| 4+ Person Household | 54 (100.0%) | 0 (0.0%) |
| Total Housing Units | 111 (78.2%) | 31 (21.8%) |
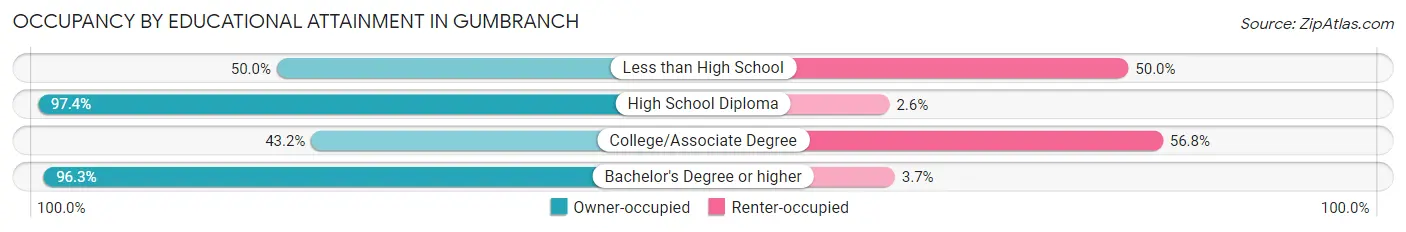
Occupancy by Educational Attainment in Gumbranch
| Household Size | Owner-occupied | Renter-occupied |
| Less than High School | 3 (50.0%) | 3 (50.0%) |
| High School Diploma | 37 (97.4%) | 1 (2.6%) |
| College/Associate Degree | 19 (43.2%) | 25 (56.8%) |
| Bachelor's Degree or higher | 52 (96.3%) | 2 (3.7%) |
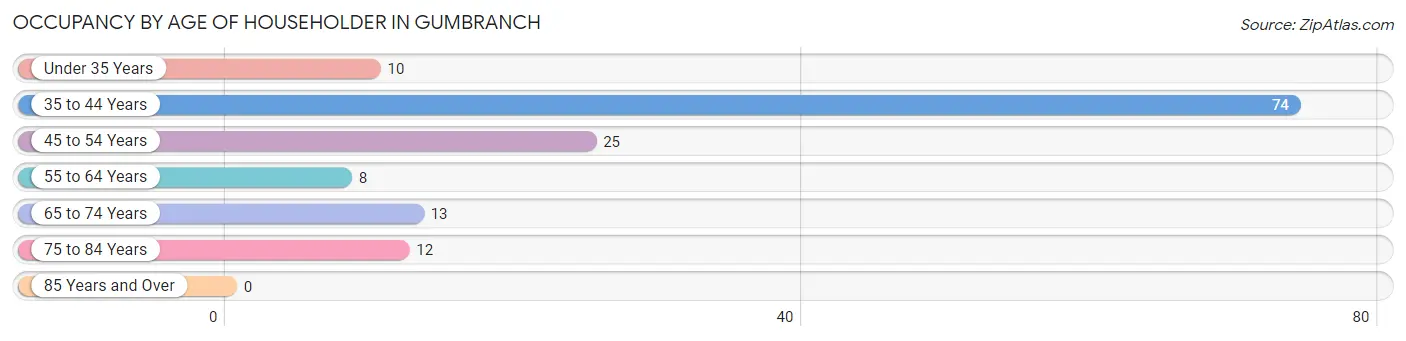
Occupancy by Age of Householder in Gumbranch
| Age Bracket | # Households | % Households |
| Under 35 Years | 10 | 7.0% |
| 35 to 44 Years | 74 | 52.1% |
| 45 to 54 Years | 25 | 17.6% |
| 55 to 64 Years | 8 | 5.6% |
| 65 to 74 Years | 13 | 9.1% |
| 75 to 84 Years | 12 | 8.5% |
| 85 Years and Over | 0 | 0.0% |
| Total | 142 | 100.0% |
Housing Finances in Gumbranch
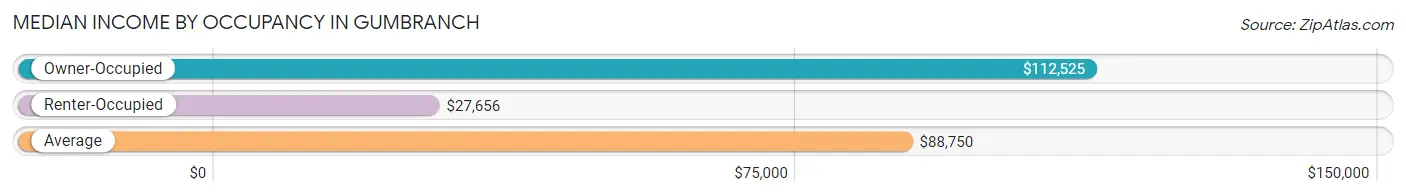
Median Income by Occupancy in Gumbranch
| Occupancy Type | # Households | Median Income |
| Owner-Occupied | 111 (78.2%) | $112,525 |
| Renter-Occupied | 31 (21.8%) | $27,656 |
| Average | 142 (100.0%) | $88,750 |
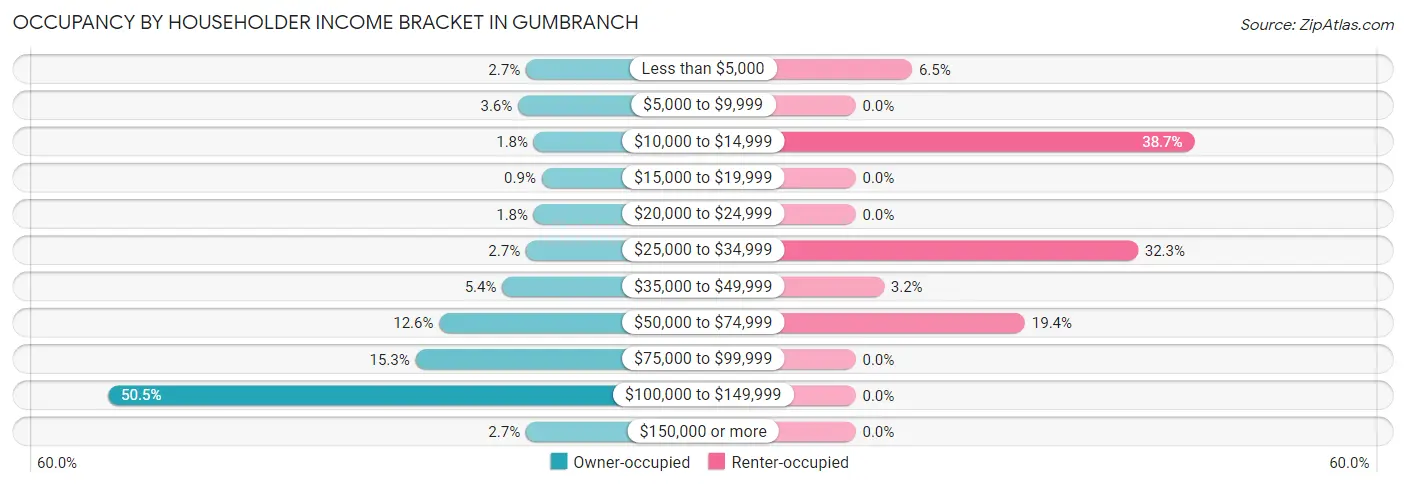
Occupancy by Householder Income Bracket in Gumbranch
| Income Bracket | Owner-occupied | Renter-occupied |
| Less than $5,000 | 3 (2.7%) | 2 (6.5%) |
| $5,000 to $9,999 | 4 (3.6%) | 0 (0.0%) |
| $10,000 to $14,999 | 2 (1.8%) | 12 (38.7%) |
| $15,000 to $19,999 | 1 (0.9%) | 0 (0.0%) |
| $20,000 to $24,999 | 2 (1.8%) | 0 (0.0%) |
| $25,000 to $34,999 | 3 (2.7%) | 10 (32.3%) |
| $35,000 to $49,999 | 6 (5.4%) | 1 (3.2%) |
| $50,000 to $74,999 | 14 (12.6%) | 6 (19.4%) |
| $75,000 to $99,999 | 17 (15.3%) | 0 (0.0%) |
| $100,000 to $149,999 | 56 (50.4%) | 0 (0.0%) |
| $150,000 or more | 3 (2.7%) | 0 (0.0%) |
| Total | 111 (100.0%) | 31 (100.0%) |
Monthly Housing Cost Tiers in Gumbranch
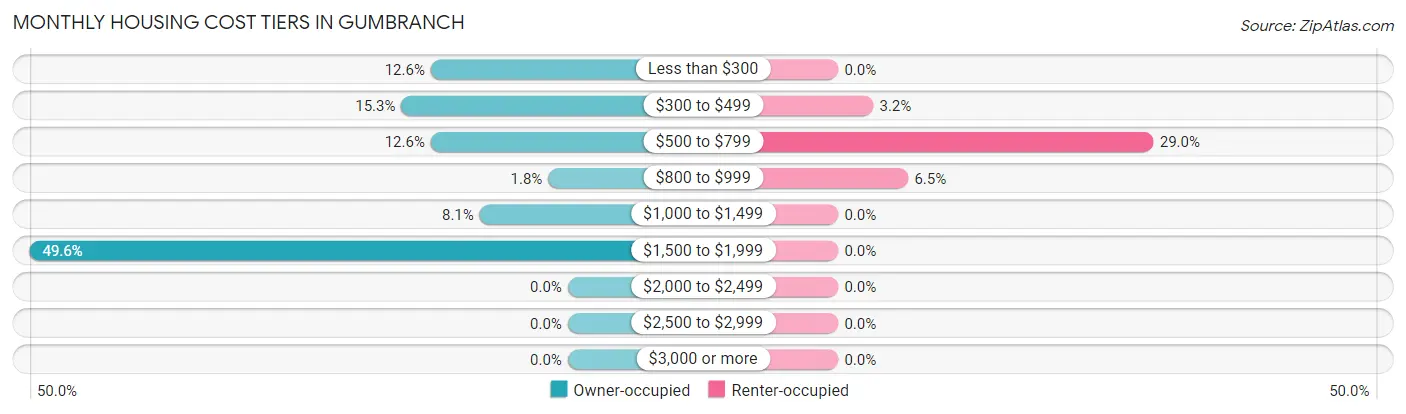
| Monthly Cost | Owner-occupied | Renter-occupied |
| Less than $300 | 14 (12.6%) | 0 (0.0%) |
| $300 to $499 | 17 (15.3%) | 1 (3.2%) |
| $500 to $799 | 14 (12.6%) | 9 (29.0%) |
| $800 to $999 | 2 (1.8%) | 2 (6.5%) |
| $1,000 to $1,499 | 9 (8.1%) | 0 (0.0%) |
| $1,500 to $1,999 | 55 (49.5%) | 0 (0.0%) |
| $2,000 to $2,499 | 0 (0.0%) | 0 (0.0%) |
| $2,500 to $2,999 | 0 (0.0%) | 0 (0.0%) |
| $3,000 or more | 0 (0.0%) | 0 (0.0%) |
| Total | 111 (100.0%) | 31 (100.0%) |
Physical Housing Characteristics in Gumbranch
Housing Structures in Gumbranch
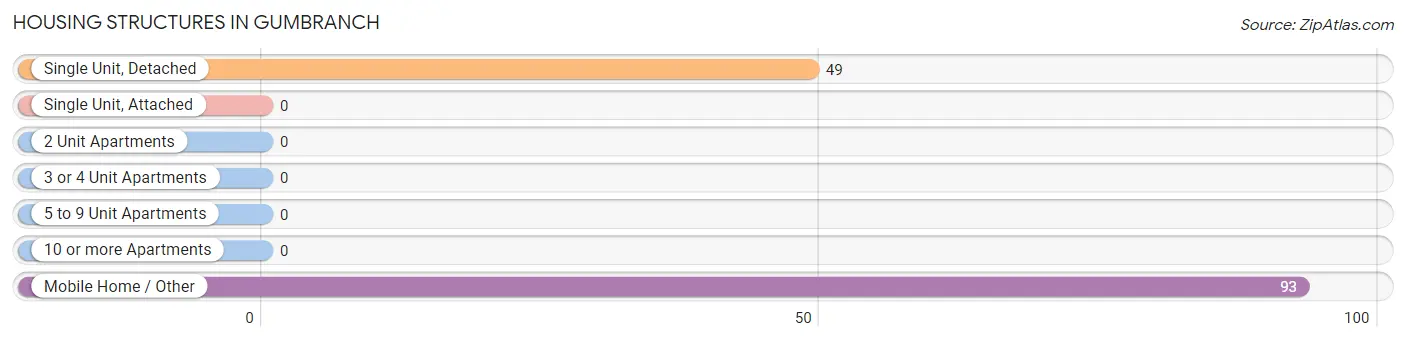
| Structure Type | # Housing Units | % Housing Units |
| Single Unit, Detached | 49 | 34.5% |
| Single Unit, Attached | 0 | 0.0% |
| 2 Unit Apartments | 0 | 0.0% |
| 3 or 4 Unit Apartments | 0 | 0.0% |
| 5 to 9 Unit Apartments | 0 | 0.0% |
| 10 or more Apartments | 0 | 0.0% |
| Mobile Home / Other | 93 | 65.5% |
| Total | 142 | 100.0% |
Housing Structures by Occupancy in Gumbranch
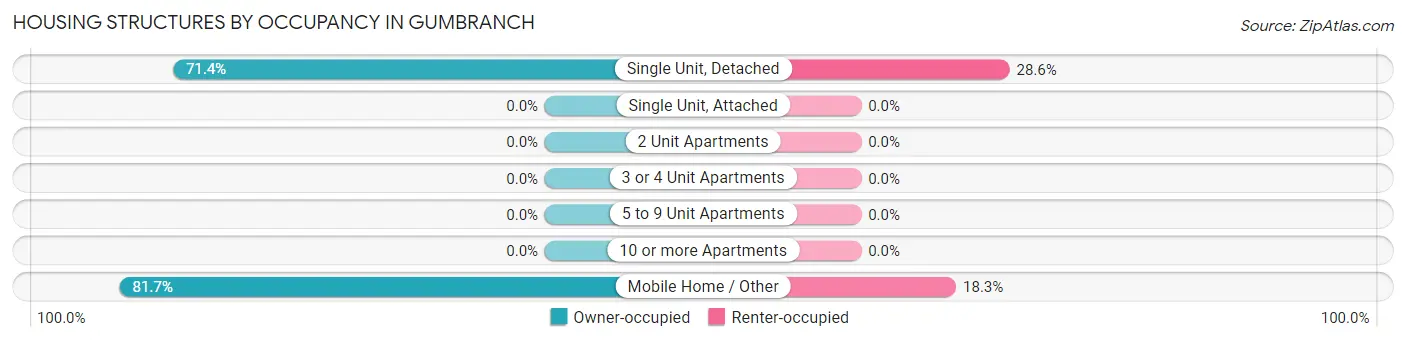
| Structure Type | Owner-occupied | Renter-occupied |
| Single Unit, Detached | 35 (71.4%) | 14 (28.6%) |
| Single Unit, Attached | 0 (0.0%) | 0 (0.0%) |
| 2 Unit Apartments | 0 (0.0%) | 0 (0.0%) |
| 3 or 4 Unit Apartments | 0 (0.0%) | 0 (0.0%) |
| 5 to 9 Unit Apartments | 0 (0.0%) | 0 (0.0%) |
| 10 or more Apartments | 0 (0.0%) | 0 (0.0%) |
| Mobile Home / Other | 76 (81.7%) | 17 (18.3%) |
| Total | 111 (78.2%) | 31 (21.8%) |
Housing Structures by Number of Rooms in Gumbranch
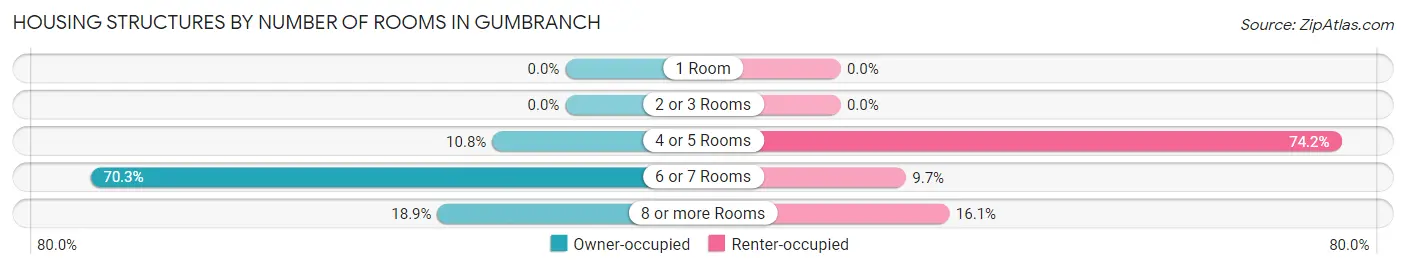
| Number of Rooms | Owner-occupied | Renter-occupied |
| 1 Room | 0 (0.0%) | 0 (0.0%) |
| 2 or 3 Rooms | 0 (0.0%) | 0 (0.0%) |
| 4 or 5 Rooms | 12 (10.8%) | 23 (74.2%) |
| 6 or 7 Rooms | 78 (70.3%) | 3 (9.7%) |
| 8 or more Rooms | 21 (18.9%) | 5 (16.1%) |
| Total | 111 (100.0%) | 31 (100.0%) |
Housing Structure by Heating Type in Gumbranch
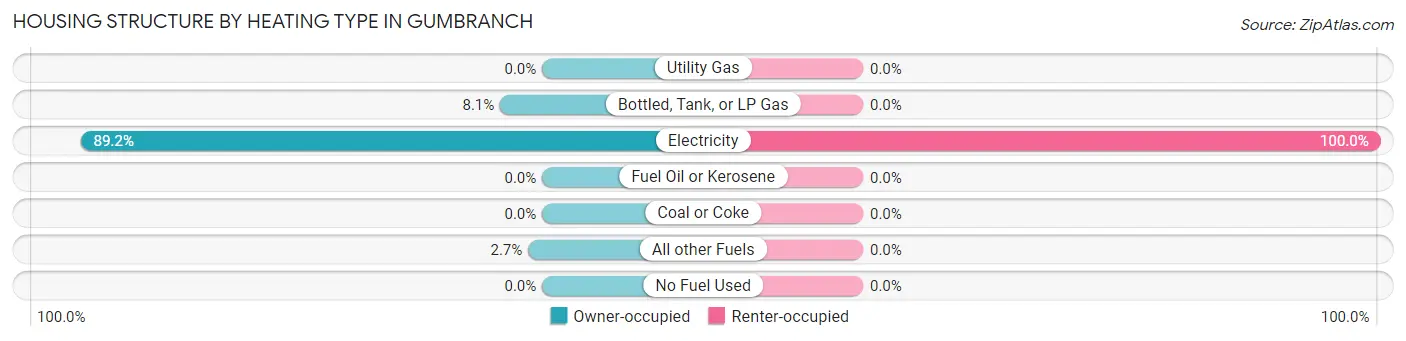
| Heating Type | Owner-occupied | Renter-occupied |
| Utility Gas | 0 (0.0%) | 0 (0.0%) |
| Bottled, Tank, or LP Gas | 9 (8.1%) | 0 (0.0%) |
| Electricity | 99 (89.2%) | 31 (100.0%) |
| Fuel Oil or Kerosene | 0 (0.0%) | 0 (0.0%) |
| Coal or Coke | 0 (0.0%) | 0 (0.0%) |
| All other Fuels | 3 (2.7%) | 0 (0.0%) |
| No Fuel Used | 0 (0.0%) | 0 (0.0%) |
| Total | 111 (100.0%) | 31 (100.0%) |
Household Vehicle Usage in Gumbranch
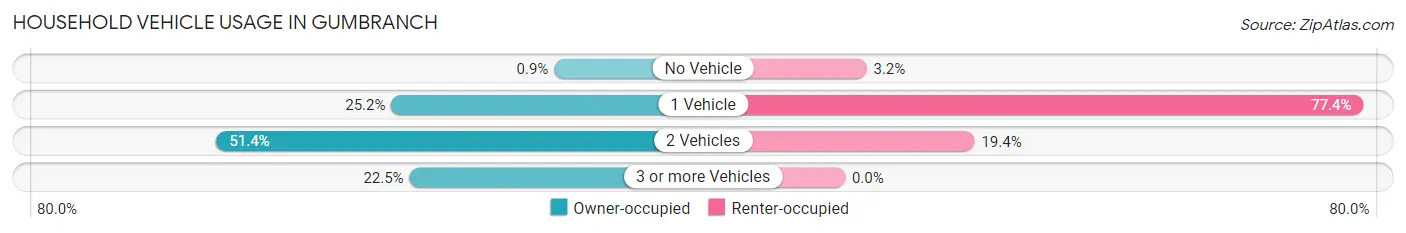
| Vehicles per Household | Owner-occupied | Renter-occupied |
| No Vehicle | 1 (0.9%) | 1 (3.2%) |
| 1 Vehicle | 28 (25.2%) | 24 (77.4%) |
| 2 Vehicles | 57 (51.3%) | 6 (19.4%) |
| 3 or more Vehicles | 25 (22.5%) | 0 (0.0%) |
| Total | 111 (100.0%) | 31 (100.0%) |
Real Estate & Mortgages in Gumbranch
Real Estate and Mortgage Overview in Gumbranch
| Characteristic | Without Mortgage | With Mortgage |
| Housing Units | 42 | 69 |
| Median Property Value | $134,100 | $94,900 |
| Median Household Income | $56,250 | $3 |
| Monthly Housing Costs | $327 | $0 |
| Real Estate Taxes | $823 | $1 |
Property Value by Mortgage Status in Gumbranch
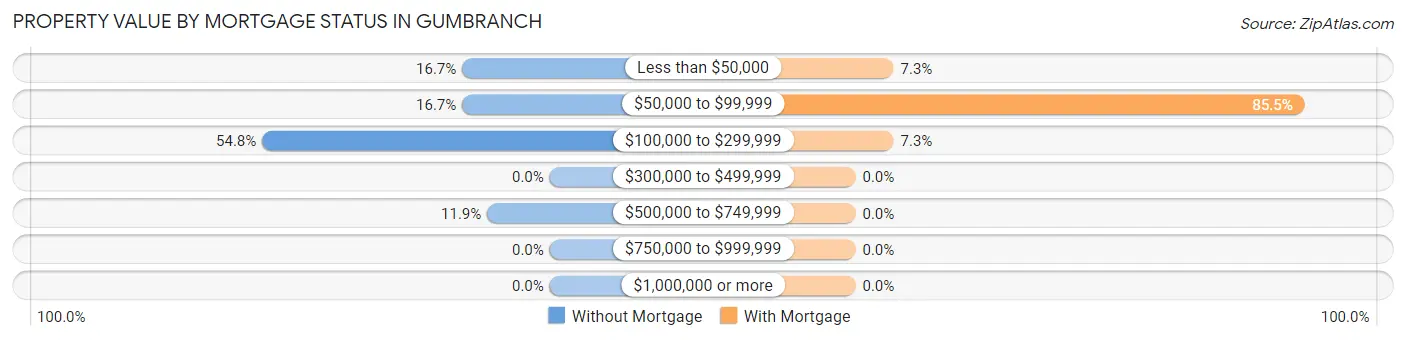
| Property Value | Without Mortgage | With Mortgage |
| Less than $50,000 | 7 (16.7%) | 5 (7.2%) |
| $50,000 to $99,999 | 7 (16.7%) | 59 (85.5%) |
| $100,000 to $299,999 | 23 (54.8%) | 5 (7.2%) |
| $300,000 to $499,999 | 0 (0.0%) | 0 (0.0%) |
| $500,000 to $749,999 | 5 (11.9%) | 0 (0.0%) |
| $750,000 to $999,999 | 0 (0.0%) | 0 (0.0%) |
| $1,000,000 or more | 0 (0.0%) | 0 (0.0%) |
| Total | 42 (100.0%) | 69 (100.0%) |
Household Income by Mortgage Status in Gumbranch
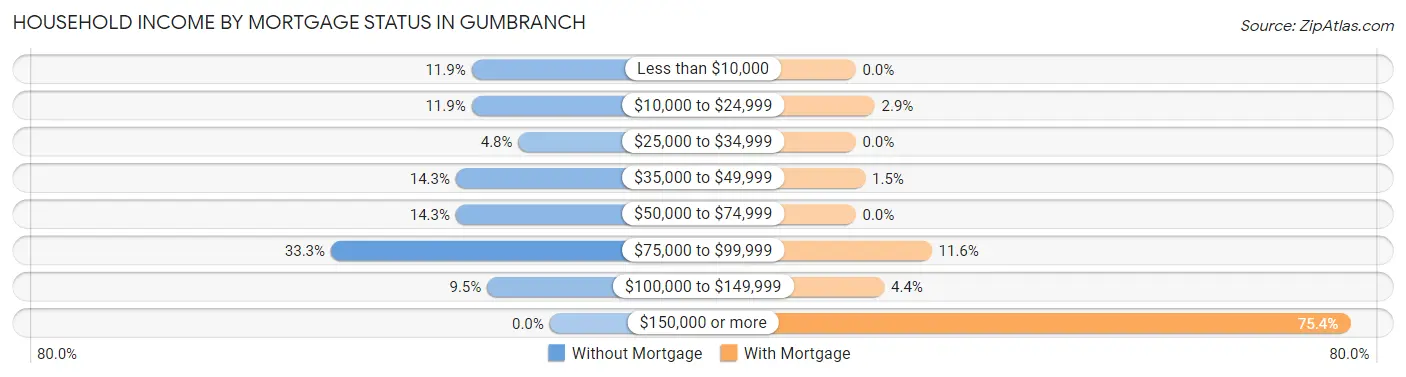
| Household Income | Without Mortgage | With Mortgage |
| Less than $10,000 | 5 (11.9%) | 0 (0.0%) |
| $10,000 to $24,999 | 5 (11.9%) | 2 (2.9%) |
| $25,000 to $34,999 | 2 (4.8%) | 0 (0.0%) |
| $35,000 to $49,999 | 6 (14.3%) | 1 (1.5%) |
| $50,000 to $74,999 | 6 (14.3%) | 0 (0.0%) |
| $75,000 to $99,999 | 14 (33.3%) | 8 (11.6%) |
| $100,000 to $149,999 | 4 (9.5%) | 3 (4.3%) |
| $150,000 or more | 0 (0.0%) | 52 (75.4%) |
| Total | 42 (100.0%) | 69 (100.0%) |
Property Value to Household Income Ratio in Gumbranch
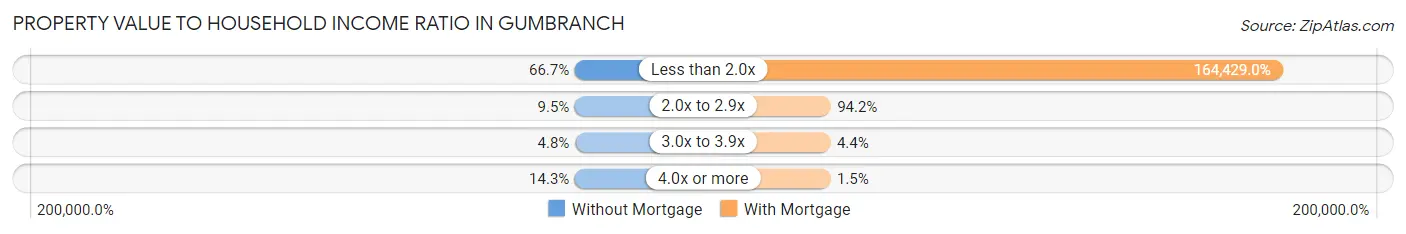
| Value-to-Income Ratio | Without Mortgage | With Mortgage |
| Less than 2.0x | 28 (66.7%) | 113,456 (164,429.0%) |
| 2.0x to 2.9x | 4 (9.5%) | 65 (94.2%) |
| 3.0x to 3.9x | 2 (4.8%) | 3 (4.3%) |
| 4.0x or more | 6 (14.3%) | 1 (1.5%) |
| Total | 42 (100.0%) | 69 (100.0%) |
Real Estate Taxes by Mortgage Status in Gumbranch
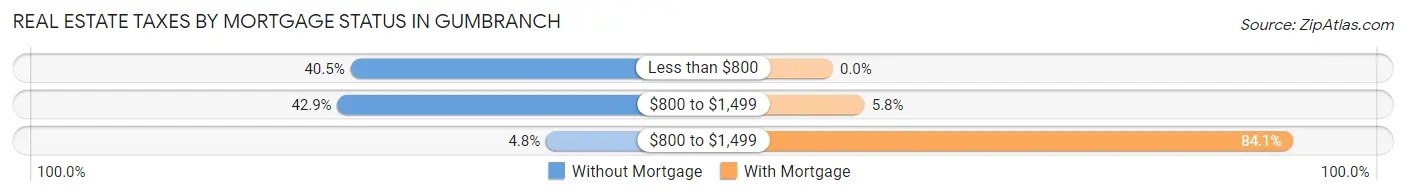
| Property Taxes | Without Mortgage | With Mortgage |
| Less than $800 | 17 (40.5%) | 0 (0.0%) |
| $800 to $1,499 | 18 (42.9%) | 4 (5.8%) |
| $800 to $1,499 | 2 (4.8%) | 58 (84.1%) |
| Total | 42 (100.0%) | 69 (100.0%) |
Health & Disability in Gumbranch
Health Insurance Coverage by Age in Gumbranch
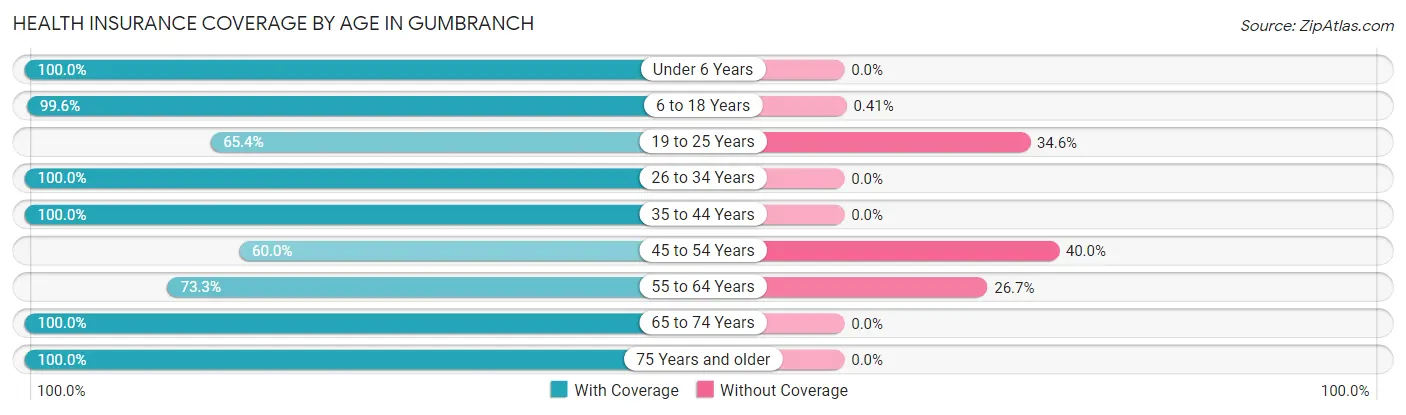
| Age Bracket | With Coverage | Without Coverage |
| Under 6 Years | 141 (100.0%) | 0 (0.0%) |
| 6 to 18 Years | 242 (99.6%) | 1 (0.4%) |
| 19 to 25 Years | 17 (65.4%) | 9 (34.6%) |
| 26 to 34 Years | 15 (100.0%) | 0 (0.0%) |
| 35 to 44 Years | 131 (100.0%) | 0 (0.0%) |
| 45 to 54 Years | 24 (60.0%) | 16 (40.0%) |
| 55 to 64 Years | 11 (73.3%) | 4 (26.7%) |
| 65 to 74 Years | 23 (100.0%) | 0 (0.0%) |
| 75 Years and older | 14 (100.0%) | 0 (0.0%) |
| Total | 618 (95.4%) | 30 (4.6%) |
Health Insurance Coverage by Citizenship Status in Gumbranch
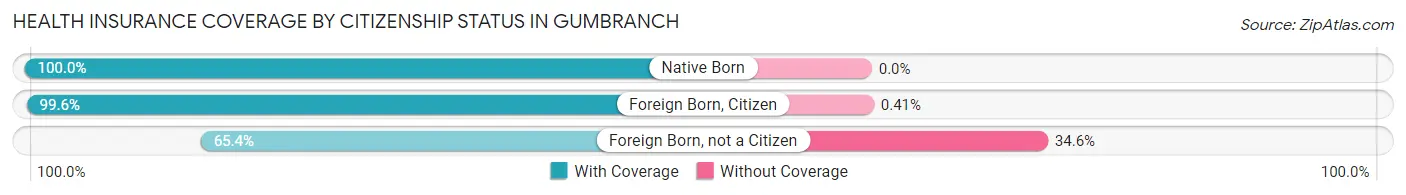
| Citizenship Status | With Coverage | Without Coverage |
| Native Born | 141 (100.0%) | 0 (0.0%) |
| Foreign Born, Citizen | 242 (99.6%) | 1 (0.4%) |
| Foreign Born, not a Citizen | 17 (65.4%) | 9 (34.6%) |
Health Insurance Coverage by Household Income in Gumbranch
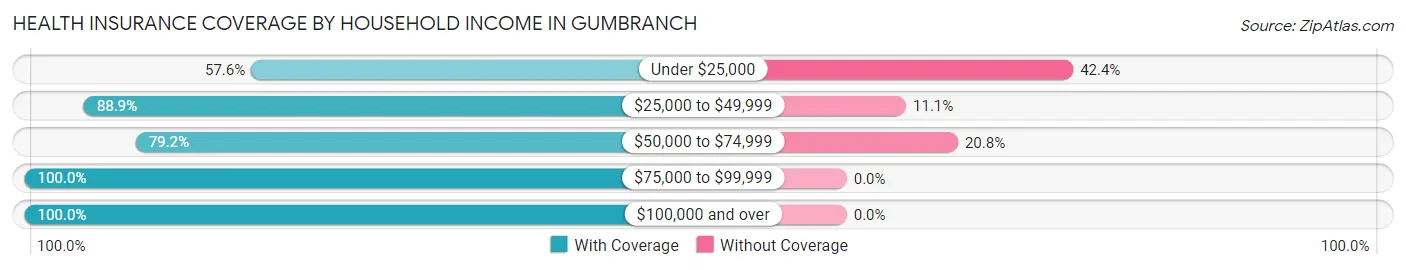
| Household Income | With Coverage | Without Coverage |
| Under $25,000 | 19 (57.6%) | 14 (42.4%) |
| $25,000 to $49,999 | 48 (88.9%) | 6 (11.1%) |
| $50,000 to $74,999 | 38 (79.2%) | 10 (20.8%) |
| $75,000 to $99,999 | 44 (100.0%) | 0 (0.0%) |
| $100,000 and over | 469 (100.0%) | 0 (0.0%) |
Public vs Private Health Insurance Coverage by Age in Gumbranch
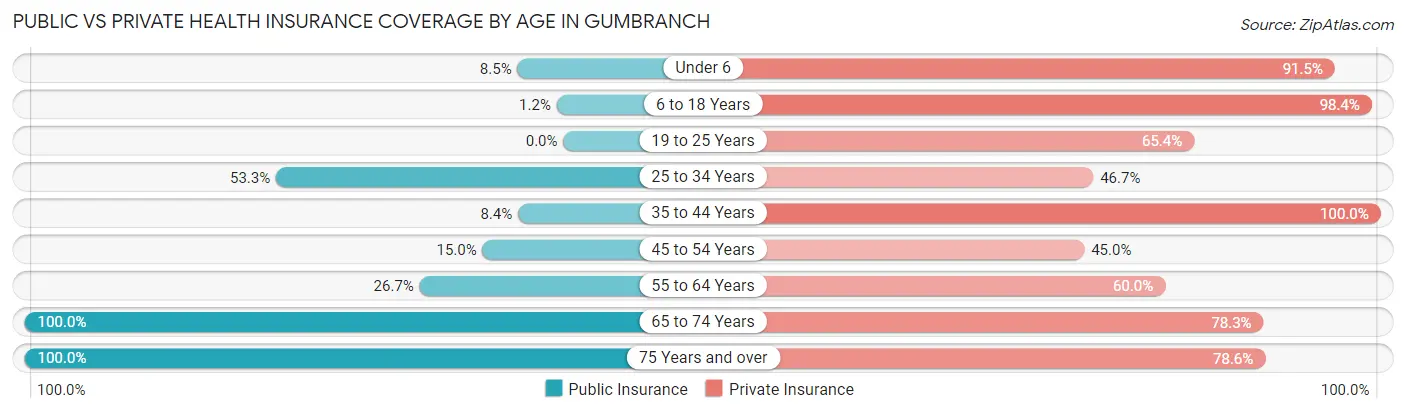
| Age Bracket | Public Insurance | Private Insurance |
| Under 6 | 12 (8.5%) | 129 (91.5%) |
| 6 to 18 Years | 3 (1.2%) | 239 (98.4%) |
| 19 to 25 Years | 0 (0.0%) | 17 (65.4%) |
| 25 to 34 Years | 8 (53.3%) | 7 (46.7%) |
| 35 to 44 Years | 11 (8.4%) | 131 (100.0%) |
| 45 to 54 Years | 6 (15.0%) | 18 (45.0%) |
| 55 to 64 Years | 4 (26.7%) | 9 (60.0%) |
| 65 to 74 Years | 23 (100.0%) | 18 (78.3%) |
| 75 Years and over | 14 (100.0%) | 11 (78.6%) |
| Total | 81 (12.5%) | 579 (89.3%) |
Disability Status by Sex by Age in Gumbranch
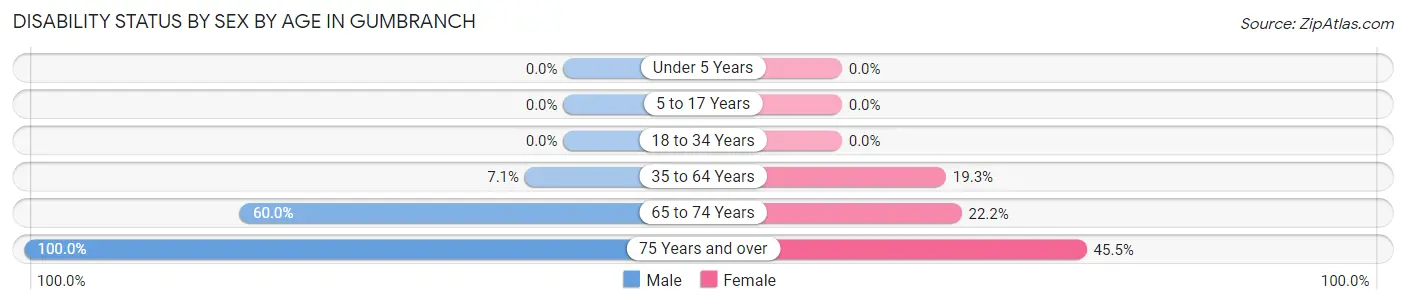
| Age Bracket | Male | Female |
| Under 5 Years | 0 (0.0%) | 0 (0.0%) |
| 5 to 17 Years | 0 (0.0%) | 0 (0.0%) |
| 18 to 34 Years | 0 (0.0%) | 0 (0.0%) |
| 35 to 64 Years | 7 (7.1%) | 17 (19.3%) |
| 65 to 74 Years | 3 (60.0%) | 4 (22.2%) |
| 75 Years and over | 3 (100.0%) | 5 (45.5%) |
Disability Class by Sex by Age in Gumbranch
Disability Class: Hearing Difficulty
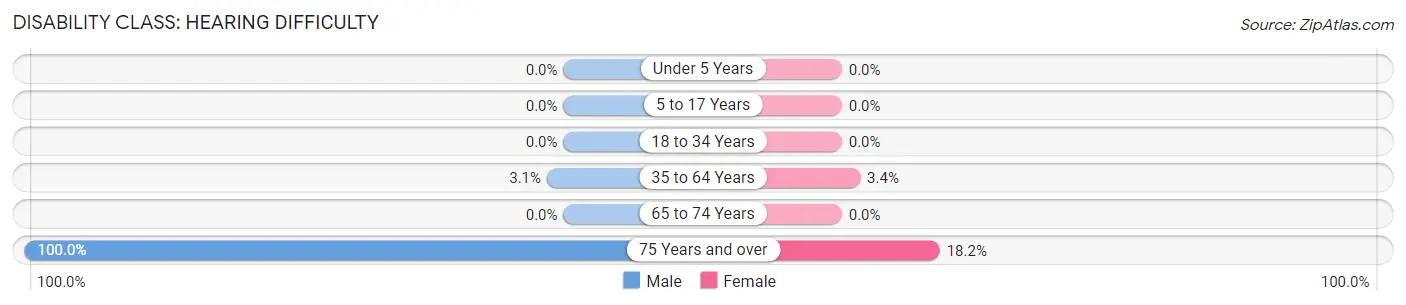
| Age Bracket | Male | Female |
| Under 5 Years | 0 (0.0%) | 0 (0.0%) |
| 5 to 17 Years | 0 (0.0%) | 0 (0.0%) |
| 18 to 34 Years | 0 (0.0%) | 0 (0.0%) |
| 35 to 64 Years | 3 (3.1%) | 3 (3.4%) |
| 65 to 74 Years | 0 (0.0%) | 0 (0.0%) |
| 75 Years and over | 3 (100.0%) | 2 (18.2%) |
Disability Class: Vision Difficulty
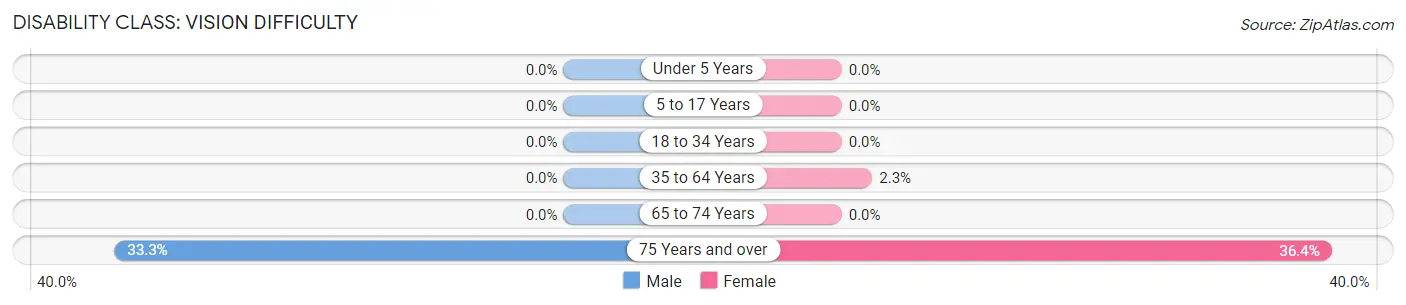
| Age Bracket | Male | Female |
| Under 5 Years | 0 (0.0%) | 0 (0.0%) |
| 5 to 17 Years | 0 (0.0%) | 0 (0.0%) |
| 18 to 34 Years | 0 (0.0%) | 0 (0.0%) |
| 35 to 64 Years | 0 (0.0%) | 2 (2.3%) |
| 65 to 74 Years | 0 (0.0%) | 0 (0.0%) |
| 75 Years and over | 1 (33.3%) | 4 (36.4%) |
Disability Class: Cognitive Difficulty
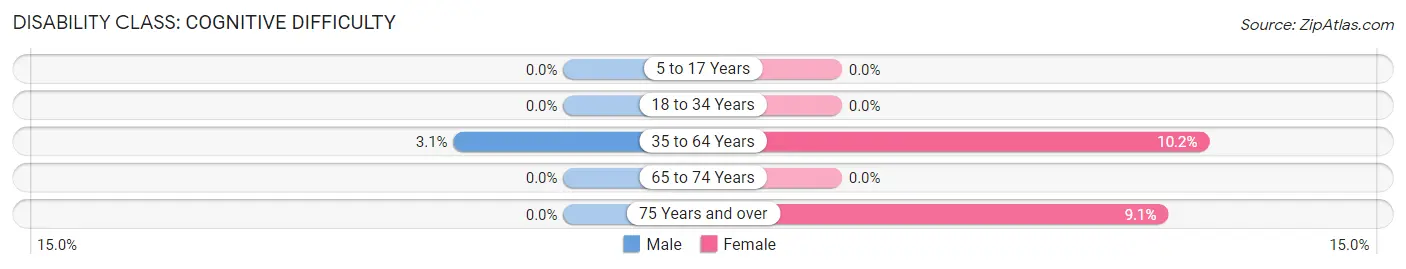
| Age Bracket | Male | Female |
| 5 to 17 Years | 0 (0.0%) | 0 (0.0%) |
| 18 to 34 Years | 0 (0.0%) | 0 (0.0%) |
| 35 to 64 Years | 3 (3.1%) | 9 (10.2%) |
| 65 to 74 Years | 0 (0.0%) | 0 (0.0%) |
| 75 Years and over | 0 (0.0%) | 1 (9.1%) |
Disability Class: Ambulatory Difficulty
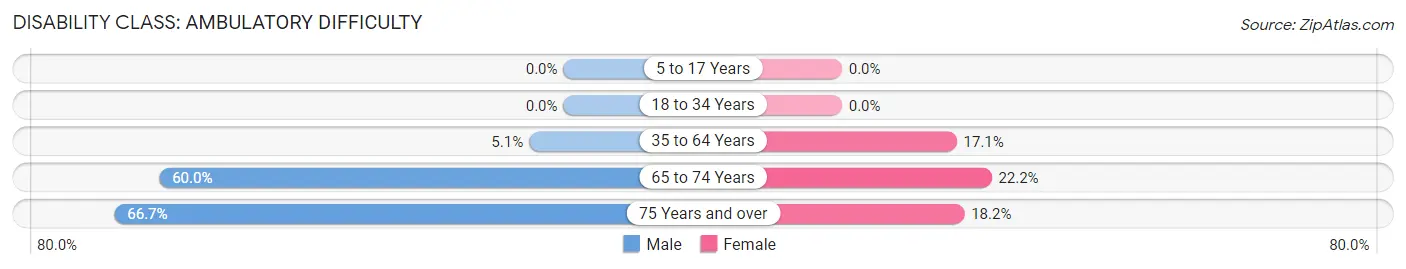
| Age Bracket | Male | Female |
| 5 to 17 Years | 0 (0.0%) | 0 (0.0%) |
| 18 to 34 Years | 0 (0.0%) | 0 (0.0%) |
| 35 to 64 Years | 5 (5.1%) | 15 (17.1%) |
| 65 to 74 Years | 3 (60.0%) | 4 (22.2%) |
| 75 Years and over | 2 (66.7%) | 2 (18.2%) |
Disability Class: Self-Care Difficulty
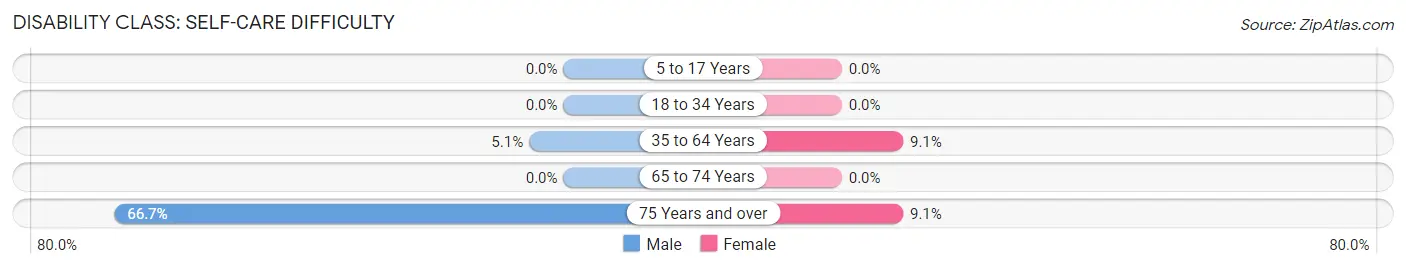
| Age Bracket | Male | Female |
| 5 to 17 Years | 0 (0.0%) | 0 (0.0%) |
| 18 to 34 Years | 0 (0.0%) | 0 (0.0%) |
| 35 to 64 Years | 5 (5.1%) | 8 (9.1%) |
| 65 to 74 Years | 0 (0.0%) | 0 (0.0%) |
| 75 Years and over | 2 (66.7%) | 1 (9.1%) |
Technology Access in Gumbranch
Computing Device Access in Gumbranch
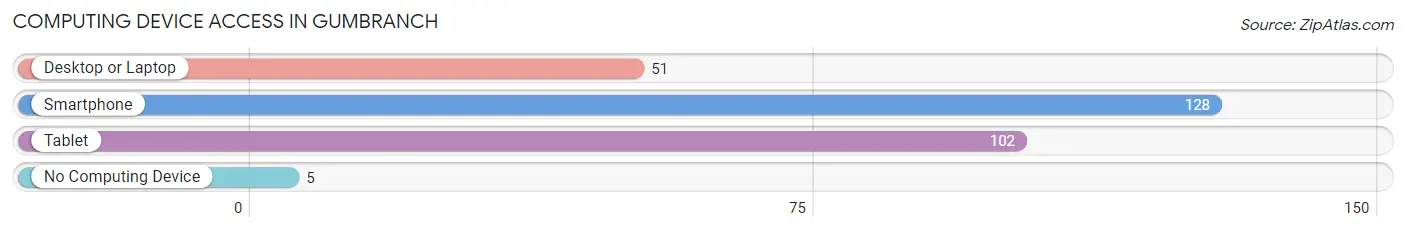
| Device Type | # Households | % Households |
| Desktop or Laptop | 51 | 35.9% |
| Smartphone | 128 | 90.1% |
| Tablet | 102 | 71.8% |
| No Computing Device | 5 | 3.5% |
| Total | 142 | 100.0% |
Internet Access in Gumbranch
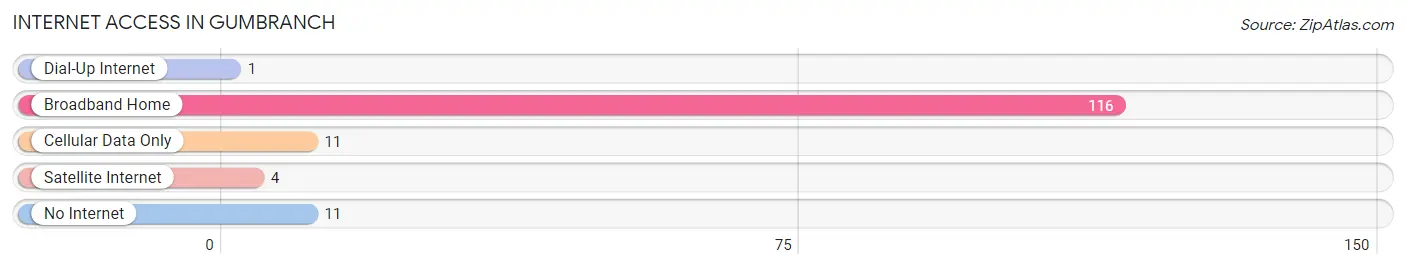
| Internet Type | # Households | % Households |
| Dial-Up Internet | 1 | 0.7% |
| Broadband Home | 116 | 81.7% |
| Cellular Data Only | 11 | 7.7% |
| Satellite Internet | 4 | 2.8% |
| No Internet | 11 | 7.7% |
| Total | 142 | 100.0% |
Gumbranch Summary
Gumbranch is a small unincorporated community located in Liberty County, Georgia, United States. It is situated along the banks of the Gum Branch Creek, which is a tributary of the Ogeechee River. The community is located approximately 10 miles south of Hinesville and 25 miles northwest of Savannah.
History
Gumbranch was first settled in the early 1800s by a group of settlers from the nearby town of Riceboro. The settlers were attracted to the area due to its abundance of timber and the presence of the Gum Branch Creek, which provided a reliable source of water. The community was originally known as Gum Branch, but the name was eventually shortened to Gumbranch.
The first post office in the area was established in 1845 and the community was officially incorporated in 1848. The town was home to a variety of businesses, including a sawmill, a gristmill, a cotton gin, and a general store.
Geography
Gumbranch is located in Liberty County, Georgia, approximately 10 miles south of Hinesville and 25 miles northwest of Savannah. The community is situated along the banks of the Gum Branch Creek, which is a tributary of the Ogeechee River. The area is mostly flat and is covered in a mix of pine and hardwood forests.
Economy
Gumbranch is a small, rural community with a limited economy. The primary industries in the area are timber and agriculture. The area is home to several small farms that produce a variety of crops, including corn, soybeans, and cotton.
The community is also home to a few small businesses, including a general store, a gas station, and a few restaurants. The nearest major city is Savannah, which is located approximately 25 miles to the southeast.
Demographics
As of the 2010 census, the population of Gumbranch was 1,093. The racial makeup of the community was 79.3% White, 17.2% African American, 0.7% Native American, 0.3% Asian, 0.1% Pacific Islander, and 2.4% from other races. The median household income was $31,250 and the median family income was $37,500.
Conclusion
Gumbranch is a small, rural community located in Liberty County, Georgia. The community was first settled in the early 1800s and was officially incorporated in 1848. The economy of the area is primarily based on timber and agriculture, and the population of the community is approximately 1,093. Gumbranch is a quiet, peaceful community that offers its residents a unique blend of rural living and modern amenities.
Common Questions
What is Per Capita Income in Gumbranch?
Per Capita income in Gumbranch is $17,089.
What is the Median Family Income in Gumbranch?
Median Family Income in Gumbranch is $112,525.
What is the Median Household income in Gumbranch?
Median Household Income in Gumbranch is $88,750.
What is Income or Wage Gap in Gumbranch?
Income or Wage Gap in Gumbranch is 61.9%.
Women in Gumbranch earn 38.1 cents for every dollar earned by a man.
What is Inequality or Gini Index in Gumbranch?
Inequality or Gini Index in Gumbranch is 0.32.
What is the Total Population of Gumbranch?
Total Population of Gumbranch is 648.
What is the Total Male Population of Gumbranch?
Total Male Population of Gumbranch is 380.
What is the Total Female Population of Gumbranch?
Total Female Population of Gumbranch is 268.
What is the Ratio of Males per 100 Females in Gumbranch?
There are 141.79 Males per 100 Females in Gumbranch.
What is the Ratio of Females per 100 Males in Gumbranch?
There are 70.53 Females per 100 Males in Gumbranch.
What is the Median Population Age in Gumbranch?
Median Population Age in Gumbranch is 16.2 Years.
What is the Average Family Size in Gumbranch
Average Family Size in Gumbranch is 5.4 People.
What is the Average Household Size in Gumbranch
Average Household Size in Gumbranch is 4.6 People.
How Large is the Labor Force in Gumbranch?
There are 198 People in the Labor Forcein in Gumbranch.
What is the Percentage of People in the Labor Force in Gumbranch?
58.6% of People are in the Labor Force in Gumbranch.
What is the Unemployment Rate in Gumbranch?
Unemployment Rate in Gumbranch is 2.0%.