Agar, SD Map & Demographics
Agar Map
Agar Overview
$35,944
PER CAPITA INCOME
$67,917
AVG FAMILY INCOME
$43,750
AVG HOUSEHOLD INCOME
18.9%
WAGE / INCOME GAP [ % ]
81.1¢/ $1
WAGE / INCOME GAP [ $ ]
0.54
INEQUALITY / GINI INDEX
97
TOTAL POPULATION
53
MALE POPULATION
44
FEMALE POPULATION
120.45
MALES / 100 FEMALES
83.02
FEMALES / 100 MALES
58.8
MEDIAN AGE
2.4
AVG FAMILY SIZE
1.6
AVG HOUSEHOLD SIZE
52
LABOR FORCE [ PEOPLE ]
58.4%
PERCENT IN LABOR FORCE
Agar Zip Codes
Agar Area Codes
Income in Agar
Income Overview in Agar
Per Capita Income in Agar is $35,944, while median incomes of families and households are $67,917 and $43,750 respectively.
| Characteristic | Number | Measure |
| Per Capita Income | 97 | $35,944 |
| Median Family Income | 20 | $67,917 |
| Mean Family Income | 20 | $83,800 |
| Median Household Income | 61 | $43,750 |
| Mean Household Income | 61 | $52,354 |
| Income Deficit | 20 | $0 |
| Wage / Income Gap (%) | 97 | 18.88% |
| Wage / Income Gap ($) | 97 | 81.12¢ per $1 |
| Gini / Inequality Index | 97 | 0.54 |
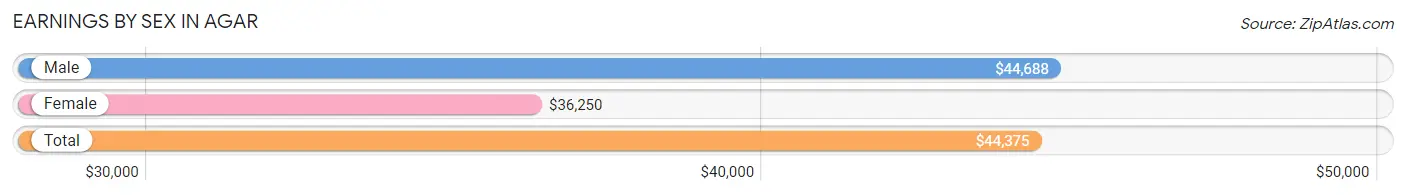
Earnings by Sex in Agar
Average Earnings in Agar are $44,375, $44,688 for men and $36,250 for women, a difference of 18.9%.
| Sex | Number | Average Earnings |
| Male | 40 (76.9%) | $44,688 |
| Female | 12 (23.1%) | $36,250 |
| Total | 52 (100.0%) | $44,375 |
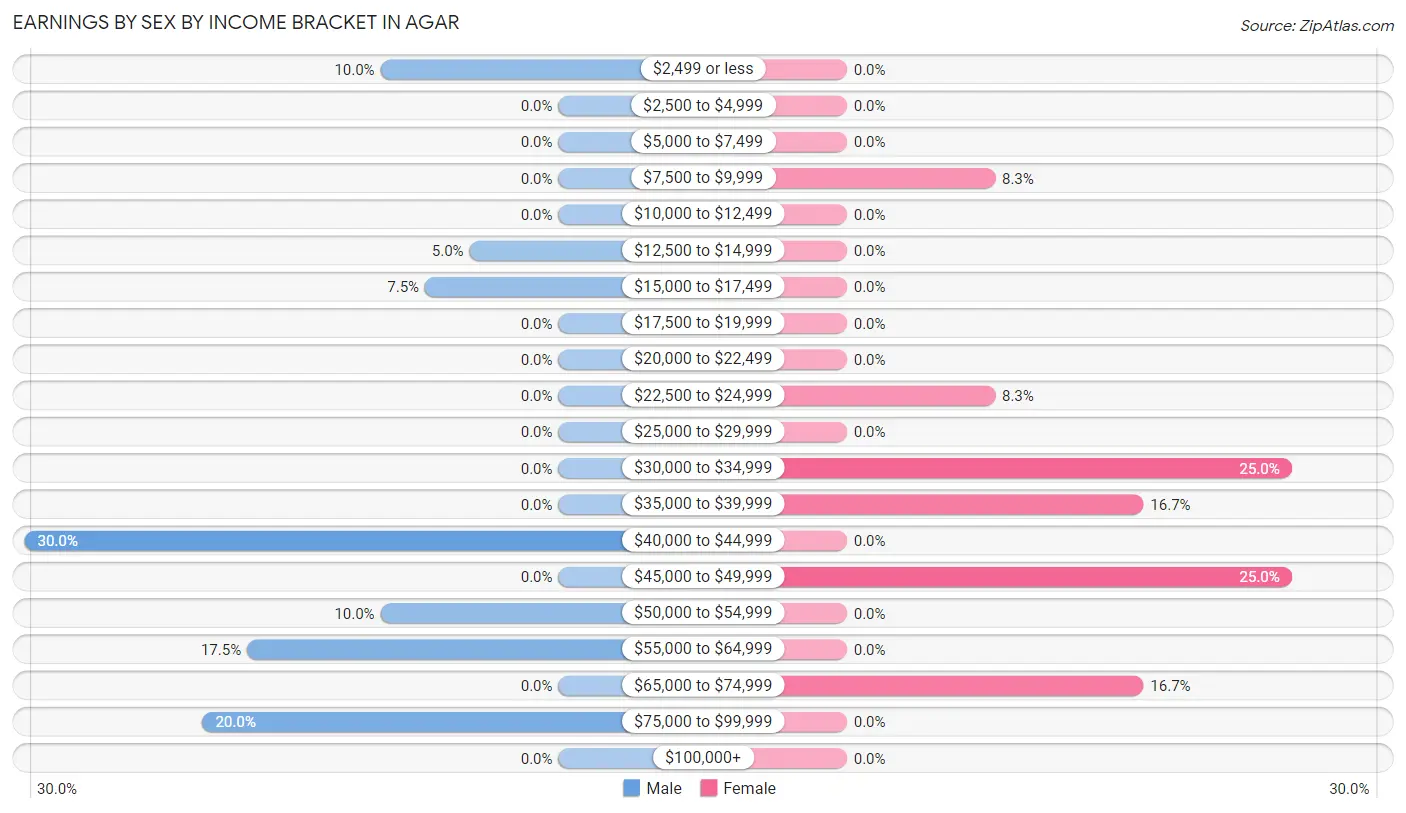
Earnings by Sex by Income Bracket in Agar
The most common earnings brackets in Agar are $40,000 to $44,999 for men (12 | 30.0%) and $30,000 to $34,999 for women (3 | 25.0%).
| Income | Male | Female |
| $2,499 or less | 4 (10.0%) | 0 (0.0%) |
| $2,500 to $4,999 | 0 (0.0%) | 0 (0.0%) |
| $5,000 to $7,499 | 0 (0.0%) | 0 (0.0%) |
| $7,500 to $9,999 | 0 (0.0%) | 1 (8.3%) |
| $10,000 to $12,499 | 0 (0.0%) | 0 (0.0%) |
| $12,500 to $14,999 | 2 (5.0%) | 0 (0.0%) |
| $15,000 to $17,499 | 3 (7.5%) | 0 (0.0%) |
| $17,500 to $19,999 | 0 (0.0%) | 0 (0.0%) |
| $20,000 to $22,499 | 0 (0.0%) | 0 (0.0%) |
| $22,500 to $24,999 | 0 (0.0%) | 1 (8.3%) |
| $25,000 to $29,999 | 0 (0.0%) | 0 (0.0%) |
| $30,000 to $34,999 | 0 (0.0%) | 3 (25.0%) |
| $35,000 to $39,999 | 0 (0.0%) | 2 (16.7%) |
| $40,000 to $44,999 | 12 (30.0%) | 0 (0.0%) |
| $45,000 to $49,999 | 0 (0.0%) | 3 (25.0%) |
| $50,000 to $54,999 | 4 (10.0%) | 0 (0.0%) |
| $55,000 to $64,999 | 7 (17.5%) | 0 (0.0%) |
| $65,000 to $74,999 | 0 (0.0%) | 2 (16.7%) |
| $75,000 to $99,999 | 8 (20.0%) | 0 (0.0%) |
| $100,000+ | 0 (0.0%) | 0 (0.0%) |
| Total | 40 (100.0%) | 12 (100.0%) |
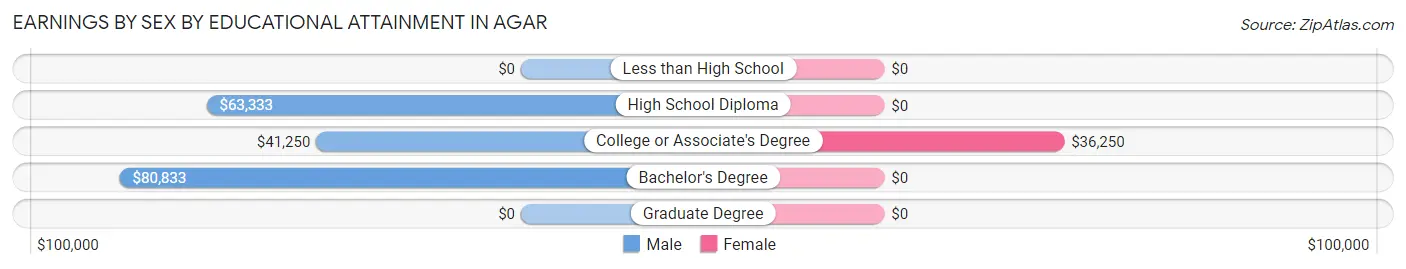
Earnings by Sex by Educational Attainment in Agar
Average earnings in Agar are $44,688 for men and $36,250 for women, a difference of 18.9%. Men with an educational attainment of bachelor's degree enjoy the highest average annual earnings of $80,833, while those with college or associate's degree education earn the least with $41,250. Women with an educational attainment of college or associate's degree earn the most with the average annual earnings of $36,250, while those with college or associate's degree education have the smallest earnings of $36,250.
| Educational Attainment | Male Income | Female Income |
| Less than High School | - | - |
| High School Diploma | $63,333 | $0 |
| College or Associate's Degree | $41,250 | $36,250 |
| Bachelor's Degree | $80,833 | $0 |
| Graduate Degree | - | - |
| Total | $44,688 | $36,250 |
Family Income in Agar
Family Income Brackets in Agar
According to the Agar family income data, there are 11 families falling into the $50,000 to $74,999 income range, which is the most common income bracket and makes up 55.0% of all families.
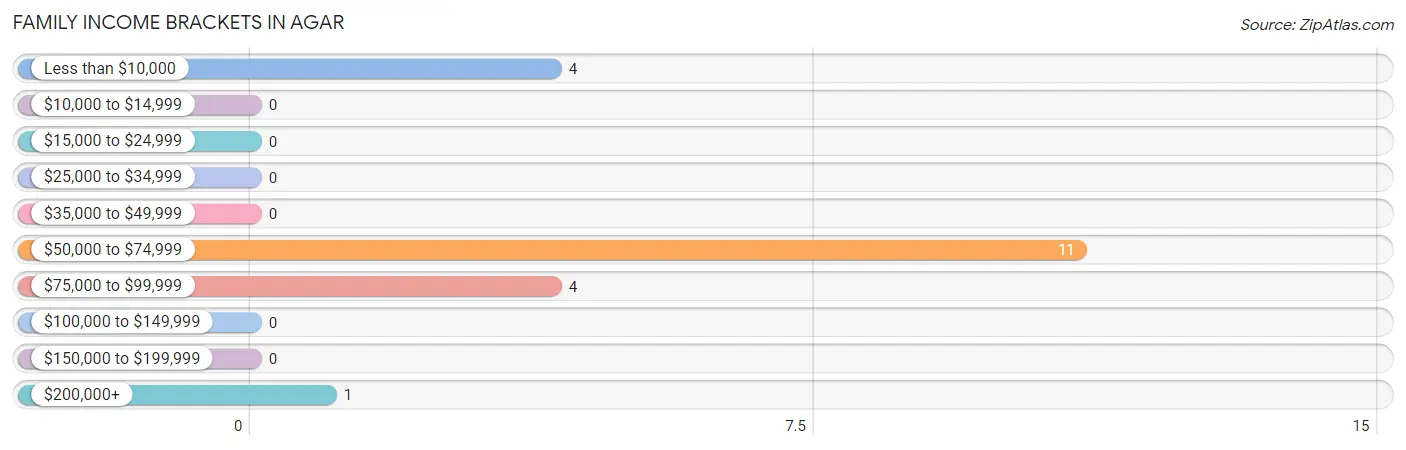
| Income Bracket | # Families | % Families |
| Less than $10,000 | 4 | 20.0% |
| $10,000 to $14,999 | 0 | 0.0% |
| $15,000 to $24,999 | 0 | 0.0% |
| $25,000 to $34,999 | 0 | 0.0% |
| $35,000 to $49,999 | 0 | 0.0% |
| $50,000 to $74,999 | 11 | 55.0% |
| $75,000 to $99,999 | 4 | 20.0% |
| $100,000 to $149,999 | 0 | 0.0% |
| $150,000 to $199,999 | 0 | 0.0% |
| $200,000+ | 1 | 5.0% |
Family Income by Famaliy Size in Agar
2-person families (17 | 85.0%) account for the highest median family income in Agar with $66,250 per family, while 2-person families (17 | 85.0%) have the highest median income of $33,125 per family member.
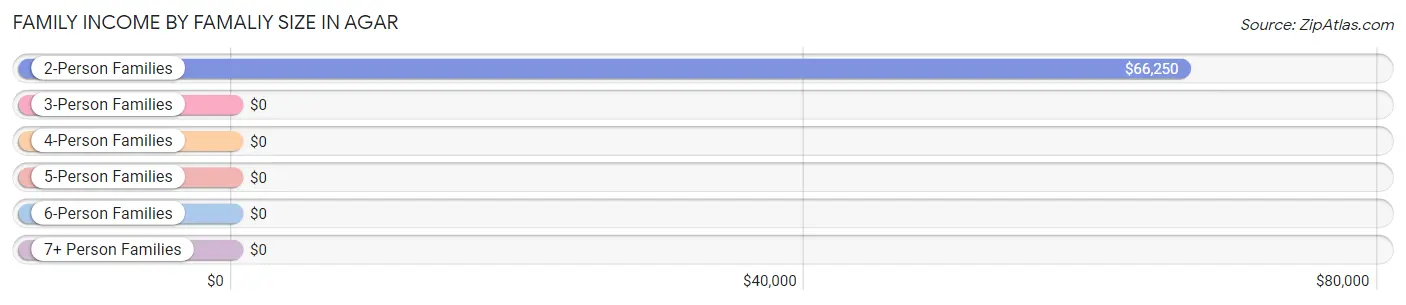
| Income Bracket | # Families | Median Income |
| 2-Person Families | 17 (85.0%) | $66,250 |
| 3-Person Families | 3 (15.0%) | $0 |
| 4-Person Families | 0 (0.0%) | $0 |
| 5-Person Families | 0 (0.0%) | $0 |
| 6-Person Families | 0 (0.0%) | $0 |
| 7+ Person Families | 0 (0.0%) | $0 |
| Total | 20 (100.0%) | $67,917 |
Family Income by Number of Earners in Agar
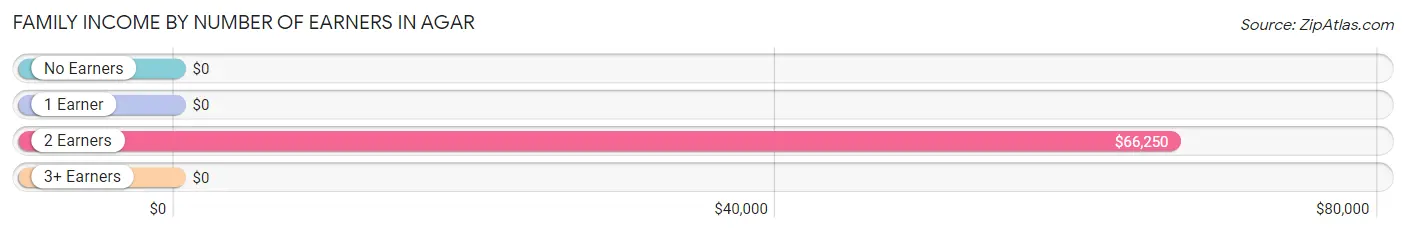
| Number of Earners | # Families | Median Income |
| No Earners | 5 (25.0%) | $0 |
| 1 Earner | 6 (30.0%) | $0 |
| 2 Earners | 9 (45.0%) | $66,250 |
| 3+ Earners | 0 (0.0%) | $0 |
| Total | 20 (100.0%) | $67,917 |
Household Income in Agar
Household Income Brackets in Agar
With 17 households falling in the category, the $50,000 to $74,999 income range is the most frequent in Agar, accounting for 27.9% of all households.
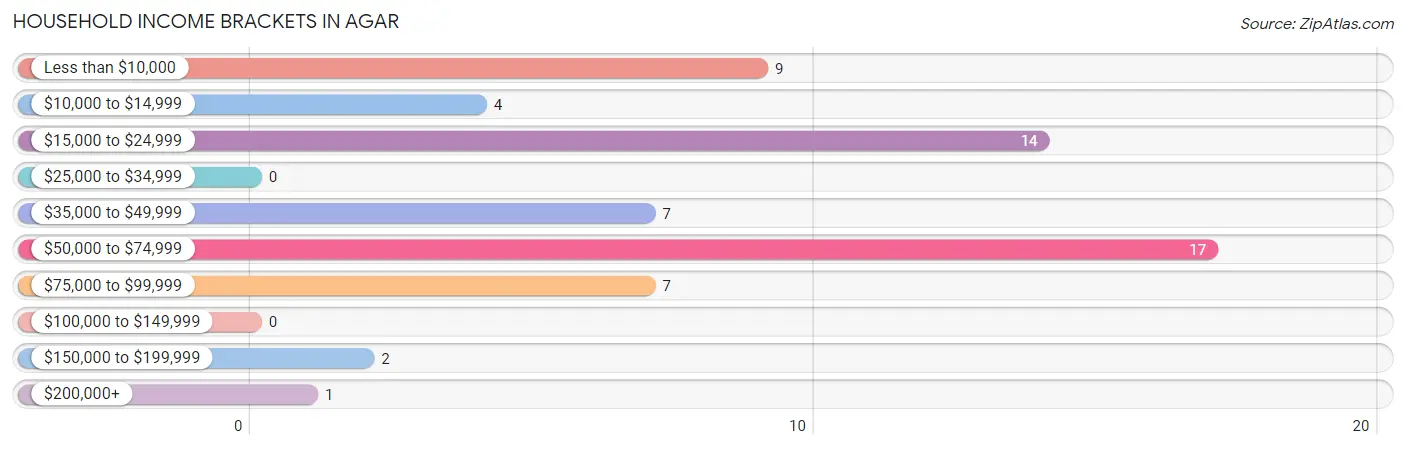
| Income Bracket | # Households | % Households |
| Less than $10,000 | 9 | 14.8% |
| $10,000 to $14,999 | 4 | 6.6% |
| $15,000 to $24,999 | 14 | 23.0% |
| $25,000 to $34,999 | 0 | 0.0% |
| $35,000 to $49,999 | 7 | 11.5% |
| $50,000 to $74,999 | 17 | 27.9% |
| $75,000 to $99,999 | 7 | 11.5% |
| $100,000 to $149,999 | 0 | 0.0% |
| $150,000 to $199,999 | 2 | 3.3% |
| $200,000+ | 1 | 1.6% |
Household Income by Householder Age in Agar
The median household income in Agar is $43,750, with the highest median household income of $67,917 found in the 45 to 64 years age bracket for the primary householder. A total of 10 households (16.4%) fall into this category.
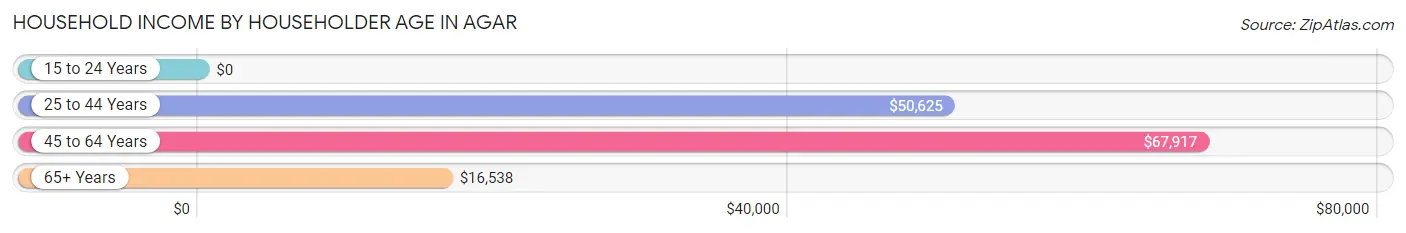
| Income Bracket | # Households | Median Income |
| 15 to 24 Years | 0 (0.0%) | $0 |
| 25 to 44 Years | 19 (31.1%) | $50,625 |
| 45 to 64 Years | 10 (16.4%) | $67,917 |
| 65+ Years | 32 (52.5%) | $16,538 |
| Total | 61 (100.0%) | $43,750 |
Poverty in Agar
Income Below Poverty by Sex and Age in Agar
With 13.2% poverty level for males and 20.4% for females among the residents of Agar, 35 to 44 year old males and 45 to 54 year old females are the most vulnerable to poverty, with 3 males (37.5%) and 3 females (100.0%) in their respective age groups living below the poverty level.
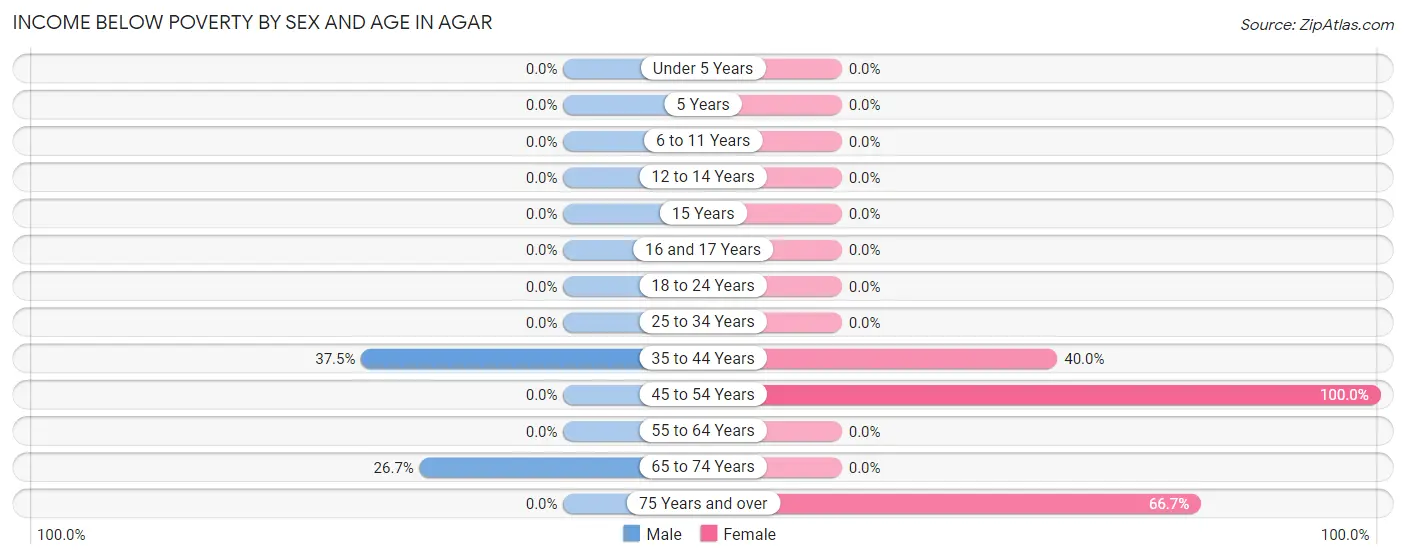
| Age Bracket | Male | Female |
| Under 5 Years | 0 (0.0%) | 0 (0.0%) |
| 5 Years | 0 (0.0%) | 0 (0.0%) |
| 6 to 11 Years | 0 (0.0%) | 0 (0.0%) |
| 12 to 14 Years | 0 (0.0%) | 0 (0.0%) |
| 15 Years | 0 (0.0%) | 0 (0.0%) |
| 16 and 17 Years | 0 (0.0%) | 0 (0.0%) |
| 18 to 24 Years | 0 (0.0%) | 0 (0.0%) |
| 25 to 34 Years | 0 (0.0%) | 0 (0.0%) |
| 35 to 44 Years | 3 (37.5%) | 2 (40.0%) |
| 45 to 54 Years | 0 (0.0%) | 3 (100.0%) |
| 55 to 64 Years | 0 (0.0%) | 0 (0.0%) |
| 65 to 74 Years | 4 (26.7%) | 0 (0.0%) |
| 75 Years and over | 0 (0.0%) | 4 (66.7%) |
| Total | 7 (13.2%) | 9 (20.4%) |
Income Above Poverty by Sex and Age in Agar
According to the poverty statistics in Agar, males aged 12 to 14 years and females aged 55 to 64 years are the age groups that are most secure financially, with 100.0% of males and 100.0% of females in these age groups living above the poverty line.
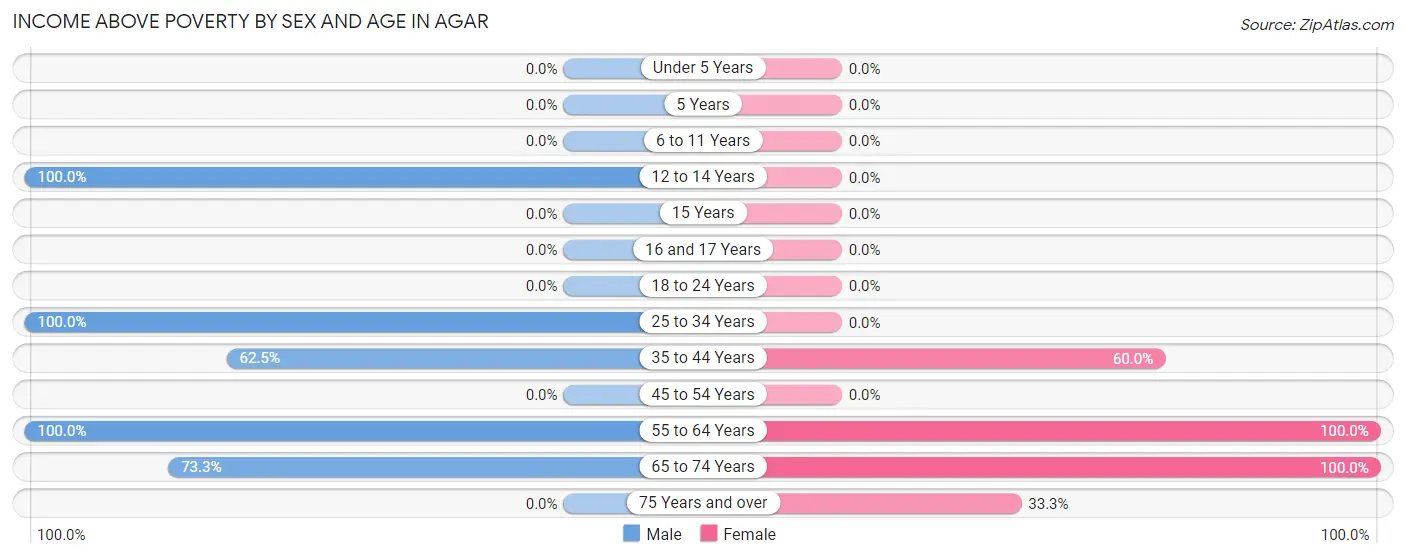
| Age Bracket | Male | Female |
| Under 5 Years | 0 (0.0%) | 0 (0.0%) |
| 5 Years | 0 (0.0%) | 0 (0.0%) |
| 6 to 11 Years | 0 (0.0%) | 0 (0.0%) |
| 12 to 14 Years | 8 (100.0%) | 0 (0.0%) |
| 15 Years | 0 (0.0%) | 0 (0.0%) |
| 16 and 17 Years | 0 (0.0%) | 0 (0.0%) |
| 18 to 24 Years | 0 (0.0%) | 0 (0.0%) |
| 25 to 34 Years | 16 (100.0%) | 0 (0.0%) |
| 35 to 44 Years | 5 (62.5%) | 3 (60.0%) |
| 45 to 54 Years | 0 (0.0%) | 0 (0.0%) |
| 55 to 64 Years | 6 (100.0%) | 14 (100.0%) |
| 65 to 74 Years | 11 (73.3%) | 16 (100.0%) |
| 75 Years and over | 0 (0.0%) | 2 (33.3%) |
| Total | 46 (86.8%) | 35 (79.5%) |
Income Below Poverty Among Married-Couple Families in Agar
The poverty statistics for married-couple families in Agar show that 20.0% or 4 of the total 20 families live below the poverty line. Families with no children have the highest poverty rate of 23.5%, comprising of 4 families. On the other hand, families with 1 or 2 children have the lowest poverty rate of 0.0%, which includes 0 families.
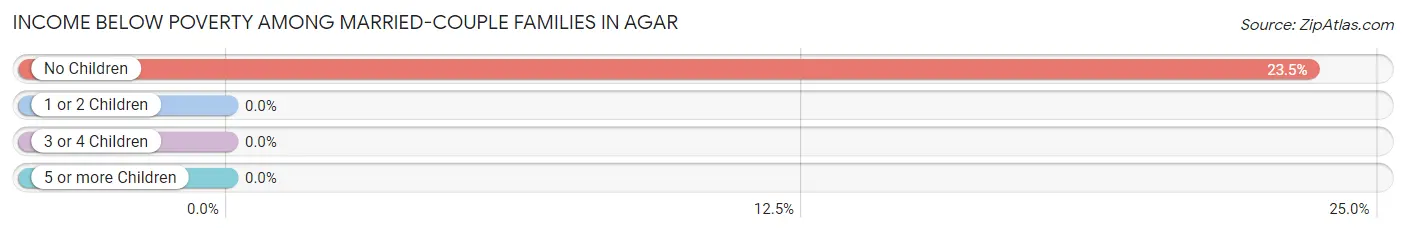
| Children | Above Poverty | Below Poverty |
| No Children | 13 (76.5%) | 4 (23.5%) |
| 1 or 2 Children | 3 (100.0%) | 0 (0.0%) |
| 3 or 4 Children | 0 (0.0%) | 0 (0.0%) |
| 5 or more Children | 0 (0.0%) | 0 (0.0%) |
| Total | 16 (80.0%) | 4 (20.0%) |
Income Below Poverty Among Single-Parent Households in Agar
| Children | Single Father | Single Mother |
| No Children | 0 (0.0%) | 0 (0.0%) |
| 1 or 2 Children | 0 (0.0%) | 0 (0.0%) |
| 3 or 4 Children | 0 (0.0%) | 0 (0.0%) |
| 5 or more Children | 0 (0.0%) | 0 (0.0%) |
| Total | 0 (0.0%) | 0 (0.0%) |
Income Below Poverty Among Married-Couple vs Single-Parent Households in Agar
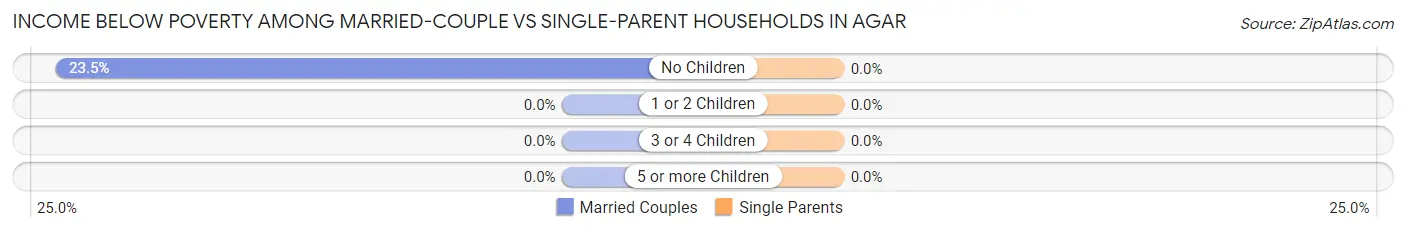
| Children | Married-Couple Families | Single-Parent Households |
| No Children | 4 (23.5%) | 0 (0.0%) |
| 1 or 2 Children | 0 (0.0%) | 0 (0.0%) |
| 3 or 4 Children | 0 (0.0%) | 0 (0.0%) |
| 5 or more Children | 0 (0.0%) | 0 (0.0%) |
| Total | 4 (20.0%) | 0 (0.0%) |
Race in Agar
The most populous races in Agar are White / Caucasian (86 | 88.7%), and Two or more Races (11 | 11.3%).
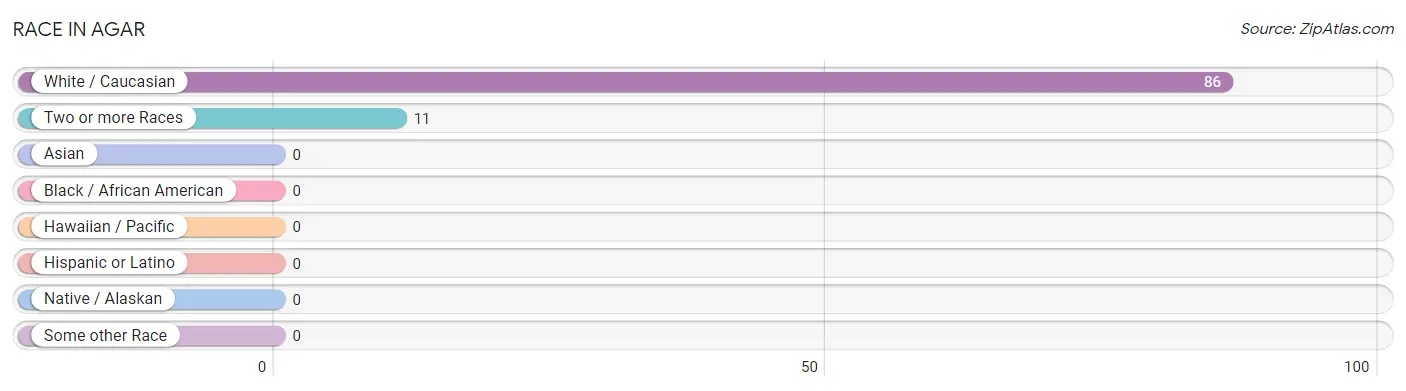
| Race | # Population | % Population |
| Asian | 0 | 0.0% |
| Black / African American | 0 | 0.0% |
| Hawaiian / Pacific | 0 | 0.0% |
| Hispanic or Latino | 0 | 0.0% |
| Native / Alaskan | 0 | 0.0% |
| White / Caucasian | 86 | 88.7% |
| Two or more Races | 11 | 11.3% |
| Some other Race | 0 | 0.0% |
| Total | 97 | 100.0% |
Ancestry in Agar
The most populous ancestries reported in Agar are German (40 | 41.2%), English (23 | 23.7%), Polish (16 | 16.5%), Danish (12 | 12.4%), and French (6 | 6.2%), together accounting for 100.0% of all Agar residents.
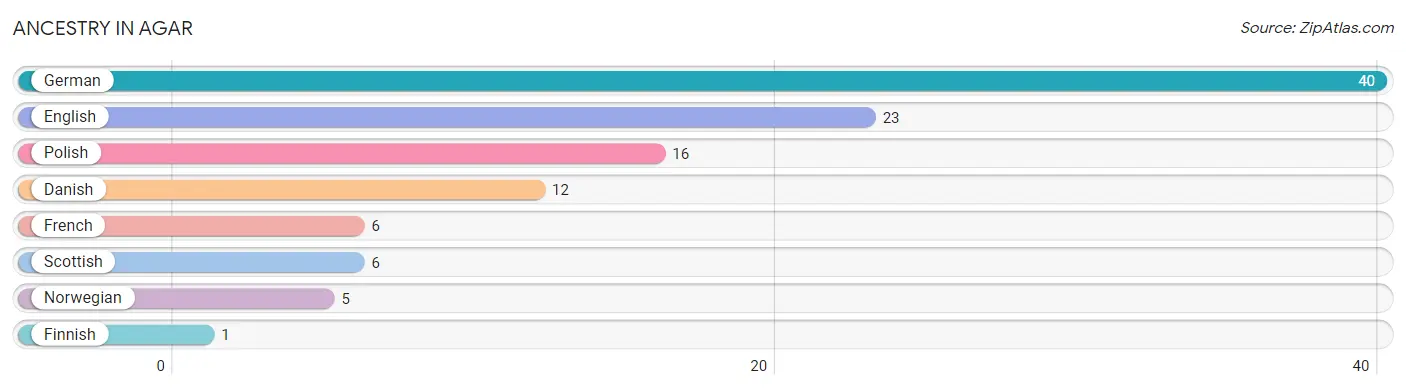
| Ancestry | # Population | % Population |
| Danish | 12 | 12.4% |
| English | 23 | 23.7% |
| Finnish | 1 | 1.0% |
| French | 6 | 6.2% |
| German | 40 | 41.2% |
| Norwegian | 5 | 5.1% |
| Polish | 16 | 16.5% |
| Scottish | 6 | 6.2% | View All 8 Rows |
Immigrants in Agar

| Immigration Origin | # Population | % Population | View All 0 Rows |
Sex and Age in Agar
Sex and Age in Agar
The most populous age groups in Agar are 65 to 69 Years (15 | 28.3%) for men and 70 to 74 Years (13 | 29.5%) for women.
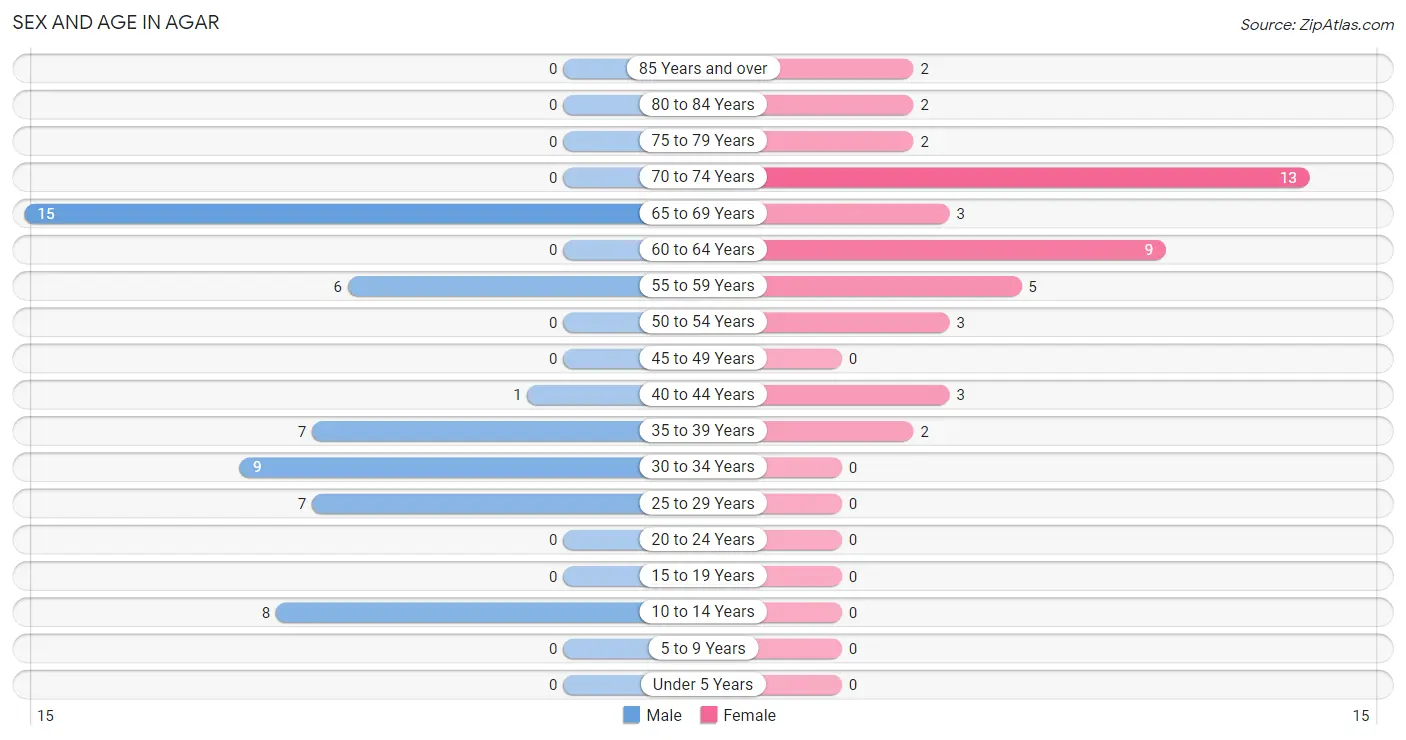
| Age Bracket | Male | Female |
| Under 5 Years | 0 (0.0%) | 0 (0.0%) |
| 5 to 9 Years | 0 (0.0%) | 0 (0.0%) |
| 10 to 14 Years | 8 (15.1%) | 0 (0.0%) |
| 15 to 19 Years | 0 (0.0%) | 0 (0.0%) |
| 20 to 24 Years | 0 (0.0%) | 0 (0.0%) |
| 25 to 29 Years | 7 (13.2%) | 0 (0.0%) |
| 30 to 34 Years | 9 (17.0%) | 0 (0.0%) |
| 35 to 39 Years | 7 (13.2%) | 2 (4.5%) |
| 40 to 44 Years | 1 (1.9%) | 3 (6.8%) |
| 45 to 49 Years | 0 (0.0%) | 0 (0.0%) |
| 50 to 54 Years | 0 (0.0%) | 3 (6.8%) |
| 55 to 59 Years | 6 (11.3%) | 5 (11.4%) |
| 60 to 64 Years | 0 (0.0%) | 9 (20.4%) |
| 65 to 69 Years | 15 (28.3%) | 3 (6.8%) |
| 70 to 74 Years | 0 (0.0%) | 13 (29.5%) |
| 75 to 79 Years | 0 (0.0%) | 2 (4.5%) |
| 80 to 84 Years | 0 (0.0%) | 2 (4.5%) |
| 85 Years and over | 0 (0.0%) | 2 (4.5%) |
| Total | 53 (100.0%) | 44 (100.0%) |
Families and Households in Agar
Median Family Size in Agar
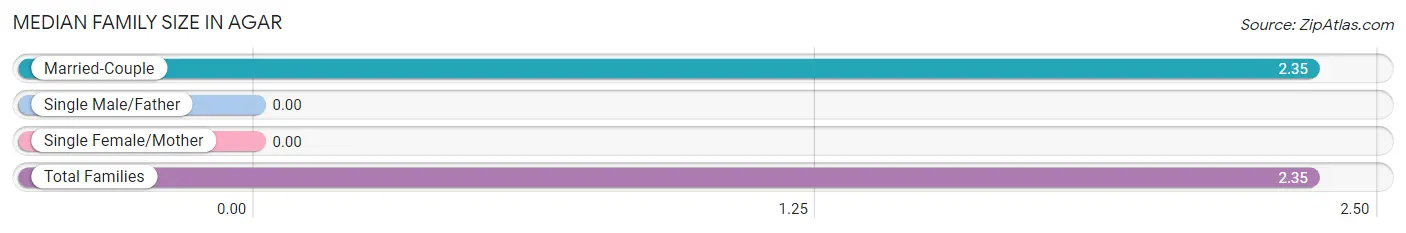
| Family Type | # Families | Family Size |
| Married-Couple | 20 (100.0%) | 2.35 |
| Single Male/Father | 0 (0.0%) | - |
| Single Female/Mother | 0 (0.0%) | - |
| Total Families | 20 (100.0%) | 2.35 |
Median Household Size in Agar
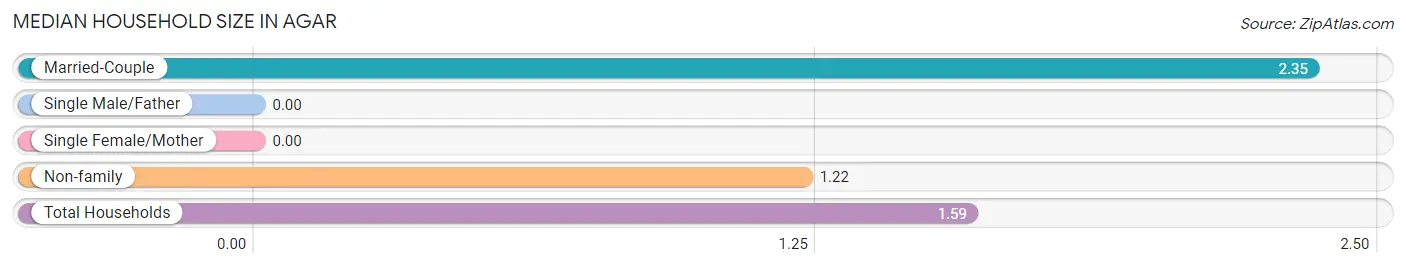
| Household Type | # Households | Household Size |
| Married-Couple | 20 (32.8%) | 2.35 |
| Single Male/Father | 0 (0.0%) | - |
| Single Female/Mother | 0 (0.0%) | - |
| Non-family | 41 (67.2%) | 1.22 |
| Total Households | 61 (100.0%) | 1.59 |
Household Size by Marriage Status in Agar
Out of a total of 61 households in Agar, 20 (32.8%) are family households, while 41 (67.2%) are nonfamily households. The most numerous type of family households are 2-person households, comprising 17, and the most common type of nonfamily households are 1-person households, comprising 39.
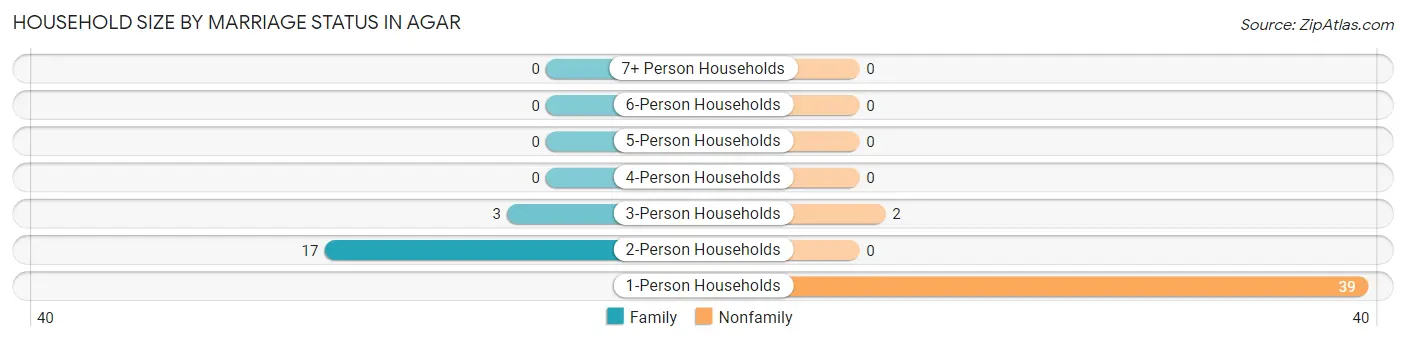
| Household Size | Family Households | Nonfamily Households |
| 1-Person Households | - | 39 (63.9%) |
| 2-Person Households | 17 (27.9%) | 0 (0.0%) |
| 3-Person Households | 3 (4.9%) | 2 (3.3%) |
| 4-Person Households | 0 (0.0%) | 0 (0.0%) |
| 5-Person Households | 0 (0.0%) | 0 (0.0%) |
| 6-Person Households | 0 (0.0%) | 0 (0.0%) |
| 7+ Person Households | 0 (0.0%) | 0 (0.0%) |
| Total | 20 (32.8%) | 41 (67.2%) |
Female Fertility in Agar
Fertility by Age in Agar
| Age Bracket | Women with Births | Births / 1,000 Women |
| 15 to 19 years | 0 (0.0%) | 0.0 |
| 20 to 34 years | 0 (0.0%) | 0.0 |
| 35 to 50 years | 0 (0.0%) | 0.0 |
| Total | 0 (0.0%) | 0.0 |
Fertility by Age by Marriage Status in Agar
| Age Bracket | Married | Unmarried |
| 15 to 19 years | 0 (0.0%) | 0 (0.0%) |
| 20 to 34 years | 0 (0.0%) | 0 (0.0%) |
| 35 to 50 years | 0 (0.0%) | 0 (0.0%) |
| Total | 0 (0.0%) | 0 (0.0%) |
Fertility by Education in Agar
| Educational Attainment | Women with Births | Births / 1,000 Women |
| Less than High School | 0 (0.0%) | 0.0 |
| High School Diploma | 0 (0.0%) | 0.0 |
| College or Associate's Degree | 0 (0.0%) | 0.0 |
| Bachelor's Degree | 0 (0.0%) | 0.0 |
| Graduate Degree | 0 (0.0%) | 0.0 |
| Total | 0 (0.0%) | 0.0 |
Fertility by Education by Marriage Status in Agar
| Educational Attainment | Married | Unmarried |
| Less than High School | 0 (0.0%) | 0 (0.0%) |
| High School Diploma | 0 (0.0%) | 0 (0.0%) |
| College or Associate's Degree | 0 (0.0%) | 0 (0.0%) |
| Bachelor's Degree | 0 (0.0%) | 0 (0.0%) |
| Graduate Degree | 0 (0.0%) | 0 (0.0%) |
| Total | 0 (0.0%) | 0 (0.0%) |
Employment Characteristics in Agar
Employment by Class of Employer in Agar
Among the 52 employed individuals in Agar, private company employees (32 | 61.5%), self-employed (incorporated) (11 | 21.1%), and self-employed (not incorporated) (7 | 13.5%) make up the most common classes of employment.
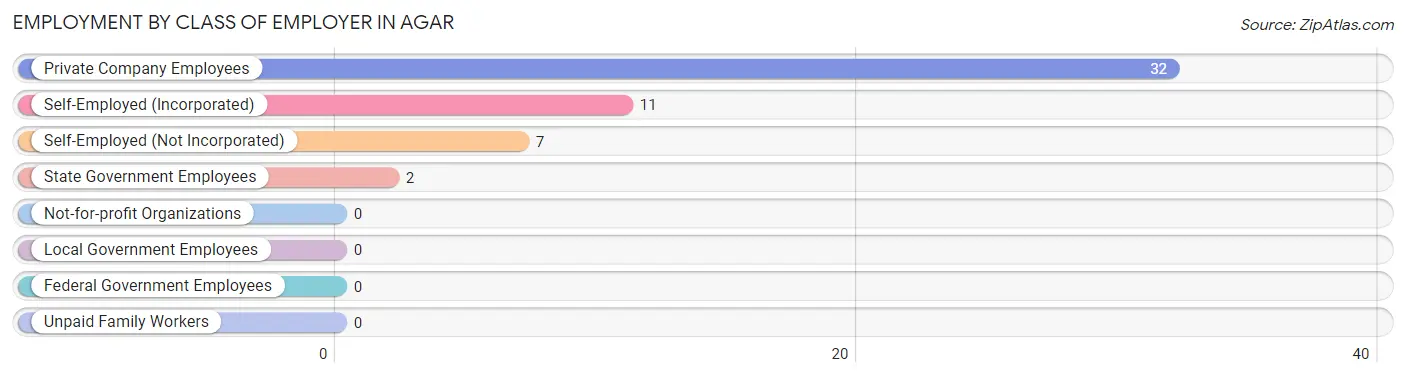
| Employer Class | # Employees | % Employees |
| Private Company Employees | 32 | 61.5% |
| Self-Employed (Incorporated) | 11 | 21.1% |
| Self-Employed (Not Incorporated) | 7 | 13.5% |
| Not-for-profit Organizations | 0 | 0.0% |
| Local Government Employees | 0 | 0.0% |
| State Government Employees | 2 | 3.8% |
| Federal Government Employees | 0 | 0.0% |
| Unpaid Family Workers | 0 | 0.0% |
| Total | 52 | 100.0% |
Employment Status by Age in Agar
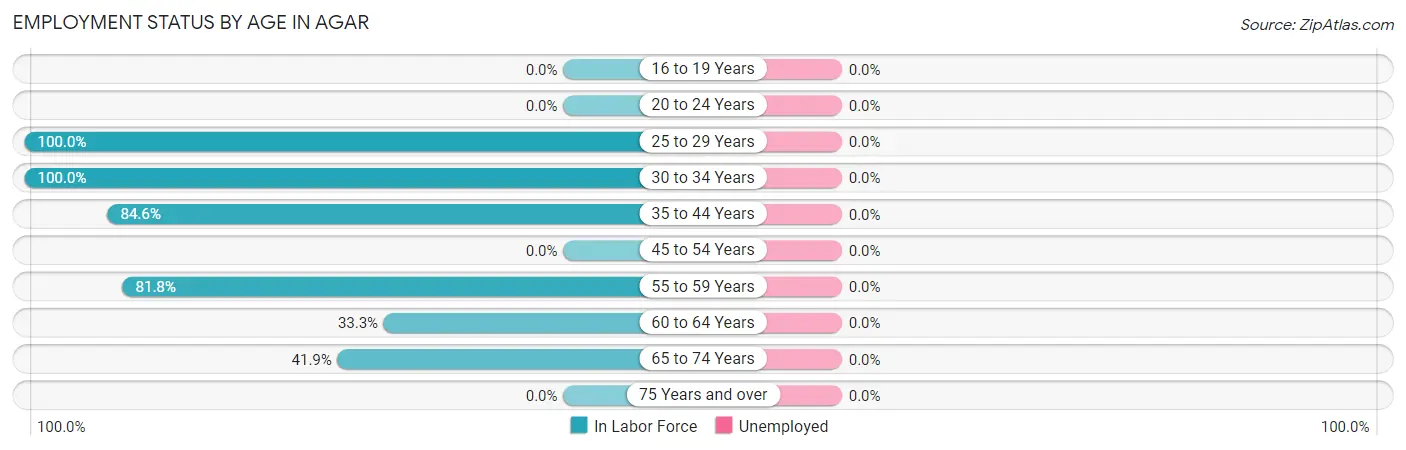
| Age Bracket | In Labor Force | Unemployed |
| 16 to 19 Years | 0 (0.0%) | 0 (0.0%) |
| 20 to 24 Years | 0 (0.0%) | 0 (0.0%) |
| 25 to 29 Years | 7 (100.0%) | 0 (0.0%) |
| 30 to 34 Years | 9 (100.0%) | 0 (0.0%) |
| 35 to 44 Years | 11 (84.6%) | 0 (0.0%) |
| 45 to 54 Years | 0 (0.0%) | 0 (0.0%) |
| 55 to 59 Years | 9 (81.8%) | 0 (0.0%) |
| 60 to 64 Years | 3 (33.3%) | 0 (0.0%) |
| 65 to 74 Years | 13 (41.9%) | 0 (0.0%) |
| 75 Years and over | 0 (0.0%) | 0 (0.0%) |
| Total | 52 (58.4%) | 0 (0.0%) |
Employment Status by Educational Attainment in Agar
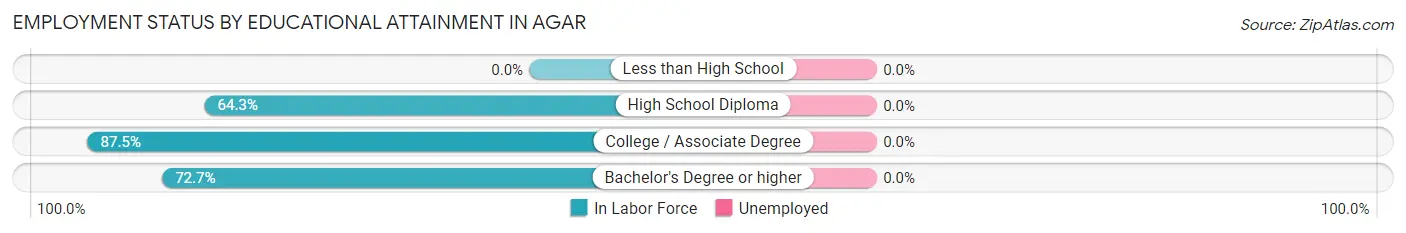
| Educational Attainment | In Labor Force | Unemployed |
| Less than High School | 0 (0.0%) | 0 (0.0%) |
| High School Diploma | 9 (64.3%) | 0 (0.0%) |
| College / Associate Degree | 14 (87.5%) | 0 (0.0%) |
| Bachelor's Degree or higher | 16 (72.7%) | 0 (0.0%) |
| Total | 39 (75.0%) | 0 (0.0%) |
Employment Occupations by Sex in Agar
Management, Business, Science and Arts Occupations
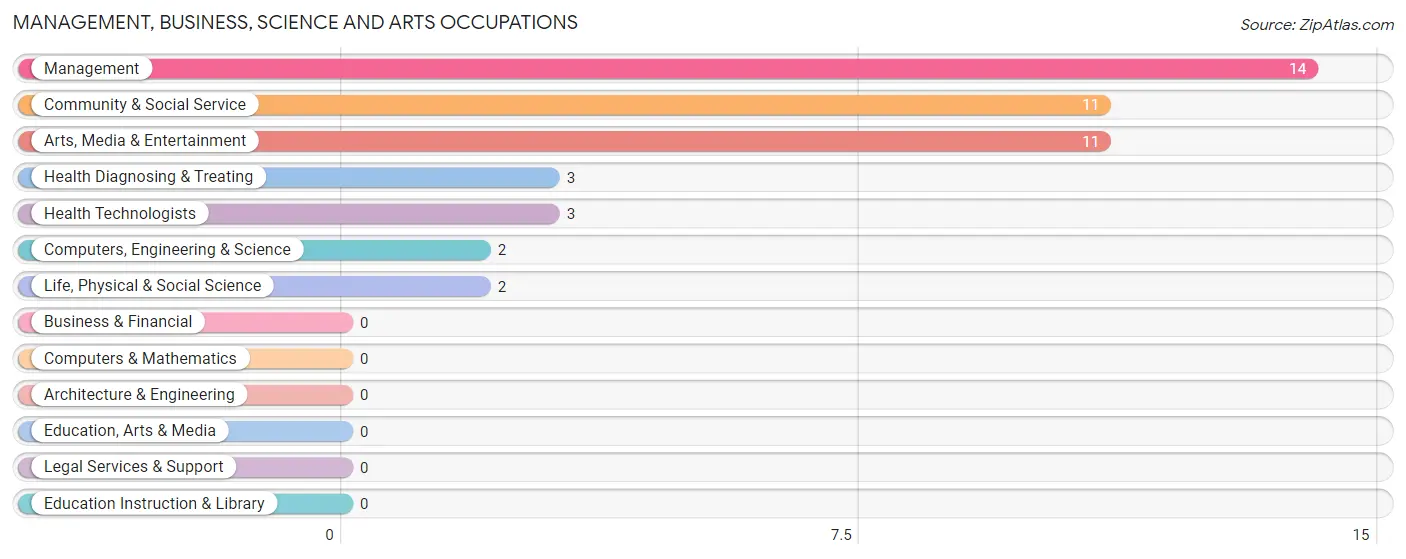
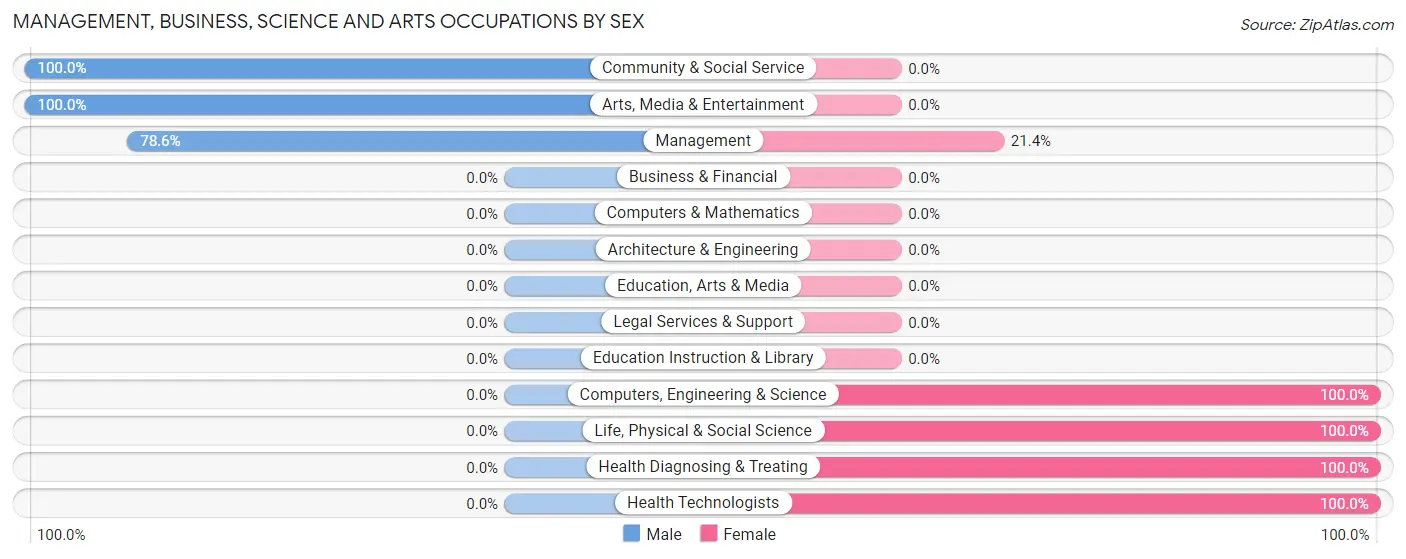
The most common Management, Business, Science and Arts occupations in Agar are Management (14 | 26.9%), Community & Social Service (11 | 21.1%), Arts, Media & Entertainment (11 | 21.1%), Health Diagnosing & Treating (3 | 5.8%), and Health Technologists (3 | 5.8%).
Management, Business, Science and Arts Occupations by Sex
Within the Management, Business, Science and Arts occupations in Agar, the most male-oriented occupations are Community & Social Service (100.0%), Arts, Media & Entertainment (100.0%), and Management (78.6%), while the most female-oriented occupations are Computers, Engineering & Science (100.0%), Life, Physical & Social Science (100.0%), and Health Diagnosing & Treating (100.0%).
| Occupation | Male | Female |
| Management | 11 (78.6%) | 3 (21.4%) |
| Business & Financial | 0 (0.0%) | 0 (0.0%) |
| Computers, Engineering & Science | 0 (0.0%) | 2 (100.0%) |
| Computers & Mathematics | 0 (0.0%) | 0 (0.0%) |
| Architecture & Engineering | 0 (0.0%) | 0 (0.0%) |
| Life, Physical & Social Science | 0 (0.0%) | 2 (100.0%) |
| Community & Social Service | 11 (100.0%) | 0 (0.0%) |
| Education, Arts & Media | 0 (0.0%) | 0 (0.0%) |
| Legal Services & Support | 0 (0.0%) | 0 (0.0%) |
| Education Instruction & Library | 0 (0.0%) | 0 (0.0%) |
| Arts, Media & Entertainment | 11 (100.0%) | 0 (0.0%) |
| Health Diagnosing & Treating | 0 (0.0%) | 3 (100.0%) |
| Health Technologists | 0 (0.0%) | 3 (100.0%) |
| Total (Category) | 22 (73.3%) | 8 (26.7%) |
| Total (Overall) | 40 (76.9%) | 12 (23.1%) |
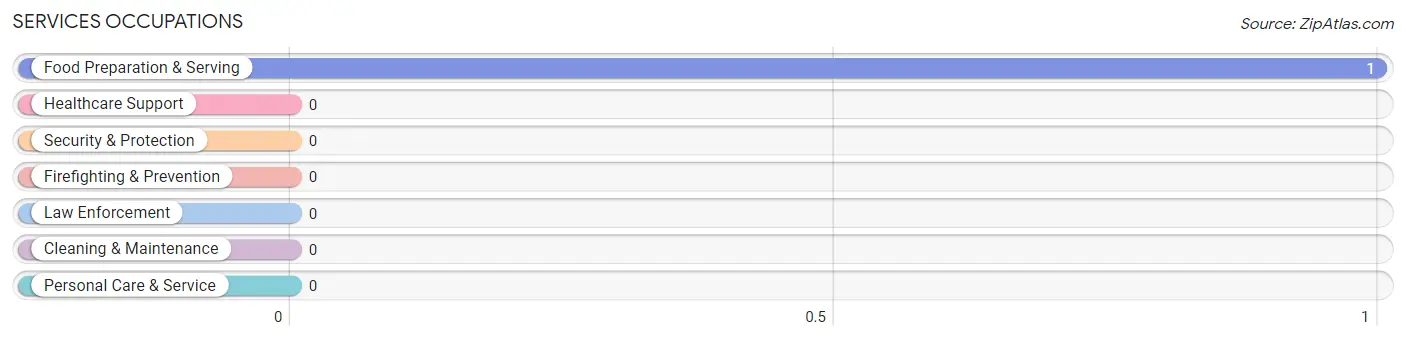
Services Occupations
The most common Services occupations in Agar are , and Food Preparation & Serving (1 | 1.9%).
Services Occupations by Sex
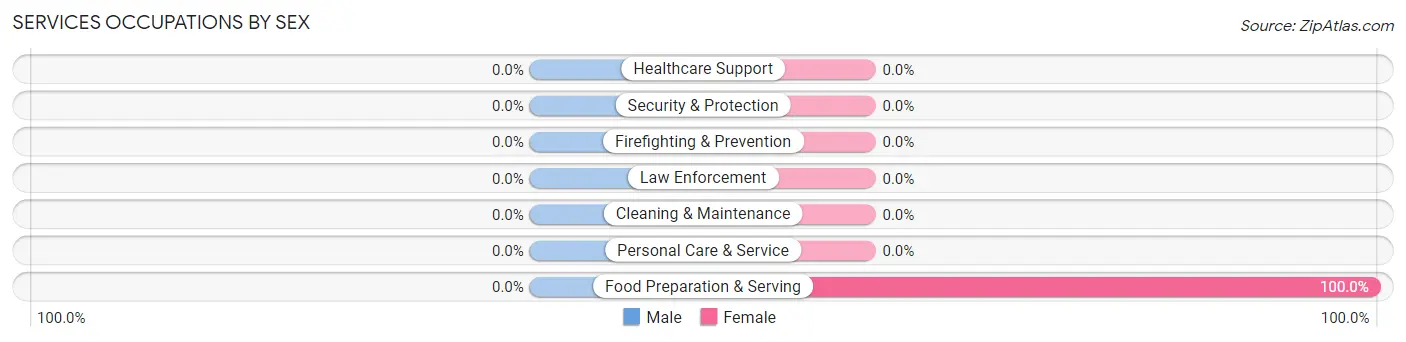
| Occupation | Male | Female |
| Healthcare Support | 0 (0.0%) | 0 (0.0%) |
| Security & Protection | 0 (0.0%) | 0 (0.0%) |
| Firefighting & Prevention | 0 (0.0%) | 0 (0.0%) |
| Law Enforcement | 0 (0.0%) | 0 (0.0%) |
| Food Preparation & Serving | 0 (0.0%) | 1 (100.0%) |
| Cleaning & Maintenance | 0 (0.0%) | 0 (0.0%) |
| Personal Care & Service | 0 (0.0%) | 0 (0.0%) |
| Total (Category) | 0 (0.0%) | 1 (100.0%) |
| Total (Overall) | 40 (76.9%) | 12 (23.1%) |
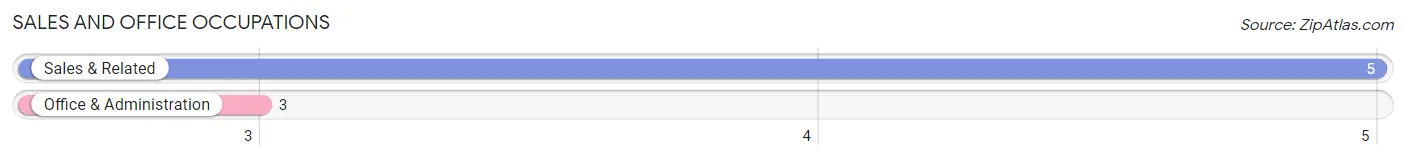
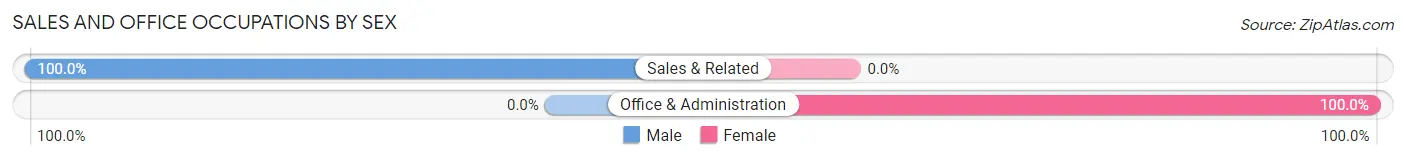
Sales and Office Occupations
The most common Sales and Office occupations in Agar are Sales & Related (5 | 9.6%), and Office & Administration (3 | 5.8%).
Sales and Office Occupations by Sex
| Occupation | Male | Female |
| Sales & Related | 5 (100.0%) | 0 (0.0%) |
| Office & Administration | 0 (0.0%) | 3 (100.0%) |
| Total (Category) | 5 (62.5%) | 3 (37.5%) |
| Total (Overall) | 40 (76.9%) | 12 (23.1%) |
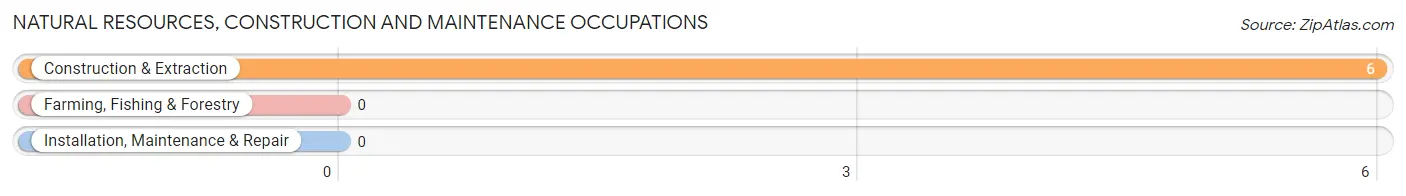
Natural Resources, Construction and Maintenance Occupations
The most common Natural Resources, Construction and Maintenance occupations in Agar are , and Construction & Extraction (6 | 11.5%).
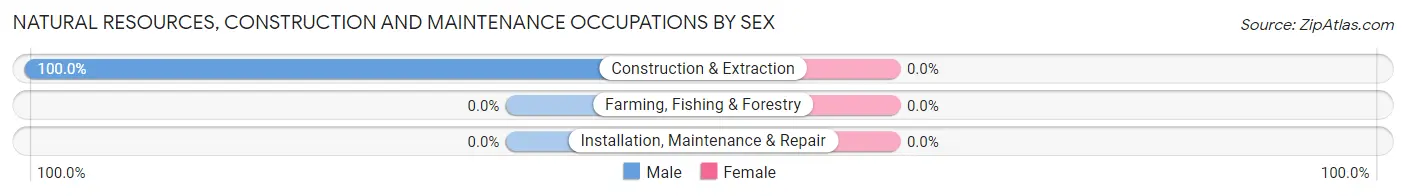
Natural Resources, Construction and Maintenance Occupations by Sex
| Occupation | Male | Female |
| Farming, Fishing & Forestry | 0 (0.0%) | 0 (0.0%) |
| Construction & Extraction | 6 (100.0%) | 0 (0.0%) |
| Installation, Maintenance & Repair | 0 (0.0%) | 0 (0.0%) |
| Total (Category) | 6 (100.0%) | 0 (0.0%) |
| Total (Overall) | 40 (76.9%) | 12 (23.1%) |
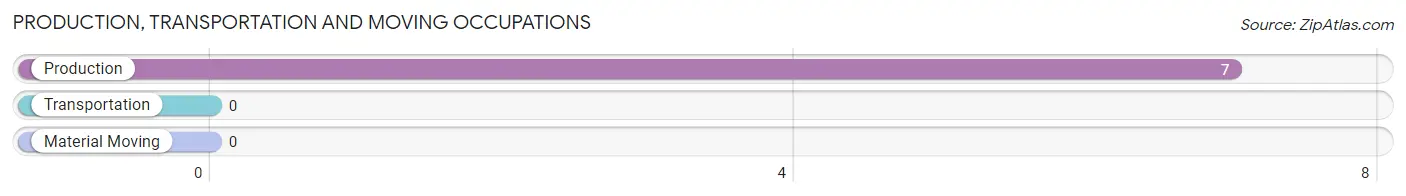
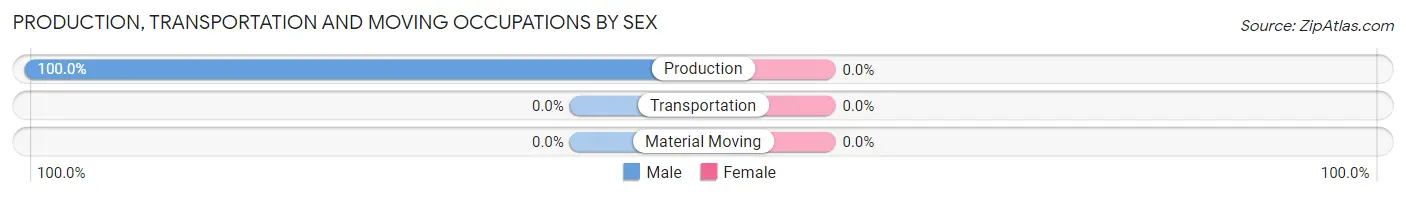
Production, Transportation and Moving Occupations
The most common Production, Transportation and Moving occupations in Agar are , and Production (7 | 13.5%).
Production, Transportation and Moving Occupations by Sex
| Occupation | Male | Female |
| Production | 7 (100.0%) | 0 (0.0%) |
| Transportation | 0 (0.0%) | 0 (0.0%) |
| Material Moving | 0 (0.0%) | 0 (0.0%) |
| Total (Category) | 7 (100.0%) | 0 (0.0%) |
| Total (Overall) | 40 (76.9%) | 12 (23.1%) |
Employment Industries by Sex in Agar
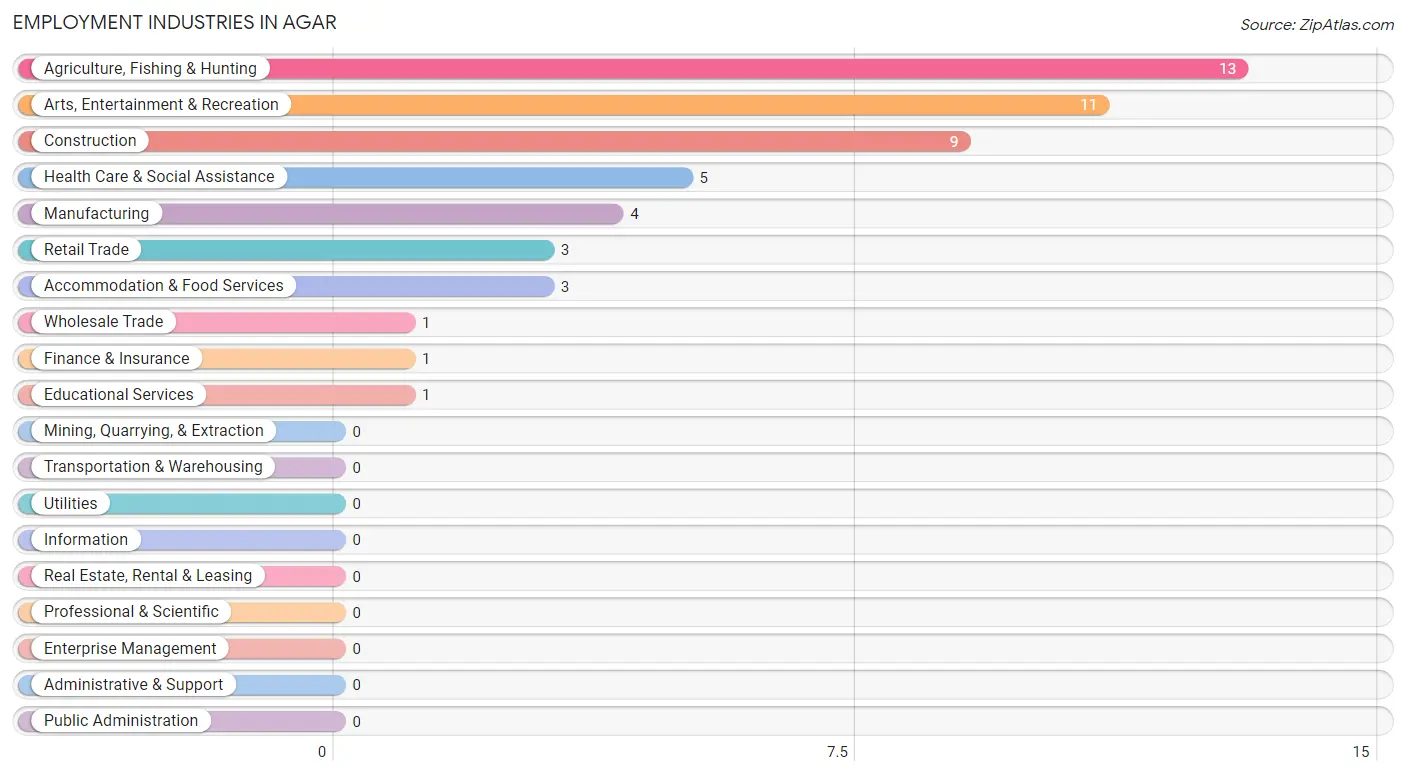
Employment Industries in Agar
The major employment industries in Agar include Agriculture, Fishing & Hunting (13 | 25.0%), Arts, Entertainment & Recreation (11 | 21.1%), Construction (9 | 17.3%), Health Care & Social Assistance (5 | 9.6%), and Manufacturing (4 | 7.7%).
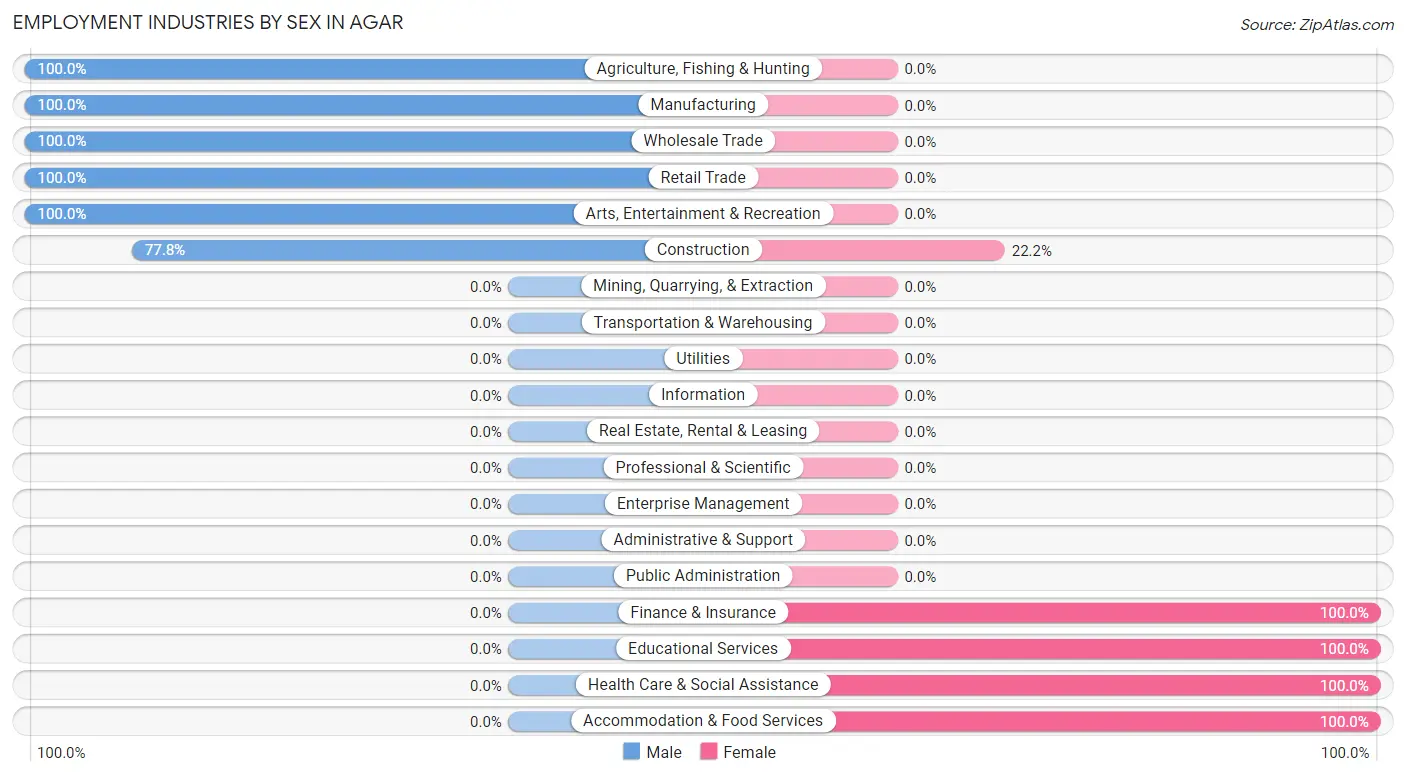
Employment Industries by Sex in Agar
The Agar industries that see more men than women are Agriculture, Fishing & Hunting (100.0%), Manufacturing (100.0%), and Wholesale Trade (100.0%), whereas the industries that tend to have a higher number of women are Finance & Insurance (100.0%), Educational Services (100.0%), and Health Care & Social Assistance (100.0%).
| Industry | Male | Female |
| Agriculture, Fishing & Hunting | 13 (100.0%) | 0 (0.0%) |
| Mining, Quarrying, & Extraction | 0 (0.0%) | 0 (0.0%) |
| Construction | 7 (77.8%) | 2 (22.2%) |
| Manufacturing | 4 (100.0%) | 0 (0.0%) |
| Wholesale Trade | 1 (100.0%) | 0 (0.0%) |
| Retail Trade | 3 (100.0%) | 0 (0.0%) |
| Transportation & Warehousing | 0 (0.0%) | 0 (0.0%) |
| Utilities | 0 (0.0%) | 0 (0.0%) |
| Information | 0 (0.0%) | 0 (0.0%) |
| Finance & Insurance | 0 (0.0%) | 1 (100.0%) |
| Real Estate, Rental & Leasing | 0 (0.0%) | 0 (0.0%) |
| Professional & Scientific | 0 (0.0%) | 0 (0.0%) |
| Enterprise Management | 0 (0.0%) | 0 (0.0%) |
| Administrative & Support | 0 (0.0%) | 0 (0.0%) |
| Educational Services | 0 (0.0%) | 1 (100.0%) |
| Health Care & Social Assistance | 0 (0.0%) | 5 (100.0%) |
| Arts, Entertainment & Recreation | 11 (100.0%) | 0 (0.0%) |
| Accommodation & Food Services | 0 (0.0%) | 3 (100.0%) |
| Public Administration | 0 (0.0%) | 0 (0.0%) |
| Total | 40 (76.9%) | 12 (23.1%) |
Education in Agar
School Enrollment in Agar
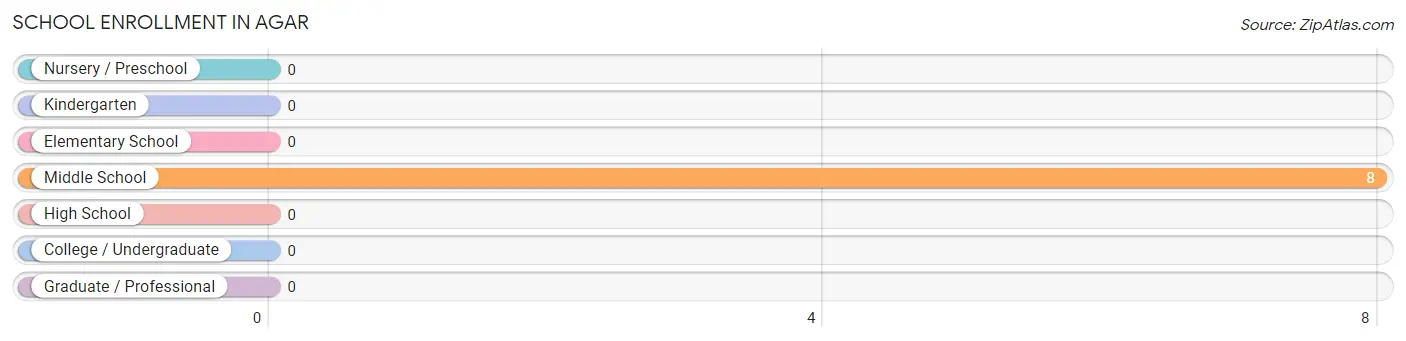
| School Level | # Students | % Students |
| Nursery / Preschool | 0 | 0.0% |
| Kindergarten | 0 | 0.0% |
| Elementary School | 0 | 0.0% |
| Middle School | 8 | 100.0% |
| High School | 0 | 0.0% |
| College / Undergraduate | 0 | 0.0% |
| Graduate / Professional | 0 | 0.0% |
| Total | 8 | 100.0% |
School Enrollment by Age by Funding Source in Agar
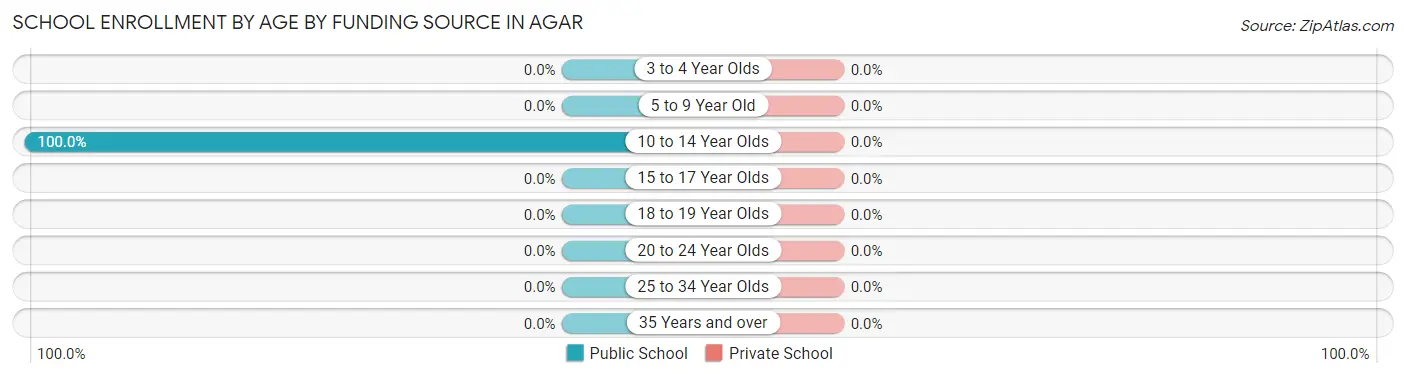
| Age Bracket | Public School | Private School |
| 3 to 4 Year Olds | 0 (0.0%) | 0 (0.0%) |
| 5 to 9 Year Old | 0 (0.0%) | 0 (0.0%) |
| 10 to 14 Year Olds | 8 (100.0%) | 0 (0.0%) |
| 15 to 17 Year Olds | 0 (0.0%) | 0 (0.0%) |
| 18 to 19 Year Olds | 0 (0.0%) | 0 (0.0%) |
| 20 to 24 Year Olds | 0 (0.0%) | 0 (0.0%) |
| 25 to 34 Year Olds | 0 (0.0%) | 0 (0.0%) |
| 35 Years and over | 0 (0.0%) | 0 (0.0%) |
| Total | 8 (100.0%) | 0 (0.0%) |
Educational Attainment by Field of Study in Agar
Business (9 | 31.0%), bio, nature & agricultural (8 | 27.6%), arts & humanities (6 | 20.7%), multidisciplinary studies (2 | 6.9%), and science & technology (2 | 6.9%) are the most common fields of study among 29 individuals in Agar who have obtained a bachelor's degree or higher.
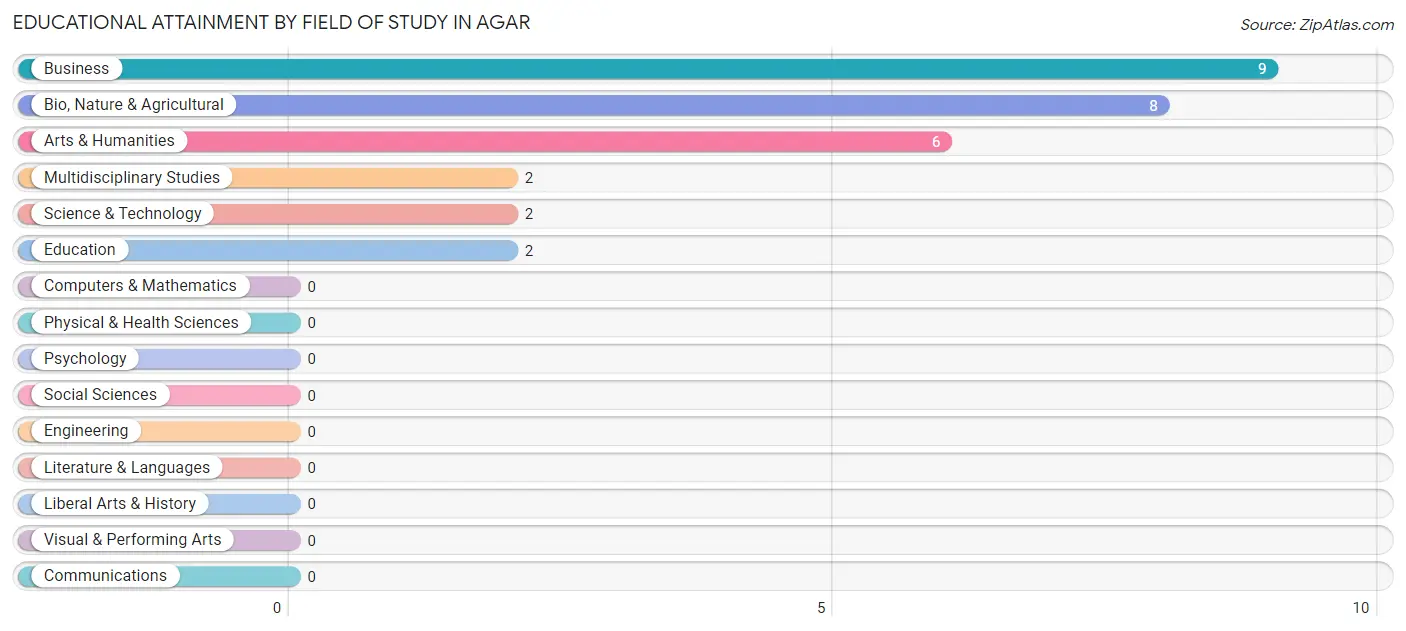
| Field of Study | # Graduates | % Graduates |
| Computers & Mathematics | 0 | 0.0% |
| Bio, Nature & Agricultural | 8 | 27.6% |
| Physical & Health Sciences | 0 | 0.0% |
| Psychology | 0 | 0.0% |
| Social Sciences | 0 | 0.0% |
| Engineering | 0 | 0.0% |
| Multidisciplinary Studies | 2 | 6.9% |
| Science & Technology | 2 | 6.9% |
| Business | 9 | 31.0% |
| Education | 2 | 6.9% |
| Literature & Languages | 0 | 0.0% |
| Liberal Arts & History | 0 | 0.0% |
| Visual & Performing Arts | 0 | 0.0% |
| Communications | 0 | 0.0% |
| Arts & Humanities | 6 | 20.7% |
| Total | 29 | 100.0% |
Transportation & Commute in Agar
Vehicle Availability by Sex in Agar
The most prevalent vehicle ownership categories in Agar are males with 3 vehicles (16, accounting for 40.0%) and females with 3 vehicles (10, making up 133.3%).
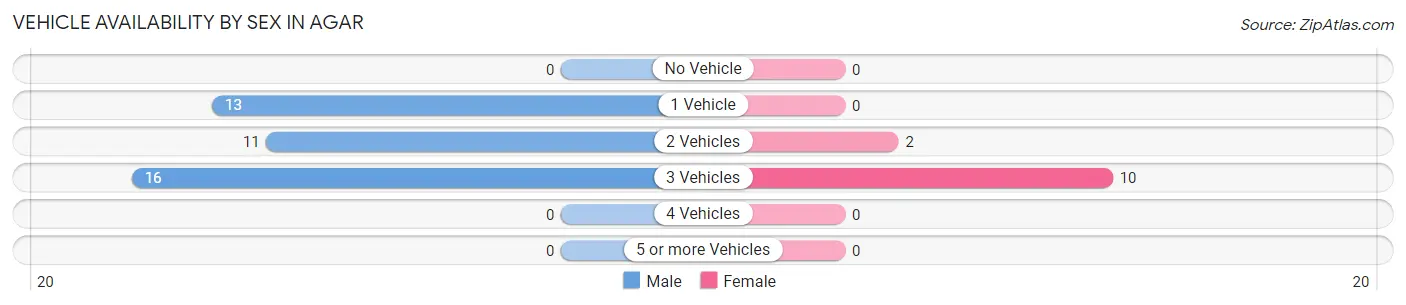
| Vehicles Available | Male | Female |
| No Vehicle | 0 (0.0%) | 0 (0.0%) |
| 1 Vehicle | 13 (32.5%) | 0 (0.0%) |
| 2 Vehicles | 11 (27.5%) | 2 (16.7%) |
| 3 Vehicles | 16 (40.0%) | 10 (83.3%) |
| 4 Vehicles | 0 (0.0%) | 0 (0.0%) |
| 5 or more Vehicles | 0 (0.0%) | 0 (0.0%) |
| Total | 40 (100.0%) | 12 (100.0%) |
Commute Time in Agar
The most frequently occuring commute durations in Agar are 20 to 24 minutes (14 commuters, 26.9%), 10 to 14 minutes (10 commuters, 19.2%), and less than 5 minutes (8 commuters, 15.4%).
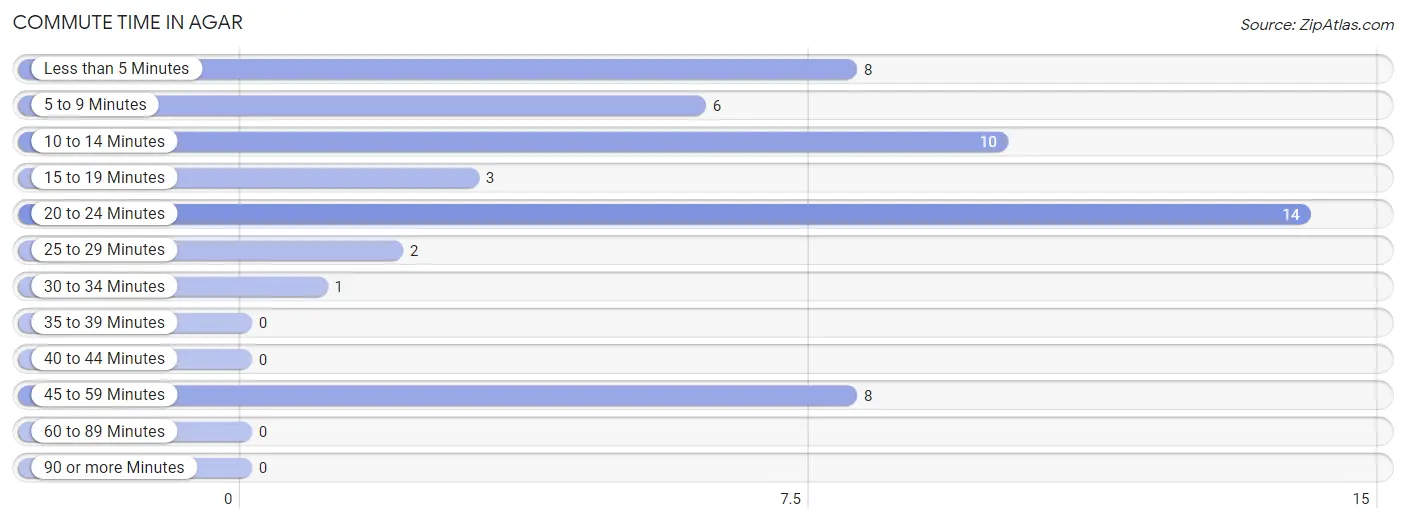
| Commute Time | # Commuters | % Commuters |
| Less than 5 Minutes | 8 | 15.4% |
| 5 to 9 Minutes | 6 | 11.5% |
| 10 to 14 Minutes | 10 | 19.2% |
| 15 to 19 Minutes | 3 | 5.8% |
| 20 to 24 Minutes | 14 | 26.9% |
| 25 to 29 Minutes | 2 | 3.8% |
| 30 to 34 Minutes | 1 | 1.9% |
| 35 to 39 Minutes | 0 | 0.0% |
| 40 to 44 Minutes | 0 | 0.0% |
| 45 to 59 Minutes | 8 | 15.4% |
| 60 to 89 Minutes | 0 | 0.0% |
| 90 or more Minutes | 0 | 0.0% |
Commute Time by Sex in Agar
The most common commute times in Agar are 20 to 24 minutes (11 commuters, 27.5%) for males and less than 5 minutes (3 commuters, 25.0%) for females.
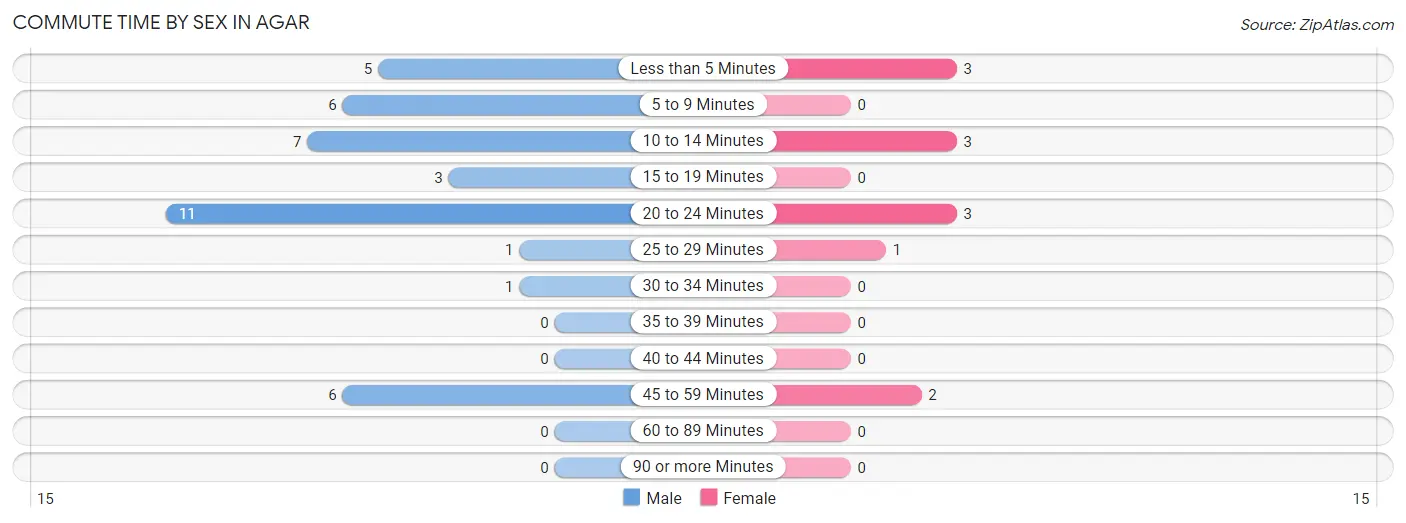
| Commute Time | Male | Female |
| Less than 5 Minutes | 5 (12.5%) | 3 (25.0%) |
| 5 to 9 Minutes | 6 (15.0%) | 0 (0.0%) |
| 10 to 14 Minutes | 7 (17.5%) | 3 (25.0%) |
| 15 to 19 Minutes | 3 (7.5%) | 0 (0.0%) |
| 20 to 24 Minutes | 11 (27.5%) | 3 (25.0%) |
| 25 to 29 Minutes | 1 (2.5%) | 1 (8.3%) |
| 30 to 34 Minutes | 1 (2.5%) | 0 (0.0%) |
| 35 to 39 Minutes | 0 (0.0%) | 0 (0.0%) |
| 40 to 44 Minutes | 0 (0.0%) | 0 (0.0%) |
| 45 to 59 Minutes | 6 (15.0%) | 2 (16.7%) |
| 60 to 89 Minutes | 0 (0.0%) | 0 (0.0%) |
| 90 or more Minutes | 0 (0.0%) | 0 (0.0%) |
Time of Departure to Work by Sex in Agar
The most frequent times of departure to work in Agar are 6:30 AM to 6:59 AM (11, 27.5%) for males and 7:00 AM to 7:29 AM (5, 41.7%) for females.
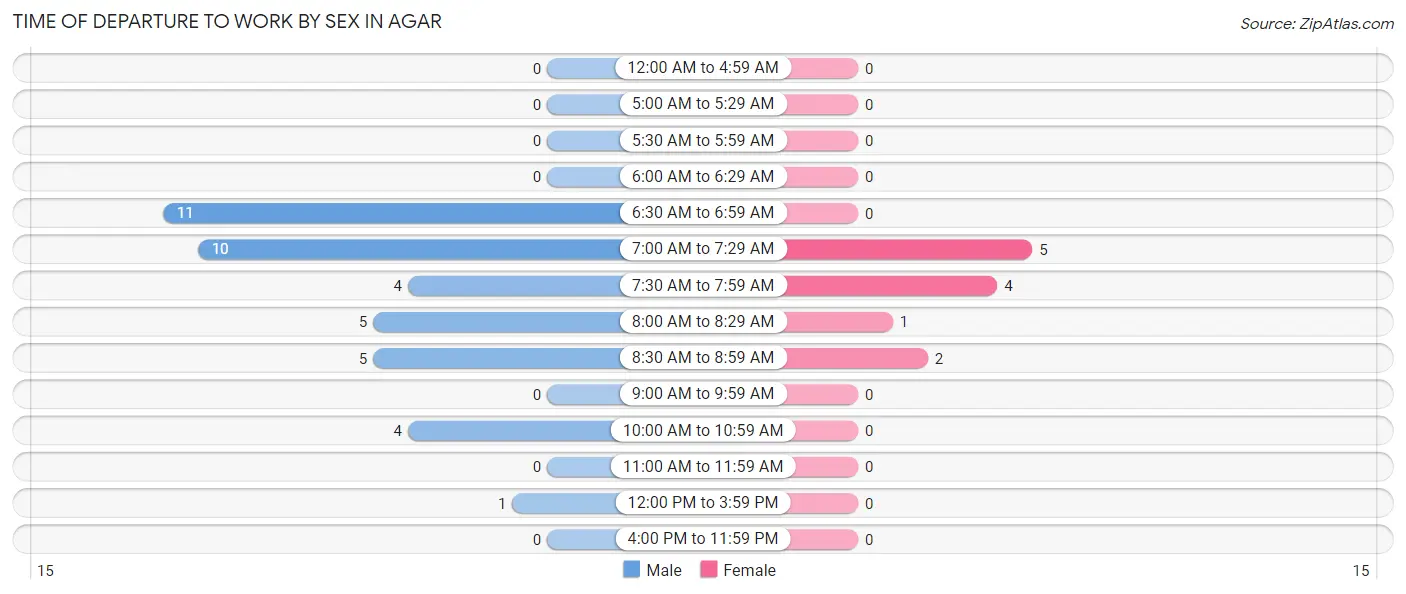
| Time of Departure | Male | Female |
| 12:00 AM to 4:59 AM | 0 (0.0%) | 0 (0.0%) |
| 5:00 AM to 5:29 AM | 0 (0.0%) | 0 (0.0%) |
| 5:30 AM to 5:59 AM | 0 (0.0%) | 0 (0.0%) |
| 6:00 AM to 6:29 AM | 0 (0.0%) | 0 (0.0%) |
| 6:30 AM to 6:59 AM | 11 (27.5%) | 0 (0.0%) |
| 7:00 AM to 7:29 AM | 10 (25.0%) | 5 (41.7%) |
| 7:30 AM to 7:59 AM | 4 (10.0%) | 4 (33.3%) |
| 8:00 AM to 8:29 AM | 5 (12.5%) | 1 (8.3%) |
| 8:30 AM to 8:59 AM | 5 (12.5%) | 2 (16.7%) |
| 9:00 AM to 9:59 AM | 0 (0.0%) | 0 (0.0%) |
| 10:00 AM to 10:59 AM | 4 (10.0%) | 0 (0.0%) |
| 11:00 AM to 11:59 AM | 0 (0.0%) | 0 (0.0%) |
| 12:00 PM to 3:59 PM | 1 (2.5%) | 0 (0.0%) |
| 4:00 PM to 11:59 PM | 0 (0.0%) | 0 (0.0%) |
| Total | 40 (100.0%) | 12 (100.0%) |
Housing Occupancy in Agar
Occupancy by Ownership in Agar
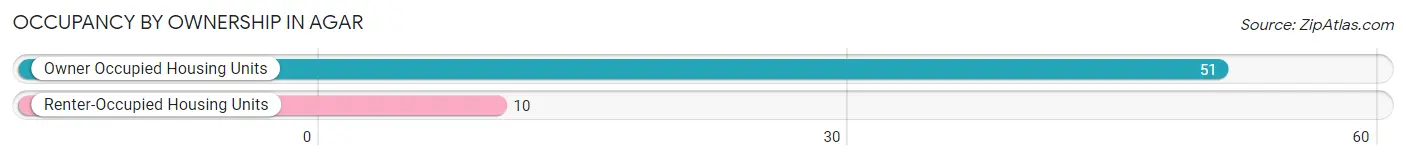
Of the total 61 dwellings in Agar, owner-occupied units account for 51 (83.6%), while renter-occupied units make up 10 (16.4%).
| Occupancy | # Housing Units | % Housing Units |
| Owner Occupied Housing Units | 51 | 83.6% |
| Renter-Occupied Housing Units | 10 | 16.4% |
| Total Occupied Housing Units | 61 | 100.0% |
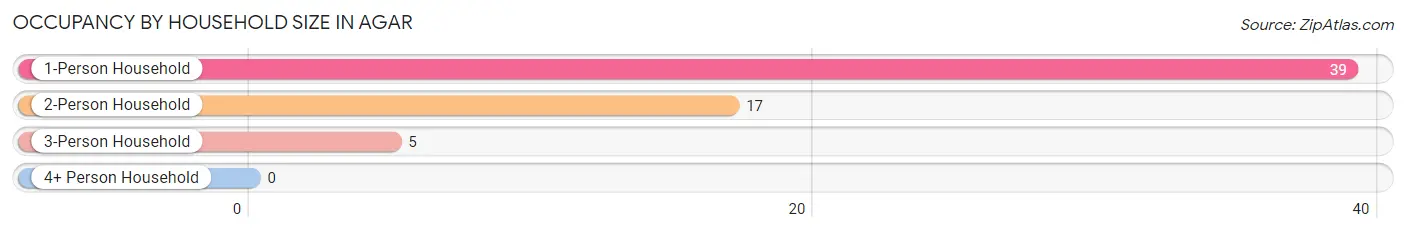
Occupancy by Household Size in Agar
| Household Size | # Housing Units | % Housing Units |
| 1-Person Household | 39 | 63.9% |
| 2-Person Household | 17 | 27.9% |
| 3-Person Household | 5 | 8.2% |
| 4+ Person Household | 0 | 0.0% |
| Total Housing Units | 61 | 100.0% |
Occupancy by Ownership by Household Size in Agar
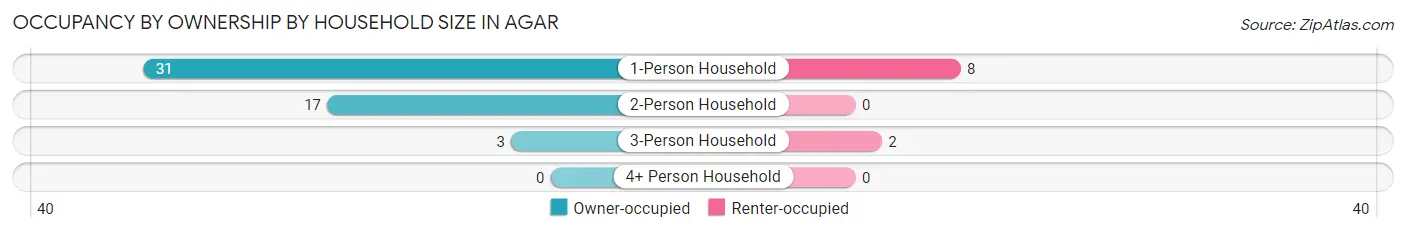
| Household Size | Owner-occupied | Renter-occupied |
| 1-Person Household | 31 (79.5%) | 8 (20.5%) |
| 2-Person Household | 17 (100.0%) | 0 (0.0%) |
| 3-Person Household | 3 (60.0%) | 2 (40.0%) |
| 4+ Person Household | 0 (0.0%) | 0 (0.0%) |
| Total Housing Units | 51 (83.6%) | 10 (16.4%) |
Occupancy by Educational Attainment in Agar
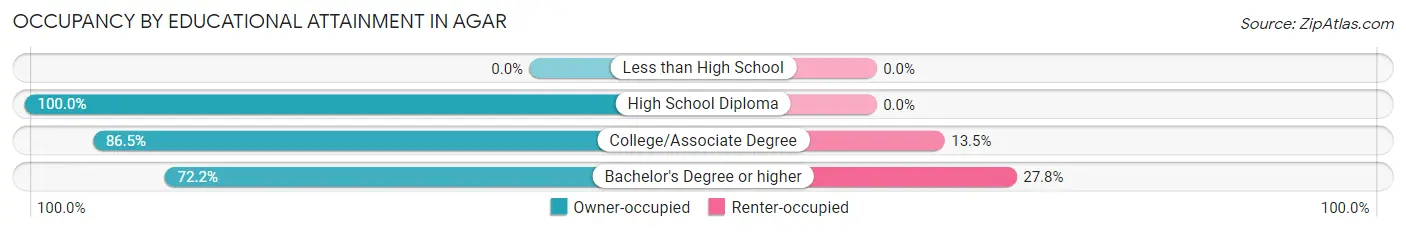
| Household Size | Owner-occupied | Renter-occupied |
| Less than High School | 0 (0.0%) | 0 (0.0%) |
| High School Diploma | 6 (100.0%) | 0 (0.0%) |
| College/Associate Degree | 32 (86.5%) | 5 (13.5%) |
| Bachelor's Degree or higher | 13 (72.2%) | 5 (27.8%) |
Occupancy by Age of Householder in Agar
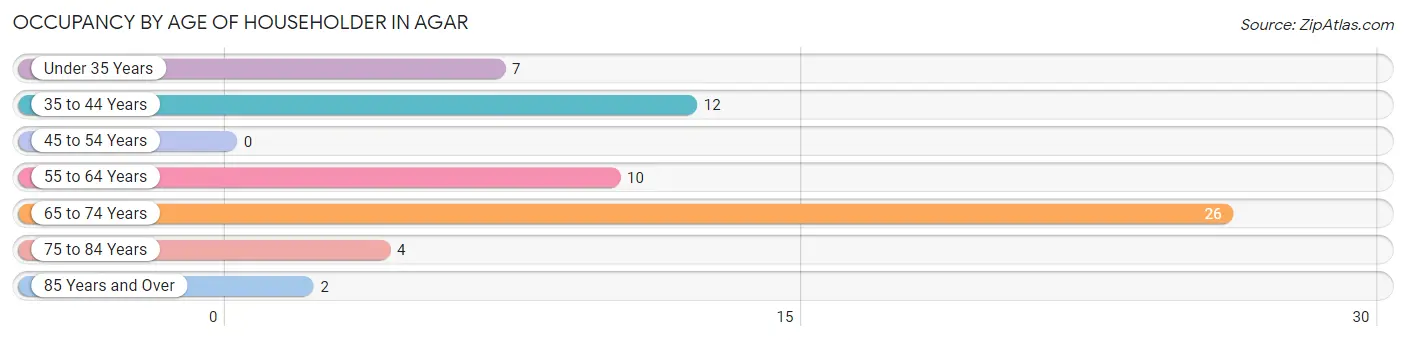
| Age Bracket | # Households | % Households |
| Under 35 Years | 7 | 11.5% |
| 35 to 44 Years | 12 | 19.7% |
| 45 to 54 Years | 0 | 0.0% |
| 55 to 64 Years | 10 | 16.4% |
| 65 to 74 Years | 26 | 42.6% |
| 75 to 84 Years | 4 | 6.6% |
| 85 Years and Over | 2 | 3.3% |
| Total | 61 | 100.0% |
Housing Finances in Agar
Median Income by Occupancy in Agar
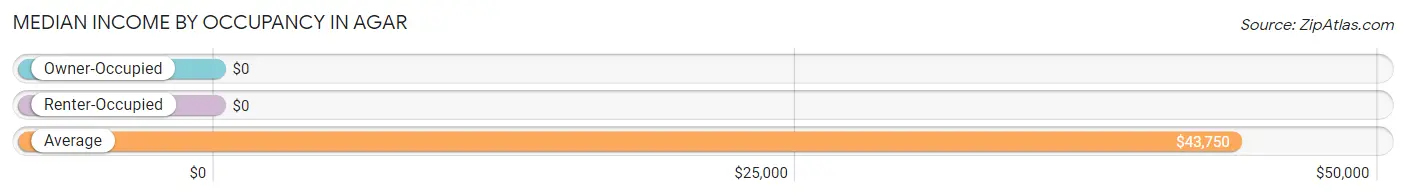
| Occupancy Type | # Households | Median Income |
| Owner-Occupied | 51 (83.6%) | $0 |
| Renter-Occupied | 10 (16.4%) | $0 |
| Average | 61 (100.0%) | $43,750 |
Occupancy by Householder Income Bracket in Agar
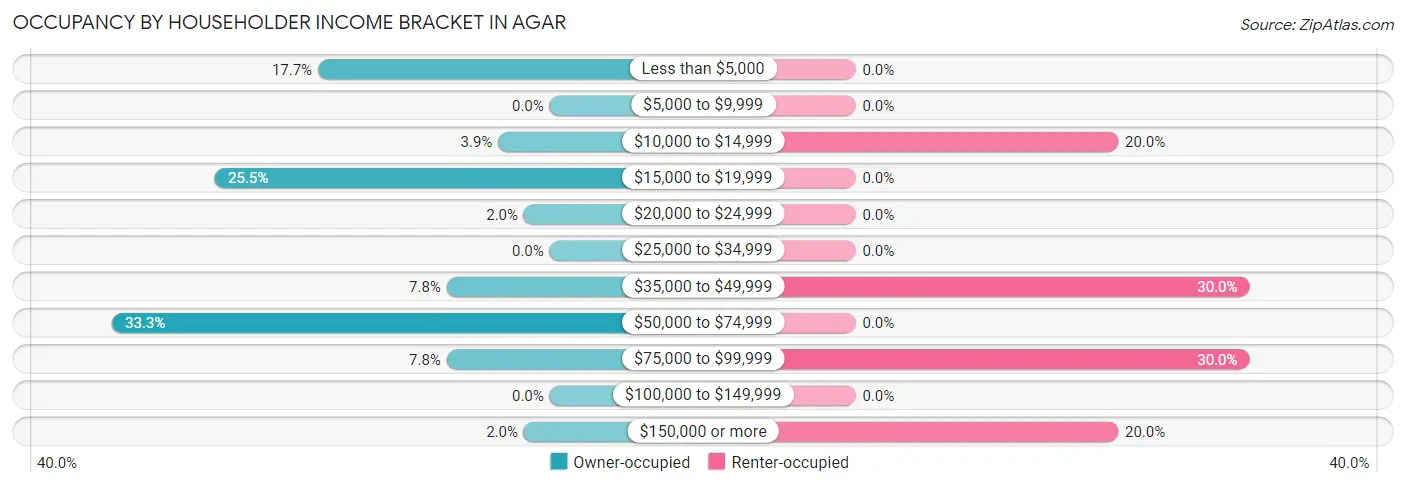
| Income Bracket | Owner-occupied | Renter-occupied |
| Less than $5,000 | 9 (17.6%) | 0 (0.0%) |
| $5,000 to $9,999 | 0 (0.0%) | 0 (0.0%) |
| $10,000 to $14,999 | 2 (3.9%) | 2 (20.0%) |
| $15,000 to $19,999 | 13 (25.5%) | 0 (0.0%) |
| $20,000 to $24,999 | 1 (2.0%) | 0 (0.0%) |
| $25,000 to $34,999 | 0 (0.0%) | 0 (0.0%) |
| $35,000 to $49,999 | 4 (7.8%) | 3 (30.0%) |
| $50,000 to $74,999 | 17 (33.3%) | 0 (0.0%) |
| $75,000 to $99,999 | 4 (7.8%) | 3 (30.0%) |
| $100,000 to $149,999 | 0 (0.0%) | 0 (0.0%) |
| $150,000 or more | 1 (2.0%) | 2 (20.0%) |
| Total | 51 (100.0%) | 10 (100.0%) |
Monthly Housing Cost Tiers in Agar
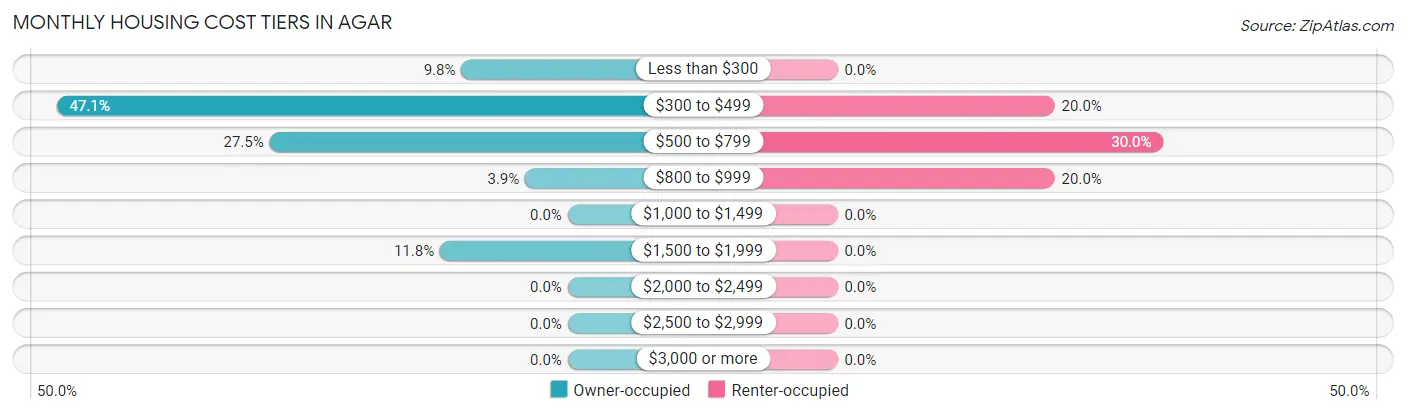
| Monthly Cost | Owner-occupied | Renter-occupied |
| Less than $300 | 5 (9.8%) | 0 (0.0%) |
| $300 to $499 | 24 (47.1%) | 2 (20.0%) |
| $500 to $799 | 14 (27.5%) | 3 (30.0%) |
| $800 to $999 | 2 (3.9%) | 2 (20.0%) |
| $1,000 to $1,499 | 0 (0.0%) | 0 (0.0%) |
| $1,500 to $1,999 | 6 (11.8%) | 0 (0.0%) |
| $2,000 to $2,499 | 0 (0.0%) | 0 (0.0%) |
| $2,500 to $2,999 | 0 (0.0%) | 0 (0.0%) |
| $3,000 or more | 0 (0.0%) | 0 (0.0%) |
| Total | 51 (100.0%) | 10 (100.0%) |
Physical Housing Characteristics in Agar
Housing Structures in Agar
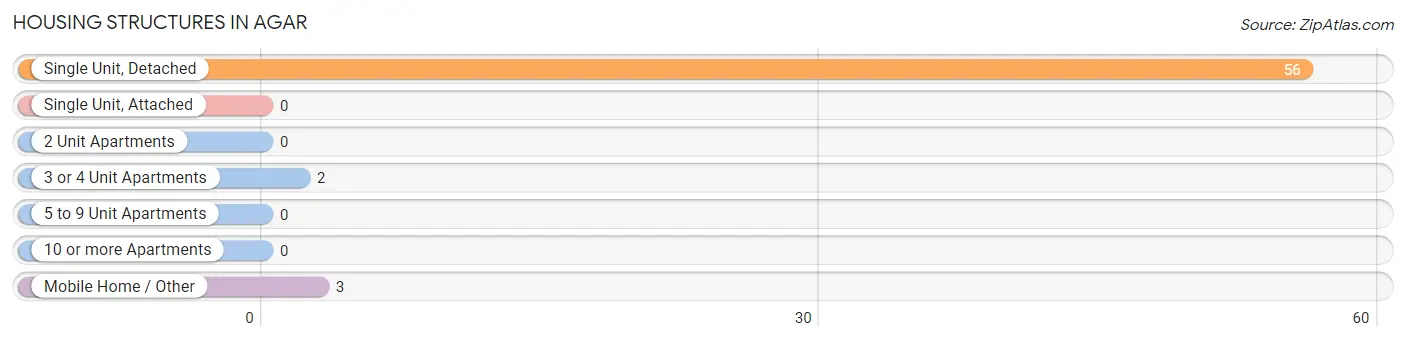
| Structure Type | # Housing Units | % Housing Units |
| Single Unit, Detached | 56 | 91.8% |
| Single Unit, Attached | 0 | 0.0% |
| 2 Unit Apartments | 0 | 0.0% |
| 3 or 4 Unit Apartments | 2 | 3.3% |
| 5 to 9 Unit Apartments | 0 | 0.0% |
| 10 or more Apartments | 0 | 0.0% |
| Mobile Home / Other | 3 | 4.9% |
| Total | 61 | 100.0% |
Housing Structures by Occupancy in Agar
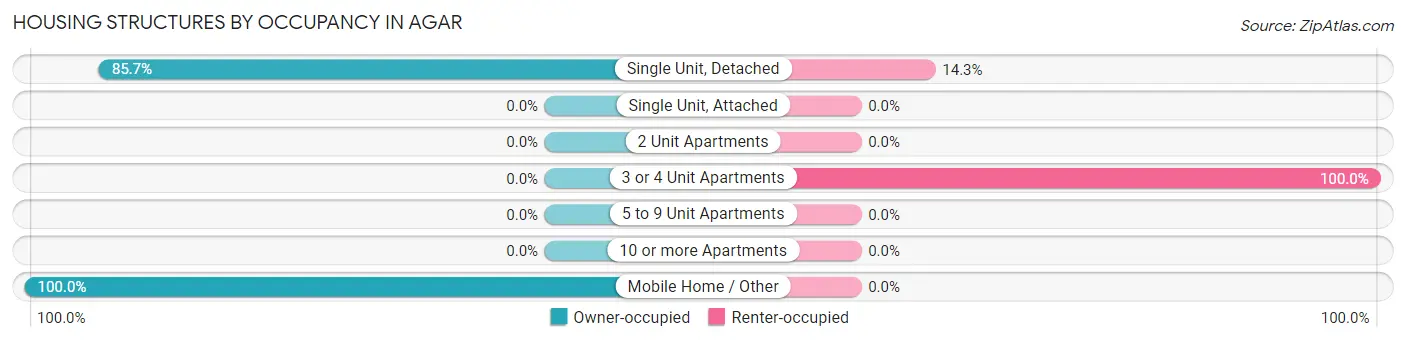
| Structure Type | Owner-occupied | Renter-occupied |
| Single Unit, Detached | 48 (85.7%) | 8 (14.3%) |
| Single Unit, Attached | 0 (0.0%) | 0 (0.0%) |
| 2 Unit Apartments | 0 (0.0%) | 0 (0.0%) |
| 3 or 4 Unit Apartments | 0 (0.0%) | 2 (100.0%) |
| 5 to 9 Unit Apartments | 0 (0.0%) | 0 (0.0%) |
| 10 or more Apartments | 0 (0.0%) | 0 (0.0%) |
| Mobile Home / Other | 3 (100.0%) | 0 (0.0%) |
| Total | 51 (83.6%) | 10 (16.4%) |
Housing Structures by Number of Rooms in Agar
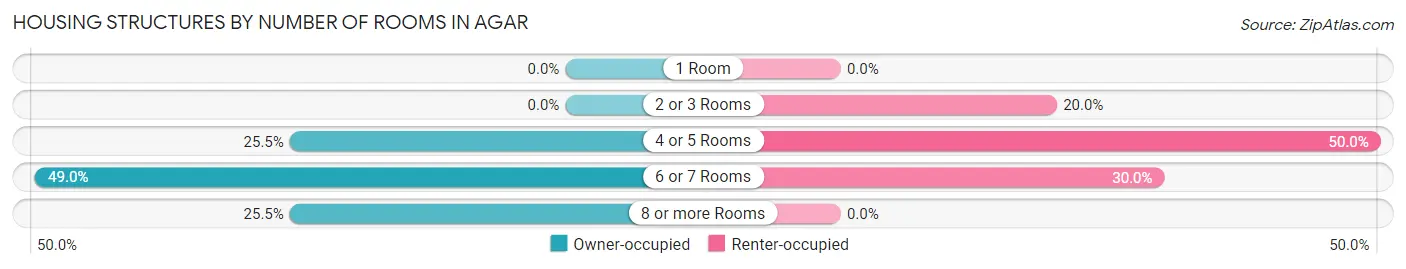
| Number of Rooms | Owner-occupied | Renter-occupied |
| 1 Room | 0 (0.0%) | 0 (0.0%) |
| 2 or 3 Rooms | 0 (0.0%) | 2 (20.0%) |
| 4 or 5 Rooms | 13 (25.5%) | 5 (50.0%) |
| 6 or 7 Rooms | 25 (49.0%) | 3 (30.0%) |
| 8 or more Rooms | 13 (25.5%) | 0 (0.0%) |
| Total | 51 (100.0%) | 10 (100.0%) |
Housing Structure by Heating Type in Agar
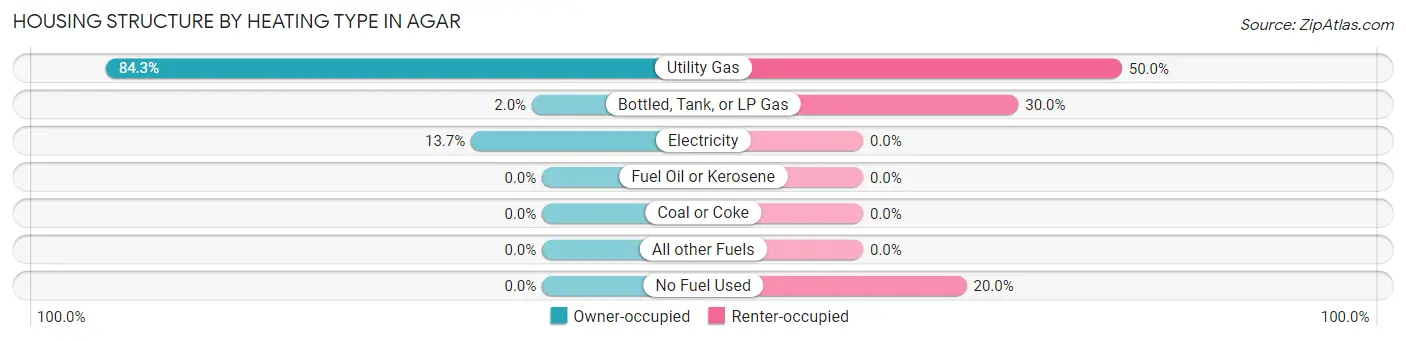
| Heating Type | Owner-occupied | Renter-occupied |
| Utility Gas | 43 (84.3%) | 5 (50.0%) |
| Bottled, Tank, or LP Gas | 1 (2.0%) | 3 (30.0%) |
| Electricity | 7 (13.7%) | 0 (0.0%) |
| Fuel Oil or Kerosene | 0 (0.0%) | 0 (0.0%) |
| Coal or Coke | 0 (0.0%) | 0 (0.0%) |
| All other Fuels | 0 (0.0%) | 0 (0.0%) |
| No Fuel Used | 0 (0.0%) | 2 (20.0%) |
| Total | 51 (100.0%) | 10 (100.0%) |
Household Vehicle Usage in Agar
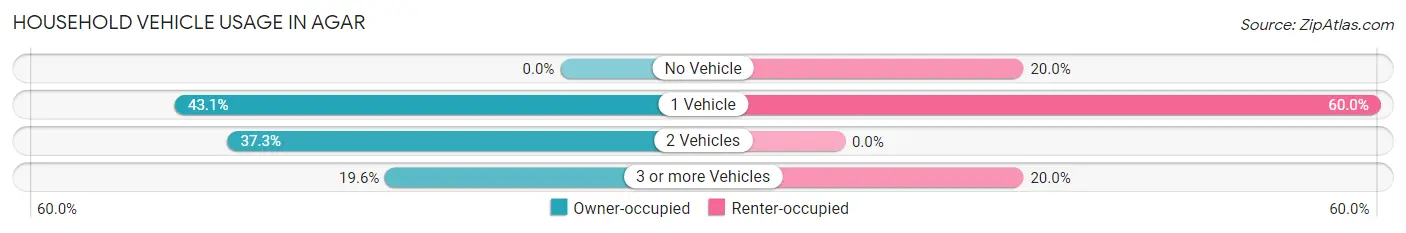
| Vehicles per Household | Owner-occupied | Renter-occupied |
| No Vehicle | 0 (0.0%) | 2 (20.0%) |
| 1 Vehicle | 22 (43.1%) | 6 (60.0%) |
| 2 Vehicles | 19 (37.2%) | 0 (0.0%) |
| 3 or more Vehicles | 10 (19.6%) | 2 (20.0%) |
| Total | 51 (100.0%) | 10 (100.0%) |
Real Estate & Mortgages in Agar
Real Estate and Mortgage Overview in Agar
| Characteristic | Without Mortgage | With Mortgage |
| Housing Units | 33 | 18 |
| Median Property Value | $111,600 | $0 |
| Median Household Income | - | - |
| Monthly Housing Costs | $338 | $0 |
| Real Estate Taxes | $313 | $5 |
Property Value by Mortgage Status in Agar
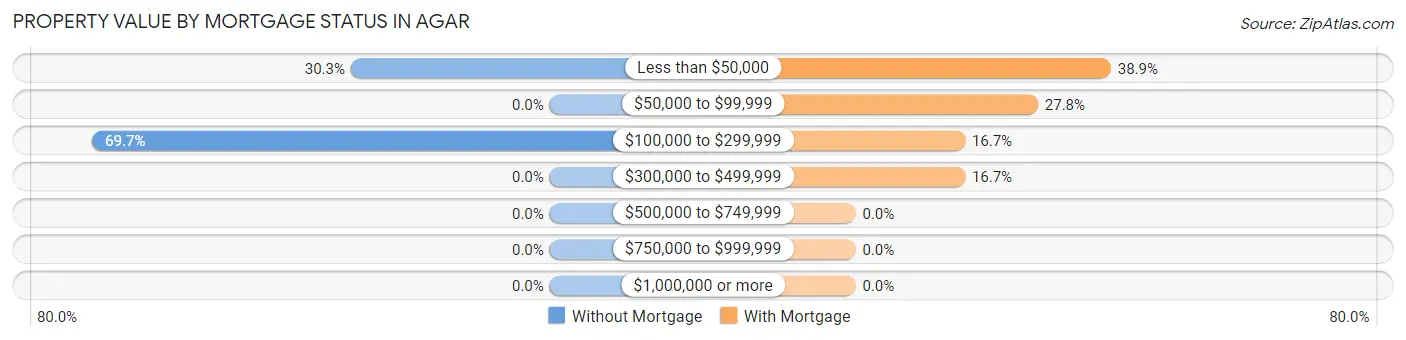
| Property Value | Without Mortgage | With Mortgage |
| Less than $50,000 | 10 (30.3%) | 7 (38.9%) |
| $50,000 to $99,999 | 0 (0.0%) | 5 (27.8%) |
| $100,000 to $299,999 | 23 (69.7%) | 3 (16.7%) |
| $300,000 to $499,999 | 0 (0.0%) | 3 (16.7%) |
| $500,000 to $749,999 | 0 (0.0%) | 0 (0.0%) |
| $750,000 to $999,999 | 0 (0.0%) | 0 (0.0%) |
| $1,000,000 or more | 0 (0.0%) | 0 (0.0%) |
| Total | 33 (100.0%) | 18 (100.0%) |
Household Income by Mortgage Status in Agar
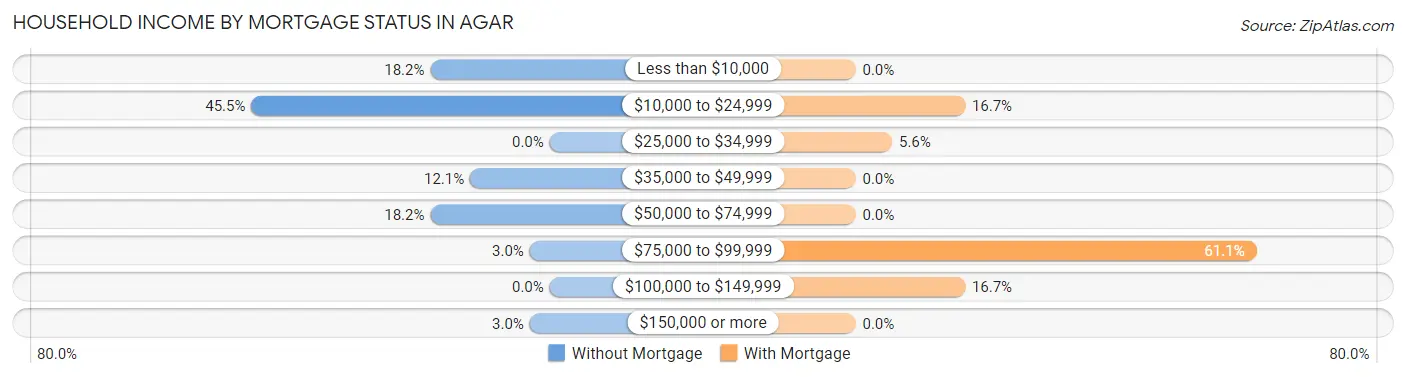
| Household Income | Without Mortgage | With Mortgage |
| Less than $10,000 | 6 (18.2%) | 0 (0.0%) |
| $10,000 to $24,999 | 15 (45.5%) | 3 (16.7%) |
| $25,000 to $34,999 | 0 (0.0%) | 1 (5.6%) |
| $35,000 to $49,999 | 4 (12.1%) | 0 (0.0%) |
| $50,000 to $74,999 | 6 (18.2%) | 0 (0.0%) |
| $75,000 to $99,999 | 1 (3.0%) | 11 (61.1%) |
| $100,000 to $149,999 | 0 (0.0%) | 3 (16.7%) |
| $150,000 or more | 1 (3.0%) | 0 (0.0%) |
| Total | 33 (100.0%) | 18 (100.0%) |
Property Value to Household Income Ratio in Agar
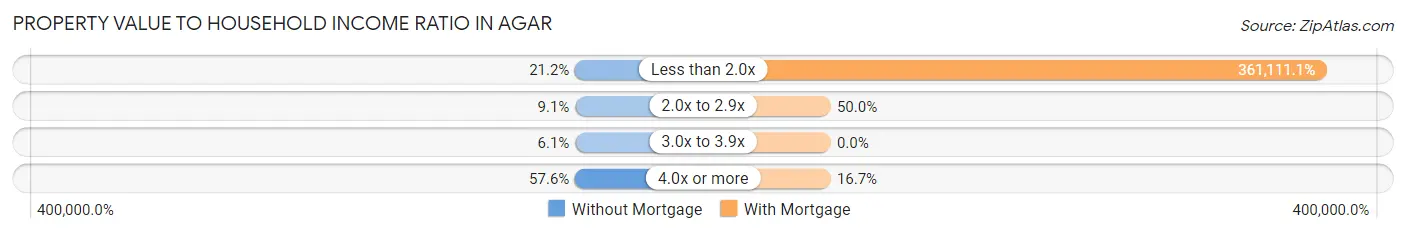
| Value-to-Income Ratio | Without Mortgage | With Mortgage |
| Less than 2.0x | 7 (21.2%) | 65,000 (361,111.1%) |
| 2.0x to 2.9x | 3 (9.1%) | 9 (50.0%) |
| 3.0x to 3.9x | 2 (6.1%) | 0 (0.0%) |
| 4.0x or more | 19 (57.6%) | 3 (16.7%) |
| Total | 33 (100.0%) | 18 (100.0%) |
Real Estate Taxes by Mortgage Status in Agar
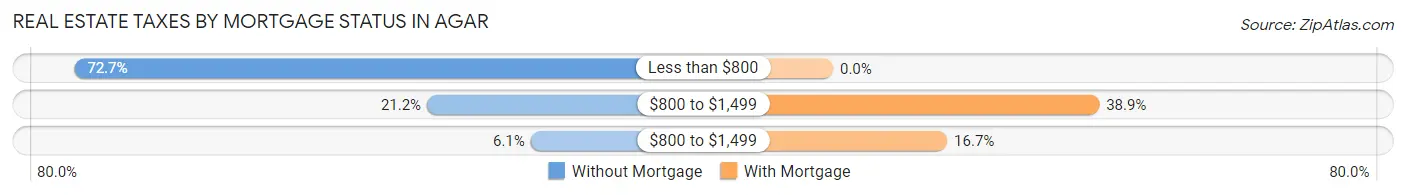
| Property Taxes | Without Mortgage | With Mortgage |
| Less than $800 | 24 (72.7%) | 0 (0.0%) |
| $800 to $1,499 | 7 (21.2%) | 7 (38.9%) |
| $800 to $1,499 | 2 (6.1%) | 3 (16.7%) |
| Total | 33 (100.0%) | 18 (100.0%) |
Health & Disability in Agar
Health Insurance Coverage by Age in Agar
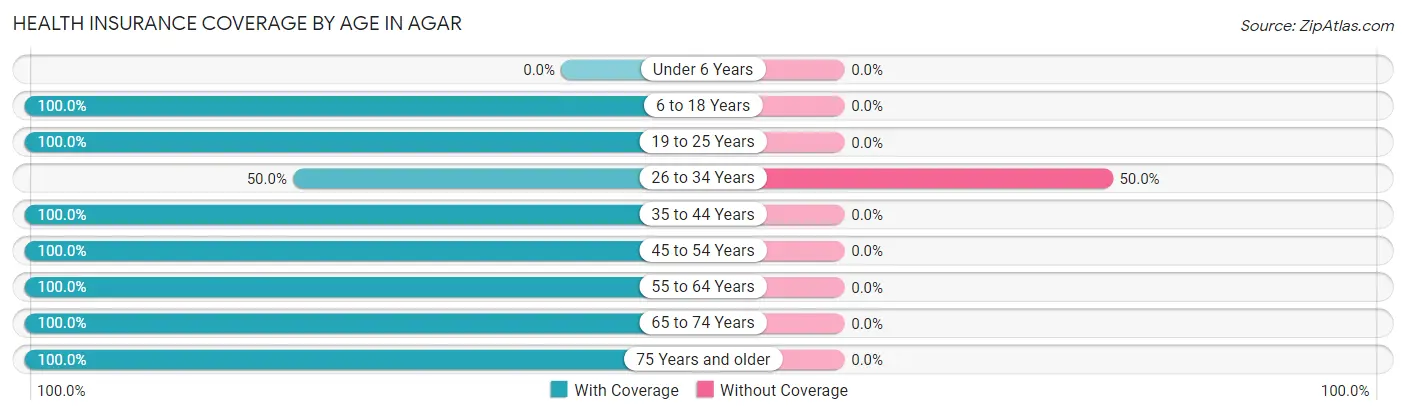
| Age Bracket | With Coverage | Without Coverage |
| Under 6 Years | 0 (0.0%) | 0 (0.0%) |
| 6 to 18 Years | 8 (100.0%) | 0 (0.0%) |
| 19 to 25 Years | 2 (100.0%) | 0 (0.0%) |
| 26 to 34 Years | 7 (50.0%) | 7 (50.0%) |
| 35 to 44 Years | 13 (100.0%) | 0 (0.0%) |
| 45 to 54 Years | 3 (100.0%) | 0 (0.0%) |
| 55 to 64 Years | 20 (100.0%) | 0 (0.0%) |
| 65 to 74 Years | 31 (100.0%) | 0 (0.0%) |
| 75 Years and older | 6 (100.0%) | 0 (0.0%) |
| Total | 90 (92.8%) | 7 (7.2%) |
Health Insurance Coverage by Citizenship Status in Agar
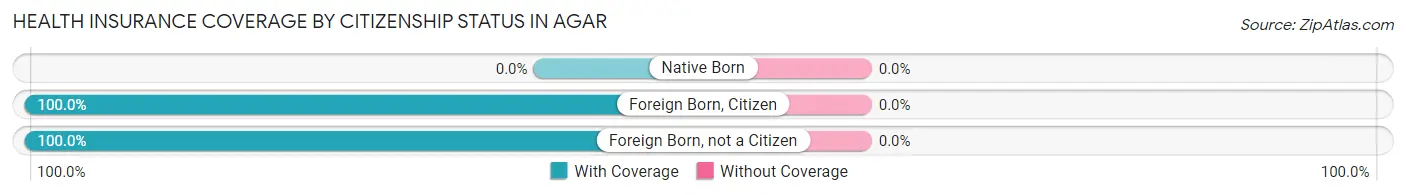
| Citizenship Status | With Coverage | Without Coverage |
| Native Born | 0 (0.0%) | 0 (0.0%) |
| Foreign Born, Citizen | 8 (100.0%) | 0 (0.0%) |
| Foreign Born, not a Citizen | 2 (100.0%) | 0 (0.0%) |
Health Insurance Coverage by Household Income in Agar
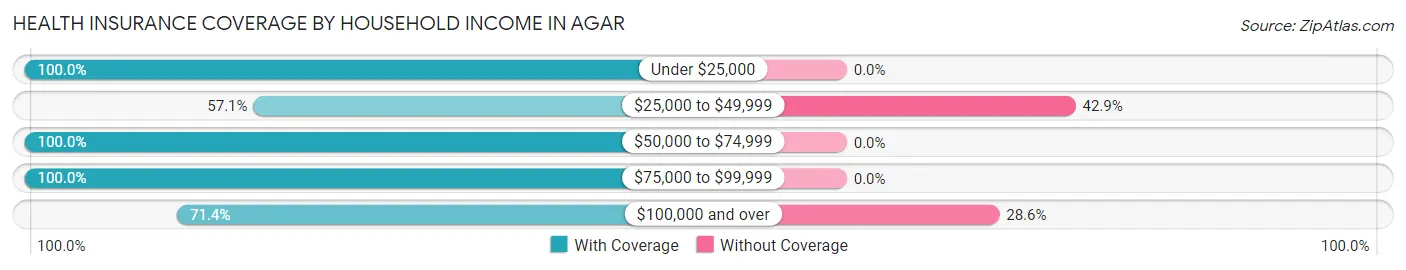
| Household Income | With Coverage | Without Coverage |
| Under $25,000 | 30 (100.0%) | 0 (0.0%) |
| $25,000 to $49,999 | 4 (57.1%) | 3 (42.9%) |
| $50,000 to $74,999 | 28 (100.0%) | 0 (0.0%) |
| $75,000 to $99,999 | 18 (100.0%) | 0 (0.0%) |
| $100,000 and over | 10 (71.4%) | 4 (28.6%) |
Public vs Private Health Insurance Coverage by Age in Agar
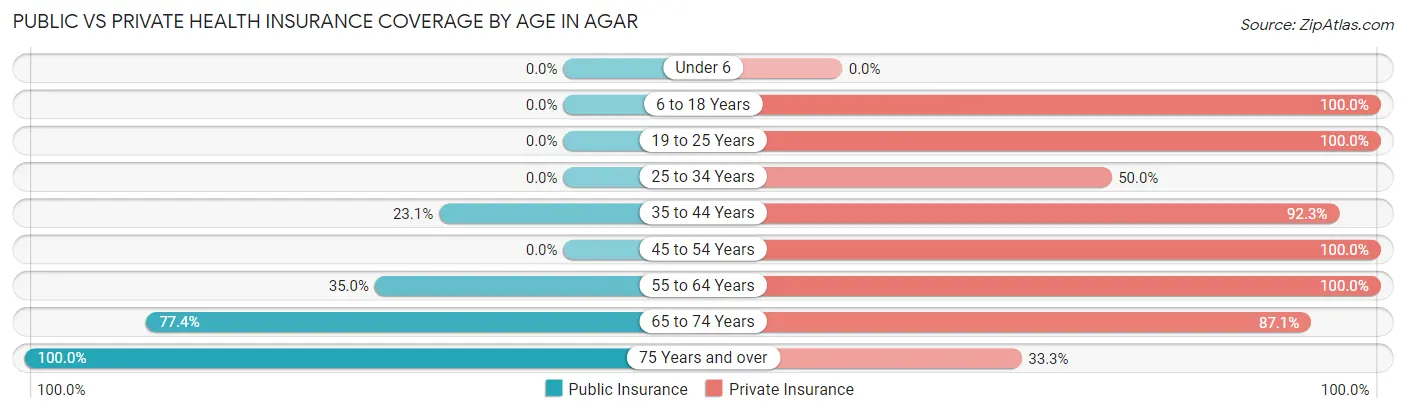
| Age Bracket | Public Insurance | Private Insurance |
| Under 6 | 0 (0.0%) | 0 (0.0%) |
| 6 to 18 Years | 0 (0.0%) | 8 (100.0%) |
| 19 to 25 Years | 0 (0.0%) | 2 (100.0%) |
| 25 to 34 Years | 0 (0.0%) | 7 (50.0%) |
| 35 to 44 Years | 3 (23.1%) | 12 (92.3%) |
| 45 to 54 Years | 0 (0.0%) | 3 (100.0%) |
| 55 to 64 Years | 7 (35.0%) | 20 (100.0%) |
| 65 to 74 Years | 24 (77.4%) | 27 (87.1%) |
| 75 Years and over | 6 (100.0%) | 2 (33.3%) |
| Total | 40 (41.2%) | 81 (83.5%) |
Disability Status by Sex by Age in Agar
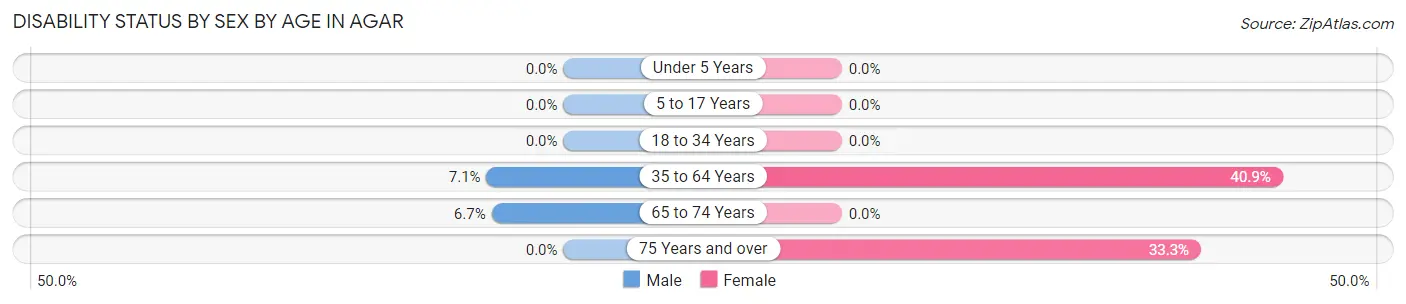
| Age Bracket | Male | Female |
| Under 5 Years | 0 (0.0%) | 0 (0.0%) |
| 5 to 17 Years | 0 (0.0%) | 0 (0.0%) |
| 18 to 34 Years | 0 (0.0%) | 0 (0.0%) |
| 35 to 64 Years | 1 (7.1%) | 9 (40.9%) |
| 65 to 74 Years | 1 (6.7%) | 0 (0.0%) |
| 75 Years and over | 0 (0.0%) | 2 (33.3%) |
Disability Class by Sex by Age in Agar
Disability Class: Hearing Difficulty
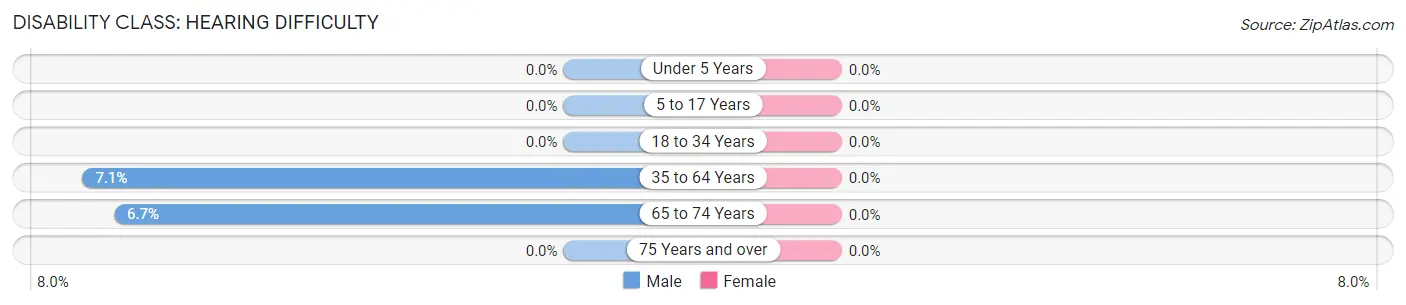
| Age Bracket | Male | Female |
| Under 5 Years | 0 (0.0%) | 0 (0.0%) |
| 5 to 17 Years | 0 (0.0%) | 0 (0.0%) |
| 18 to 34 Years | 0 (0.0%) | 0 (0.0%) |
| 35 to 64 Years | 1 (7.1%) | 0 (0.0%) |
| 65 to 74 Years | 1 (6.7%) | 0 (0.0%) |
| 75 Years and over | 0 (0.0%) | 0 (0.0%) |
Disability Class: Vision Difficulty
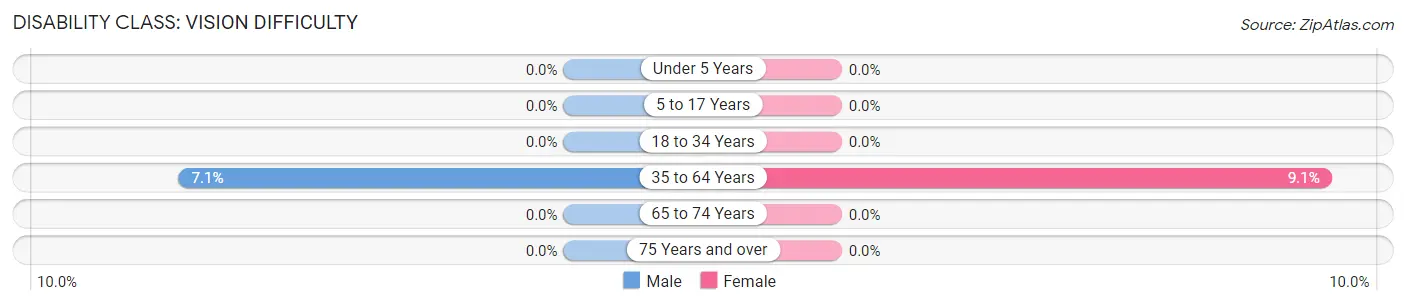
| Age Bracket | Male | Female |
| Under 5 Years | 0 (0.0%) | 0 (0.0%) |
| 5 to 17 Years | 0 (0.0%) | 0 (0.0%) |
| 18 to 34 Years | 0 (0.0%) | 0 (0.0%) |
| 35 to 64 Years | 1 (7.1%) | 2 (9.1%) |
| 65 to 74 Years | 0 (0.0%) | 0 (0.0%) |
| 75 Years and over | 0 (0.0%) | 0 (0.0%) |
Disability Class: Cognitive Difficulty
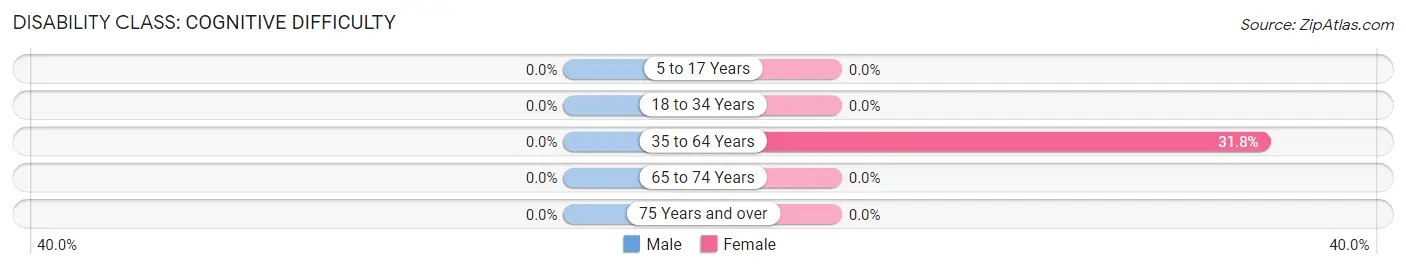
| Age Bracket | Male | Female |
| 5 to 17 Years | 0 (0.0%) | 0 (0.0%) |
| 18 to 34 Years | 0 (0.0%) | 0 (0.0%) |
| 35 to 64 Years | 0 (0.0%) | 7 (31.8%) |
| 65 to 74 Years | 0 (0.0%) | 0 (0.0%) |
| 75 Years and over | 0 (0.0%) | 0 (0.0%) |
Disability Class: Ambulatory Difficulty
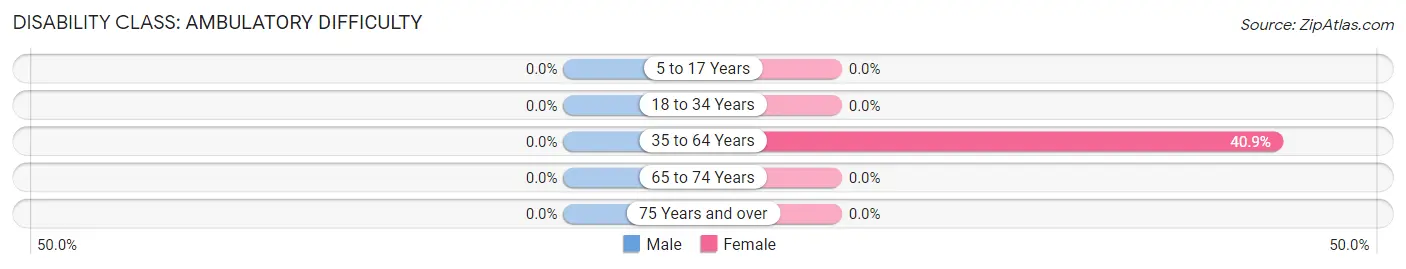
| Age Bracket | Male | Female |
| 5 to 17 Years | 0 (0.0%) | 0 (0.0%) |
| 18 to 34 Years | 0 (0.0%) | 0 (0.0%) |
| 35 to 64 Years | 0 (0.0%) | 9 (40.9%) |
| 65 to 74 Years | 0 (0.0%) | 0 (0.0%) |
| 75 Years and over | 0 (0.0%) | 0 (0.0%) |
Disability Class: Self-Care Difficulty
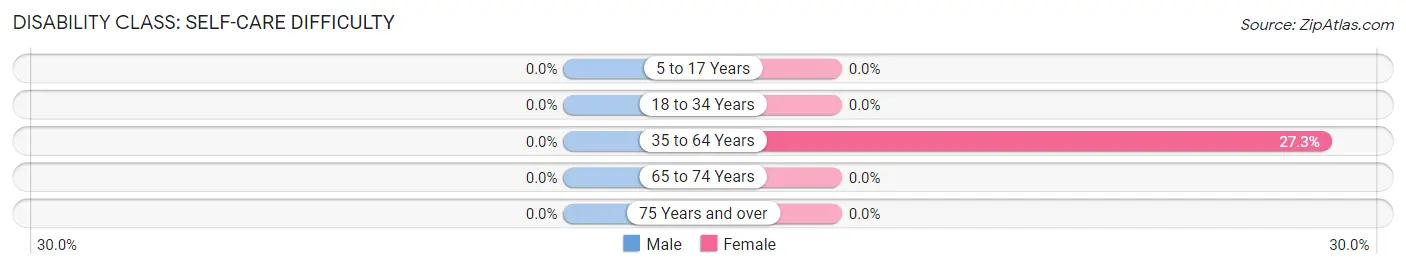
| Age Bracket | Male | Female |
| 5 to 17 Years | 0 (0.0%) | 0 (0.0%) |
| 18 to 34 Years | 0 (0.0%) | 0 (0.0%) |
| 35 to 64 Years | 0 (0.0%) | 6 (27.3%) |
| 65 to 74 Years | 0 (0.0%) | 0 (0.0%) |
| 75 Years and over | 0 (0.0%) | 0 (0.0%) |
Technology Access in Agar
Computing Device Access in Agar
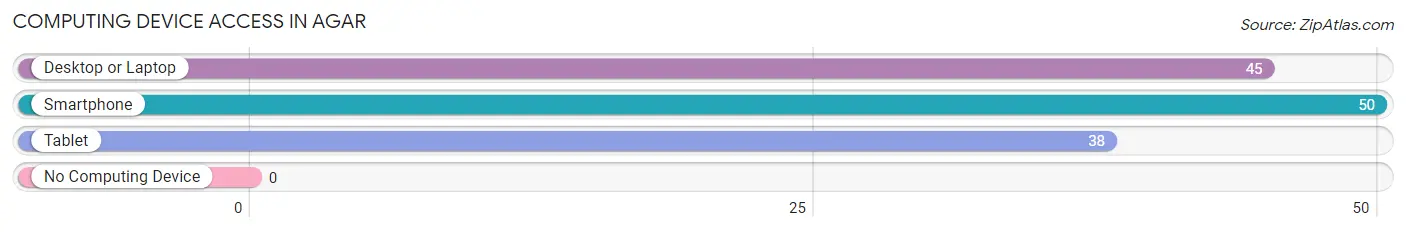
| Device Type | # Households | % Households |
| Desktop or Laptop | 45 | 73.8% |
| Smartphone | 50 | 82.0% |
| Tablet | 38 | 62.3% |
| No Computing Device | 0 | 0.0% |
| Total | 61 | 100.0% |
Internet Access in Agar
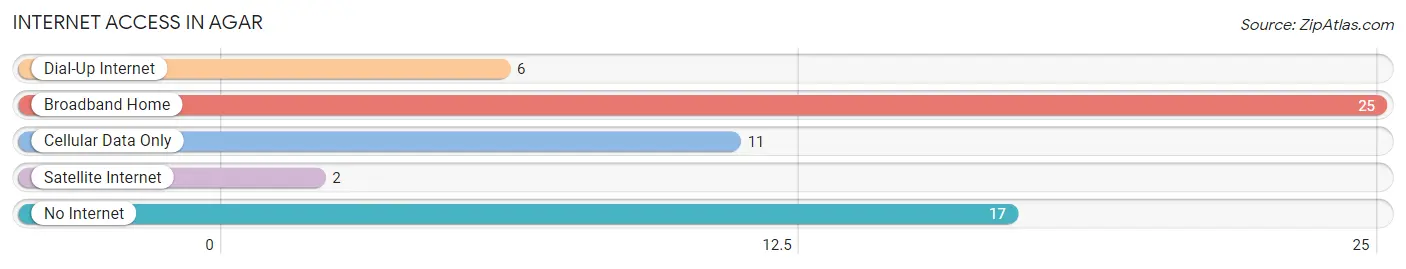
| Internet Type | # Households | % Households |
| Dial-Up Internet | 6 | 9.8% |
| Broadband Home | 25 | 41.0% |
| Cellular Data Only | 11 | 18.0% |
| Satellite Internet | 2 | 3.3% |
| No Internet | 17 | 27.9% |
| Total | 61 | 100.0% |
Agar Summary
History
Agar is a small town located in the state of South Dakota, in the United States. It is located in the southeastern corner of the state, near the border with Nebraska. The town was founded in 1883 by a group of settlers from Iowa, who were looking for a place to settle and start a new life. The town was named after the Agar family, who were among the first settlers.
The town grew slowly but steadily over the years, and by the early 1900s, it had become a thriving agricultural community. The town was home to a variety of businesses, including a bank, a hotel, a general store, and a post office. The town also had a school, which was attended by many of the local children.
In the early 1900s, the town was also home to a number of churches, including the Methodist Episcopal Church, the Congregational Church, and the Presbyterian Church. The town also had a number of fraternal organizations, such as the Masons and the Odd Fellows.
In the 1920s, the town experienced a period of growth, as the population increased and new businesses opened. The town was also home to a number of cultural events, such as the annual Agar County Fair.
In the 1950s, the town experienced a period of decline, as many of the businesses closed and the population decreased. However, in the late 1970s, the town experienced a resurgence, as new businesses opened and the population began to increase again.
Today, Agar is a small but vibrant community, with a population of around 500 people. The town is home to a variety of businesses, including a grocery store, a hardware store, a bank, and a post office. The town also has a number of churches, including the Methodist Episcopal Church, the Congregational Church, and the Presbyterian Church.
Geography
Agar is located in the southeastern corner of South Dakota, near the border with Nebraska. The town is situated in the Missouri River Valley, and is surrounded by rolling hills and prairies. The town is located about 25 miles from the nearest major city, Sioux Falls.
The town is located at an elevation of 1,845 feet above sea level, and has an average annual temperature of 50 degrees Fahrenheit. The town receives an average of 25 inches of precipitation each year, and has an average annual snowfall of around 20 inches.
Economy
Agar’s economy is largely based on agriculture. The town is home to a number of farms, which produce a variety of crops, including corn, soybeans, wheat, and hay. The town is also home to a number of businesses, including a grocery store, a hardware store, a bank, and a post office.
The town is also home to a number of manufacturing businesses, which produce a variety of products, including furniture, clothing, and automotive parts. The town is also home to a number of service businesses, such as restaurants, hotels, and auto repair shops.
Demographics
As of the 2010 census, the population of Agar was 498 people. The town has a median age of 44.7 years, and a median household income of $41,250. The town is predominantly white, with 92.2% of the population identifying as white. The town also has a small Hispanic population, with 4.2% of the population identifying as Hispanic or Latino. The town also has a small African American population, with 1.2% of the population identifying as African American.
Common Questions
What is Per Capita Income in Agar?
Per Capita income in Agar is $35,944.
What is the Median Family Income in Agar?
Median Family Income in Agar is $67,917.
What is the Median Household income in Agar?
Median Household Income in Agar is $43,750.
What is Income or Wage Gap in Agar?
Income or Wage Gap in Agar is 18.9%.
Women in Agar earn 81.1 cents for every dollar earned by a man.
What is Inequality or Gini Index in Agar?
Inequality or Gini Index in Agar is 0.54.
What is the Total Population of Agar?
Total Population of Agar is 97.
What is the Total Male Population of Agar?
Total Male Population of Agar is 53.
What is the Total Female Population of Agar?
Total Female Population of Agar is 44.
What is the Ratio of Males per 100 Females in Agar?
There are 120.45 Males per 100 Females in Agar.
What is the Ratio of Females per 100 Males in Agar?
There are 83.02 Females per 100 Males in Agar.
What is the Median Population Age in Agar?
Median Population Age in Agar is 58.8 Years.
What is the Average Family Size in Agar
Average Family Size in Agar is 2.4 People.
What is the Average Household Size in Agar
Average Household Size in Agar is 1.6 People.
How Large is the Labor Force in Agar?
There are 52 People in the Labor Forcein in Agar.
What is the Percentage of People in the Labor Force in Agar?
58.4% of People are in the Labor Force in Agar.