Cedar Grove, NM Map & Demographics
Cedar Grove Map
Cedar Grove Overview
$50,569
PER CAPITA INCOME
$95,156
AVG FAMILY INCOME
$61,020
AVG HOUSEHOLD INCOME
2.0%
WAGE / INCOME GAP [ % ]
98.0¢/ $1
WAGE / INCOME GAP [ $ ]
0.49
INEQUALITY / GINI INDEX
886
TOTAL POPULATION
335
MALE POPULATION
551
FEMALE POPULATION
60.80
MALES / 100 FEMALES
164.48
FEMALES / 100 MALES
67.5
MEDIAN AGE
2.2
AVG FAMILY SIZE
1.6
AVG HOUSEHOLD SIZE
300
LABOR FORCE [ PEOPLE ]
34.6%
PERCENT IN LABOR FORCE
12.3%
UNEMPLOYMENT RATE
Income in Cedar Grove
Income Overview in Cedar Grove
Per Capita Income in Cedar Grove is $50,569, while median incomes of families and households are $95,156 and $61,020 respectively.
| Characteristic | Number | Measure |
| Per Capita Income | 886 | $50,569 |
| Median Family Income | 271 | $95,156 |
| Mean Family Income | 271 | $114,884 |
| Median Household Income | 564 | $61,020 |
| Mean Household Income | 564 | $81,039 |
| Income Deficit | 271 | $0 |
| Wage / Income Gap (%) | 886 | 2.05% |
| Wage / Income Gap ($) | 886 | 97.95¢ per $1 |
| Gini / Inequality Index | 886 | 0.49 |
Earnings by Sex in Cedar Grove
Average Earnings in Cedar Grove are $77,844, $76,250 for men and $77,844 for women, a difference of 2.1%.
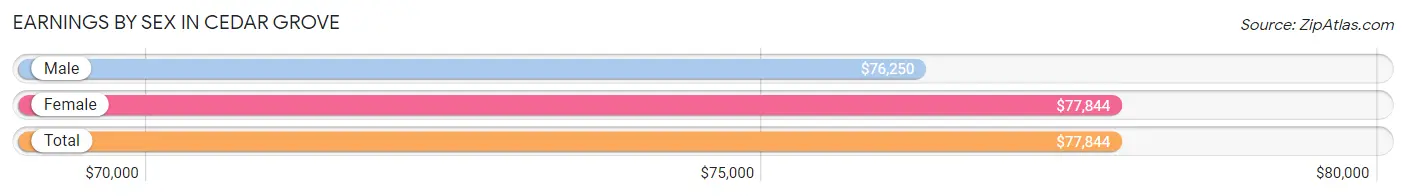
| Sex | Number | Average Earnings |
| Male | 102 (32.8%) | $76,250 |
| Female | 209 (67.2%) | $77,844 |
| Total | 311 (100.0%) | $77,844 |
Earnings by Sex by Income Bracket in Cedar Grove
The most common earnings brackets in Cedar Grove are $75,000 to $99,999 for men (32 | 31.4%) and $75,000 to $99,999 for women (71 | 34.0%).
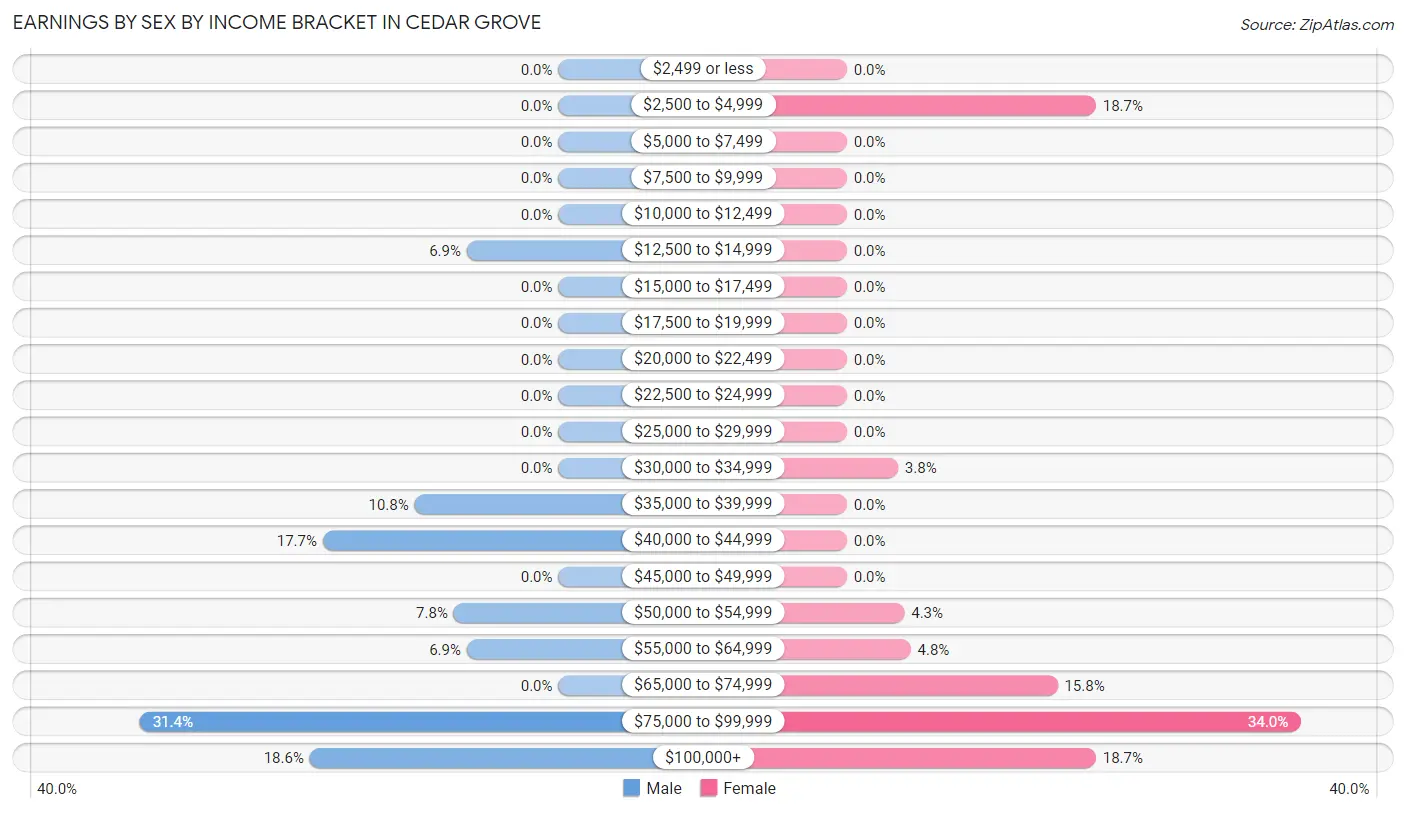
| Income | Male | Female |
| $2,499 or less | 0 (0.0%) | 0 (0.0%) |
| $2,500 to $4,999 | 0 (0.0%) | 39 (18.7%) |
| $5,000 to $7,499 | 0 (0.0%) | 0 (0.0%) |
| $7,500 to $9,999 | 0 (0.0%) | 0 (0.0%) |
| $10,000 to $12,499 | 0 (0.0%) | 0 (0.0%) |
| $12,500 to $14,999 | 7 (6.9%) | 0 (0.0%) |
| $15,000 to $17,499 | 0 (0.0%) | 0 (0.0%) |
| $17,500 to $19,999 | 0 (0.0%) | 0 (0.0%) |
| $20,000 to $22,499 | 0 (0.0%) | 0 (0.0%) |
| $22,500 to $24,999 | 0 (0.0%) | 0 (0.0%) |
| $25,000 to $29,999 | 0 (0.0%) | 0 (0.0%) |
| $30,000 to $34,999 | 0 (0.0%) | 8 (3.8%) |
| $35,000 to $39,999 | 11 (10.8%) | 0 (0.0%) |
| $40,000 to $44,999 | 18 (17.6%) | 0 (0.0%) |
| $45,000 to $49,999 | 0 (0.0%) | 0 (0.0%) |
| $50,000 to $54,999 | 8 (7.8%) | 9 (4.3%) |
| $55,000 to $64,999 | 7 (6.9%) | 10 (4.8%) |
| $65,000 to $74,999 | 0 (0.0%) | 33 (15.8%) |
| $75,000 to $99,999 | 32 (31.4%) | 71 (34.0%) |
| $100,000+ | 19 (18.6%) | 39 (18.7%) |
| Total | 102 (100.0%) | 209 (100.0%) |
Earnings by Sex by Educational Attainment in Cedar Grove
Average earnings in Cedar Grove are $90,795 for men and $78,719 for women, a difference of 13.3%. Men with an educational attainment of graduate degree enjoy the highest average annual earnings of $91,023, while those with graduate degree education earn the least with $91,023. Women with an educational attainment of bachelor's degree earn the most with the average annual earnings of $78,813, while those with college or associate's degree education have the smallest earnings of $67,992.
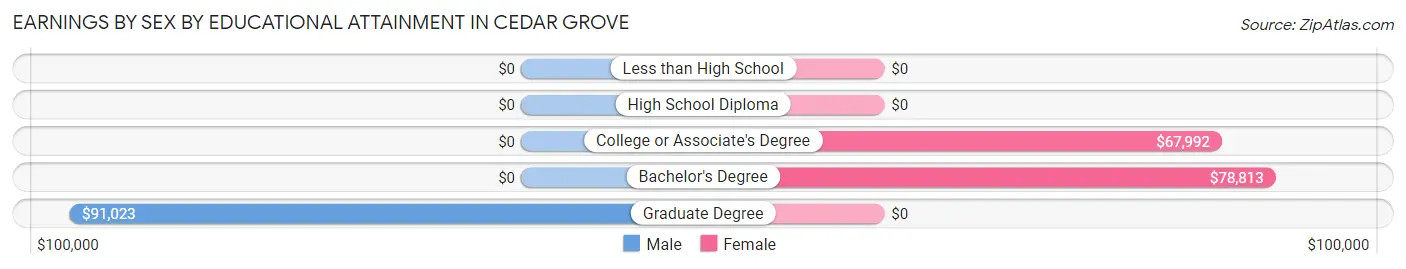
| Educational Attainment | Male Income | Female Income |
| Less than High School | - | - |
| High School Diploma | - | - |
| College or Associate's Degree | - | - |
| Bachelor's Degree | - | - |
| Graduate Degree | $91,023 | $0 |
| Total | $90,795 | $78,719 |
Family Income in Cedar Grove
Family Income Brackets in Cedar Grove
According to the Cedar Grove family income data, there are 118 families falling into the $50,000 to $74,999 income range, which is the most common income bracket and makes up 43.5% of all families.
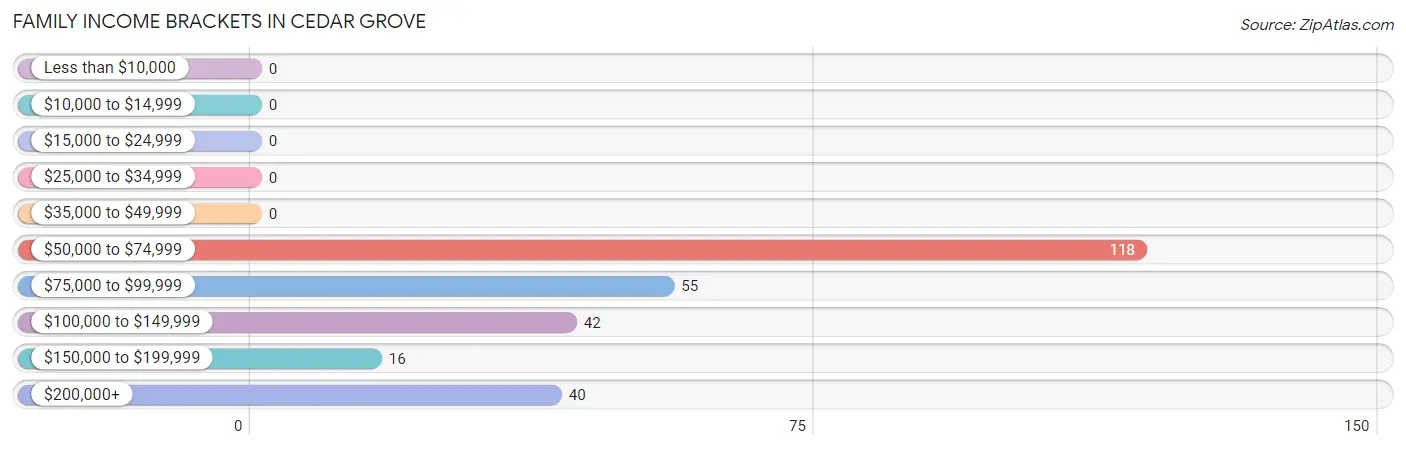
| Income Bracket | # Families | % Families |
| Less than $10,000 | 0 | 0.0% |
| $10,000 to $14,999 | 0 | 0.0% |
| $15,000 to $24,999 | 0 | 0.0% |
| $25,000 to $34,999 | 0 | 0.0% |
| $35,000 to $49,999 | 0 | 0.0% |
| $50,000 to $74,999 | 118 | 43.5% |
| $75,000 to $99,999 | 55 | 20.3% |
| $100,000 to $149,999 | 42 | 15.5% |
| $150,000 to $199,999 | 16 | 5.9% |
| $200,000+ | 40 | 14.8% |
Family Income by Famaliy Size in Cedar Grove
| Income Bracket | # Families | Median Income |
| 2-Person Families | 215 (79.3%) | $0 |
| 3-Person Families | 7 (2.6%) | $0 |
| 4-Person Families | 44 (16.2%) | $0 |
| 5-Person Families | 5 (1.8%) | $0 |
| 6-Person Families | 0 (0.0%) | $0 |
| 7+ Person Families | 0 (0.0%) | $0 |
| Total | 271 (100.0%) | $95,156 |
Family Income by Number of Earners in Cedar Grove
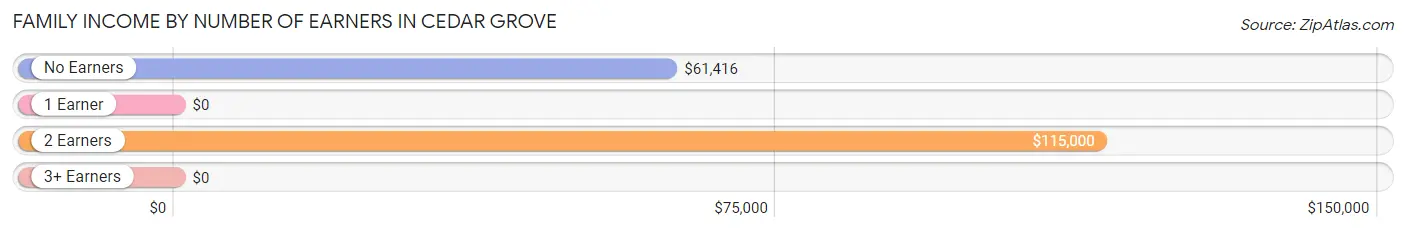
| Number of Earners | # Families | Median Income |
| No Earners | 133 (49.1%) | $61,416 |
| 1 Earner | 14 (5.2%) | $0 |
| 2 Earners | 124 (45.8%) | $115,000 |
| 3+ Earners | 0 (0.0%) | $0 |
| Total | 271 (100.0%) | $95,156 |
Household Income in Cedar Grove
Household Income Brackets in Cedar Grove
With 158 households falling in the category, the $10,000 to $14,999 income range is the most frequent in Cedar Grove, accounting for 28.0% of all households.
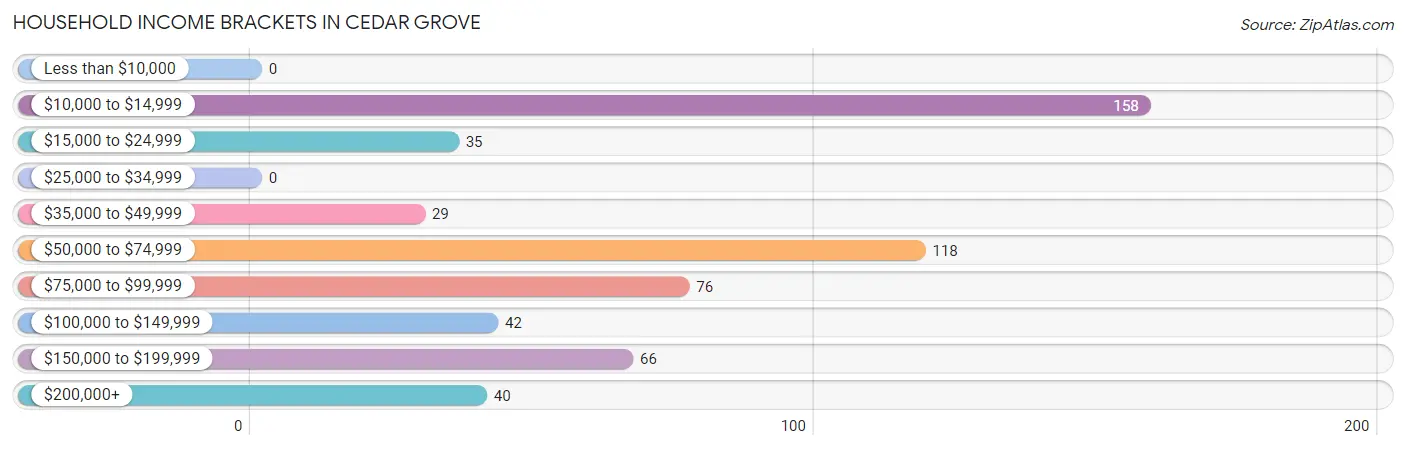
| Income Bracket | # Households | % Households |
| Less than $10,000 | 0 | 0.0% |
| $10,000 to $14,999 | 158 | 28.0% |
| $15,000 to $24,999 | 35 | 6.2% |
| $25,000 to $34,999 | 0 | 0.0% |
| $35,000 to $49,999 | 29 | 5.1% |
| $50,000 to $74,999 | 118 | 20.9% |
| $75,000 to $99,999 | 76 | 13.5% |
| $100,000 to $149,999 | 42 | 7.4% |
| $150,000 to $199,999 | 66 | 11.7% |
| $200,000+ | 40 | 7.1% |
Household Income by Householder Age in Cedar Grove
The median household income in Cedar Grove is $61,020, with the highest median household income of $126,591 found in the 45 to 64 years age bracket for the primary householder. A total of 120 households (21.3%) fall into this category. Meanwhile, the 15 to 24 years age bracket for the primary householder has the lowest median household income of $0, with 7 households (1.2%) in this group.
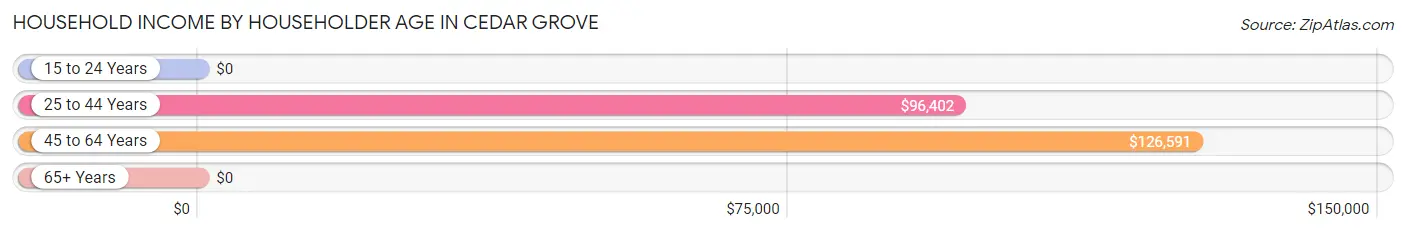
| Income Bracket | # Households | Median Income |
| 15 to 24 Years | 7 (1.2%) | $0 |
| 25 to 44 Years | 71 (12.6%) | $96,402 |
| 45 to 64 Years | 120 (21.3%) | $126,591 |
| 65+ Years | 366 (64.9%) | $0 |
| Total | 564 (100.0%) | $61,020 |
Poverty in Cedar Grove
Income Below Poverty by Sex and Age in Cedar Grove
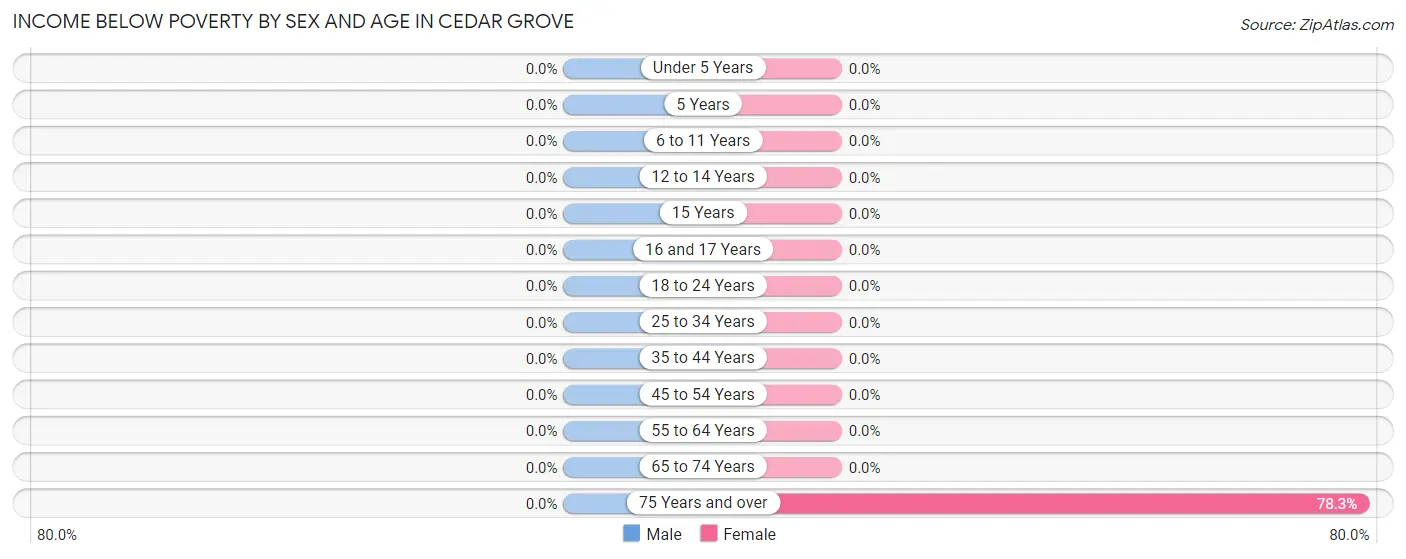
| Age Bracket | Male | Female |
| Under 5 Years | 0 (0.0%) | 0 (0.0%) |
| 5 Years | 0 (0.0%) | 0 (0.0%) |
| 6 to 11 Years | 0 (0.0%) | 0 (0.0%) |
| 12 to 14 Years | 0 (0.0%) | 0 (0.0%) |
| 15 Years | 0 (0.0%) | 0 (0.0%) |
| 16 and 17 Years | 0 (0.0%) | 0 (0.0%) |
| 18 to 24 Years | 0 (0.0%) | 0 (0.0%) |
| 25 to 34 Years | 0 (0.0%) | 0 (0.0%) |
| 35 to 44 Years | 0 (0.0%) | 0 (0.0%) |
| 45 to 54 Years | 0 (0.0%) | 0 (0.0%) |
| 55 to 64 Years | 0 (0.0%) | 0 (0.0%) |
| 65 to 74 Years | 0 (0.0%) | 0 (0.0%) |
| 75 Years and over | 0 (0.0%) | 101 (78.3%) |
| Total | 0 (0.0%) | 101 (18.3%) |
Income Above Poverty by Sex and Age in Cedar Grove
According to the poverty statistics in Cedar Grove, males aged 6 to 11 years and females aged under 5 years are the age groups that are most secure financially, with 100.0% of males and 100.0% of females in these age groups living above the poverty line.
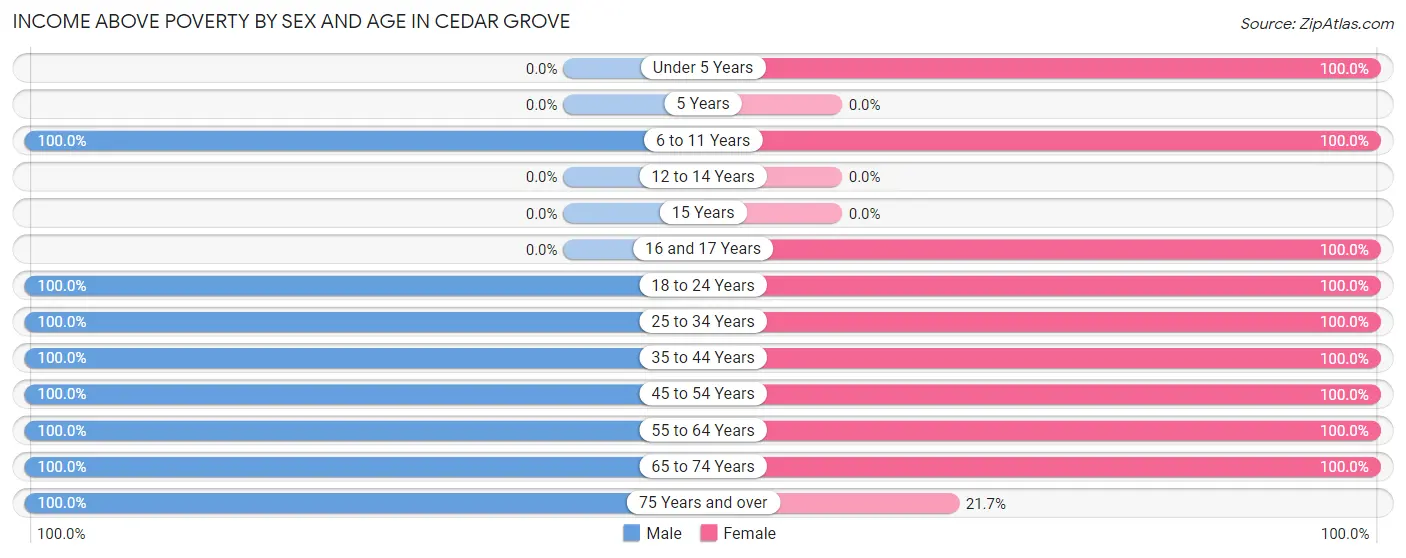
| Age Bracket | Male | Female |
| Under 5 Years | 0 (0.0%) | 4 (100.0%) |
| 5 Years | 0 (0.0%) | 0 (0.0%) |
| 6 to 11 Years | 7 (100.0%) | 7 (100.0%) |
| 12 to 14 Years | 0 (0.0%) | 0 (0.0%) |
| 15 Years | 0 (0.0%) | 0 (0.0%) |
| 16 and 17 Years | 0 (0.0%) | 7 (100.0%) |
| 18 to 24 Years | 7 (100.0%) | 28 (100.0%) |
| 25 to 34 Years | 8 (100.0%) | 9 (100.0%) |
| 35 to 44 Years | 18 (100.0%) | 66 (100.0%) |
| 45 to 54 Years | 19 (100.0%) | 69 (100.0%) |
| 55 to 64 Years | 60 (100.0%) | 55 (100.0%) |
| 65 to 74 Years | 119 (100.0%) | 177 (100.0%) |
| 75 Years and over | 97 (100.0%) | 28 (21.7%) |
| Total | 335 (100.0%) | 450 (81.7%) |
Income Below Poverty Among Married-Couple Families in Cedar Grove
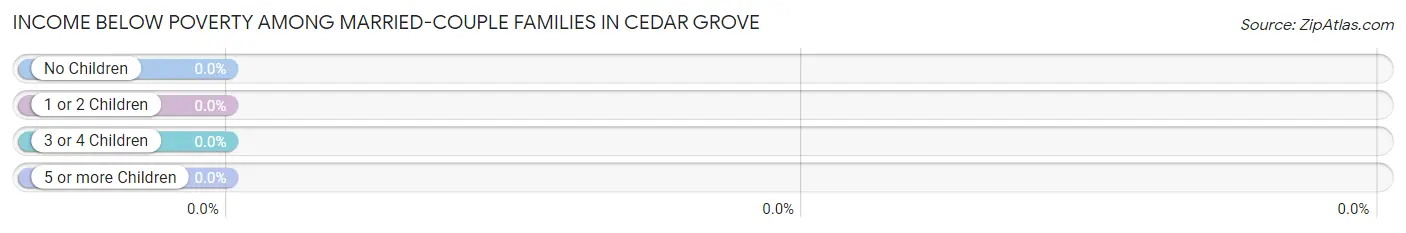
| Children | Above Poverty | Below Poverty |
| No Children | 250 (100.0%) | 0 (0.0%) |
| 1 or 2 Children | 7 (100.0%) | 0 (0.0%) |
| 3 or 4 Children | 5 (100.0%) | 0 (0.0%) |
| 5 or more Children | 0 (0.0%) | 0 (0.0%) |
| Total | 262 (100.0%) | 0 (0.0%) |
Income Below Poverty Among Single-Parent Households in Cedar Grove
| Children | Single Father | Single Mother |
| No Children | 0 (0.0%) | 0 (0.0%) |
| 1 or 2 Children | 0 (0.0%) | 0 (0.0%) |
| 3 or 4 Children | 0 (0.0%) | 0 (0.0%) |
| 5 or more Children | 0 (0.0%) | 0 (0.0%) |
| Total | 0 (0.0%) | 0 (0.0%) |
Income Below Poverty Among Married-Couple vs Single-Parent Households in Cedar Grove
| Children | Married-Couple Families | Single-Parent Households |
| No Children | 0 (0.0%) | 0 (0.0%) |
| 1 or 2 Children | 0 (0.0%) | 0 (0.0%) |
| 3 or 4 Children | 0 (0.0%) | 0 (0.0%) |
| 5 or more Children | 0 (0.0%) | 0 (0.0%) |
| Total | 0 (0.0%) | 0 (0.0%) |
Race in Cedar Grove
The most populous races in Cedar Grove are White / Caucasian (728 | 82.2%), Hispanic or Latino (235 | 26.5%), and Two or more Races (158 | 17.8%).
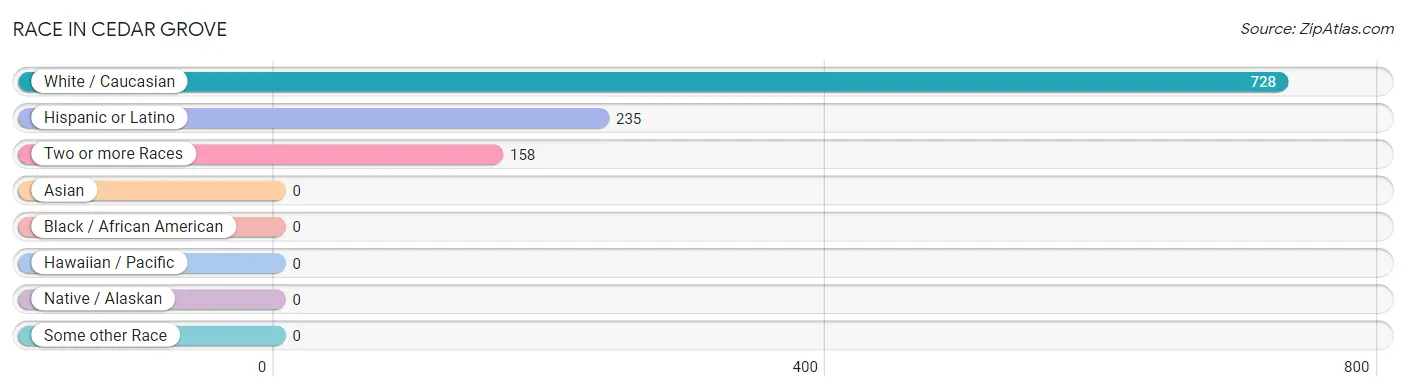
| Race | # Population | % Population |
| Asian | 0 | 0.0% |
| Black / African American | 0 | 0.0% |
| Hawaiian / Pacific | 0 | 0.0% |
| Hispanic or Latino | 235 | 26.5% |
| Native / Alaskan | 0 | 0.0% |
| White / Caucasian | 728 | 82.2% |
| Two or more Races | 158 | 17.8% |
| Some other Race | 0 | 0.0% |
| Total | 886 | 100.0% |
Ancestry in Cedar Grove
The most populous ancestries reported in Cedar Grove are German (268 | 30.2%), Irish (208 | 23.5%), Spanish (158 | 17.8%), English (130 | 14.7%), and Spaniard (40 | 4.5%), together accounting for 90.7% of all Cedar Grove residents.
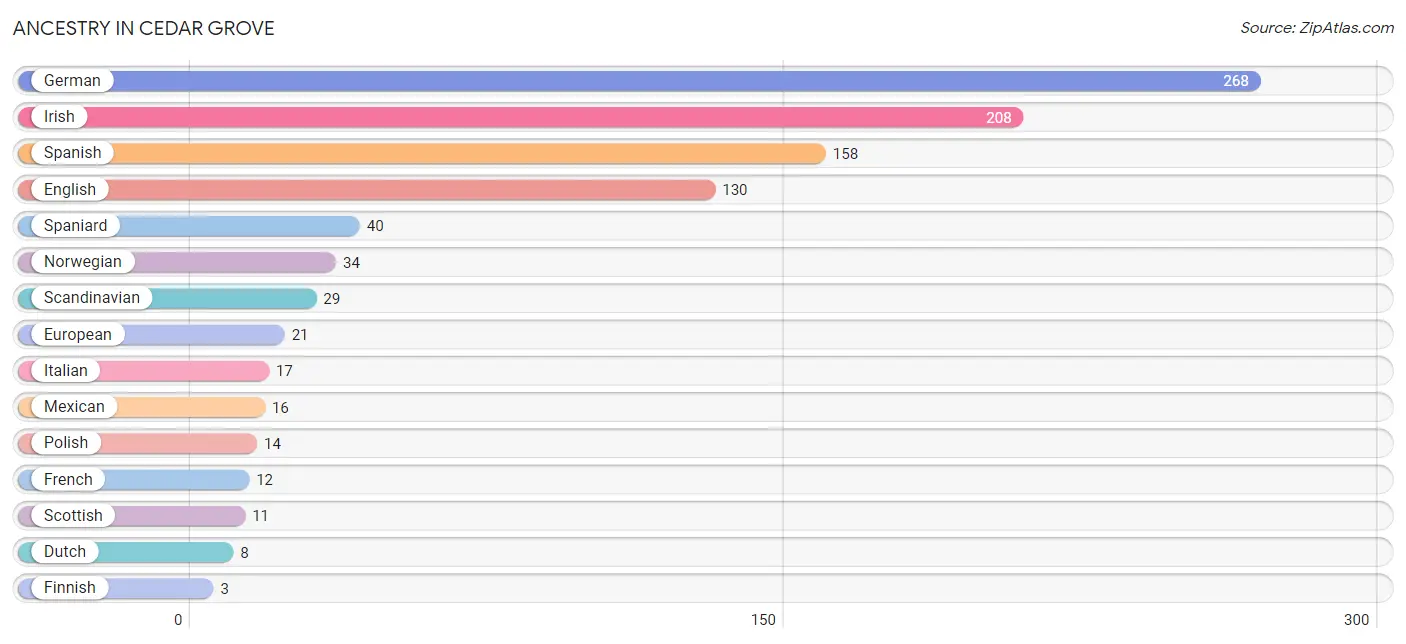
| Ancestry | # Population | % Population |
| British | 2 | 0.2% |
| Dutch | 8 | 0.9% |
| English | 130 | 14.7% |
| European | 21 | 2.4% |
| Finnish | 3 | 0.3% |
| French | 12 | 1.3% |
| German | 268 | 30.2% |
| Irish | 208 | 23.5% |
| Italian | 17 | 1.9% |
| Mexican | 16 | 1.8% |
| Norwegian | 34 | 3.8% |
| Polish | 14 | 1.6% |
| Scandinavian | 29 | 3.3% |
| Scottish | 11 | 1.2% |
| Spaniard | 40 | 4.5% |
| Spanish | 158 | 17.8% | View All 16 Rows |
Immigrants in Cedar Grove

| Immigration Origin | # Population | % Population | View All 0 Rows |
Sex and Age in Cedar Grove
Sex and Age in Cedar Grove
The most populous age groups in Cedar Grove are 65 to 69 Years (105 | 31.3%) for men and 65 to 69 Years (165 | 29.9%) for women.
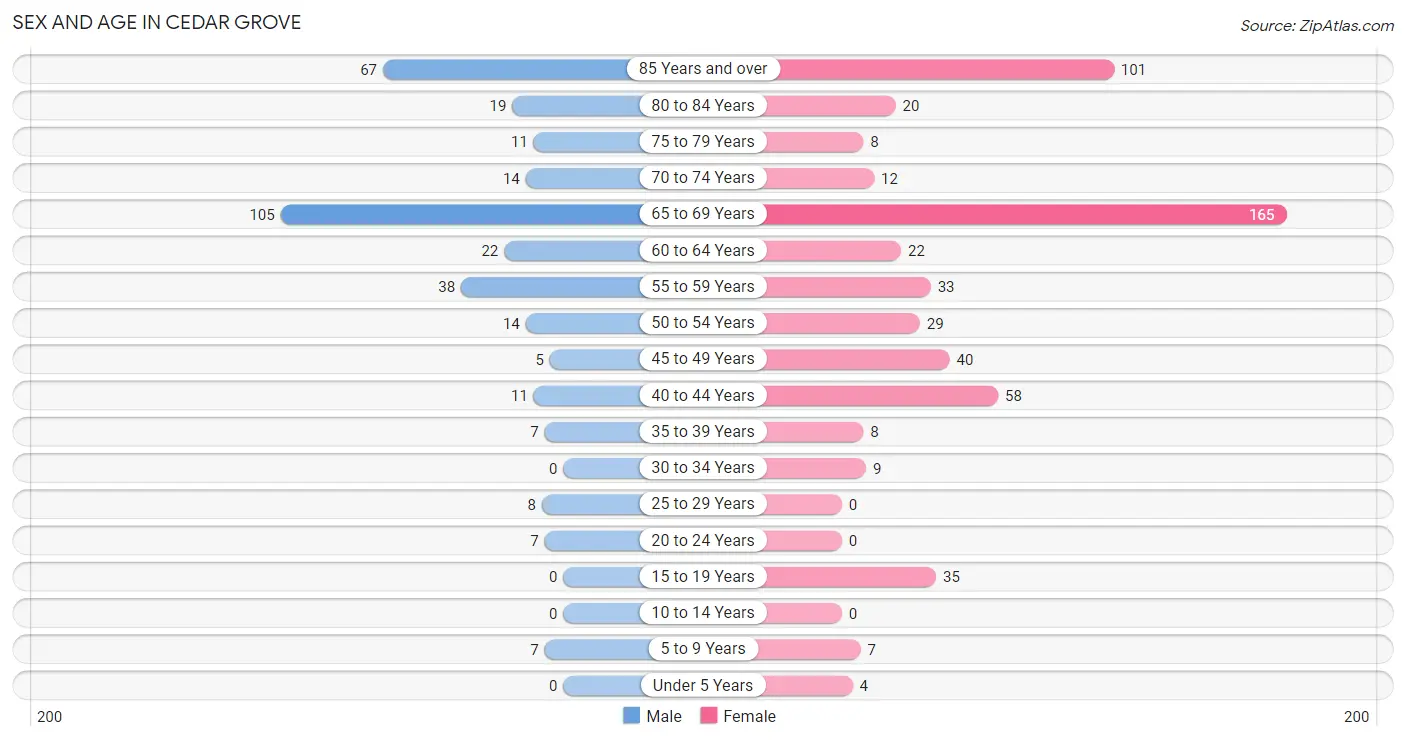
| Age Bracket | Male | Female |
| Under 5 Years | 0 (0.0%) | 4 (0.7%) |
| 5 to 9 Years | 7 (2.1%) | 7 (1.3%) |
| 10 to 14 Years | 0 (0.0%) | 0 (0.0%) |
| 15 to 19 Years | 0 (0.0%) | 35 (6.4%) |
| 20 to 24 Years | 7 (2.1%) | 0 (0.0%) |
| 25 to 29 Years | 8 (2.4%) | 0 (0.0%) |
| 30 to 34 Years | 0 (0.0%) | 9 (1.6%) |
| 35 to 39 Years | 7 (2.1%) | 8 (1.5%) |
| 40 to 44 Years | 11 (3.3%) | 58 (10.5%) |
| 45 to 49 Years | 5 (1.5%) | 40 (7.3%) |
| 50 to 54 Years | 14 (4.2%) | 29 (5.3%) |
| 55 to 59 Years | 38 (11.3%) | 33 (6.0%) |
| 60 to 64 Years | 22 (6.6%) | 22 (4.0%) |
| 65 to 69 Years | 105 (31.3%) | 165 (29.9%) |
| 70 to 74 Years | 14 (4.2%) | 12 (2.2%) |
| 75 to 79 Years | 11 (3.3%) | 8 (1.5%) |
| 80 to 84 Years | 19 (5.7%) | 20 (3.6%) |
| 85 Years and over | 67 (20.0%) | 101 (18.3%) |
| Total | 335 (100.0%) | 551 (100.0%) |
Families and Households in Cedar Grove
Median Family Size in Cedar Grove
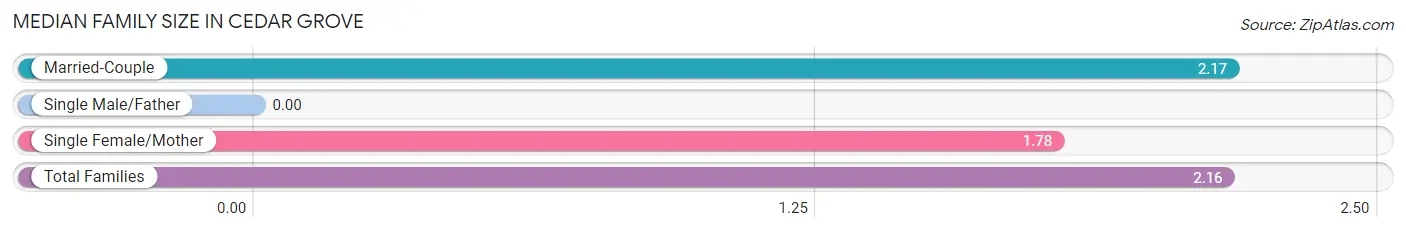
| Family Type | # Families | Family Size |
| Married-Couple | 262 (96.7%) | 2.17 |
| Single Male/Father | 0 (0.0%) | - |
| Single Female/Mother | 9 (3.3%) | 1.78 |
| Total Families | 271 (100.0%) | 2.16 |
Median Household Size in Cedar Grove
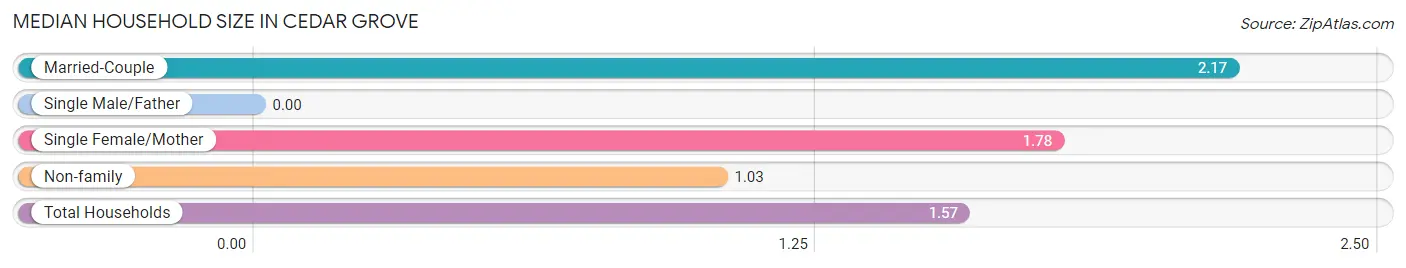
| Household Type | # Households | Household Size |
| Married-Couple | 262 (46.5%) | 2.17 |
| Single Male/Father | 0 (0.0%) | - |
| Single Female/Mother | 9 (1.6%) | 1.78 |
| Non-family | 293 (51.9%) | 1.03 |
| Total Households | 564 (100.0%) | 1.57 |
Household Size by Marriage Status in Cedar Grove
Out of a total of 564 households in Cedar Grove, 271 (48.0%) are family households, while 293 (51.9%) are nonfamily households. The most numerous type of family households are 2-person households, comprising 215, and the most common type of nonfamily households are 1-person households, comprising 286.
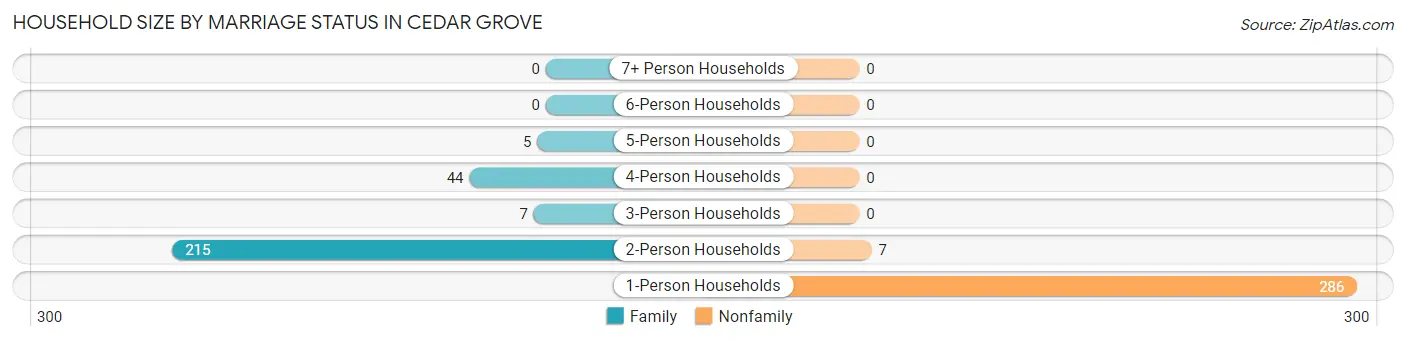
| Household Size | Family Households | Nonfamily Households |
| 1-Person Households | - | 286 (50.7%) |
| 2-Person Households | 215 (38.1%) | 7 (1.2%) |
| 3-Person Households | 7 (1.2%) | 0 (0.0%) |
| 4-Person Households | 44 (7.8%) | 0 (0.0%) |
| 5-Person Households | 5 (0.9%) | 0 (0.0%) |
| 6-Person Households | 0 (0.0%) | 0 (0.0%) |
| 7+ Person Households | 0 (0.0%) | 0 (0.0%) |
| Total | 271 (48.0%) | 293 (51.9%) |
Female Fertility in Cedar Grove
Fertility by Age in Cedar Grove
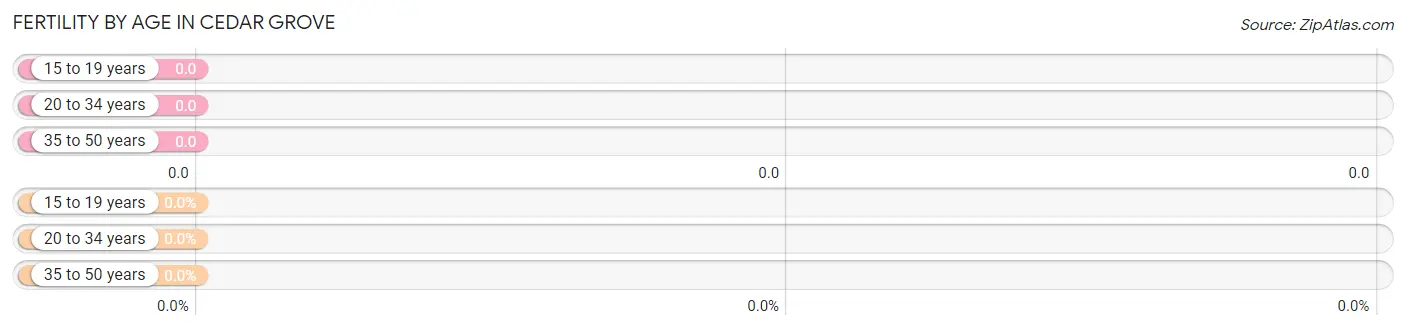
| Age Bracket | Women with Births | Births / 1,000 Women |
| 15 to 19 years | 0 (0.0%) | 0.0 |
| 20 to 34 years | 0 (0.0%) | 0.0 |
| 35 to 50 years | 0 (0.0%) | 0.0 |
| Total | 0 (0.0%) | 0.0 |
Fertility by Age by Marriage Status in Cedar Grove

| Age Bracket | Married | Unmarried |
| 15 to 19 years | 0 (0.0%) | 0 (0.0%) |
| 20 to 34 years | 0 (0.0%) | 0 (0.0%) |
| 35 to 50 years | 0 (0.0%) | 0 (0.0%) |
| Total | 0 (0.0%) | 0 (0.0%) |
Fertility by Education in Cedar Grove
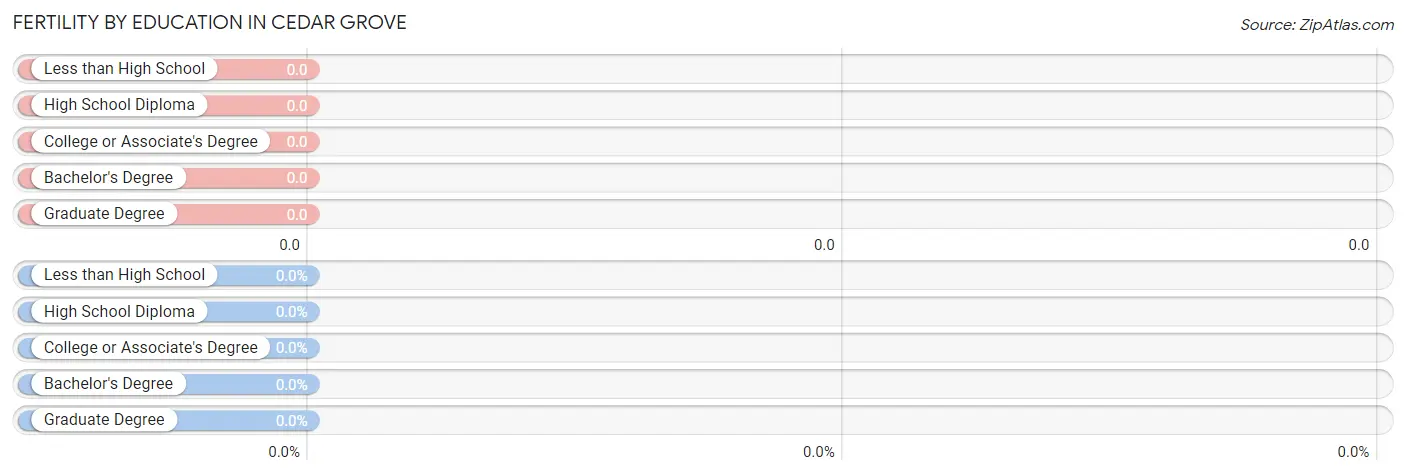
| Educational Attainment | Women with Births | Births / 1,000 Women |
| Less than High School | 0 (0.0%) | 0.0 |
| High School Diploma | 0 (0.0%) | 0.0 |
| College or Associate's Degree | 0 (0.0%) | 0.0 |
| Bachelor's Degree | 0 (0.0%) | 0.0 |
| Graduate Degree | 0 (0.0%) | 0.0 |
| Total | 0 (0.0%) | 0.0 |
Fertility by Education by Marriage Status in Cedar Grove
| Educational Attainment | Married | Unmarried |
| Less than High School | 0 (0.0%) | 0 (0.0%) |
| High School Diploma | 0 (0.0%) | 0 (0.0%) |
| College or Associate's Degree | 0 (0.0%) | 0 (0.0%) |
| Bachelor's Degree | 0 (0.0%) | 0 (0.0%) |
| Graduate Degree | 0 (0.0%) | 0 (0.0%) |
| Total | 0 (0.0%) | 0 (0.0%) |
Employment Characteristics in Cedar Grove
Employment by Class of Employer in Cedar Grove
Among the 263 employed individuals in Cedar Grove, private company employees (156 | 59.3%), federal government employees (43 | 16.4%), and state government employees (32 | 12.2%) make up the most common classes of employment.
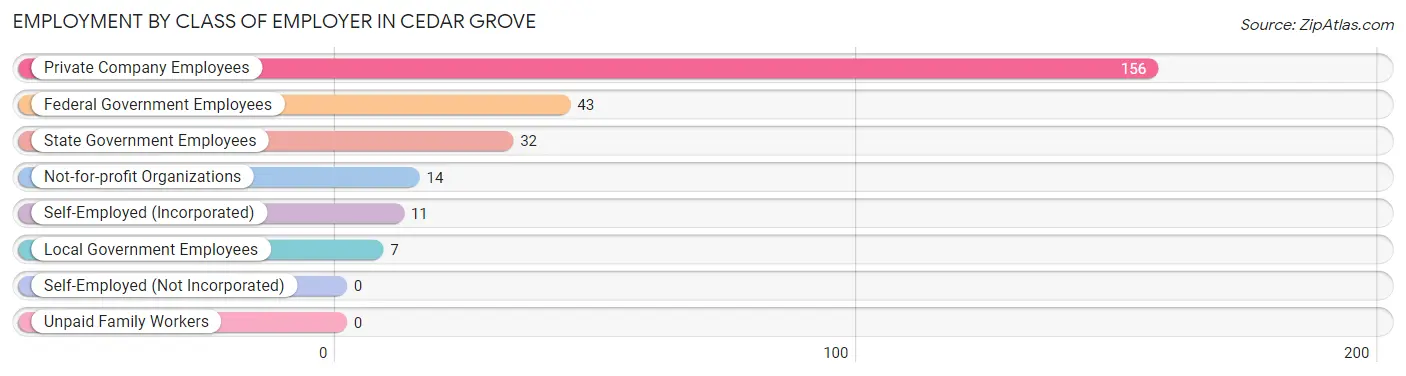
| Employer Class | # Employees | % Employees |
| Private Company Employees | 156 | 59.3% |
| Self-Employed (Incorporated) | 11 | 4.2% |
| Self-Employed (Not Incorporated) | 0 | 0.0% |
| Not-for-profit Organizations | 14 | 5.3% |
| Local Government Employees | 7 | 2.7% |
| State Government Employees | 32 | 12.2% |
| Federal Government Employees | 43 | 16.4% |
| Unpaid Family Workers | 0 | 0.0% |
| Total | 263 | 100.0% |
Employment Status by Age in Cedar Grove
According to the labor force statistics for Cedar Grove, out of the total population over 16 years of age (868), 34.6% or 300 individuals are in the labor force, with 12.3% or 37 of them unemployed. The age group with the highest labor force participation rate is 20 to 24 years, with 100.0% or 7 individuals in the labor force. Within the labor force, the 45 to 54 years age range has the highest percentage of unemployed individuals, with 33.0% or 29 of them being unemployed.
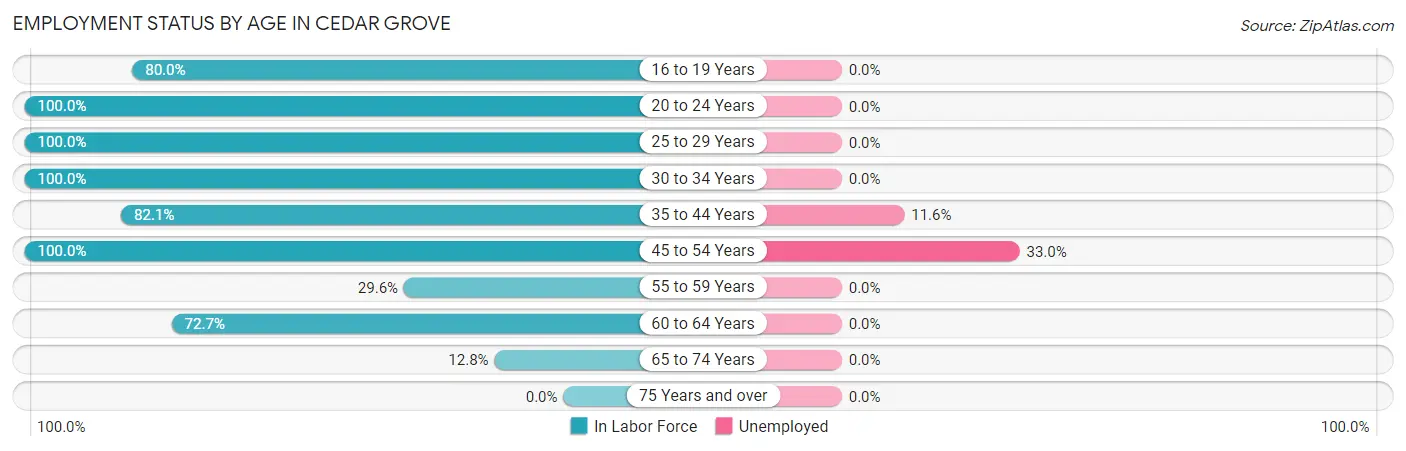
| Age Bracket | In Labor Force | Unemployed |
| 16 to 19 Years | 28 (80.0%) | 0 (0.0%) |
| 20 to 24 Years | 7 (100.0%) | 0 (0.0%) |
| 25 to 29 Years | 8 (100.0%) | 0 (0.0%) |
| 30 to 34 Years | 9 (100.0%) | 0 (0.0%) |
| 35 to 44 Years | 69 (82.1%) | 8 (11.6%) |
| 45 to 54 Years | 88 (100.0%) | 29 (33.0%) |
| 55 to 59 Years | 21 (29.6%) | 0 (0.0%) |
| 60 to 64 Years | 32 (72.7%) | 0 (0.0%) |
| 65 to 74 Years | 38 (12.8%) | 0 (0.0%) |
| 75 Years and over | 0 (0.0%) | 0 (0.0%) |
| Total | 300 (34.6%) | 37 (12.3%) |
Employment Status by Educational Attainment in Cedar Grove
According to labor force statistics for Cedar Grove, 74.7% of individuals (227) out of the total population between 25 and 64 years of age (304) are in the labor force, with 16.3% or 37 of them being unemployed. The group with the highest labor force participation rate are those with the educational attainment of bachelor's degree or higher, with 88.2% or 142 individuals in the labor force. Within the labor force, individuals with bachelor's degree or higher education have the highest percentage of unemployment, with 26.1% or 37 of them being unemployed.
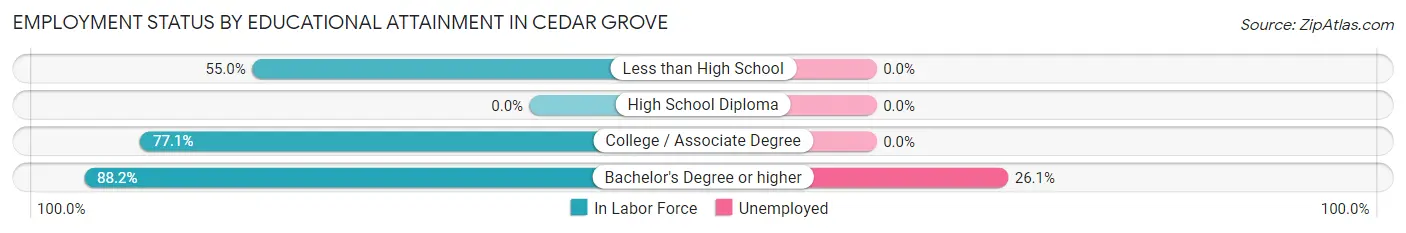
| Educational Attainment | In Labor Force | Unemployed |
| Less than High School | 11 (55.0%) | 0 (0.0%) |
| High School Diploma | 0 (0.0%) | 0 (0.0%) |
| College / Associate Degree | 74 (77.1%) | 0 (0.0%) |
| Bachelor's Degree or higher | 142 (88.2%) | 42 (26.1%) |
| Total | 227 (74.7%) | 50 (16.3%) |
Employment Occupations by Sex in Cedar Grove
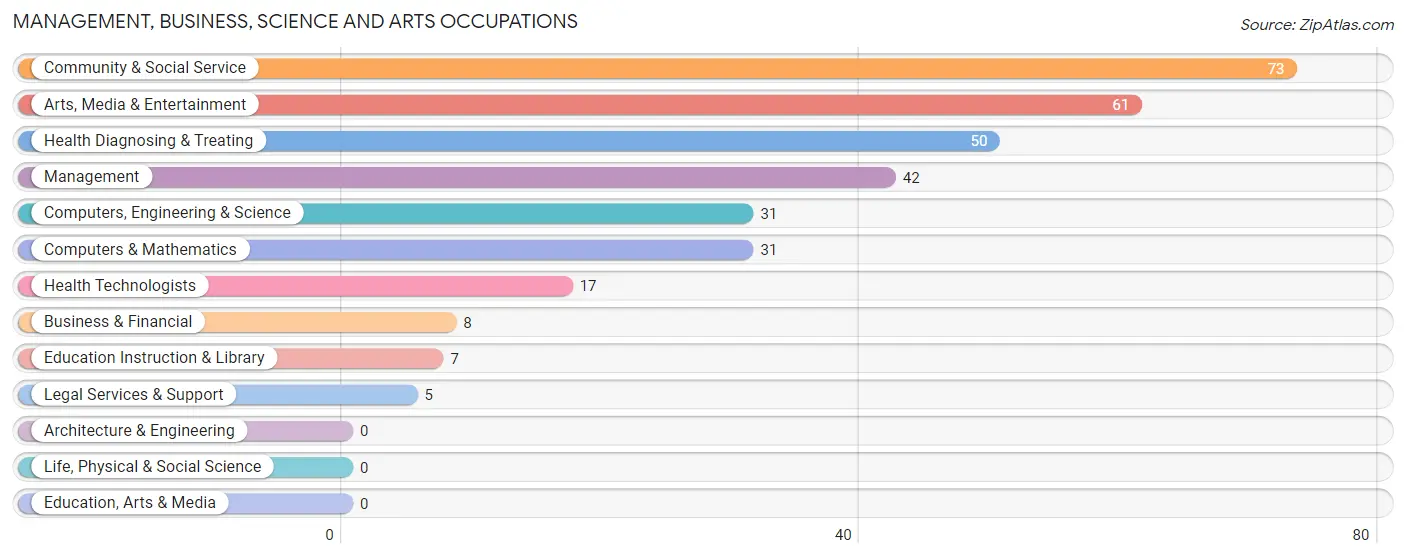
Management, Business, Science and Arts Occupations
The most common Management, Business, Science and Arts occupations in Cedar Grove are Community & Social Service (73 | 27.8%), Arts, Media & Entertainment (61 | 23.2%), Health Diagnosing & Treating (50 | 19.0%), Management (42 | 16.0%), and Computers, Engineering & Science (31 | 11.8%).
Management, Business, Science and Arts Occupations by Sex
Within the Management, Business, Science and Arts occupations in Cedar Grove, the most male-oriented occupations are Business & Financial (100.0%), Legal Services & Support (100.0%), and Education Instruction & Library (100.0%), while the most female-oriented occupations are Health Diagnosing & Treating (86.0%), Management (73.8%), and Arts, Media & Entertainment (65.6%).
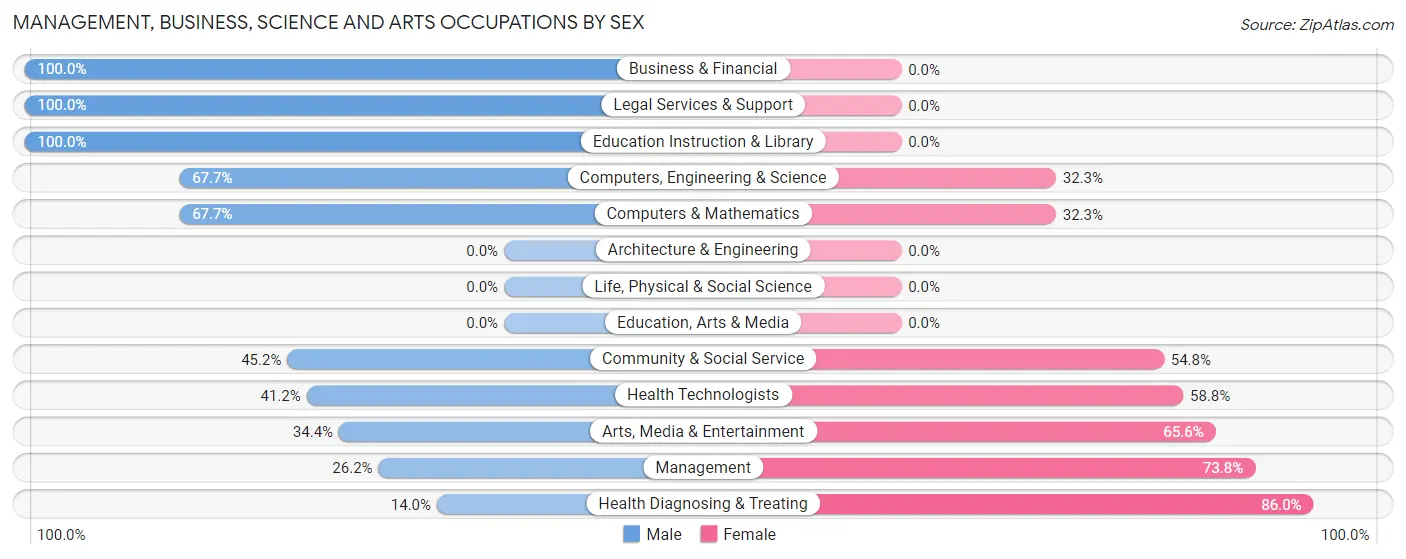
| Occupation | Male | Female |
| Management | 11 (26.2%) | 31 (73.8%) |
| Business & Financial | 8 (100.0%) | 0 (0.0%) |
| Computers, Engineering & Science | 21 (67.7%) | 10 (32.3%) |
| Computers & Mathematics | 21 (67.7%) | 10 (32.3%) |
| Architecture & Engineering | 0 (0.0%) | 0 (0.0%) |
| Life, Physical & Social Science | 0 (0.0%) | 0 (0.0%) |
| Community & Social Service | 33 (45.2%) | 40 (54.8%) |
| Education, Arts & Media | 0 (0.0%) | 0 (0.0%) |
| Legal Services & Support | 5 (100.0%) | 0 (0.0%) |
| Education Instruction & Library | 7 (100.0%) | 0 (0.0%) |
| Arts, Media & Entertainment | 21 (34.4%) | 40 (65.6%) |
| Health Diagnosing & Treating | 7 (14.0%) | 43 (86.0%) |
| Health Technologists | 7 (41.2%) | 10 (58.8%) |
| Total (Category) | 80 (39.2%) | 124 (60.8%) |
| Total (Overall) | 102 (38.8%) | 161 (61.2%) |
Services Occupations
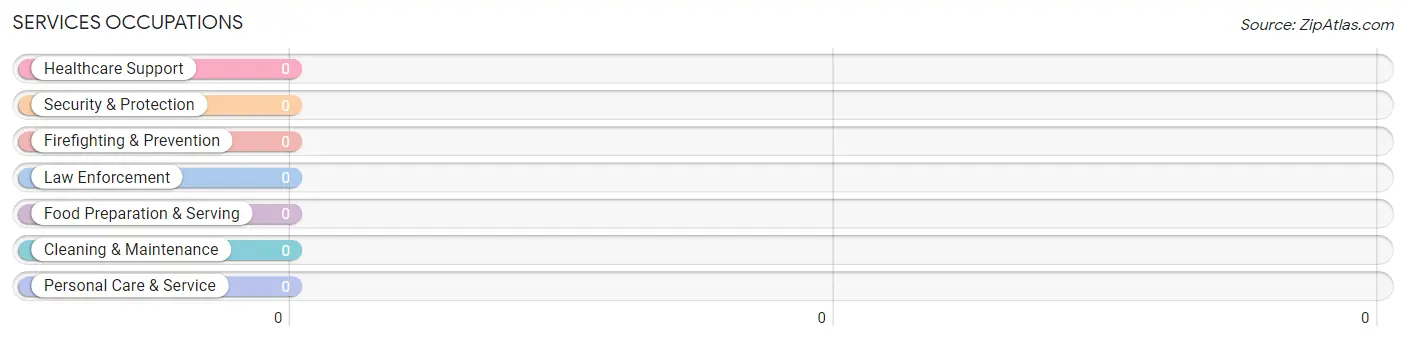
Services Occupations by Sex
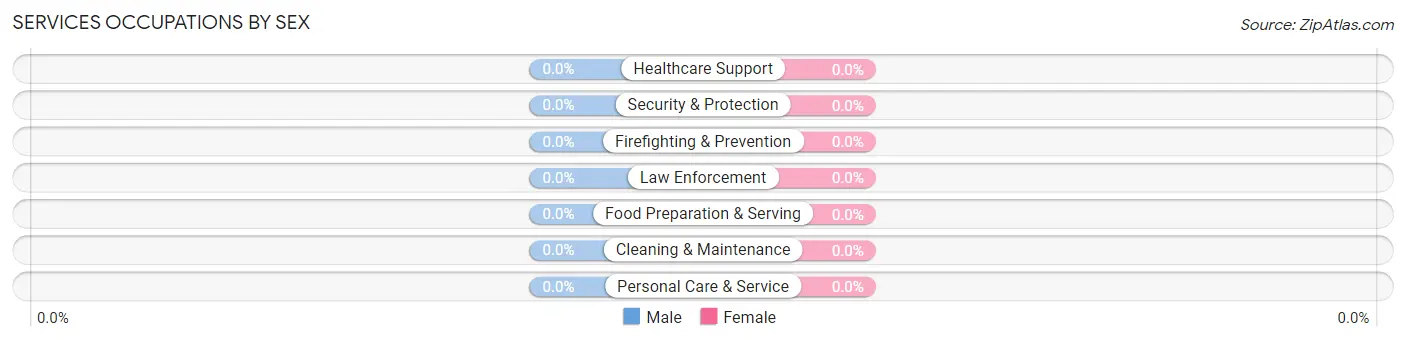
| Occupation | Male | Female |
| Healthcare Support | 0 (0.0%) | 0 (0.0%) |
| Security & Protection | 0 (0.0%) | 0 (0.0%) |
| Firefighting & Prevention | 0 (0.0%) | 0 (0.0%) |
| Law Enforcement | 0 (0.0%) | 0 (0.0%) |
| Food Preparation & Serving | 0 (0.0%) | 0 (0.0%) |
| Cleaning & Maintenance | 0 (0.0%) | 0 (0.0%) |
| Personal Care & Service | 0 (0.0%) | 0 (0.0%) |
| Total (Category) | 0 (0.0%) | 0 (0.0%) |
| Total (Overall) | 102 (38.8%) | 161 (61.2%) |
Sales and Office Occupations
The most common Sales and Office occupations in Cedar Grove are Office & Administration (37 | 14.1%), and Sales & Related (11 | 4.2%).
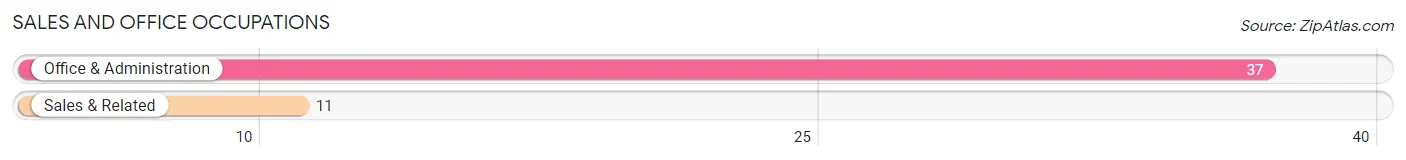
Sales and Office Occupations by Sex

| Occupation | Male | Female |
| Sales & Related | 11 (100.0%) | 0 (0.0%) |
| Office & Administration | 0 (0.0%) | 37 (100.0%) |
| Total (Category) | 11 (22.9%) | 37 (77.1%) |
| Total (Overall) | 102 (38.8%) | 161 (61.2%) |
Natural Resources, Construction and Maintenance Occupations
The most common Natural Resources, Construction and Maintenance occupations in Cedar Grove are , and Construction & Extraction (11 | 4.2%).
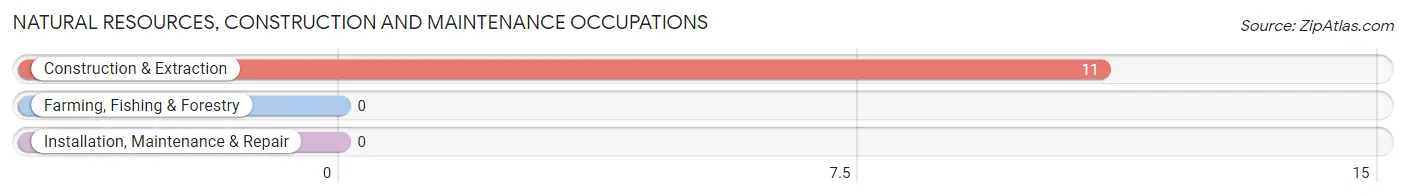
Natural Resources, Construction and Maintenance Occupations by Sex

| Occupation | Male | Female |
| Farming, Fishing & Forestry | 0 (0.0%) | 0 (0.0%) |
| Construction & Extraction | 11 (100.0%) | 0 (0.0%) |
| Installation, Maintenance & Repair | 0 (0.0%) | 0 (0.0%) |
| Total (Category) | 11 (100.0%) | 0 (0.0%) |
| Total (Overall) | 102 (38.8%) | 161 (61.2%) |
Production, Transportation and Moving Occupations
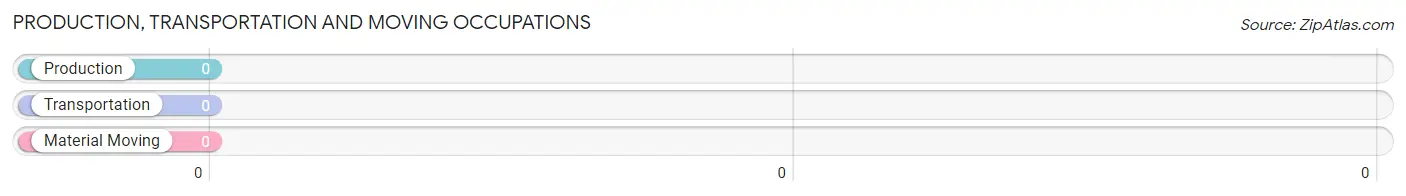
Production, Transportation and Moving Occupations by Sex
| Occupation | Male | Female |
| Production | 0 (0.0%) | 0 (0.0%) |
| Transportation | 0 (0.0%) | 0 (0.0%) |
| Material Moving | 0 (0.0%) | 0 (0.0%) |
| Total (Category) | 0 (0.0%) | 0 (0.0%) |
| Total (Overall) | 102 (38.8%) | 161 (61.2%) |
Employment Industries by Sex in Cedar Grove
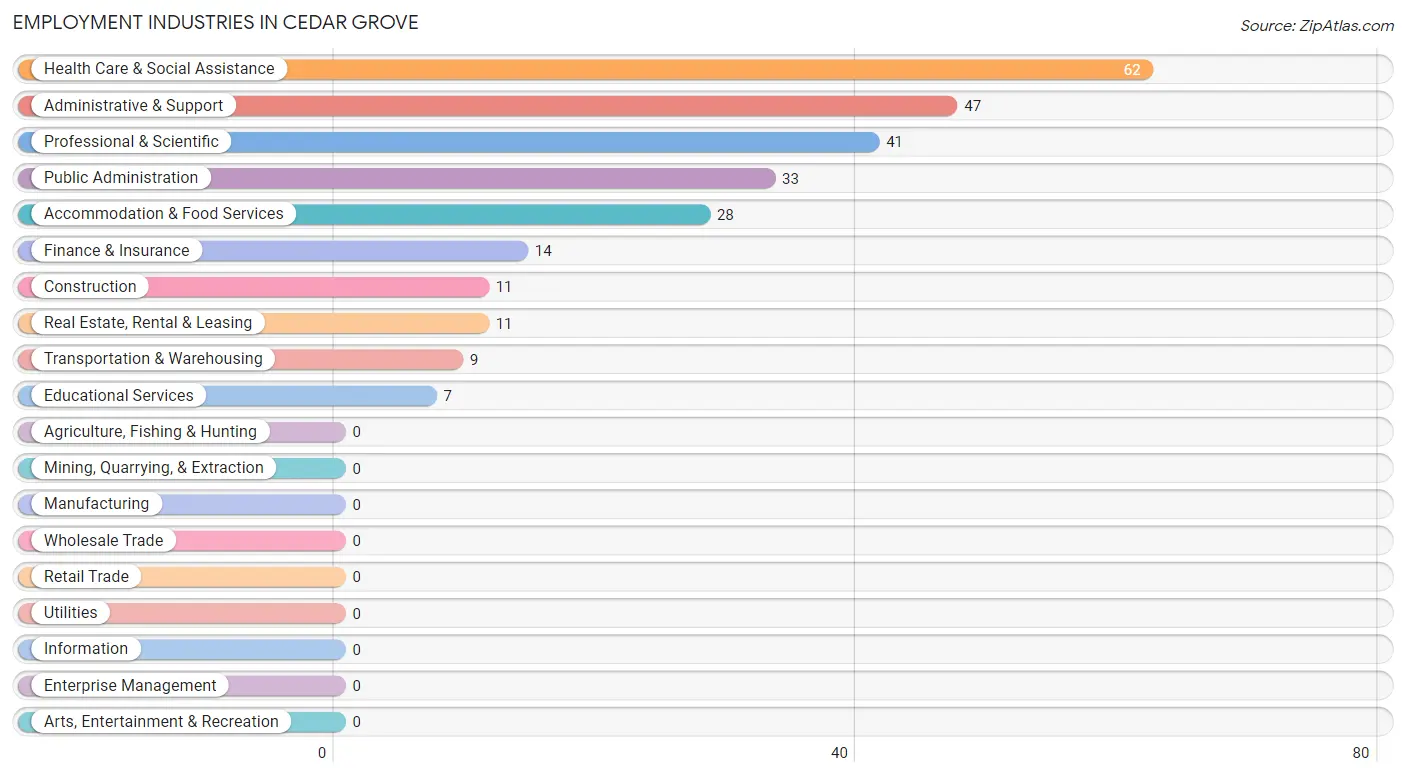
Employment Industries in Cedar Grove
The major employment industries in Cedar Grove include Health Care & Social Assistance (62 | 23.6%), Administrative & Support (47 | 17.9%), Professional & Scientific (41 | 15.6%), Public Administration (33 | 12.6%), and Accommodation & Food Services (28 | 10.6%).
Employment Industries by Sex in Cedar Grove
The Cedar Grove industries that see more men than women are Construction (100.0%), Finance & Insurance (100.0%), and Real Estate, Rental & Leasing (100.0%), whereas the industries that tend to have a higher number of women are Transportation & Warehousing (100.0%), Accommodation & Food Services (100.0%), and Administrative & Support (85.1%).
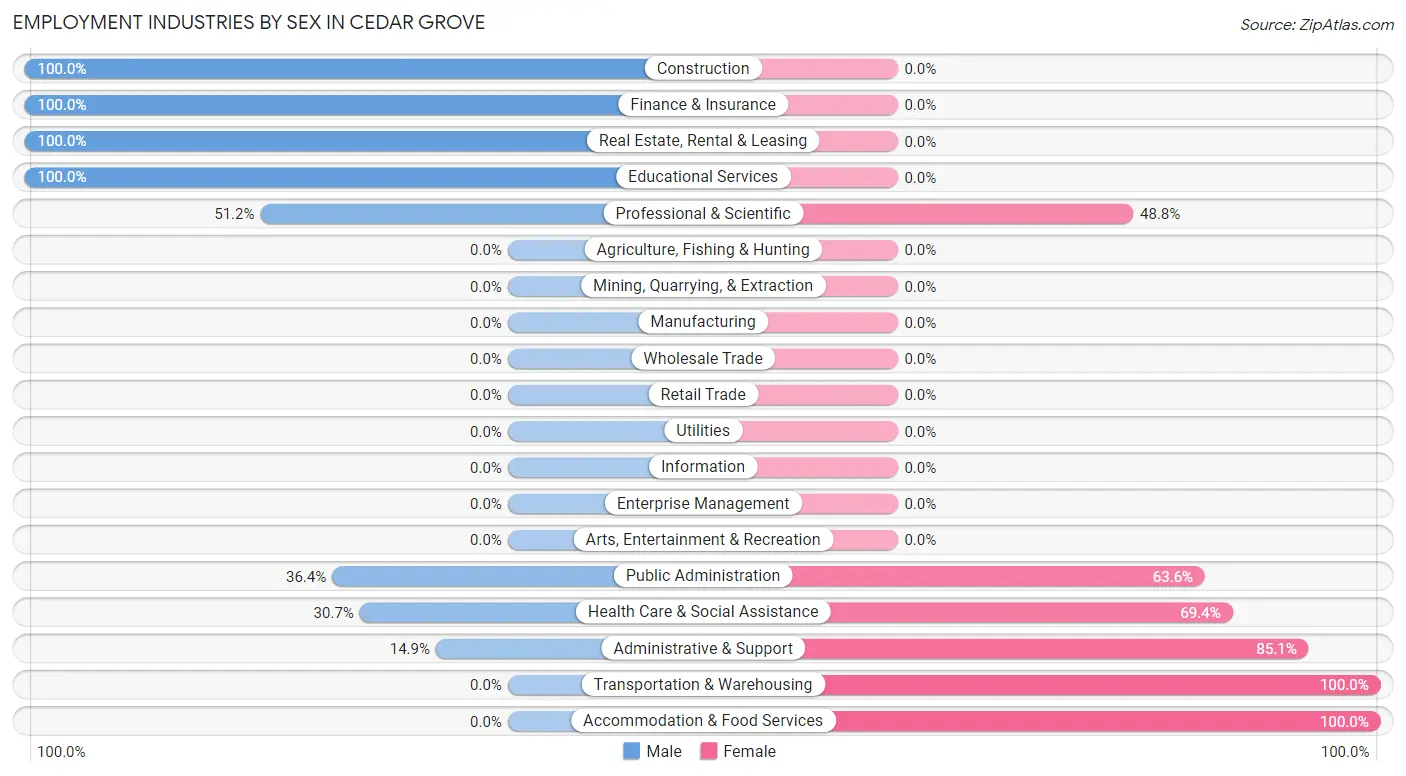
| Industry | Male | Female |
| Agriculture, Fishing & Hunting | 0 (0.0%) | 0 (0.0%) |
| Mining, Quarrying, & Extraction | 0 (0.0%) | 0 (0.0%) |
| Construction | 11 (100.0%) | 0 (0.0%) |
| Manufacturing | 0 (0.0%) | 0 (0.0%) |
| Wholesale Trade | 0 (0.0%) | 0 (0.0%) |
| Retail Trade | 0 (0.0%) | 0 (0.0%) |
| Transportation & Warehousing | 0 (0.0%) | 9 (100.0%) |
| Utilities | 0 (0.0%) | 0 (0.0%) |
| Information | 0 (0.0%) | 0 (0.0%) |
| Finance & Insurance | 14 (100.0%) | 0 (0.0%) |
| Real Estate, Rental & Leasing | 11 (100.0%) | 0 (0.0%) |
| Professional & Scientific | 21 (51.2%) | 20 (48.8%) |
| Enterprise Management | 0 (0.0%) | 0 (0.0%) |
| Administrative & Support | 7 (14.9%) | 40 (85.1%) |
| Educational Services | 7 (100.0%) | 0 (0.0%) |
| Health Care & Social Assistance | 19 (30.6%) | 43 (69.4%) |
| Arts, Entertainment & Recreation | 0 (0.0%) | 0 (0.0%) |
| Accommodation & Food Services | 0 (0.0%) | 28 (100.0%) |
| Public Administration | 12 (36.4%) | 21 (63.6%) |
| Total | 102 (38.8%) | 161 (61.2%) |
Education in Cedar Grove
School Enrollment in Cedar Grove
The most common levels of schooling among the 78 students in Cedar Grove are high school (35 | 44.9%), college / undergraduate (25 | 32.1%), and elementary school (14 | 17.9%).
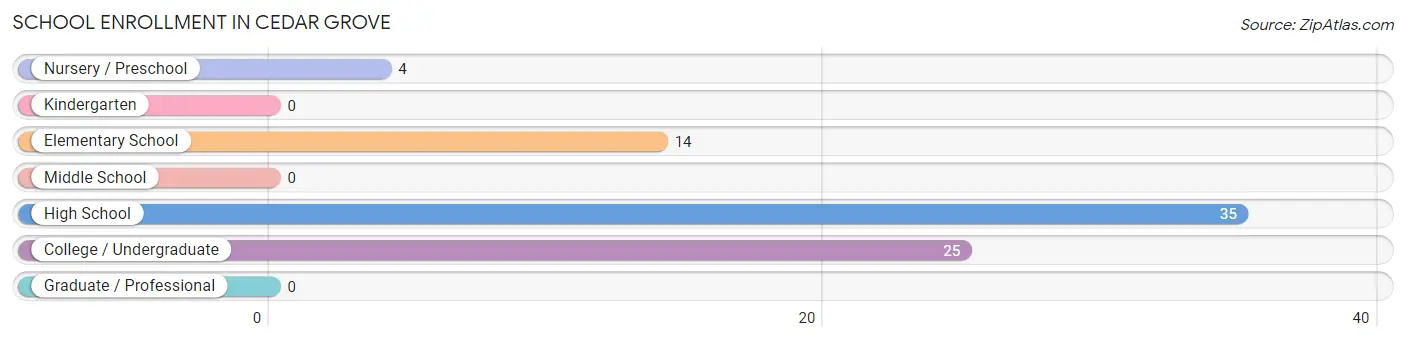
| School Level | # Students | % Students |
| Nursery / Preschool | 4 | 5.1% |
| Kindergarten | 0 | 0.0% |
| Elementary School | 14 | 17.9% |
| Middle School | 0 | 0.0% |
| High School | 35 | 44.9% |
| College / Undergraduate | 25 | 32.1% |
| Graduate / Professional | 0 | 0.0% |
| Total | 78 | 100.0% |
School Enrollment by Age by Funding Source in Cedar Grove
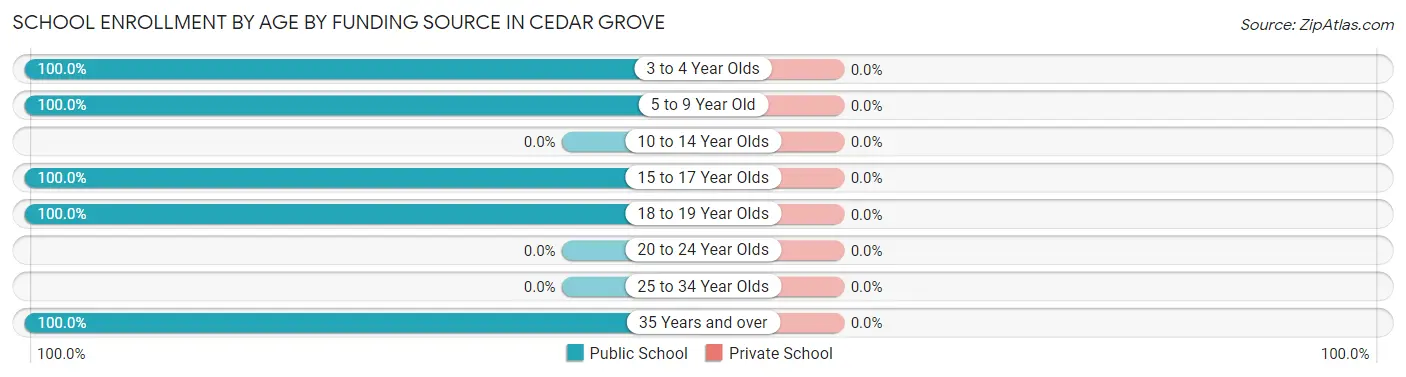
| Age Bracket | Public School | Private School |
| 3 to 4 Year Olds | 4 (100.0%) | 0 (0.0%) |
| 5 to 9 Year Old | 14 (100.0%) | 0 (0.0%) |
| 10 to 14 Year Olds | 0 (0.0%) | 0 (0.0%) |
| 15 to 17 Year Olds | 7 (100.0%) | 0 (0.0%) |
| 18 to 19 Year Olds | 28 (100.0%) | 0 (0.0%) |
| 20 to 24 Year Olds | 0 (0.0%) | 0 (0.0%) |
| 25 to 34 Year Olds | 0 (0.0%) | 0 (0.0%) |
| 35 Years and over | 25 (100.0%) | 0 (0.0%) |
| Total | 78 (100.0%) | 0 (0.0%) |
Educational Attainment by Field of Study in Cedar Grove
Bio, nature & agricultural (57 | 18.9%), education (49 | 16.2%), literature & languages (43 | 14.2%), business (35 | 11.6%), and social sciences (29 | 9.6%) are the most common fields of study among 302 individuals in Cedar Grove who have obtained a bachelor's degree or higher.
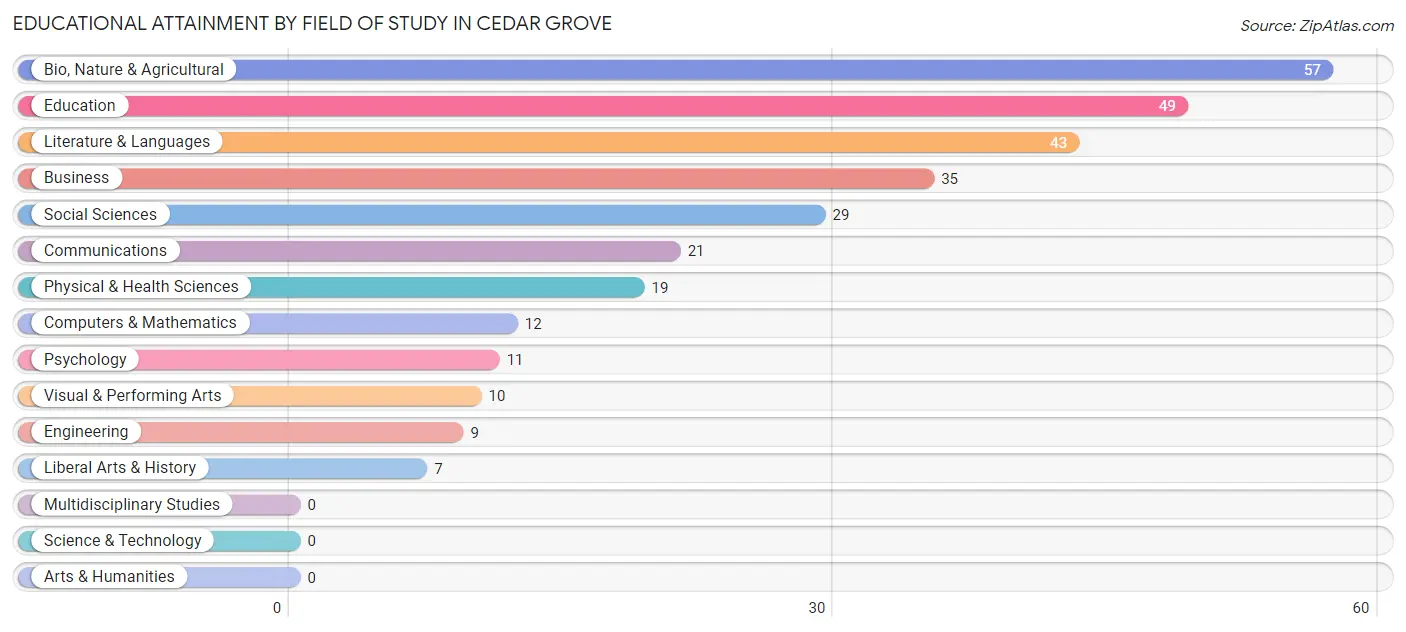
| Field of Study | # Graduates | % Graduates |
| Computers & Mathematics | 12 | 4.0% |
| Bio, Nature & Agricultural | 57 | 18.9% |
| Physical & Health Sciences | 19 | 6.3% |
| Psychology | 11 | 3.6% |
| Social Sciences | 29 | 9.6% |
| Engineering | 9 | 3.0% |
| Multidisciplinary Studies | 0 | 0.0% |
| Science & Technology | 0 | 0.0% |
| Business | 35 | 11.6% |
| Education | 49 | 16.2% |
| Literature & Languages | 43 | 14.2% |
| Liberal Arts & History | 7 | 2.3% |
| Visual & Performing Arts | 10 | 3.3% |
| Communications | 21 | 7.0% |
| Arts & Humanities | 0 | 0.0% |
| Total | 302 | 100.0% |
Transportation & Commute in Cedar Grove
Vehicle Availability by Sex in Cedar Grove
The most prevalent vehicle ownership categories in Cedar Grove are males with 2 vehicles (49, accounting for 48.0%) and females with 2 vehicles (121, making up 30.4%).
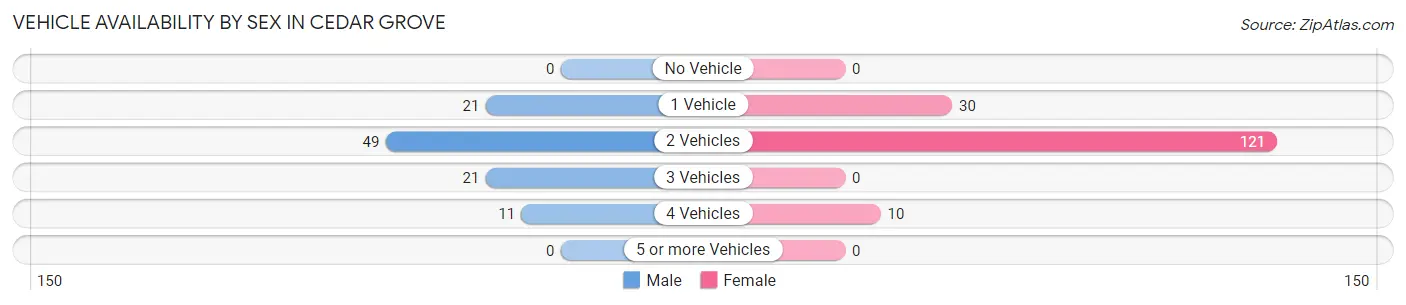
| Vehicles Available | Male | Female |
| No Vehicle | 0 (0.0%) | 0 (0.0%) |
| 1 Vehicle | 21 (20.6%) | 30 (18.6%) |
| 2 Vehicles | 49 (48.0%) | 121 (75.2%) |
| 3 Vehicles | 21 (20.6%) | 0 (0.0%) |
| 4 Vehicles | 11 (10.8%) | 10 (6.2%) |
| 5 or more Vehicles | 0 (0.0%) | 0 (0.0%) |
| Total | 102 (100.0%) | 161 (100.0%) |
Commute Time in Cedar Grove
The most frequently occuring commute durations in Cedar Grove are 45 to 59 minutes (93 commuters, 36.0%), 15 to 19 minutes (49 commuters, 19.0%), and 90 or more minutes (40 commuters, 15.5%).
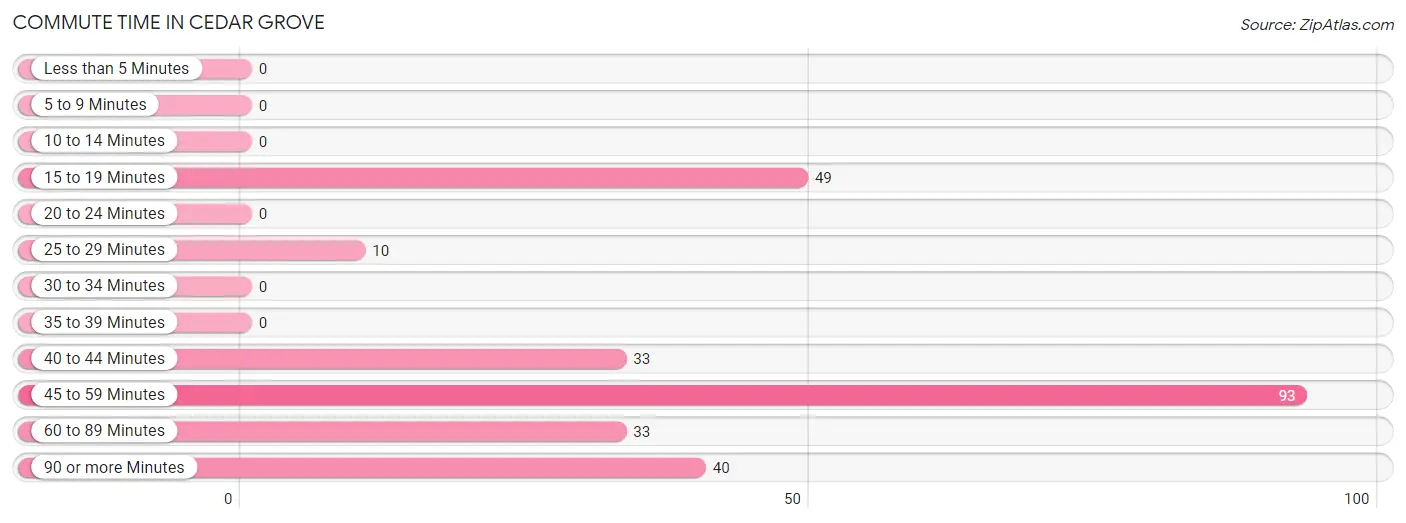
| Commute Time | # Commuters | % Commuters |
| Less than 5 Minutes | 0 | 0.0% |
| 5 to 9 Minutes | 0 | 0.0% |
| 10 to 14 Minutes | 0 | 0.0% |
| 15 to 19 Minutes | 49 | 19.0% |
| 20 to 24 Minutes | 0 | 0.0% |
| 25 to 29 Minutes | 10 | 3.9% |
| 30 to 34 Minutes | 0 | 0.0% |
| 35 to 39 Minutes | 0 | 0.0% |
| 40 to 44 Minutes | 33 | 12.8% |
| 45 to 59 Minutes | 93 | 36.0% |
| 60 to 89 Minutes | 33 | 12.8% |
| 90 or more Minutes | 40 | 15.5% |
Commute Time by Sex in Cedar Grove
The most common commute times in Cedar Grove are 45 to 59 minutes (53 commuters, 54.6%) for males and 45 to 59 minutes (40 commuters, 24.8%) for females.
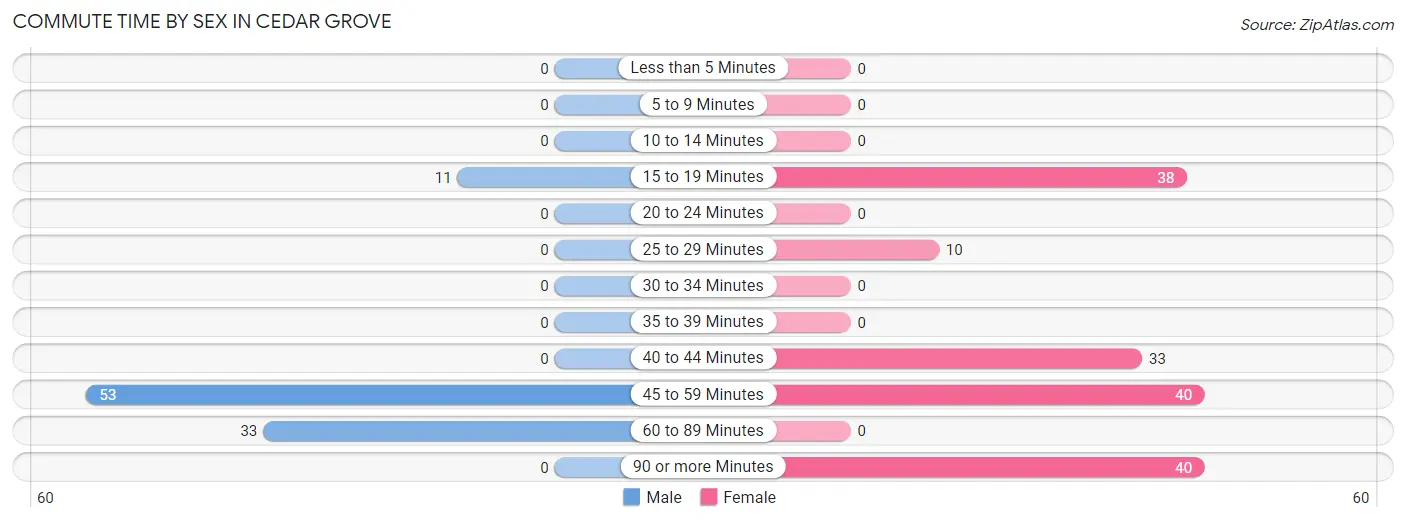
| Commute Time | Male | Female |
| Less than 5 Minutes | 0 (0.0%) | 0 (0.0%) |
| 5 to 9 Minutes | 0 (0.0%) | 0 (0.0%) |
| 10 to 14 Minutes | 0 (0.0%) | 0 (0.0%) |
| 15 to 19 Minutes | 11 (11.3%) | 38 (23.6%) |
| 20 to 24 Minutes | 0 (0.0%) | 0 (0.0%) |
| 25 to 29 Minutes | 0 (0.0%) | 10 (6.2%) |
| 30 to 34 Minutes | 0 (0.0%) | 0 (0.0%) |
| 35 to 39 Minutes | 0 (0.0%) | 0 (0.0%) |
| 40 to 44 Minutes | 0 (0.0%) | 33 (20.5%) |
| 45 to 59 Minutes | 53 (54.6%) | 40 (24.8%) |
| 60 to 89 Minutes | 33 (34.0%) | 0 (0.0%) |
| 90 or more Minutes | 0 (0.0%) | 40 (24.8%) |
Time of Departure to Work by Sex in Cedar Grove
The most frequent times of departure to work in Cedar Grove are 6:00 AM to 6:29 AM (22, 22.7%) for males and 8:00 AM to 8:29 AM (41, 25.5%) for females.
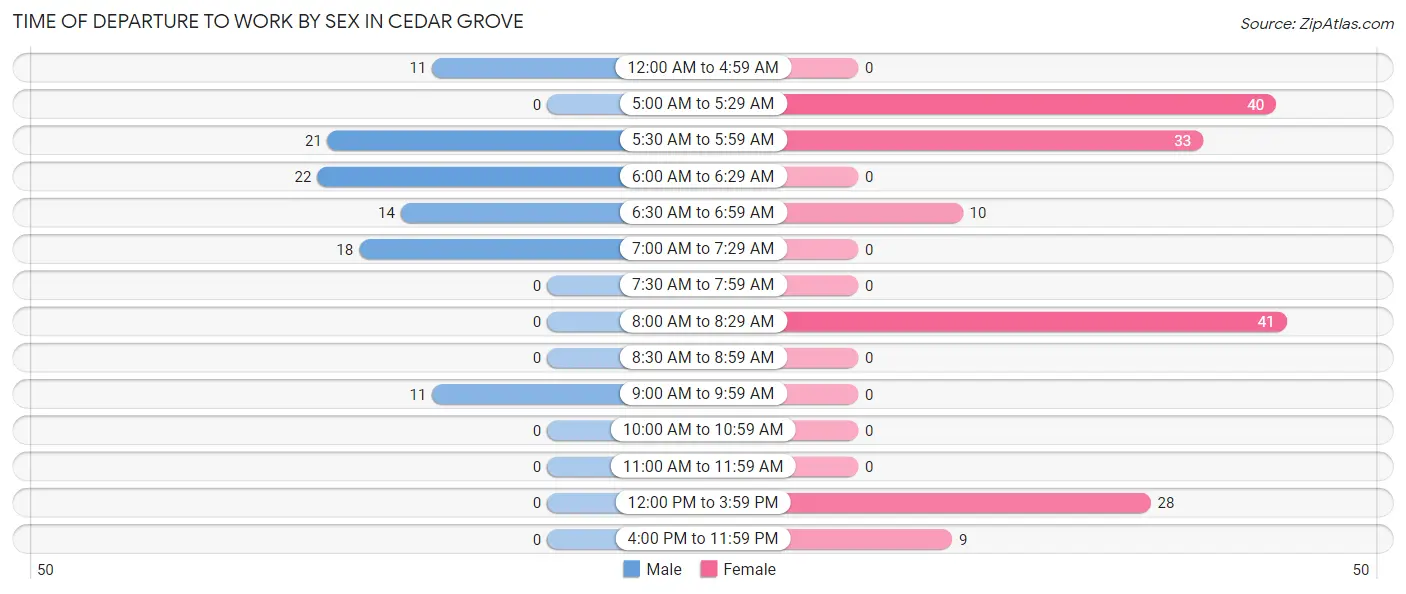
| Time of Departure | Male | Female |
| 12:00 AM to 4:59 AM | 11 (11.3%) | 0 (0.0%) |
| 5:00 AM to 5:29 AM | 0 (0.0%) | 40 (24.8%) |
| 5:30 AM to 5:59 AM | 21 (21.6%) | 33 (20.5%) |
| 6:00 AM to 6:29 AM | 22 (22.7%) | 0 (0.0%) |
| 6:30 AM to 6:59 AM | 14 (14.4%) | 10 (6.2%) |
| 7:00 AM to 7:29 AM | 18 (18.6%) | 0 (0.0%) |
| 7:30 AM to 7:59 AM | 0 (0.0%) | 0 (0.0%) |
| 8:00 AM to 8:29 AM | 0 (0.0%) | 41 (25.5%) |
| 8:30 AM to 8:59 AM | 0 (0.0%) | 0 (0.0%) |
| 9:00 AM to 9:59 AM | 11 (11.3%) | 0 (0.0%) |
| 10:00 AM to 10:59 AM | 0 (0.0%) | 0 (0.0%) |
| 11:00 AM to 11:59 AM | 0 (0.0%) | 0 (0.0%) |
| 12:00 PM to 3:59 PM | 0 (0.0%) | 28 (17.4%) |
| 4:00 PM to 11:59 PM | 0 (0.0%) | 9 (5.6%) |
| Total | 97 (100.0%) | 161 (100.0%) |
Housing Occupancy in Cedar Grove
Occupancy by Ownership in Cedar Grove
Of the total 564 dwellings in Cedar Grove, owner-occupied units account for 516 (91.5%), while renter-occupied units make up 48 (8.5%).
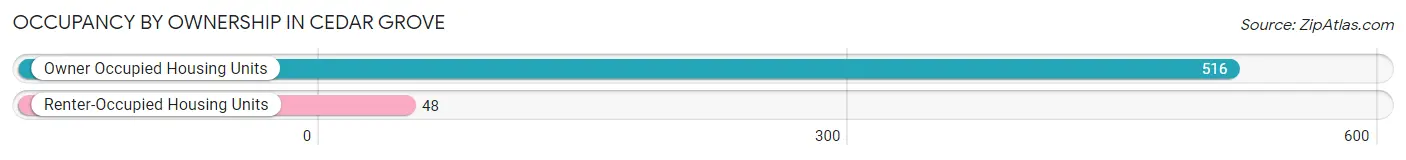
| Occupancy | # Housing Units | % Housing Units |
| Owner Occupied Housing Units | 516 | 91.5% |
| Renter-Occupied Housing Units | 48 | 8.5% |
| Total Occupied Housing Units | 564 | 100.0% |
Occupancy by Household Size in Cedar Grove
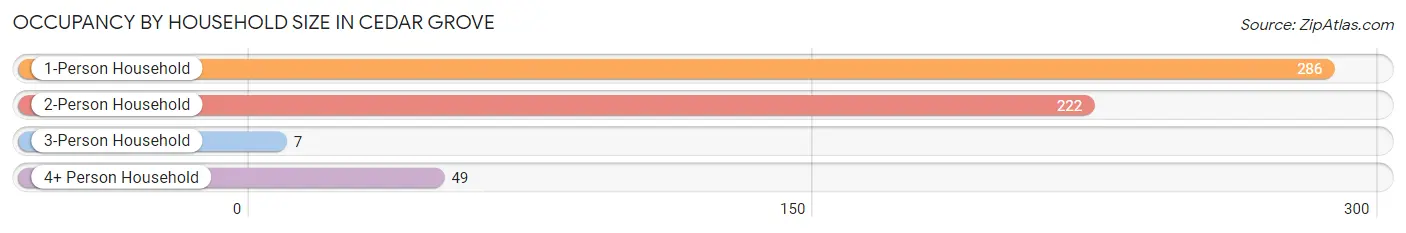
| Household Size | # Housing Units | % Housing Units |
| 1-Person Household | 286 | 50.7% |
| 2-Person Household | 222 | 39.4% |
| 3-Person Household | 7 | 1.2% |
| 4+ Person Household | 49 | 8.7% |
| Total Housing Units | 564 | 100.0% |
Occupancy by Ownership by Household Size in Cedar Grove
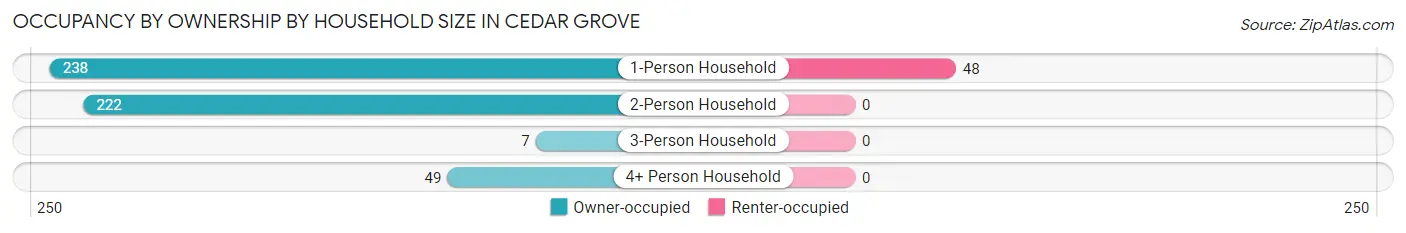
| Household Size | Owner-occupied | Renter-occupied |
| 1-Person Household | 238 (83.2%) | 48 (16.8%) |
| 2-Person Household | 222 (100.0%) | 0 (0.0%) |
| 3-Person Household | 7 (100.0%) | 0 (0.0%) |
| 4+ Person Household | 49 (100.0%) | 0 (0.0%) |
| Total Housing Units | 516 (91.5%) | 48 (8.5%) |
Occupancy by Educational Attainment in Cedar Grove
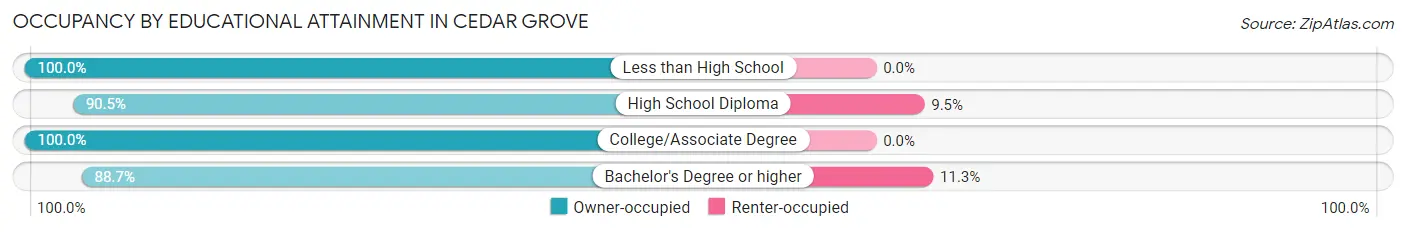
| Household Size | Owner-occupied | Renter-occupied |
| Less than High School | 11 (100.0%) | 0 (0.0%) |
| High School Diploma | 256 (90.5%) | 27 (9.5%) |
| College/Associate Degree | 84 (100.0%) | 0 (0.0%) |
| Bachelor's Degree or higher | 165 (88.7%) | 21 (11.3%) |
Occupancy by Age of Householder in Cedar Grove
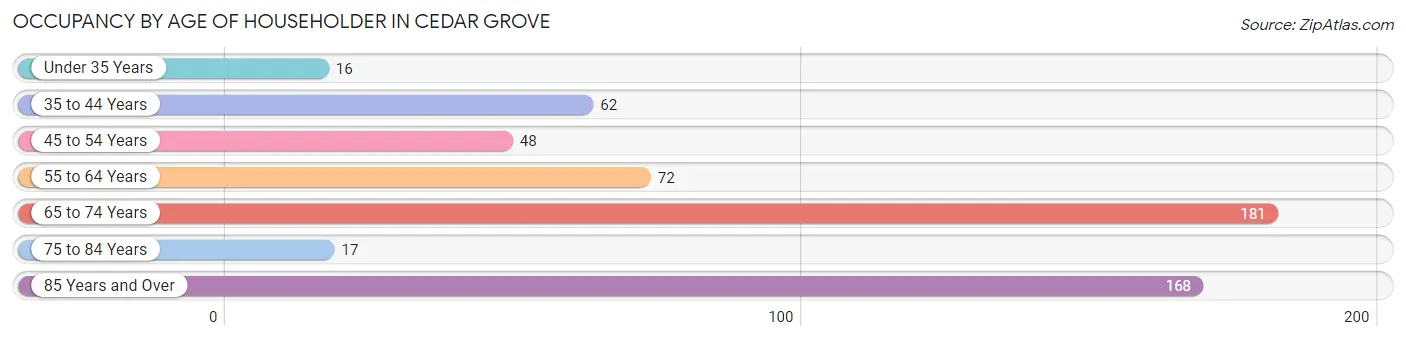
| Age Bracket | # Households | % Households |
| Under 35 Years | 16 | 2.8% |
| 35 to 44 Years | 62 | 11.0% |
| 45 to 54 Years | 48 | 8.5% |
| 55 to 64 Years | 72 | 12.8% |
| 65 to 74 Years | 181 | 32.1% |
| 75 to 84 Years | 17 | 3.0% |
| 85 Years and Over | 168 | 29.8% |
| Total | 564 | 100.0% |
Housing Finances in Cedar Grove
Median Income by Occupancy in Cedar Grove
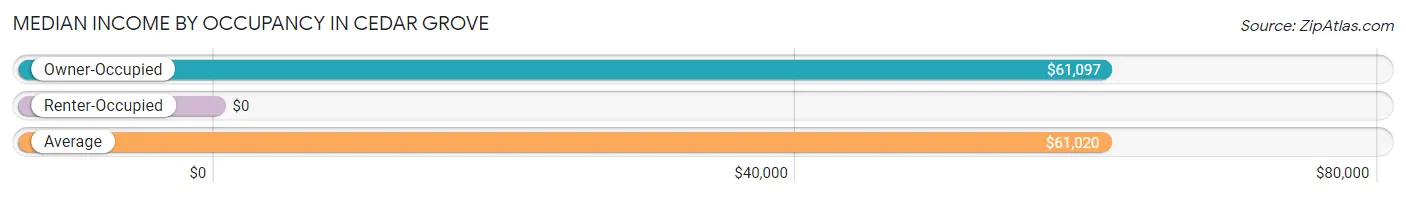
| Occupancy Type | # Households | Median Income |
| Owner-Occupied | 516 (91.5%) | $61,097 |
| Renter-Occupied | 48 (8.5%) | $0 |
| Average | 564 (100.0%) | $61,020 |
Occupancy by Householder Income Bracket in Cedar Grove
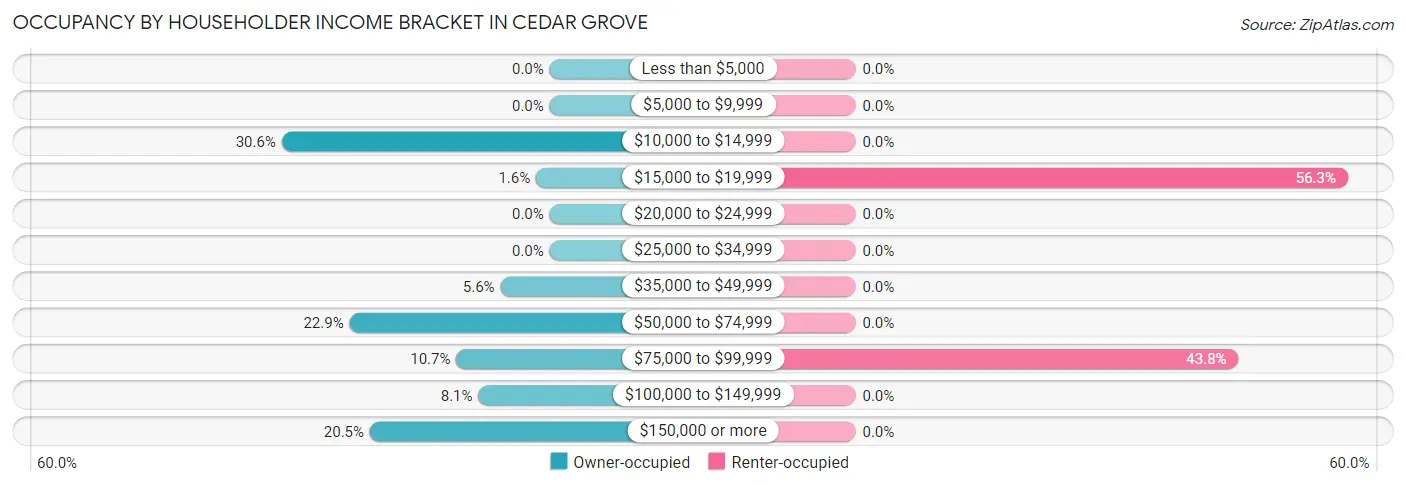
| Income Bracket | Owner-occupied | Renter-occupied |
| Less than $5,000 | 0 (0.0%) | 0 (0.0%) |
| $5,000 to $9,999 | 0 (0.0%) | 0 (0.0%) |
| $10,000 to $14,999 | 158 (30.6%) | 0 (0.0%) |
| $15,000 to $19,999 | 8 (1.5%) | 27 (56.2%) |
| $20,000 to $24,999 | 0 (0.0%) | 0 (0.0%) |
| $25,000 to $34,999 | 0 (0.0%) | 0 (0.0%) |
| $35,000 to $49,999 | 29 (5.6%) | 0 (0.0%) |
| $50,000 to $74,999 | 118 (22.9%) | 0 (0.0%) |
| $75,000 to $99,999 | 55 (10.7%) | 21 (43.8%) |
| $100,000 to $149,999 | 42 (8.1%) | 0 (0.0%) |
| $150,000 or more | 106 (20.5%) | 0 (0.0%) |
| Total | 516 (100.0%) | 48 (100.0%) |
Monthly Housing Cost Tiers in Cedar Grove
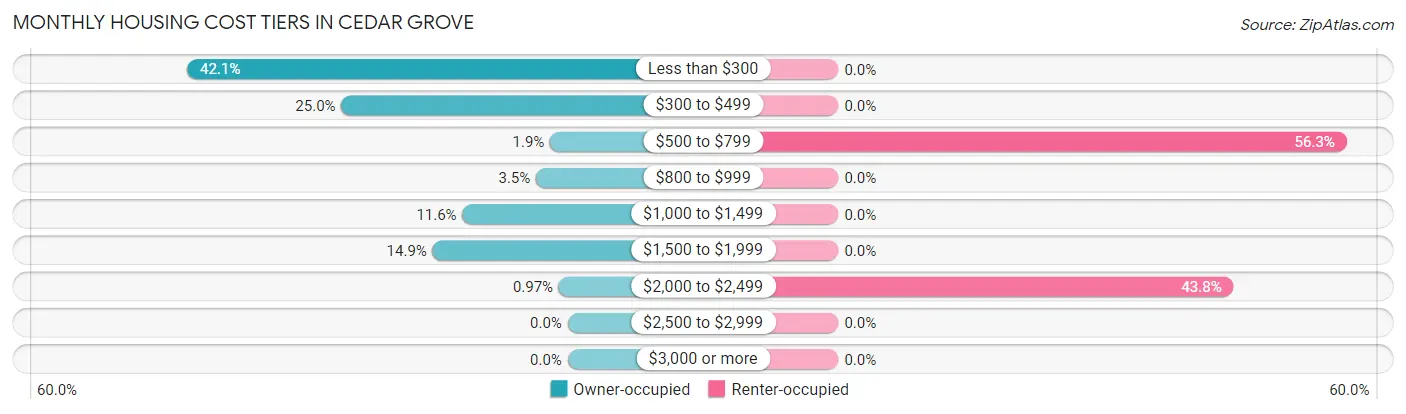
| Monthly Cost | Owner-occupied | Renter-occupied |
| Less than $300 | 217 (42.0%) | 0 (0.0%) |
| $300 to $499 | 129 (25.0%) | 0 (0.0%) |
| $500 to $799 | 10 (1.9%) | 27 (56.2%) |
| $800 to $999 | 18 (3.5%) | 0 (0.0%) |
| $1,000 to $1,499 | 60 (11.6%) | 0 (0.0%) |
| $1,500 to $1,999 | 77 (14.9%) | 0 (0.0%) |
| $2,000 to $2,499 | 5 (1.0%) | 21 (43.8%) |
| $2,500 to $2,999 | 0 (0.0%) | 0 (0.0%) |
| $3,000 or more | 0 (0.0%) | 0 (0.0%) |
| Total | 516 (100.0%) | 48 (100.0%) |
Physical Housing Characteristics in Cedar Grove
Housing Structures in Cedar Grove
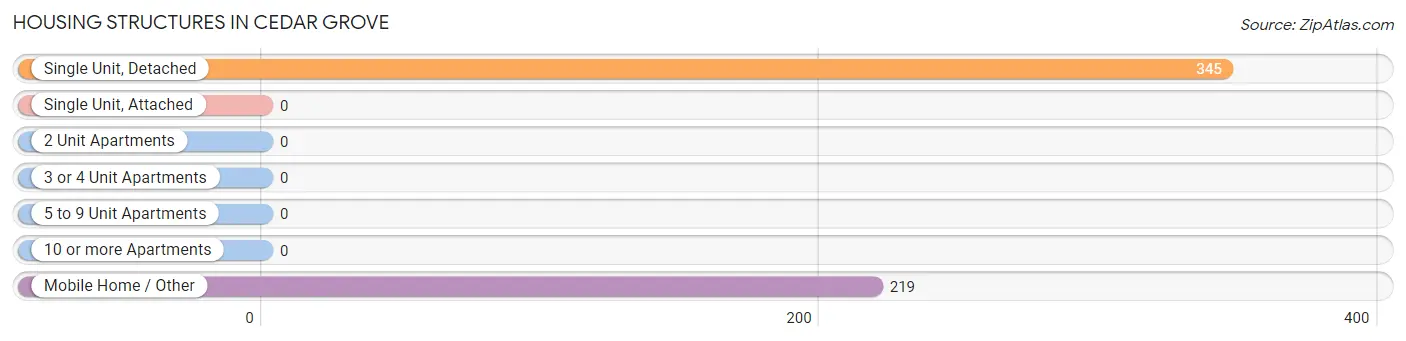
| Structure Type | # Housing Units | % Housing Units |
| Single Unit, Detached | 345 | 61.2% |
| Single Unit, Attached | 0 | 0.0% |
| 2 Unit Apartments | 0 | 0.0% |
| 3 or 4 Unit Apartments | 0 | 0.0% |
| 5 to 9 Unit Apartments | 0 | 0.0% |
| 10 or more Apartments | 0 | 0.0% |
| Mobile Home / Other | 219 | 38.8% |
| Total | 564 | 100.0% |
Housing Structures by Occupancy in Cedar Grove

| Structure Type | Owner-occupied | Renter-occupied |
| Single Unit, Detached | 324 (93.9%) | 21 (6.1%) |
| Single Unit, Attached | 0 (0.0%) | 0 (0.0%) |
| 2 Unit Apartments | 0 (0.0%) | 0 (0.0%) |
| 3 or 4 Unit Apartments | 0 (0.0%) | 0 (0.0%) |
| 5 to 9 Unit Apartments | 0 (0.0%) | 0 (0.0%) |
| 10 or more Apartments | 0 (0.0%) | 0 (0.0%) |
| Mobile Home / Other | 192 (87.7%) | 27 (12.3%) |
| Total | 516 (91.5%) | 48 (8.5%) |
Housing Structures by Number of Rooms in Cedar Grove
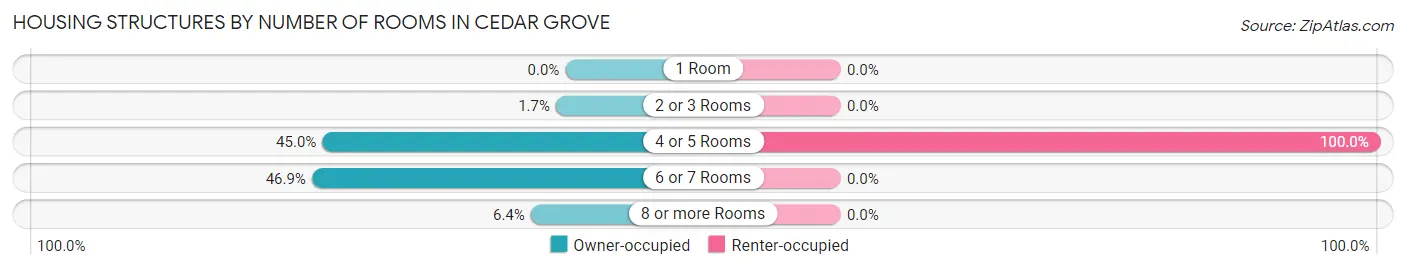
| Number of Rooms | Owner-occupied | Renter-occupied |
| 1 Room | 0 (0.0%) | 0 (0.0%) |
| 2 or 3 Rooms | 9 (1.7%) | 0 (0.0%) |
| 4 or 5 Rooms | 232 (45.0%) | 48 (100.0%) |
| 6 or 7 Rooms | 242 (46.9%) | 0 (0.0%) |
| 8 or more Rooms | 33 (6.4%) | 0 (0.0%) |
| Total | 516 (100.0%) | 48 (100.0%) |
Housing Structure by Heating Type in Cedar Grove
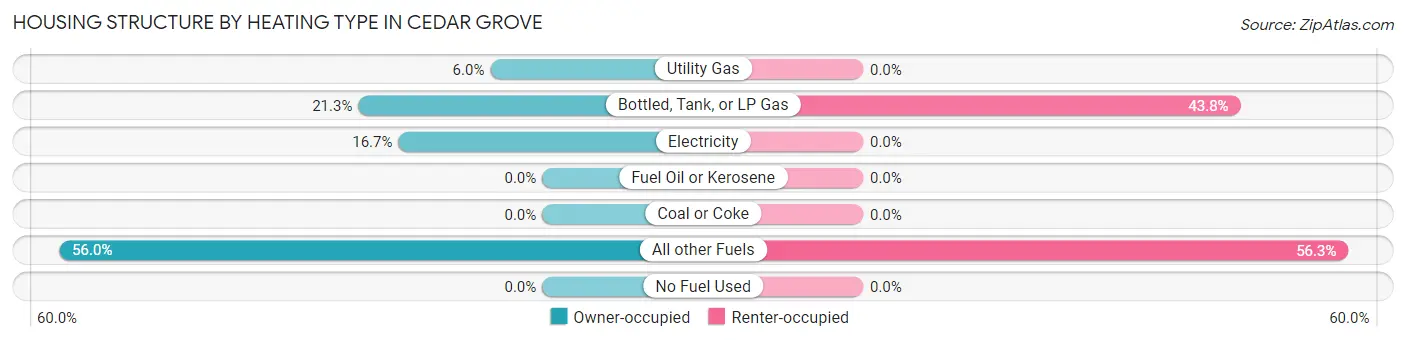
| Heating Type | Owner-occupied | Renter-occupied |
| Utility Gas | 31 (6.0%) | 0 (0.0%) |
| Bottled, Tank, or LP Gas | 110 (21.3%) | 21 (43.8%) |
| Electricity | 86 (16.7%) | 0 (0.0%) |
| Fuel Oil or Kerosene | 0 (0.0%) | 0 (0.0%) |
| Coal or Coke | 0 (0.0%) | 0 (0.0%) |
| All other Fuels | 289 (56.0%) | 27 (56.2%) |
| No Fuel Used | 0 (0.0%) | 0 (0.0%) |
| Total | 516 (100.0%) | 48 (100.0%) |
Household Vehicle Usage in Cedar Grove
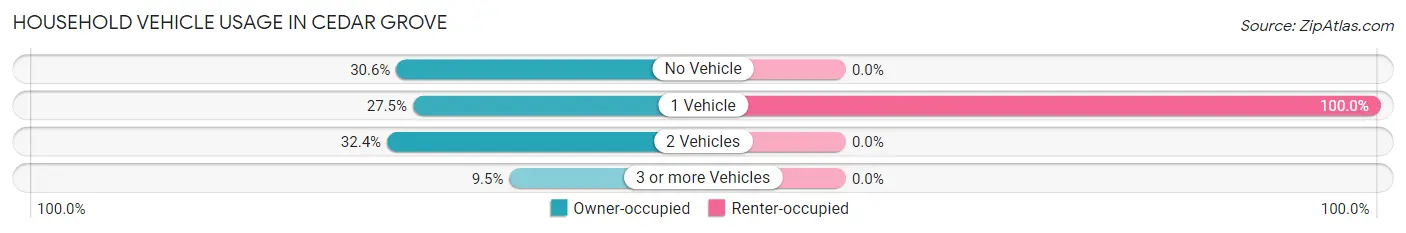
| Vehicles per Household | Owner-occupied | Renter-occupied |
| No Vehicle | 158 (30.6%) | 0 (0.0%) |
| 1 Vehicle | 142 (27.5%) | 48 (100.0%) |
| 2 Vehicles | 167 (32.4%) | 0 (0.0%) |
| 3 or more Vehicles | 49 (9.5%) | 0 (0.0%) |
| Total | 516 (100.0%) | 48 (100.0%) |
Real Estate & Mortgages in Cedar Grove
Real Estate and Mortgage Overview in Cedar Grove
| Characteristic | Without Mortgage | With Mortgage |
| Housing Units | 373 | 143 |
| Median Property Value | $152,500 | $319,600 |
| Median Household Income | - | - |
| Monthly Housing Costs | $292 | $0 |
| Real Estate Taxes | $634 | $0 |
Property Value by Mortgage Status in Cedar Grove
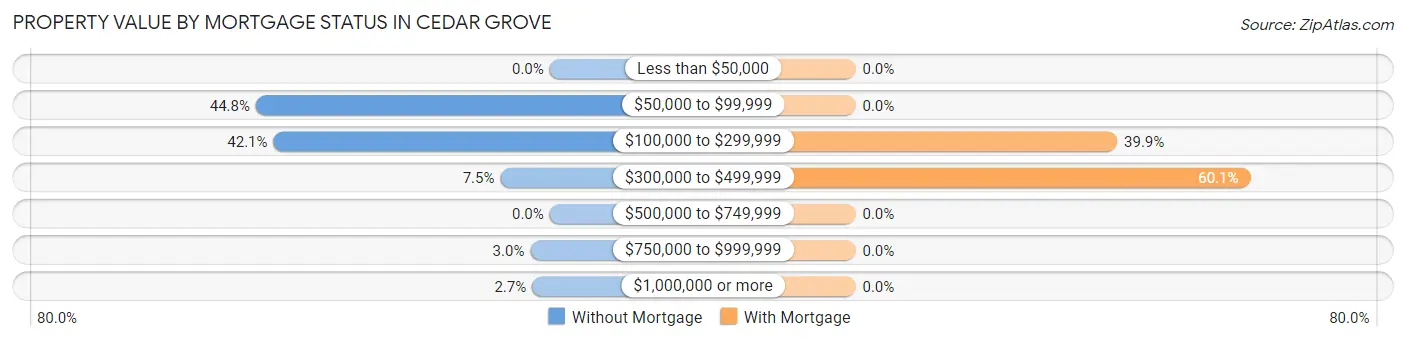
| Property Value | Without Mortgage | With Mortgage |
| Less than $50,000 | 0 (0.0%) | 0 (0.0%) |
| $50,000 to $99,999 | 167 (44.8%) | 0 (0.0%) |
| $100,000 to $299,999 | 157 (42.1%) | 57 (39.9%) |
| $300,000 to $499,999 | 28 (7.5%) | 86 (60.1%) |
| $500,000 to $749,999 | 0 (0.0%) | 0 (0.0%) |
| $750,000 to $999,999 | 11 (2.9%) | 0 (0.0%) |
| $1,000,000 or more | 10 (2.7%) | 0 (0.0%) |
| Total | 373 (100.0%) | 143 (100.0%) |
Household Income by Mortgage Status in Cedar Grove
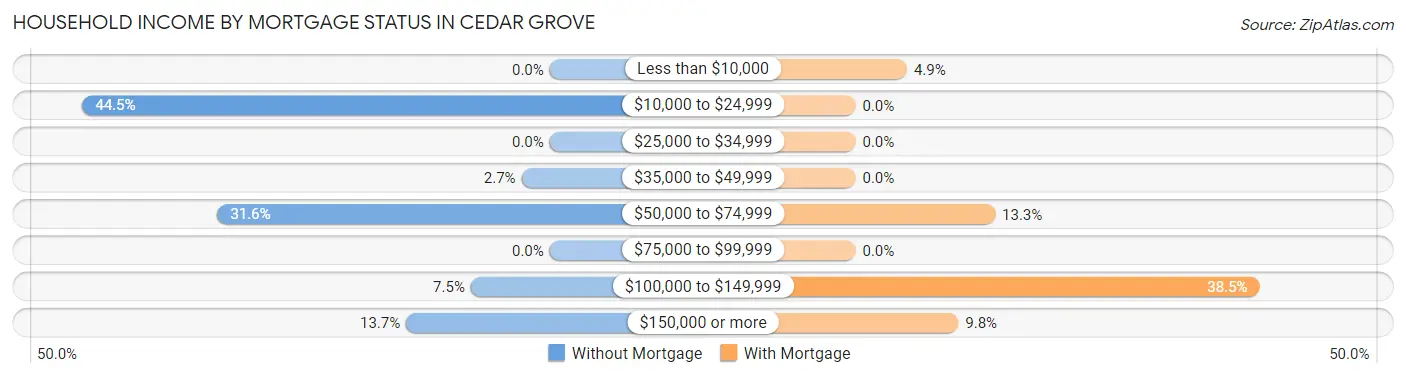
| Household Income | Without Mortgage | With Mortgage |
| Less than $10,000 | 0 (0.0%) | 7 (4.9%) |
| $10,000 to $24,999 | 166 (44.5%) | 0 (0.0%) |
| $25,000 to $34,999 | 0 (0.0%) | 0 (0.0%) |
| $35,000 to $49,999 | 10 (2.7%) | 0 (0.0%) |
| $50,000 to $74,999 | 118 (31.6%) | 19 (13.3%) |
| $75,000 to $99,999 | 0 (0.0%) | 0 (0.0%) |
| $100,000 to $149,999 | 28 (7.5%) | 55 (38.5%) |
| $150,000 or more | 51 (13.7%) | 14 (9.8%) |
| Total | 373 (100.0%) | 143 (100.0%) |
Property Value to Household Income Ratio in Cedar Grove
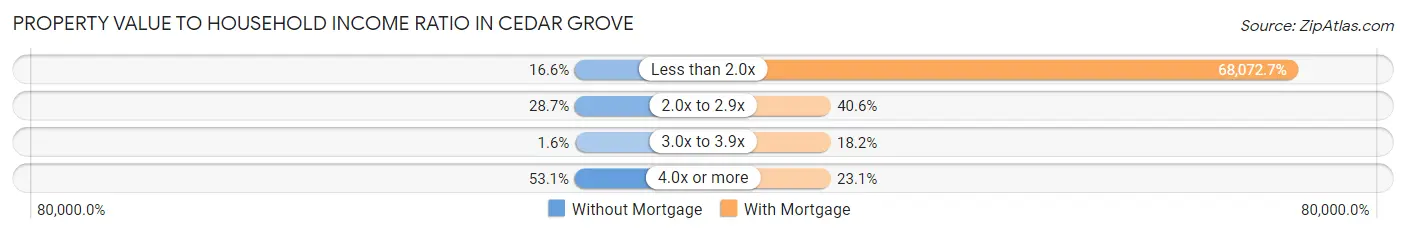
| Value-to-Income Ratio | Without Mortgage | With Mortgage |
| Less than 2.0x | 62 (16.6%) | 97,344 (68,072.7%) |
| 2.0x to 2.9x | 107 (28.7%) | 58 (40.6%) |
| 3.0x to 3.9x | 6 (1.6%) | 26 (18.2%) |
| 4.0x or more | 198 (53.1%) | 33 (23.1%) |
| Total | 373 (100.0%) | 143 (100.0%) |
Real Estate Taxes by Mortgage Status in Cedar Grove
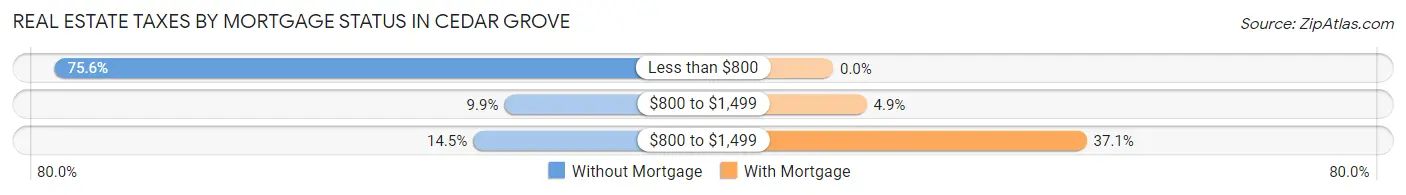
| Property Taxes | Without Mortgage | With Mortgage |
| Less than $800 | 282 (75.6%) | 0 (0.0%) |
| $800 to $1,499 | 37 (9.9%) | 7 (4.9%) |
| $800 to $1,499 | 54 (14.5%) | 53 (37.1%) |
| Total | 373 (100.0%) | 143 (100.0%) |
Health & Disability in Cedar Grove
Health Insurance Coverage by Age in Cedar Grove
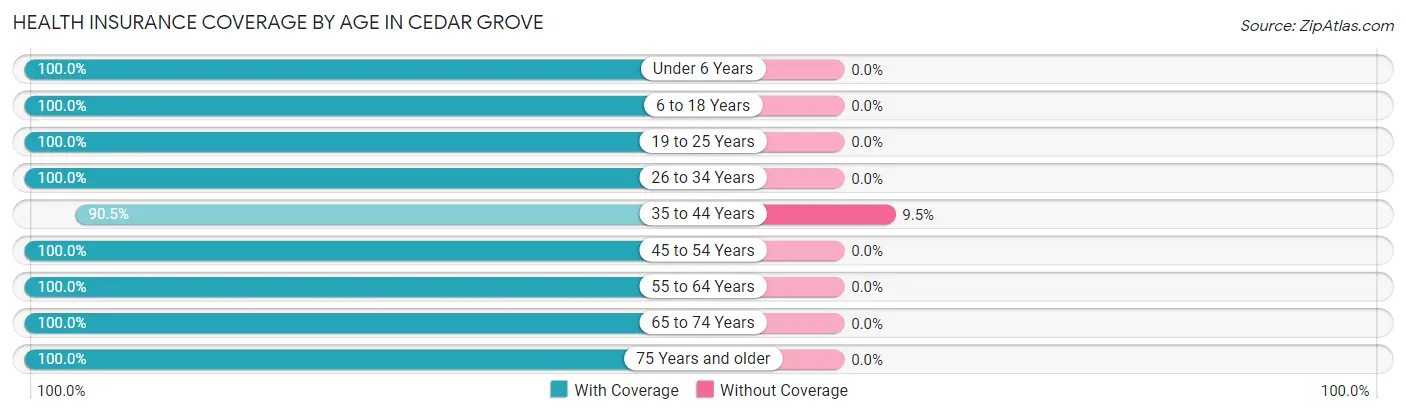
| Age Bracket | With Coverage | Without Coverage |
| Under 6 Years | 4 (100.0%) | 0 (0.0%) |
| 6 to 18 Years | 49 (100.0%) | 0 (0.0%) |
| 19 to 25 Years | 15 (100.0%) | 0 (0.0%) |
| 26 to 34 Years | 9 (100.0%) | 0 (0.0%) |
| 35 to 44 Years | 76 (90.5%) | 8 (9.5%) |
| 45 to 54 Years | 88 (100.0%) | 0 (0.0%) |
| 55 to 64 Years | 115 (100.0%) | 0 (0.0%) |
| 65 to 74 Years | 296 (100.0%) | 0 (0.0%) |
| 75 Years and older | 226 (100.0%) | 0 (0.0%) |
| Total | 878 (99.1%) | 8 (0.9%) |
Health Insurance Coverage by Citizenship Status in Cedar Grove

| Citizenship Status | With Coverage | Without Coverage |
| Native Born | 4 (100.0%) | 0 (0.0%) |
| Foreign Born, Citizen | 49 (100.0%) | 0 (0.0%) |
| Foreign Born, not a Citizen | 15 (100.0%) | 0 (0.0%) |
Health Insurance Coverage by Household Income in Cedar Grove
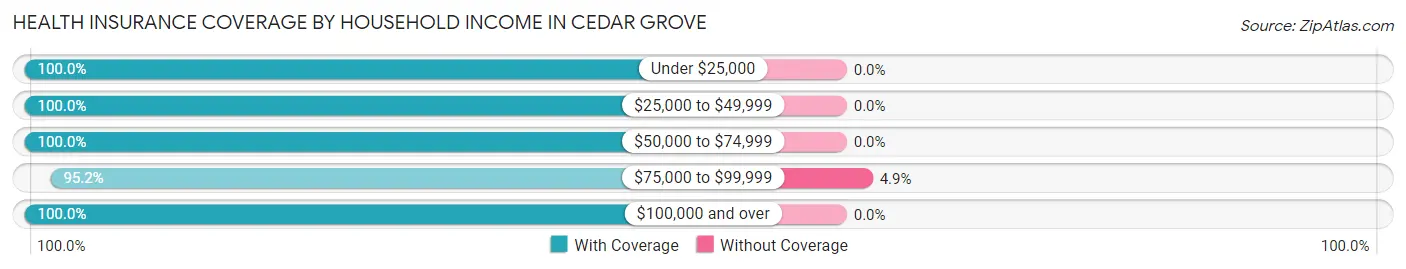
| Household Income | With Coverage | Without Coverage |
| Under $25,000 | 193 (100.0%) | 0 (0.0%) |
| $25,000 to $49,999 | 37 (100.0%) | 0 (0.0%) |
| $50,000 to $74,999 | 202 (100.0%) | 0 (0.0%) |
| $75,000 to $99,999 | 157 (95.2%) | 8 (4.9%) |
| $100,000 and over | 289 (100.0%) | 0 (0.0%) |
Public vs Private Health Insurance Coverage by Age in Cedar Grove
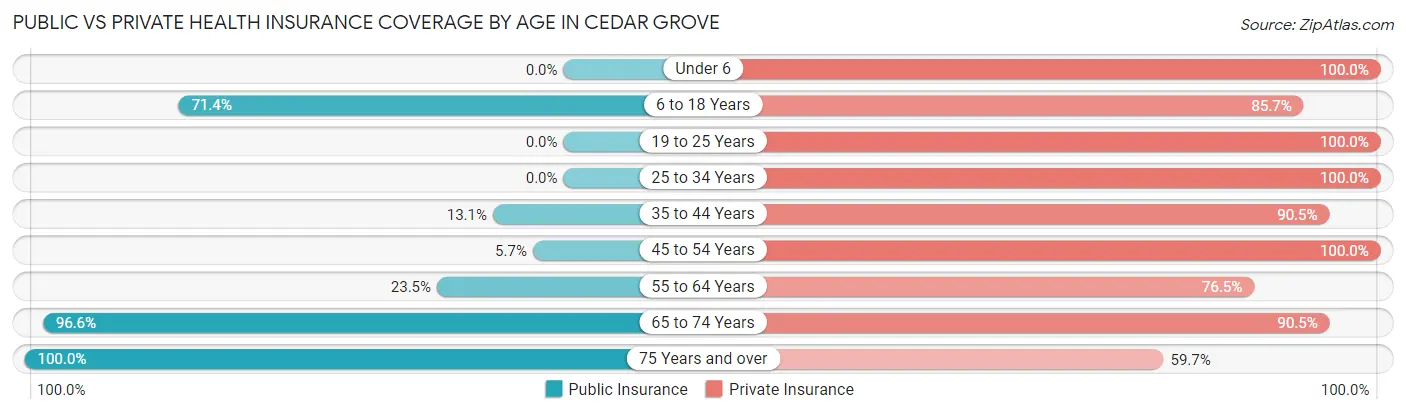
| Age Bracket | Public Insurance | Private Insurance |
| Under 6 | 0 (0.0%) | 4 (100.0%) |
| 6 to 18 Years | 35 (71.4%) | 42 (85.7%) |
| 19 to 25 Years | 0 (0.0%) | 15 (100.0%) |
| 25 to 34 Years | 0 (0.0%) | 9 (100.0%) |
| 35 to 44 Years | 11 (13.1%) | 76 (90.5%) |
| 45 to 54 Years | 5 (5.7%) | 88 (100.0%) |
| 55 to 64 Years | 27 (23.5%) | 88 (76.5%) |
| 65 to 74 Years | 286 (96.6%) | 268 (90.5%) |
| 75 Years and over | 226 (100.0%) | 135 (59.7%) |
| Total | 590 (66.6%) | 725 (81.8%) |
Disability Status by Sex by Age in Cedar Grove
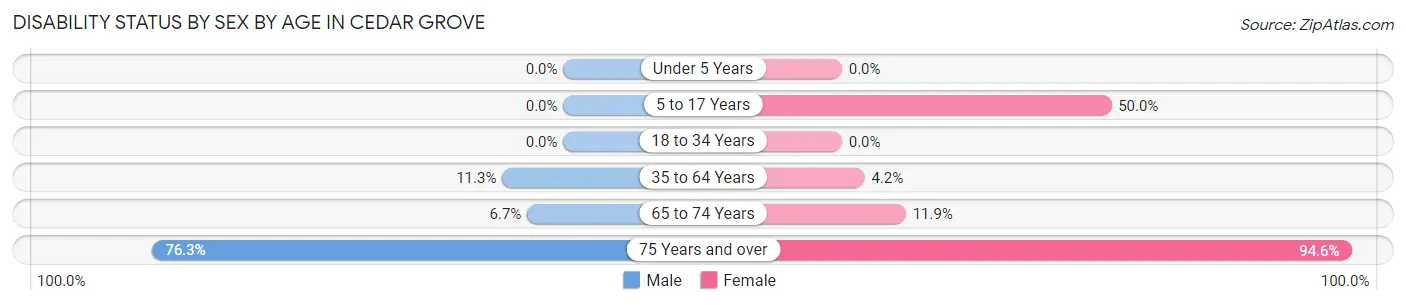
| Age Bracket | Male | Female |
| Under 5 Years | 0 (0.0%) | 0 (0.0%) |
| 5 to 17 Years | 0 (0.0%) | 7 (50.0%) |
| 18 to 34 Years | 0 (0.0%) | 0 (0.0%) |
| 35 to 64 Years | 11 (11.3%) | 8 (4.2%) |
| 65 to 74 Years | 8 (6.7%) | 21 (11.9%) |
| 75 Years and over | 74 (76.3%) | 122 (94.6%) |
Disability Class by Sex by Age in Cedar Grove
Disability Class: Hearing Difficulty
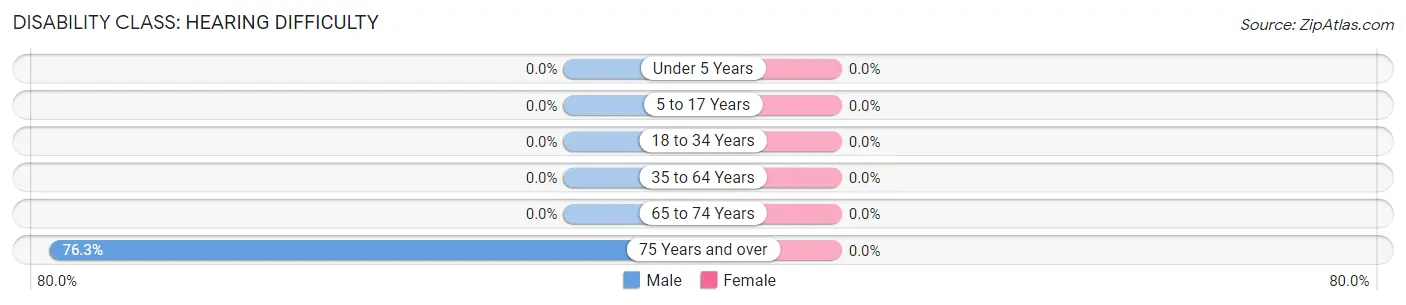
| Age Bracket | Male | Female |
| Under 5 Years | 0 (0.0%) | 0 (0.0%) |
| 5 to 17 Years | 0 (0.0%) | 0 (0.0%) |
| 18 to 34 Years | 0 (0.0%) | 0 (0.0%) |
| 35 to 64 Years | 0 (0.0%) | 0 (0.0%) |
| 65 to 74 Years | 0 (0.0%) | 0 (0.0%) |
| 75 Years and over | 74 (76.3%) | 0 (0.0%) |
Disability Class: Vision Difficulty
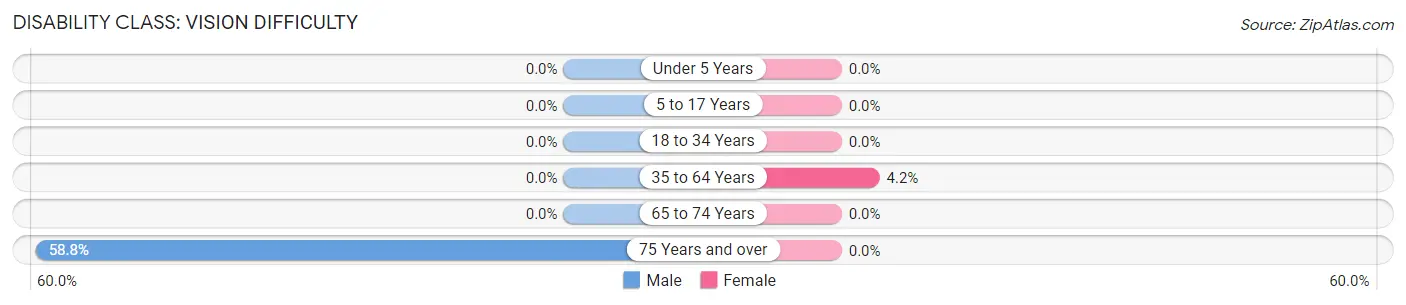
| Age Bracket | Male | Female |
| Under 5 Years | 0 (0.0%) | 0 (0.0%) |
| 5 to 17 Years | 0 (0.0%) | 0 (0.0%) |
| 18 to 34 Years | 0 (0.0%) | 0 (0.0%) |
| 35 to 64 Years | 0 (0.0%) | 8 (4.2%) |
| 65 to 74 Years | 0 (0.0%) | 0 (0.0%) |
| 75 Years and over | 57 (58.8%) | 0 (0.0%) |
Disability Class: Cognitive Difficulty
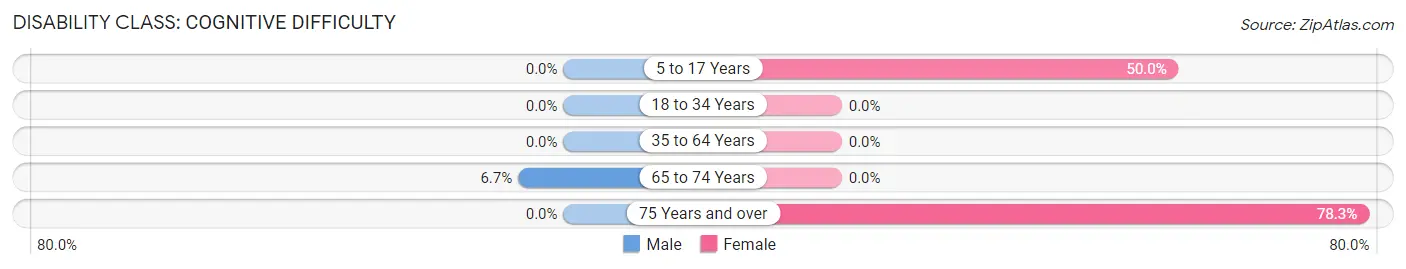
| Age Bracket | Male | Female |
| 5 to 17 Years | 0 (0.0%) | 7 (50.0%) |
| 18 to 34 Years | 0 (0.0%) | 0 (0.0%) |
| 35 to 64 Years | 0 (0.0%) | 0 (0.0%) |
| 65 to 74 Years | 8 (6.7%) | 0 (0.0%) |
| 75 Years and over | 0 (0.0%) | 101 (78.3%) |
Disability Class: Ambulatory Difficulty
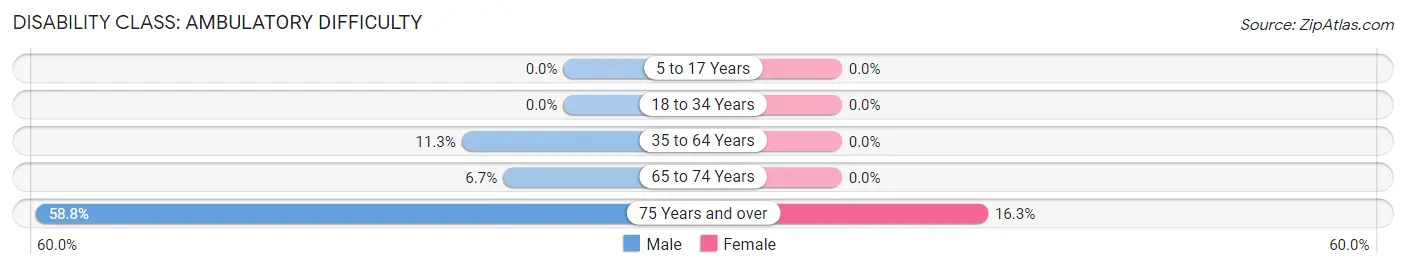
| Age Bracket | Male | Female |
| 5 to 17 Years | 0 (0.0%) | 0 (0.0%) |
| 18 to 34 Years | 0 (0.0%) | 0 (0.0%) |
| 35 to 64 Years | 11 (11.3%) | 0 (0.0%) |
| 65 to 74 Years | 8 (6.7%) | 0 (0.0%) |
| 75 Years and over | 57 (58.8%) | 21 (16.3%) |
Disability Class: Self-Care Difficulty
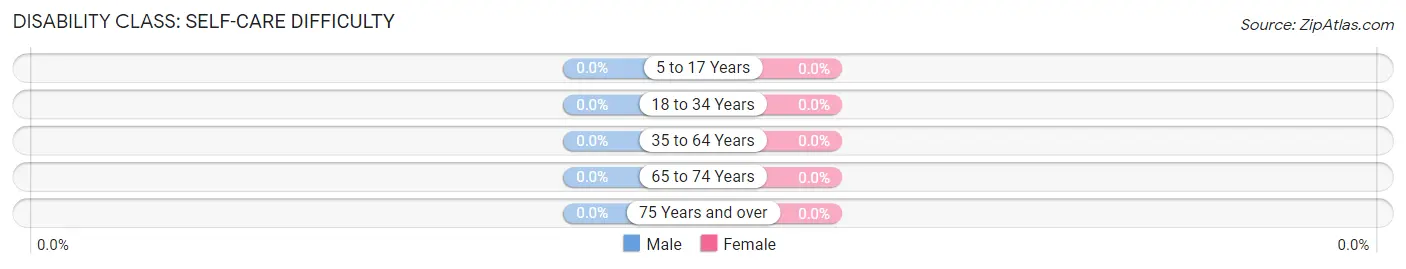
| Age Bracket | Male | Female |
| 5 to 17 Years | 0 (0.0%) | 0 (0.0%) |
| 18 to 34 Years | 0 (0.0%) | 0 (0.0%) |
| 35 to 64 Years | 0 (0.0%) | 0 (0.0%) |
| 65 to 74 Years | 0 (0.0%) | 0 (0.0%) |
| 75 Years and over | 0 (0.0%) | 0 (0.0%) |
Technology Access in Cedar Grove
Computing Device Access in Cedar Grove
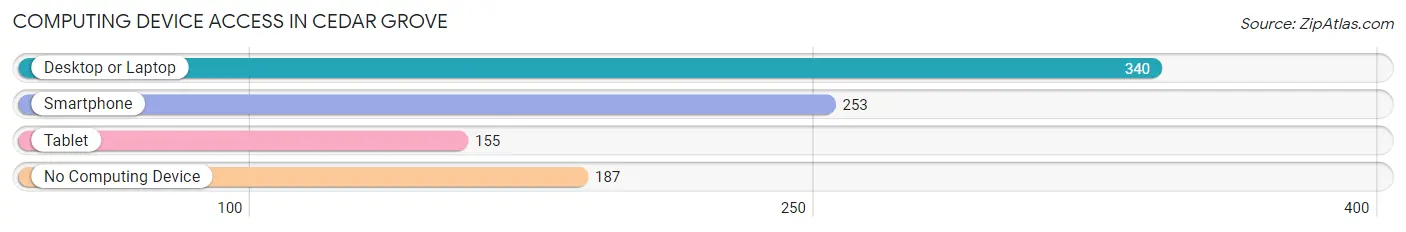
| Device Type | # Households | % Households |
| Desktop or Laptop | 340 | 60.3% |
| Smartphone | 253 | 44.9% |
| Tablet | 155 | 27.5% |
| No Computing Device | 187 | 33.2% |
| Total | 564 | 100.0% |
Internet Access in Cedar Grove
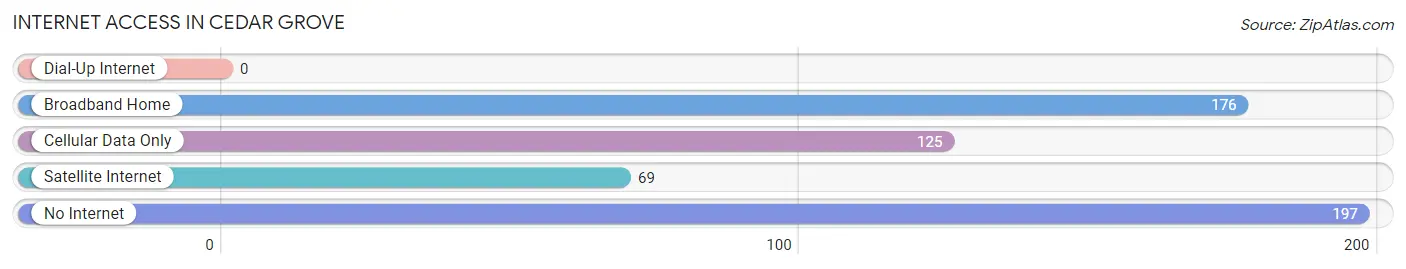
| Internet Type | # Households | % Households |
| Dial-Up Internet | 0 | 0.0% |
| Broadband Home | 176 | 31.2% |
| Cellular Data Only | 125 | 22.2% |
| Satellite Internet | 69 | 12.2% |
| No Internet | 197 | 34.9% |
| Total | 564 | 100.0% |
Cedar Grove Summary
Cedar Grove is a small unincorporated community located in the northwest corner of New Mexico, in the United States. It is situated in the foothills of the Sangre de Cristo Mountains, approximately 25 miles south of Taos. The area is known for its stunning views of the surrounding mountains and its proximity to the Rio Grande.
History
The area around Cedar Grove has been inhabited for thousands of years. The first known inhabitants were the Tewa people, who lived in the area for centuries before the arrival of Europeans. The Tewa were a peaceful people who lived in small villages and farmed the land.
In the late 1700s, Spanish settlers began to move into the area. They established small settlements and ranches, and the area became known as the “Cedar Grove” due to the abundance of cedar trees in the area.
In the late 1800s, the area was settled by Anglo-Americans, who established small farms and ranches. The area was also home to a number of small mining operations, which produced gold, silver, and other minerals.
In the early 1900s, the area was home to a number of small towns, including Cedar Grove, which was established in 1906. The town was named after the abundance of cedar trees in the area.
Geography
Cedar Grove is located in the northwest corner of New Mexico, in the foothills of the Sangre de Cristo Mountains. The area is known for its stunning views of the surrounding mountains and its proximity to the Rio Grande.
The area is characterized by rolling hills, with elevations ranging from 5,000 to 8,000 feet. The climate is semi-arid, with hot summers and cold winters.
Economy
The economy of Cedar Grove is largely based on agriculture and tourism. The area is home to a number of small farms and ranches, which produce a variety of crops, including hay, alfalfa, and vegetables.
The area is also home to a number of small businesses, including restaurants, stores, and lodging. Tourism is an important part of the local economy, as the area is known for its stunning views of the surrounding mountains and its proximity to the Rio Grande.
Demographics
As of the 2010 census, the population of Cedar Grove was 1,093. The population is largely Hispanic, with a small number of Anglo-Americans. The median household income is $30,000, and the median age is 37.
Conclusion
Cedar Grove is a small unincorporated community located in the northwest corner of New Mexico, in the United States. It is situated in the foothills of the Sangre de Cristo Mountains, approximately 25 miles south of Taos. The area is known for its stunning views of the surrounding mountains and its proximity to the Rio Grande. The economy of Cedar Grove is largely based on agriculture and tourism, and the population is largely Hispanic.
Common Questions
What is Per Capita Income in Cedar Grove?
Per Capita income in Cedar Grove is $50,569.
What is the Median Family Income in Cedar Grove?
Median Family Income in Cedar Grove is $95,156.
What is the Median Household income in Cedar Grove?
Median Household Income in Cedar Grove is $61,020.
What is Income or Wage Gap in Cedar Grove?
Income or Wage Gap in Cedar Grove is 2.0%.
Women in Cedar Grove earn 98.0 cents for every dollar earned by a man.
What is Inequality or Gini Index in Cedar Grove?
Inequality or Gini Index in Cedar Grove is 0.49.
What is the Total Population of Cedar Grove?
Total Population of Cedar Grove is 886.
What is the Total Male Population of Cedar Grove?
Total Male Population of Cedar Grove is 335.
What is the Total Female Population of Cedar Grove?
Total Female Population of Cedar Grove is 551.
What is the Ratio of Males per 100 Females in Cedar Grove?
There are 60.80 Males per 100 Females in Cedar Grove.
What is the Ratio of Females per 100 Males in Cedar Grove?
There are 164.48 Females per 100 Males in Cedar Grove.
What is the Median Population Age in Cedar Grove?
Median Population Age in Cedar Grove is 67.5 Years.
What is the Average Family Size in Cedar Grove
Average Family Size in Cedar Grove is 2.2 People.
What is the Average Household Size in Cedar Grove
Average Household Size in Cedar Grove is 1.6 People.
How Large is the Labor Force in Cedar Grove?
There are 300 People in the Labor Forcein in Cedar Grove.
What is the Percentage of People in the Labor Force in Cedar Grove?
34.6% of People are in the Labor Force in Cedar Grove.
What is the Unemployment Rate in Cedar Grove?
Unemployment Rate in Cedar Grove is 12.3%.