East Point, AL Map & Demographics
East Point Map
East Point Overview
$19,532
PER CAPITA INCOME
$78,821
AVG FAMILY INCOME
$78,703
AVG HOUSEHOLD INCOME
39.6%
WAGE / INCOME GAP [ % ]
60.4¢/ $1
WAGE / INCOME GAP [ $ ]
0.13
INEQUALITY / GINI INDEX
339
TOTAL POPULATION
142
MALE POPULATION
197
FEMALE POPULATION
72.08
MALES / 100 FEMALES
138.73
FEMALES / 100 MALES
25.1
MEDIAN AGE
4.7
AVG FAMILY SIZE
4.5
AVG HOUSEHOLD SIZE
170
LABOR FORCE [ PEOPLE ]
87.2%
PERCENT IN LABOR FORCE
2.9%
UNEMPLOYMENT RATE
Income in East Point
Income Overview in East Point
Per Capita Income in East Point is $19,532, while median incomes of families and households are $78,821 and $78,703 respectively.
| Characteristic | Number | Measure |
| Per Capita Income | 339 | $19,532 |
| Median Family Income | 70 | $78,821 |
| Mean Family Income | 70 | $84,626 |
| Median Household Income | 75 | $78,703 |
| Mean Household Income | 75 | $83,968 |
| Income Deficit | 70 | $0 |
| Wage / Income Gap (%) | 339 | 39.62% |
| Wage / Income Gap ($) | 339 | 60.38¢ per $1 |
| Gini / Inequality Index | 339 | 0.13 |
Earnings by Sex in East Point
Average Earnings in East Point are $32,986, $29,245 for men and $48,438 for women, a difference of 39.6%.
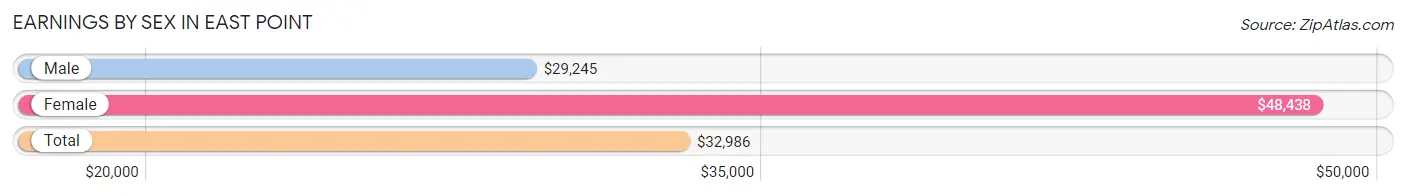
| Sex | Number | Average Earnings |
| Male | 110 (60.1%) | $29,245 |
| Female | 73 (39.9%) | $48,438 |
| Total | 183 (100.0%) | $32,986 |
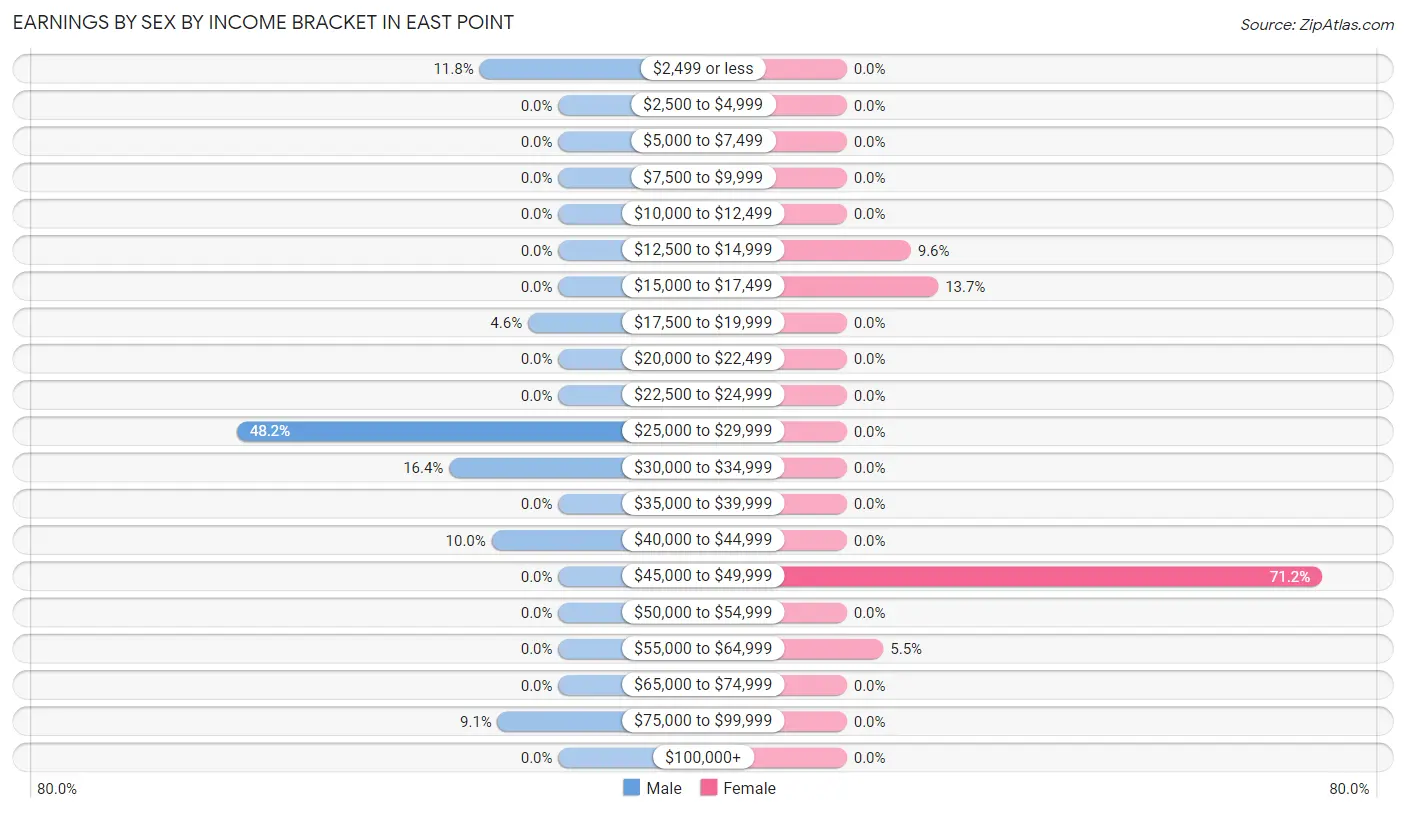
Earnings by Sex by Income Bracket in East Point
The most common earnings brackets in East Point are $25,000 to $29,999 for men (53 | 48.2%) and $45,000 to $49,999 for women (52 | 71.2%).
| Income | Male | Female |
| $2,499 or less | 13 (11.8%) | 0 (0.0%) |
| $2,500 to $4,999 | 0 (0.0%) | 0 (0.0%) |
| $5,000 to $7,499 | 0 (0.0%) | 0 (0.0%) |
| $7,500 to $9,999 | 0 (0.0%) | 0 (0.0%) |
| $10,000 to $12,499 | 0 (0.0%) | 0 (0.0%) |
| $12,500 to $14,999 | 0 (0.0%) | 7 (9.6%) |
| $15,000 to $17,499 | 0 (0.0%) | 10 (13.7%) |
| $17,500 to $19,999 | 5 (4.5%) | 0 (0.0%) |
| $20,000 to $22,499 | 0 (0.0%) | 0 (0.0%) |
| $22,500 to $24,999 | 0 (0.0%) | 0 (0.0%) |
| $25,000 to $29,999 | 53 (48.2%) | 0 (0.0%) |
| $30,000 to $34,999 | 18 (16.4%) | 0 (0.0%) |
| $35,000 to $39,999 | 0 (0.0%) | 0 (0.0%) |
| $40,000 to $44,999 | 11 (10.0%) | 0 (0.0%) |
| $45,000 to $49,999 | 0 (0.0%) | 52 (71.2%) |
| $50,000 to $54,999 | 0 (0.0%) | 0 (0.0%) |
| $55,000 to $64,999 | 0 (0.0%) | 4 (5.5%) |
| $65,000 to $74,999 | 0 (0.0%) | 0 (0.0%) |
| $75,000 to $99,999 | 10 (9.1%) | 0 (0.0%) |
| $100,000+ | 0 (0.0%) | 0 (0.0%) |
| Total | 110 (100.0%) | 73 (100.0%) |
Earnings by Sex by Educational Attainment in East Point
| Educational Attainment | Male Income | Female Income |
| Less than High School | - | - |
| High School Diploma | - | - |
| College or Associate's Degree | - | - |
| Bachelor's Degree | - | - |
| Graduate Degree | - | - |
| Total | $29,552 | $48,438 |
Family Income in East Point
Family Income Brackets in East Point
According to the East Point family income data, there are 53 families falling into the $75,000 to $99,999 income range, which is the most common income bracket and makes up 75.7% of all families.
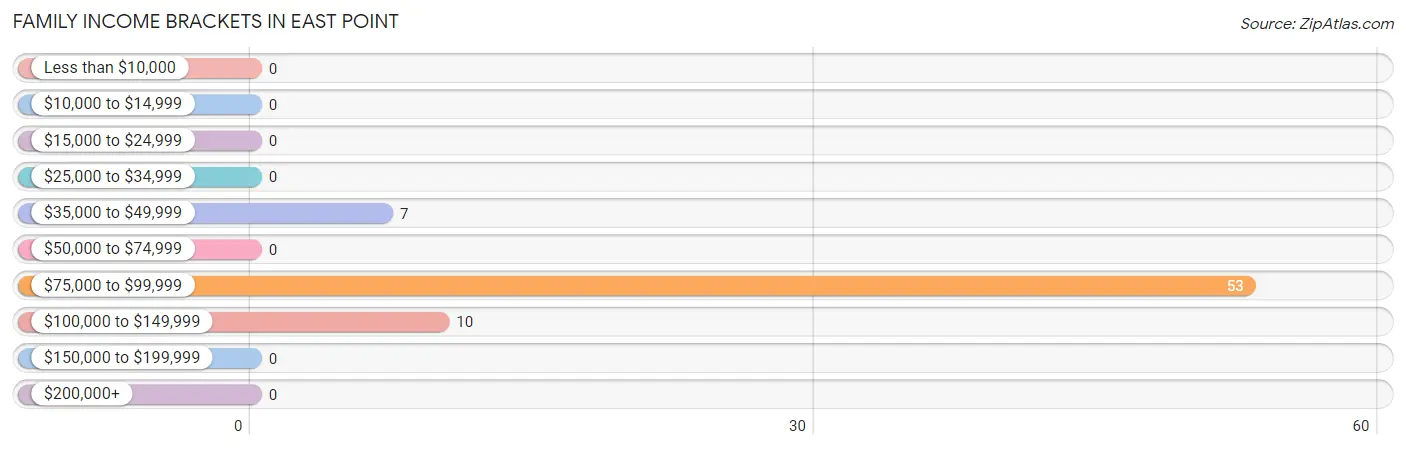
| Income Bracket | # Families | % Families |
| Less than $10,000 | 0 | 0.0% |
| $10,000 to $14,999 | 0 | 0.0% |
| $15,000 to $24,999 | 0 | 0.0% |
| $25,000 to $34,999 | 0 | 0.0% |
| $35,000 to $49,999 | 7 | 10.0% |
| $50,000 to $74,999 | 0 | 0.0% |
| $75,000 to $99,999 | 53 | 75.7% |
| $100,000 to $149,999 | 10 | 14.3% |
| $150,000 to $199,999 | 0 | 0.0% |
| $200,000+ | 0 | 0.0% |
Family Income by Famaliy Size in East Point
| Income Bracket | # Families | Median Income |
| 2-Person Families | 0 (0.0%) | $0 |
| 3-Person Families | 10 (14.3%) | $0 |
| 4-Person Families | 53 (75.7%) | $0 |
| 5-Person Families | 0 (0.0%) | $0 |
| 6-Person Families | 0 (0.0%) | $0 |
| 7+ Person Families | 7 (10.0%) | $0 |
| Total | 70 (100.0%) | $78,821 |
Family Income by Number of Earners in East Point
| Number of Earners | # Families | Median Income |
| No Earners | 0 (0.0%) | $0 |
| 1 Earner | 0 (0.0%) | $0 |
| 2 Earners | 53 (75.7%) | $0 |
| 3+ Earners | 17 (24.3%) | $0 |
| Total | 70 (100.0%) | $78,821 |
Household Income in East Point
Household Income Brackets in East Point
With 53 households falling in the category, the $75,000 to $99,999 income range is the most frequent in East Point, accounting for 70.7% of all households.
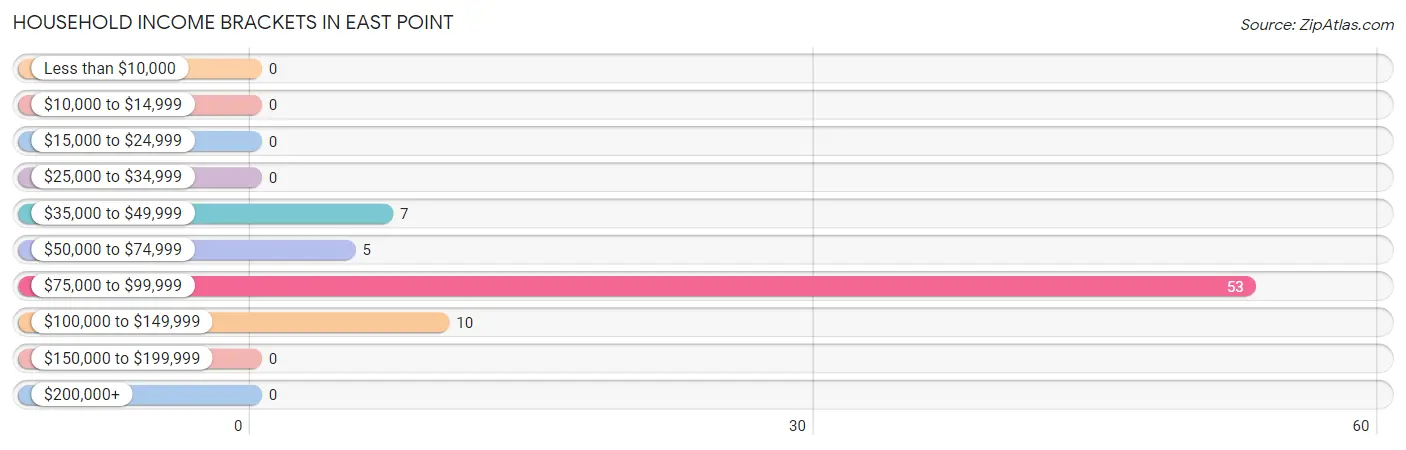
| Income Bracket | # Households | % Households |
| Less than $10,000 | 0 | 0.0% |
| $10,000 to $14,999 | 0 | 0.0% |
| $15,000 to $24,999 | 0 | 0.0% |
| $25,000 to $34,999 | 0 | 0.0% |
| $35,000 to $49,999 | 7 | 9.3% |
| $50,000 to $74,999 | 5 | 6.7% |
| $75,000 to $99,999 | 53 | 70.7% |
| $100,000 to $149,999 | 10 | 13.3% |
| $150,000 to $199,999 | 0 | 0.0% |
| $200,000+ | 0 | 0.0% |
Household Income by Householder Age in East Point
The median household income in East Point is $78,703, with the highest median household income of $78,467 found in the 25 to 44 years age bracket for the primary householder. A total of 65 households (86.7%) fall into this category.
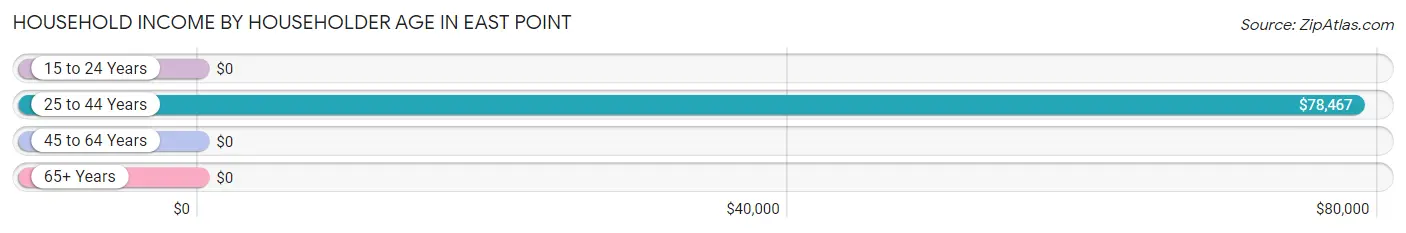
| Income Bracket | # Households | Median Income |
| 15 to 24 Years | 0 (0.0%) | $0 |
| 25 to 44 Years | 65 (86.7%) | $78,467 |
| 45 to 64 Years | 10 (13.3%) | $0 |
| 65+ Years | 0 (0.0%) | $0 |
| Total | 75 (100.0%) | $78,703 |
Poverty in East Point
Income Below Poverty by Sex and Age in East Point
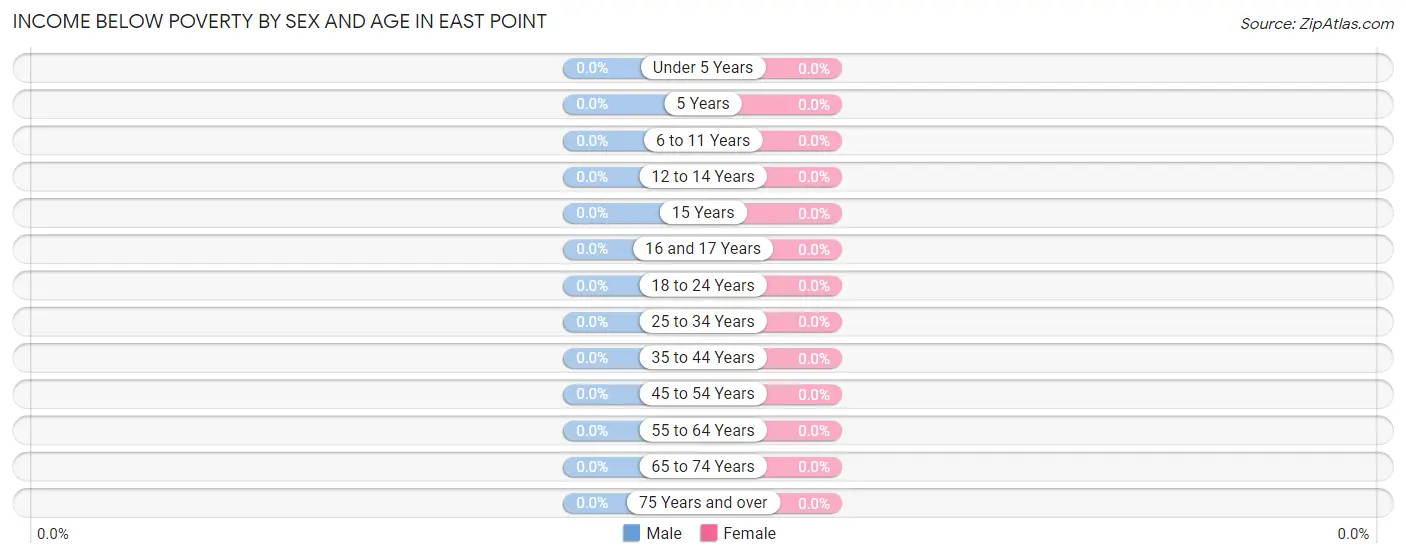
| Age Bracket | Male | Female |
| Under 5 Years | 0 (0.0%) | 0 (0.0%) |
| 5 Years | 0 (0.0%) | 0 (0.0%) |
| 6 to 11 Years | 0 (0.0%) | 0 (0.0%) |
| 12 to 14 Years | 0 (0.0%) | 0 (0.0%) |
| 15 Years | 0 (0.0%) | 0 (0.0%) |
| 16 and 17 Years | 0 (0.0%) | 0 (0.0%) |
| 18 to 24 Years | 0 (0.0%) | 0 (0.0%) |
| 25 to 34 Years | 0 (0.0%) | 0 (0.0%) |
| 35 to 44 Years | 0 (0.0%) | 0 (0.0%) |
| 45 to 54 Years | 0 (0.0%) | 0 (0.0%) |
| 55 to 64 Years | 0 (0.0%) | 0 (0.0%) |
| 65 to 74 Years | 0 (0.0%) | 0 (0.0%) |
| 75 Years and over | 0 (0.0%) | 0 (0.0%) |
| Total | 0 (0.0%) | 0 (0.0%) |
Income Above Poverty by Sex and Age in East Point
According to the poverty statistics in East Point, males aged under 5 years and females aged under 5 years are the age groups that are most secure financially, with 100.0% of males and 100.0% of females in these age groups living above the poverty line.
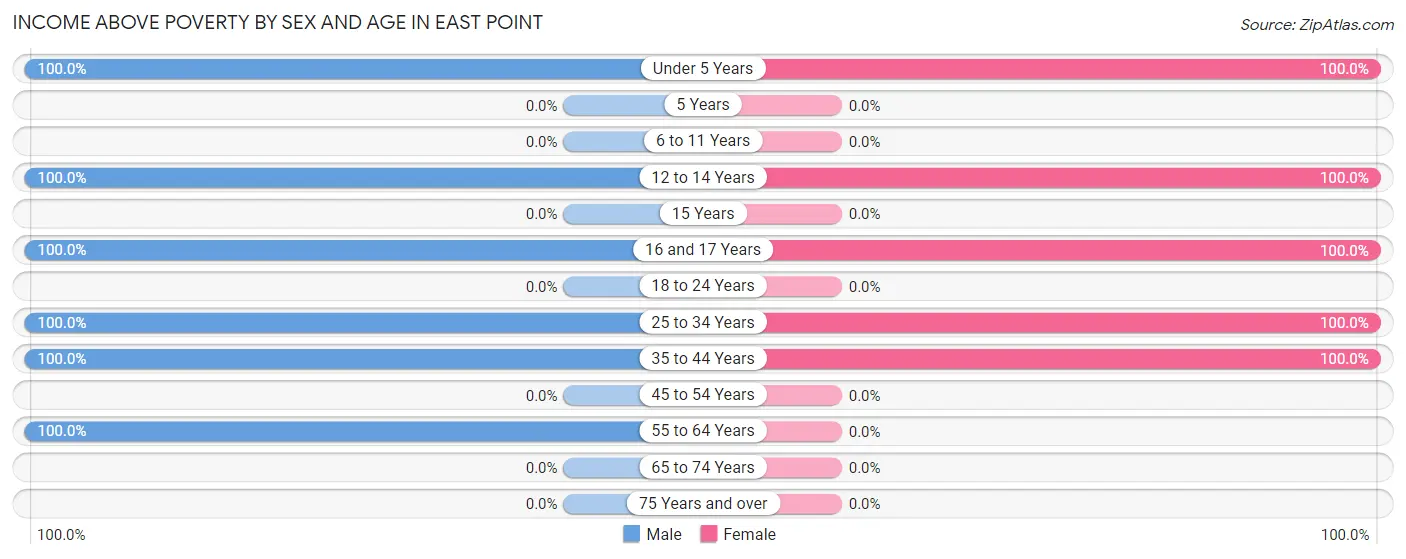
| Age Bracket | Male | Female |
| Under 5 Years | 16 (100.0%) | 54 (100.0%) |
| 5 Years | 0 (0.0%) | 0 (0.0%) |
| 6 to 11 Years | 0 (0.0%) | 0 (0.0%) |
| 12 to 14 Years | 16 (100.0%) | 58 (100.0%) |
| 15 Years | 0 (0.0%) | 0 (0.0%) |
| 16 and 17 Years | 13 (100.0%) | 12 (100.0%) |
| 18 to 24 Years | 0 (0.0%) | 0 (0.0%) |
| 25 to 34 Years | 23 (100.0%) | 56 (100.0%) |
| 35 to 44 Years | 64 (100.0%) | 17 (100.0%) |
| 45 to 54 Years | 0 (0.0%) | 0 (0.0%) |
| 55 to 64 Years | 10 (100.0%) | 0 (0.0%) |
| 65 to 74 Years | 0 (0.0%) | 0 (0.0%) |
| 75 Years and over | 0 (0.0%) | 0 (0.0%) |
| Total | 142 (100.0%) | 197 (100.0%) |
Income Below Poverty Among Married-Couple Families in East Point
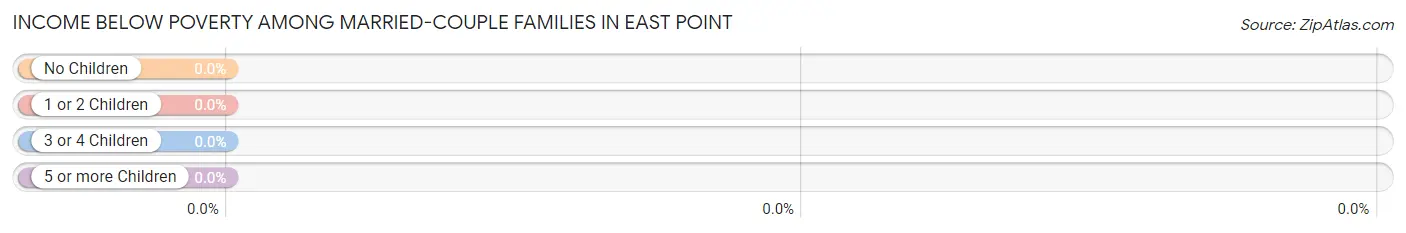
| Children | Above Poverty | Below Poverty |
| No Children | 0 (0.0%) | 0 (0.0%) |
| 1 or 2 Children | 53 (100.0%) | 0 (0.0%) |
| 3 or 4 Children | 0 (0.0%) | 0 (0.0%) |
| 5 or more Children | 7 (100.0%) | 0 (0.0%) |
| Total | 60 (100.0%) | 0 (0.0%) |
Income Below Poverty Among Single-Parent Households in East Point
| Children | Single Father | Single Mother |
| No Children | 0 (0.0%) | 0 (0.0%) |
| 1 or 2 Children | 0 (0.0%) | 0 (0.0%) |
| 3 or 4 Children | 0 (0.0%) | 0 (0.0%) |
| 5 or more Children | 0 (0.0%) | 0 (0.0%) |
| Total | 0 (0.0%) | 0 (0.0%) |
Income Below Poverty Among Married-Couple vs Single-Parent Households in East Point
| Children | Married-Couple Families | Single-Parent Households |
| No Children | 0 (0.0%) | 0 (0.0%) |
| 1 or 2 Children | 0 (0.0%) | 0 (0.0%) |
| 3 or 4 Children | 0 (0.0%) | 0 (0.0%) |
| 5 or more Children | 0 (0.0%) | 0 (0.0%) |
| Total | 0 (0.0%) | 0 (0.0%) |
Race in East Point
The most populous races in East Point are , and White / Caucasian (339 | 100.0%).
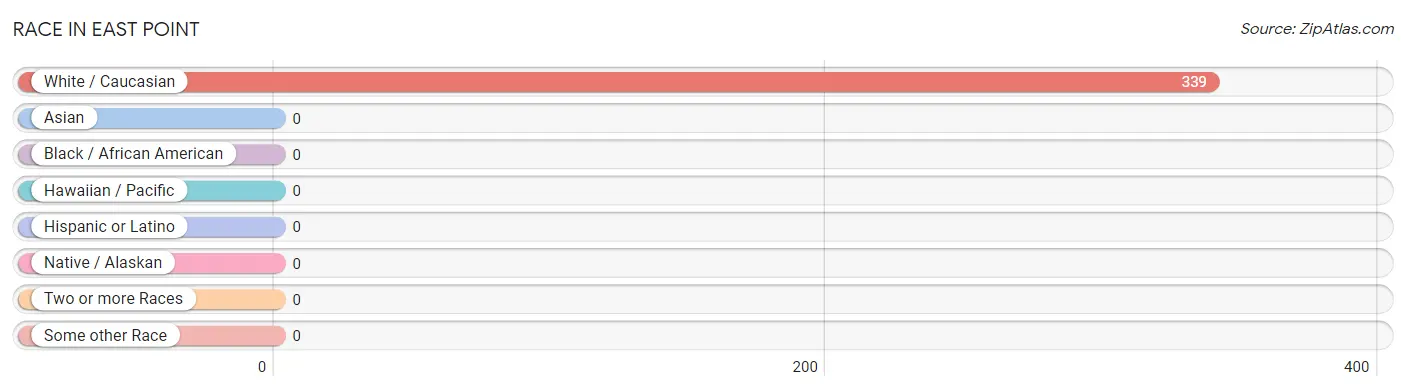
| Race | # Population | % Population |
| Asian | 0 | 0.0% |
| Black / African American | 0 | 0.0% |
| Hawaiian / Pacific | 0 | 0.0% |
| Hispanic or Latino | 0 | 0.0% |
| Native / Alaskan | 0 | 0.0% |
| White / Caucasian | 339 | 100.0% |
| Two or more Races | 0 | 0.0% |
| Some other Race | 0 | 0.0% |
| Total | 339 | 100.0% |
Ancestry in East Point
The most populous ancestries reported in East Point are Scotch-Irish (152 | 44.8%), and Polish (151 | 44.5%), together accounting for 89.4% of all East Point residents.
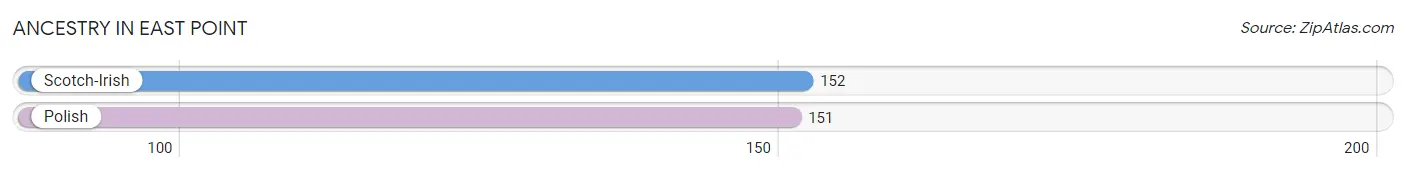
| Ancestry | # Population | % Population |
| Polish | 151 | 44.5% |
| Scotch-Irish | 152 | 44.8% | View All 2 Rows |
Immigrants in East Point

| Immigration Origin | # Population | % Population | View All 0 Rows |
Sex and Age in East Point
Sex and Age in East Point
The most populous age groups in East Point are 40 to 44 Years (53 | 37.3%) for men and 10 to 14 Years (58 | 29.4%) for women.
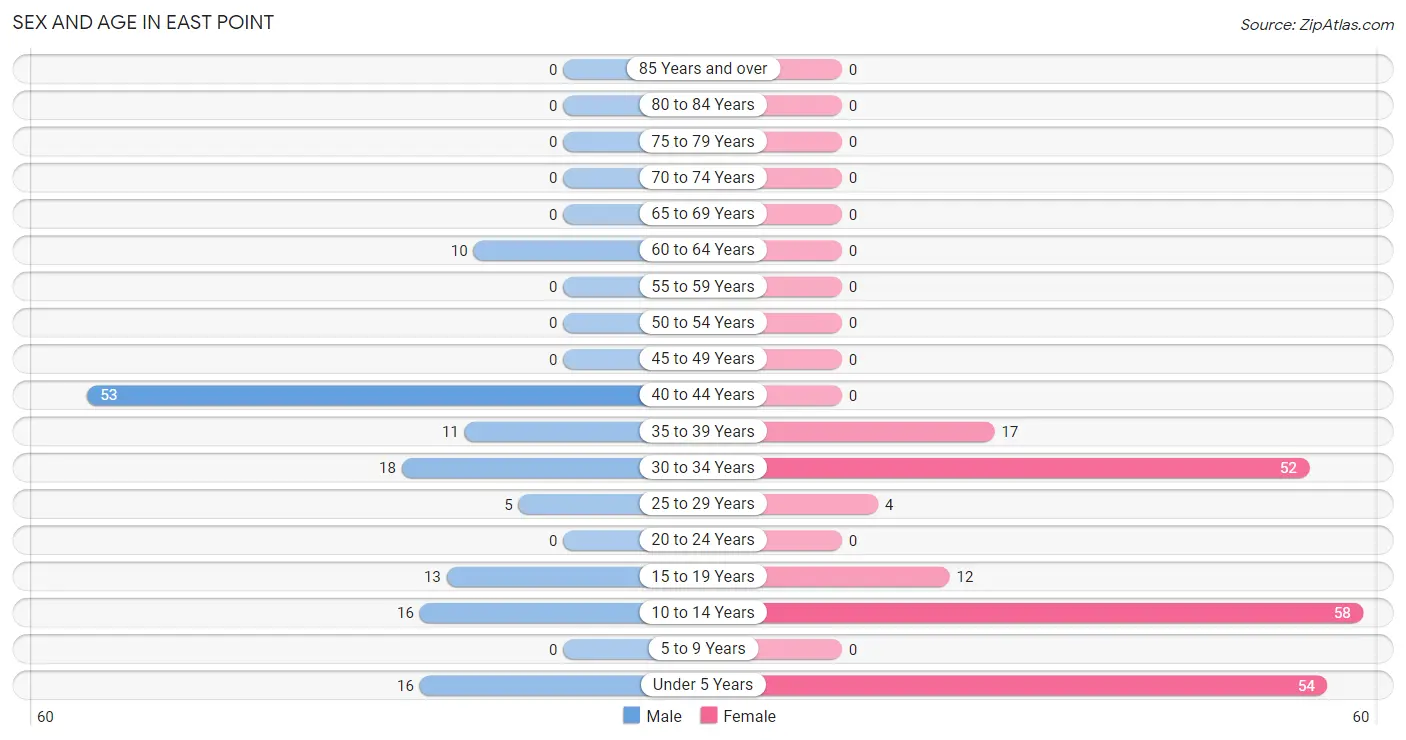
| Age Bracket | Male | Female |
| Under 5 Years | 16 (11.3%) | 54 (27.4%) |
| 5 to 9 Years | 0 (0.0%) | 0 (0.0%) |
| 10 to 14 Years | 16 (11.3%) | 58 (29.4%) |
| 15 to 19 Years | 13 (9.1%) | 12 (6.1%) |
| 20 to 24 Years | 0 (0.0%) | 0 (0.0%) |
| 25 to 29 Years | 5 (3.5%) | 4 (2.0%) |
| 30 to 34 Years | 18 (12.7%) | 52 (26.4%) |
| 35 to 39 Years | 11 (7.7%) | 17 (8.6%) |
| 40 to 44 Years | 53 (37.3%) | 0 (0.0%) |
| 45 to 49 Years | 0 (0.0%) | 0 (0.0%) |
| 50 to 54 Years | 0 (0.0%) | 0 (0.0%) |
| 55 to 59 Years | 0 (0.0%) | 0 (0.0%) |
| 60 to 64 Years | 10 (7.0%) | 0 (0.0%) |
| 65 to 69 Years | 0 (0.0%) | 0 (0.0%) |
| 70 to 74 Years | 0 (0.0%) | 0 (0.0%) |
| 75 to 79 Years | 0 (0.0%) | 0 (0.0%) |
| 80 to 84 Years | 0 (0.0%) | 0 (0.0%) |
| 85 Years and over | 0 (0.0%) | 0 (0.0%) |
| Total | 142 (100.0%) | 197 (100.0%) |
Families and Households in East Point
Median Family Size in East Point
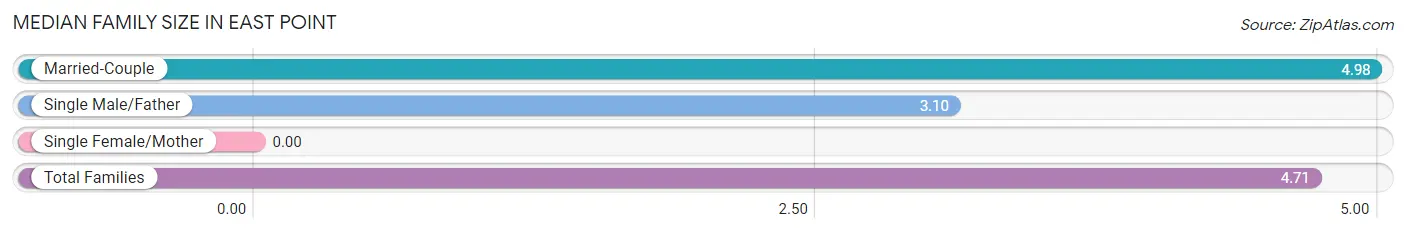
| Family Type | # Families | Family Size |
| Married-Couple | 60 (85.7%) | 4.98 |
| Single Male/Father | 10 (14.3%) | 3.10 |
| Single Female/Mother | 0 (0.0%) | - |
| Total Families | 70 (100.0%) | 4.71 |
Median Household Size in East Point
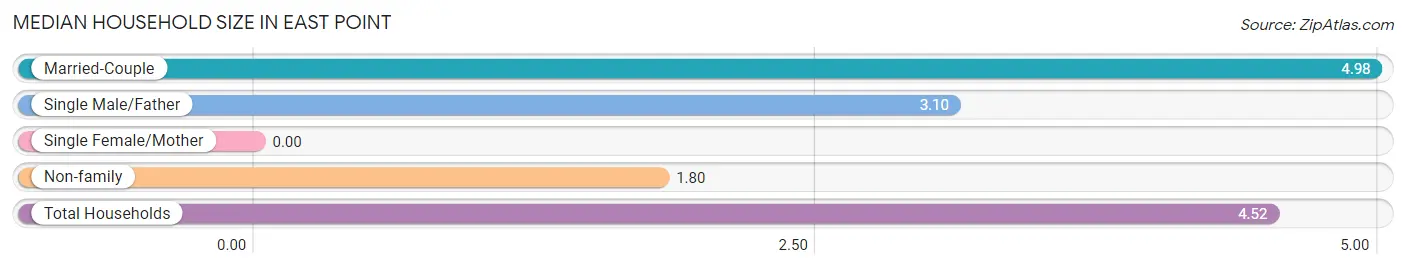
| Household Type | # Households | Household Size |
| Married-Couple | 60 (80.0%) | 4.98 |
| Single Male/Father | 10 (13.3%) | 3.10 |
| Single Female/Mother | 0 (0.0%) | - |
| Non-family | 5 (6.7%) | 1.80 |
| Total Households | 75 (100.0%) | 4.52 |
Household Size by Marriage Status in East Point
Out of a total of 75 households in East Point, 70 (93.3%) are family households, while 5 (6.7%) are nonfamily households. The most numerous type of family households are 4-person households, comprising 53, and the most common type of nonfamily households are 2-person households, comprising 5.
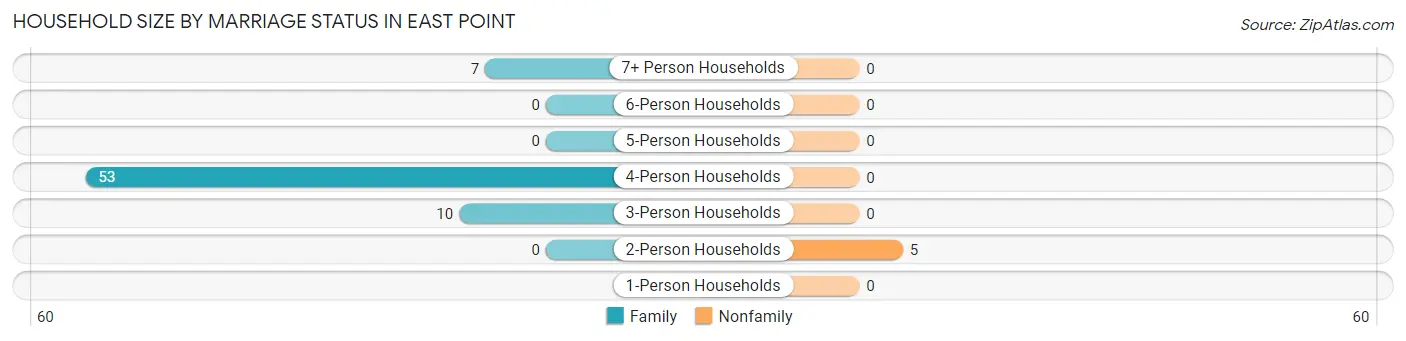
| Household Size | Family Households | Nonfamily Households |
| 1-Person Households | - | 0 (0.0%) |
| 2-Person Households | 0 (0.0%) | 5 (6.7%) |
| 3-Person Households | 10 (13.3%) | 0 (0.0%) |
| 4-Person Households | 53 (70.7%) | 0 (0.0%) |
| 5-Person Households | 0 (0.0%) | 0 (0.0%) |
| 6-Person Households | 0 (0.0%) | 0 (0.0%) |
| 7+ Person Households | 7 (9.3%) | 0 (0.0%) |
| Total | 70 (93.3%) | 5 (6.7%) |
Female Fertility in East Point
Fertility by Age in East Point
| Age Bracket | Women with Births | Births / 1,000 Women |
| 15 to 19 years | 0 (0.0%) | 0.0 |
| 20 to 34 years | 0 (0.0%) | 0.0 |
| 35 to 50 years | 0 (0.0%) | 0.0 |
| Total | 0 (0.0%) | 0.0 |
Fertility by Age by Marriage Status in East Point
| Age Bracket | Married | Unmarried |
| 15 to 19 years | 0 (0.0%) | 0 (0.0%) |
| 20 to 34 years | 0 (0.0%) | 0 (0.0%) |
| 35 to 50 years | 0 (0.0%) | 0 (0.0%) |
| Total | 0 (0.0%) | 0 (0.0%) |
Fertility by Education in East Point
| Educational Attainment | Women with Births | Births / 1,000 Women |
| Less than High School | 0 (0.0%) | 0.0 |
| High School Diploma | 0 (0.0%) | 0.0 |
| College or Associate's Degree | 0 (0.0%) | 0.0 |
| Bachelor's Degree | 0 (0.0%) | 0.0 |
| Graduate Degree | 0 (0.0%) | 0.0 |
| Total | 0 (0.0%) | 0.0 |
Fertility by Education by Marriage Status in East Point
| Educational Attainment | Married | Unmarried |
| Less than High School | 0 (0.0%) | 0 (0.0%) |
| High School Diploma | 0 (0.0%) | 0 (0.0%) |
| College or Associate's Degree | 0 (0.0%) | 0 (0.0%) |
| Bachelor's Degree | 0 (0.0%) | 0 (0.0%) |
| Graduate Degree | 0 (0.0%) | 0 (0.0%) |
| Total | 0 (0.0%) | 0 (0.0%) |
Employment Characteristics in East Point
Employment by Class of Employer in East Point
Among the 165 employed individuals in East Point, private company employees (161 | 97.6%), and local government employees (4 | 2.4%) make up the most common classes of employment.
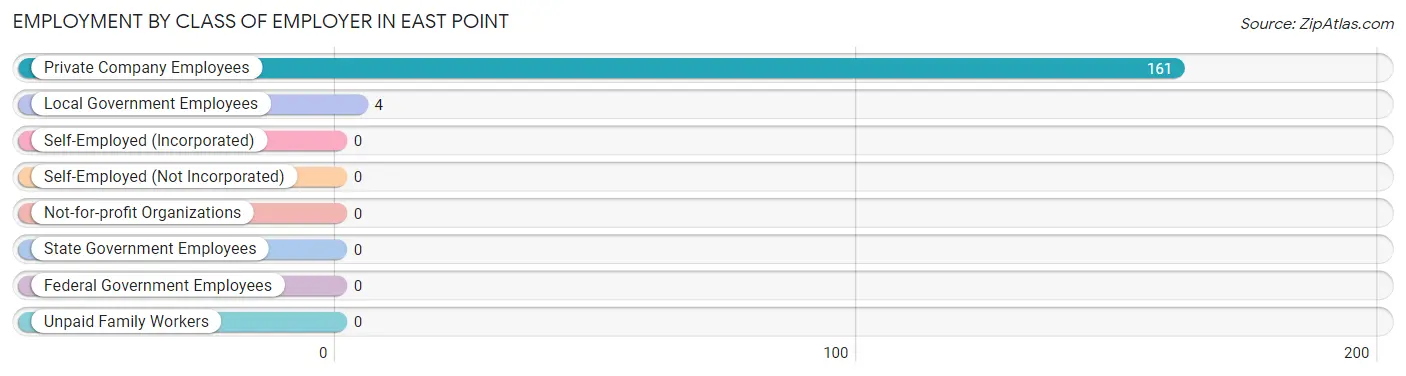
| Employer Class | # Employees | % Employees |
| Private Company Employees | 161 | 97.6% |
| Self-Employed (Incorporated) | 0 | 0.0% |
| Self-Employed (Not Incorporated) | 0 | 0.0% |
| Not-for-profit Organizations | 0 | 0.0% |
| Local Government Employees | 4 | 2.4% |
| State Government Employees | 0 | 0.0% |
| Federal Government Employees | 0 | 0.0% |
| Unpaid Family Workers | 0 | 0.0% |
| Total | 165 | 100.0% |
Employment Status by Age in East Point
According to the labor force statistics for East Point, out of the total population over 16 years of age (195), 87.2% or 170 individuals are in the labor force, with 2.9% or 5 of them unemployed. The age group with the highest labor force participation rate is 25 to 29 years, with 100.0% or 9 individuals in the labor force. Within the labor force, the 25 to 29 years age range has the highest percentage of unemployed individuals, with 55.6% or 5 of them being unemployed.
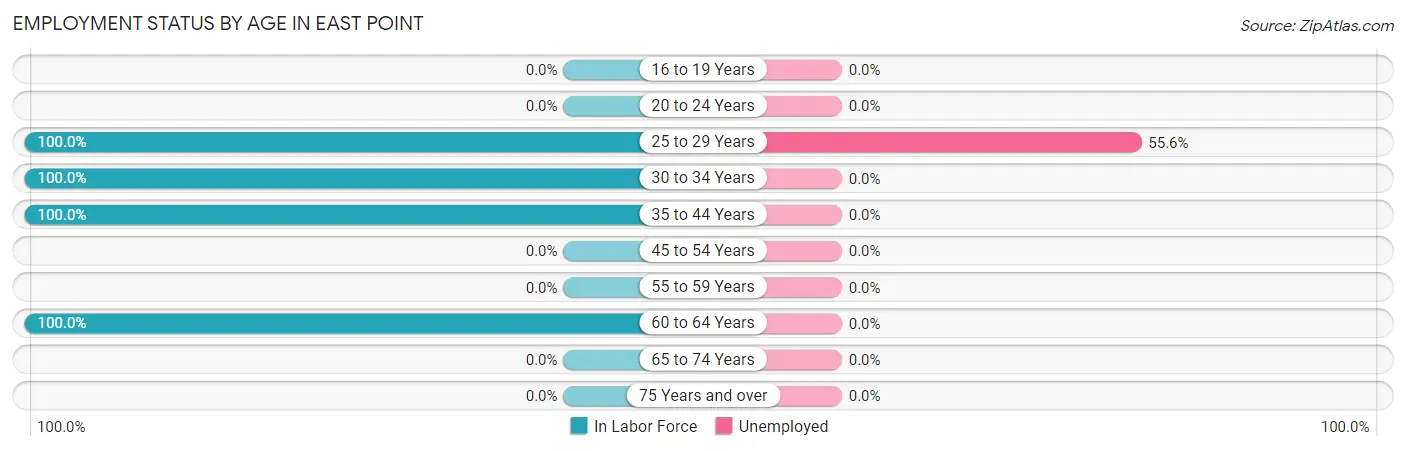
| Age Bracket | In Labor Force | Unemployed |
| 16 to 19 Years | 0 (0.0%) | 0 (0.0%) |
| 20 to 24 Years | 0 (0.0%) | 0 (0.0%) |
| 25 to 29 Years | 9 (100.0%) | 5 (55.6%) |
| 30 to 34 Years | 70 (100.0%) | 0 (0.0%) |
| 35 to 44 Years | 81 (100.0%) | 0 (0.0%) |
| 45 to 54 Years | 0 (0.0%) | 0 (0.0%) |
| 55 to 59 Years | 0 (0.0%) | 0 (0.0%) |
| 60 to 64 Years | 10 (100.0%) | 0 (0.0%) |
| 65 to 74 Years | 0 (0.0%) | 0 (0.0%) |
| 75 Years and over | 0 (0.0%) | 0 (0.0%) |
| Total | 170 (87.2%) | 5 (2.9%) |
Employment Status by Educational Attainment in East Point
According to labor force statistics for East Point, 100.0% of individuals (170) out of the total population between 25 and 64 years of age (170) are in the labor force, with 2.9% or 5 of them being unemployed. The group with the highest labor force participation rate are those with the educational attainment of less than high school, with 100.0% or 18 individuals in the labor force. Within the labor force, individuals with high school diploma education have the highest percentage of unemployment, with 25.0% or 5 of them being unemployed.
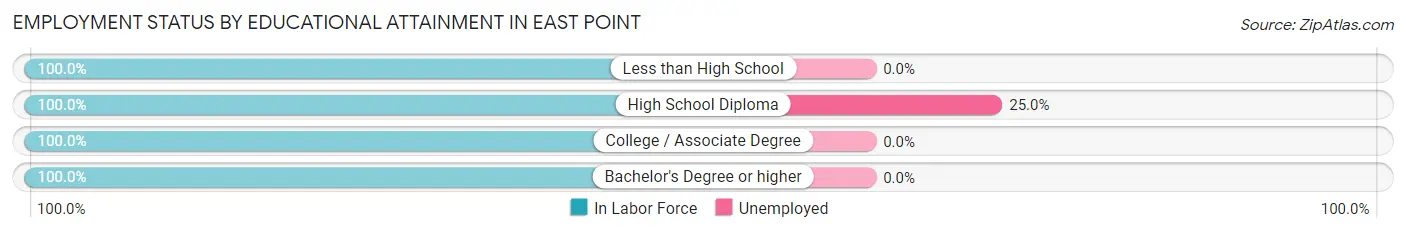
| Educational Attainment | In Labor Force | Unemployed |
| Less than High School | 18 (100.0%) | 0 (0.0%) |
| High School Diploma | 20 (100.0%) | 5 (25.0%) |
| College / Associate Degree | 122 (100.0%) | 0 (0.0%) |
| Bachelor's Degree or higher | 10 (100.0%) | 0 (0.0%) |
| Total | 170 (100.0%) | 5 (2.9%) |
Employment Occupations by Sex in East Point
Management, Business, Science and Arts Occupations
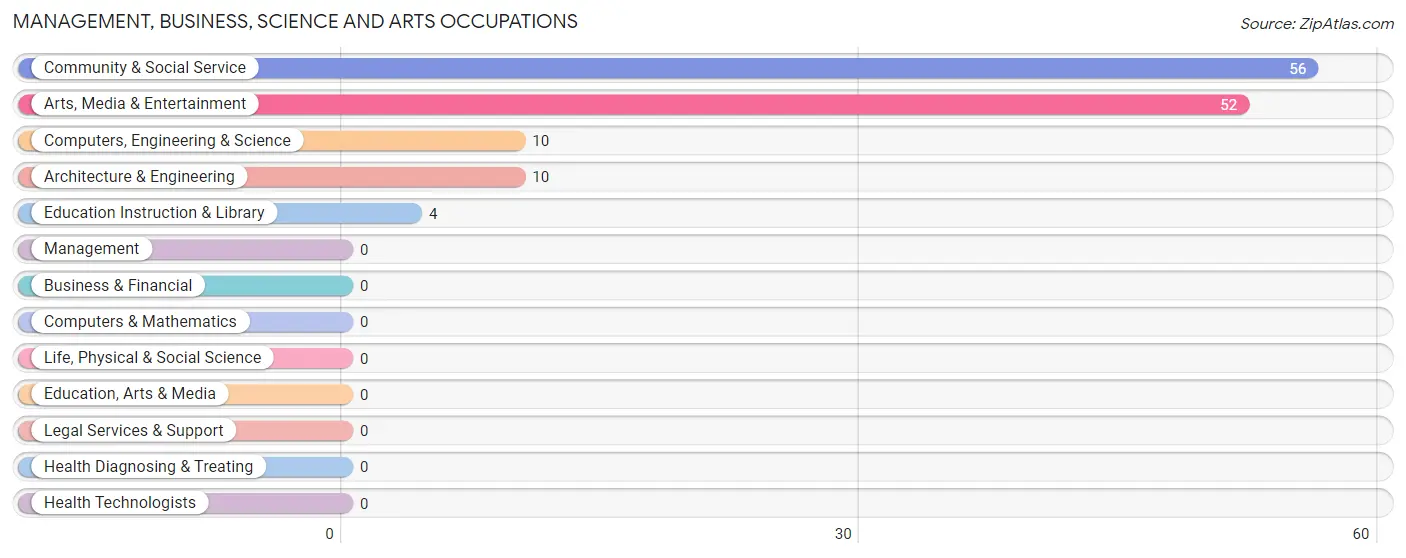
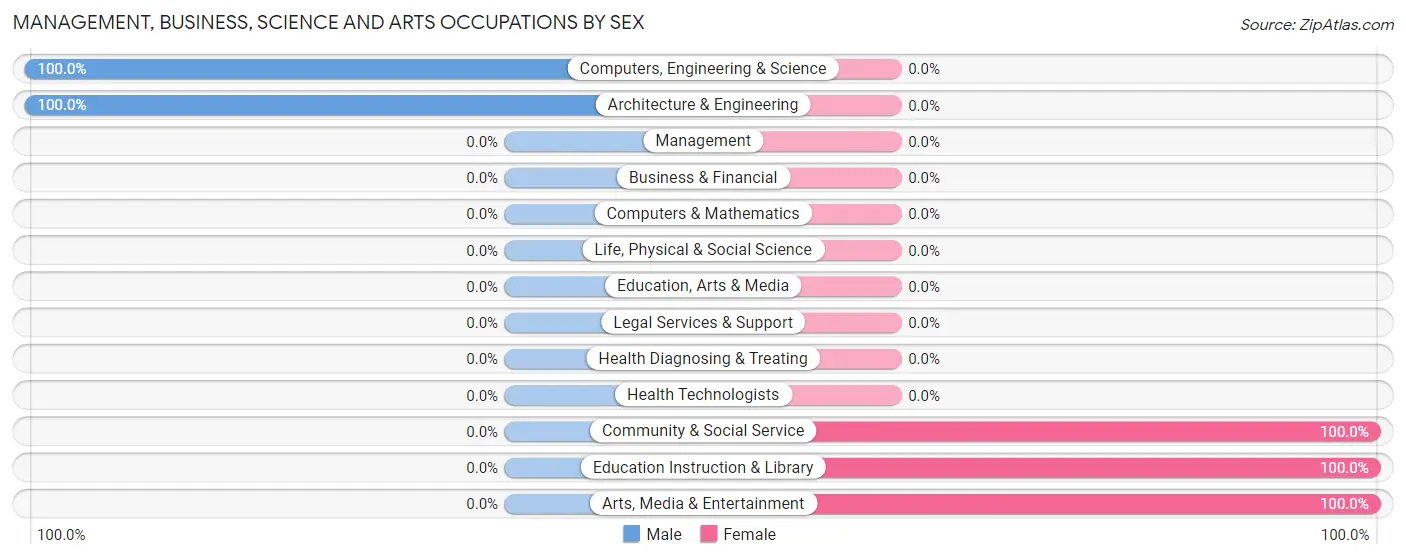
The most common Management, Business, Science and Arts occupations in East Point are Community & Social Service (56 | 33.9%), Arts, Media & Entertainment (52 | 31.5%), Computers, Engineering & Science (10 | 6.1%), Architecture & Engineering (10 | 6.1%), and Education Instruction & Library (4 | 2.4%).
Management, Business, Science and Arts Occupations by Sex
Within the Management, Business, Science and Arts occupations in East Point, the most male-oriented occupations are Computers, Engineering & Science (100.0%), and Architecture & Engineering (100.0%), while the most female-oriented occupations are Community & Social Service (100.0%), Education Instruction & Library (100.0%), and Arts, Media & Entertainment (100.0%).
| Occupation | Male | Female |
| Management | 0 (0.0%) | 0 (0.0%) |
| Business & Financial | 0 (0.0%) | 0 (0.0%) |
| Computers, Engineering & Science | 10 (100.0%) | 0 (0.0%) |
| Computers & Mathematics | 0 (0.0%) | 0 (0.0%) |
| Architecture & Engineering | 10 (100.0%) | 0 (0.0%) |
| Life, Physical & Social Science | 0 (0.0%) | 0 (0.0%) |
| Community & Social Service | 0 (0.0%) | 56 (100.0%) |
| Education, Arts & Media | 0 (0.0%) | 0 (0.0%) |
| Legal Services & Support | 0 (0.0%) | 0 (0.0%) |
| Education Instruction & Library | 0 (0.0%) | 4 (100.0%) |
| Arts, Media & Entertainment | 0 (0.0%) | 52 (100.0%) |
| Health Diagnosing & Treating | 0 (0.0%) | 0 (0.0%) |
| Health Technologists | 0 (0.0%) | 0 (0.0%) |
| Total (Category) | 10 (15.1%) | 56 (84.9%) |
| Total (Overall) | 92 (55.8%) | 73 (44.2%) |
Services Occupations
Services Occupations by Sex
| Occupation | Male | Female |
| Healthcare Support | 0 (0.0%) | 0 (0.0%) |
| Security & Protection | 0 (0.0%) | 0 (0.0%) |
| Firefighting & Prevention | 0 (0.0%) | 0 (0.0%) |
| Law Enforcement | 0 (0.0%) | 0 (0.0%) |
| Food Preparation & Serving | 0 (0.0%) | 0 (0.0%) |
| Cleaning & Maintenance | 0 (0.0%) | 0 (0.0%) |
| Personal Care & Service | 0 (0.0%) | 0 (0.0%) |
| Total (Category) | 0 (0.0%) | 0 (0.0%) |
| Total (Overall) | 92 (55.8%) | 73 (44.2%) |
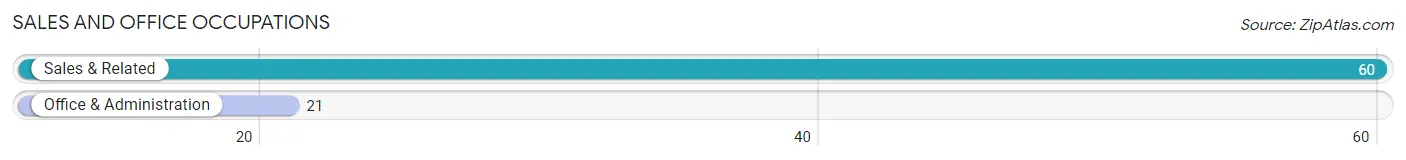
Sales and Office Occupations
The most common Sales and Office occupations in East Point are Sales & Related (60 | 36.4%), and Office & Administration (21 | 12.7%).
Sales and Office Occupations by Sex
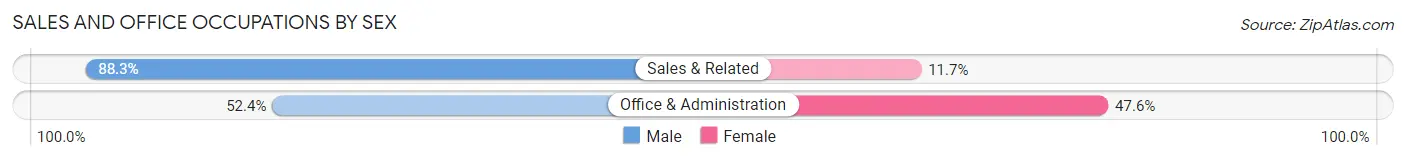
| Occupation | Male | Female |
| Sales & Related | 53 (88.3%) | 7 (11.7%) |
| Office & Administration | 11 (52.4%) | 10 (47.6%) |
| Total (Category) | 64 (79.0%) | 17 (21.0%) |
| Total (Overall) | 92 (55.8%) | 73 (44.2%) |
Natural Resources, Construction and Maintenance Occupations
Natural Resources, Construction and Maintenance Occupations by Sex
| Occupation | Male | Female |
| Farming, Fishing & Forestry | 0 (0.0%) | 0 (0.0%) |
| Construction & Extraction | 0 (0.0%) | 0 (0.0%) |
| Installation, Maintenance & Repair | 0 (0.0%) | 0 (0.0%) |
| Total (Category) | 0 (0.0%) | 0 (0.0%) |
| Total (Overall) | 92 (55.8%) | 73 (44.2%) |
Production, Transportation and Moving Occupations
The most common Production, Transportation and Moving occupations in East Point are , and Transportation (18 | 10.9%).
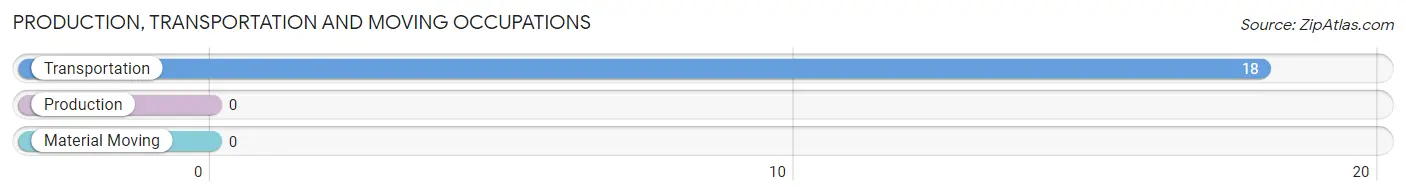
Production, Transportation and Moving Occupations by Sex
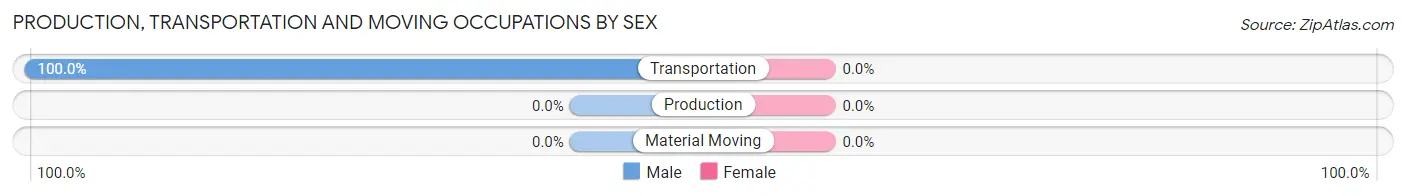
| Occupation | Male | Female |
| Production | 0 (0.0%) | 0 (0.0%) |
| Transportation | 18 (100.0%) | 0 (0.0%) |
| Material Moving | 0 (0.0%) | 0 (0.0%) |
| Total (Category) | 18 (100.0%) | 0 (0.0%) |
| Total (Overall) | 92 (55.8%) | 73 (44.2%) |
Employment Industries by Sex in East Point
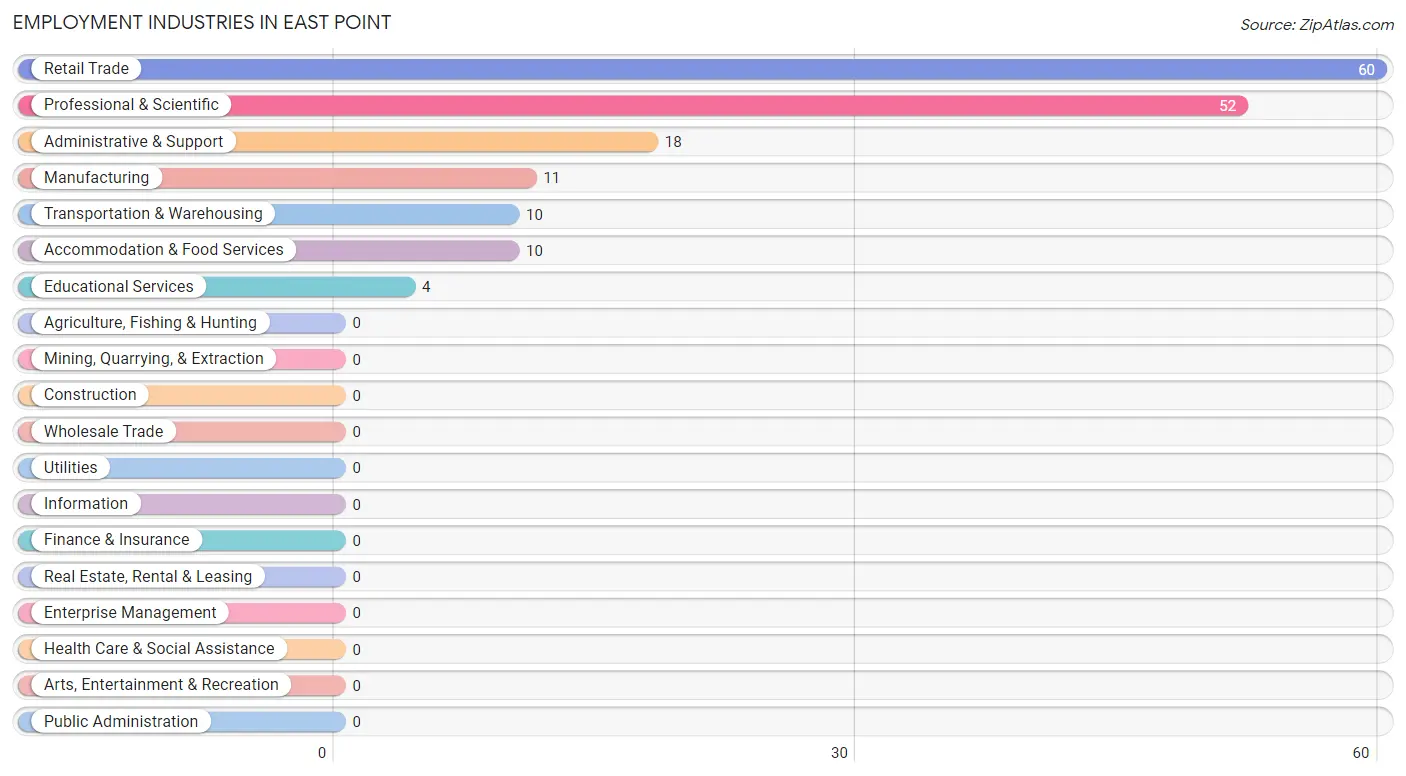
Employment Industries in East Point
The major employment industries in East Point include Retail Trade (60 | 36.4%), Professional & Scientific (52 | 31.5%), Administrative & Support (18 | 10.9%), Manufacturing (11 | 6.7%), and Transportation & Warehousing (10 | 6.1%).
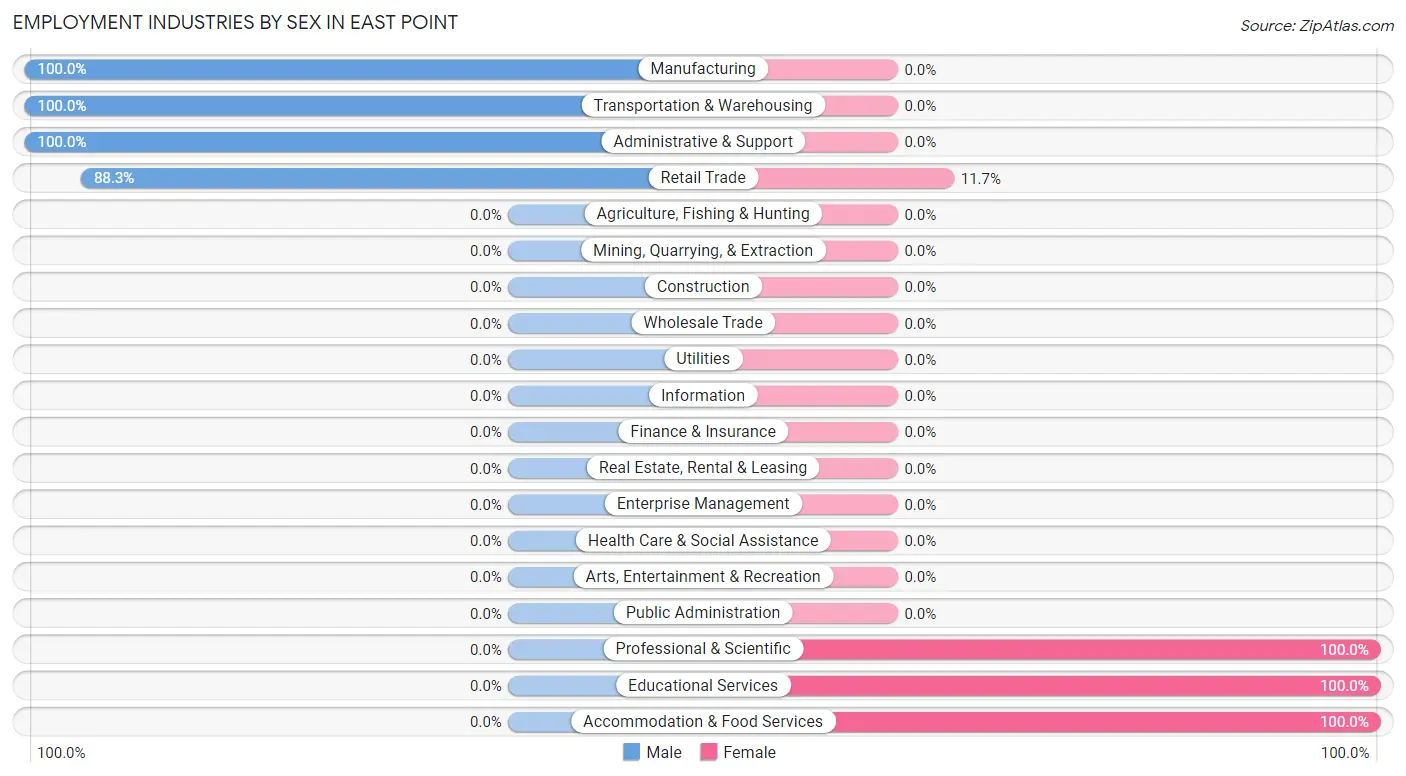
Employment Industries by Sex in East Point
The East Point industries that see more men than women are Manufacturing (100.0%), Transportation & Warehousing (100.0%), and Administrative & Support (100.0%), whereas the industries that tend to have a higher number of women are Professional & Scientific (100.0%), Educational Services (100.0%), and Accommodation & Food Services (100.0%).
| Industry | Male | Female |
| Agriculture, Fishing & Hunting | 0 (0.0%) | 0 (0.0%) |
| Mining, Quarrying, & Extraction | 0 (0.0%) | 0 (0.0%) |
| Construction | 0 (0.0%) | 0 (0.0%) |
| Manufacturing | 11 (100.0%) | 0 (0.0%) |
| Wholesale Trade | 0 (0.0%) | 0 (0.0%) |
| Retail Trade | 53 (88.3%) | 7 (11.7%) |
| Transportation & Warehousing | 10 (100.0%) | 0 (0.0%) |
| Utilities | 0 (0.0%) | 0 (0.0%) |
| Information | 0 (0.0%) | 0 (0.0%) |
| Finance & Insurance | 0 (0.0%) | 0 (0.0%) |
| Real Estate, Rental & Leasing | 0 (0.0%) | 0 (0.0%) |
| Professional & Scientific | 0 (0.0%) | 52 (100.0%) |
| Enterprise Management | 0 (0.0%) | 0 (0.0%) |
| Administrative & Support | 18 (100.0%) | 0 (0.0%) |
| Educational Services | 0 (0.0%) | 4 (100.0%) |
| Health Care & Social Assistance | 0 (0.0%) | 0 (0.0%) |
| Arts, Entertainment & Recreation | 0 (0.0%) | 0 (0.0%) |
| Accommodation & Food Services | 0 (0.0%) | 10 (100.0%) |
| Public Administration | 0 (0.0%) | 0 (0.0%) |
| Total | 92 (55.8%) | 73 (44.2%) |
Education in East Point
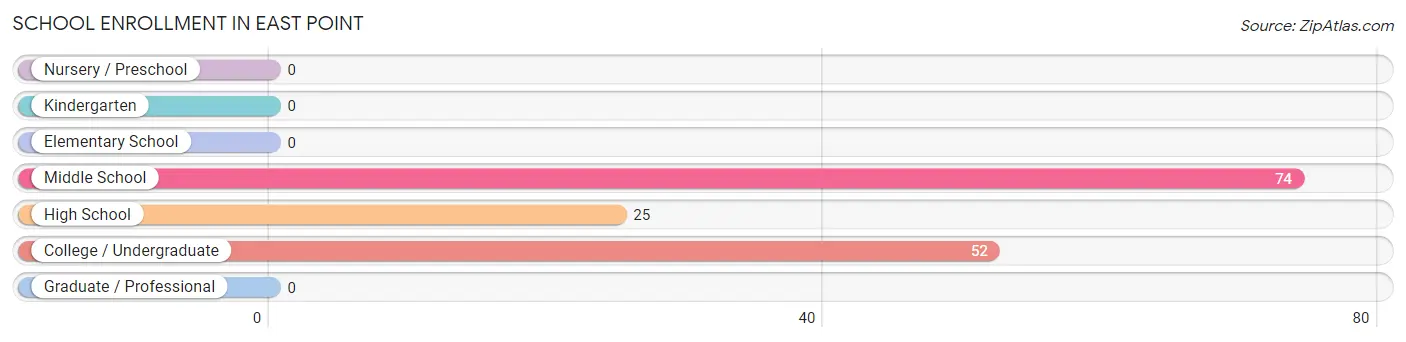
School Enrollment in East Point
The most common levels of schooling among the 151 students in East Point are middle school (74 | 49.0%), college / undergraduate (52 | 34.4%), and high school (25 | 16.6%).
| School Level | # Students | % Students |
| Nursery / Preschool | 0 | 0.0% |
| Kindergarten | 0 | 0.0% |
| Elementary School | 0 | 0.0% |
| Middle School | 74 | 49.0% |
| High School | 25 | 16.6% |
| College / Undergraduate | 52 | 34.4% |
| Graduate / Professional | 0 | 0.0% |
| Total | 151 | 100.0% |
School Enrollment by Age by Funding Source in East Point
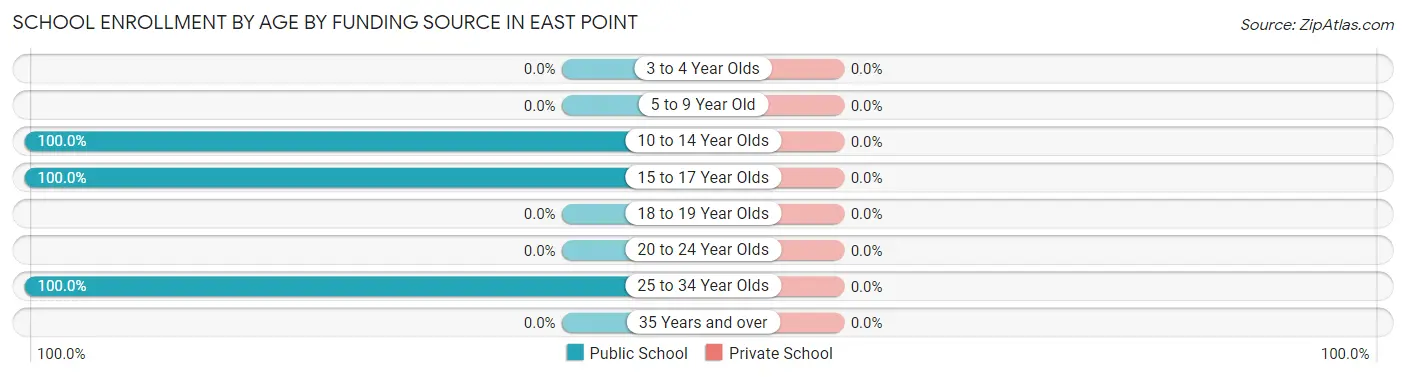
| Age Bracket | Public School | Private School |
| 3 to 4 Year Olds | 0 (0.0%) | 0 (0.0%) |
| 5 to 9 Year Old | 0 (0.0%) | 0 (0.0%) |
| 10 to 14 Year Olds | 74 (100.0%) | 0 (0.0%) |
| 15 to 17 Year Olds | 25 (100.0%) | 0 (0.0%) |
| 18 to 19 Year Olds | 0 (0.0%) | 0 (0.0%) |
| 20 to 24 Year Olds | 0 (0.0%) | 0 (0.0%) |
| 25 to 34 Year Olds | 52 (100.0%) | 0 (0.0%) |
| 35 Years and over | 0 (0.0%) | 0 (0.0%) |
| Total | 151 (100.0%) | 0 (0.0%) |
Educational Attainment by Field of Study in East Point
, and business (10 | 100.0%) are the most common fields of study among 10 individuals in East Point who have obtained a bachelor's degree or higher.
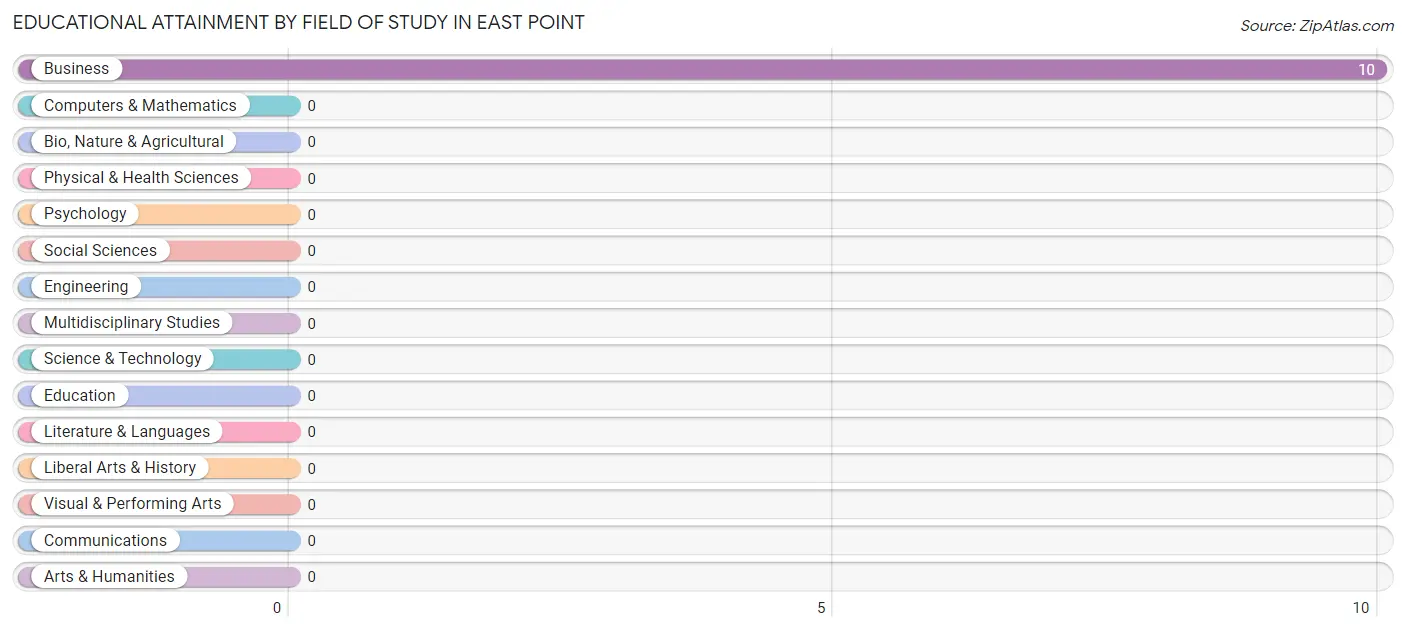
| Field of Study | # Graduates | % Graduates |
| Computers & Mathematics | 0 | 0.0% |
| Bio, Nature & Agricultural | 0 | 0.0% |
| Physical & Health Sciences | 0 | 0.0% |
| Psychology | 0 | 0.0% |
| Social Sciences | 0 | 0.0% |
| Engineering | 0 | 0.0% |
| Multidisciplinary Studies | 0 | 0.0% |
| Science & Technology | 0 | 0.0% |
| Business | 10 | 100.0% |
| Education | 0 | 0.0% |
| Literature & Languages | 0 | 0.0% |
| Liberal Arts & History | 0 | 0.0% |
| Visual & Performing Arts | 0 | 0.0% |
| Communications | 0 | 0.0% |
| Arts & Humanities | 0 | 0.0% |
| Total | 10 | 100.0% |
Transportation & Commute in East Point
Vehicle Availability by Sex in East Point
The most prevalent vehicle ownership categories in East Point are males with 2 vehicles (71, accounting for 77.2%) and females with 2 vehicles (59, making up 97.3%).
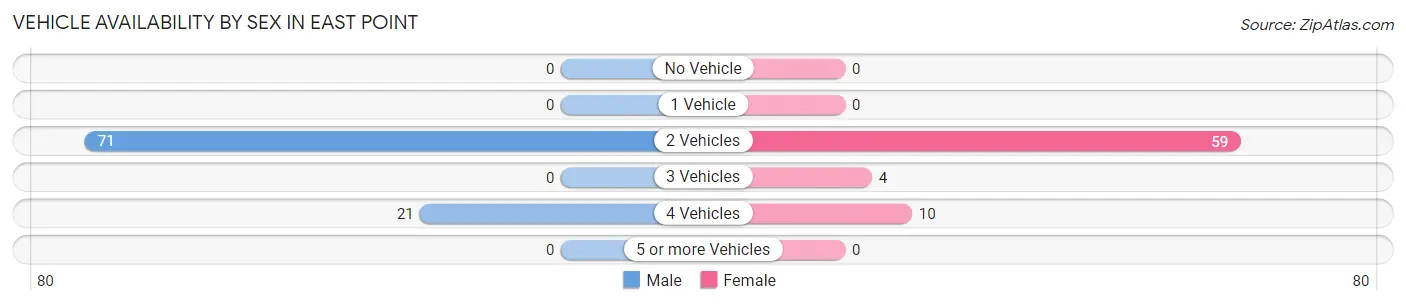
| Vehicles Available | Male | Female |
| No Vehicle | 0 (0.0%) | 0 (0.0%) |
| 1 Vehicle | 0 (0.0%) | 0 (0.0%) |
| 2 Vehicles | 71 (77.2%) | 59 (80.8%) |
| 3 Vehicles | 0 (0.0%) | 4 (5.5%) |
| 4 Vehicles | 21 (22.8%) | 10 (13.7%) |
| 5 or more Vehicles | 0 (0.0%) | 0 (0.0%) |
| Total | 92 (100.0%) | 73 (100.0%) |
Commute Time in East Point
The most frequently occuring commute durations in East Point are 10 to 14 minutes (64 commuters, 38.8%), 20 to 24 minutes (52 commuters, 31.5%), and 60 to 89 minutes (27 commuters, 16.4%).
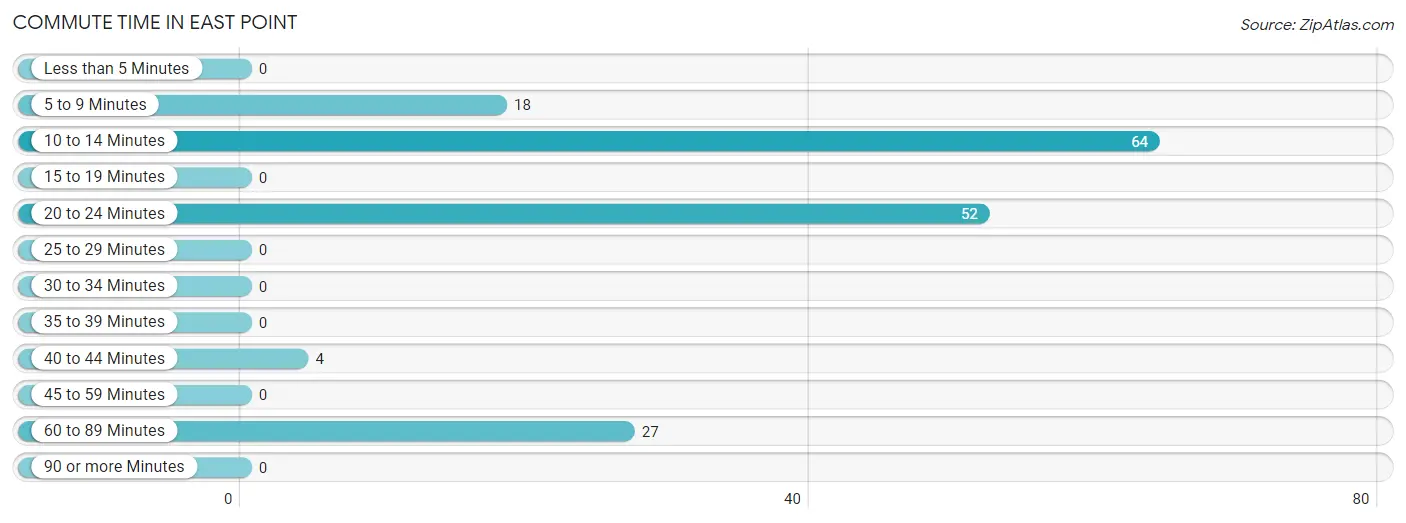
| Commute Time | # Commuters | % Commuters |
| Less than 5 Minutes | 0 | 0.0% |
| 5 to 9 Minutes | 18 | 10.9% |
| 10 to 14 Minutes | 64 | 38.8% |
| 15 to 19 Minutes | 0 | 0.0% |
| 20 to 24 Minutes | 52 | 31.5% |
| 25 to 29 Minutes | 0 | 0.0% |
| 30 to 34 Minutes | 0 | 0.0% |
| 35 to 39 Minutes | 0 | 0.0% |
| 40 to 44 Minutes | 4 | 2.4% |
| 45 to 59 Minutes | 0 | 0.0% |
| 60 to 89 Minutes | 27 | 16.4% |
| 90 or more Minutes | 0 | 0.0% |
Commute Time by Sex in East Point
The most common commute times in East Point are 10 to 14 minutes (64 commuters, 69.6%) for males and 20 to 24 minutes (52 commuters, 71.2%) for females.
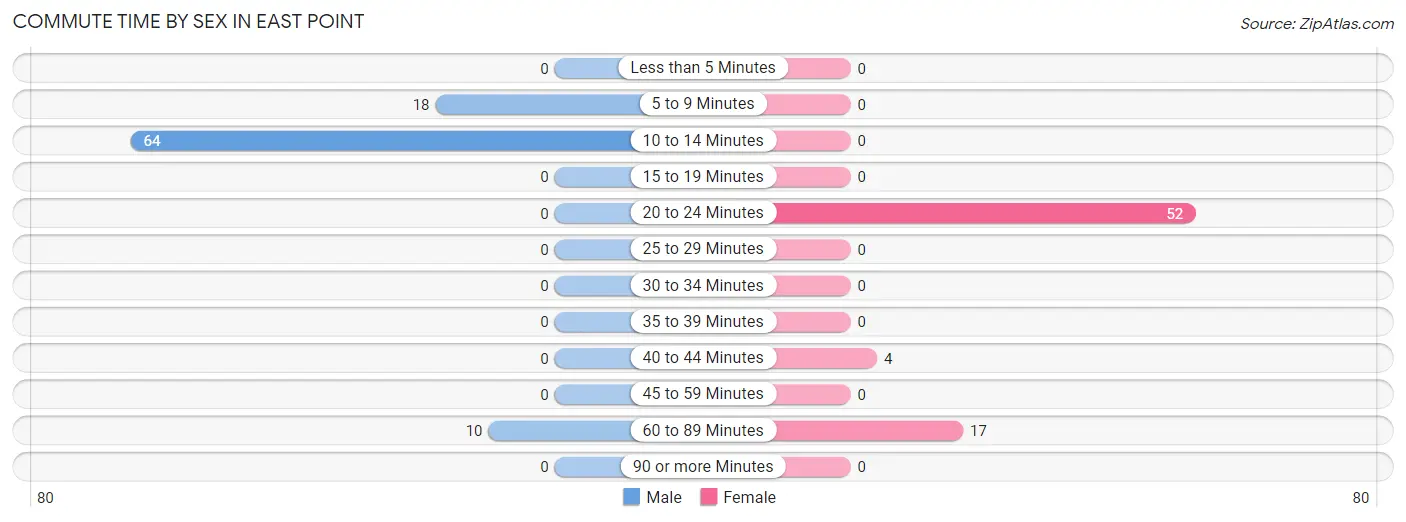
| Commute Time | Male | Female |
| Less than 5 Minutes | 0 (0.0%) | 0 (0.0%) |
| 5 to 9 Minutes | 18 (19.6%) | 0 (0.0%) |
| 10 to 14 Minutes | 64 (69.6%) | 0 (0.0%) |
| 15 to 19 Minutes | 0 (0.0%) | 0 (0.0%) |
| 20 to 24 Minutes | 0 (0.0%) | 52 (71.2%) |
| 25 to 29 Minutes | 0 (0.0%) | 0 (0.0%) |
| 30 to 34 Minutes | 0 (0.0%) | 0 (0.0%) |
| 35 to 39 Minutes | 0 (0.0%) | 0 (0.0%) |
| 40 to 44 Minutes | 0 (0.0%) | 4 (5.5%) |
| 45 to 59 Minutes | 0 (0.0%) | 0 (0.0%) |
| 60 to 89 Minutes | 10 (10.9%) | 17 (23.3%) |
| 90 or more Minutes | 0 (0.0%) | 0 (0.0%) |
Time of Departure to Work by Sex in East Point
The most frequent times of departure to work in East Point are 8:00 AM to 8:29 AM (53, 57.6%) for males and 7:30 AM to 7:59 AM (56, 76.7%) for females.
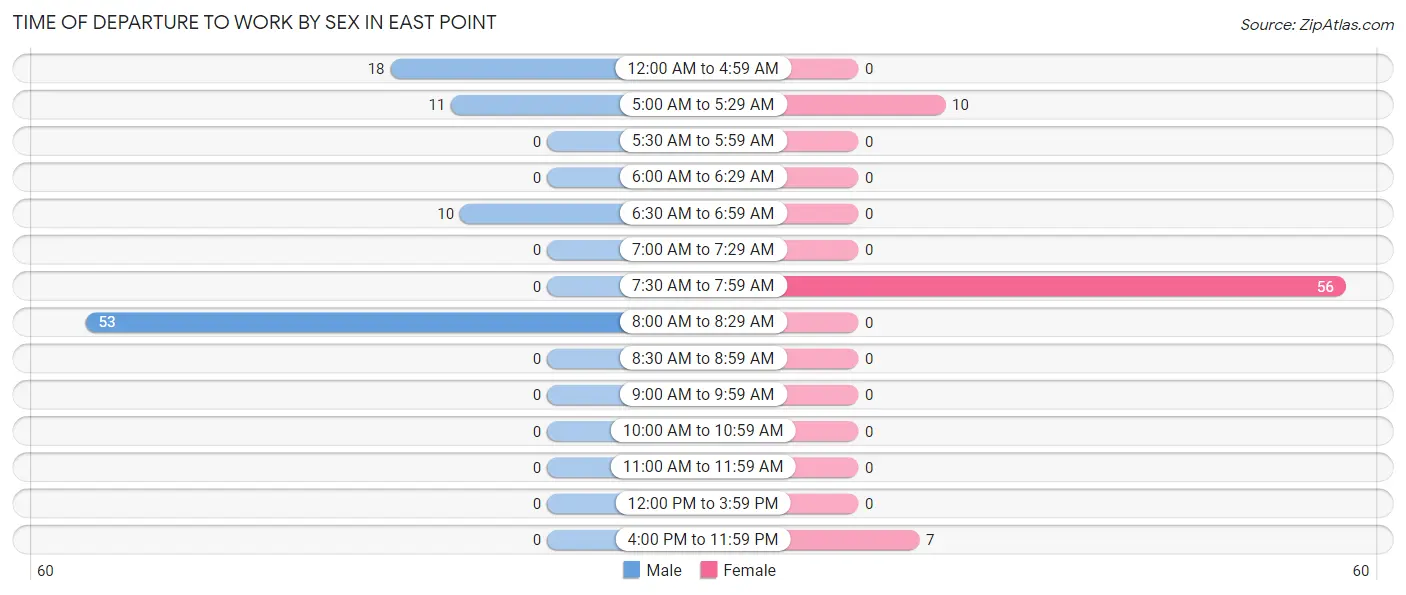
| Time of Departure | Male | Female |
| 12:00 AM to 4:59 AM | 18 (19.6%) | 0 (0.0%) |
| 5:00 AM to 5:29 AM | 11 (12.0%) | 10 (13.7%) |
| 5:30 AM to 5:59 AM | 0 (0.0%) | 0 (0.0%) |
| 6:00 AM to 6:29 AM | 0 (0.0%) | 0 (0.0%) |
| 6:30 AM to 6:59 AM | 10 (10.9%) | 0 (0.0%) |
| 7:00 AM to 7:29 AM | 0 (0.0%) | 0 (0.0%) |
| 7:30 AM to 7:59 AM | 0 (0.0%) | 56 (76.7%) |
| 8:00 AM to 8:29 AM | 53 (57.6%) | 0 (0.0%) |
| 8:30 AM to 8:59 AM | 0 (0.0%) | 0 (0.0%) |
| 9:00 AM to 9:59 AM | 0 (0.0%) | 0 (0.0%) |
| 10:00 AM to 10:59 AM | 0 (0.0%) | 0 (0.0%) |
| 11:00 AM to 11:59 AM | 0 (0.0%) | 0 (0.0%) |
| 12:00 PM to 3:59 PM | 0 (0.0%) | 0 (0.0%) |
| 4:00 PM to 11:59 PM | 0 (0.0%) | 7 (9.6%) |
| Total | 92 (100.0%) | 73 (100.0%) |
Housing Occupancy in East Point
Occupancy by Ownership in East Point
Of the total 75 dwellings in East Point, owner-occupied units account for 68 (90.7%), while renter-occupied units make up 7 (9.3%).
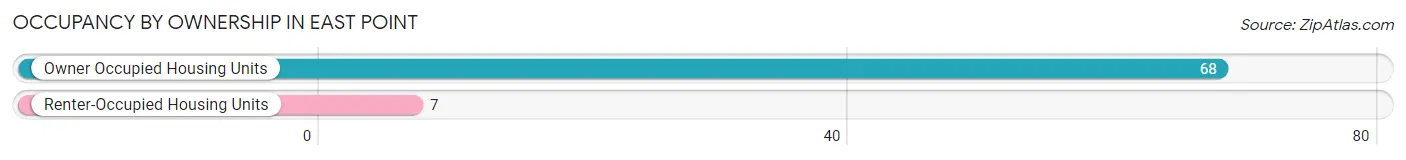
| Occupancy | # Housing Units | % Housing Units |
| Owner Occupied Housing Units | 68 | 90.7% |
| Renter-Occupied Housing Units | 7 | 9.3% |
| Total Occupied Housing Units | 75 | 100.0% |
Occupancy by Household Size in East Point
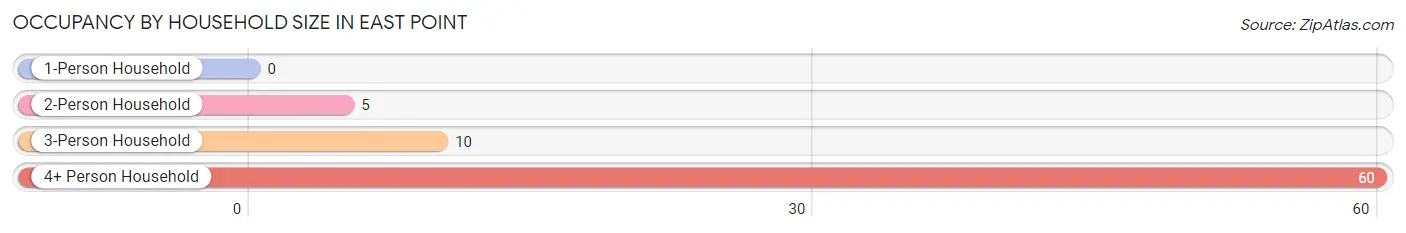
| Household Size | # Housing Units | % Housing Units |
| 1-Person Household | 0 | 0.0% |
| 2-Person Household | 5 | 6.7% |
| 3-Person Household | 10 | 13.3% |
| 4+ Person Household | 60 | 80.0% |
| Total Housing Units | 75 | 100.0% |
Occupancy by Ownership by Household Size in East Point
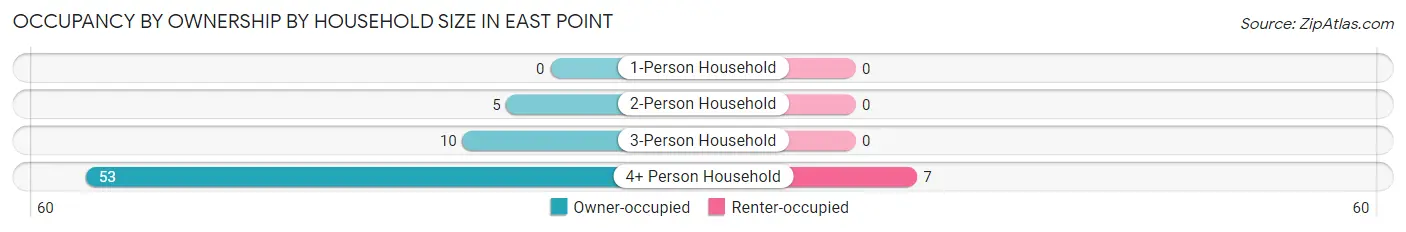
| Household Size | Owner-occupied | Renter-occupied |
| 1-Person Household | 0 (0.0%) | 0 (0.0%) |
| 2-Person Household | 5 (100.0%) | 0 (0.0%) |
| 3-Person Household | 10 (100.0%) | 0 (0.0%) |
| 4+ Person Household | 53 (88.3%) | 7 (11.7%) |
| Total Housing Units | 68 (90.7%) | 7 (9.3%) |
Occupancy by Educational Attainment in East Point
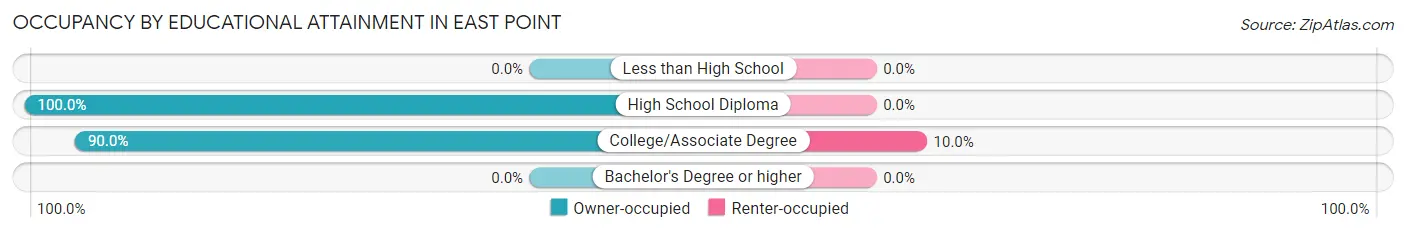
| Household Size | Owner-occupied | Renter-occupied |
| Less than High School | 0 (0.0%) | 0 (0.0%) |
| High School Diploma | 5 (100.0%) | 0 (0.0%) |
| College/Associate Degree | 63 (90.0%) | 7 (10.0%) |
| Bachelor's Degree or higher | 0 (0.0%) | 0 (0.0%) |
Occupancy by Age of Householder in East Point
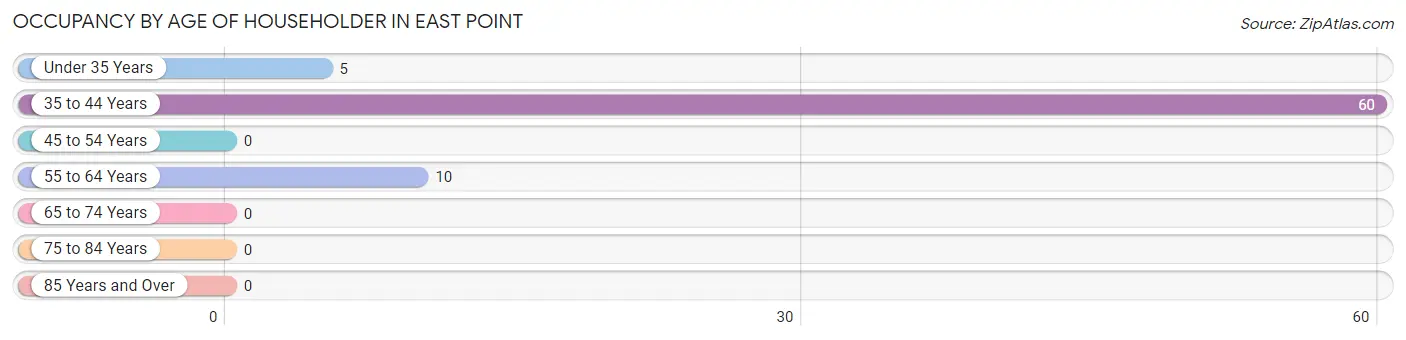
| Age Bracket | # Households | % Households |
| Under 35 Years | 5 | 6.7% |
| 35 to 44 Years | 60 | 80.0% |
| 45 to 54 Years | 0 | 0.0% |
| 55 to 64 Years | 10 | 13.3% |
| 65 to 74 Years | 0 | 0.0% |
| 75 to 84 Years | 0 | 0.0% |
| 85 Years and Over | 0 | 0.0% |
| Total | 75 | 100.0% |
Housing Finances in East Point
Median Income by Occupancy in East Point
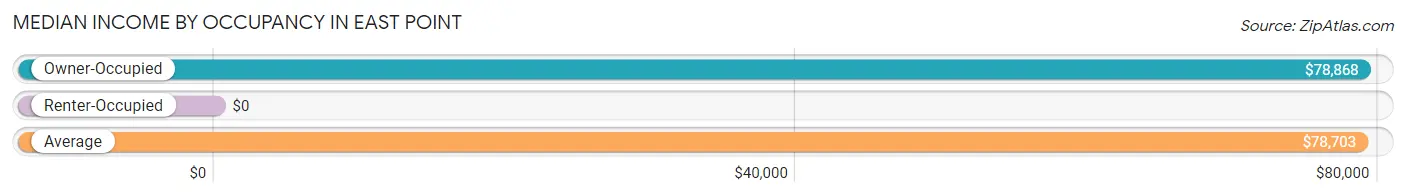
| Occupancy Type | # Households | Median Income |
| Owner-Occupied | 68 (90.7%) | $78,868 |
| Renter-Occupied | 7 (9.3%) | $0 |
| Average | 75 (100.0%) | $78,703 |
Occupancy by Householder Income Bracket in East Point
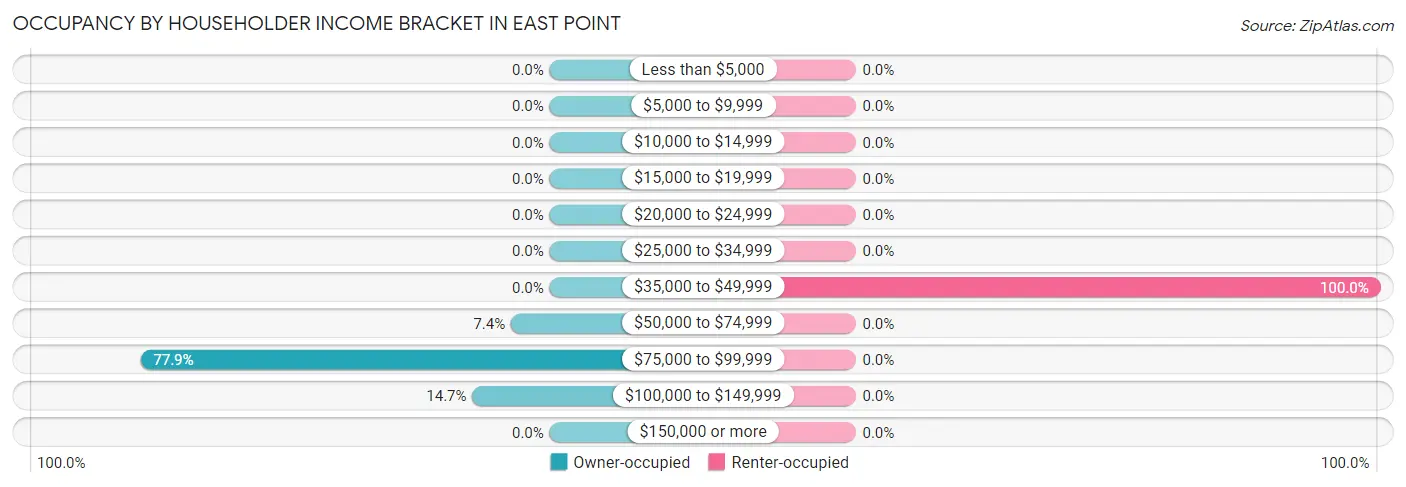
| Income Bracket | Owner-occupied | Renter-occupied |
| Less than $5,000 | 0 (0.0%) | 0 (0.0%) |
| $5,000 to $9,999 | 0 (0.0%) | 0 (0.0%) |
| $10,000 to $14,999 | 0 (0.0%) | 0 (0.0%) |
| $15,000 to $19,999 | 0 (0.0%) | 0 (0.0%) |
| $20,000 to $24,999 | 0 (0.0%) | 0 (0.0%) |
| $25,000 to $34,999 | 0 (0.0%) | 0 (0.0%) |
| $35,000 to $49,999 | 0 (0.0%) | 7 (100.0%) |
| $50,000 to $74,999 | 5 (7.3%) | 0 (0.0%) |
| $75,000 to $99,999 | 53 (77.9%) | 0 (0.0%) |
| $100,000 to $149,999 | 10 (14.7%) | 0 (0.0%) |
| $150,000 or more | 0 (0.0%) | 0 (0.0%) |
| Total | 68 (100.0%) | 7 (100.0%) |
Monthly Housing Cost Tiers in East Point
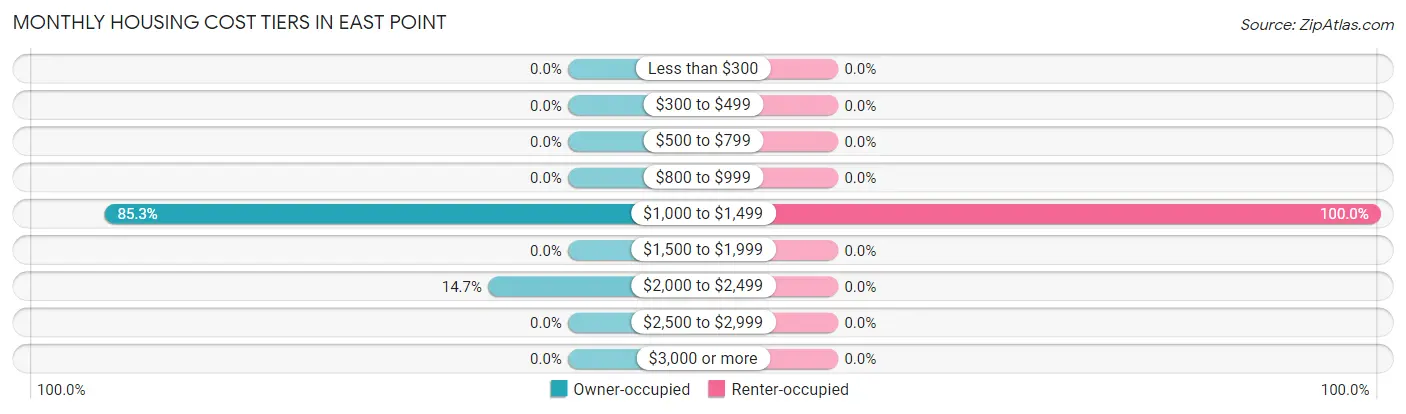
| Monthly Cost | Owner-occupied | Renter-occupied |
| Less than $300 | 0 (0.0%) | 0 (0.0%) |
| $300 to $499 | 0 (0.0%) | 0 (0.0%) |
| $500 to $799 | 0 (0.0%) | 0 (0.0%) |
| $800 to $999 | 0 (0.0%) | 0 (0.0%) |
| $1,000 to $1,499 | 58 (85.3%) | 7 (100.0%) |
| $1,500 to $1,999 | 0 (0.0%) | 0 (0.0%) |
| $2,000 to $2,499 | 10 (14.7%) | 0 (0.0%) |
| $2,500 to $2,999 | 0 (0.0%) | 0 (0.0%) |
| $3,000 or more | 0 (0.0%) | 0 (0.0%) |
| Total | 68 (100.0%) | 7 (100.0%) |
Physical Housing Characteristics in East Point
Housing Structures in East Point
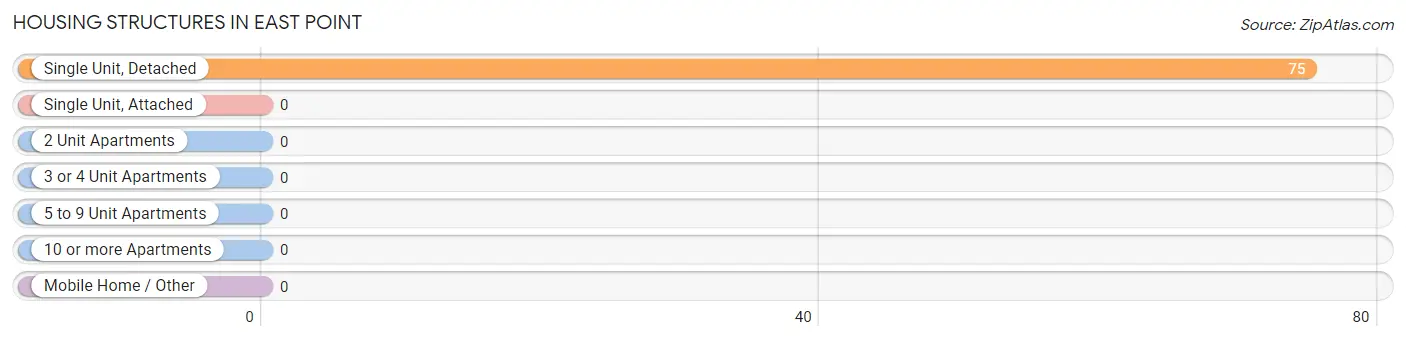
| Structure Type | # Housing Units | % Housing Units |
| Single Unit, Detached | 75 | 100.0% |
| Single Unit, Attached | 0 | 0.0% |
| 2 Unit Apartments | 0 | 0.0% |
| 3 or 4 Unit Apartments | 0 | 0.0% |
| 5 to 9 Unit Apartments | 0 | 0.0% |
| 10 or more Apartments | 0 | 0.0% |
| Mobile Home / Other | 0 | 0.0% |
| Total | 75 | 100.0% |
Housing Structures by Occupancy in East Point
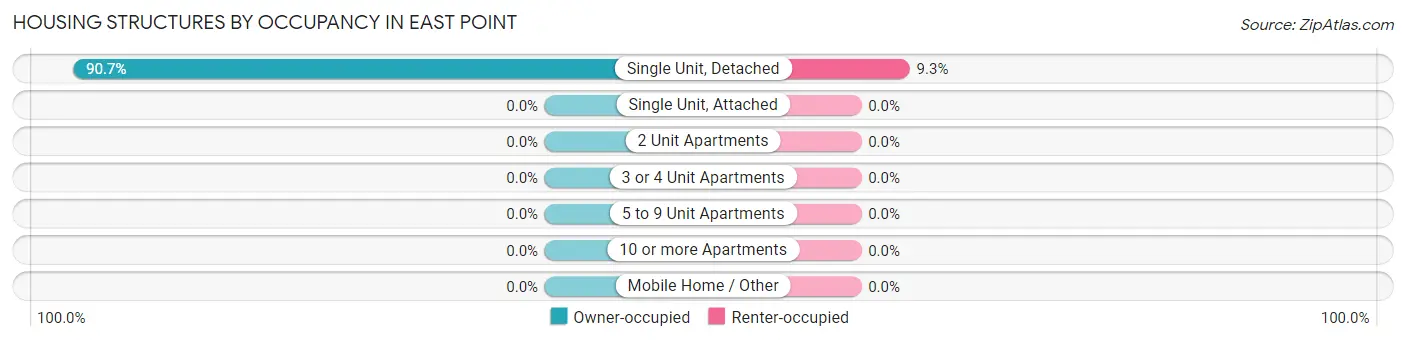
| Structure Type | Owner-occupied | Renter-occupied |
| Single Unit, Detached | 68 (90.7%) | 7 (9.3%) |
| Single Unit, Attached | 0 (0.0%) | 0 (0.0%) |
| 2 Unit Apartments | 0 (0.0%) | 0 (0.0%) |
| 3 or 4 Unit Apartments | 0 (0.0%) | 0 (0.0%) |
| 5 to 9 Unit Apartments | 0 (0.0%) | 0 (0.0%) |
| 10 or more Apartments | 0 (0.0%) | 0 (0.0%) |
| Mobile Home / Other | 0 (0.0%) | 0 (0.0%) |
| Total | 68 (90.7%) | 7 (9.3%) |
Housing Structures by Number of Rooms in East Point
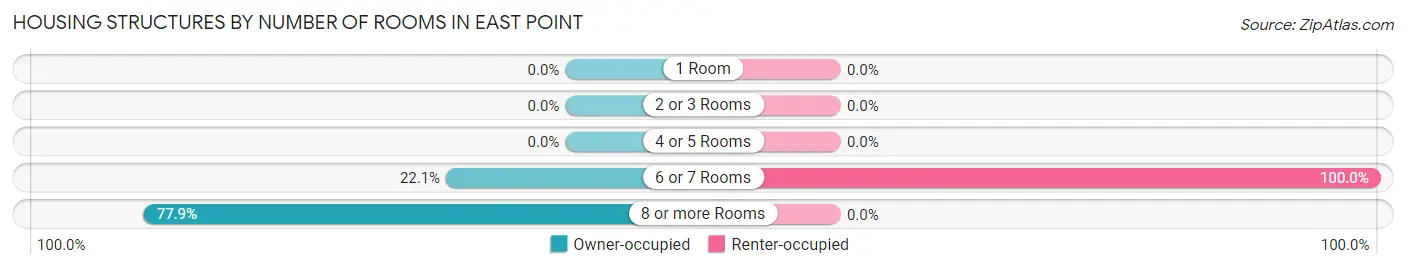
| Number of Rooms | Owner-occupied | Renter-occupied |
| 1 Room | 0 (0.0%) | 0 (0.0%) |
| 2 or 3 Rooms | 0 (0.0%) | 0 (0.0%) |
| 4 or 5 Rooms | 0 (0.0%) | 0 (0.0%) |
| 6 or 7 Rooms | 15 (22.1%) | 7 (100.0%) |
| 8 or more Rooms | 53 (77.9%) | 0 (0.0%) |
| Total | 68 (100.0%) | 7 (100.0%) |
Housing Structure by Heating Type in East Point
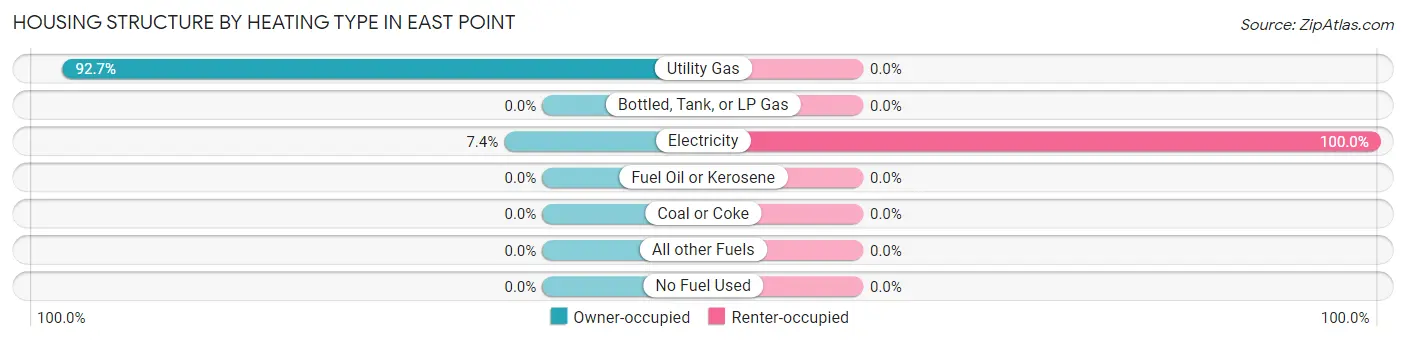
| Heating Type | Owner-occupied | Renter-occupied |
| Utility Gas | 63 (92.6%) | 0 (0.0%) |
| Bottled, Tank, or LP Gas | 0 (0.0%) | 0 (0.0%) |
| Electricity | 5 (7.3%) | 7 (100.0%) |
| Fuel Oil or Kerosene | 0 (0.0%) | 0 (0.0%) |
| Coal or Coke | 0 (0.0%) | 0 (0.0%) |
| All other Fuels | 0 (0.0%) | 0 (0.0%) |
| No Fuel Used | 0 (0.0%) | 0 (0.0%) |
| Total | 68 (100.0%) | 7 (100.0%) |
Household Vehicle Usage in East Point
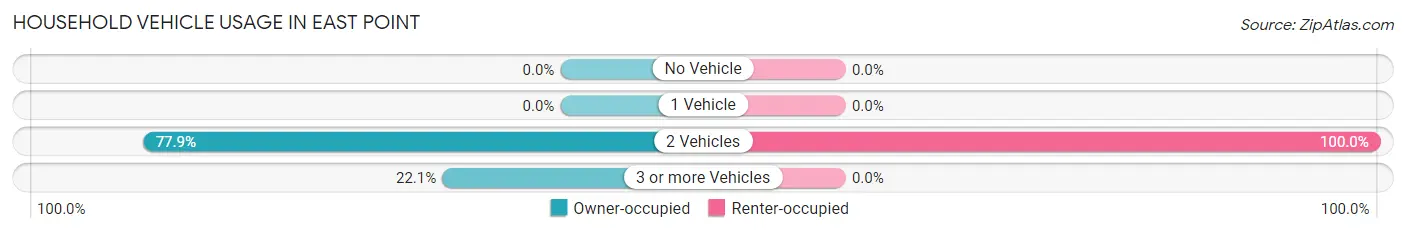
| Vehicles per Household | Owner-occupied | Renter-occupied |
| No Vehicle | 0 (0.0%) | 0 (0.0%) |
| 1 Vehicle | 0 (0.0%) | 0 (0.0%) |
| 2 Vehicles | 53 (77.9%) | 7 (100.0%) |
| 3 or more Vehicles | 15 (22.1%) | 0 (0.0%) |
| Total | 68 (100.0%) | 7 (100.0%) |
Real Estate & Mortgages in East Point
Real Estate and Mortgage Overview in East Point
| Characteristic | Without Mortgage | With Mortgage |
| Housing Units | 0 | 68 |
| Median Property Value | - | - |
| Median Household Income | - | - |
| Monthly Housing Costs | - | - |
| Real Estate Taxes | - | - |
Property Value by Mortgage Status in East Point
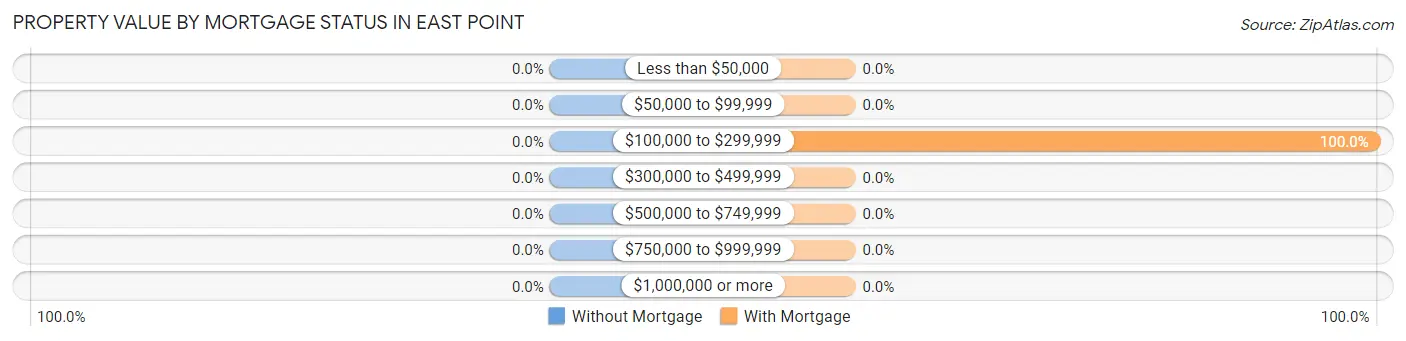
| Property Value | Without Mortgage | With Mortgage |
| Less than $50,000 | 0 (0.0%) | 0 (0.0%) |
| $50,000 to $99,999 | 0 (0.0%) | 0 (0.0%) |
| $100,000 to $299,999 | 0 (0.0%) | 68 (100.0%) |
| $300,000 to $499,999 | 0 (0.0%) | 0 (0.0%) |
| $500,000 to $749,999 | 0 (0.0%) | 0 (0.0%) |
| $750,000 to $999,999 | 0 (0.0%) | 0 (0.0%) |
| $1,000,000 or more | 0 (0.0%) | 0 (0.0%) |
| Total | 0 (0.0%) | 68 (100.0%) |
Household Income by Mortgage Status in East Point
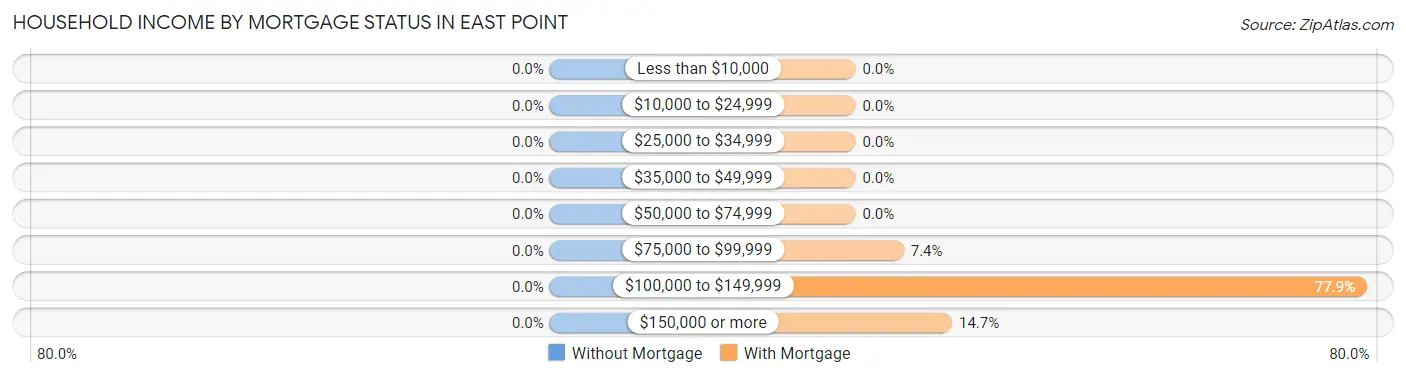
| Household Income | Without Mortgage | With Mortgage |
| Less than $10,000 | 0 (0.0%) | 0 (0.0%) |
| $10,000 to $24,999 | 0 (0.0%) | 0 (0.0%) |
| $25,000 to $34,999 | 0 (0.0%) | 0 (0.0%) |
| $35,000 to $49,999 | 0 (0.0%) | 0 (0.0%) |
| $50,000 to $74,999 | 0 (0.0%) | 0 (0.0%) |
| $75,000 to $99,999 | 0 (0.0%) | 5 (7.3%) |
| $100,000 to $149,999 | 0 (0.0%) | 53 (77.9%) |
| $150,000 or more | 0 (0.0%) | 10 (14.7%) |
| Total | 0 (0.0%) | 68 (100.0%) |
Property Value to Household Income Ratio in East Point
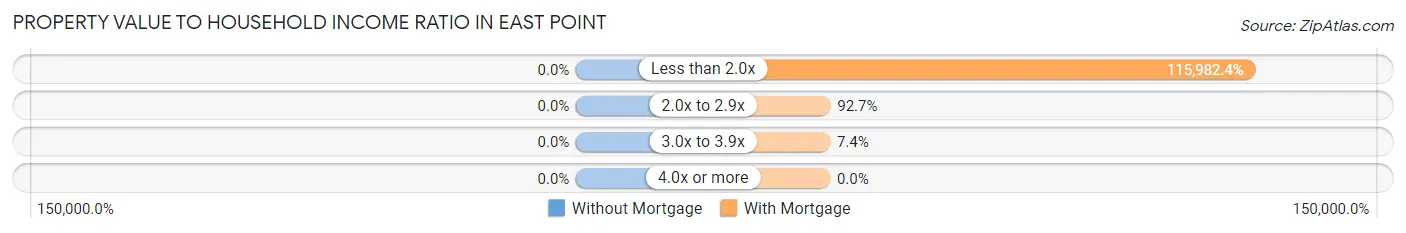
| Value-to-Income Ratio | Without Mortgage | With Mortgage |
| Less than 2.0x | 0 (0.0%) | 78,868 (115,982.3%) |
| 2.0x to 2.9x | 0 (0.0%) | 63 (92.6%) |
| 3.0x to 3.9x | 0 (0.0%) | 5 (7.3%) |
| 4.0x or more | 0 (0.0%) | 0 (0.0%) |
| Total | 0 (0.0%) | 68 (100.0%) |
Real Estate Taxes by Mortgage Status in East Point
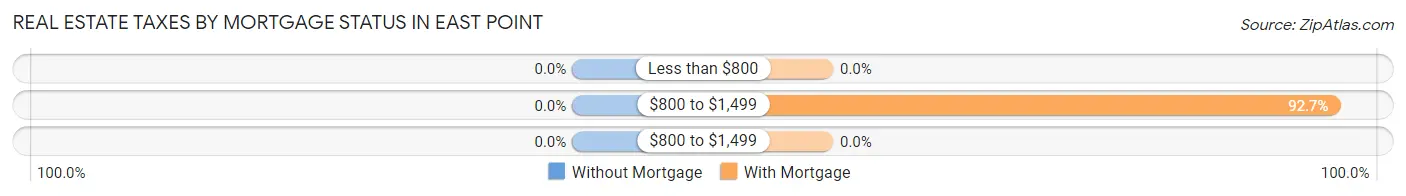
| Property Taxes | Without Mortgage | With Mortgage |
| Less than $800 | 0 (0.0%) | 0 (0.0%) |
| $800 to $1,499 | 0 (0.0%) | 63 (92.6%) |
| $800 to $1,499 | 0 (0.0%) | 0 (0.0%) |
| Total | 0 (0.0%) | 68 (100.0%) |
Health & Disability in East Point
Health Insurance Coverage by Age in East Point
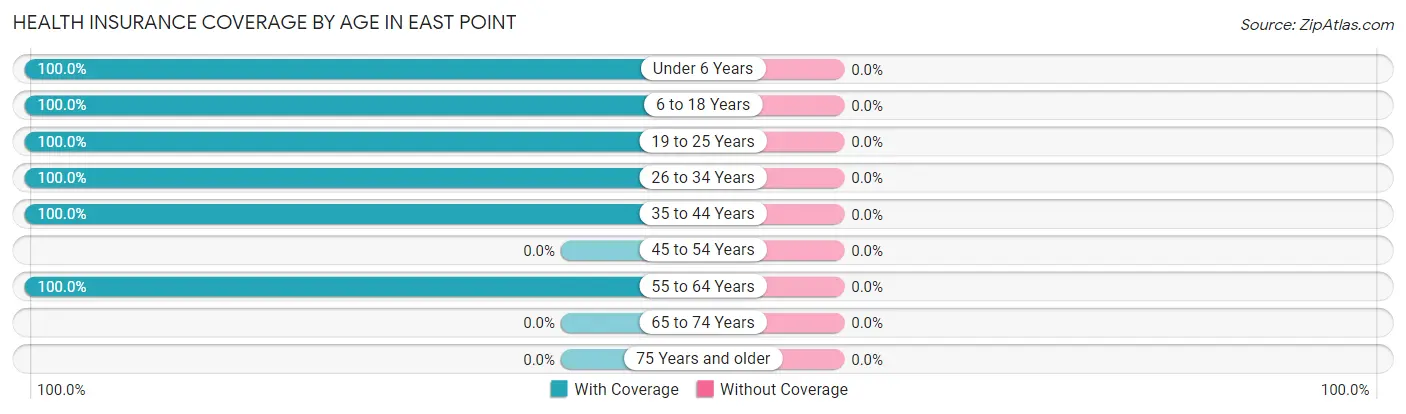
| Age Bracket | With Coverage | Without Coverage |
| Under 6 Years | 70 (100.0%) | 0 (0.0%) |
| 6 to 18 Years | 99 (100.0%) | 0 (0.0%) |
| 19 to 25 Years | 4 (100.0%) | 0 (0.0%) |
| 26 to 34 Years | 75 (100.0%) | 0 (0.0%) |
| 35 to 44 Years | 81 (100.0%) | 0 (0.0%) |
| 45 to 54 Years | 0 (0.0%) | 0 (0.0%) |
| 55 to 64 Years | 10 (100.0%) | 0 (0.0%) |
| 65 to 74 Years | 0 (0.0%) | 0 (0.0%) |
| 75 Years and older | 0 (0.0%) | 0 (0.0%) |
| Total | 339 (100.0%) | 0 (0.0%) |
Health Insurance Coverage by Citizenship Status in East Point
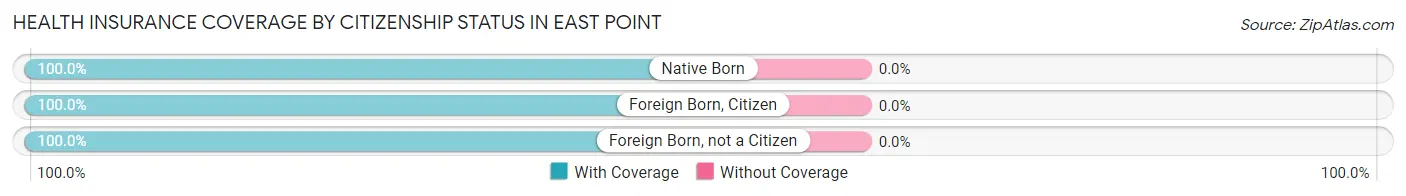
| Citizenship Status | With Coverage | Without Coverage |
| Native Born | 70 (100.0%) | 0 (0.0%) |
| Foreign Born, Citizen | 99 (100.0%) | 0 (0.0%) |
| Foreign Born, not a Citizen | 4 (100.0%) | 0 (0.0%) |
Health Insurance Coverage by Household Income in East Point
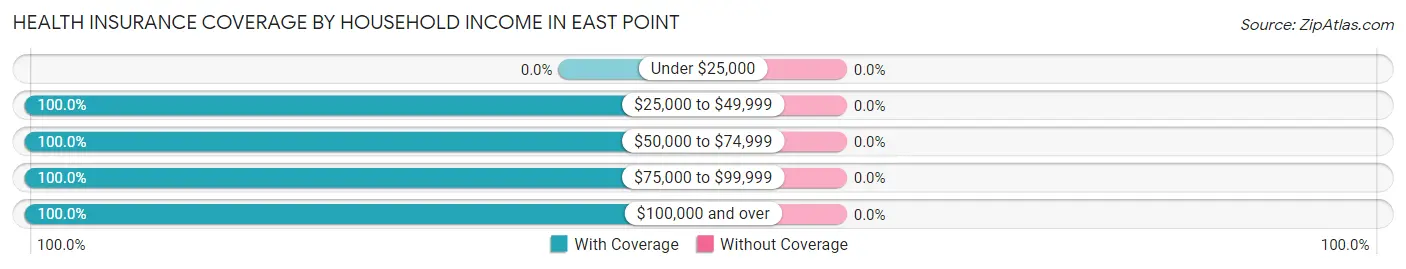
| Household Income | With Coverage | Without Coverage |
| Under $25,000 | 0 (0.0%) | 0 (0.0%) |
| $25,000 to $49,999 | 95 (100.0%) | 0 (0.0%) |
| $50,000 to $74,999 | 9 (100.0%) | 0 (0.0%) |
| $75,000 to $99,999 | 204 (100.0%) | 0 (0.0%) |
| $100,000 and over | 31 (100.0%) | 0 (0.0%) |
Public vs Private Health Insurance Coverage by Age in East Point
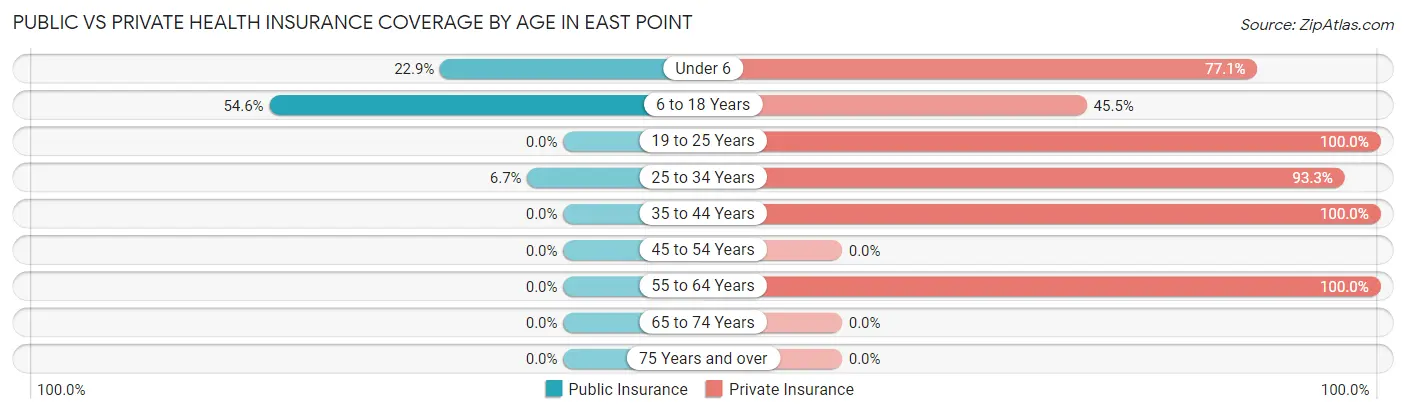
| Age Bracket | Public Insurance | Private Insurance |
| Under 6 | 16 (22.9%) | 54 (77.1%) |
| 6 to 18 Years | 54 (54.5%) | 45 (45.5%) |
| 19 to 25 Years | 0 (0.0%) | 4 (100.0%) |
| 25 to 34 Years | 5 (6.7%) | 70 (93.3%) |
| 35 to 44 Years | 0 (0.0%) | 81 (100.0%) |
| 45 to 54 Years | 0 (0.0%) | 0 (0.0%) |
| 55 to 64 Years | 0 (0.0%) | 10 (100.0%) |
| 65 to 74 Years | 0 (0.0%) | 0 (0.0%) |
| 75 Years and over | 0 (0.0%) | 0 (0.0%) |
| Total | 75 (22.1%) | 264 (77.9%) |
Disability Status by Sex by Age in East Point
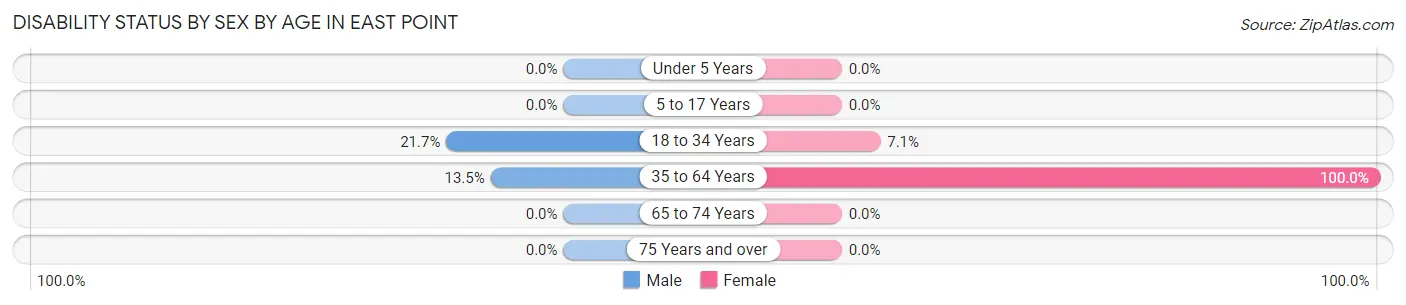
| Age Bracket | Male | Female |
| Under 5 Years | 0 (0.0%) | 0 (0.0%) |
| 5 to 17 Years | 0 (0.0%) | 0 (0.0%) |
| 18 to 34 Years | 5 (21.7%) | 4 (7.1%) |
| 35 to 64 Years | 10 (13.5%) | 17 (100.0%) |
| 65 to 74 Years | 0 (0.0%) | 0 (0.0%) |
| 75 Years and over | 0 (0.0%) | 0 (0.0%) |
Disability Class by Sex by Age in East Point
Disability Class: Hearing Difficulty
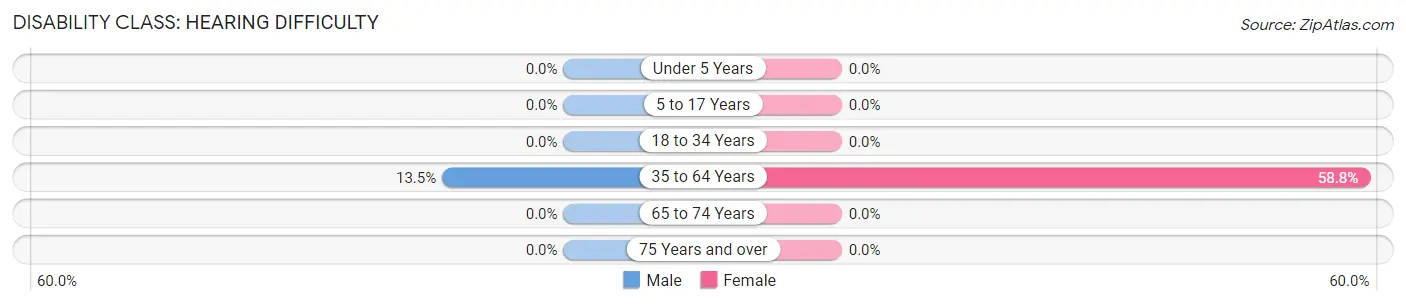
| Age Bracket | Male | Female |
| Under 5 Years | 0 (0.0%) | 0 (0.0%) |
| 5 to 17 Years | 0 (0.0%) | 0 (0.0%) |
| 18 to 34 Years | 0 (0.0%) | 0 (0.0%) |
| 35 to 64 Years | 10 (13.5%) | 10 (58.8%) |
| 65 to 74 Years | 0 (0.0%) | 0 (0.0%) |
| 75 Years and over | 0 (0.0%) | 0 (0.0%) |
Disability Class: Vision Difficulty
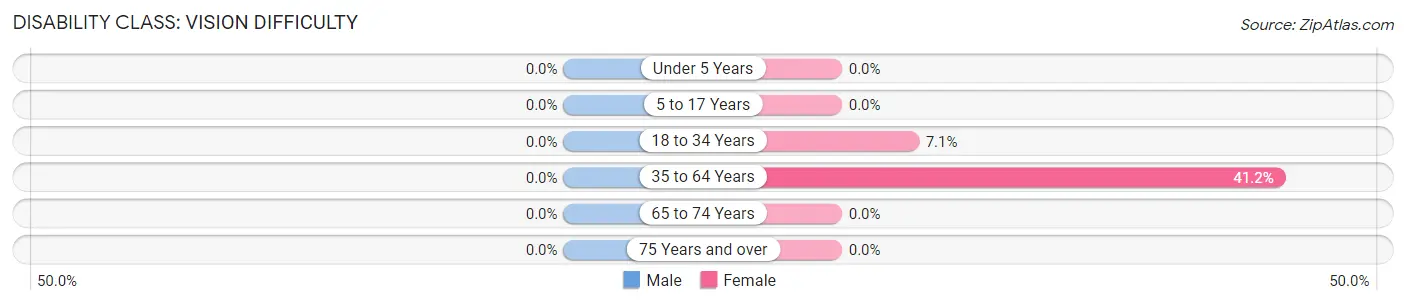
| Age Bracket | Male | Female |
| Under 5 Years | 0 (0.0%) | 0 (0.0%) |
| 5 to 17 Years | 0 (0.0%) | 0 (0.0%) |
| 18 to 34 Years | 0 (0.0%) | 4 (7.1%) |
| 35 to 64 Years | 0 (0.0%) | 7 (41.2%) |
| 65 to 74 Years | 0 (0.0%) | 0 (0.0%) |
| 75 Years and over | 0 (0.0%) | 0 (0.0%) |
Disability Class: Cognitive Difficulty
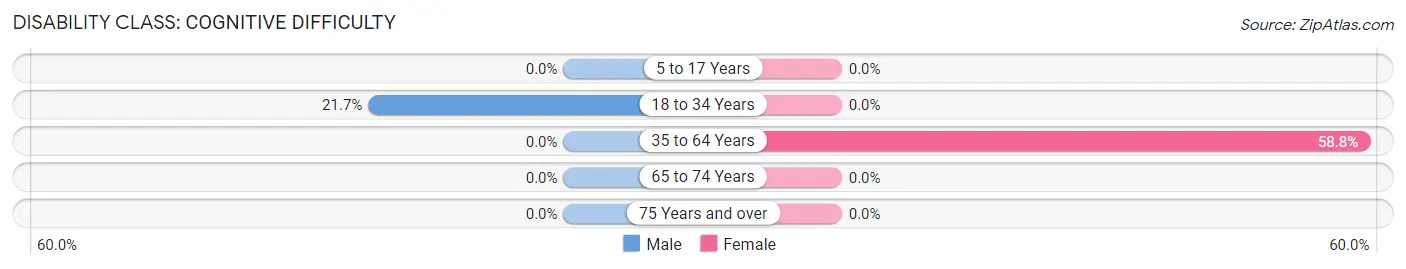
| Age Bracket | Male | Female |
| 5 to 17 Years | 0 (0.0%) | 0 (0.0%) |
| 18 to 34 Years | 5 (21.7%) | 0 (0.0%) |
| 35 to 64 Years | 0 (0.0%) | 10 (58.8%) |
| 65 to 74 Years | 0 (0.0%) | 0 (0.0%) |
| 75 Years and over | 0 (0.0%) | 0 (0.0%) |
Disability Class: Ambulatory Difficulty
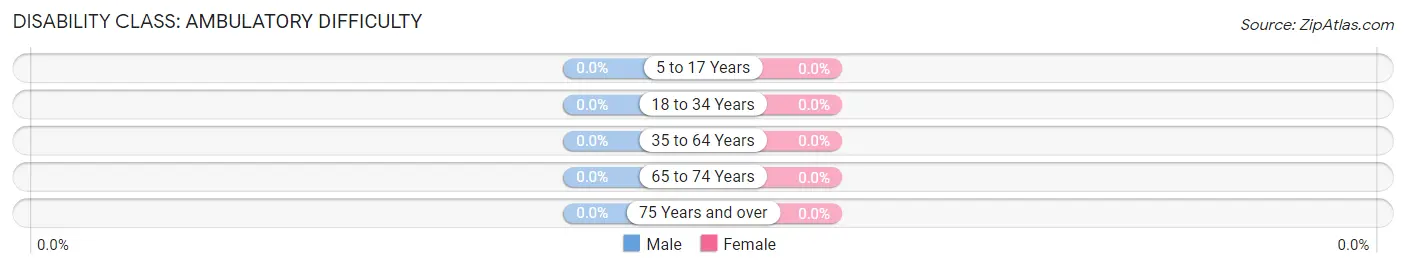
| Age Bracket | Male | Female |
| 5 to 17 Years | 0 (0.0%) | 0 (0.0%) |
| 18 to 34 Years | 0 (0.0%) | 0 (0.0%) |
| 35 to 64 Years | 0 (0.0%) | 0 (0.0%) |
| 65 to 74 Years | 0 (0.0%) | 0 (0.0%) |
| 75 Years and over | 0 (0.0%) | 0 (0.0%) |
Disability Class: Self-Care Difficulty
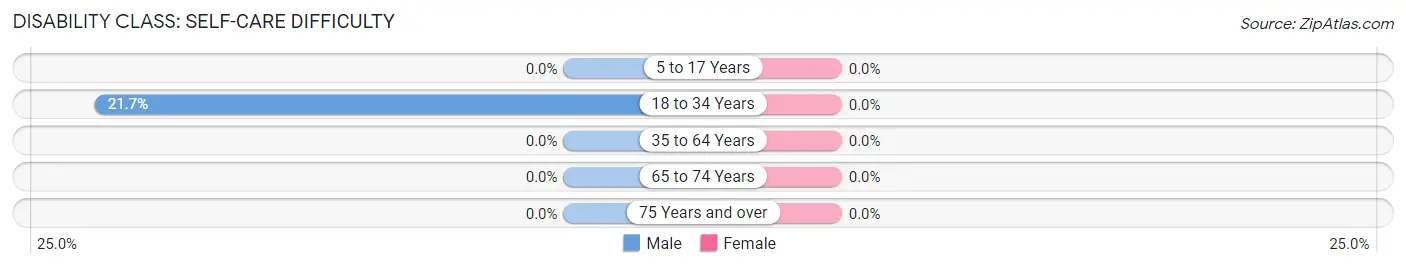
| Age Bracket | Male | Female |
| 5 to 17 Years | 0 (0.0%) | 0 (0.0%) |
| 18 to 34 Years | 5 (21.7%) | 0 (0.0%) |
| 35 to 64 Years | 0 (0.0%) | 0 (0.0%) |
| 65 to 74 Years | 0 (0.0%) | 0 (0.0%) |
| 75 Years and over | 0 (0.0%) | 0 (0.0%) |
Technology Access in East Point
Computing Device Access in East Point
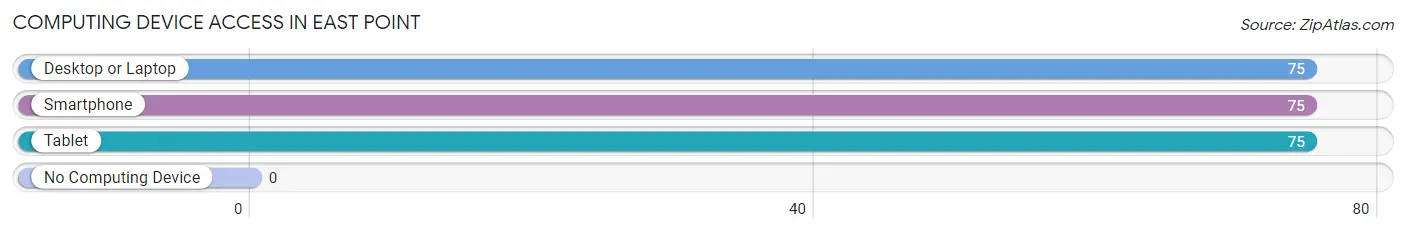
| Device Type | # Households | % Households |
| Desktop or Laptop | 75 | 100.0% |
| Smartphone | 75 | 100.0% |
| Tablet | 75 | 100.0% |
| No Computing Device | 0 | 0.0% |
| Total | 75 | 100.0% |
Internet Access in East Point
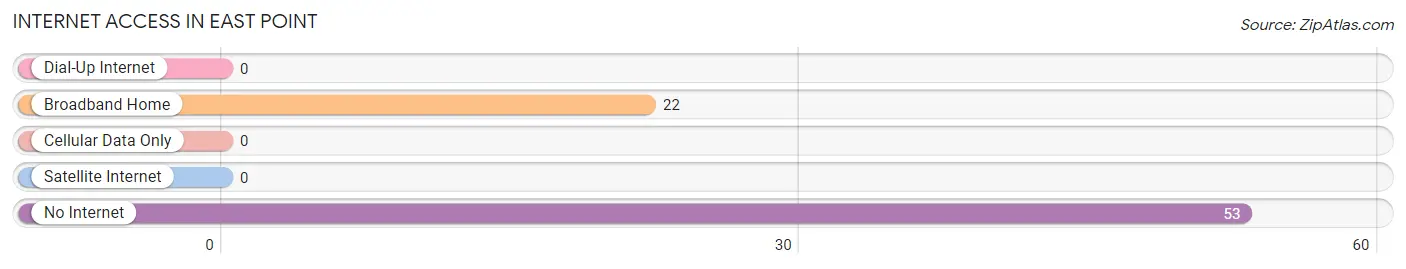
| Internet Type | # Households | % Households |
| Dial-Up Internet | 0 | 0.0% |
| Broadband Home | 22 | 29.3% |
| Cellular Data Only | 0 | 0.0% |
| Satellite Internet | 0 | 0.0% |
| No Internet | 53 | 70.7% |
| Total | 75 | 100.0% |
East Point Summary
Introduction
East Point is a city located in the state of Alabama, United States. It is located in the southeastern corner of the state, just south of the Georgia border. The city is part of the Atlanta metropolitan area and is located in Fulton County. East Point is a diverse city with a population of approximately 35,000 people.
History
East Point was first settled in the early 1800s by settlers from the Creek Nation. The city was originally known as "Creek Stand" and was a trading post for the Creek Nation. In 1854, the city was renamed East Point after the nearby railroad station. The city was incorporated in 1887 and was the first city in Fulton County to be incorporated.
East Point was a major industrial center during the early 20th century. The city was home to several factories, including a cotton mill, a paper mill, and a brick factory. The city also had a large number of stores and businesses.
During the 1950s and 1960s, East Point experienced a period of rapid growth. The city's population increased from 8,000 in 1950 to over 35,000 in 1970. This growth was due to the city's proximity to Atlanta and the growth of the Atlanta metropolitan area.
Geography
East Point is located in the southeastern corner of the state of Alabama, just south of the Georgia border. The city is part of the Atlanta metropolitan area and is located in Fulton County. East Point is situated on the banks of the Chattahoochee River and is bordered by the cities of College Park, Hapeville, and Atlanta.
The city has a total area of 8.3 square miles, of which 8.2 square miles is land and 0.1 square miles is water. The city has a humid subtropical climate, with hot, humid summers and mild winters.
Economy
East Point is a major economic center in the Atlanta metropolitan area. The city is home to several large businesses, including the East Point Business Park, which is home to over 200 businesses. The city is also home to several major retail stores, including Walmart, Target, and Home Depot.
The city's economy is also supported by the nearby Hartsfield-Jackson Atlanta International Airport, which is located just a few miles away. The airport is the busiest airport in the world and is a major economic driver for the region.
Demographics
As of the 2010 census, East Point had a population of 33,712 people. The city has a diverse population, with a majority of African Americans (63.3%), followed by Whites (30.2%), Hispanics (3.7%), and Asians (2.8%).
The median household income in East Point is $37,845, and the median family income is $45,845. The city has a poverty rate of 22.3%, which is higher than the national average.
Conclusion
East Point is a diverse city located in the southeastern corner of the state of Alabama. The city has a rich history and has been an important economic center in the Atlanta metropolitan area for many years. The city has a diverse population and a strong economy, supported by the nearby Hartsfield-Jackson Atlanta International Airport. East Point is a great place to live and work, and is a great example of the diversity and economic strength of the state of Alabama.
Common Questions
What is Per Capita Income in East Point?
Per Capita income in East Point is $19,532.
What is the Median Family Income in East Point?
Median Family Income in East Point is $78,821.
What is the Median Household income in East Point?
Median Household Income in East Point is $78,703.
What is Income or Wage Gap in East Point?
Income or Wage Gap in East Point is 39.6%.
Women in East Point earn 60.4 cents for every dollar earned by a man.
What is Inequality or Gini Index in East Point?
Inequality or Gini Index in East Point is 0.13.
What is the Total Population of East Point?
Total Population of East Point is 339.
What is the Total Male Population of East Point?
Total Male Population of East Point is 142.
What is the Total Female Population of East Point?
Total Female Population of East Point is 197.
What is the Ratio of Males per 100 Females in East Point?
There are 72.08 Males per 100 Females in East Point.
What is the Ratio of Females per 100 Males in East Point?
There are 138.73 Females per 100 Males in East Point.
What is the Median Population Age in East Point?
Median Population Age in East Point is 25.1 Years.
What is the Average Family Size in East Point
Average Family Size in East Point is 4.7 People.
What is the Average Household Size in East Point
Average Household Size in East Point is 4.5 People.
How Large is the Labor Force in East Point?
There are 170 People in the Labor Forcein in East Point.
What is the Percentage of People in the Labor Force in East Point?
87.2% of People are in the Labor Force in East Point.
What is the Unemployment Rate in East Point?
Unemployment Rate in East Point is 2.9%.