Alcorn State University, MS Map & Demographics
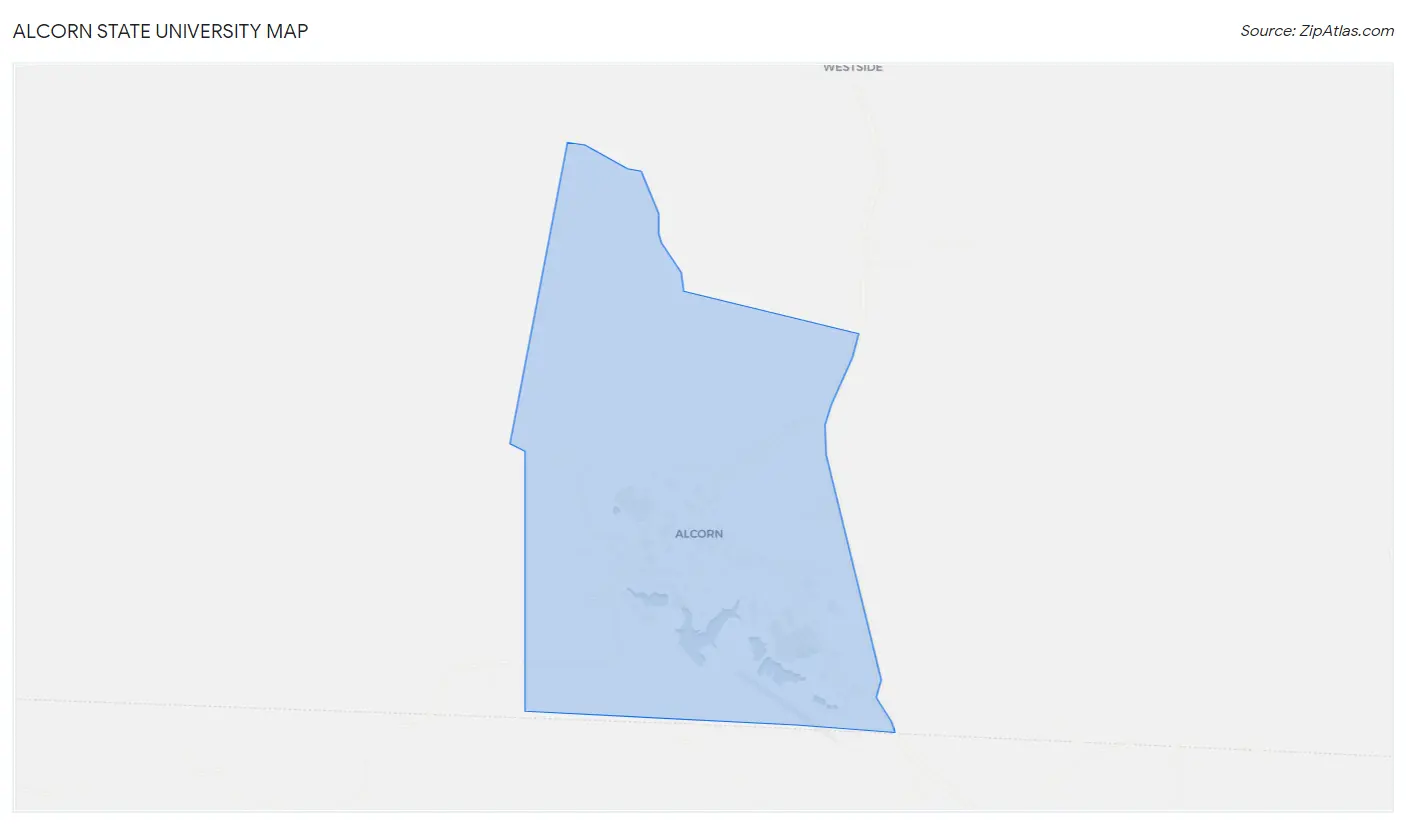
Alcorn State University Map
Alcorn State University Overview
$6,524
PER CAPITA INCOME
27.5%
WAGE / INCOME GAP [ % ]
72.5¢/ $1
WAGE / INCOME GAP [ $ ]
0.18
INEQUALITY / GINI INDEX
1,071
TOTAL POPULATION
493
MALE POPULATION
578
FEMALE POPULATION
85.29
MALES / 100 FEMALES
117.24
FEMALES / 100 MALES
20.0
MEDIAN AGE
2.2
AVG FAMILY SIZE
1.3
AVG HOUSEHOLD SIZE
491
LABOR FORCE [ PEOPLE ]
45.8%
PERCENT IN LABOR FORCE
1.0%
UNEMPLOYMENT RATE
Income in Alcorn State University
Income Overview in Alcorn State University
| Characteristic | Number | Measure |
| Per Capita Income | 1,071 | $6,524 |
| Median Family Income | 10 | $0 |
| Mean Family Income | 10 | $0 |
| Median Household Income | 35 | $0 |
| Mean Household Income | 35 | $0 |
| Income Deficit | 10 | $0 |
| Wage / Income Gap (%) | 1,071 | 27.51% |
| Wage / Income Gap ($) | 1,071 | 72.49¢ per $1 |
| Gini / Inequality Index | 1,071 | 0.18 |
Earnings by Sex in Alcorn State University
Average Earnings in Alcorn State University are $3,427, $2,730 for men and $3,766 for women, a difference of 27.5%.
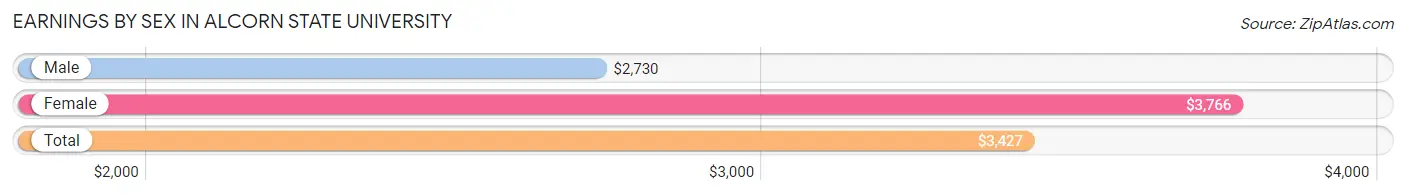
| Sex | Number | Average Earnings |
| Male | 353 (50.0%) | $2,730 |
| Female | 353 (50.0%) | $3,766 |
| Total | 706 (100.0%) | $3,427 |
Earnings by Sex by Income Bracket in Alcorn State University
The most common earnings brackets in Alcorn State University are $2,499 or less for men (173 | 49.0%) and $2,499 or less for women (137 | 38.8%).
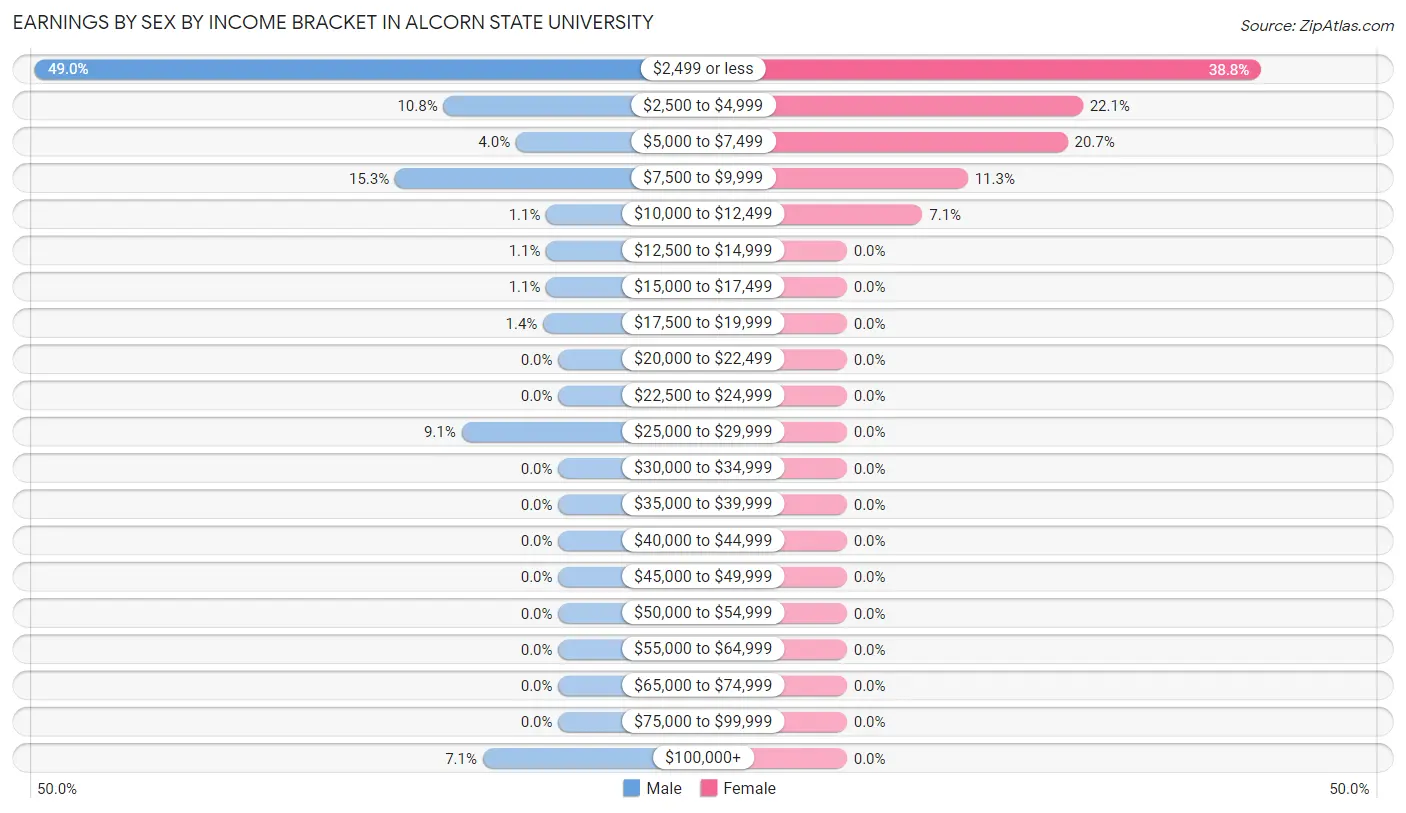
| Income | Male | Female |
| $2,499 or less | 173 (49.0%) | 137 (38.8%) |
| $2,500 to $4,999 | 38 (10.8%) | 78 (22.1%) |
| $5,000 to $7,499 | 14 (4.0%) | 73 (20.7%) |
| $7,500 to $9,999 | 54 (15.3%) | 40 (11.3%) |
| $10,000 to $12,499 | 4 (1.1%) | 25 (7.1%) |
| $12,500 to $14,999 | 4 (1.1%) | 0 (0.0%) |
| $15,000 to $17,499 | 4 (1.1%) | 0 (0.0%) |
| $17,500 to $19,999 | 5 (1.4%) | 0 (0.0%) |
| $20,000 to $22,499 | 0 (0.0%) | 0 (0.0%) |
| $22,500 to $24,999 | 0 (0.0%) | 0 (0.0%) |
| $25,000 to $29,999 | 32 (9.1%) | 0 (0.0%) |
| $30,000 to $34,999 | 0 (0.0%) | 0 (0.0%) |
| $35,000 to $39,999 | 0 (0.0%) | 0 (0.0%) |
| $40,000 to $44,999 | 0 (0.0%) | 0 (0.0%) |
| $45,000 to $49,999 | 0 (0.0%) | 0 (0.0%) |
| $50,000 to $54,999 | 0 (0.0%) | 0 (0.0%) |
| $55,000 to $64,999 | 0 (0.0%) | 0 (0.0%) |
| $65,000 to $74,999 | 0 (0.0%) | 0 (0.0%) |
| $75,000 to $99,999 | 0 (0.0%) | 0 (0.0%) |
| $100,000+ | 25 (7.1%) | 0 (0.0%) |
| Total | 353 (100.0%) | 353 (100.0%) |
Earnings by Sex by Educational Attainment in Alcorn State University
| Educational Attainment | Male Income | Female Income |
| Less than High School | - | - |
| High School Diploma | - | - |
| College or Associate's Degree | - | - |
| Bachelor's Degree | - | - |
| Graduate Degree | - | - |
| Total | - | - |
Family Income in Alcorn State University
Family Income Brackets in Alcorn State University
According to the Alcorn State University family income data, there are 10 families falling into the $25,000 to $34,999 income range, which is the most common income bracket and makes up 100.0% of all families.
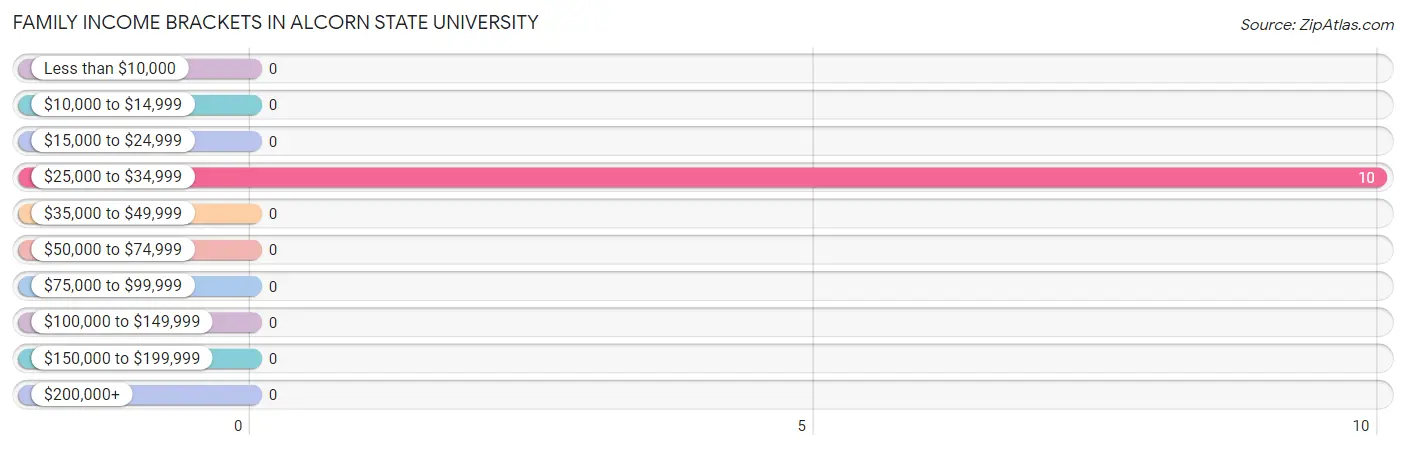
| Income Bracket | # Families | % Families |
| Less than $10,000 | 0 | 0.0% |
| $10,000 to $14,999 | 0 | 0.0% |
| $15,000 to $24,999 | 0 | 0.0% |
| $25,000 to $34,999 | 10 | 100.0% |
| $35,000 to $49,999 | 0 | 0.0% |
| $50,000 to $74,999 | 0 | 0.0% |
| $75,000 to $99,999 | 0 | 0.0% |
| $100,000 to $149,999 | 0 | 0.0% |
| $150,000 to $199,999 | 0 | 0.0% |
| $200,000+ | 0 | 0.0% |
Family Income by Famaliy Size in Alcorn State University
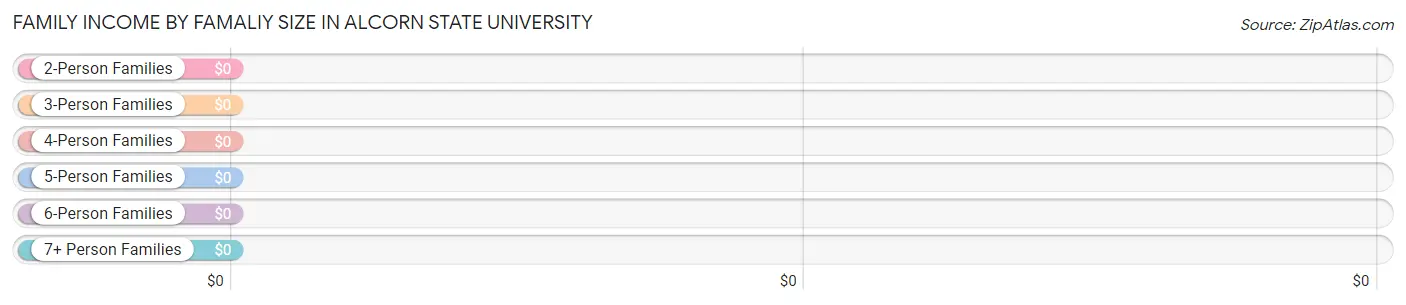
| Income Bracket | # Families | Median Income |
| 2-Person Families | 10 (100.0%) | $0 |
| 3-Person Families | 0 (0.0%) | $0 |
| 4-Person Families | 0 (0.0%) | $0 |
| 5-Person Families | 0 (0.0%) | $0 |
| 6-Person Families | 0 (0.0%) | $0 |
| 7+ Person Families | 0 (0.0%) | $0 |
| Total | 10 (100.0%) | $0 |
Family Income by Number of Earners in Alcorn State University
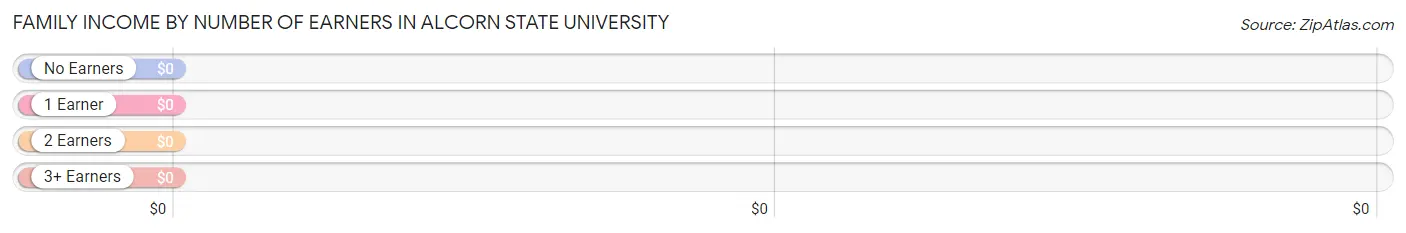
| Number of Earners | # Families | Median Income |
| No Earners | 0 (0.0%) | $0 |
| 1 Earner | 10 (100.0%) | $0 |
| 2 Earners | 0 (0.0%) | $0 |
| 3+ Earners | 0 (0.0%) | $0 |
| Total | 10 (100.0%) | $0 |
Household Income in Alcorn State University
Household Income Brackets in Alcorn State University
With 25 households falling in the category, the $100,000 to $149,999 income range is the most frequent in Alcorn State University, accounting for 71.4% of all households.
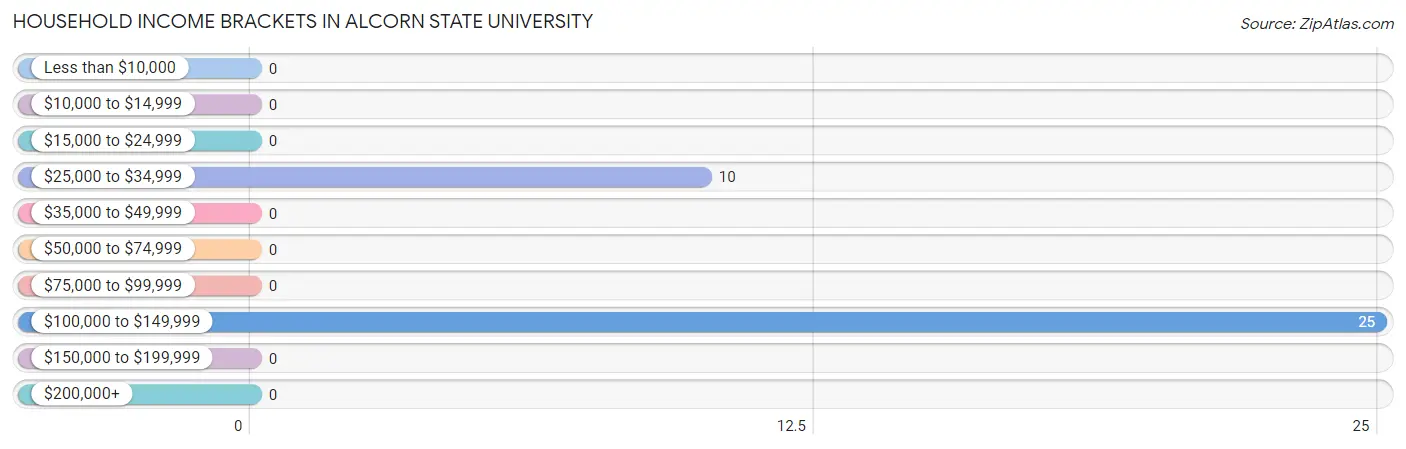
| Income Bracket | # Households | % Households |
| Less than $10,000 | 0 | 0.0% |
| $10,000 to $14,999 | 0 | 0.0% |
| $15,000 to $24,999 | 0 | 0.0% |
| $25,000 to $34,999 | 10 | 28.6% |
| $35,000 to $49,999 | 0 | 0.0% |
| $50,000 to $74,999 | 0 | 0.0% |
| $75,000 to $99,999 | 0 | 0.0% |
| $100,000 to $149,999 | 25 | 71.4% |
| $150,000 to $199,999 | 0 | 0.0% |
| $200,000+ | 0 | 0.0% |
Household Income by Householder Age in Alcorn State University
| Income Bracket | # Households | Median Income |
| 15 to 24 Years | 0 (0.0%) | $0 |
| 25 to 44 Years | 0 (0.0%) | $0 |
| 45 to 64 Years | 0 (0.0%) | $0 |
| 65+ Years | 35 (100.0%) | $0 |
| Total | 35 (100.0%) | $0 |
Poverty in Alcorn State University
Income Below Poverty by Sex and Age in Alcorn State University
| Age Bracket | Male | Female |
| Under 5 Years | 0 (0.0%) | 0 (0.0%) |
| 5 Years | 0 (0.0%) | 0 (0.0%) |
| 6 to 11 Years | 0 (0.0%) | 0 (0.0%) |
| 12 to 14 Years | 0 (0.0%) | 0 (0.0%) |
| 15 Years | 0 (0.0%) | 0 (0.0%) |
| 16 and 17 Years | 0 (0.0%) | 0 (0.0%) |
| 18 to 24 Years | 0 (0.0%) | 0 (0.0%) |
| 25 to 34 Years | 0 (0.0%) | 0 (0.0%) |
| 35 to 44 Years | 0 (0.0%) | 0 (0.0%) |
| 45 to 54 Years | 0 (0.0%) | 0 (0.0%) |
| 55 to 64 Years | 0 (0.0%) | 0 (0.0%) |
| 65 to 74 Years | 0 (0.0%) | 0 (0.0%) |
| 75 Years and over | 0 (0.0%) | 0 (0.0%) |
| Total | 0 (0.0%) | 0 (0.0%) |
Income Above Poverty by Sex and Age in Alcorn State University
According to the poverty statistics in Alcorn State University, males aged 65 to 74 years and females aged 45 to 54 years are the age groups that are most secure financially, with 100.0% of males and 100.0% of females in these age groups living above the poverty line.
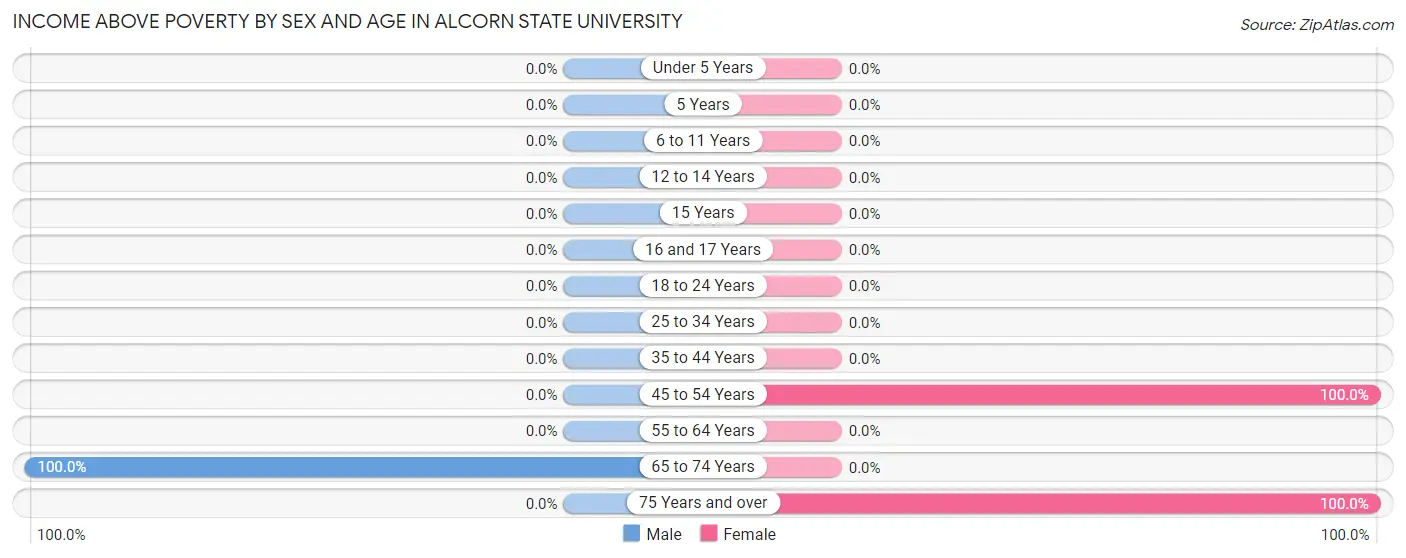
| Age Bracket | Male | Female |
| Under 5 Years | 0 (0.0%) | 0 (0.0%) |
| 5 Years | 0 (0.0%) | 0 (0.0%) |
| 6 to 11 Years | 0 (0.0%) | 0 (0.0%) |
| 12 to 14 Years | 0 (0.0%) | 0 (0.0%) |
| 15 Years | 0 (0.0%) | 0 (0.0%) |
| 16 and 17 Years | 0 (0.0%) | 0 (0.0%) |
| 18 to 24 Years | 0 (0.0%) | 0 (0.0%) |
| 25 to 34 Years | 0 (0.0%) | 0 (0.0%) |
| 35 to 44 Years | 0 (0.0%) | 0 (0.0%) |
| 45 to 54 Years | 0 (0.0%) | 12 (100.0%) |
| 55 to 64 Years | 0 (0.0%) | 0 (0.0%) |
| 65 to 74 Years | 25 (100.0%) | 0 (0.0%) |
| 75 Years and over | 0 (0.0%) | 10 (100.0%) |
| Total | 25 (100.0%) | 22 (100.0%) |
Income Below Poverty Among Married-Couple Families in Alcorn State University
| Children | Above Poverty | Below Poverty |
| No Children | 0 (0.0%) | 0 (0.0%) |
| 1 or 2 Children | 0 (0.0%) | 0 (0.0%) |
| 3 or 4 Children | 0 (0.0%) | 0 (0.0%) |
| 5 or more Children | 0 (0.0%) | 0 (0.0%) |
| Total | 0 (0.0%) | 0 (0.0%) |
Income Below Poverty Among Single-Parent Households in Alcorn State University
| Children | Single Father | Single Mother |
| No Children | 0 (0.0%) | 0 (0.0%) |
| 1 or 2 Children | 0 (0.0%) | 0 (0.0%) |
| 3 or 4 Children | 0 (0.0%) | 0 (0.0%) |
| 5 or more Children | 0 (0.0%) | 0 (0.0%) |
| Total | 0 (0.0%) | 0 (0.0%) |
Income Below Poverty Among Married-Couple vs Single-Parent Households in Alcorn State University
| Children | Married-Couple Families | Single-Parent Households |
| No Children | 0 (0.0%) | 0 (0.0%) |
| 1 or 2 Children | 0 (0.0%) | 0 (0.0%) |
| 3 or 4 Children | 0 (0.0%) | 0 (0.0%) |
| 5 or more Children | 0 (0.0%) | 0 (0.0%) |
| Total | 0 (0.0%) | 0 (0.0%) |
Race in Alcorn State University
The most populous races in Alcorn State University are Black / African American (1,061 | 99.1%), Hispanic or Latino (16 | 1.5%), and Some other Race (6 | 0.6%).
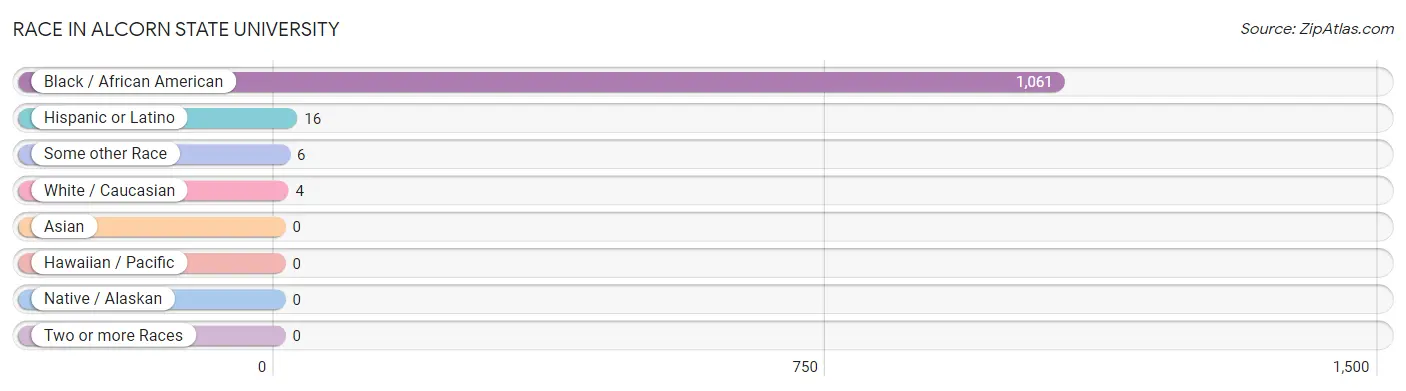
| Race | # Population | % Population |
| Asian | 0 | 0.0% |
| Black / African American | 1,061 | 99.1% |
| Hawaiian / Pacific | 0 | 0.0% |
| Hispanic or Latino | 16 | 1.5% |
| Native / Alaskan | 0 | 0.0% |
| White / Caucasian | 4 | 0.4% |
| Two or more Races | 0 | 0.0% |
| Some other Race | 6 | 0.6% |
| Total | 1,071 | 100.0% |
Ancestry in Alcorn State University
The most populous ancestries reported in Alcorn State University are Subsaharan African (64 | 6.0%), Nigerian (52 | 4.9%), African (12 | 1.1%), Puerto Rican (12 | 1.1%), and Central American (4 | 0.4%), together accounting for 13.5% of all Alcorn State University residents.
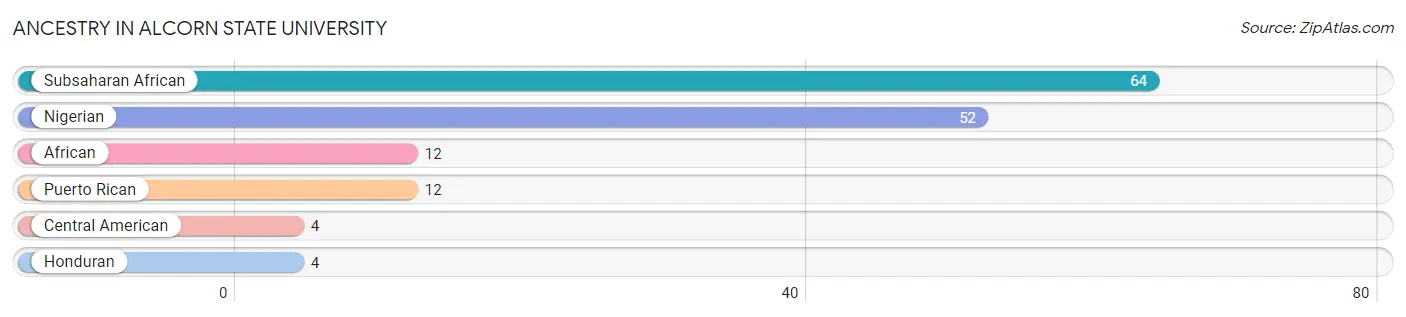
| Ancestry | # Population | % Population |
| African | 12 | 1.1% |
| Central American | 4 | 0.4% |
| Honduran | 4 | 0.4% |
| Nigerian | 52 | 4.9% |
| Puerto Rican | 12 | 1.1% |
| Subsaharan African | 64 | 6.0% | View All 6 Rows |
Immigrants in Alcorn State University
The most numerous immigrant groups reported in Alcorn State University came from Africa (64 | 6.0%), Nigeria (64 | 6.0%), and Western Africa (64 | 6.0%), together accounting for 17.9% of all Alcorn State University residents.
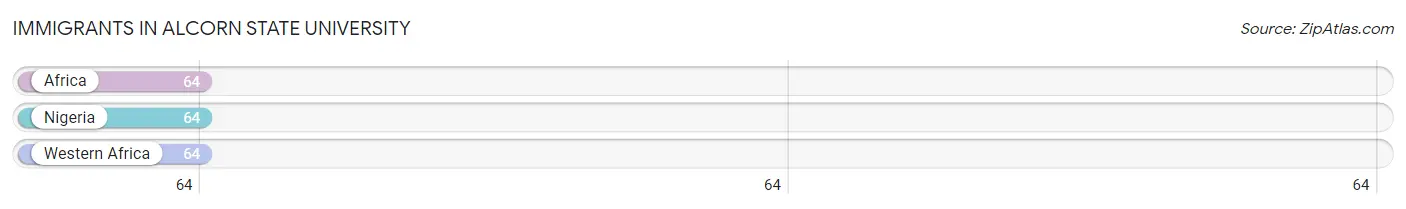
| Immigration Origin | # Population | % Population |
| Africa | 64 | 6.0% |
| Nigeria | 64 | 6.0% |
| Western Africa | 64 | 6.0% | View All 3 Rows |
Sex and Age in Alcorn State University
Sex and Age in Alcorn State University
The most populous age groups in Alcorn State University are 20 to 24 Years (321 | 65.1%) for men and 15 to 19 Years (384 | 66.4%) for women.
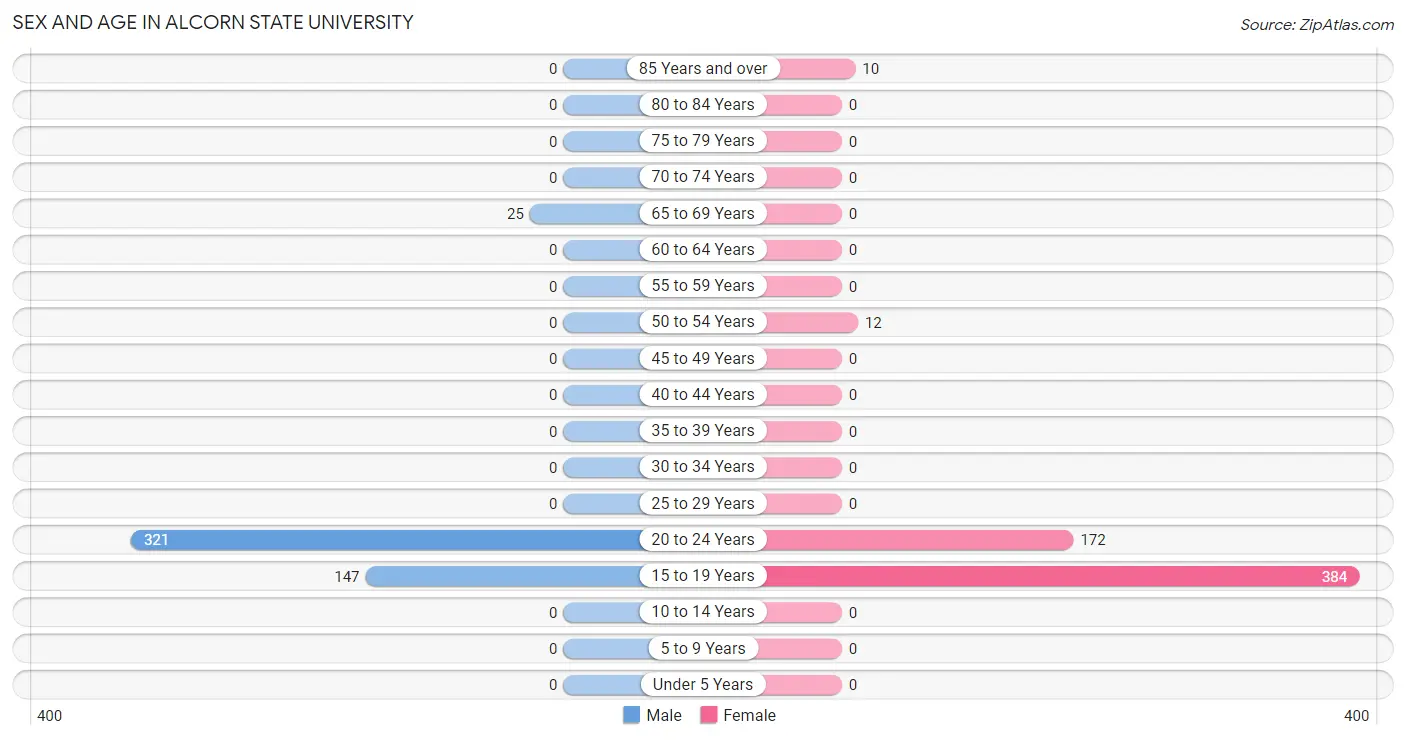
| Age Bracket | Male | Female |
| Under 5 Years | 0 (0.0%) | 0 (0.0%) |
| 5 to 9 Years | 0 (0.0%) | 0 (0.0%) |
| 10 to 14 Years | 0 (0.0%) | 0 (0.0%) |
| 15 to 19 Years | 147 (29.8%) | 384 (66.4%) |
| 20 to 24 Years | 321 (65.1%) | 172 (29.8%) |
| 25 to 29 Years | 0 (0.0%) | 0 (0.0%) |
| 30 to 34 Years | 0 (0.0%) | 0 (0.0%) |
| 35 to 39 Years | 0 (0.0%) | 0 (0.0%) |
| 40 to 44 Years | 0 (0.0%) | 0 (0.0%) |
| 45 to 49 Years | 0 (0.0%) | 0 (0.0%) |
| 50 to 54 Years | 0 (0.0%) | 12 (2.1%) |
| 55 to 59 Years | 0 (0.0%) | 0 (0.0%) |
| 60 to 64 Years | 0 (0.0%) | 0 (0.0%) |
| 65 to 69 Years | 25 (5.1%) | 0 (0.0%) |
| 70 to 74 Years | 0 (0.0%) | 0 (0.0%) |
| 75 to 79 Years | 0 (0.0%) | 0 (0.0%) |
| 80 to 84 Years | 0 (0.0%) | 0 (0.0%) |
| 85 Years and over | 0 (0.0%) | 10 (1.7%) |
| Total | 493 (100.0%) | 578 (100.0%) |
Families and Households in Alcorn State University
Median Family Size in Alcorn State University
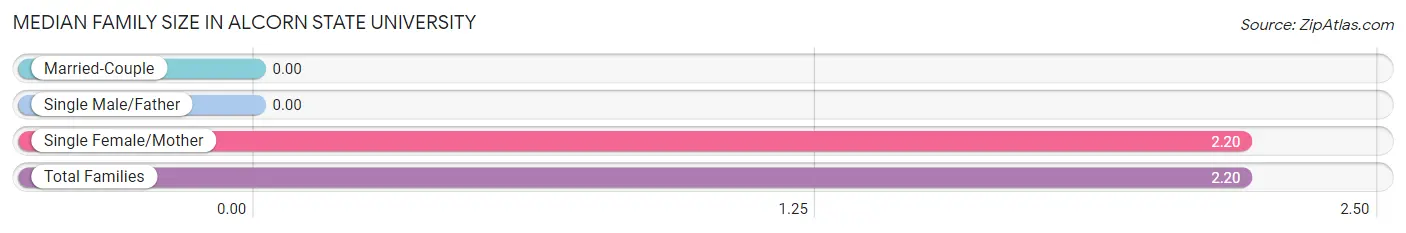
| Family Type | # Families | Family Size |
| Married-Couple | 0 (0.0%) | - |
| Single Male/Father | 0 (0.0%) | - |
| Single Female/Mother | 10 (100.0%) | 2.20 |
| Total Families | 10 (100.0%) | 2.20 |
Median Household Size in Alcorn State University
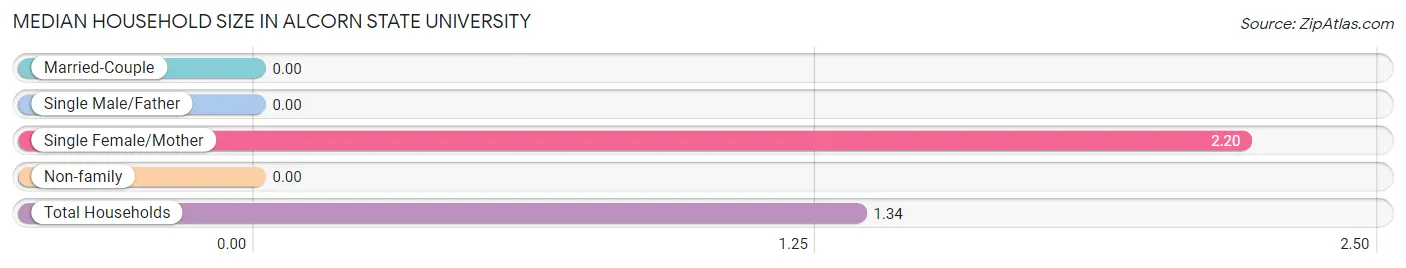
| Household Type | # Households | Household Size |
| Married-Couple | 0 (0.0%) | - |
| Single Male/Father | 0 (0.0%) | - |
| Single Female/Mother | 10 (28.6%) | 2.20 |
| Non-family | 25 (71.4%) | - |
| Total Households | 35 (100.0%) | 1.34 |
Household Size by Marriage Status in Alcorn State University
Out of a total of 35 households in Alcorn State University, 10 (28.6%) are family households, while 25 (71.4%) are nonfamily households. The most numerous type of family households are 2-person households, comprising 10, and the most common type of nonfamily households are 1-person households, comprising 25.
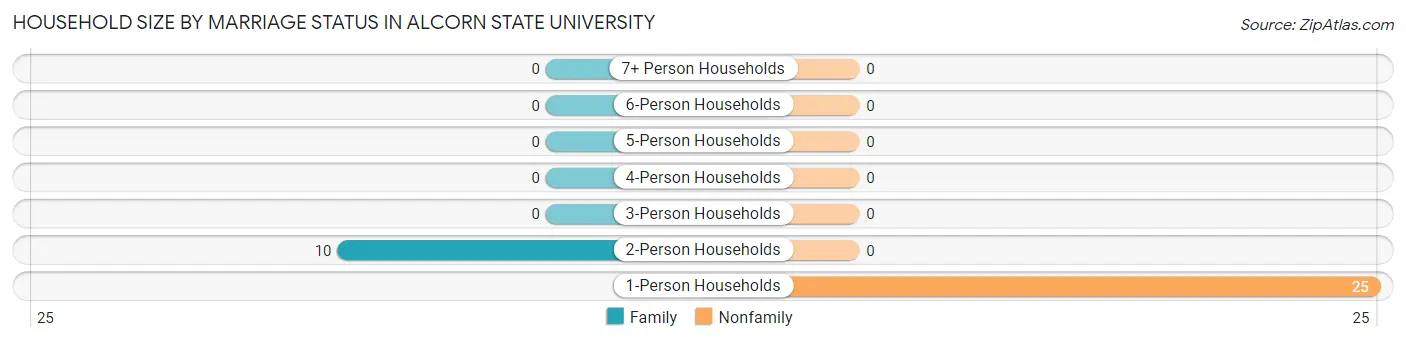
| Household Size | Family Households | Nonfamily Households |
| 1-Person Households | - | 25 (71.4%) |
| 2-Person Households | 10 (28.6%) | 0 (0.0%) |
| 3-Person Households | 0 (0.0%) | 0 (0.0%) |
| 4-Person Households | 0 (0.0%) | 0 (0.0%) |
| 5-Person Households | 0 (0.0%) | 0 (0.0%) |
| 6-Person Households | 0 (0.0%) | 0 (0.0%) |
| 7+ Person Households | 0 (0.0%) | 0 (0.0%) |
| Total | 10 (28.6%) | 25 (71.4%) |
Female Fertility in Alcorn State University
Fertility by Age in Alcorn State University
| Age Bracket | Women with Births | Births / 1,000 Women |
| 15 to 19 years | 0 (0.0%) | 0.0 |
| 20 to 34 years | 0 (0.0%) | 0.0 |
| 35 to 50 years | 0 (0.0%) | 0.0 |
| Total | 0 (0.0%) | 0.0 |
Fertility by Age by Marriage Status in Alcorn State University
| Age Bracket | Married | Unmarried |
| 15 to 19 years | 0 (0.0%) | 0 (0.0%) |
| 20 to 34 years | 0 (0.0%) | 0 (0.0%) |
| 35 to 50 years | 0 (0.0%) | 0 (0.0%) |
| Total | 0 (0.0%) | 0 (0.0%) |
Fertility by Education in Alcorn State University
| Educational Attainment | Women with Births | Births / 1,000 Women |
| Less than High School | 0 (0.0%) | 0.0 |
| High School Diploma | 0 (0.0%) | 0.0 |
| College or Associate's Degree | 0 (0.0%) | 0.0 |
| Bachelor's Degree | 0 (0.0%) | 0.0 |
| Graduate Degree | 0 (0.0%) | 0.0 |
| Total | 0 (0.0%) | 0.0 |
Fertility by Education by Marriage Status in Alcorn State University
| Educational Attainment | Married | Unmarried |
| Less than High School | 0 (0.0%) | 0 (0.0%) |
| High School Diploma | 0 (0.0%) | 0 (0.0%) |
| College or Associate's Degree | 0 (0.0%) | 0 (0.0%) |
| Bachelor's Degree | 0 (0.0%) | 0 (0.0%) |
| Graduate Degree | 0 (0.0%) | 0 (0.0%) |
| Total | 0 (0.0%) | 0 (0.0%) |
Employment Characteristics in Alcorn State University
Employment by Class of Employer in Alcorn State University
Among the 469 employed individuals in Alcorn State University, private company employees (215 | 45.8%), state government employees (192 | 40.9%), and not-for-profit organizations (50 | 10.7%) make up the most common classes of employment.
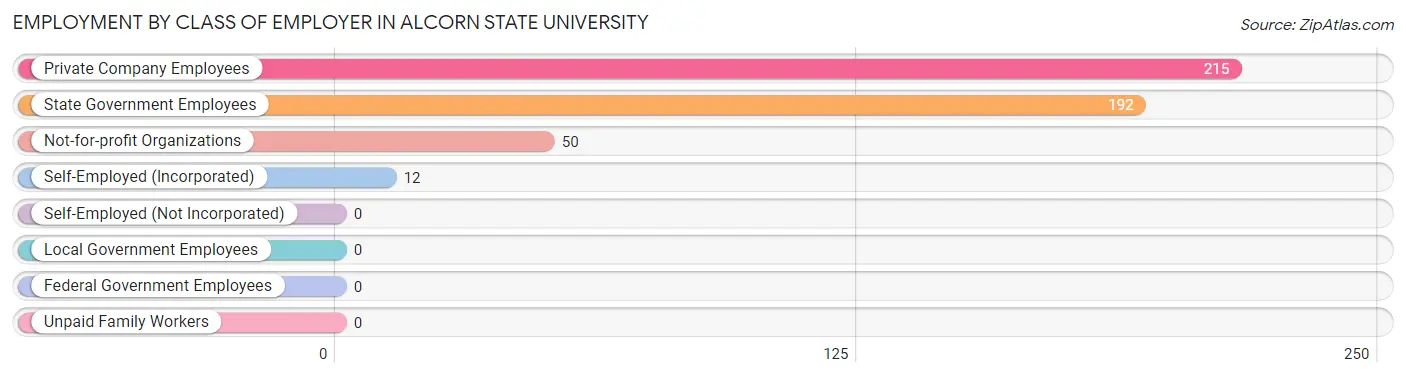
| Employer Class | # Employees | % Employees |
| Private Company Employees | 215 | 45.8% |
| Self-Employed (Incorporated) | 12 | 2.6% |
| Self-Employed (Not Incorporated) | 0 | 0.0% |
| Not-for-profit Organizations | 50 | 10.7% |
| Local Government Employees | 0 | 0.0% |
| State Government Employees | 192 | 40.9% |
| Federal Government Employees | 0 | 0.0% |
| Unpaid Family Workers | 0 | 0.0% |
| Total | 469 | 100.0% |
Employment Status by Age in Alcorn State University
According to the labor force statistics for Alcorn State University, out of the total population over 16 years of age (1,071), 45.8% or 491 individuals are in the labor force, with 1.0% or 5 of them unemployed. The age group with the highest labor force participation rate is 65 to 74 years, with 100.0% or 25 individuals in the labor force. Within the labor force, the 20 to 24 years age range has the highest percentage of unemployed individuals, with 2.0% or 5 of them being unemployed.
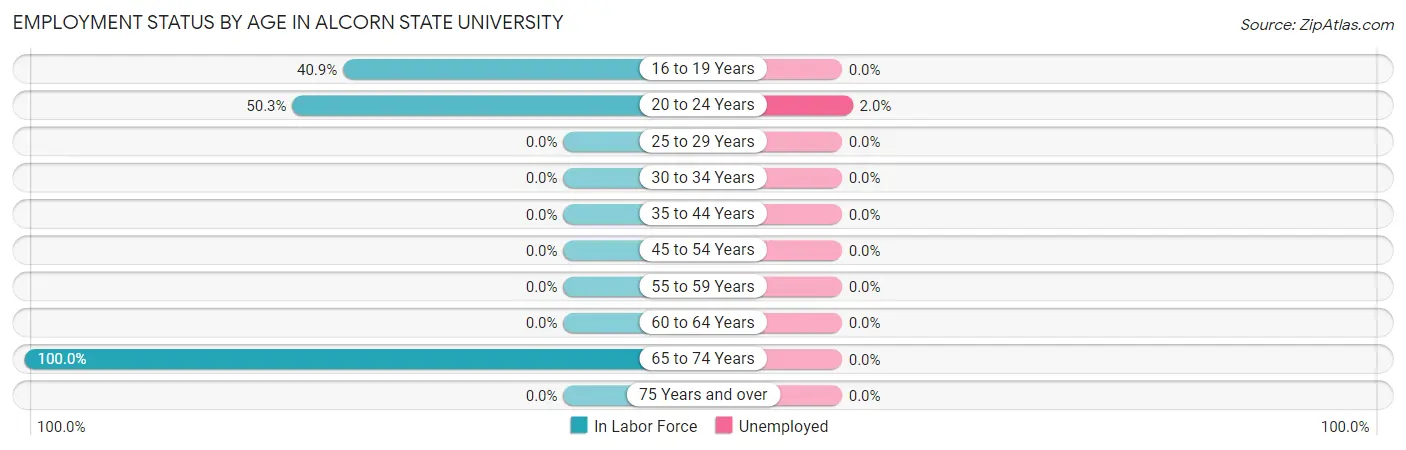
| Age Bracket | In Labor Force | Unemployed |
| 16 to 19 Years | 217 (40.9%) | 0 (0.0%) |
| 20 to 24 Years | 248 (50.3%) | 5 (2.0%) |
| 25 to 29 Years | 0 (0.0%) | 0 (0.0%) |
| 30 to 34 Years | 0 (0.0%) | 0 (0.0%) |
| 35 to 44 Years | 0 (0.0%) | 0 (0.0%) |
| 45 to 54 Years | 0 (0.0%) | 0 (0.0%) |
| 55 to 59 Years | 0 (0.0%) | 0 (0.0%) |
| 60 to 64 Years | 0 (0.0%) | 0 (0.0%) |
| 65 to 74 Years | 25 (100.0%) | 0 (0.0%) |
| 75 Years and over | 0 (0.0%) | 0 (0.0%) |
| Total | 491 (45.8%) | 5 (1.0%) |
Employment Status by Educational Attainment in Alcorn State University
| Educational Attainment | In Labor Force | Unemployed |
| Less than High School | 0 (0.0%) | 0 (0.0%) |
| High School Diploma | 0 (0.0%) | 0 (0.0%) |
| College / Associate Degree | 0 (0.0%) | 0 (0.0%) |
| Bachelor's Degree or higher | 0 (0.0%) | 0 (0.0%) |
| Total | 0 (0.0%) | 0 (0.0%) |
Employment Occupations by Sex in Alcorn State University
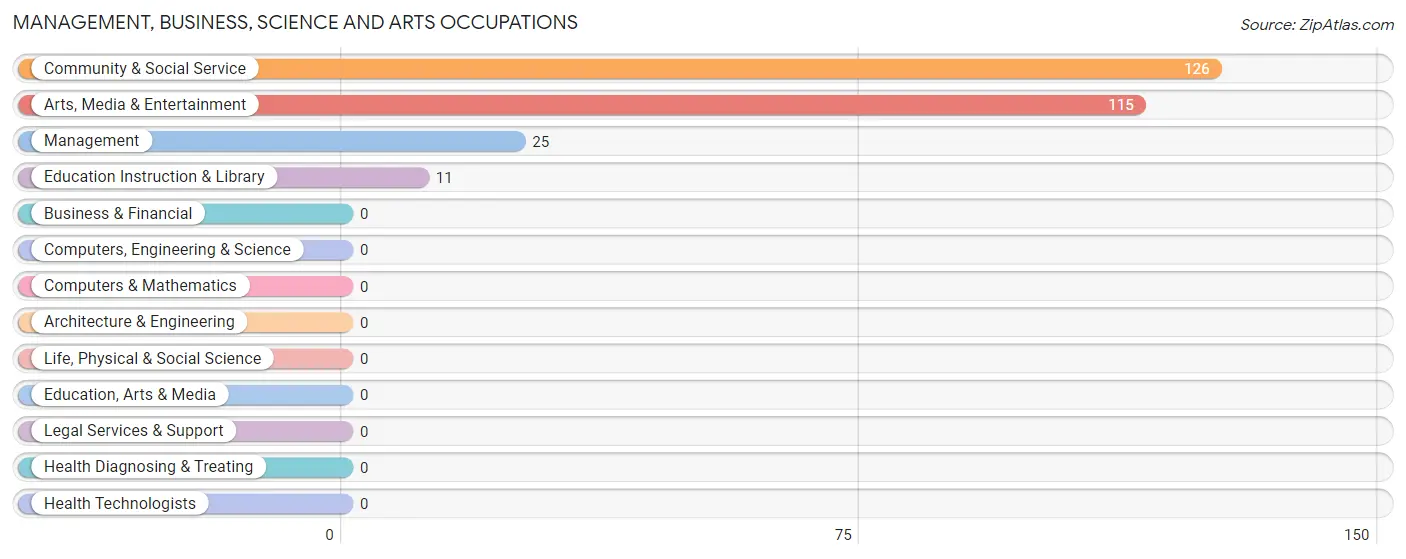
Management, Business, Science and Arts Occupations
The most common Management, Business, Science and Arts occupations in Alcorn State University are Community & Social Service (126 | 26.0%), Arts, Media & Entertainment (115 | 23.7%), Management (25 | 5.1%), and Education Instruction & Library (11 | 2.3%).
Management, Business, Science and Arts Occupations by Sex
Within the Management, Business, Science and Arts occupations in Alcorn State University, the most male-oriented occupations are Arts, Media & Entertainment (65.2%), and Community & Social Service (59.5%), while the most female-oriented occupations are Management (100.0%), Education Instruction & Library (100.0%), and Community & Social Service (40.5%).
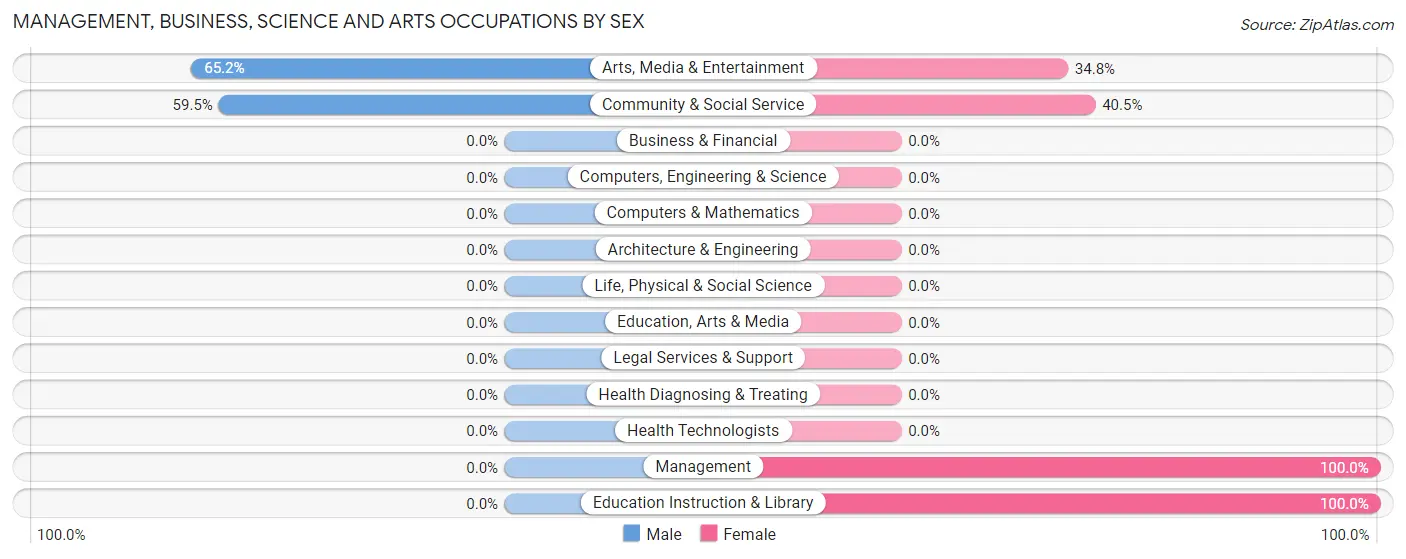
| Occupation | Male | Female |
| Management | 0 (0.0%) | 25 (100.0%) |
| Business & Financial | 0 (0.0%) | 0 (0.0%) |
| Computers, Engineering & Science | 0 (0.0%) | 0 (0.0%) |
| Computers & Mathematics | 0 (0.0%) | 0 (0.0%) |
| Architecture & Engineering | 0 (0.0%) | 0 (0.0%) |
| Life, Physical & Social Science | 0 (0.0%) | 0 (0.0%) |
| Community & Social Service | 75 (59.5%) | 51 (40.5%) |
| Education, Arts & Media | 0 (0.0%) | 0 (0.0%) |
| Legal Services & Support | 0 (0.0%) | 0 (0.0%) |
| Education Instruction & Library | 0 (0.0%) | 11 (100.0%) |
| Arts, Media & Entertainment | 75 (65.2%) | 40 (34.8%) |
| Health Diagnosing & Treating | 0 (0.0%) | 0 (0.0%) |
| Health Technologists | 0 (0.0%) | 0 (0.0%) |
| Total (Category) | 75 (49.7%) | 76 (50.3%) |
| Total (Overall) | 204 (42.1%) | 281 (57.9%) |
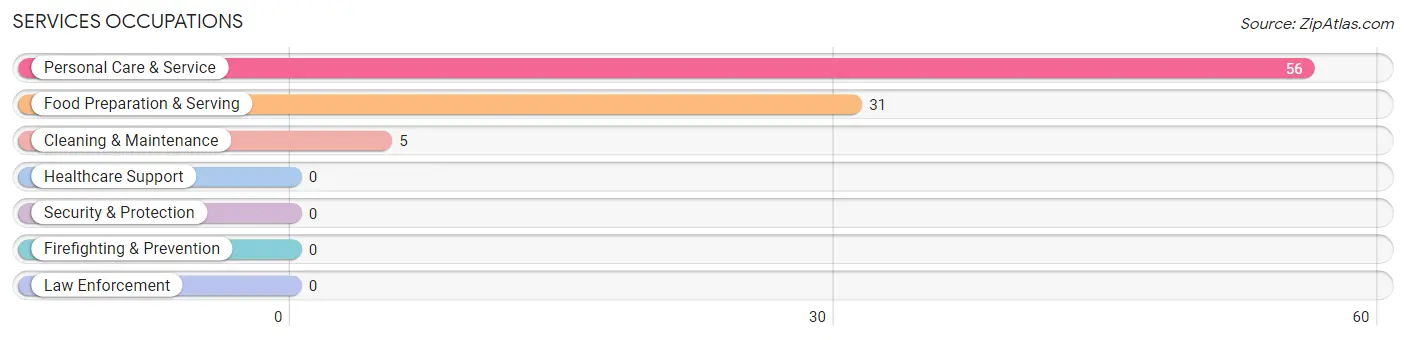
Services Occupations
The most common Services occupations in Alcorn State University are Personal Care & Service (56 | 11.6%), Food Preparation & Serving (31 | 6.4%), and Cleaning & Maintenance (5 | 1.0%).
Services Occupations by Sex
Within the Services occupations in Alcorn State University, the most male-oriented occupations are Cleaning & Maintenance (100.0%), Food Preparation & Serving (61.3%), and Personal Care & Service (19.6%), while the most female-oriented occupations are Personal Care & Service (80.4%), and Food Preparation & Serving (38.7%).
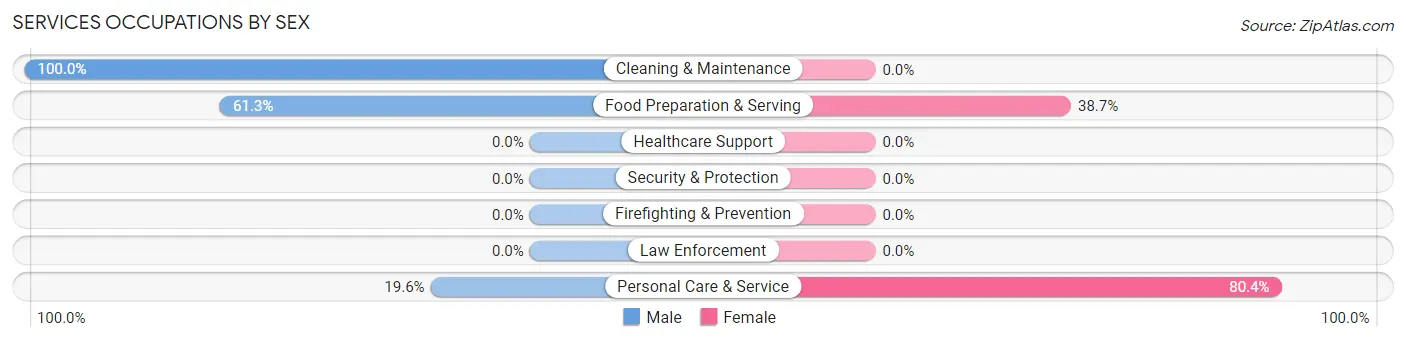
| Occupation | Male | Female |
| Healthcare Support | 0 (0.0%) | 0 (0.0%) |
| Security & Protection | 0 (0.0%) | 0 (0.0%) |
| Firefighting & Prevention | 0 (0.0%) | 0 (0.0%) |
| Law Enforcement | 0 (0.0%) | 0 (0.0%) |
| Food Preparation & Serving | 19 (61.3%) | 12 (38.7%) |
| Cleaning & Maintenance | 5 (100.0%) | 0 (0.0%) |
| Personal Care & Service | 11 (19.6%) | 45 (80.4%) |
| Total (Category) | 35 (38.0%) | 57 (62.0%) |
| Total (Overall) | 204 (42.1%) | 281 (57.9%) |
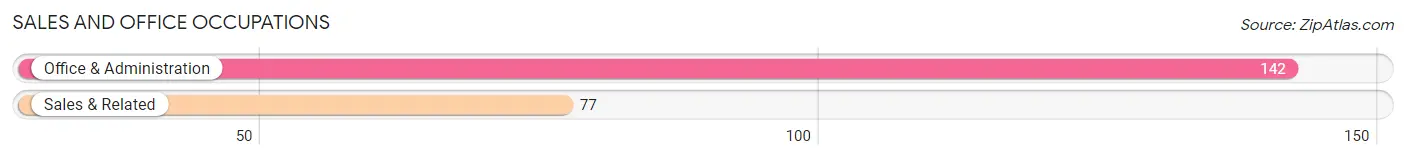
Sales and Office Occupations
The most common Sales and Office occupations in Alcorn State University are Office & Administration (142 | 29.3%), and Sales & Related (77 | 15.9%).
Sales and Office Occupations by Sex

| Occupation | Male | Female |
| Sales & Related | 5 (6.5%) | 72 (93.5%) |
| Office & Administration | 72 (50.7%) | 70 (49.3%) |
| Total (Category) | 77 (35.2%) | 142 (64.8%) |
| Total (Overall) | 204 (42.1%) | 281 (57.9%) |
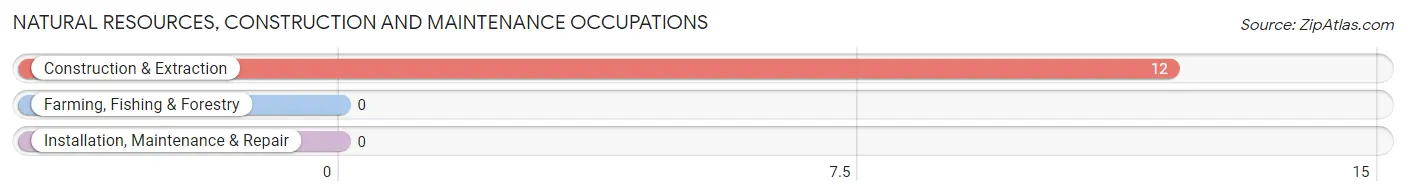
Natural Resources, Construction and Maintenance Occupations
The most common Natural Resources, Construction and Maintenance occupations in Alcorn State University are , and Construction & Extraction (12 | 2.5%).
Natural Resources, Construction and Maintenance Occupations by Sex

| Occupation | Male | Female |
| Farming, Fishing & Forestry | 0 (0.0%) | 0 (0.0%) |
| Construction & Extraction | 12 (100.0%) | 0 (0.0%) |
| Installation, Maintenance & Repair | 0 (0.0%) | 0 (0.0%) |
| Total (Category) | 12 (100.0%) | 0 (0.0%) |
| Total (Overall) | 204 (42.1%) | 281 (57.9%) |
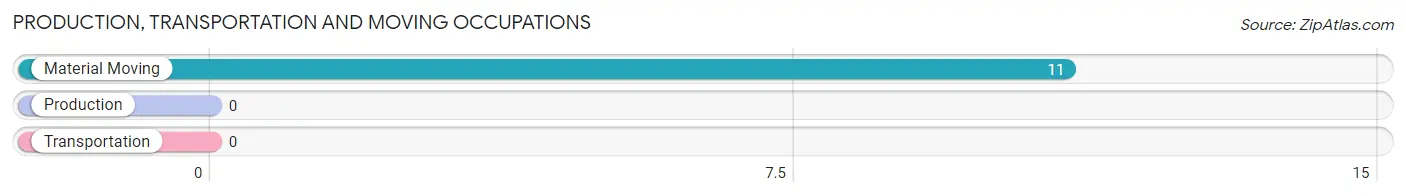
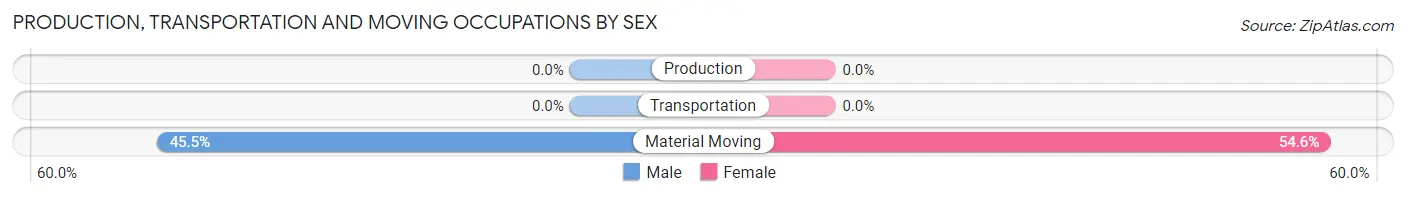
Production, Transportation and Moving Occupations
The most common Production, Transportation and Moving occupations in Alcorn State University are , and Material Moving (11 | 2.3%).
Production, Transportation and Moving Occupations by Sex
| Occupation | Male | Female |
| Production | 0 (0.0%) | 0 (0.0%) |
| Transportation | 0 (0.0%) | 0 (0.0%) |
| Material Moving | 5 (45.5%) | 6 (54.5%) |
| Total (Category) | 5 (45.5%) | 6 (54.5%) |
| Total (Overall) | 204 (42.1%) | 281 (57.9%) |
Employment Industries by Sex in Alcorn State University
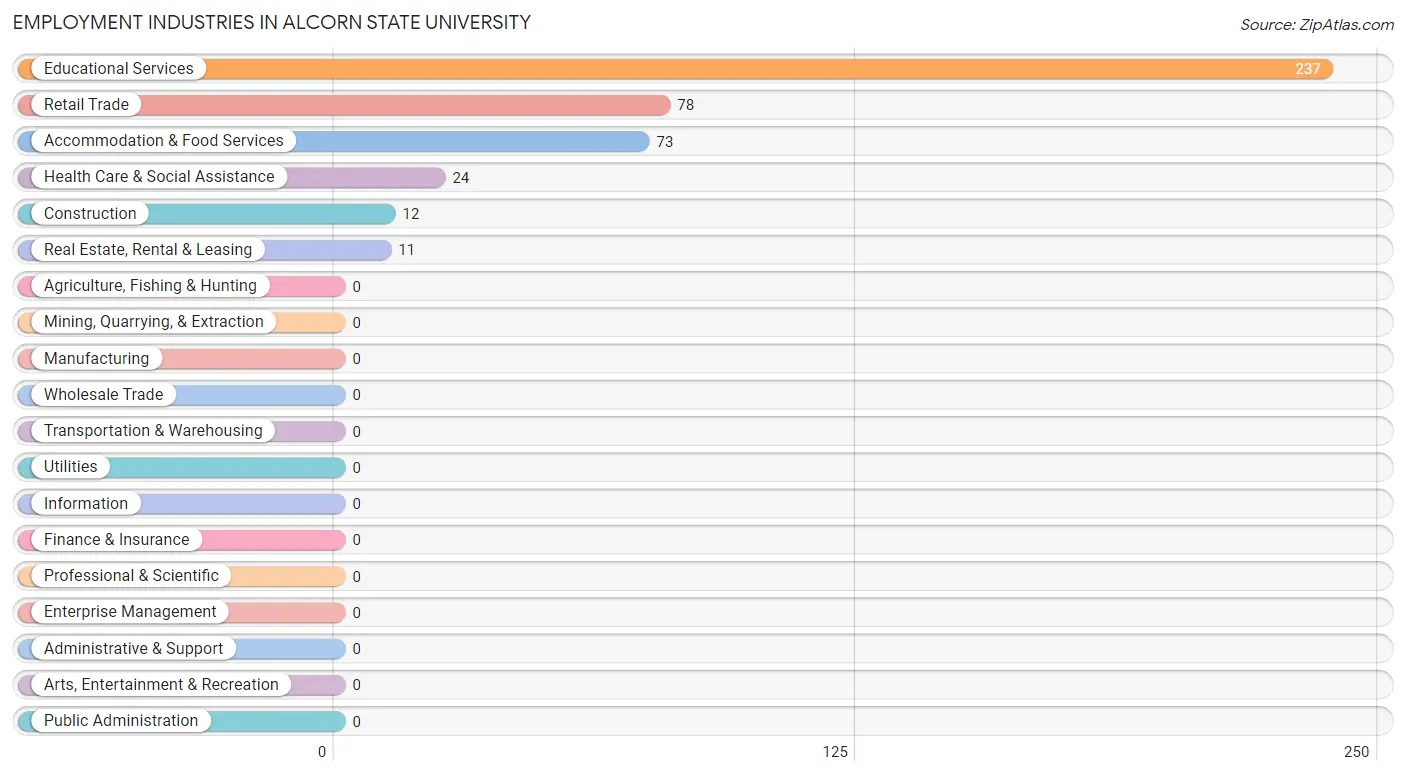
Employment Industries in Alcorn State University
The major employment industries in Alcorn State University include Educational Services (237 | 48.9%), Retail Trade (78 | 16.1%), Accommodation & Food Services (73 | 15.0%), Health Care & Social Assistance (24 | 5.0%), and Construction (12 | 2.5%).
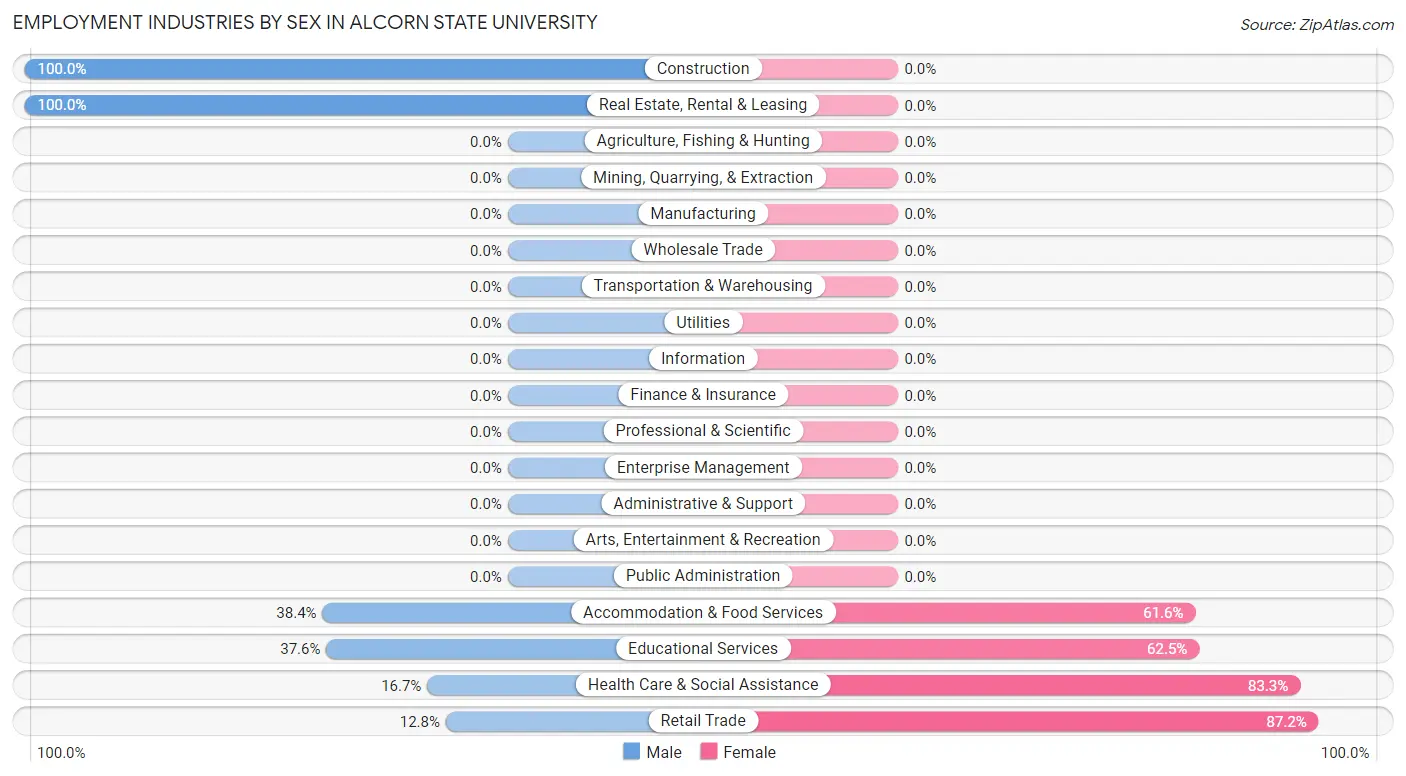
Employment Industries by Sex in Alcorn State University
The Alcorn State University industries that see more men than women are Construction (100.0%), Real Estate, Rental & Leasing (100.0%), and Accommodation & Food Services (38.4%), whereas the industries that tend to have a higher number of women are Retail Trade (87.2%), Health Care & Social Assistance (83.3%), and Educational Services (62.5%).
| Industry | Male | Female |
| Agriculture, Fishing & Hunting | 0 (0.0%) | 0 (0.0%) |
| Mining, Quarrying, & Extraction | 0 (0.0%) | 0 (0.0%) |
| Construction | 12 (100.0%) | 0 (0.0%) |
| Manufacturing | 0 (0.0%) | 0 (0.0%) |
| Wholesale Trade | 0 (0.0%) | 0 (0.0%) |
| Retail Trade | 10 (12.8%) | 68 (87.2%) |
| Transportation & Warehousing | 0 (0.0%) | 0 (0.0%) |
| Utilities | 0 (0.0%) | 0 (0.0%) |
| Information | 0 (0.0%) | 0 (0.0%) |
| Finance & Insurance | 0 (0.0%) | 0 (0.0%) |
| Real Estate, Rental & Leasing | 11 (100.0%) | 0 (0.0%) |
| Professional & Scientific | 0 (0.0%) | 0 (0.0%) |
| Enterprise Management | 0 (0.0%) | 0 (0.0%) |
| Administrative & Support | 0 (0.0%) | 0 (0.0%) |
| Educational Services | 89 (37.6%) | 148 (62.5%) |
| Health Care & Social Assistance | 4 (16.7%) | 20 (83.3%) |
| Arts, Entertainment & Recreation | 0 (0.0%) | 0 (0.0%) |
| Accommodation & Food Services | 28 (38.4%) | 45 (61.6%) |
| Public Administration | 0 (0.0%) | 0 (0.0%) |
| Total | 204 (42.1%) | 281 (57.9%) |
Education in Alcorn State University
School Enrollment in Alcorn State University
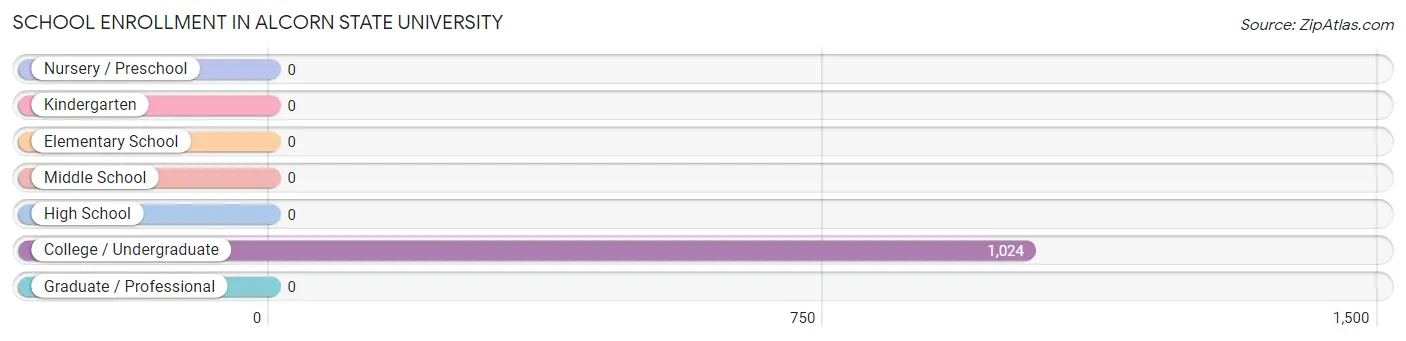
| School Level | # Students | % Students |
| Nursery / Preschool | 0 | 0.0% |
| Kindergarten | 0 | 0.0% |
| Elementary School | 0 | 0.0% |
| Middle School | 0 | 0.0% |
| High School | 0 | 0.0% |
| College / Undergraduate | 1,024 | 100.0% |
| Graduate / Professional | 0 | 0.0% |
| Total | 1,024 | 100.0% |
School Enrollment by Age by Funding Source in Alcorn State University
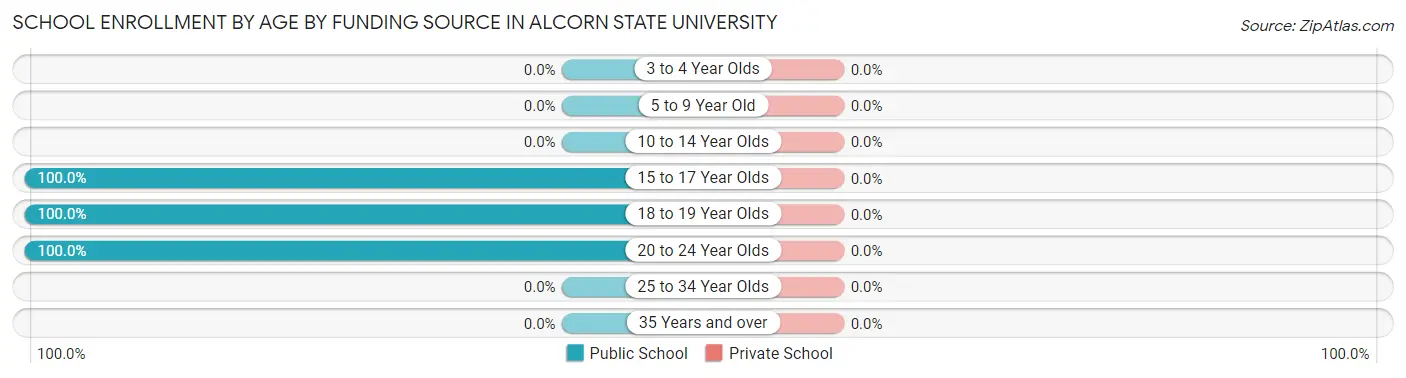
| Age Bracket | Public School | Private School |
| 3 to 4 Year Olds | 0 (0.0%) | 0 (0.0%) |
| 5 to 9 Year Old | 0 (0.0%) | 0 (0.0%) |
| 10 to 14 Year Olds | 0 (0.0%) | 0 (0.0%) |
| 15 to 17 Year Olds | 16 (100.0%) | 0 (0.0%) |
| 18 to 19 Year Olds | 515 (100.0%) | 0 (0.0%) |
| 20 to 24 Year Olds | 493 (100.0%) | 0 (0.0%) |
| 25 to 34 Year Olds | 0 (0.0%) | 0 (0.0%) |
| 35 Years and over | 0 (0.0%) | 0 (0.0%) |
| Total | 1,024 (100.0%) | 0 (0.0%) |
Educational Attainment by Field of Study in Alcorn State University
, and arts & humanities (10 | 100.0%) are the most common fields of study among 10 individuals in Alcorn State University who have obtained a bachelor's degree or higher.
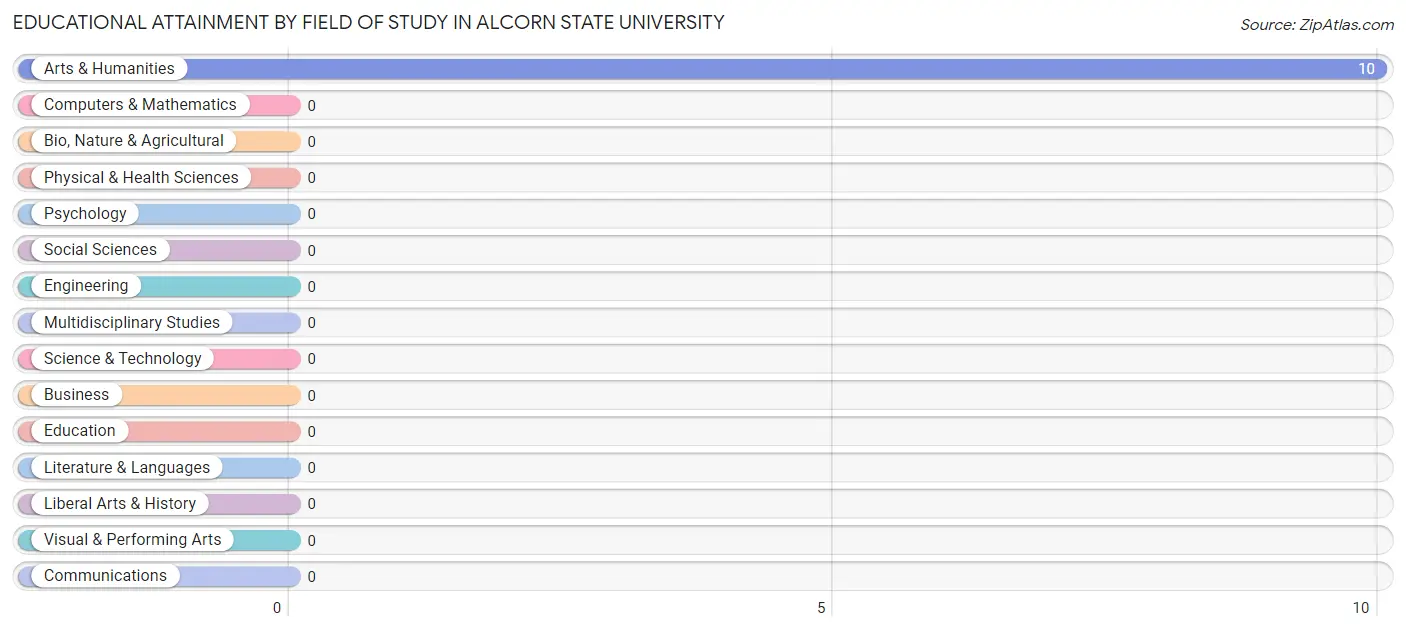
| Field of Study | # Graduates | % Graduates |
| Computers & Mathematics | 0 | 0.0% |
| Bio, Nature & Agricultural | 0 | 0.0% |
| Physical & Health Sciences | 0 | 0.0% |
| Psychology | 0 | 0.0% |
| Social Sciences | 0 | 0.0% |
| Engineering | 0 | 0.0% |
| Multidisciplinary Studies | 0 | 0.0% |
| Science & Technology | 0 | 0.0% |
| Business | 0 | 0.0% |
| Education | 0 | 0.0% |
| Literature & Languages | 0 | 0.0% |
| Liberal Arts & History | 0 | 0.0% |
| Visual & Performing Arts | 0 | 0.0% |
| Communications | 0 | 0.0% |
| Arts & Humanities | 10 | 100.0% |
| Total | 10 | 100.0% |
Transportation & Commute in Alcorn State University
Vehicle Availability by Sex in Alcorn State University
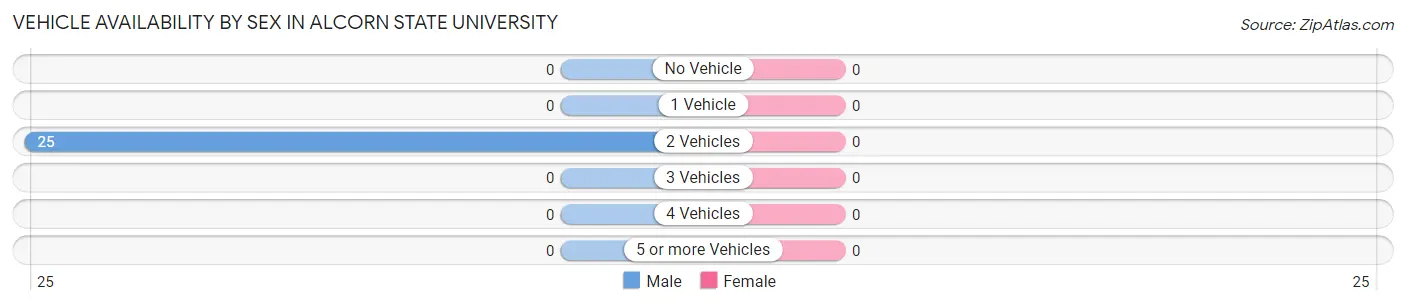
| Vehicles Available | Male | Female |
| No Vehicle | 0 (0.0%) | 0 (0.0%) |
| 1 Vehicle | 0 (0.0%) | 0 (0.0%) |
| 2 Vehicles | 25 (100.0%) | 0 (0.0%) |
| 3 Vehicles | 0 (0.0%) | 0 (0.0%) |
| 4 Vehicles | 0 (0.0%) | 0 (0.0%) |
| 5 or more Vehicles | 0 (0.0%) | 0 (0.0%) |
| Total | 25 (100.0%) | 0 (0.0%) |
Commute Time in Alcorn State University
The most frequently occuring commute durations in Alcorn State University are 5 to 9 minutes (203 commuters, 47.5%), 10 to 14 minutes (88 commuters, 20.6%), and 60 to 89 minutes (50 commuters, 11.7%).
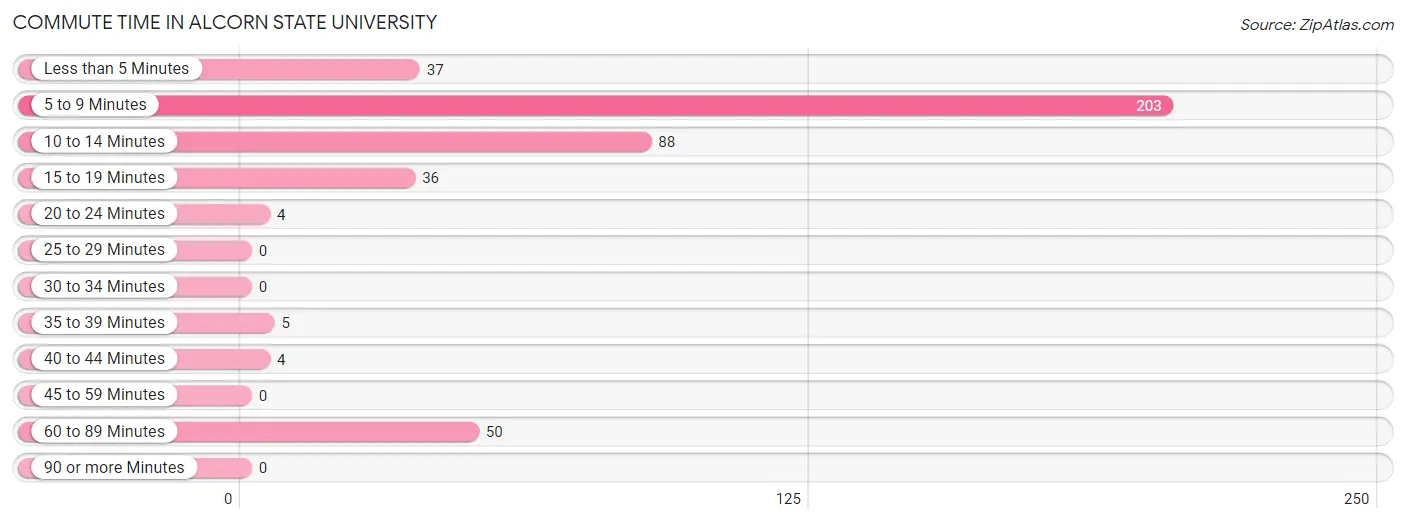
| Commute Time | # Commuters | % Commuters |
| Less than 5 Minutes | 37 | 8.7% |
| 5 to 9 Minutes | 203 | 47.5% |
| 10 to 14 Minutes | 88 | 20.6% |
| 15 to 19 Minutes | 36 | 8.4% |
| 20 to 24 Minutes | 4 | 0.9% |
| 25 to 29 Minutes | 0 | 0.0% |
| 30 to 34 Minutes | 0 | 0.0% |
| 35 to 39 Minutes | 5 | 1.2% |
| 40 to 44 Minutes | 4 | 0.9% |
| 45 to 59 Minutes | 0 | 0.0% |
| 60 to 89 Minutes | 50 | 11.7% |
| 90 or more Minutes | 0 | 0.0% |
Commute Time by Sex in Alcorn State University
The most common commute times in Alcorn State University are 5 to 9 minutes (77 commuters, 41.0%) for males and 5 to 9 minutes (126 commuters, 52.7%) for females.
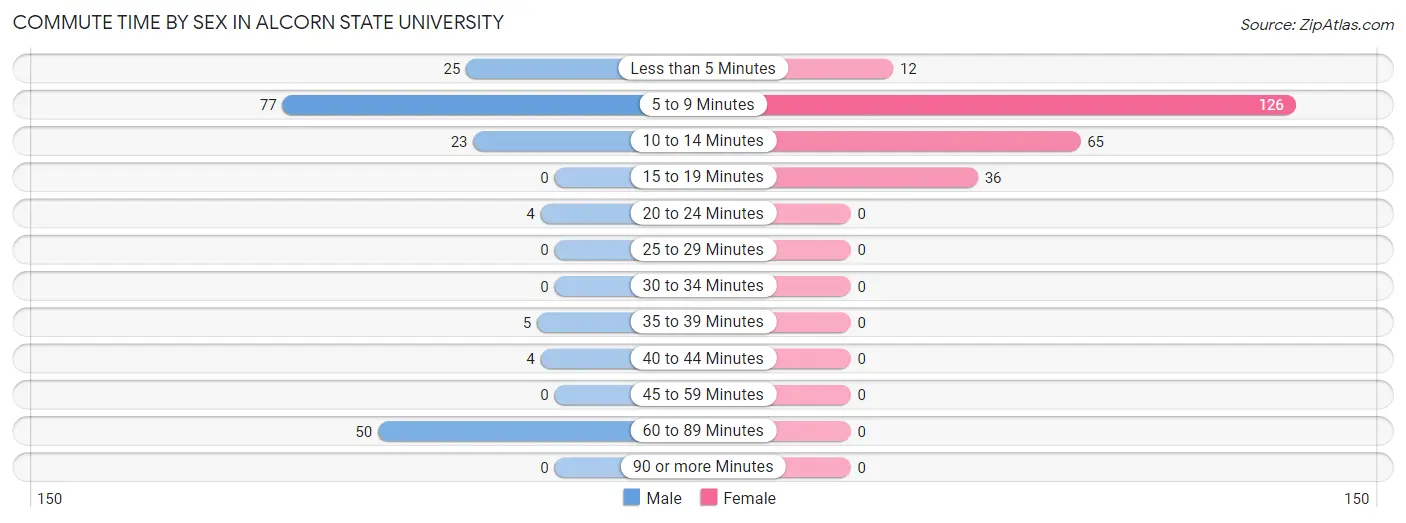
| Commute Time | Male | Female |
| Less than 5 Minutes | 25 (13.3%) | 12 (5.0%) |
| 5 to 9 Minutes | 77 (41.0%) | 126 (52.7%) |
| 10 to 14 Minutes | 23 (12.2%) | 65 (27.2%) |
| 15 to 19 Minutes | 0 (0.0%) | 36 (15.1%) |
| 20 to 24 Minutes | 4 (2.1%) | 0 (0.0%) |
| 25 to 29 Minutes | 0 (0.0%) | 0 (0.0%) |
| 30 to 34 Minutes | 0 (0.0%) | 0 (0.0%) |
| 35 to 39 Minutes | 5 (2.7%) | 0 (0.0%) |
| 40 to 44 Minutes | 4 (2.1%) | 0 (0.0%) |
| 45 to 59 Minutes | 0 (0.0%) | 0 (0.0%) |
| 60 to 89 Minutes | 50 (26.6%) | 0 (0.0%) |
| 90 or more Minutes | 0 (0.0%) | 0 (0.0%) |
Time of Departure to Work by Sex in Alcorn State University
The most frequent times of departure to work in Alcorn State University are 12:00 PM to 3:59 PM (60, 31.9%) for males and 12:00 PM to 3:59 PM (144, 60.3%) for females.
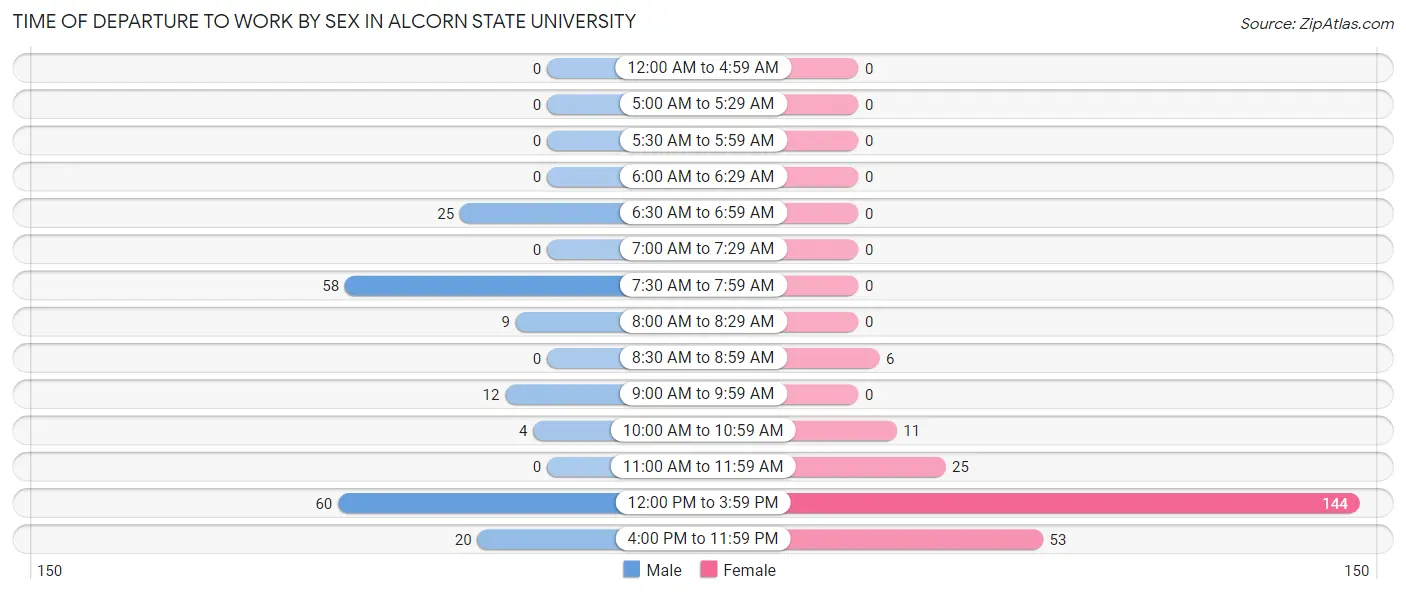
| Time of Departure | Male | Female |
| 12:00 AM to 4:59 AM | 0 (0.0%) | 0 (0.0%) |
| 5:00 AM to 5:29 AM | 0 (0.0%) | 0 (0.0%) |
| 5:30 AM to 5:59 AM | 0 (0.0%) | 0 (0.0%) |
| 6:00 AM to 6:29 AM | 0 (0.0%) | 0 (0.0%) |
| 6:30 AM to 6:59 AM | 25 (13.3%) | 0 (0.0%) |
| 7:00 AM to 7:29 AM | 0 (0.0%) | 0 (0.0%) |
| 7:30 AM to 7:59 AM | 58 (30.8%) | 0 (0.0%) |
| 8:00 AM to 8:29 AM | 9 (4.8%) | 0 (0.0%) |
| 8:30 AM to 8:59 AM | 0 (0.0%) | 6 (2.5%) |
| 9:00 AM to 9:59 AM | 12 (6.4%) | 0 (0.0%) |
| 10:00 AM to 10:59 AM | 4 (2.1%) | 11 (4.6%) |
| 11:00 AM to 11:59 AM | 0 (0.0%) | 25 (10.5%) |
| 12:00 PM to 3:59 PM | 60 (31.9%) | 144 (60.3%) |
| 4:00 PM to 11:59 PM | 20 (10.6%) | 53 (22.2%) |
| Total | 188 (100.0%) | 239 (100.0%) |
Housing Occupancy in Alcorn State University
Occupancy by Ownership in Alcorn State University
Of the total 35 dwellings in Alcorn State University, owner-occupied units account for 10 (28.6%), while renter-occupied units make up 25 (71.4%).
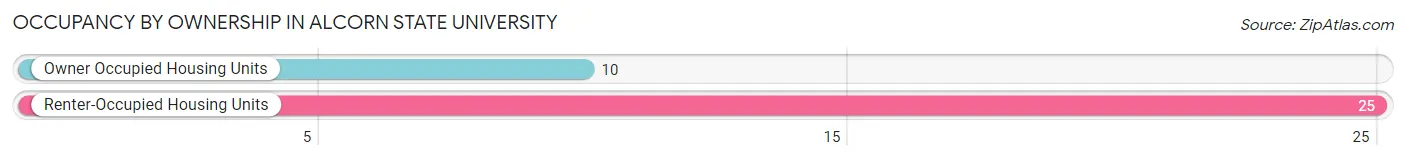
| Occupancy | # Housing Units | % Housing Units |
| Owner Occupied Housing Units | 10 | 28.6% |
| Renter-Occupied Housing Units | 25 | 71.4% |
| Total Occupied Housing Units | 35 | 100.0% |
Occupancy by Household Size in Alcorn State University
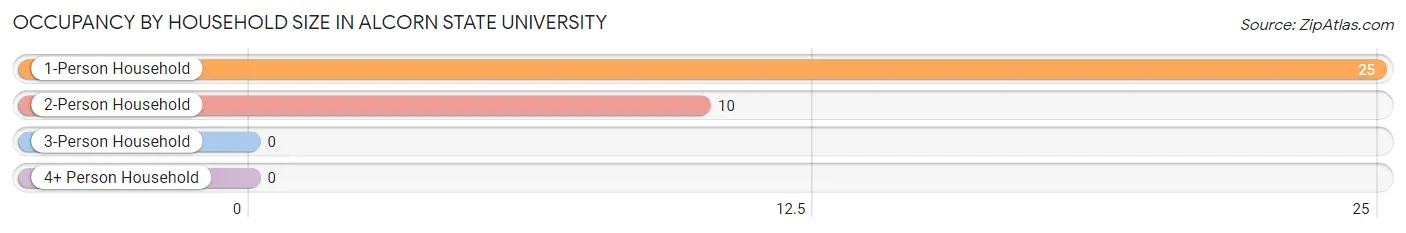
| Household Size | # Housing Units | % Housing Units |
| 1-Person Household | 25 | 71.4% |
| 2-Person Household | 10 | 28.6% |
| 3-Person Household | 0 | 0.0% |
| 4+ Person Household | 0 | 0.0% |
| Total Housing Units | 35 | 100.0% |
Occupancy by Ownership by Household Size in Alcorn State University
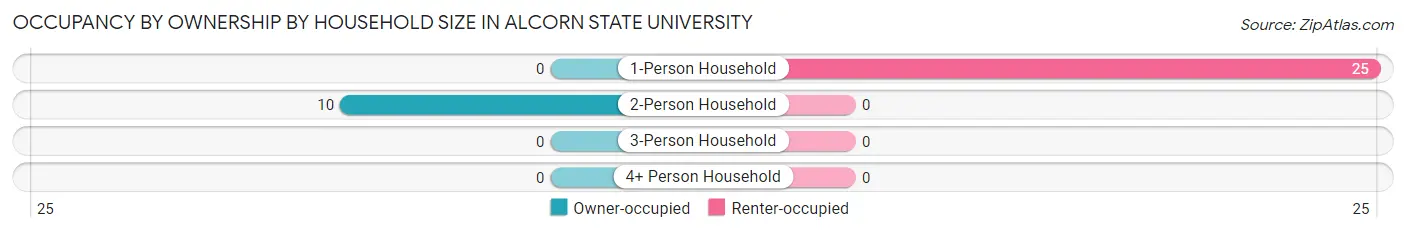
| Household Size | Owner-occupied | Renter-occupied |
| 1-Person Household | 0 (0.0%) | 25 (100.0%) |
| 2-Person Household | 10 (100.0%) | 0 (0.0%) |
| 3-Person Household | 0 (0.0%) | 0 (0.0%) |
| 4+ Person Household | 0 (0.0%) | 0 (0.0%) |
| Total Housing Units | 10 (28.6%) | 25 (71.4%) |
Occupancy by Educational Attainment in Alcorn State University
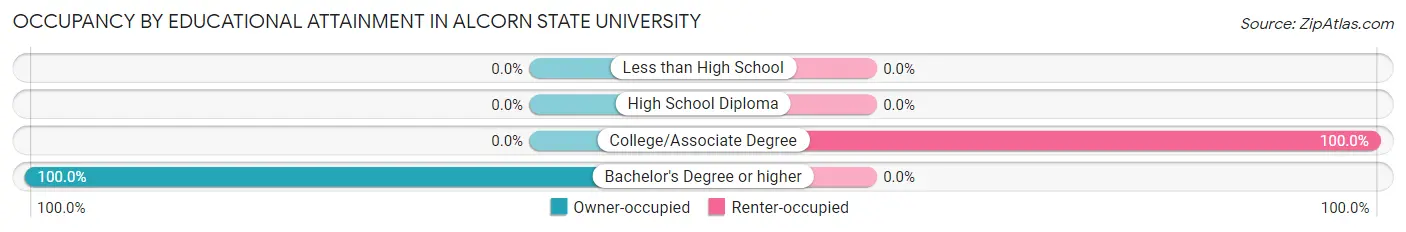
| Household Size | Owner-occupied | Renter-occupied |
| Less than High School | 0 (0.0%) | 0 (0.0%) |
| High School Diploma | 0 (0.0%) | 0 (0.0%) |
| College/Associate Degree | 0 (0.0%) | 25 (100.0%) |
| Bachelor's Degree or higher | 10 (100.0%) | 0 (0.0%) |
Occupancy by Age of Householder in Alcorn State University
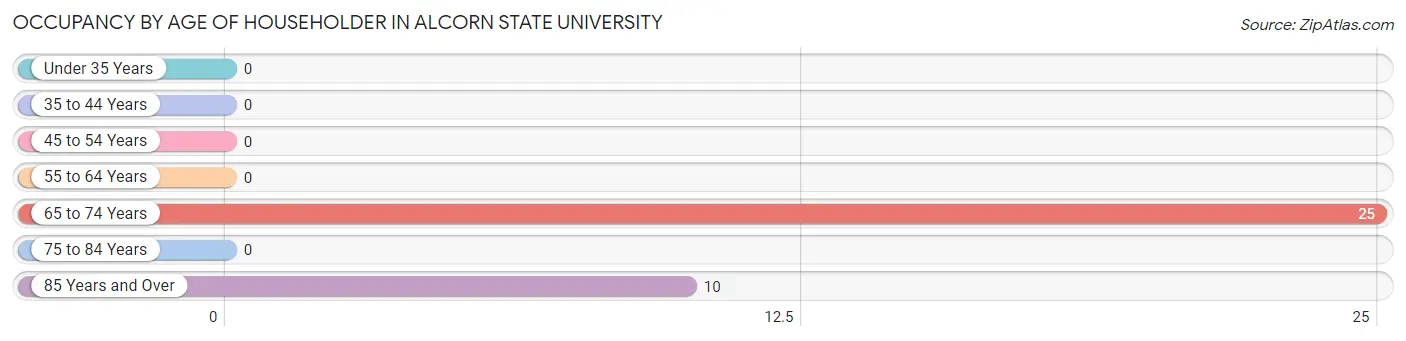
| Age Bracket | # Households | % Households |
| Under 35 Years | 0 | 0.0% |
| 35 to 44 Years | 0 | 0.0% |
| 45 to 54 Years | 0 | 0.0% |
| 55 to 64 Years | 0 | 0.0% |
| 65 to 74 Years | 25 | 71.4% |
| 75 to 84 Years | 0 | 0.0% |
| 85 Years and Over | 10 | 28.6% |
| Total | 35 | 100.0% |
Housing Finances in Alcorn State University
Median Income by Occupancy in Alcorn State University
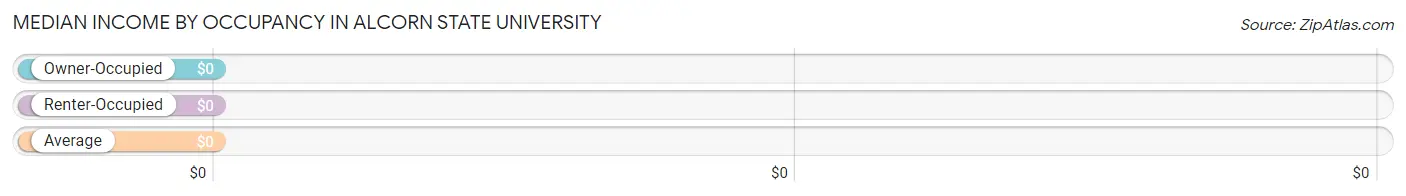
| Occupancy Type | # Households | Median Income |
| Owner-Occupied | 10 (28.6%) | $0 |
| Renter-Occupied | 25 (71.4%) | $0 |
| Average | 35 (100.0%) | $0 |
Occupancy by Householder Income Bracket in Alcorn State University
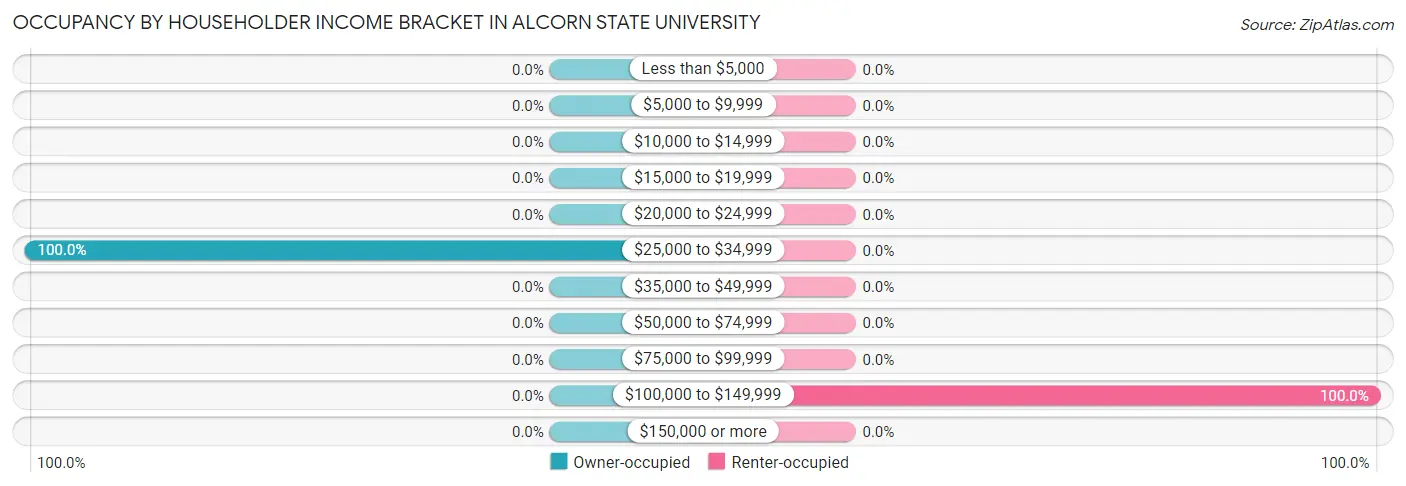
| Income Bracket | Owner-occupied | Renter-occupied |
| Less than $5,000 | 0 (0.0%) | 0 (0.0%) |
| $5,000 to $9,999 | 0 (0.0%) | 0 (0.0%) |
| $10,000 to $14,999 | 0 (0.0%) | 0 (0.0%) |
| $15,000 to $19,999 | 0 (0.0%) | 0 (0.0%) |
| $20,000 to $24,999 | 0 (0.0%) | 0 (0.0%) |
| $25,000 to $34,999 | 10 (100.0%) | 0 (0.0%) |
| $35,000 to $49,999 | 0 (0.0%) | 0 (0.0%) |
| $50,000 to $74,999 | 0 (0.0%) | 0 (0.0%) |
| $75,000 to $99,999 | 0 (0.0%) | 0 (0.0%) |
| $100,000 to $149,999 | 0 (0.0%) | 25 (100.0%) |
| $150,000 or more | 0 (0.0%) | 0 (0.0%) |
| Total | 10 (100.0%) | 25 (100.0%) |
Monthly Housing Cost Tiers in Alcorn State University
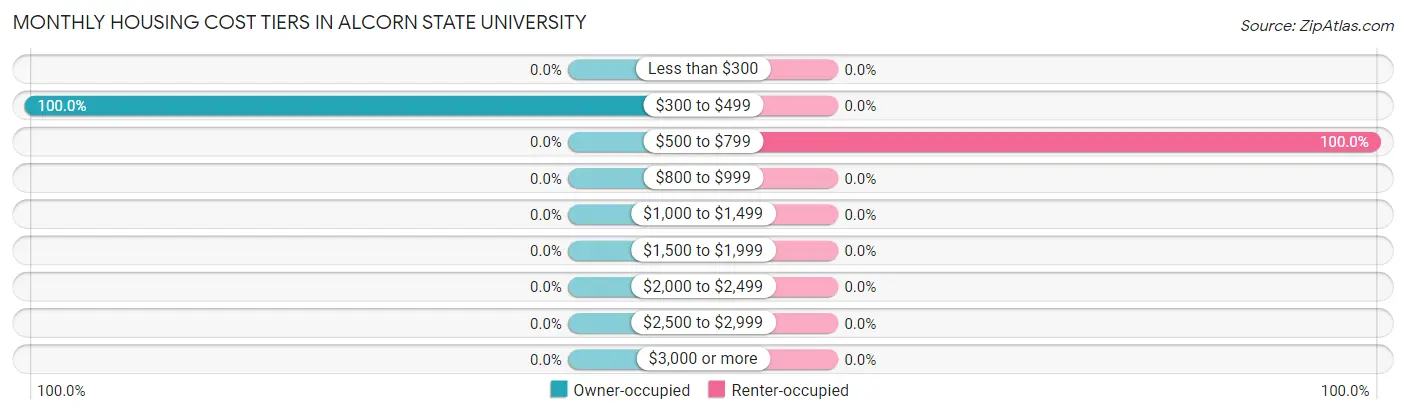
| Monthly Cost | Owner-occupied | Renter-occupied |
| Less than $300 | 0 (0.0%) | 0 (0.0%) |
| $300 to $499 | 10 (100.0%) | 0 (0.0%) |
| $500 to $799 | 0 (0.0%) | 25 (100.0%) |
| $800 to $999 | 0 (0.0%) | 0 (0.0%) |
| $1,000 to $1,499 | 0 (0.0%) | 0 (0.0%) |
| $1,500 to $1,999 | 0 (0.0%) | 0 (0.0%) |
| $2,000 to $2,499 | 0 (0.0%) | 0 (0.0%) |
| $2,500 to $2,999 | 0 (0.0%) | 0 (0.0%) |
| $3,000 or more | 0 (0.0%) | 0 (0.0%) |
| Total | 10 (100.0%) | 25 (100.0%) |
Physical Housing Characteristics in Alcorn State University
Housing Structures in Alcorn State University
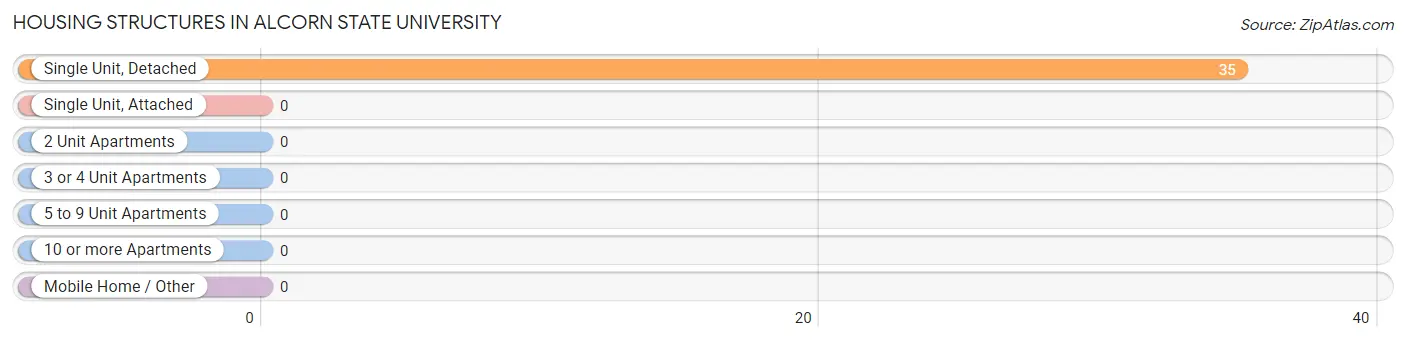
| Structure Type | # Housing Units | % Housing Units |
| Single Unit, Detached | 35 | 100.0% |
| Single Unit, Attached | 0 | 0.0% |
| 2 Unit Apartments | 0 | 0.0% |
| 3 or 4 Unit Apartments | 0 | 0.0% |
| 5 to 9 Unit Apartments | 0 | 0.0% |
| 10 or more Apartments | 0 | 0.0% |
| Mobile Home / Other | 0 | 0.0% |
| Total | 35 | 100.0% |
Housing Structures by Occupancy in Alcorn State University
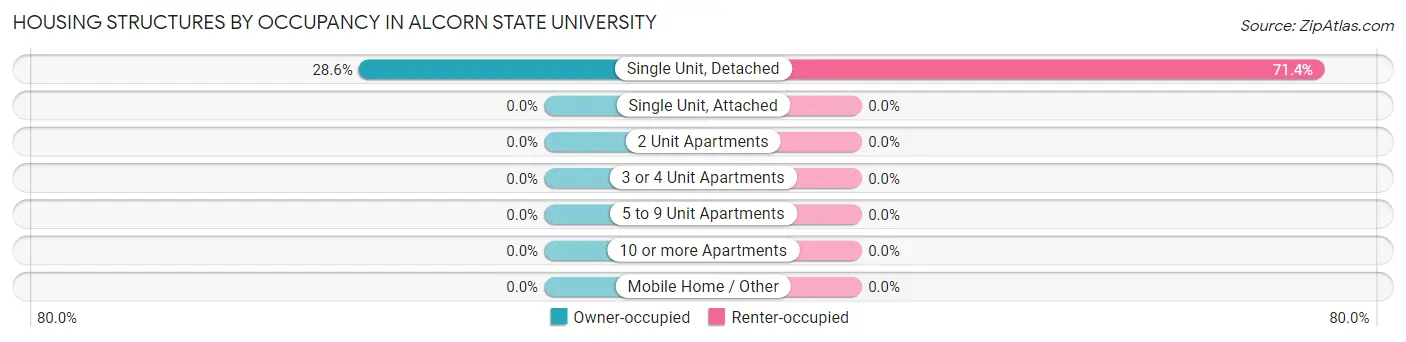
| Structure Type | Owner-occupied | Renter-occupied |
| Single Unit, Detached | 10 (28.6%) | 25 (71.4%) |
| Single Unit, Attached | 0 (0.0%) | 0 (0.0%) |
| 2 Unit Apartments | 0 (0.0%) | 0 (0.0%) |
| 3 or 4 Unit Apartments | 0 (0.0%) | 0 (0.0%) |
| 5 to 9 Unit Apartments | 0 (0.0%) | 0 (0.0%) |
| 10 or more Apartments | 0 (0.0%) | 0 (0.0%) |
| Mobile Home / Other | 0 (0.0%) | 0 (0.0%) |
| Total | 10 (28.6%) | 25 (71.4%) |
Housing Structures by Number of Rooms in Alcorn State University
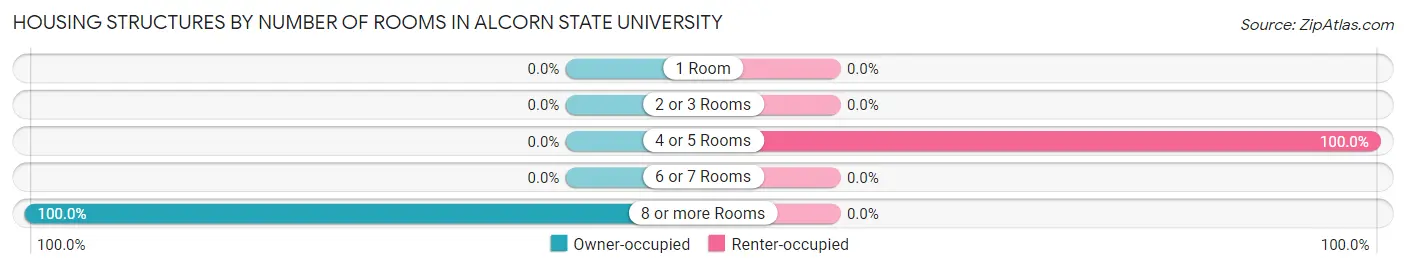
| Number of Rooms | Owner-occupied | Renter-occupied |
| 1 Room | 0 (0.0%) | 0 (0.0%) |
| 2 or 3 Rooms | 0 (0.0%) | 0 (0.0%) |
| 4 or 5 Rooms | 0 (0.0%) | 25 (100.0%) |
| 6 or 7 Rooms | 0 (0.0%) | 0 (0.0%) |
| 8 or more Rooms | 10 (100.0%) | 0 (0.0%) |
| Total | 10 (100.0%) | 25 (100.0%) |
Housing Structure by Heating Type in Alcorn State University
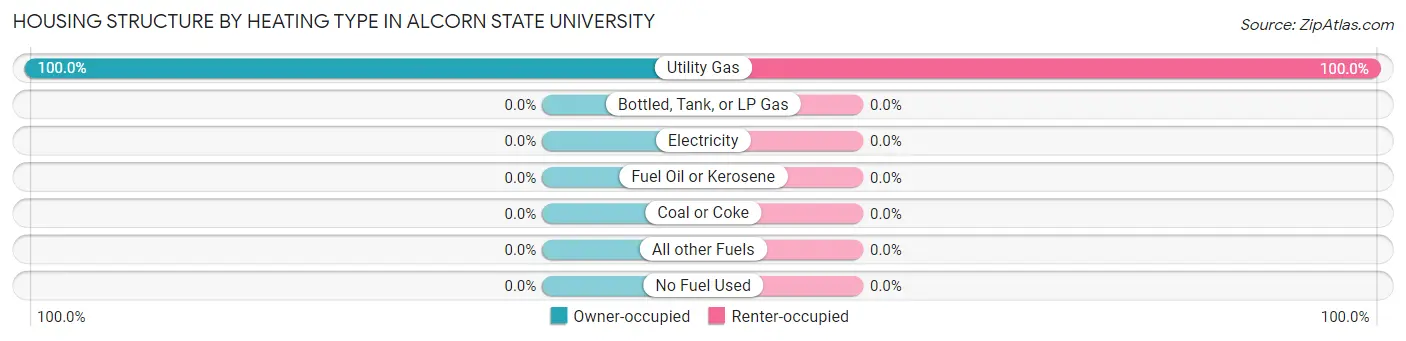
| Heating Type | Owner-occupied | Renter-occupied |
| Utility Gas | 10 (100.0%) | 25 (100.0%) |
| Bottled, Tank, or LP Gas | 0 (0.0%) | 0 (0.0%) |
| Electricity | 0 (0.0%) | 0 (0.0%) |
| Fuel Oil or Kerosene | 0 (0.0%) | 0 (0.0%) |
| Coal or Coke | 0 (0.0%) | 0 (0.0%) |
| All other Fuels | 0 (0.0%) | 0 (0.0%) |
| No Fuel Used | 0 (0.0%) | 0 (0.0%) |
| Total | 10 (100.0%) | 25 (100.0%) |
Household Vehicle Usage in Alcorn State University

| Vehicles per Household | Owner-occupied | Renter-occupied |
| No Vehicle | 0 (0.0%) | 0 (0.0%) |
| 1 Vehicle | 10 (100.0%) | 0 (0.0%) |
| 2 Vehicles | 0 (0.0%) | 25 (100.0%) |
| 3 or more Vehicles | 0 (0.0%) | 0 (0.0%) |
| Total | 10 (100.0%) | 25 (100.0%) |
Real Estate & Mortgages in Alcorn State University
Real Estate and Mortgage Overview in Alcorn State University
| Characteristic | Without Mortgage | With Mortgage |
| Housing Units | 10 | 0 |
| Median Property Value | - | - |
| Median Household Income | - | - |
| Monthly Housing Costs | - | - |
| Real Estate Taxes | - | - |
Property Value by Mortgage Status in Alcorn State University
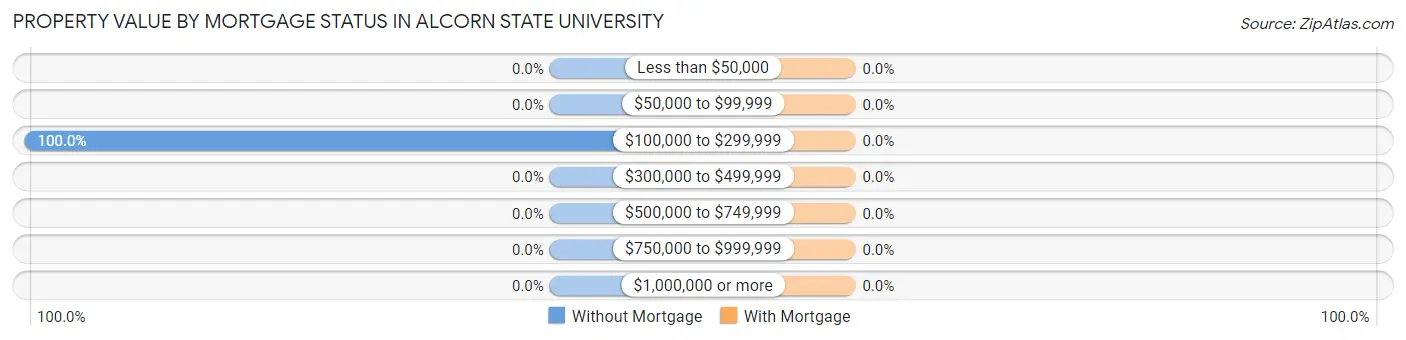
| Property Value | Without Mortgage | With Mortgage |
| Less than $50,000 | 0 (0.0%) | 0 (0.0%) |
| $50,000 to $99,999 | 0 (0.0%) | 0 (0.0%) |
| $100,000 to $299,999 | 10 (100.0%) | 0 (0.0%) |
| $300,000 to $499,999 | 0 (0.0%) | 0 (0.0%) |
| $500,000 to $749,999 | 0 (0.0%) | 0 (0.0%) |
| $750,000 to $999,999 | 0 (0.0%) | 0 (0.0%) |
| $1,000,000 or more | 0 (0.0%) | 0 (0.0%) |
| Total | 10 (100.0%) | 0 (0.0%) |
Household Income by Mortgage Status in Alcorn State University
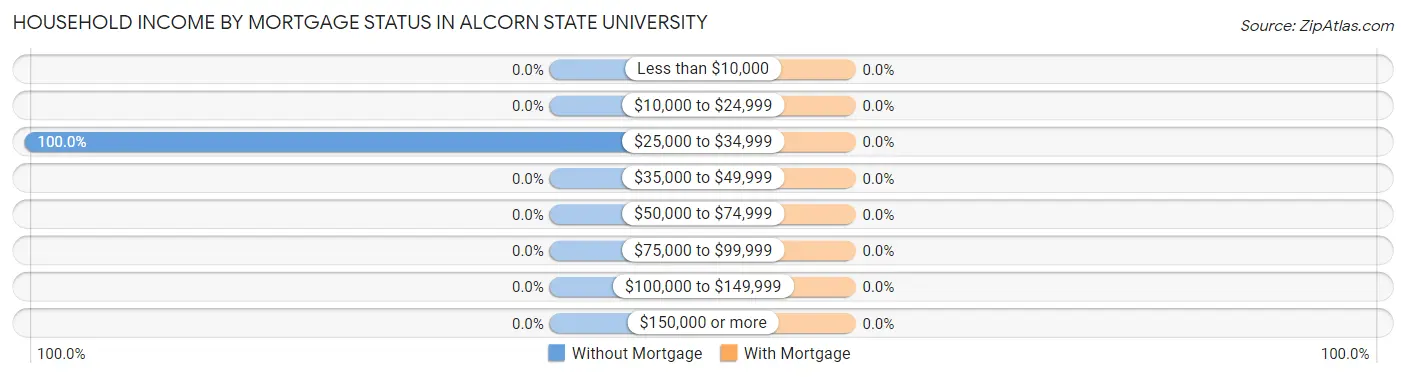
| Household Income | Without Mortgage | With Mortgage |
| Less than $10,000 | 0 (0.0%) | 0 (0.0%) |
| $10,000 to $24,999 | 0 (0.0%) | 0 (0.0%) |
| $25,000 to $34,999 | 10 (100.0%) | 0 (0.0%) |
| $35,000 to $49,999 | 0 (0.0%) | 0 (0.0%) |
| $50,000 to $74,999 | 0 (0.0%) | 0 (0.0%) |
| $75,000 to $99,999 | 0 (0.0%) | 0 (0.0%) |
| $100,000 to $149,999 | 0 (0.0%) | 0 (0.0%) |
| $150,000 or more | 0 (0.0%) | 0 (0.0%) |
| Total | 10 (100.0%) | 0 (0.0%) |
Property Value to Household Income Ratio in Alcorn State University

| Value-to-Income Ratio | Without Mortgage | With Mortgage |
| Less than 2.0x | 0 (0.0%) | 0 (0.0%) |
| 2.0x to 2.9x | 0 (0.0%) | 0 (0.0%) |
| 3.0x to 3.9x | 0 (0.0%) | 0 (0.0%) |
| 4.0x or more | 10 (100.0%) | 0 (0.0%) |
| Total | 10 (100.0%) | 0 (0.0%) |
Real Estate Taxes by Mortgage Status in Alcorn State University

| Property Taxes | Without Mortgage | With Mortgage |
| Less than $800 | 0 (0.0%) | 0 (0.0%) |
| $800 to $1,499 | 10 (100.0%) | 0 (0.0%) |
| $800 to $1,499 | 0 (0.0%) | 0 (0.0%) |
| Total | 10 (100.0%) | 0 (0.0%) |
Health & Disability in Alcorn State University
Health Insurance Coverage by Age in Alcorn State University
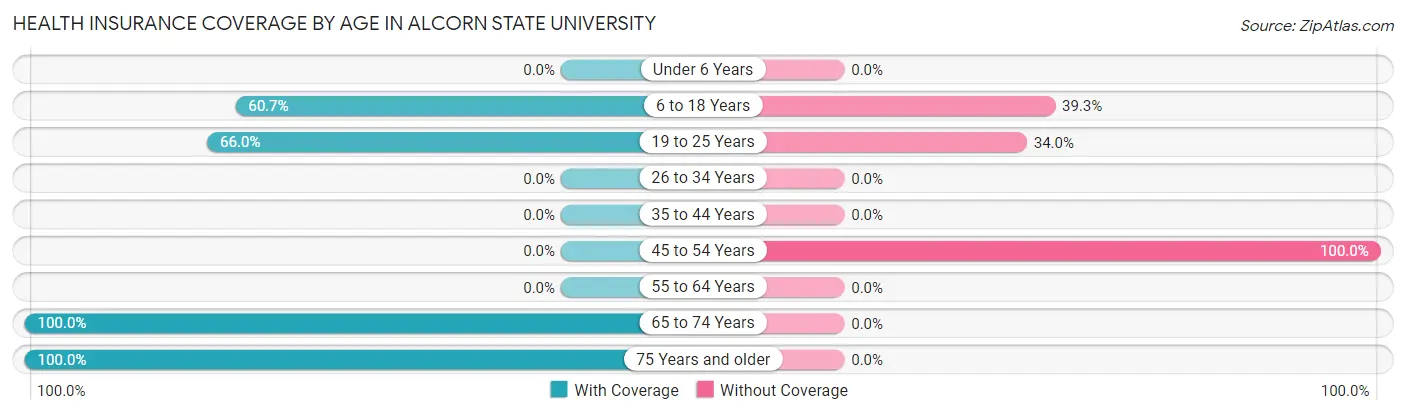
| Age Bracket | With Coverage | Without Coverage |
| Under 6 Years | 0 (0.0%) | 0 (0.0%) |
| 6 to 18 Years | 156 (60.7%) | 101 (39.3%) |
| 19 to 25 Years | 506 (66.0%) | 261 (34.0%) |
| 26 to 34 Years | 0 (0.0%) | 0 (0.0%) |
| 35 to 44 Years | 0 (0.0%) | 0 (0.0%) |
| 45 to 54 Years | 0 (0.0%) | 12 (100.0%) |
| 55 to 64 Years | 0 (0.0%) | 0 (0.0%) |
| 65 to 74 Years | 25 (100.0%) | 0 (0.0%) |
| 75 Years and older | 10 (100.0%) | 0 (0.0%) |
| Total | 697 (65.1%) | 374 (34.9%) |
Health Insurance Coverage by Citizenship Status in Alcorn State University
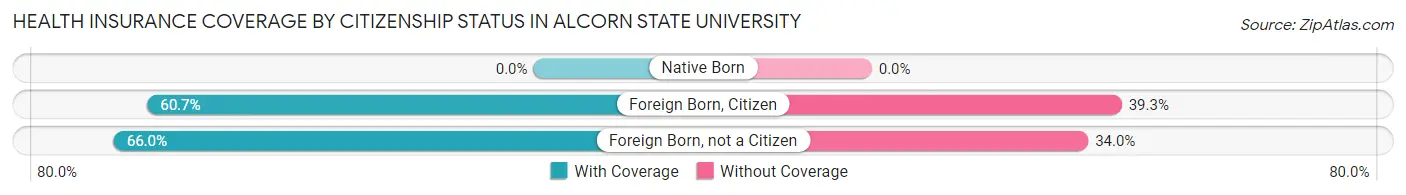
| Citizenship Status | With Coverage | Without Coverage |
| Native Born | 0 (0.0%) | 0 (0.0%) |
| Foreign Born, Citizen | 156 (60.7%) | 101 (39.3%) |
| Foreign Born, not a Citizen | 506 (66.0%) | 261 (34.0%) |
Health Insurance Coverage by Household Income in Alcorn State University
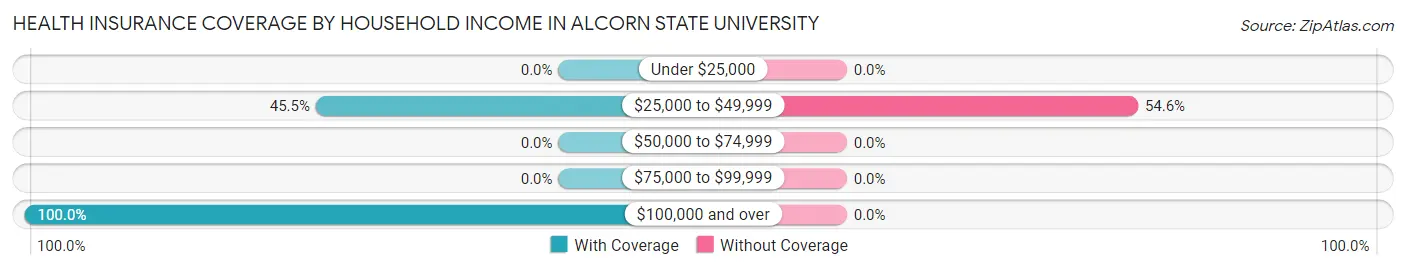
| Household Income | With Coverage | Without Coverage |
| Under $25,000 | 0 (0.0%) | 0 (0.0%) |
| $25,000 to $49,999 | 10 (45.5%) | 12 (54.5%) |
| $50,000 to $74,999 | 0 (0.0%) | 0 (0.0%) |
| $75,000 to $99,999 | 0 (0.0%) | 0 (0.0%) |
| $100,000 and over | 25 (100.0%) | 0 (0.0%) |
Public vs Private Health Insurance Coverage by Age in Alcorn State University
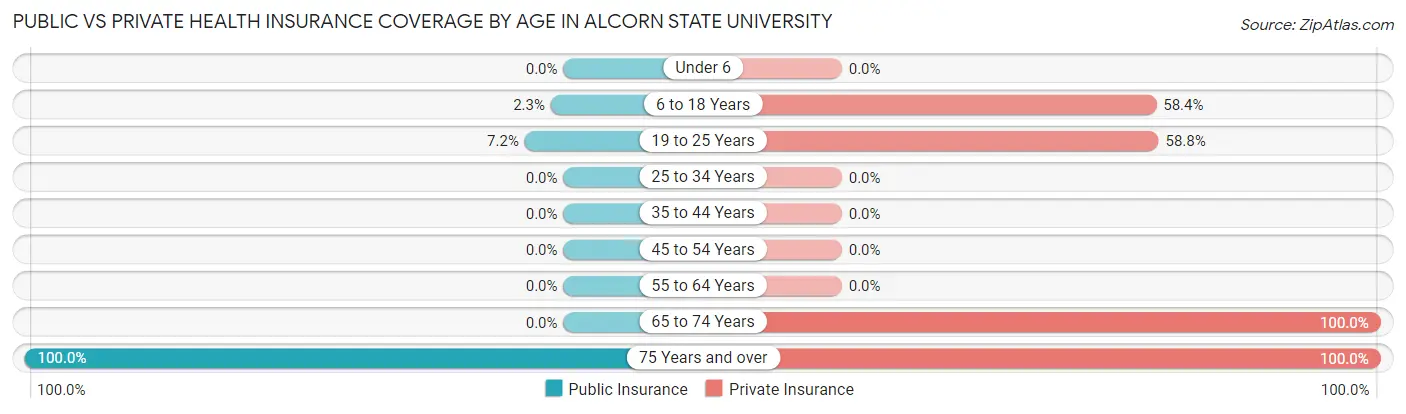
| Age Bracket | Public Insurance | Private Insurance |
| Under 6 | 0 (0.0%) | 0 (0.0%) |
| 6 to 18 Years | 6 (2.3%) | 150 (58.4%) |
| 19 to 25 Years | 55 (7.2%) | 451 (58.8%) |
| 25 to 34 Years | 0 (0.0%) | 0 (0.0%) |
| 35 to 44 Years | 0 (0.0%) | 0 (0.0%) |
| 45 to 54 Years | 0 (0.0%) | 0 (0.0%) |
| 55 to 64 Years | 0 (0.0%) | 0 (0.0%) |
| 65 to 74 Years | 0 (0.0%) | 25 (100.0%) |
| 75 Years and over | 10 (100.0%) | 10 (100.0%) |
| Total | 71 (6.6%) | 636 (59.4%) |
Disability Status by Sex by Age in Alcorn State University
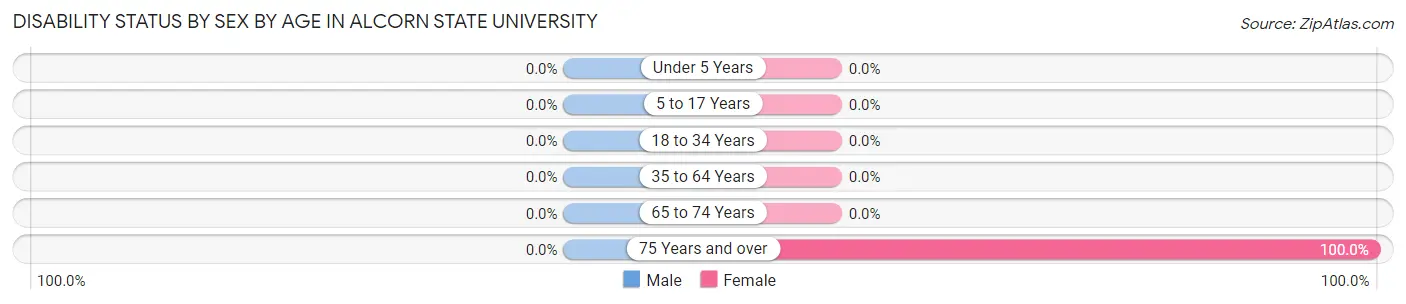
| Age Bracket | Male | Female |
| Under 5 Years | 0 (0.0%) | 0 (0.0%) |
| 5 to 17 Years | 0 (0.0%) | 0 (0.0%) |
| 18 to 34 Years | 0 (0.0%) | 0 (0.0%) |
| 35 to 64 Years | 0 (0.0%) | 0 (0.0%) |
| 65 to 74 Years | 0 (0.0%) | 0 (0.0%) |
| 75 Years and over | 0 (0.0%) | 10 (100.0%) |
Disability Class by Sex by Age in Alcorn State University
Disability Class: Hearing Difficulty
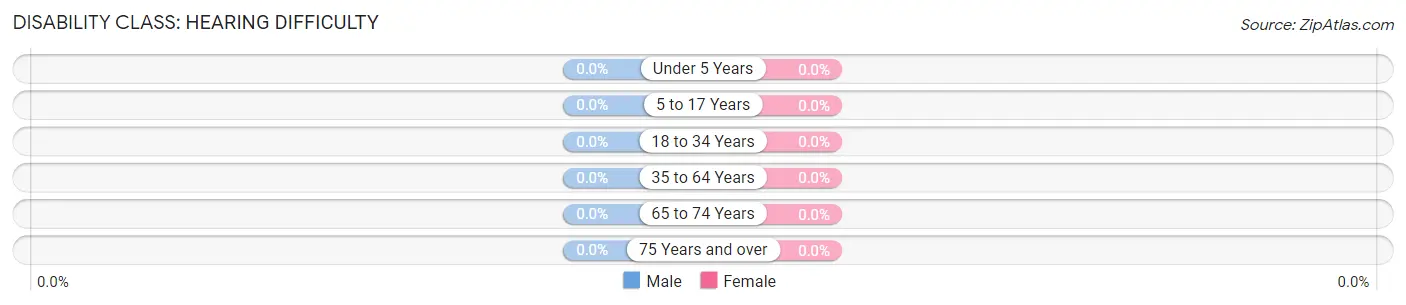
| Age Bracket | Male | Female |
| Under 5 Years | 0 (0.0%) | 0 (0.0%) |
| 5 to 17 Years | 0 (0.0%) | 0 (0.0%) |
| 18 to 34 Years | 0 (0.0%) | 0 (0.0%) |
| 35 to 64 Years | 0 (0.0%) | 0 (0.0%) |
| 65 to 74 Years | 0 (0.0%) | 0 (0.0%) |
| 75 Years and over | 0 (0.0%) | 0 (0.0%) |
Disability Class: Vision Difficulty
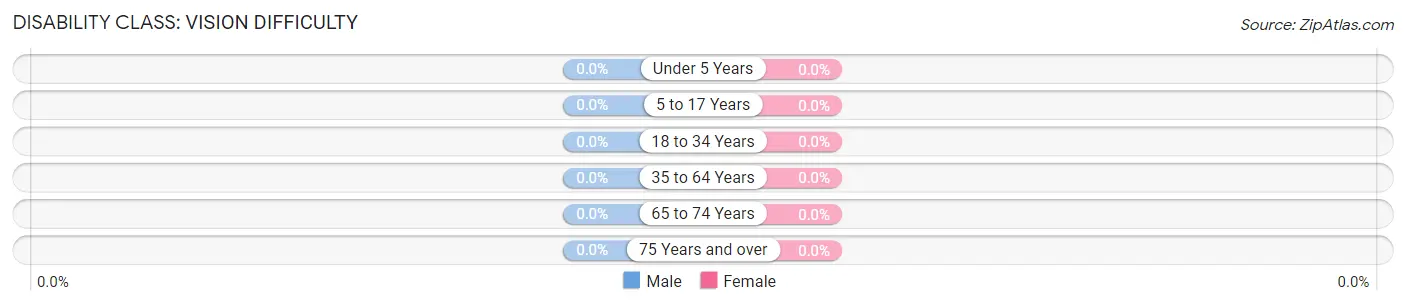
| Age Bracket | Male | Female |
| Under 5 Years | 0 (0.0%) | 0 (0.0%) |
| 5 to 17 Years | 0 (0.0%) | 0 (0.0%) |
| 18 to 34 Years | 0 (0.0%) | 0 (0.0%) |
| 35 to 64 Years | 0 (0.0%) | 0 (0.0%) |
| 65 to 74 Years | 0 (0.0%) | 0 (0.0%) |
| 75 Years and over | 0 (0.0%) | 0 (0.0%) |
Disability Class: Cognitive Difficulty
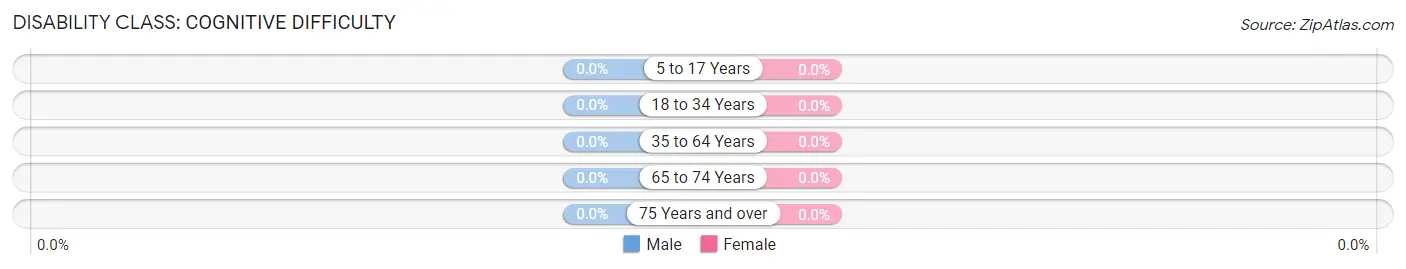
| Age Bracket | Male | Female |
| 5 to 17 Years | 0 (0.0%) | 0 (0.0%) |
| 18 to 34 Years | 0 (0.0%) | 0 (0.0%) |
| 35 to 64 Years | 0 (0.0%) | 0 (0.0%) |
| 65 to 74 Years | 0 (0.0%) | 0 (0.0%) |
| 75 Years and over | 0 (0.0%) | 0 (0.0%) |
Disability Class: Ambulatory Difficulty
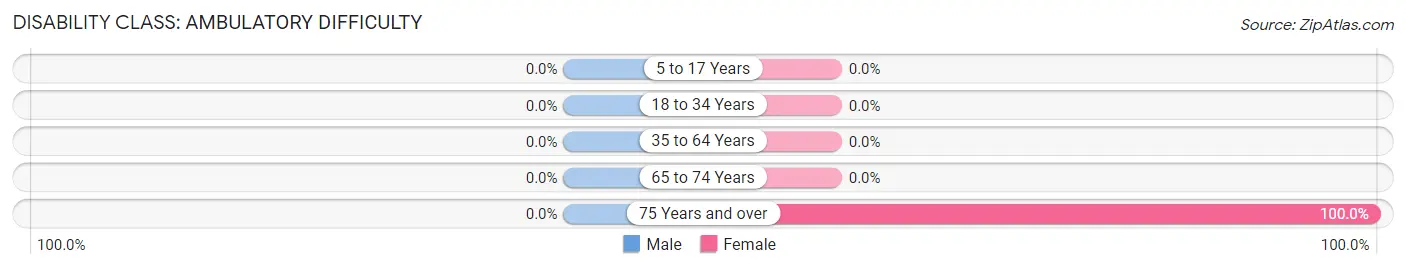
| Age Bracket | Male | Female |
| 5 to 17 Years | 0 (0.0%) | 0 (0.0%) |
| 18 to 34 Years | 0 (0.0%) | 0 (0.0%) |
| 35 to 64 Years | 0 (0.0%) | 0 (0.0%) |
| 65 to 74 Years | 0 (0.0%) | 0 (0.0%) |
| 75 Years and over | 0 (0.0%) | 10 (100.0%) |
Disability Class: Self-Care Difficulty
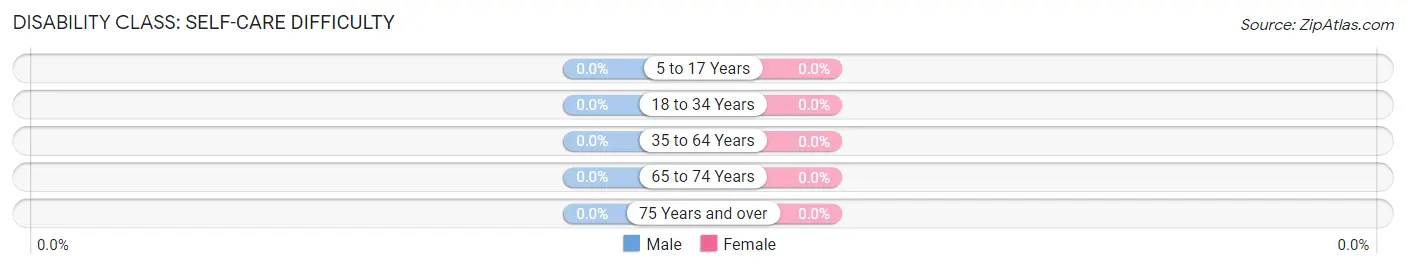
| Age Bracket | Male | Female |
| 5 to 17 Years | 0 (0.0%) | 0 (0.0%) |
| 18 to 34 Years | 0 (0.0%) | 0 (0.0%) |
| 35 to 64 Years | 0 (0.0%) | 0 (0.0%) |
| 65 to 74 Years | 0 (0.0%) | 0 (0.0%) |
| 75 Years and over | 0 (0.0%) | 0 (0.0%) |
Technology Access in Alcorn State University
Computing Device Access in Alcorn State University
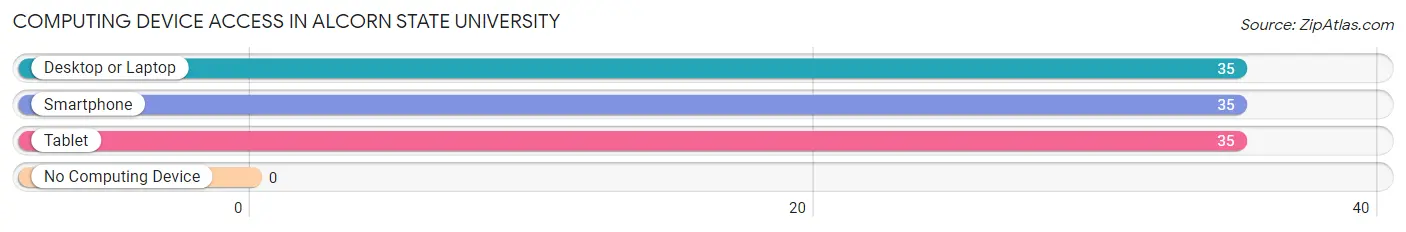
| Device Type | # Households | % Households |
| Desktop or Laptop | 35 | 100.0% |
| Smartphone | 35 | 100.0% |
| Tablet | 35 | 100.0% |
| No Computing Device | 0 | 0.0% |
| Total | 35 | 100.0% |
Internet Access in Alcorn State University
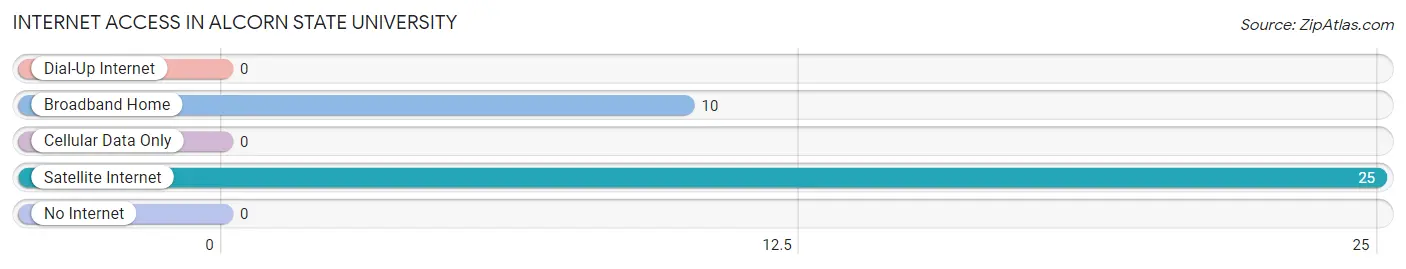
| Internet Type | # Households | % Households |
| Dial-Up Internet | 0 | 0.0% |
| Broadband Home | 10 | 28.6% |
| Cellular Data Only | 0 | 0.0% |
| Satellite Internet | 25 | 71.4% |
| No Internet | 0 | 0.0% |
| Total | 35 | 100.0% |
Alcorn State University Summary
Alcorn State University (ASU) is a historically black university located in Lorman, Mississippi. Founded in 1871, ASU is the first black land-grant university in the United States and is the second-oldest public university in the state. ASU is a member of the Thurgood Marshall College Fund and is accredited by the Southern Association of Colleges and Schools Commission on Colleges.
History
Alcorn State University was founded in 1871 as the Alcorn University, a private school for African Americans. The school was established by the Reconstruction-era legislature of Mississippi to provide educational opportunities for African Americans. The school was named after James L. Alcorn, a prominent Mississippi politician who was a strong advocate for African American education.
In 1877, the school was taken over by the state of Mississippi and renamed Alcorn Agricultural and Mechanical College. The school was then designated as the first land-grant college for African Americans in the United States.
In 1974, the school was renamed Alcorn State University and began offering a wider range of degree programs. Today, ASU offers bachelor's, master's, and doctoral degrees in a variety of disciplines.
Geography
Alcorn State University is located in Lorman, Mississippi, in the southwestern corner of the state. The university is situated on a 1,500-acre campus in the rolling hills of the Mississippi Delta. The campus is located approximately 60 miles south of Jackson, Mississippi, and is within easy driving distance of the cities of Natchez, Vicksburg, and Hattiesburg.
The university is surrounded by a variety of natural features, including the Big Black River, which runs along the western edge of the campus. The campus is also home to a variety of wildlife, including deer, wild turkeys, and a variety of birds.
Economy
Alcorn State University is a major economic force in the region. The university has an annual economic impact of more than $200 million, and is the largest employer in Claiborne County.
The university also serves as a major source of education and training for the region. ASU offers a variety of degree programs, including business, engineering, nursing, and education. The university also offers a variety of continuing education and professional development programs.
Demographics
As of 2020, Alcorn State University had an enrollment of 4,717 students. The student body is composed of students from all 50 states and several foreign countries. The student body is also diverse, with African Americans making up the majority of the student population.
The faculty and staff of Alcorn State University are also diverse. The university employs more than 500 faculty and staff members, including more than 200 full-time faculty members.
Conclusion
Alcorn State University is a historically black university located in Lorman, Mississippi. Founded in 1871, ASU is the first black land-grant university in the United States and is the second-oldest public university in the state. ASU is a major economic force in the region, with an annual economic impact of more than $200 million. The university has an enrollment of 4,717 students, with African Americans making up the majority of the student population. The faculty and staff of Alcorn State University are also diverse, with more than 500 faculty and staff members, including more than 200 full-time faculty members.
Common Questions
What is Per Capita Income in Alcorn State University?
Per Capita income in Alcorn State University is $6,524.
What is Income or Wage Gap in Alcorn State University?
Income or Wage Gap in Alcorn State University is 27.5%.
Women in Alcorn State University earn 72.5 cents for every dollar earned by a man.
What is Inequality or Gini Index in Alcorn State University?
Inequality or Gini Index in Alcorn State University is 0.18.
What is the Total Population of Alcorn State University?
Total Population of Alcorn State University is 1,071.
What is the Total Male Population of Alcorn State University?
Total Male Population of Alcorn State University is 493.
What is the Total Female Population of Alcorn State University?
Total Female Population of Alcorn State University is 578.
What is the Ratio of Males per 100 Females in Alcorn State University?
There are 85.29 Males per 100 Females in Alcorn State University.
What is the Ratio of Females per 100 Males in Alcorn State University?
There are 117.24 Females per 100 Males in Alcorn State University.
What is the Median Population Age in Alcorn State University?
Median Population Age in Alcorn State University is 20.0 Years.
What is the Average Family Size in Alcorn State University
Average Family Size in Alcorn State University is 2.2 People.
What is the Average Household Size in Alcorn State University
Average Household Size in Alcorn State University is 1.3 People.
How Large is the Labor Force in Alcorn State University?
There are 491 People in the Labor Forcein in Alcorn State University.
What is the Percentage of People in the Labor Force in Alcorn State University?
45.8% of People are in the Labor Force in Alcorn State University.
What is the Unemployment Rate in Alcorn State University?
Unemployment Rate in Alcorn State University is 1.0%.