Gardner, FL Map & Demographics
Gardner Map
Gardner Overview
$19,204
PER CAPITA INCOME
$32,689
AVG FAMILY INCOME
$33,788
AVG HOUSEHOLD INCOME
0.37
INEQUALITY / GINI INDEX
493
TOTAL POPULATION
196
MALE POPULATION
297
FEMALE POPULATION
65.99
MALES / 100 FEMALES
151.53
FEMALES / 100 MALES
68.0
MEDIAN AGE
2.2
AVG FAMILY SIZE
2.3
AVG HOUSEHOLD SIZE
37
LABOR FORCE [ PEOPLE ]
8.6%
PERCENT IN LABOR FORCE
Income in Gardner
Income Overview in Gardner
Per Capita Income in Gardner is $19,204, while median incomes of families and households are $32,689 and $33,788 respectively.
| Characteristic | Number | Measure |
| Per Capita Income | 493 | $19,204 |
| Median Family Income | 201 | $32,689 |
| Mean Family Income | 201 | $39,969 |
| Median Household Income | 216 | $33,788 |
| Mean Household Income | 216 | $44,544 |
| Income Deficit | 201 | $0 |
| Wage / Income Gap (%) | 493 | 0.00% |
| Wage / Income Gap ($) | 493 | 100.00¢ per $1 |
| Gini / Inequality Index | 493 | 0.37 |
Earnings by Sex in Gardner
| Sex | Number | Average Earnings |
| Male | 8 (16.0%) | $0 |
| Female | 42 (84.0%) | $0 |
| Total | 50 (100.0%) | $0 |
Earnings by Sex by Income Bracket in Gardner
The most common earnings brackets in Gardner are $12,500 to $14,999 for men (8 | 100.0%) and $30,000 to $34,999 for women (18 | 42.9%).
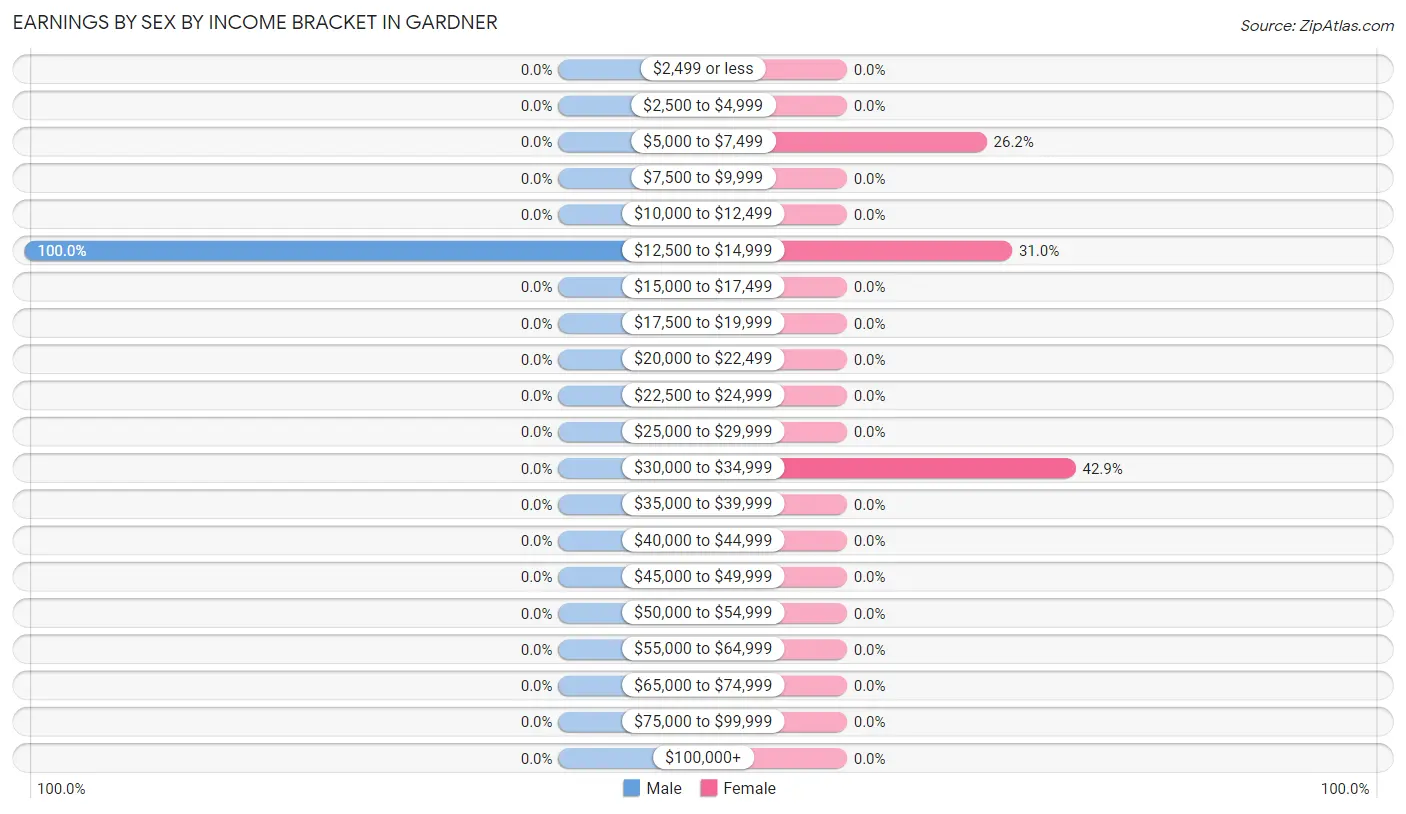
| Income | Male | Female |
| $2,499 or less | 0 (0.0%) | 0 (0.0%) |
| $2,500 to $4,999 | 0 (0.0%) | 0 (0.0%) |
| $5,000 to $7,499 | 0 (0.0%) | 11 (26.2%) |
| $7,500 to $9,999 | 0 (0.0%) | 0 (0.0%) |
| $10,000 to $12,499 | 0 (0.0%) | 0 (0.0%) |
| $12,500 to $14,999 | 8 (100.0%) | 13 (30.9%) |
| $15,000 to $17,499 | 0 (0.0%) | 0 (0.0%) |
| $17,500 to $19,999 | 0 (0.0%) | 0 (0.0%) |
| $20,000 to $22,499 | 0 (0.0%) | 0 (0.0%) |
| $22,500 to $24,999 | 0 (0.0%) | 0 (0.0%) |
| $25,000 to $29,999 | 0 (0.0%) | 0 (0.0%) |
| $30,000 to $34,999 | 0 (0.0%) | 18 (42.9%) |
| $35,000 to $39,999 | 0 (0.0%) | 0 (0.0%) |
| $40,000 to $44,999 | 0 (0.0%) | 0 (0.0%) |
| $45,000 to $49,999 | 0 (0.0%) | 0 (0.0%) |
| $50,000 to $54,999 | 0 (0.0%) | 0 (0.0%) |
| $55,000 to $64,999 | 0 (0.0%) | 0 (0.0%) |
| $65,000 to $74,999 | 0 (0.0%) | 0 (0.0%) |
| $75,000 to $99,999 | 0 (0.0%) | 0 (0.0%) |
| $100,000+ | 0 (0.0%) | 0 (0.0%) |
| Total | 8 (100.0%) | 42 (100.0%) |
Earnings by Sex by Educational Attainment in Gardner
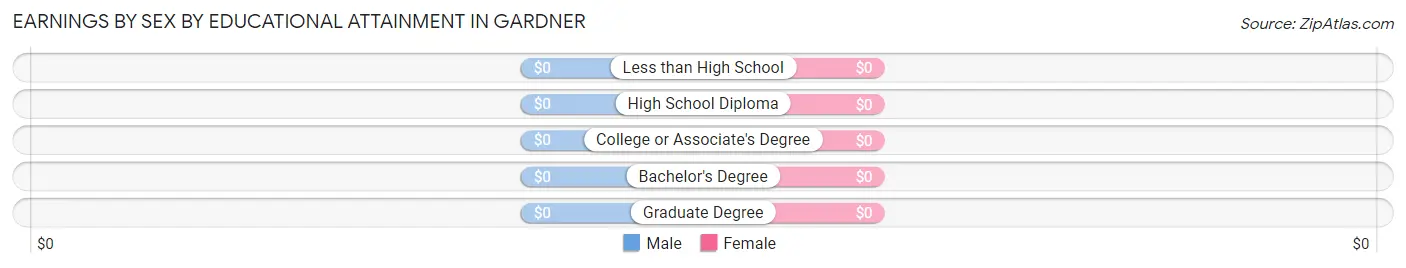
| Educational Attainment | Male Income | Female Income |
| Less than High School | - | - |
| High School Diploma | - | - |
| College or Associate's Degree | - | - |
| Bachelor's Degree | - | - |
| Graduate Degree | - | - |
| Total | - | - |
Family Income in Gardner
Family Income Brackets in Gardner
According to the Gardner family income data, there are 77 families falling into the $15,000 to $24,999 income range, which is the most common income bracket and makes up 38.3% of all families.
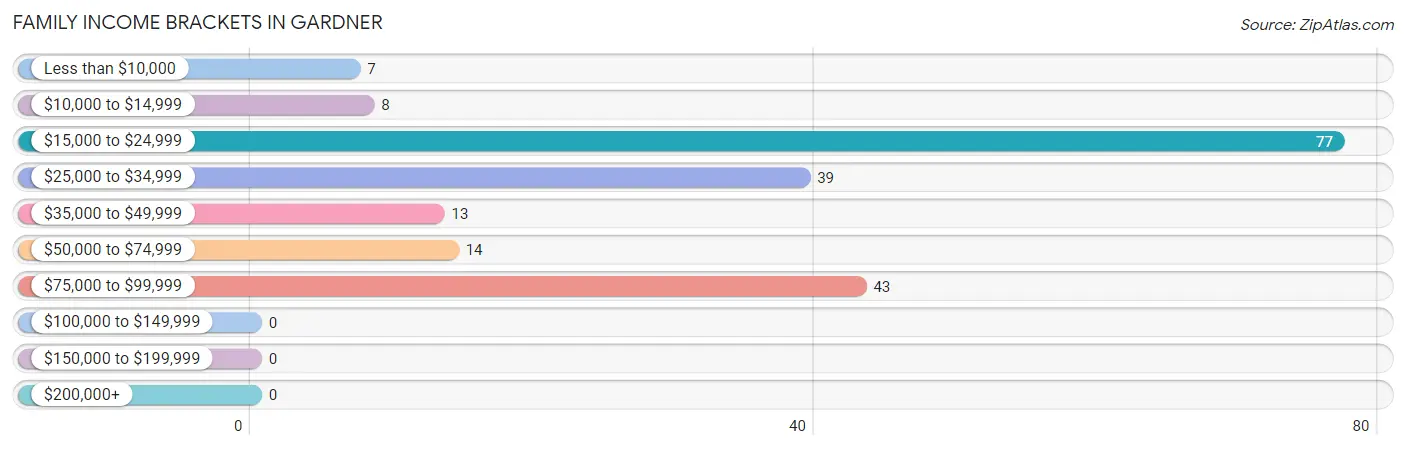
| Income Bracket | # Families | % Families |
| Less than $10,000 | 7 | 3.5% |
| $10,000 to $14,999 | 8 | 4.0% |
| $15,000 to $24,999 | 77 | 38.3% |
| $25,000 to $34,999 | 39 | 19.4% |
| $35,000 to $49,999 | 13 | 6.5% |
| $50,000 to $74,999 | 14 | 7.0% |
| $75,000 to $99,999 | 43 | 21.4% |
| $100,000 to $149,999 | 0 | 0.0% |
| $150,000 to $199,999 | 0 | 0.0% |
| $200,000+ | 0 | 0.0% |
Family Income by Famaliy Size in Gardner
2-person families (169 | 84.1%) account for the highest median family income in Gardner with $33,902 per family, while 2-person families (169 | 84.1%) have the highest median income of $16,951 per family member.
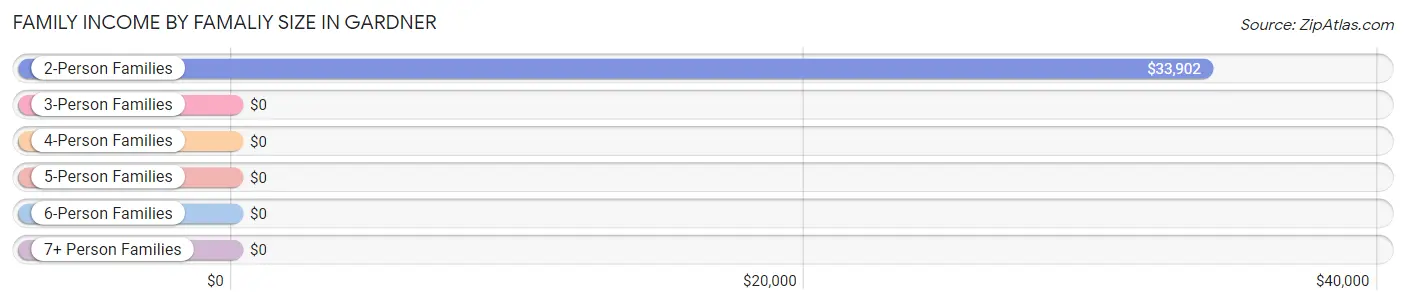
| Income Bracket | # Families | Median Income |
| 2-Person Families | 169 (84.1%) | $33,902 |
| 3-Person Families | 0 (0.0%) | $0 |
| 4-Person Families | 0 (0.0%) | $0 |
| 5-Person Families | 32 (15.9%) | $0 |
| 6-Person Families | 0 (0.0%) | $0 |
| 7+ Person Families | 0 (0.0%) | $0 |
| Total | 201 (100.0%) | $32,689 |
Family Income by Number of Earners in Gardner
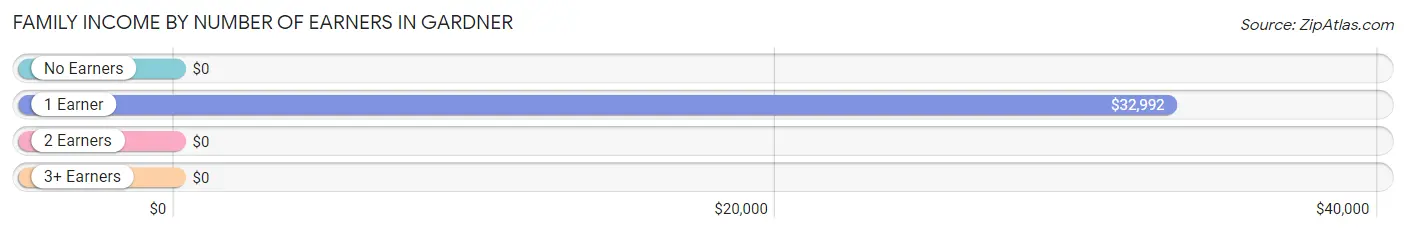
| Number of Earners | # Families | Median Income |
| No Earners | 148 (73.6%) | $0 |
| 1 Earner | 53 (26.4%) | $32,992 |
| 2 Earners | 0 (0.0%) | $0 |
| 3+ Earners | 0 (0.0%) | $0 |
| Total | 201 (100.0%) | $32,689 |
Household Income in Gardner
Household Income Brackets in Gardner
With 65 households falling in the category, the $15,000 to $24,999 income range is the most frequent in Gardner, accounting for 30.1% of all households.
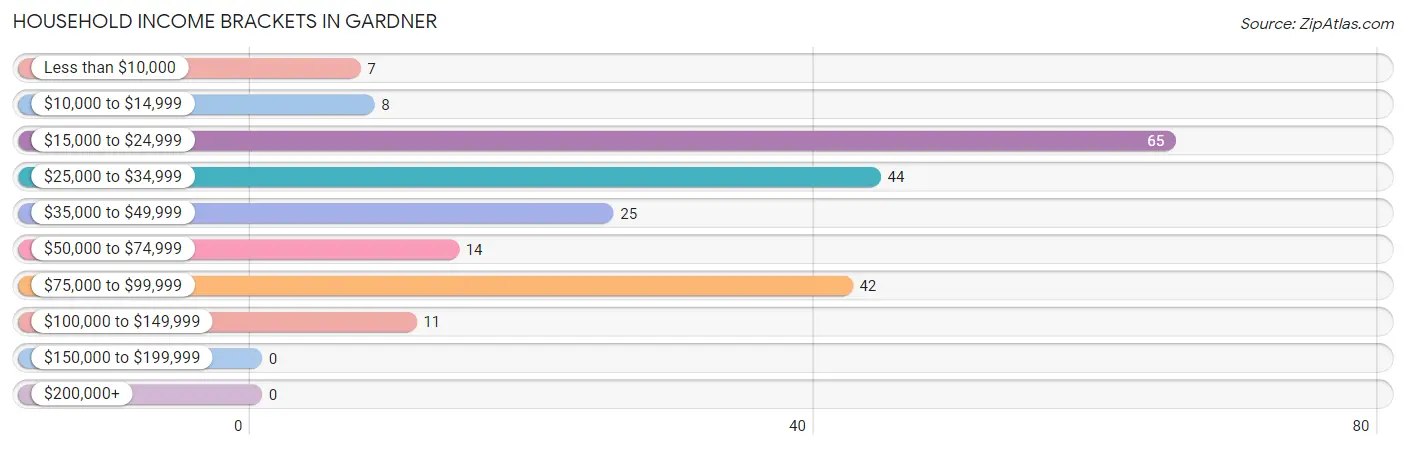
| Income Bracket | # Households | % Households |
| Less than $10,000 | 7 | 3.2% |
| $10,000 to $14,999 | 8 | 3.7% |
| $15,000 to $24,999 | 65 | 30.1% |
| $25,000 to $34,999 | 44 | 20.4% |
| $35,000 to $49,999 | 25 | 11.6% |
| $50,000 to $74,999 | 14 | 6.5% |
| $75,000 to $99,999 | 42 | 19.4% |
| $100,000 to $149,999 | 11 | 5.1% |
| $150,000 to $199,999 | 0 | 0.0% |
| $200,000+ | 0 | 0.0% |
Household Income by Householder Age in Gardner
The median household income in Gardner is $33,788, with the highest median household income of $34,097 found in the 45 to 64 years age bracket for the primary householder. A total of 53 households (24.5%) fall into this category.
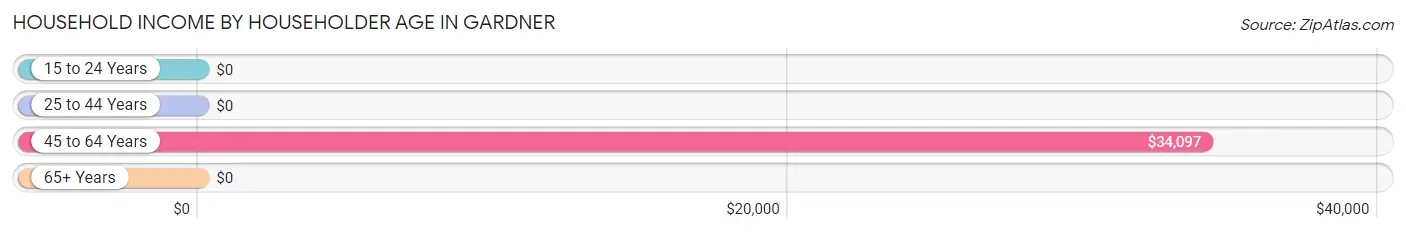
| Income Bracket | # Households | Median Income |
| 15 to 24 Years | 0 (0.0%) | $0 |
| 25 to 44 Years | 0 (0.0%) | $0 |
| 45 to 64 Years | 53 (24.5%) | $34,097 |
| 65+ Years | 163 (75.5%) | $0 |
| Total | 216 (100.0%) | $33,788 |
Poverty in Gardner
Income Below Poverty by Sex and Age in Gardner
With 38.8% poverty level for males and 29.3% for females among the residents of Gardner, 12 to 14 year old males and 6 to 11 year old females are the most vulnerable to poverty, with 8 males (100.0%) and 38 females (100.0%) in their respective age groups living below the poverty level.
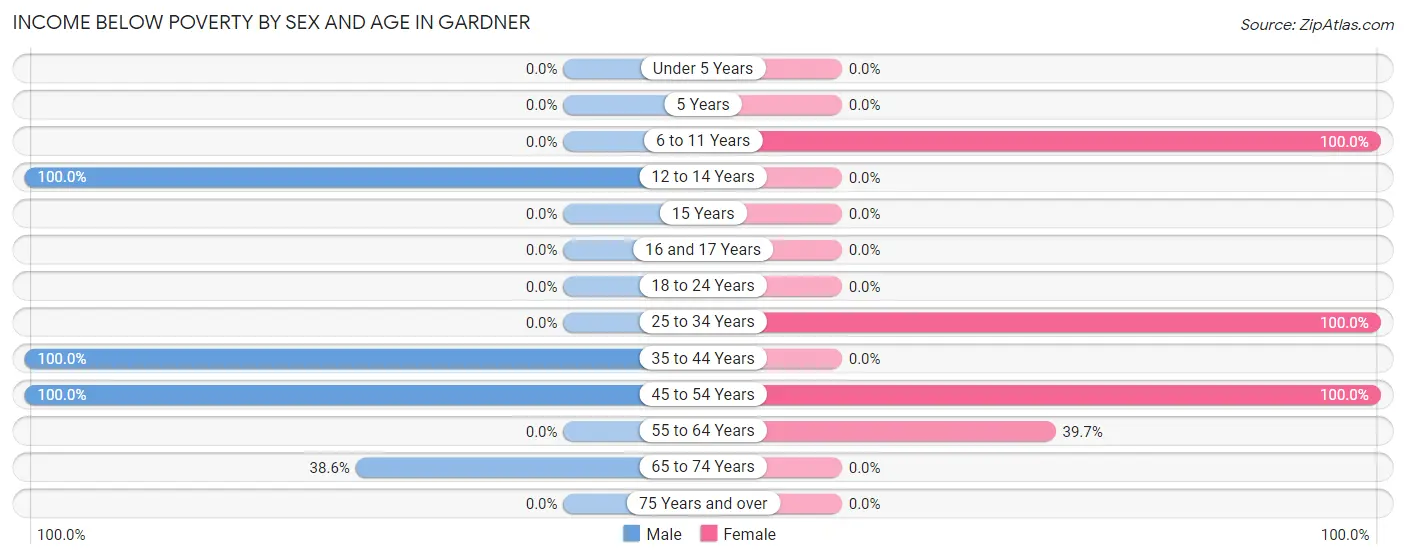
| Age Bracket | Male | Female |
| Under 5 Years | 0 (0.0%) | 0 (0.0%) |
| 5 Years | 0 (0.0%) | 0 (0.0%) |
| 6 to 11 Years | 0 (0.0%) | 38 (100.0%) |
| 12 to 14 Years | 8 (100.0%) | 0 (0.0%) |
| 15 Years | 0 (0.0%) | 0 (0.0%) |
| 16 and 17 Years | 0 (0.0%) | 0 (0.0%) |
| 18 to 24 Years | 0 (0.0%) | 0 (0.0%) |
| 25 to 34 Years | 0 (0.0%) | 15 (100.0%) |
| 35 to 44 Years | 19 (100.0%) | 0 (0.0%) |
| 45 to 54 Years | 17 (100.0%) | 9 (100.0%) |
| 55 to 64 Years | 0 (0.0%) | 25 (39.7%) |
| 65 to 74 Years | 32 (38.6%) | 0 (0.0%) |
| 75 Years and over | 0 (0.0%) | 0 (0.0%) |
| Total | 76 (38.8%) | 87 (29.3%) |
Income Above Poverty by Sex and Age in Gardner
According to the poverty statistics in Gardner, males aged 75 years and over and females aged under 5 years are the age groups that are most secure financially, with 100.0% of males and 100.0% of females in these age groups living above the poverty line.
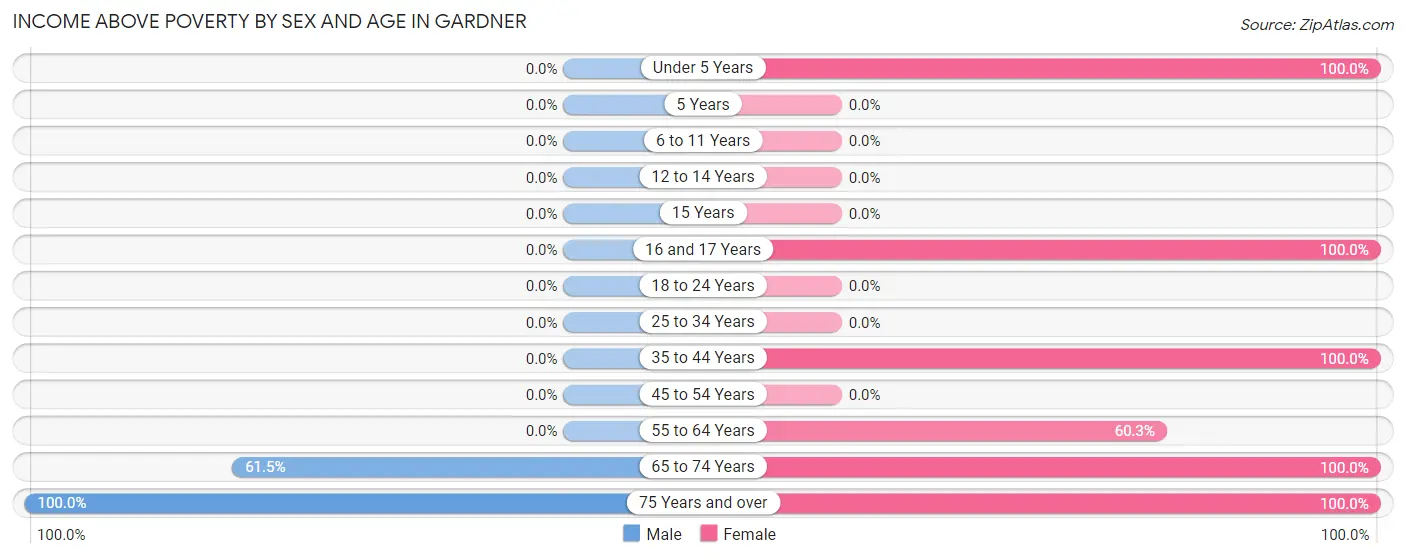
| Age Bracket | Male | Female |
| Under 5 Years | 0 (0.0%) | 19 (100.0%) |
| 5 Years | 0 (0.0%) | 0 (0.0%) |
| 6 to 11 Years | 0 (0.0%) | 0 (0.0%) |
| 12 to 14 Years | 0 (0.0%) | 0 (0.0%) |
| 15 Years | 0 (0.0%) | 0 (0.0%) |
| 16 and 17 Years | 0 (0.0%) | 10 (100.0%) |
| 18 to 24 Years | 0 (0.0%) | 0 (0.0%) |
| 25 to 34 Years | 0 (0.0%) | 0 (0.0%) |
| 35 to 44 Years | 0 (0.0%) | 11 (100.0%) |
| 45 to 54 Years | 0 (0.0%) | 0 (0.0%) |
| 55 to 64 Years | 0 (0.0%) | 38 (60.3%) |
| 65 to 74 Years | 51 (61.5%) | 52 (100.0%) |
| 75 Years and over | 69 (100.0%) | 80 (100.0%) |
| Total | 120 (61.2%) | 210 (70.7%) |
Income Below Poverty Among Married-Couple Families in Gardner
The poverty statistics for married-couple families in Gardner show that 25.7% or 39 of the total 152 families live below the poverty line. Families with 1 or 2 children have the highest poverty rate of 100.0%, comprising of 32 families. On the other hand, families with no children have the lowest poverty rate of 5.8%, which includes 7 families.
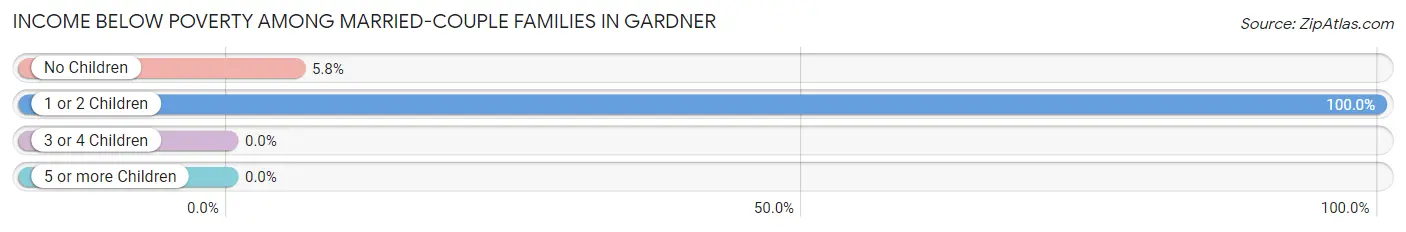
| Children | Above Poverty | Below Poverty |
| No Children | 113 (94.2%) | 7 (5.8%) |
| 1 or 2 Children | 0 (0.0%) | 32 (100.0%) |
| 3 or 4 Children | 0 (0.0%) | 0 (0.0%) |
| 5 or more Children | 0 (0.0%) | 0 (0.0%) |
| Total | 113 (74.3%) | 39 (25.7%) |
Income Below Poverty Among Single-Parent Households in Gardner
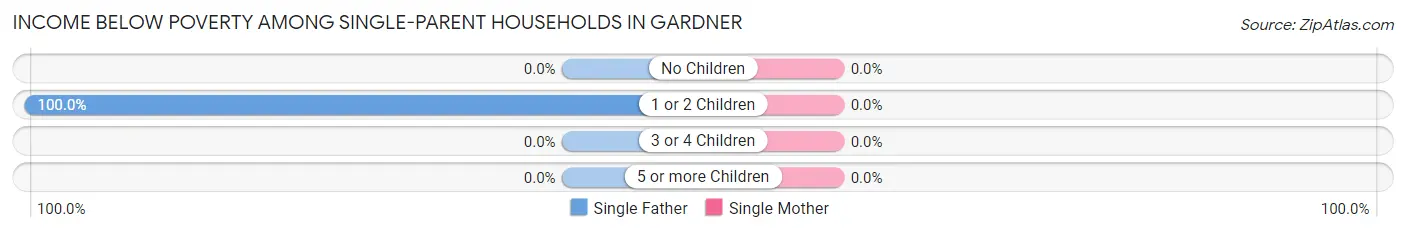
| Children | Single Father | Single Mother |
| No Children | 0 (0.0%) | 0 (0.0%) |
| 1 or 2 Children | 8 (100.0%) | 0 (0.0%) |
| 3 or 4 Children | 0 (0.0%) | 0 (0.0%) |
| 5 or more Children | 0 (0.0%) | 0 (0.0%) |
| Total | 8 (100.0%) | 0 (0.0%) |
Income Below Poverty Among Married-Couple vs Single-Parent Households in Gardner
The poverty data for Gardner shows that 39 of the married-couple family households (25.7%) and 8 of the single-parent households (16.3%) are living below the poverty level. Within the married-couple family households, those with 1 or 2 children have the highest poverty rate, with 32 households (100.0%) falling below the poverty line. Among the single-parent households, those with 1 or 2 children have the highest poverty rate, with 8 household (21.6%) living below poverty.
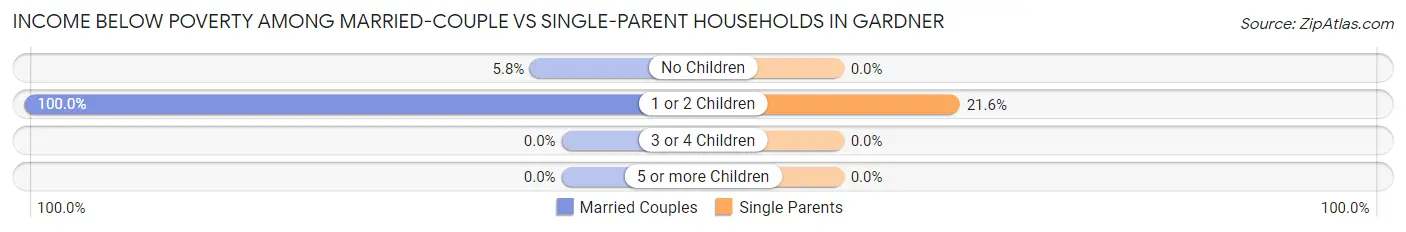
| Children | Married-Couple Families | Single-Parent Households |
| No Children | 7 (5.8%) | 0 (0.0%) |
| 1 or 2 Children | 32 (100.0%) | 8 (21.6%) |
| 3 or 4 Children | 0 (0.0%) | 0 (0.0%) |
| 5 or more Children | 0 (0.0%) | 0 (0.0%) |
| Total | 39 (25.7%) | 8 (16.3%) |
Race in Gardner
The most populous races in Gardner are White / Caucasian (358 | 72.6%), Hispanic or Latino (110 | 22.3%), and Some other Race (103 | 20.9%).
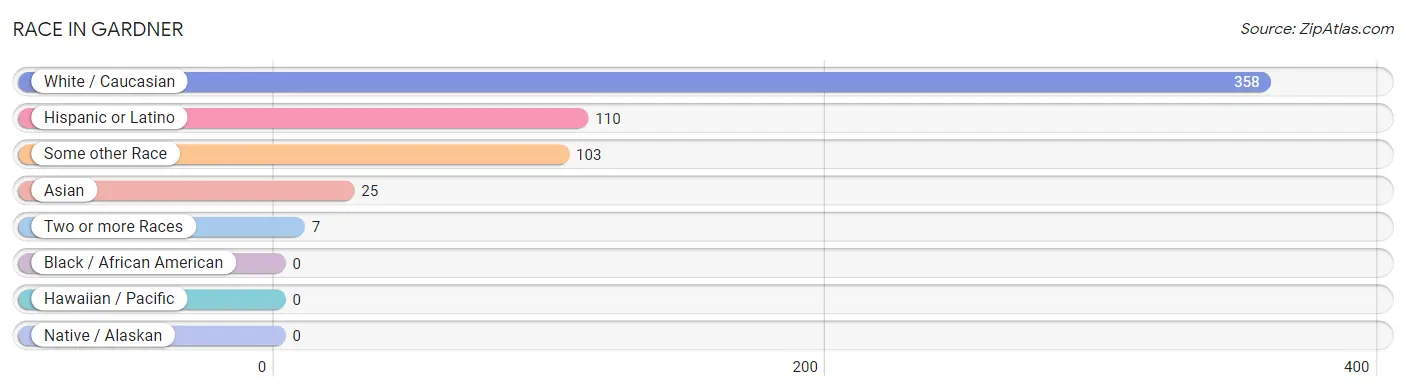
| Race | # Population | % Population |
| Asian | 25 | 5.1% |
| Black / African American | 0 | 0.0% |
| Hawaiian / Pacific | 0 | 0.0% |
| Hispanic or Latino | 110 | 22.3% |
| Native / Alaskan | 0 | 0.0% |
| White / Caucasian | 358 | 72.6% |
| Two or more Races | 7 | 1.4% |
| Some other Race | 103 | 20.9% |
| Total | 493 | 100.0% |
Ancestry in Gardner
The most populous ancestries reported in Gardner are American (111 | 22.5%), Mexican (103 | 20.9%), English (47 | 9.5%), Irish (30 | 6.1%), and Pakistani (25 | 5.1%), together accounting for 64.1% of all Gardner residents.
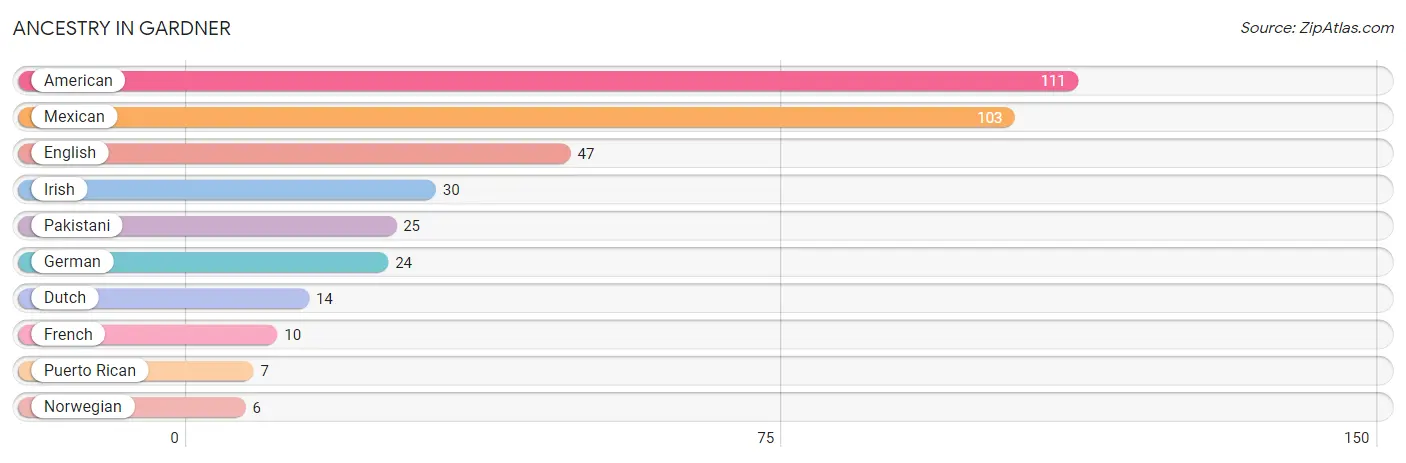
| Ancestry | # Population | % Population |
| American | 111 | 22.5% |
| Dutch | 14 | 2.8% |
| English | 47 | 9.5% |
| French | 10 | 2.0% |
| German | 24 | 4.9% |
| Irish | 30 | 6.1% |
| Mexican | 103 | 20.9% |
| Norwegian | 6 | 1.2% |
| Pakistani | 25 | 5.1% |
| Puerto Rican | 7 | 1.4% | View All 10 Rows |
Immigrants in Gardner
The most numerous immigrant groups reported in Gardner came from Asia (17 | 3.5%), South Eastern Asia (17 | 3.5%), and Thailand (17 | 3.5%), together accounting for 10.4% of all Gardner residents.
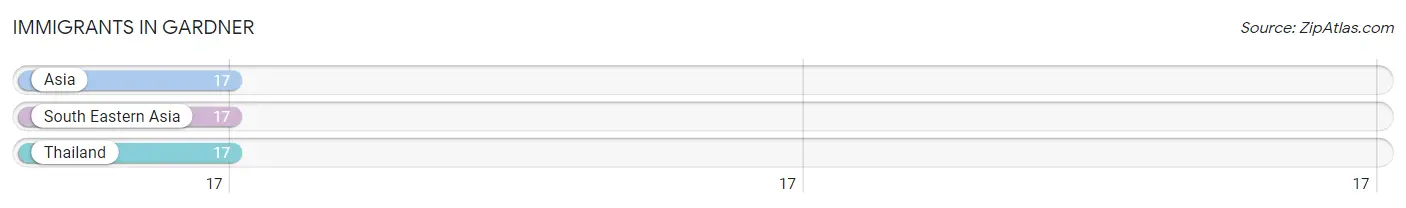
| Immigration Origin | # Population | % Population |
| Asia | 17 | 3.5% |
| South Eastern Asia | 17 | 3.5% |
| Thailand | 17 | 3.5% | View All 3 Rows |
Sex and Age in Gardner
Sex and Age in Gardner
The most populous age groups in Gardner are 65 to 69 Years (42 | 21.4%) for men and 60 to 64 Years (56 | 18.9%) for women.
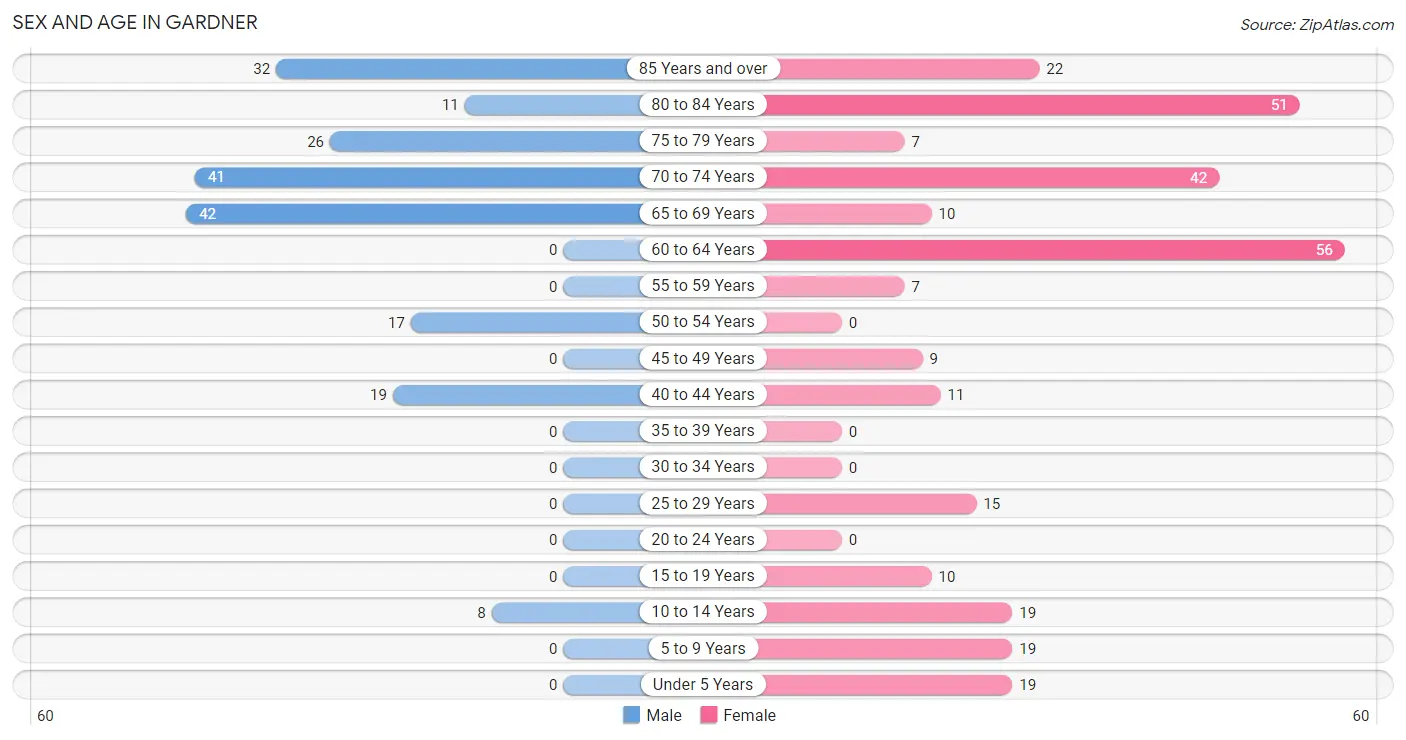
| Age Bracket | Male | Female |
| Under 5 Years | 0 (0.0%) | 19 (6.4%) |
| 5 to 9 Years | 0 (0.0%) | 19 (6.4%) |
| 10 to 14 Years | 8 (4.1%) | 19 (6.4%) |
| 15 to 19 Years | 0 (0.0%) | 10 (3.4%) |
| 20 to 24 Years | 0 (0.0%) | 0 (0.0%) |
| 25 to 29 Years | 0 (0.0%) | 15 (5.1%) |
| 30 to 34 Years | 0 (0.0%) | 0 (0.0%) |
| 35 to 39 Years | 0 (0.0%) | 0 (0.0%) |
| 40 to 44 Years | 19 (9.7%) | 11 (3.7%) |
| 45 to 49 Years | 0 (0.0%) | 9 (3.0%) |
| 50 to 54 Years | 17 (8.7%) | 0 (0.0%) |
| 55 to 59 Years | 0 (0.0%) | 7 (2.4%) |
| 60 to 64 Years | 0 (0.0%) | 56 (18.9%) |
| 65 to 69 Years | 42 (21.4%) | 10 (3.4%) |
| 70 to 74 Years | 41 (20.9%) | 42 (14.1%) |
| 75 to 79 Years | 26 (13.3%) | 7 (2.4%) |
| 80 to 84 Years | 11 (5.6%) | 51 (17.2%) |
| 85 Years and over | 32 (16.3%) | 22 (7.4%) |
| Total | 196 (100.0%) | 297 (100.0%) |
Families and Households in Gardner
Median Family Size in Gardner
The median family size in Gardner is 2.18 persons per family, with married-couple families (152 | 75.6%) accounting for the largest median family size of 2.25 persons per family. On the other hand, single female/mother families (41 | 20.4%) represent the smallest median family size with 1.98 persons per family.
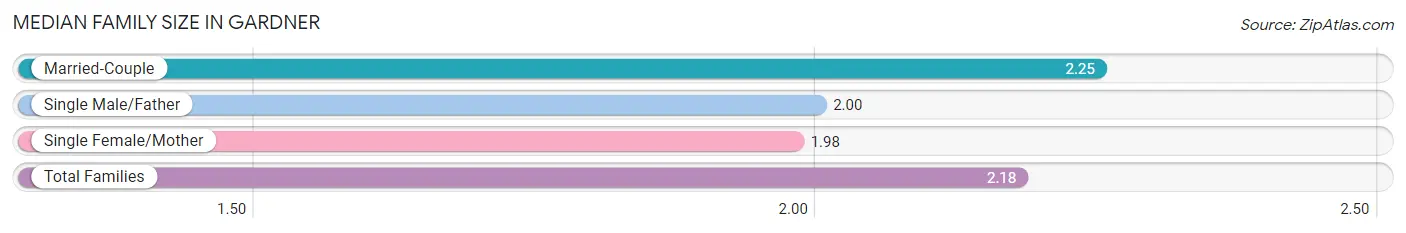
| Family Type | # Families | Family Size |
| Married-Couple | 152 (75.6%) | 2.25 |
| Single Male/Father | 8 (4.0%) | 2.00 |
| Single Female/Mother | 41 (20.4%) | 1.98 |
| Total Families | 201 (100.0%) | 2.18 |
Median Household Size in Gardner
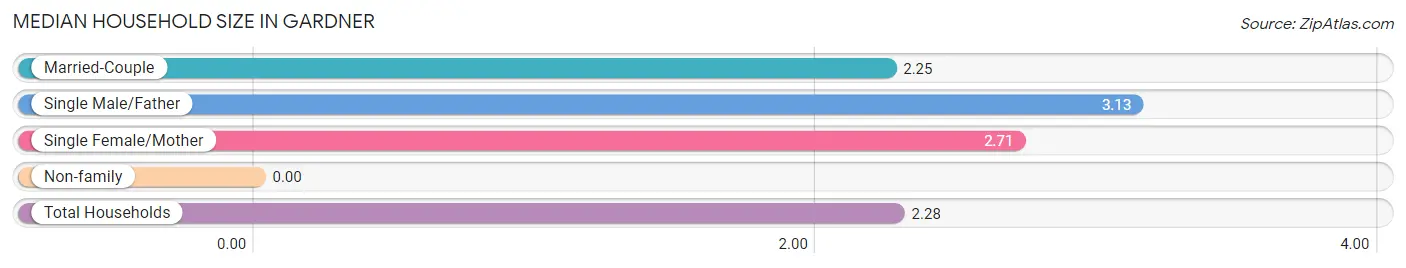
| Household Type | # Households | Household Size |
| Married-Couple | 152 (70.4%) | 2.25 |
| Single Male/Father | 8 (3.7%) | 3.13 |
| Single Female/Mother | 41 (19.0%) | 2.71 |
| Non-family | 15 (6.9%) | - |
| Total Households | 216 (100.0%) | 2.28 |
Household Size by Marriage Status in Gardner
Out of a total of 216 households in Gardner, 201 (93.1%) are family households, while 15 (6.9%) are nonfamily households. The most numerous type of family households are 2-person households, comprising 138, and the most common type of nonfamily households are 1-person households, comprising 15.
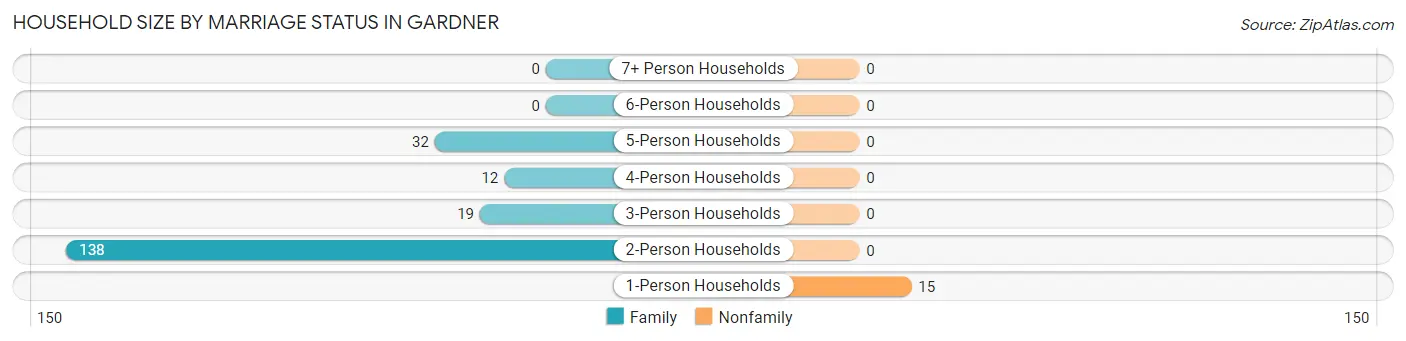
| Household Size | Family Households | Nonfamily Households |
| 1-Person Households | - | 15 (6.9%) |
| 2-Person Households | 138 (63.9%) | 0 (0.0%) |
| 3-Person Households | 19 (8.8%) | 0 (0.0%) |
| 4-Person Households | 12 (5.6%) | 0 (0.0%) |
| 5-Person Households | 32 (14.8%) | 0 (0.0%) |
| 6-Person Households | 0 (0.0%) | 0 (0.0%) |
| 7+ Person Households | 0 (0.0%) | 0 (0.0%) |
| Total | 201 (93.1%) | 15 (6.9%) |
Female Fertility in Gardner
Fertility by Age in Gardner
| Age Bracket | Women with Births | Births / 1,000 Women |
| 15 to 19 years | 0 (0.0%) | 0.0 |
| 20 to 34 years | 0 (0.0%) | 0.0 |
| 35 to 50 years | 0 (0.0%) | 0.0 |
| Total | 0 (0.0%) | 0.0 |
Fertility by Age by Marriage Status in Gardner
| Age Bracket | Married | Unmarried |
| 15 to 19 years | 0 (0.0%) | 0 (0.0%) |
| 20 to 34 years | 0 (0.0%) | 0 (0.0%) |
| 35 to 50 years | 0 (0.0%) | 0 (0.0%) |
| Total | 0 (0.0%) | 0 (0.0%) |
Fertility by Education in Gardner
| Educational Attainment | Women with Births | Births / 1,000 Women |
| Less than High School | 0 (0.0%) | 0.0 |
| High School Diploma | 0 (0.0%) | 0.0 |
| College or Associate's Degree | 0 (0.0%) | 0.0 |
| Bachelor's Degree | 0 (0.0%) | 0.0 |
| Graduate Degree | 0 (0.0%) | 0.0 |
| Total | 0 (0.0%) | 0.0 |
Fertility by Education by Marriage Status in Gardner
| Educational Attainment | Married | Unmarried |
| Less than High School | 0 (0.0%) | 0 (0.0%) |
| High School Diploma | 0 (0.0%) | 0 (0.0%) |
| College or Associate's Degree | 0 (0.0%) | 0 (0.0%) |
| Bachelor's Degree | 0 (0.0%) | 0 (0.0%) |
| Graduate Degree | 0 (0.0%) | 0 (0.0%) |
| Total | 0 (0.0%) | 0 (0.0%) |
Employment Characteristics in Gardner
Employment by Class of Employer in Gardner
Among the 37 employed individuals in Gardner, local government employees (18 | 48.6%), not-for-profit organizations (11 | 29.7%), and self-employed (not incorporated) (8 | 21.6%) make up the most common classes of employment.
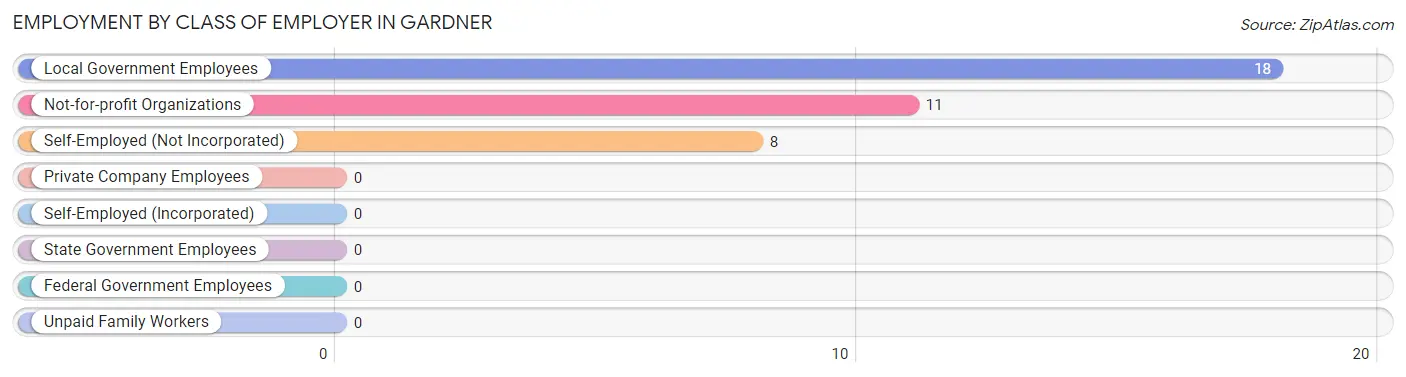
| Employer Class | # Employees | % Employees |
| Private Company Employees | 0 | 0.0% |
| Self-Employed (Incorporated) | 0 | 0.0% |
| Self-Employed (Not Incorporated) | 8 | 21.6% |
| Not-for-profit Organizations | 11 | 29.7% |
| Local Government Employees | 18 | 48.6% |
| State Government Employees | 0 | 0.0% |
| Federal Government Employees | 0 | 0.0% |
| Unpaid Family Workers | 0 | 0.0% |
| Total | 37 | 100.0% |
Employment Status by Age in Gardner
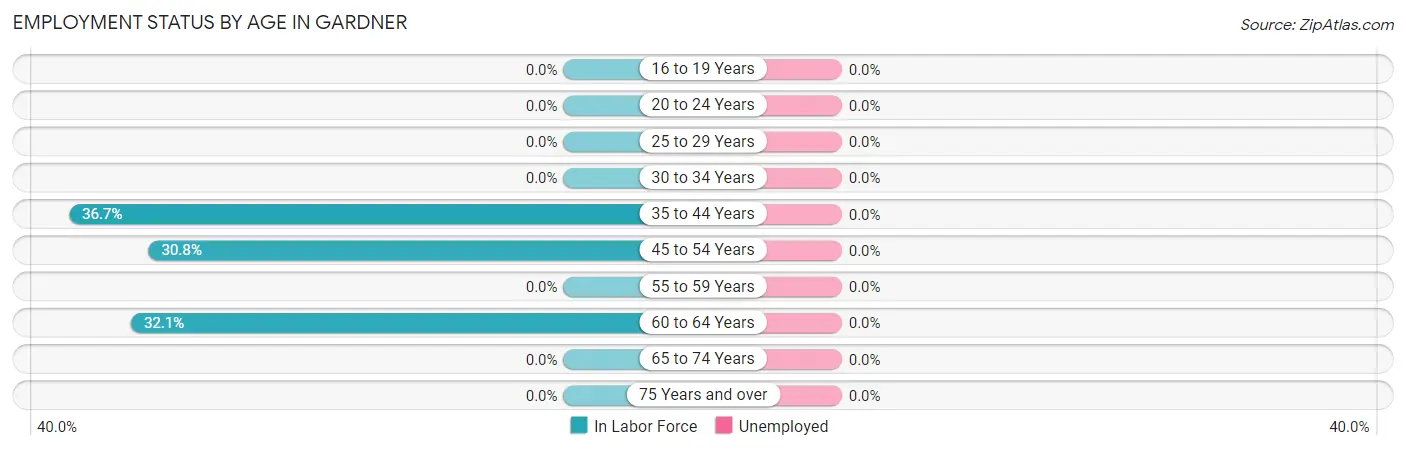
| Age Bracket | In Labor Force | Unemployed |
| 16 to 19 Years | 0 (0.0%) | 0 (0.0%) |
| 20 to 24 Years | 0 (0.0%) | 0 (0.0%) |
| 25 to 29 Years | 0 (0.0%) | 0 (0.0%) |
| 30 to 34 Years | 0 (0.0%) | 0 (0.0%) |
| 35 to 44 Years | 11 (36.7%) | 0 (0.0%) |
| 45 to 54 Years | 8 (30.8%) | 0 (0.0%) |
| 55 to 59 Years | 0 (0.0%) | 0 (0.0%) |
| 60 to 64 Years | 18 (32.1%) | 0 (0.0%) |
| 65 to 74 Years | 0 (0.0%) | 0 (0.0%) |
| 75 Years and over | 0 (0.0%) | 0 (0.0%) |
| Total | 37 (8.6%) | 0 (0.0%) |
Employment Status by Educational Attainment in Gardner
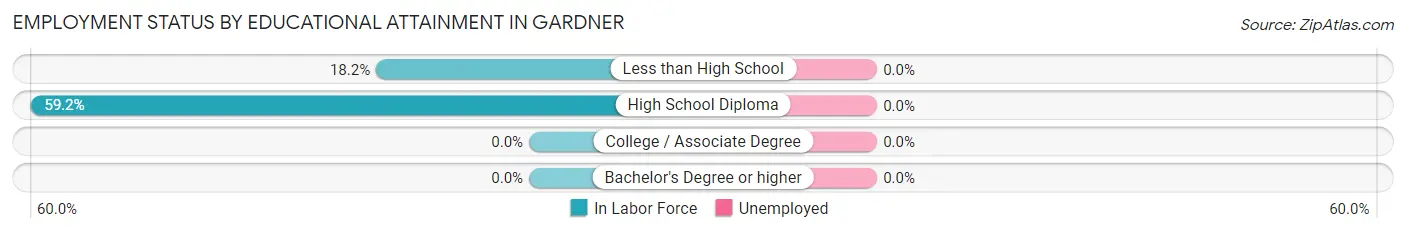
| Educational Attainment | In Labor Force | Unemployed |
| Less than High School | 8 (18.2%) | 0 (0.0%) |
| High School Diploma | 29 (59.2%) | 0 (0.0%) |
| College / Associate Degree | 0 (0.0%) | 0 (0.0%) |
| Bachelor's Degree or higher | 0 (0.0%) | 0 (0.0%) |
| Total | 37 (27.6%) | 0 (0.0%) |
Employment Occupations by Sex in Gardner
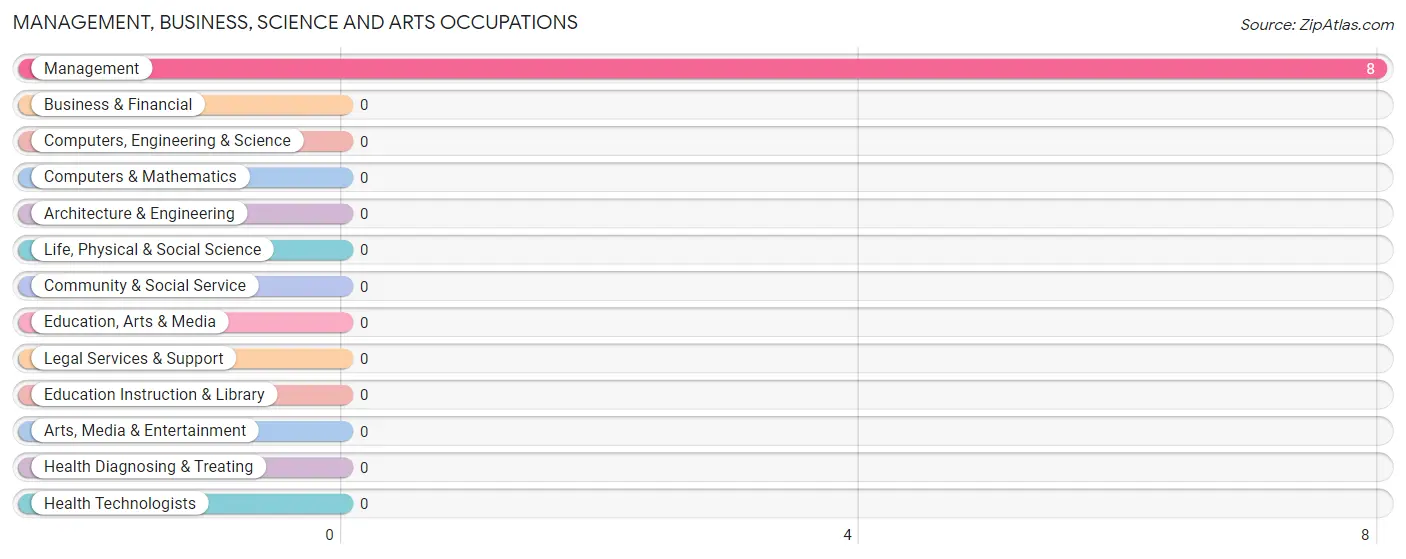
Management, Business, Science and Arts Occupations
The most common Management, Business, Science and Arts occupations in Gardner are , and Management (8 | 21.6%).
Management, Business, Science and Arts Occupations by Sex
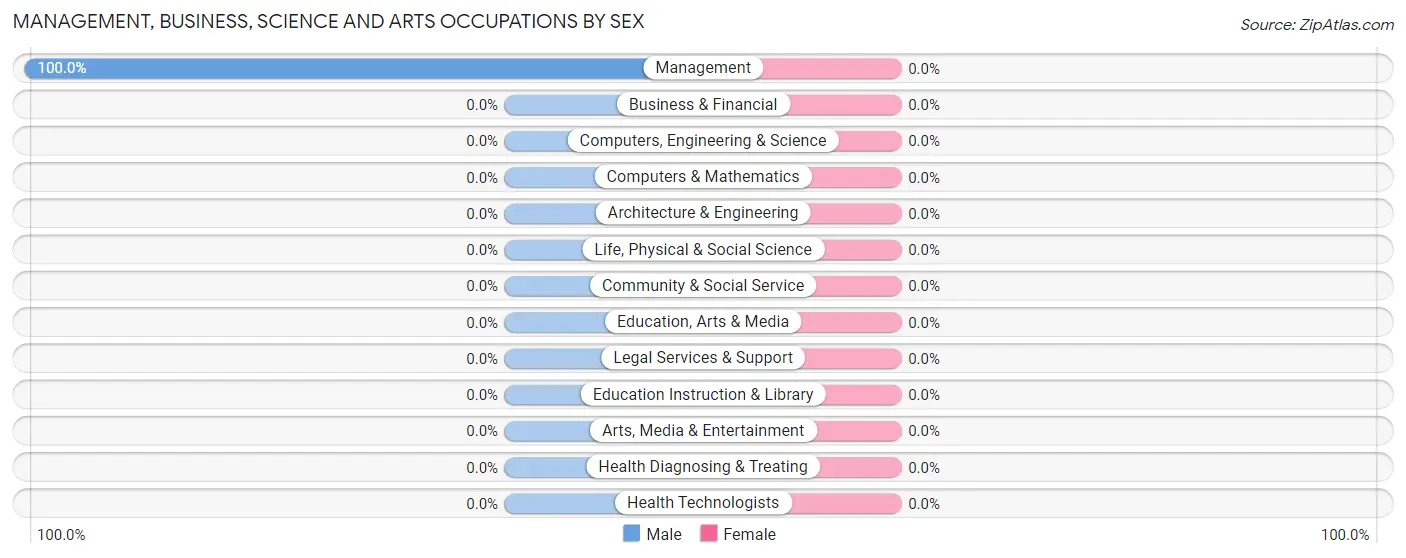
| Occupation | Male | Female |
| Management | 8 (100.0%) | 0 (0.0%) |
| Business & Financial | 0 (0.0%) | 0 (0.0%) |
| Computers, Engineering & Science | 0 (0.0%) | 0 (0.0%) |
| Computers & Mathematics | 0 (0.0%) | 0 (0.0%) |
| Architecture & Engineering | 0 (0.0%) | 0 (0.0%) |
| Life, Physical & Social Science | 0 (0.0%) | 0 (0.0%) |
| Community & Social Service | 0 (0.0%) | 0 (0.0%) |
| Education, Arts & Media | 0 (0.0%) | 0 (0.0%) |
| Legal Services & Support | 0 (0.0%) | 0 (0.0%) |
| Education Instruction & Library | 0 (0.0%) | 0 (0.0%) |
| Arts, Media & Entertainment | 0 (0.0%) | 0 (0.0%) |
| Health Diagnosing & Treating | 0 (0.0%) | 0 (0.0%) |
| Health Technologists | 0 (0.0%) | 0 (0.0%) |
| Total (Category) | 8 (100.0%) | 0 (0.0%) |
| Total (Overall) | 8 (21.6%) | 29 (78.4%) |
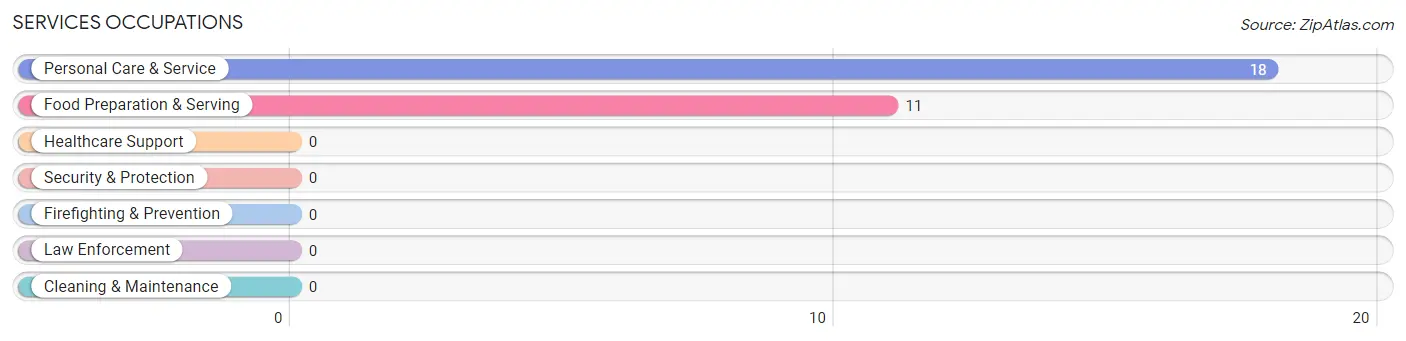
Services Occupations
The most common Services occupations in Gardner are Personal Care & Service (18 | 48.6%), and Food Preparation & Serving (11 | 29.7%).
Services Occupations by Sex
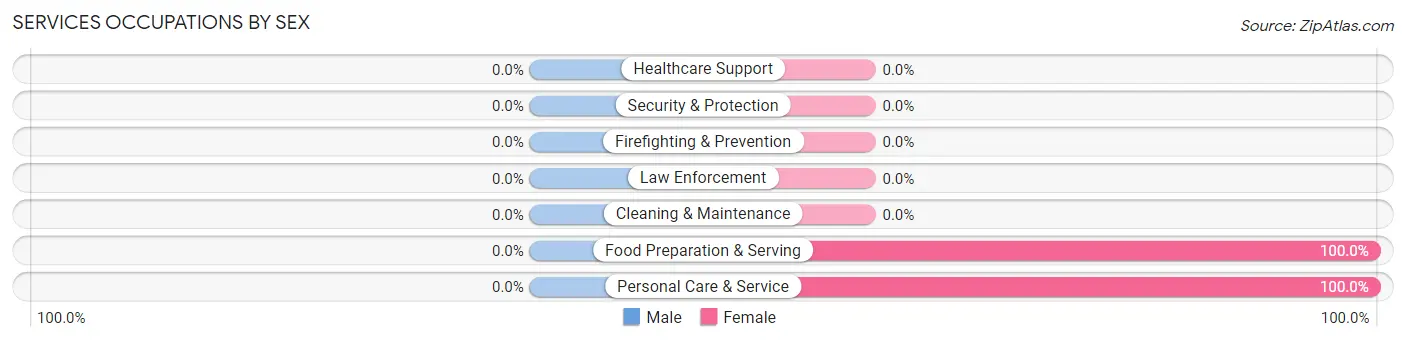
| Occupation | Male | Female |
| Healthcare Support | 0 (0.0%) | 0 (0.0%) |
| Security & Protection | 0 (0.0%) | 0 (0.0%) |
| Firefighting & Prevention | 0 (0.0%) | 0 (0.0%) |
| Law Enforcement | 0 (0.0%) | 0 (0.0%) |
| Food Preparation & Serving | 0 (0.0%) | 11 (100.0%) |
| Cleaning & Maintenance | 0 (0.0%) | 0 (0.0%) |
| Personal Care & Service | 0 (0.0%) | 18 (100.0%) |
| Total (Category) | 0 (0.0%) | 29 (100.0%) |
| Total (Overall) | 8 (21.6%) | 29 (78.4%) |
Sales and Office Occupations
Sales and Office Occupations by Sex
| Occupation | Male | Female |
| Sales & Related | 0 (0.0%) | 0 (0.0%) |
| Office & Administration | 0 (0.0%) | 0 (0.0%) |
| Total (Category) | 0 (0.0%) | 0 (0.0%) |
| Total (Overall) | 8 (21.6%) | 29 (78.4%) |
Natural Resources, Construction and Maintenance Occupations
Natural Resources, Construction and Maintenance Occupations by Sex
| Occupation | Male | Female |
| Farming, Fishing & Forestry | 0 (0.0%) | 0 (0.0%) |
| Construction & Extraction | 0 (0.0%) | 0 (0.0%) |
| Installation, Maintenance & Repair | 0 (0.0%) | 0 (0.0%) |
| Total (Category) | 0 (0.0%) | 0 (0.0%) |
| Total (Overall) | 8 (21.6%) | 29 (78.4%) |
Production, Transportation and Moving Occupations
Production, Transportation and Moving Occupations by Sex
| Occupation | Male | Female |
| Production | 0 (0.0%) | 0 (0.0%) |
| Transportation | 0 (0.0%) | 0 (0.0%) |
| Material Moving | 0 (0.0%) | 0 (0.0%) |
| Total (Category) | 0 (0.0%) | 0 (0.0%) |
| Total (Overall) | 8 (21.6%) | 29 (78.4%) |
Employment Industries by Sex in Gardner
Employment Industries in Gardner
The major employment industries in Gardner include Arts, Entertainment & Recreation (18 | 48.6%), Accommodation & Food Services (11 | 29.7%), and Agriculture, Fishing & Hunting (8 | 21.6%).
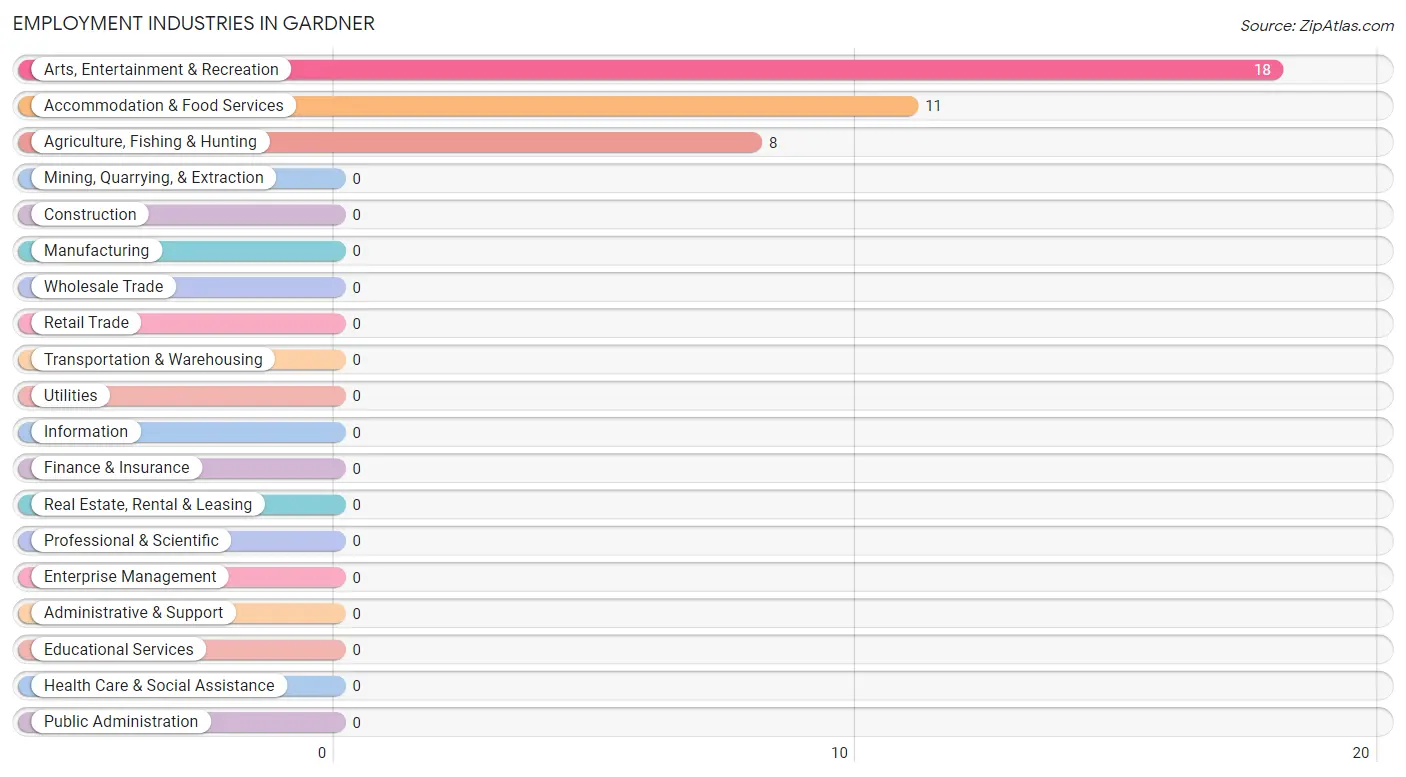
Employment Industries by Sex in Gardner
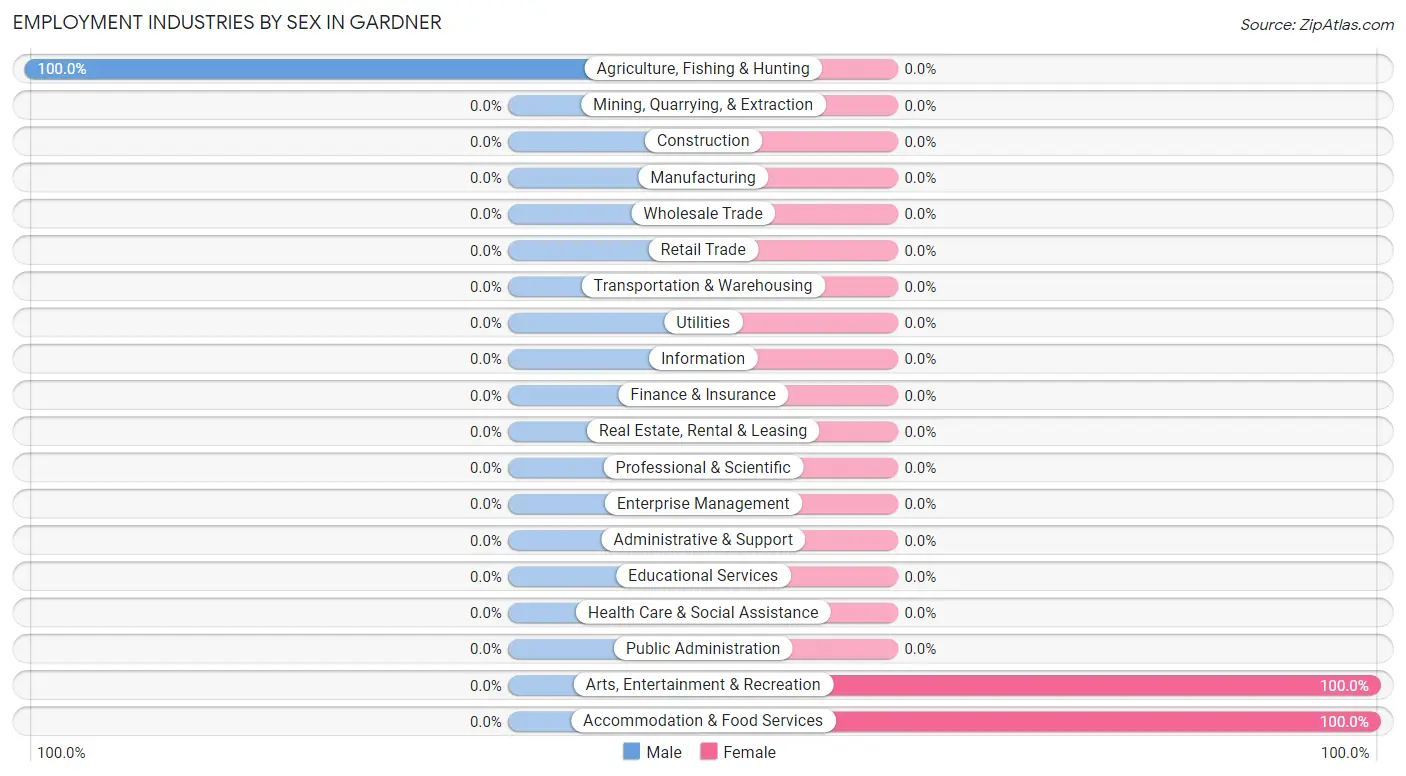
| Industry | Male | Female |
| Agriculture, Fishing & Hunting | 8 (100.0%) | 0 (0.0%) |
| Mining, Quarrying, & Extraction | 0 (0.0%) | 0 (0.0%) |
| Construction | 0 (0.0%) | 0 (0.0%) |
| Manufacturing | 0 (0.0%) | 0 (0.0%) |
| Wholesale Trade | 0 (0.0%) | 0 (0.0%) |
| Retail Trade | 0 (0.0%) | 0 (0.0%) |
| Transportation & Warehousing | 0 (0.0%) | 0 (0.0%) |
| Utilities | 0 (0.0%) | 0 (0.0%) |
| Information | 0 (0.0%) | 0 (0.0%) |
| Finance & Insurance | 0 (0.0%) | 0 (0.0%) |
| Real Estate, Rental & Leasing | 0 (0.0%) | 0 (0.0%) |
| Professional & Scientific | 0 (0.0%) | 0 (0.0%) |
| Enterprise Management | 0 (0.0%) | 0 (0.0%) |
| Administrative & Support | 0 (0.0%) | 0 (0.0%) |
| Educational Services | 0 (0.0%) | 0 (0.0%) |
| Health Care & Social Assistance | 0 (0.0%) | 0 (0.0%) |
| Arts, Entertainment & Recreation | 0 (0.0%) | 18 (100.0%) |
| Accommodation & Food Services | 0 (0.0%) | 11 (100.0%) |
| Public Administration | 0 (0.0%) | 0 (0.0%) |
| Total | 8 (21.6%) | 29 (78.4%) |
Education in Gardner
School Enrollment in Gardner
The most common levels of schooling among the 67 students in Gardner are elementary school (38 | 56.7%), graduate / professional (11 | 16.4%), and high school (10 | 14.9%).
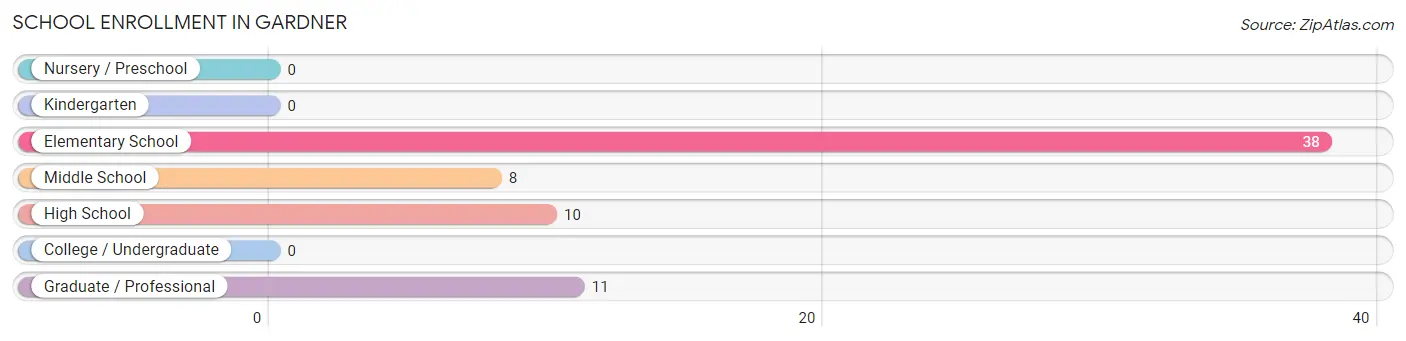
| School Level | # Students | % Students |
| Nursery / Preschool | 0 | 0.0% |
| Kindergarten | 0 | 0.0% |
| Elementary School | 38 | 56.7% |
| Middle School | 8 | 11.9% |
| High School | 10 | 14.9% |
| College / Undergraduate | 0 | 0.0% |
| Graduate / Professional | 11 | 16.4% |
| Total | 67 | 100.0% |
School Enrollment by Age by Funding Source in Gardner
Out of a total of 67 students who are enrolled in schools in Gardner, 11 (16.4%) attend a private institution, while the remaining 56 (83.6%) are enrolled in public schools. The age group of 35 years and over has the highest likelihood of being enrolled in private schools, with 11 (100.0% in the age bracket) enrolled. Conversely, the age group of 5 to 9 year old has the lowest likelihood of being enrolled in a private school, with 19 (100.0% in the age bracket) attending a public institution.
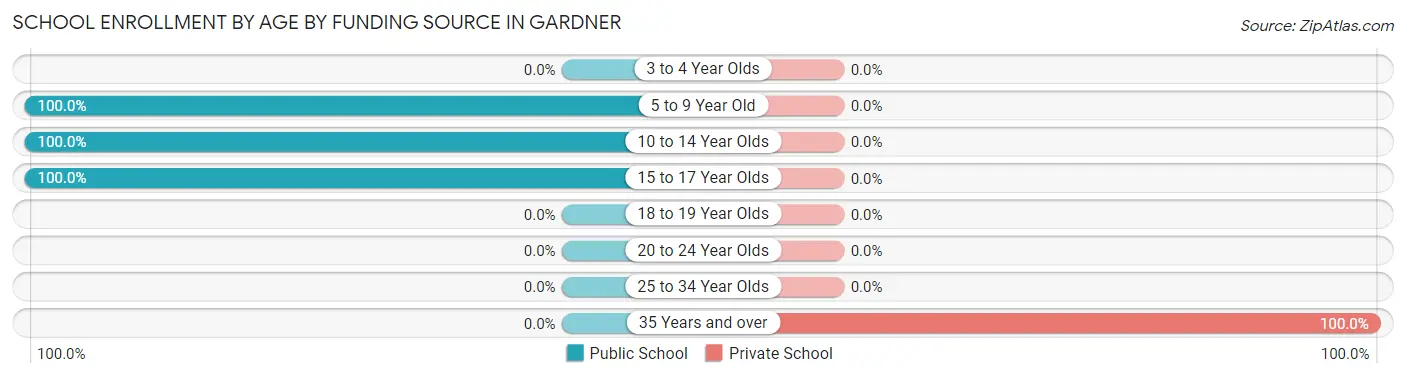
| Age Bracket | Public School | Private School |
| 3 to 4 Year Olds | 0 (0.0%) | 0 (0.0%) |
| 5 to 9 Year Old | 19 (100.0%) | 0 (0.0%) |
| 10 to 14 Year Olds | 27 (100.0%) | 0 (0.0%) |
| 15 to 17 Year Olds | 10 (100.0%) | 0 (0.0%) |
| 18 to 19 Year Olds | 0 (0.0%) | 0 (0.0%) |
| 20 to 24 Year Olds | 0 (0.0%) | 0 (0.0%) |
| 25 to 34 Year Olds | 0 (0.0%) | 0 (0.0%) |
| 35 Years and over | 0 (0.0%) | 11 (100.0%) |
| Total | 56 (83.6%) | 11 (16.4%) |
Educational Attainment by Field of Study in Gardner
Education (11 | 29.7%), arts & humanities (11 | 29.7%), communications (9 | 24.3%), and physical & health sciences (6 | 16.2%) are the most common fields of study among 37 individuals in Gardner who have obtained a bachelor's degree or higher.
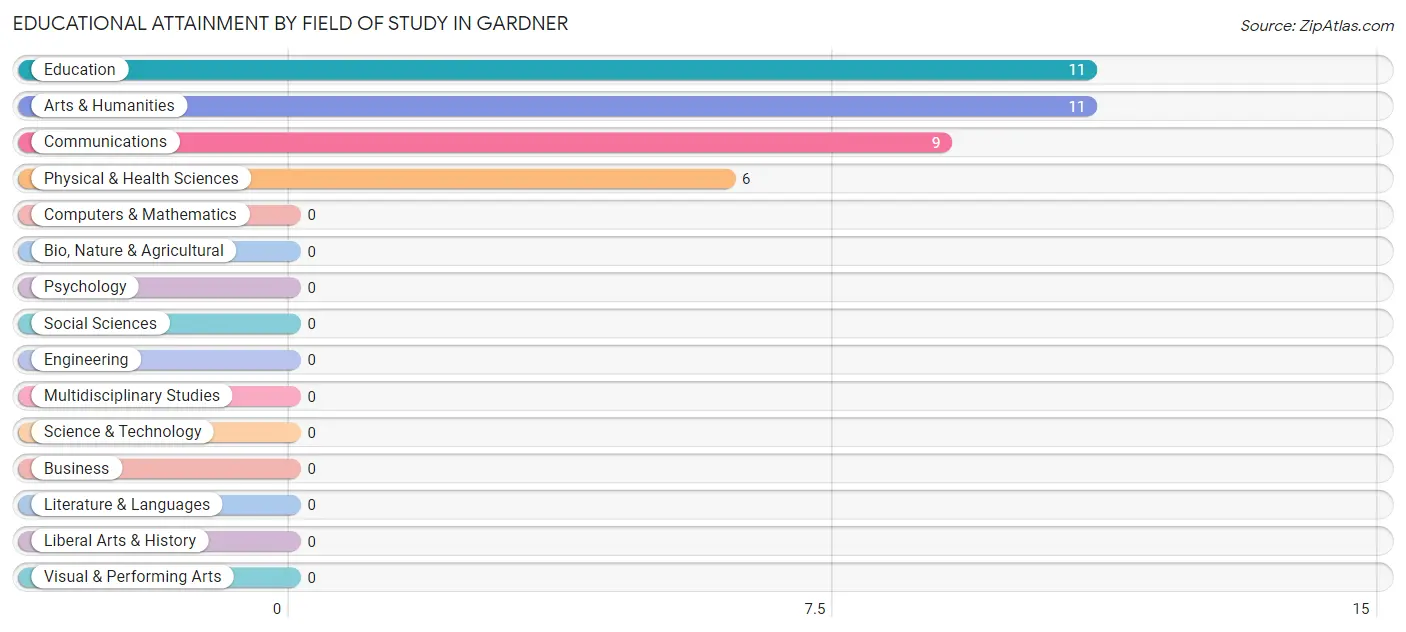
| Field of Study | # Graduates | % Graduates |
| Computers & Mathematics | 0 | 0.0% |
| Bio, Nature & Agricultural | 0 | 0.0% |
| Physical & Health Sciences | 6 | 16.2% |
| Psychology | 0 | 0.0% |
| Social Sciences | 0 | 0.0% |
| Engineering | 0 | 0.0% |
| Multidisciplinary Studies | 0 | 0.0% |
| Science & Technology | 0 | 0.0% |
| Business | 0 | 0.0% |
| Education | 11 | 29.7% |
| Literature & Languages | 0 | 0.0% |
| Liberal Arts & History | 0 | 0.0% |
| Visual & Performing Arts | 0 | 0.0% |
| Communications | 9 | 24.3% |
| Arts & Humanities | 11 | 29.7% |
| Total | 37 | 100.0% |
Transportation & Commute in Gardner
Vehicle Availability by Sex in Gardner
The most prevalent vehicle ownership categories in Gardner are males with 3 vehicles (8, accounting for 100.0%) and females with 3 vehicles (0, making up 27.6%).
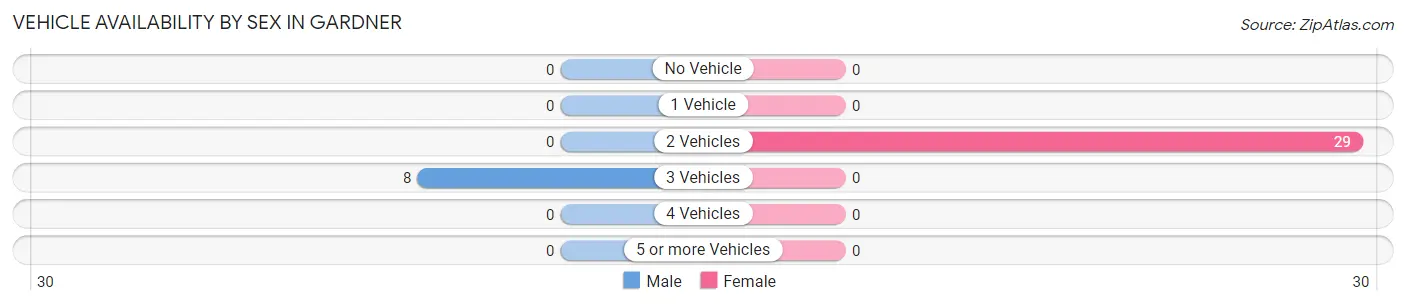
| Vehicles Available | Male | Female |
| No Vehicle | 0 (0.0%) | 0 (0.0%) |
| 1 Vehicle | 0 (0.0%) | 0 (0.0%) |
| 2 Vehicles | 0 (0.0%) | 29 (100.0%) |
| 3 Vehicles | 8 (100.0%) | 0 (0.0%) |
| 4 Vehicles | 0 (0.0%) | 0 (0.0%) |
| 5 or more Vehicles | 0 (0.0%) | 0 (0.0%) |
| Total | 8 (100.0%) | 29 (100.0%) |
Commute Time in Gardner
The most frequently occuring commute durations in Gardner are 10 to 14 minutes (19 commuters, 51.3%), 15 to 19 minutes (18 commuters, 48.6%), and less than 5 minutes (0 commuters, 0.0%).
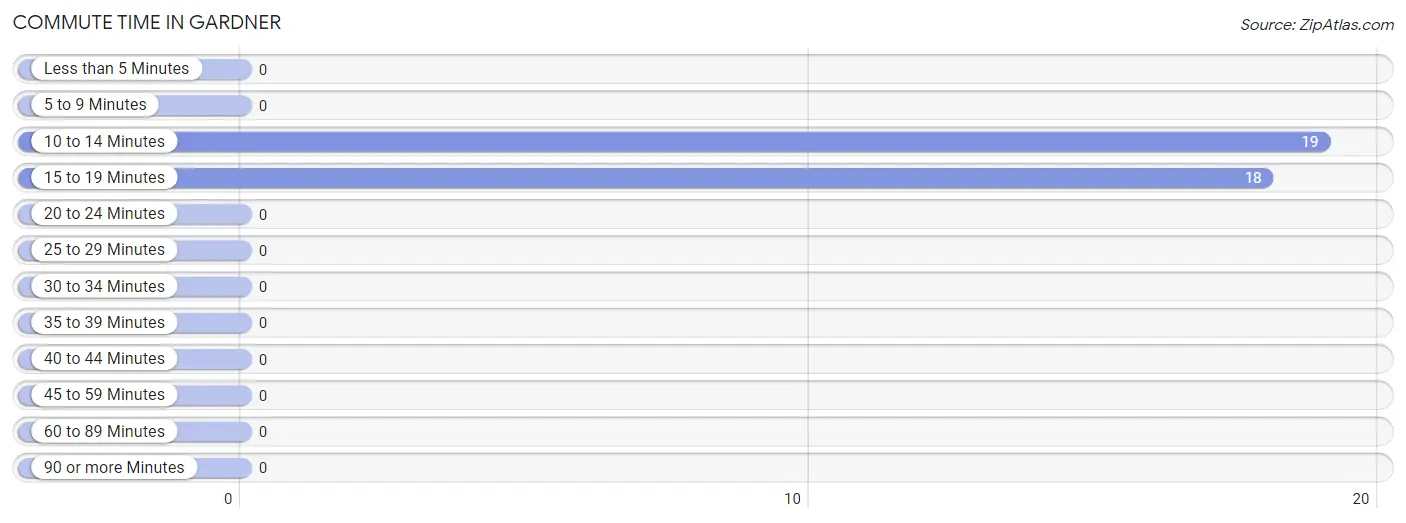
| Commute Time | # Commuters | % Commuters |
| Less than 5 Minutes | 0 | 0.0% |
| 5 to 9 Minutes | 0 | 0.0% |
| 10 to 14 Minutes | 19 | 51.3% |
| 15 to 19 Minutes | 18 | 48.6% |
| 20 to 24 Minutes | 0 | 0.0% |
| 25 to 29 Minutes | 0 | 0.0% |
| 30 to 34 Minutes | 0 | 0.0% |
| 35 to 39 Minutes | 0 | 0.0% |
| 40 to 44 Minutes | 0 | 0.0% |
| 45 to 59 Minutes | 0 | 0.0% |
| 60 to 89 Minutes | 0 | 0.0% |
| 90 or more Minutes | 0 | 0.0% |
Commute Time by Sex in Gardner
The most common commute times in Gardner are 10 to 14 minutes (8 commuters, 100.0%) for males and 15 to 19 minutes (18 commuters, 62.1%) for females.
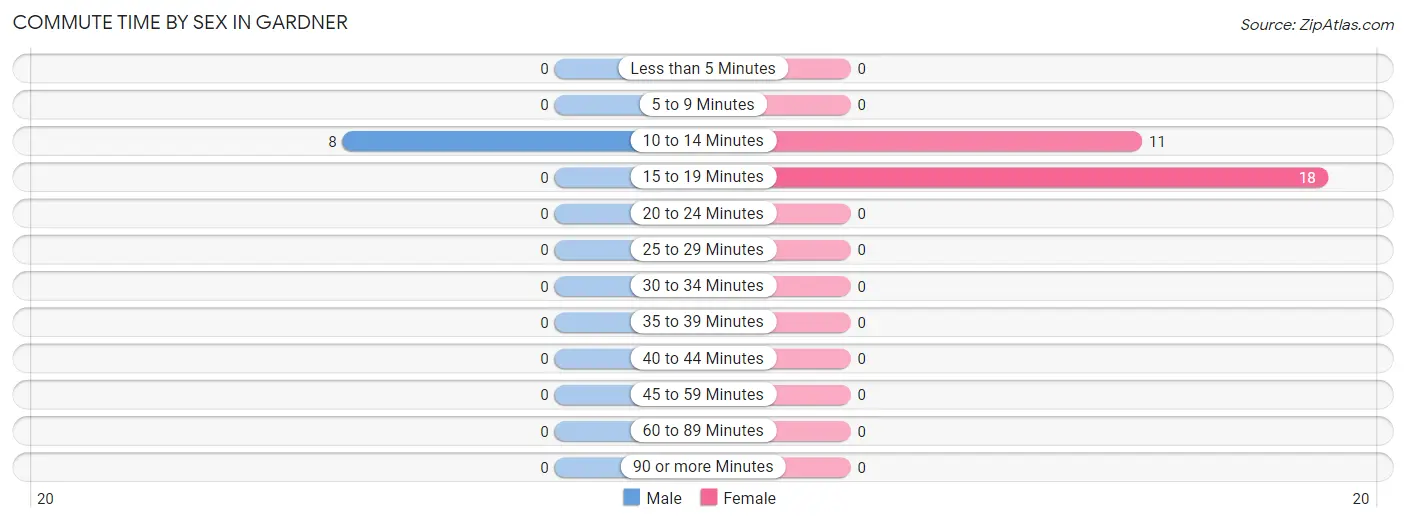
| Commute Time | Male | Female |
| Less than 5 Minutes | 0 (0.0%) | 0 (0.0%) |
| 5 to 9 Minutes | 0 (0.0%) | 0 (0.0%) |
| 10 to 14 Minutes | 8 (100.0%) | 11 (37.9%) |
| 15 to 19 Minutes | 0 (0.0%) | 18 (62.1%) |
| 20 to 24 Minutes | 0 (0.0%) | 0 (0.0%) |
| 25 to 29 Minutes | 0 (0.0%) | 0 (0.0%) |
| 30 to 34 Minutes | 0 (0.0%) | 0 (0.0%) |
| 35 to 39 Minutes | 0 (0.0%) | 0 (0.0%) |
| 40 to 44 Minutes | 0 (0.0%) | 0 (0.0%) |
| 45 to 59 Minutes | 0 (0.0%) | 0 (0.0%) |
| 60 to 89 Minutes | 0 (0.0%) | 0 (0.0%) |
| 90 or more Minutes | 0 (0.0%) | 0 (0.0%) |
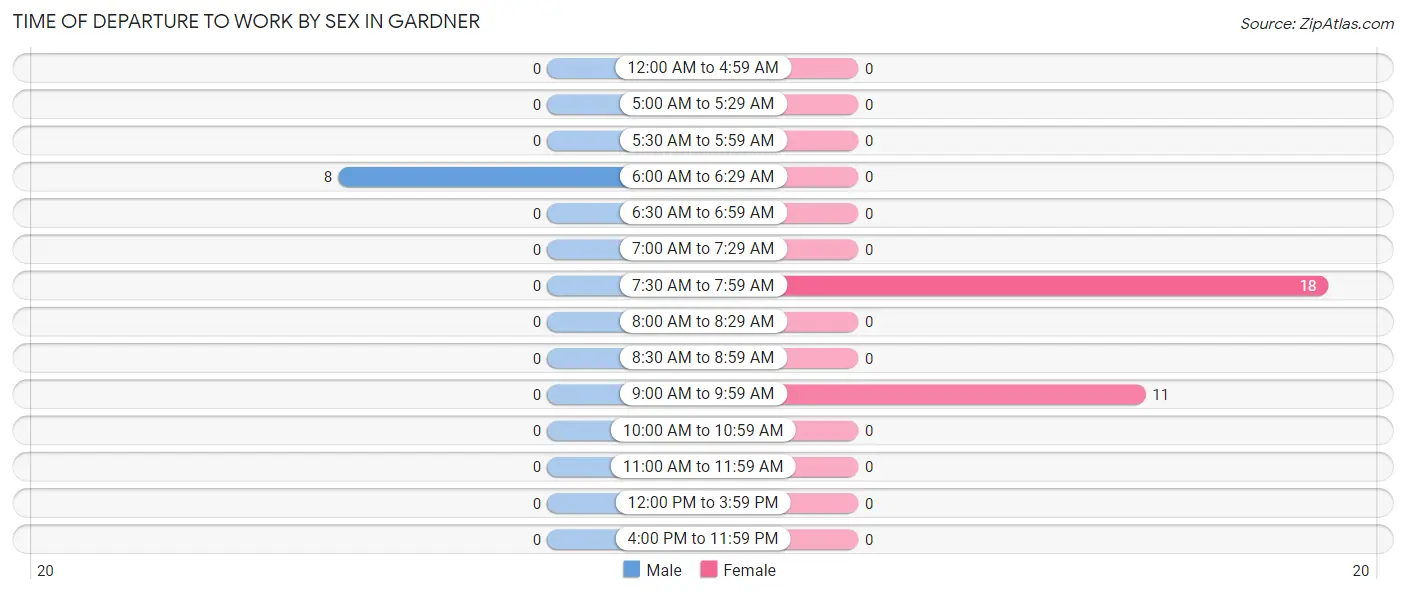
Time of Departure to Work by Sex in Gardner
The most frequent times of departure to work in Gardner are 6:00 AM to 6:29 AM (8, 100.0%) for males and 7:30 AM to 7:59 AM (18, 62.1%) for females.
| Time of Departure | Male | Female |
| 12:00 AM to 4:59 AM | 0 (0.0%) | 0 (0.0%) |
| 5:00 AM to 5:29 AM | 0 (0.0%) | 0 (0.0%) |
| 5:30 AM to 5:59 AM | 0 (0.0%) | 0 (0.0%) |
| 6:00 AM to 6:29 AM | 8 (100.0%) | 0 (0.0%) |
| 6:30 AM to 6:59 AM | 0 (0.0%) | 0 (0.0%) |
| 7:00 AM to 7:29 AM | 0 (0.0%) | 0 (0.0%) |
| 7:30 AM to 7:59 AM | 0 (0.0%) | 18 (62.1%) |
| 8:00 AM to 8:29 AM | 0 (0.0%) | 0 (0.0%) |
| 8:30 AM to 8:59 AM | 0 (0.0%) | 0 (0.0%) |
| 9:00 AM to 9:59 AM | 0 (0.0%) | 11 (37.9%) |
| 10:00 AM to 10:59 AM | 0 (0.0%) | 0 (0.0%) |
| 11:00 AM to 11:59 AM | 0 (0.0%) | 0 (0.0%) |
| 12:00 PM to 3:59 PM | 0 (0.0%) | 0 (0.0%) |
| 4:00 PM to 11:59 PM | 0 (0.0%) | 0 (0.0%) |
| Total | 8 (100.0%) | 29 (100.0%) |
Housing Occupancy in Gardner
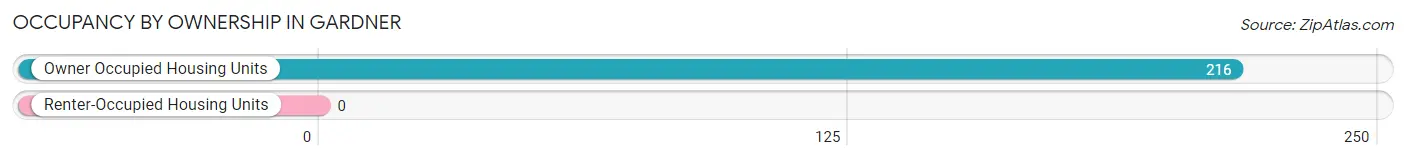
Occupancy by Ownership in Gardner
Of the total 216 dwellings in Gardner, owner-occupied units account for 216 (100.0%), while renter-occupied units make up 0 (0.0%).
| Occupancy | # Housing Units | % Housing Units |
| Owner Occupied Housing Units | 216 | 100.0% |
| Renter-Occupied Housing Units | 0 | 0.0% |
| Total Occupied Housing Units | 216 | 100.0% |
Occupancy by Household Size in Gardner
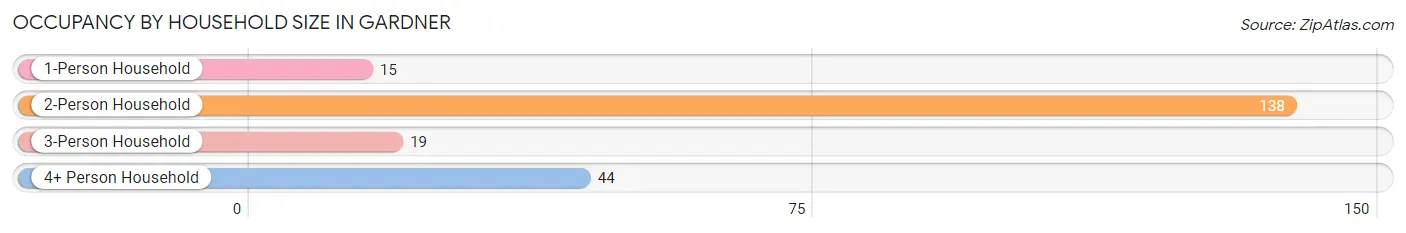
| Household Size | # Housing Units | % Housing Units |
| 1-Person Household | 15 | 6.9% |
| 2-Person Household | 138 | 63.9% |
| 3-Person Household | 19 | 8.8% |
| 4+ Person Household | 44 | 20.4% |
| Total Housing Units | 216 | 100.0% |
Occupancy by Ownership by Household Size in Gardner
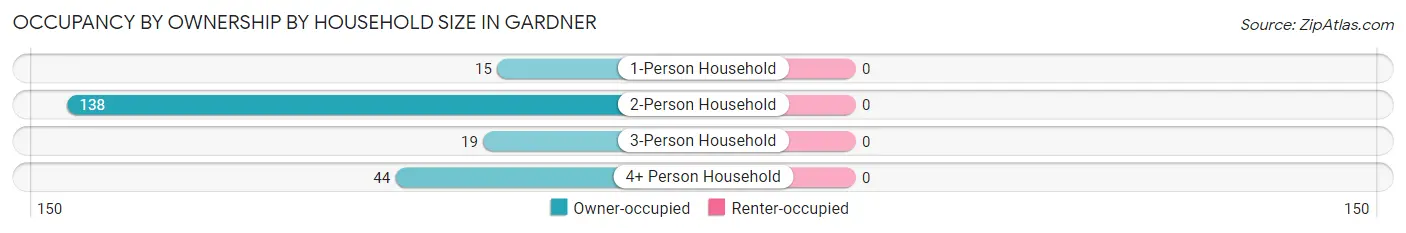
| Household Size | Owner-occupied | Renter-occupied |
| 1-Person Household | 15 (100.0%) | 0 (0.0%) |
| 2-Person Household | 138 (100.0%) | 0 (0.0%) |
| 3-Person Household | 19 (100.0%) | 0 (0.0%) |
| 4+ Person Household | 44 (100.0%) | 0 (0.0%) |
| Total Housing Units | 216 (100.0%) | 0 (0.0%) |
Occupancy by Educational Attainment in Gardner
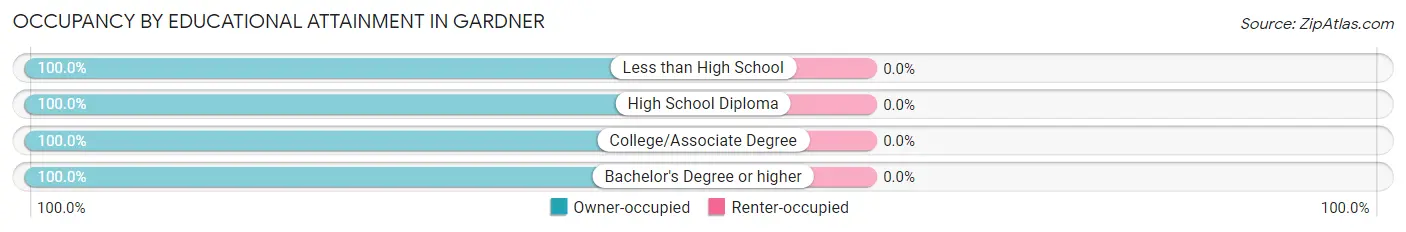
| Household Size | Owner-occupied | Renter-occupied |
| Less than High School | 46 (100.0%) | 0 (0.0%) |
| High School Diploma | 116 (100.0%) | 0 (0.0%) |
| College/Associate Degree | 37 (100.0%) | 0 (0.0%) |
| Bachelor's Degree or higher | 17 (100.0%) | 0 (0.0%) |
Occupancy by Age of Householder in Gardner
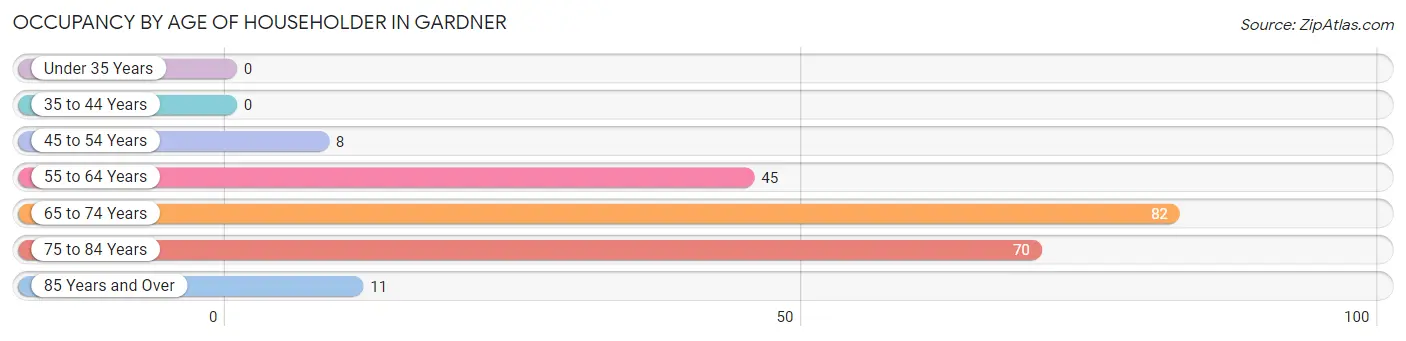
| Age Bracket | # Households | % Households |
| Under 35 Years | 0 | 0.0% |
| 35 to 44 Years | 0 | 0.0% |
| 45 to 54 Years | 8 | 3.7% |
| 55 to 64 Years | 45 | 20.8% |
| 65 to 74 Years | 82 | 38.0% |
| 75 to 84 Years | 70 | 32.4% |
| 85 Years and Over | 11 | 5.1% |
| Total | 216 | 100.0% |
Housing Finances in Gardner
Median Income by Occupancy in Gardner
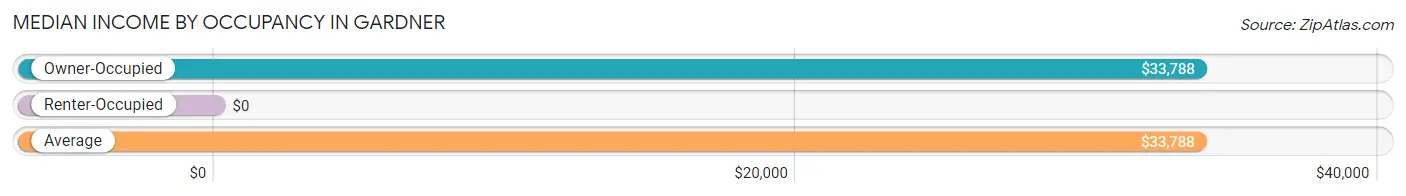
| Occupancy Type | # Households | Median Income |
| Owner-Occupied | 216 (100.0%) | $33,788 |
| Renter-Occupied | 0 (0.0%) | $0 |
| Average | 216 (100.0%) | $33,788 |
Occupancy by Householder Income Bracket in Gardner
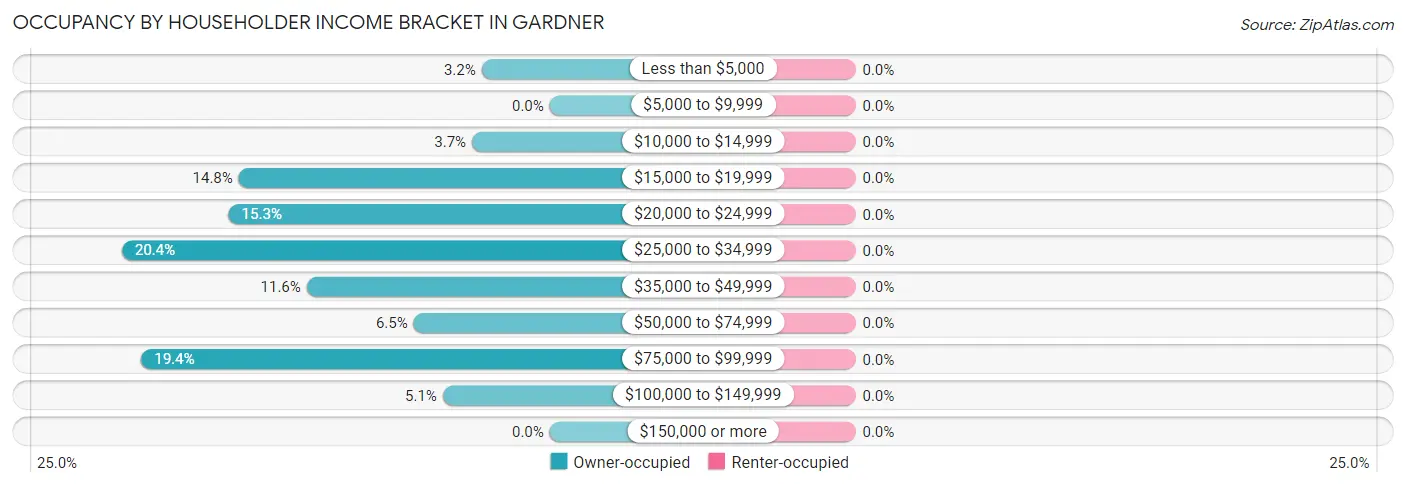
| Income Bracket | Owner-occupied | Renter-occupied |
| Less than $5,000 | 7 (3.2%) | 0 (0.0%) |
| $5,000 to $9,999 | 0 (0.0%) | 0 (0.0%) |
| $10,000 to $14,999 | 8 (3.7%) | 0 (0.0%) |
| $15,000 to $19,999 | 32 (14.8%) | 0 (0.0%) |
| $20,000 to $24,999 | 33 (15.3%) | 0 (0.0%) |
| $25,000 to $34,999 | 44 (20.4%) | 0 (0.0%) |
| $35,000 to $49,999 | 25 (11.6%) | 0 (0.0%) |
| $50,000 to $74,999 | 14 (6.5%) | 0 (0.0%) |
| $75,000 to $99,999 | 42 (19.4%) | 0 (0.0%) |
| $100,000 to $149,999 | 11 (5.1%) | 0 (0.0%) |
| $150,000 or more | 0 (0.0%) | 0 (0.0%) |
| Total | 216 (100.0%) | 0 (0.0%) |
Monthly Housing Cost Tiers in Gardner
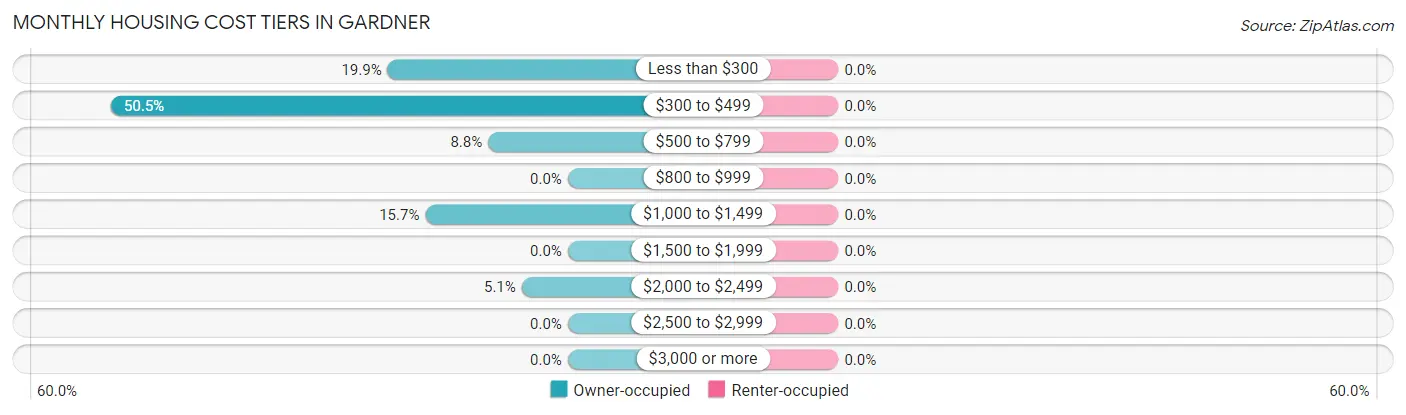
| Monthly Cost | Owner-occupied | Renter-occupied |
| Less than $300 | 43 (19.9%) | 0 (0.0%) |
| $300 to $499 | 109 (50.5%) | 0 (0.0%) |
| $500 to $799 | 19 (8.8%) | 0 (0.0%) |
| $800 to $999 | 0 (0.0%) | 0 (0.0%) |
| $1,000 to $1,499 | 34 (15.7%) | 0 (0.0%) |
| $1,500 to $1,999 | 0 (0.0%) | 0 (0.0%) |
| $2,000 to $2,499 | 11 (5.1%) | 0 (0.0%) |
| $2,500 to $2,999 | 0 (0.0%) | 0 (0.0%) |
| $3,000 or more | 0 (0.0%) | 0 (0.0%) |
| Total | 216 (100.0%) | 0 (0.0%) |
Physical Housing Characteristics in Gardner
Housing Structures in Gardner
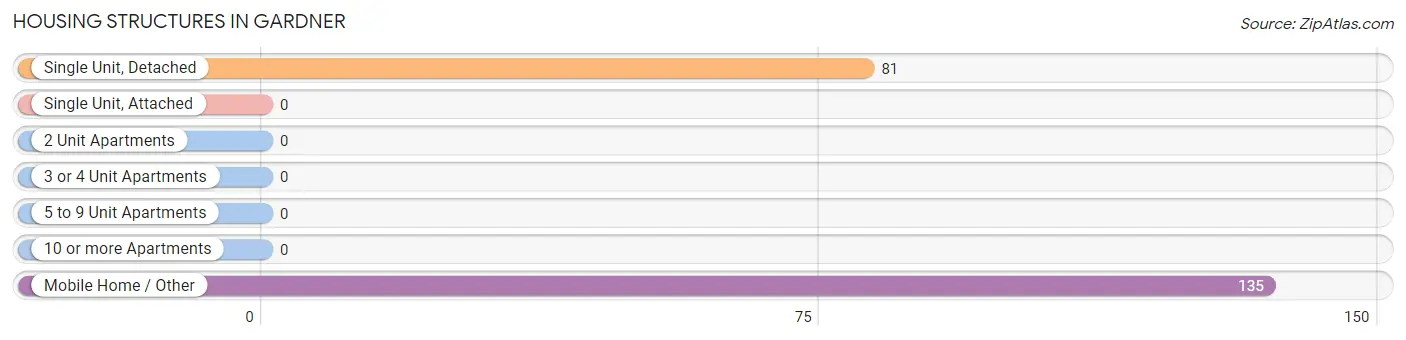
| Structure Type | # Housing Units | % Housing Units |
| Single Unit, Detached | 81 | 37.5% |
| Single Unit, Attached | 0 | 0.0% |
| 2 Unit Apartments | 0 | 0.0% |
| 3 or 4 Unit Apartments | 0 | 0.0% |
| 5 to 9 Unit Apartments | 0 | 0.0% |
| 10 or more Apartments | 0 | 0.0% |
| Mobile Home / Other | 135 | 62.5% |
| Total | 216 | 100.0% |
Housing Structures by Occupancy in Gardner
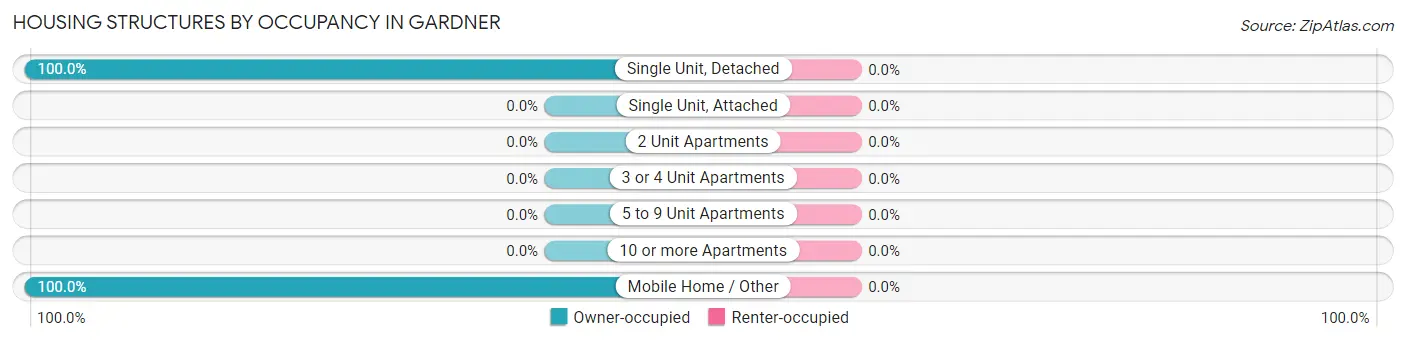
| Structure Type | Owner-occupied | Renter-occupied |
| Single Unit, Detached | 81 (100.0%) | 0 (0.0%) |
| Single Unit, Attached | 0 (0.0%) | 0 (0.0%) |
| 2 Unit Apartments | 0 (0.0%) | 0 (0.0%) |
| 3 or 4 Unit Apartments | 0 (0.0%) | 0 (0.0%) |
| 5 to 9 Unit Apartments | 0 (0.0%) | 0 (0.0%) |
| 10 or more Apartments | 0 (0.0%) | 0 (0.0%) |
| Mobile Home / Other | 135 (100.0%) | 0 (0.0%) |
| Total | 216 (100.0%) | 0 (0.0%) |
Housing Structures by Number of Rooms in Gardner
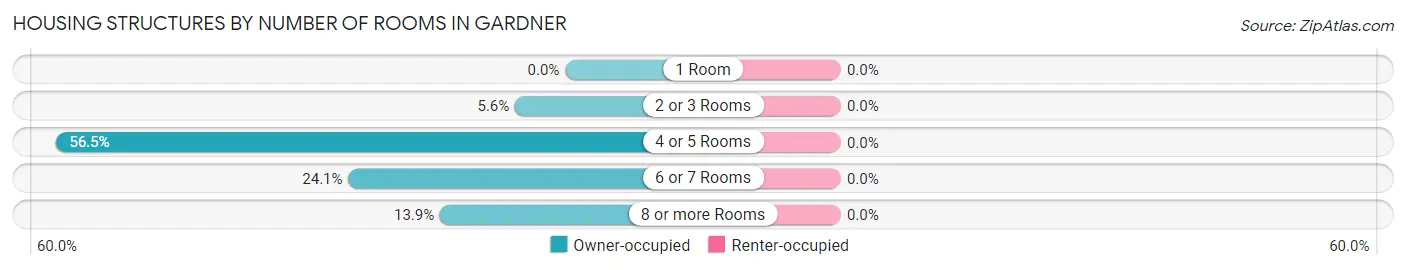
| Number of Rooms | Owner-occupied | Renter-occupied |
| 1 Room | 0 (0.0%) | 0 (0.0%) |
| 2 or 3 Rooms | 12 (5.6%) | 0 (0.0%) |
| 4 or 5 Rooms | 122 (56.5%) | 0 (0.0%) |
| 6 or 7 Rooms | 52 (24.1%) | 0 (0.0%) |
| 8 or more Rooms | 30 (13.9%) | 0 (0.0%) |
| Total | 216 (100.0%) | 0 (0.0%) |
Housing Structure by Heating Type in Gardner
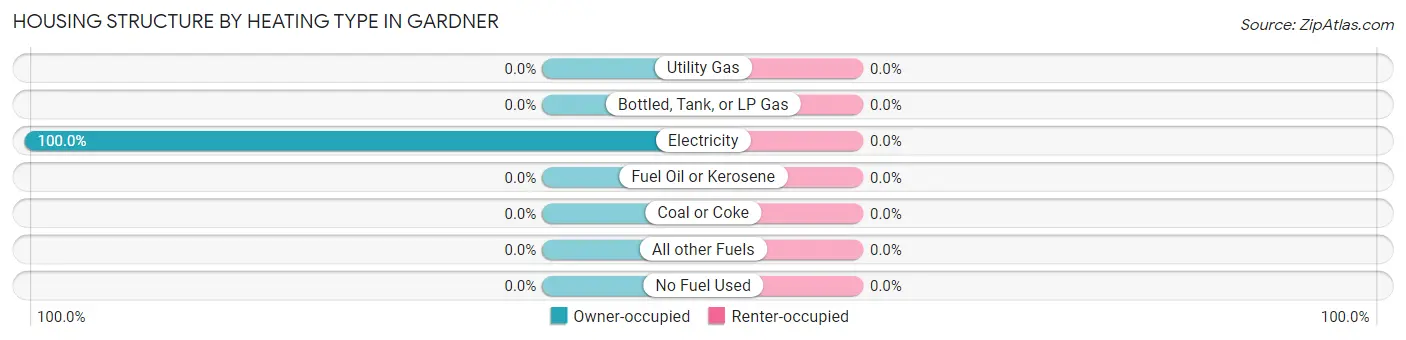
| Heating Type | Owner-occupied | Renter-occupied |
| Utility Gas | 0 (0.0%) | 0 (0.0%) |
| Bottled, Tank, or LP Gas | 0 (0.0%) | 0 (0.0%) |
| Electricity | 216 (100.0%) | 0 (0.0%) |
| Fuel Oil or Kerosene | 0 (0.0%) | 0 (0.0%) |
| Coal or Coke | 0 (0.0%) | 0 (0.0%) |
| All other Fuels | 0 (0.0%) | 0 (0.0%) |
| No Fuel Used | 0 (0.0%) | 0 (0.0%) |
| Total | 216 (100.0%) | 0 (0.0%) |
Household Vehicle Usage in Gardner
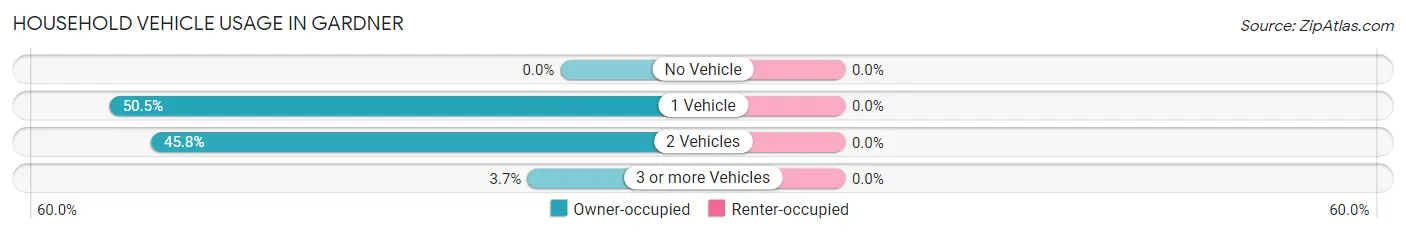
| Vehicles per Household | Owner-occupied | Renter-occupied |
| No Vehicle | 0 (0.0%) | 0 (0.0%) |
| 1 Vehicle | 109 (50.5%) | 0 (0.0%) |
| 2 Vehicles | 99 (45.8%) | 0 (0.0%) |
| 3 or more Vehicles | 8 (3.7%) | 0 (0.0%) |
| Total | 216 (100.0%) | 0 (0.0%) |
Real Estate & Mortgages in Gardner
Real Estate and Mortgage Overview in Gardner
| Characteristic | Without Mortgage | With Mortgage |
| Housing Units | 171 | 45 |
| Median Property Value | $114,700 | $97,700 |
| Median Household Income | $32,708 | $0 |
| Monthly Housing Costs | $373 | $0 |
| Real Estate Taxes | $1,143 | $0 |
Property Value by Mortgage Status in Gardner
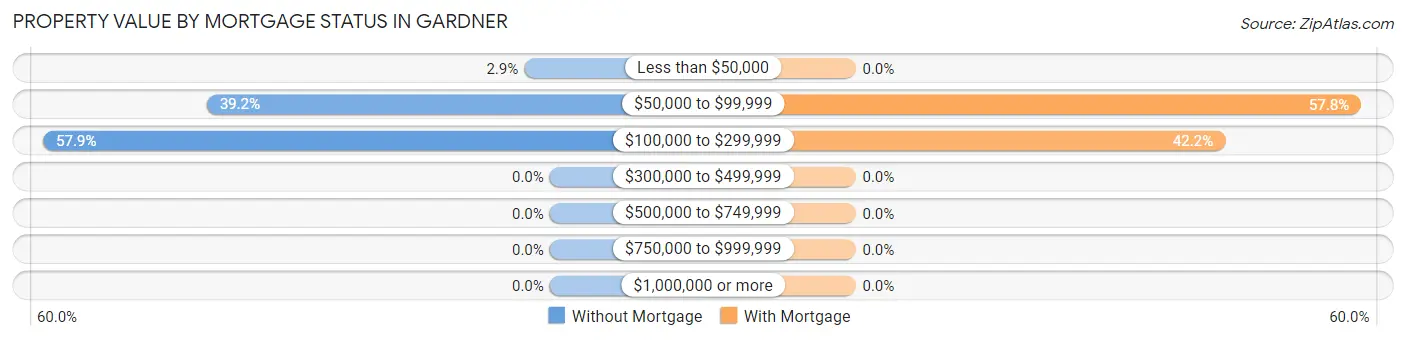
| Property Value | Without Mortgage | With Mortgage |
| Less than $50,000 | 5 (2.9%) | 0 (0.0%) |
| $50,000 to $99,999 | 67 (39.2%) | 26 (57.8%) |
| $100,000 to $299,999 | 99 (57.9%) | 19 (42.2%) |
| $300,000 to $499,999 | 0 (0.0%) | 0 (0.0%) |
| $500,000 to $749,999 | 0 (0.0%) | 0 (0.0%) |
| $750,000 to $999,999 | 0 (0.0%) | 0 (0.0%) |
| $1,000,000 or more | 0 (0.0%) | 0 (0.0%) |
| Total | 171 (100.0%) | 45 (100.0%) |
Household Income by Mortgage Status in Gardner
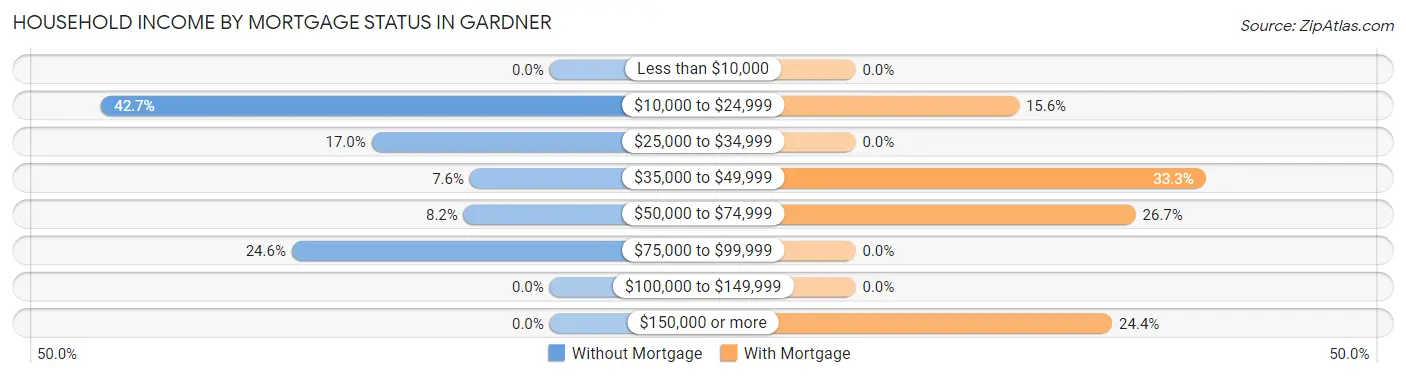
| Household Income | Without Mortgage | With Mortgage |
| Less than $10,000 | 0 (0.0%) | 0 (0.0%) |
| $10,000 to $24,999 | 73 (42.7%) | 7 (15.6%) |
| $25,000 to $34,999 | 29 (17.0%) | 0 (0.0%) |
| $35,000 to $49,999 | 13 (7.6%) | 15 (33.3%) |
| $50,000 to $74,999 | 14 (8.2%) | 12 (26.7%) |
| $75,000 to $99,999 | 42 (24.6%) | 0 (0.0%) |
| $100,000 to $149,999 | 0 (0.0%) | 0 (0.0%) |
| $150,000 or more | 0 (0.0%) | 11 (24.4%) |
| Total | 171 (100.0%) | 45 (100.0%) |
Property Value to Household Income Ratio in Gardner
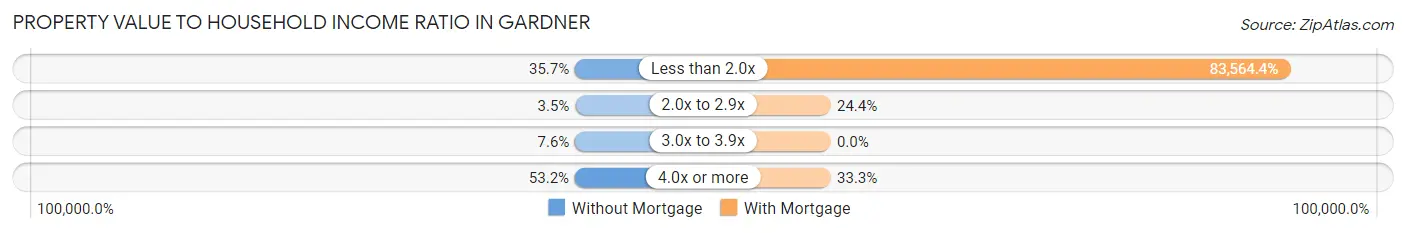
| Value-to-Income Ratio | Without Mortgage | With Mortgage |
| Less than 2.0x | 61 (35.7%) | 37,604 (83,564.4%) |
| 2.0x to 2.9x | 6 (3.5%) | 11 (24.4%) |
| 3.0x to 3.9x | 13 (7.6%) | 0 (0.0%) |
| 4.0x or more | 91 (53.2%) | 15 (33.3%) |
| Total | 171 (100.0%) | 45 (100.0%) |
Real Estate Taxes by Mortgage Status in Gardner
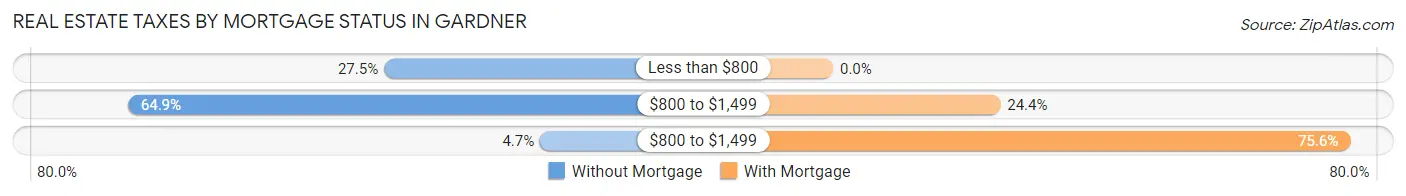
| Property Taxes | Without Mortgage | With Mortgage |
| Less than $800 | 47 (27.5%) | 0 (0.0%) |
| $800 to $1,499 | 111 (64.9%) | 11 (24.4%) |
| $800 to $1,499 | 8 (4.7%) | 34 (75.6%) |
| Total | 171 (100.0%) | 45 (100.0%) |
Health & Disability in Gardner
Health Insurance Coverage by Age in Gardner
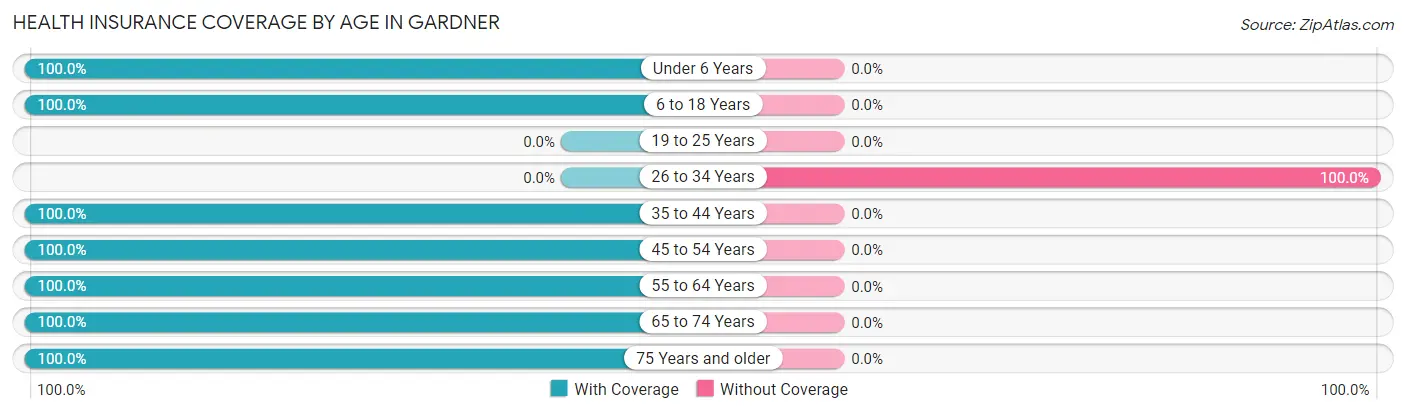
| Age Bracket | With Coverage | Without Coverage |
| Under 6 Years | 19 (100.0%) | 0 (0.0%) |
| 6 to 18 Years | 56 (100.0%) | 0 (0.0%) |
| 19 to 25 Years | 0 (0.0%) | 0 (0.0%) |
| 26 to 34 Years | 0 (0.0%) | 15 (100.0%) |
| 35 to 44 Years | 30 (100.0%) | 0 (0.0%) |
| 45 to 54 Years | 26 (100.0%) | 0 (0.0%) |
| 55 to 64 Years | 63 (100.0%) | 0 (0.0%) |
| 65 to 74 Years | 135 (100.0%) | 0 (0.0%) |
| 75 Years and older | 149 (100.0%) | 0 (0.0%) |
| Total | 478 (97.0%) | 15 (3.0%) |
Health Insurance Coverage by Citizenship Status in Gardner
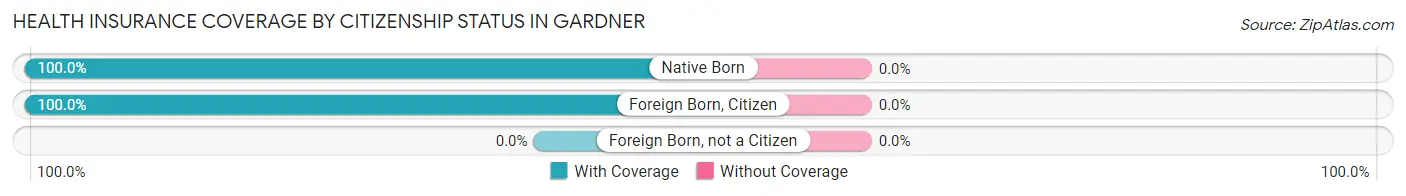
| Citizenship Status | With Coverage | Without Coverage |
| Native Born | 19 (100.0%) | 0 (0.0%) |
| Foreign Born, Citizen | 56 (100.0%) | 0 (0.0%) |
| Foreign Born, not a Citizen | 0 (0.0%) | 0 (0.0%) |
Health Insurance Coverage by Household Income in Gardner
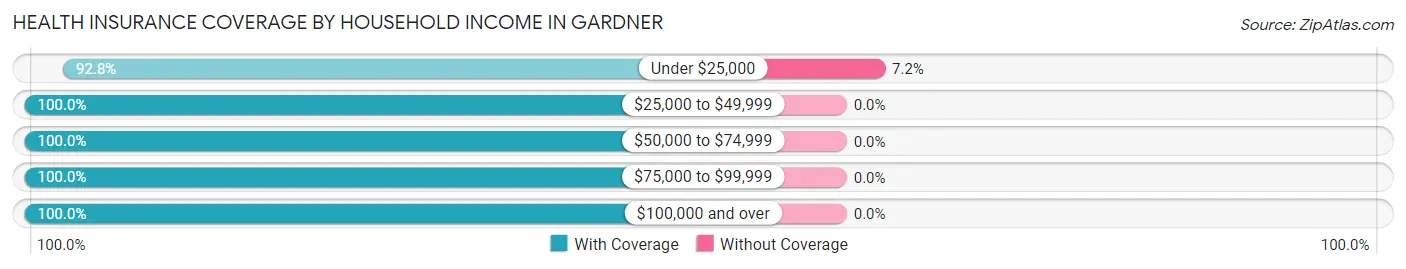
| Household Income | With Coverage | Without Coverage |
| Under $25,000 | 194 (92.8%) | 15 (7.2%) |
| $25,000 to $49,999 | 139 (100.0%) | 0 (0.0%) |
| $50,000 to $74,999 | 26 (100.0%) | 0 (0.0%) |
| $75,000 to $99,999 | 78 (100.0%) | 0 (0.0%) |
| $100,000 and over | 41 (100.0%) | 0 (0.0%) |
Public vs Private Health Insurance Coverage by Age in Gardner
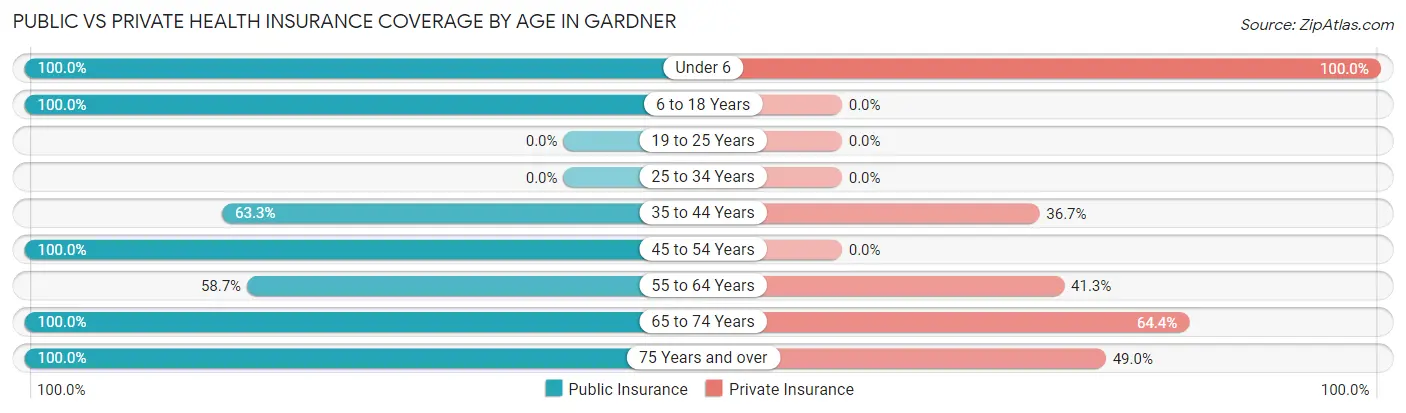
| Age Bracket | Public Insurance | Private Insurance |
| Under 6 | 19 (100.0%) | 19 (100.0%) |
| 6 to 18 Years | 56 (100.0%) | 0 (0.0%) |
| 19 to 25 Years | 0 (0.0%) | 0 (0.0%) |
| 25 to 34 Years | 0 (0.0%) | 0 (0.0%) |
| 35 to 44 Years | 19 (63.3%) | 11 (36.7%) |
| 45 to 54 Years | 26 (100.0%) | 0 (0.0%) |
| 55 to 64 Years | 37 (58.7%) | 26 (41.3%) |
| 65 to 74 Years | 135 (100.0%) | 87 (64.4%) |
| 75 Years and over | 149 (100.0%) | 73 (49.0%) |
| Total | 441 (89.4%) | 216 (43.8%) |
Disability Status by Sex by Age in Gardner
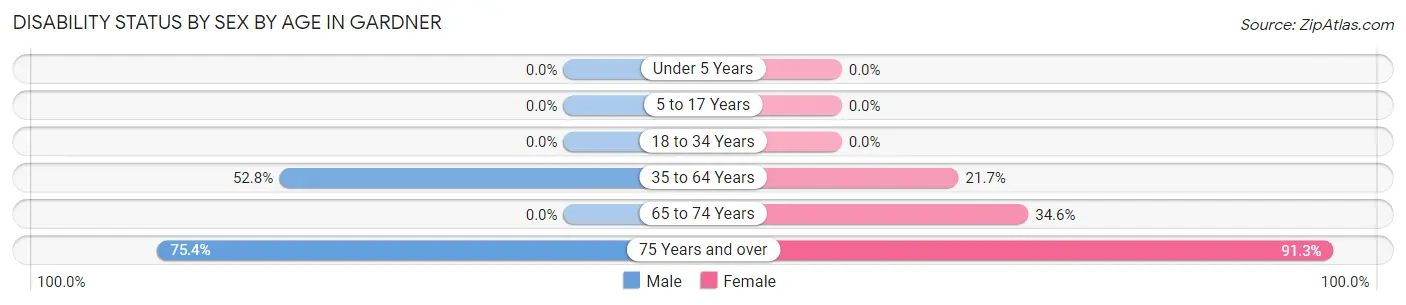
| Age Bracket | Male | Female |
| Under 5 Years | 0 (0.0%) | 0 (0.0%) |
| 5 to 17 Years | 0 (0.0%) | 0 (0.0%) |
| 18 to 34 Years | 0 (0.0%) | 0 (0.0%) |
| 35 to 64 Years | 19 (52.8%) | 18 (21.7%) |
| 65 to 74 Years | 0 (0.0%) | 18 (34.6%) |
| 75 Years and over | 52 (75.4%) | 73 (91.2%) |
Disability Class by Sex by Age in Gardner
Disability Class: Hearing Difficulty
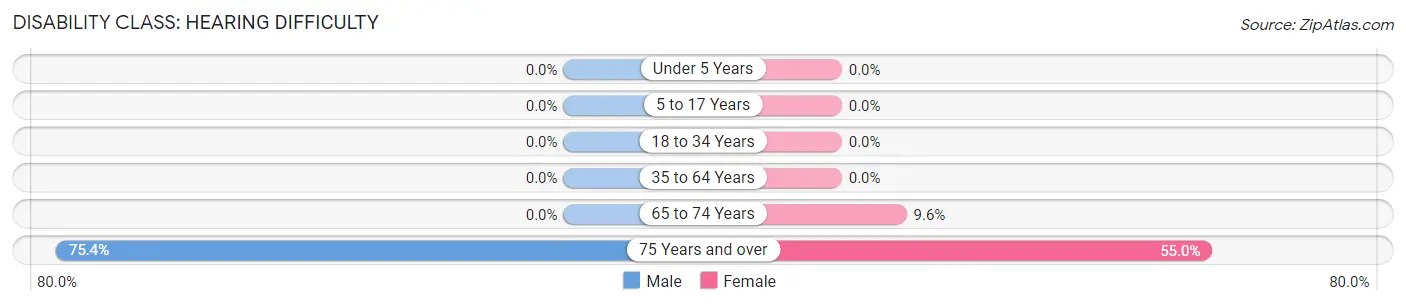
| Age Bracket | Male | Female |
| Under 5 Years | 0 (0.0%) | 0 (0.0%) |
| 5 to 17 Years | 0 (0.0%) | 0 (0.0%) |
| 18 to 34 Years | 0 (0.0%) | 0 (0.0%) |
| 35 to 64 Years | 0 (0.0%) | 0 (0.0%) |
| 65 to 74 Years | 0 (0.0%) | 5 (9.6%) |
| 75 Years and over | 52 (75.4%) | 44 (55.0%) |
Disability Class: Vision Difficulty
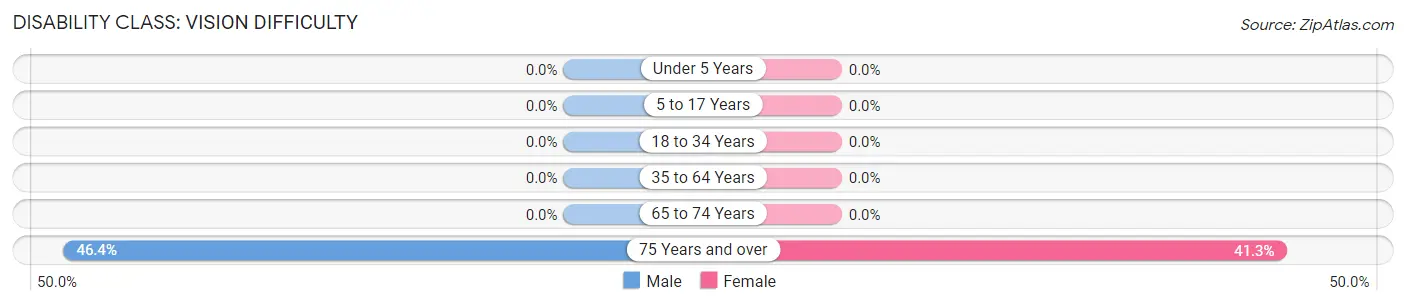
| Age Bracket | Male | Female |
| Under 5 Years | 0 (0.0%) | 0 (0.0%) |
| 5 to 17 Years | 0 (0.0%) | 0 (0.0%) |
| 18 to 34 Years | 0 (0.0%) | 0 (0.0%) |
| 35 to 64 Years | 0 (0.0%) | 0 (0.0%) |
| 65 to 74 Years | 0 (0.0%) | 0 (0.0%) |
| 75 Years and over | 32 (46.4%) | 33 (41.2%) |
Disability Class: Cognitive Difficulty
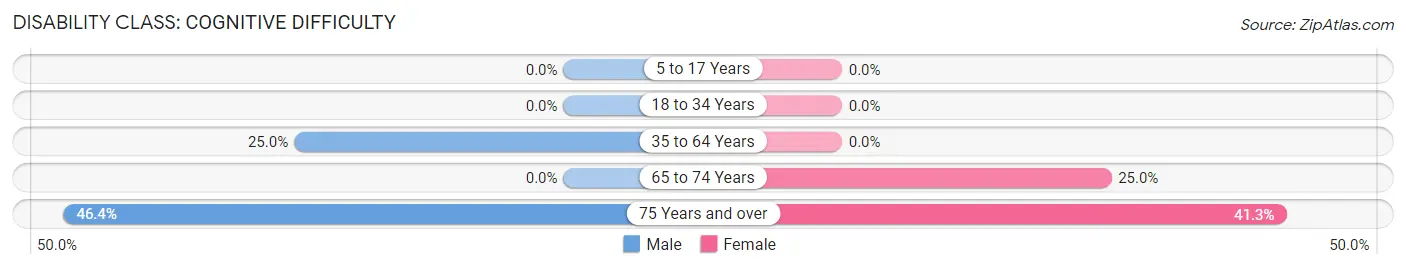
| Age Bracket | Male | Female |
| 5 to 17 Years | 0 (0.0%) | 0 (0.0%) |
| 18 to 34 Years | 0 (0.0%) | 0 (0.0%) |
| 35 to 64 Years | 9 (25.0%) | 0 (0.0%) |
| 65 to 74 Years | 0 (0.0%) | 13 (25.0%) |
| 75 Years and over | 32 (46.4%) | 33 (41.2%) |
Disability Class: Ambulatory Difficulty
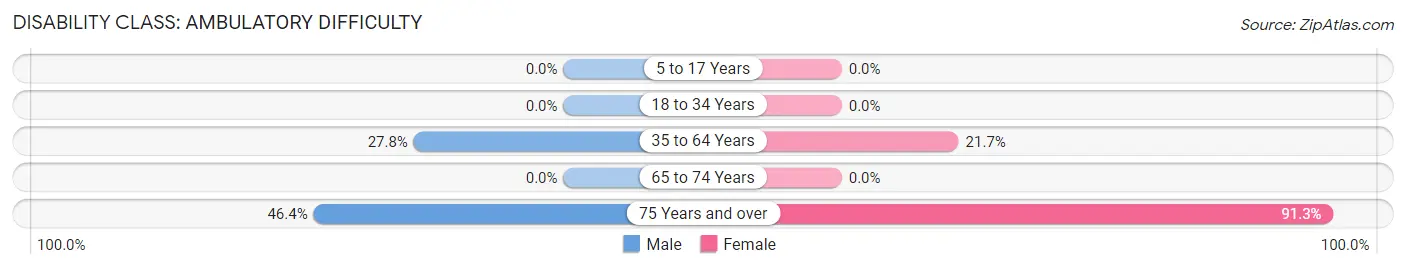
| Age Bracket | Male | Female |
| 5 to 17 Years | 0 (0.0%) | 0 (0.0%) |
| 18 to 34 Years | 0 (0.0%) | 0 (0.0%) |
| 35 to 64 Years | 10 (27.8%) | 18 (21.7%) |
| 65 to 74 Years | 0 (0.0%) | 0 (0.0%) |
| 75 Years and over | 32 (46.4%) | 73 (91.2%) |
Disability Class: Self-Care Difficulty
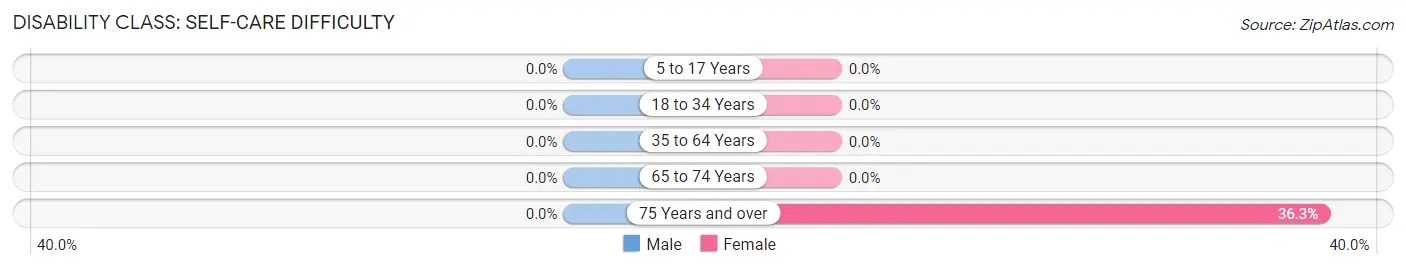
| Age Bracket | Male | Female |
| 5 to 17 Years | 0 (0.0%) | 0 (0.0%) |
| 18 to 34 Years | 0 (0.0%) | 0 (0.0%) |
| 35 to 64 Years | 0 (0.0%) | 0 (0.0%) |
| 65 to 74 Years | 0 (0.0%) | 0 (0.0%) |
| 75 Years and over | 0 (0.0%) | 29 (36.2%) |
Technology Access in Gardner
Computing Device Access in Gardner
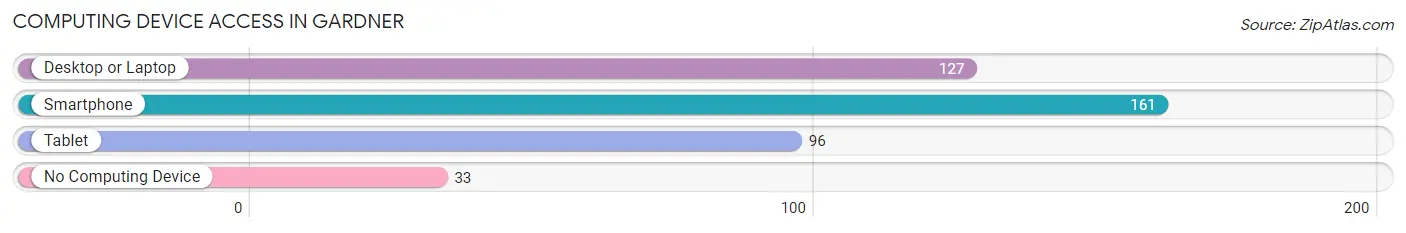
| Device Type | # Households | % Households |
| Desktop or Laptop | 127 | 58.8% |
| Smartphone | 161 | 74.5% |
| Tablet | 96 | 44.4% |
| No Computing Device | 33 | 15.3% |
| Total | 216 | 100.0% |
Internet Access in Gardner
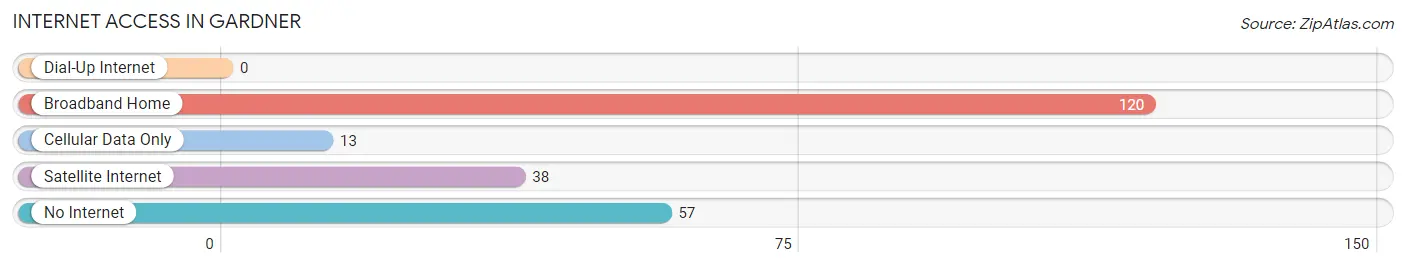
| Internet Type | # Households | % Households |
| Dial-Up Internet | 0 | 0.0% |
| Broadband Home | 120 | 55.6% |
| Cellular Data Only | 13 | 6.0% |
| Satellite Internet | 38 | 17.6% |
| No Internet | 57 | 26.4% |
| Total | 216 | 100.0% |
Gardner Summary
Gardner is a small town located in the state of Florida, in the United States. It is situated in the northern part of the state, in the county of Alachua. The town has a population of approximately 1,000 people, and is located about 20 miles north of Gainesville.
History
Gardner was founded in 1883 by a group of settlers from Georgia. The town was named after the Gardner family, who were among the first settlers. The town was originally a farming community, and the main crops grown were cotton, corn, and tobacco. In the early 1900s, the town began to grow and develop, and by the 1920s, it had become a thriving community.
In the 1950s, Gardner began to experience a decline in population, as many of the town's residents moved away to larger cities. However, in the late 1970s, the town began to experience a resurgence in population, as people began to move back to the area. Today, Gardner is a small, rural town with a population of around 1,000 people.
Geography
Gardner is located in the northern part of the state of Florida, in the county of Alachua. The town is situated on the banks of the Santa Fe River, and is surrounded by rolling hills and forests. The town is located about 20 miles north of Gainesville, and is about an hour and a half drive from Jacksonville.
The climate in Gardner is subtropical, with hot, humid summers and mild winters. The average temperature in the summer is around 90 degrees Fahrenheit, and the average temperature in the winter is around 60 degrees Fahrenheit.
Economy
Gardner's economy is largely based on agriculture. The town is home to several farms, which produce a variety of crops, including cotton, corn, and tobacco. In addition, the town is home to several small businesses, including restaurants, stores, and other services.
Demographics
As of the 2010 census, the population of Gardner was 1,000 people. The racial makeup of the town was 94.2% White, 2.2% African American, 0.2% Native American, 0.2% Asian, and 3.2% from other races. The median household income in Gardner was $35,000, and the median age was 37 years.
Conclusion
Gardner is a small town located in the northern part of the state of Florida. It has a population of around 1,000 people, and is largely an agricultural community. The town has a subtropical climate, and is home to several small businesses. The racial makeup of the town is predominantly White, with a small percentage of African American, Native American, and Asian residents. The median household income in Gardner is $35,000, and the median age is 37 years.
Common Questions
What is Per Capita Income in Gardner?
Per Capita income in Gardner is $19,204.
What is the Median Family Income in Gardner?
Median Family Income in Gardner is $32,689.
What is the Median Household income in Gardner?
Median Household Income in Gardner is $33,788.
What is Inequality or Gini Index in Gardner?
Inequality or Gini Index in Gardner is 0.37.
What is the Total Population of Gardner?
Total Population of Gardner is 493.
What is the Total Male Population of Gardner?
Total Male Population of Gardner is 196.
What is the Total Female Population of Gardner?
Total Female Population of Gardner is 297.
What is the Ratio of Males per 100 Females in Gardner?
There are 65.99 Males per 100 Females in Gardner.
What is the Ratio of Females per 100 Males in Gardner?
There are 151.53 Females per 100 Males in Gardner.
What is the Median Population Age in Gardner?
Median Population Age in Gardner is 68.0 Years.
What is the Average Family Size in Gardner
Average Family Size in Gardner is 2.2 People.
What is the Average Household Size in Gardner
Average Household Size in Gardner is 2.3 People.
How Large is the Labor Force in Gardner?
There are 37 People in the Labor Forcein in Gardner.
What is the Percentage of People in the Labor Force in Gardner?
8.6% of People are in the Labor Force in Gardner.